


Abstract
Rapid urbanization has exacerbated urban-stormwater challenges, highlighting the critical need for coordinated surface-water and groundwater management through rainfall recharge. However, current sponge city construction methods often overlook the crucial role of underground aquifers in regulating the water cycle and mostly rely on simplified engineering approaches. To address these limitations, this study proposes a spatial optimization framework for urban-scale sponge systems that integrates a hydrodynamic model (FVCOM), geographic information systems (GIS), and Monte Carlo simulations. This framework establishes a comprehensive evaluation system that synergistically integrates surface water inundation depth, geological lithology, and groundwater depth to quantitatively assess sponge city suitability. The FVCOM was employed to simulate surface water inundation processes under extreme rainfall scenarios, while GIS facilitated spatial analysis and data integration. The Monte Carlo simulation was utilized to optimize the spatial layout by objectively determining factor weights and evaluate result uncertainty. Using Shenzhen City in China as a case study, this research combined the “matrix-corridor-patch” theory from landscape ecology to optimize the spatial structure of the sponge system. Furthermore, differentiated planning and management strategies were proposed based on regional characteristics and uncertainty analysis. The research findings provide a replicable and verifiable methodology for developing sponge city systems in high-density urban areas. The core value of this methodology lies in its creation of a scientific decision-making tool for direct application in urban planning. This tool can significantly enhance a city’s climate resilience and facilitate the coordinated, optimal management of water resources amid environmental changes.
1. Introduction
The combined drivers of increasing extreme climate events and rapid urbanization have significantly elevated the risk of urban flooding and storm surges in coastal areas [1]. The global scale of such hazards is reflected in the World Meteorological Organization’s 2021 report, the WMO Atlas of Mortality and Economic Losses from Weather, Climate and Water Extremes (1970–2019). It documents that more than 11,000 related disasters were recorded worldwide during this period, resulting in over two million fatalities and economic losses of approximately US$ 3.64 trillion [2,3]. Confronted with such a serious situation, traditional flood management strategies have proven inadequate to address these challenges. There is an urgent need for a more proactive and comprehensive solution to urban water management. Compared with conventional gray infrastructure, Nature-based Solutions (NbS), such as Low Impact Development (LID) and Green Infrastructure(GI), provide significant co-benefits for biodiversity and human well-being [4]. At the urban scale, green infrastructure has emerged as a core theoretical foundation for the development of sponge systems. By conceptualizing the city as an integrated ecological system, this approach coordinates multiple processes—namely detention, infiltration, storage, purification, reuse, and drainage—with the aim of enhancing urban resilience to flooding and storm surges, while reducing environmental risks associated with natural hazards.
Sponge systems are typically developed within a landscape ecology framework, and research focuses on the flood-storage wetland system, including the storm-flood area, wetland, river, and low-lying land, among others. The sponge system primarily entails the construction of a fully connected network consisting of stormwater management patches, corridors, and matrix. Furthermore, it provides the basis for land-use planning and sponge city design [5]. Jiao et al. constructed a sponge system from three dimensions: the stormwater corridor, stormwater inundation and stormwate pollution, using GIS [6]. Guo et al. analyzed the superimposed flood area and potential runoff, identified the critical points, regions, and corridors of stormwater, and proposed reconstruction measures for river corridors and runoff depression to achieve the purpose of stormwater safety [7]. Ding et al. built evaluation factors for point water sources, inundated patches, and river corridors, and determined urban hazard buffers, urban elastic space areas, and ecological conservation areas [8]. Based on the theory of landscape ecology, Zhang et al. [9] determined the space and location of three aspects: regional flood safety, runoff pollution control, and water resource protection, providing a basis for sponge city management. They tried the construction methods and practices of the sponge system from different angles and levels [10].
There are two types of methods for the construction of urban-scale sponge systems: one is the construction method based on an index evaluation system, and the other is the risk assessment construction method based on scenario simulation. The first method is to evaluate and analyze the factors that can affect stormwater safety in the region directly or indirectly, and then determine the safety level, function analysis, and system spatial structure [11]. The second method refers to the simulation and analysis of the research area to finally obtain the functional partition and system spatial structure [6]. In practical application, the first method is suitable for the comprehensive planning of cities or large regions. The second approach is suitable for detailed risk analysis and response development.
There are three specific construction methods for the first method, and their principles and characteristics are shown in Table 1 below.
Table 1.
Construction method based on index evaluation system.
First of all, the factor superposition evaluation method is utilized to assess various impact factors collectively. These factors include soil conditions, the type of underlying surface, geological features, hydrology, and more. GIS is utilized for spatial analysis, including overlaying storm inundation areas with hydrological features, and assessing flood detention capacity. Because of its good visualization effect, the GIS tool is widely used in the factor superposition method. Dai et al. [11] built a sponge system by comprehensively superimposing storm inundation range, water system, flood detention wetland, and other influencing factors using ArcGIS tools. Jiang et al. [12] applied fuzzy set theory to make decisions, that is, weighted impact factors by combining subjective and objective methods, and constructed a sponge system with ArcGIS. Secondly, the logical rule grouping method uses the logical combination principle to establish a new set of logical combinations by coupling two systems. This method is much clearer than the factor superposition method. It can also be used in combination with qualitative and quantitative research. Jiao et al. [5] constructed the structure of “spot-corridor-base” to calculate the amount of water that the patch needs to control and the depth at which it can be stored. Finally, the source-corridor method uses the patch–corridor–matrix model in landscape ecology to analyze the spatial pattern. This approach takes into account the interactions between different elements and determines how they affect the design of sponge systems. Ding et al. [8] constructed a sponge system of the “point water patch -inundated matrix-river corridor” in Xiamen, and proposed high-, medium-, and low-level stormwater prevention and control schemes.
The second method employs hydrological models to simulate inundation depth, duration, and area under different rainfall scenarios, and then determines the sponge system according to simulation results. The advantage of this method is that it can capture the entire rainfall–runoff process and provide the temporal and spatial dynamics of runoff. However, this method requires a large amount of monitoring data for model calibration. Wei et al. [13] first simulated the flood inundation process under various scenarios using a coupling hydrodynamic model, then processed terrain and other impact factors with GIS, and finally assessed the flood risk level in the study area. Li et al. [14] used the SCS model to calculate the precipitation in the study area under extreme rainfall conditions and conducted a flood simulation analysis in Fangshan District of Beijing with the help of ArcGIS, and constructed the spatial structure of the sponge system according to the average submergence depth of each basin and river course. Taking Wuhan Optical Valley Center as an example, Ren et al. [15] employed the MIKE URBAN and MIKE 21 models to develop integrated 1D and 2D models of the study area. These were coupled with MIKE FLOOD to simulate flood inundation for a 50-year return period rainstorm scenario, ultimately generating a flood risk map for the region. Although coupled surface and groundwater models (such as MIKE-SHE or SWMM-GW) have been widely studied, these approaches predominantly focus on the numerical simulation of hydrological processes to predict flow rates or water levels [16]. They often lack a direct interface with spatial planning strategies and rarely account for the uncertainty inherent in decision-making parameters.
Current research on sponge cities predominantly focuses on surface systems, often overlooking the critical role and complexities of groundwater components. To address this gap, this study proposes a decision-oriented spatial optimization framework. This framework surmounts key limitations of existing assessment approaches, which tend to be relatively simplistic both in their indicator analysis and their risk assessment under different scenarios, and largely treat groundwater considerations at a qualitative level. To address these gaps, this study proposes an innovative framework that integrates the outputs of fluid dynamics models with hydrogeological constraints and incorporates Monte Carlo simulation [17], thereby moving beyond traditional methods that rely on a single physical coupling or process simulation. Through this integrated framework, this study not only provides a reliable tool for identifying the priority areas where surface water and groundwater work in synergy in sponge city construction, but also significantly enhances the credibility and scientific nature of sponge system planning.
2. Materials and Methods
2.1. Study Area
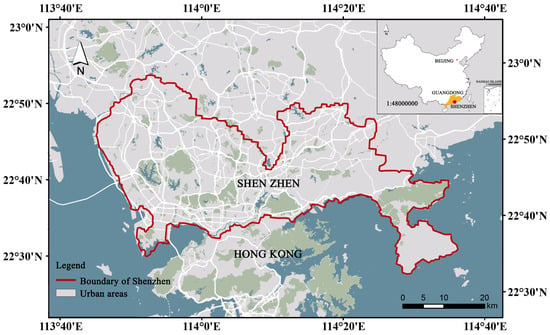
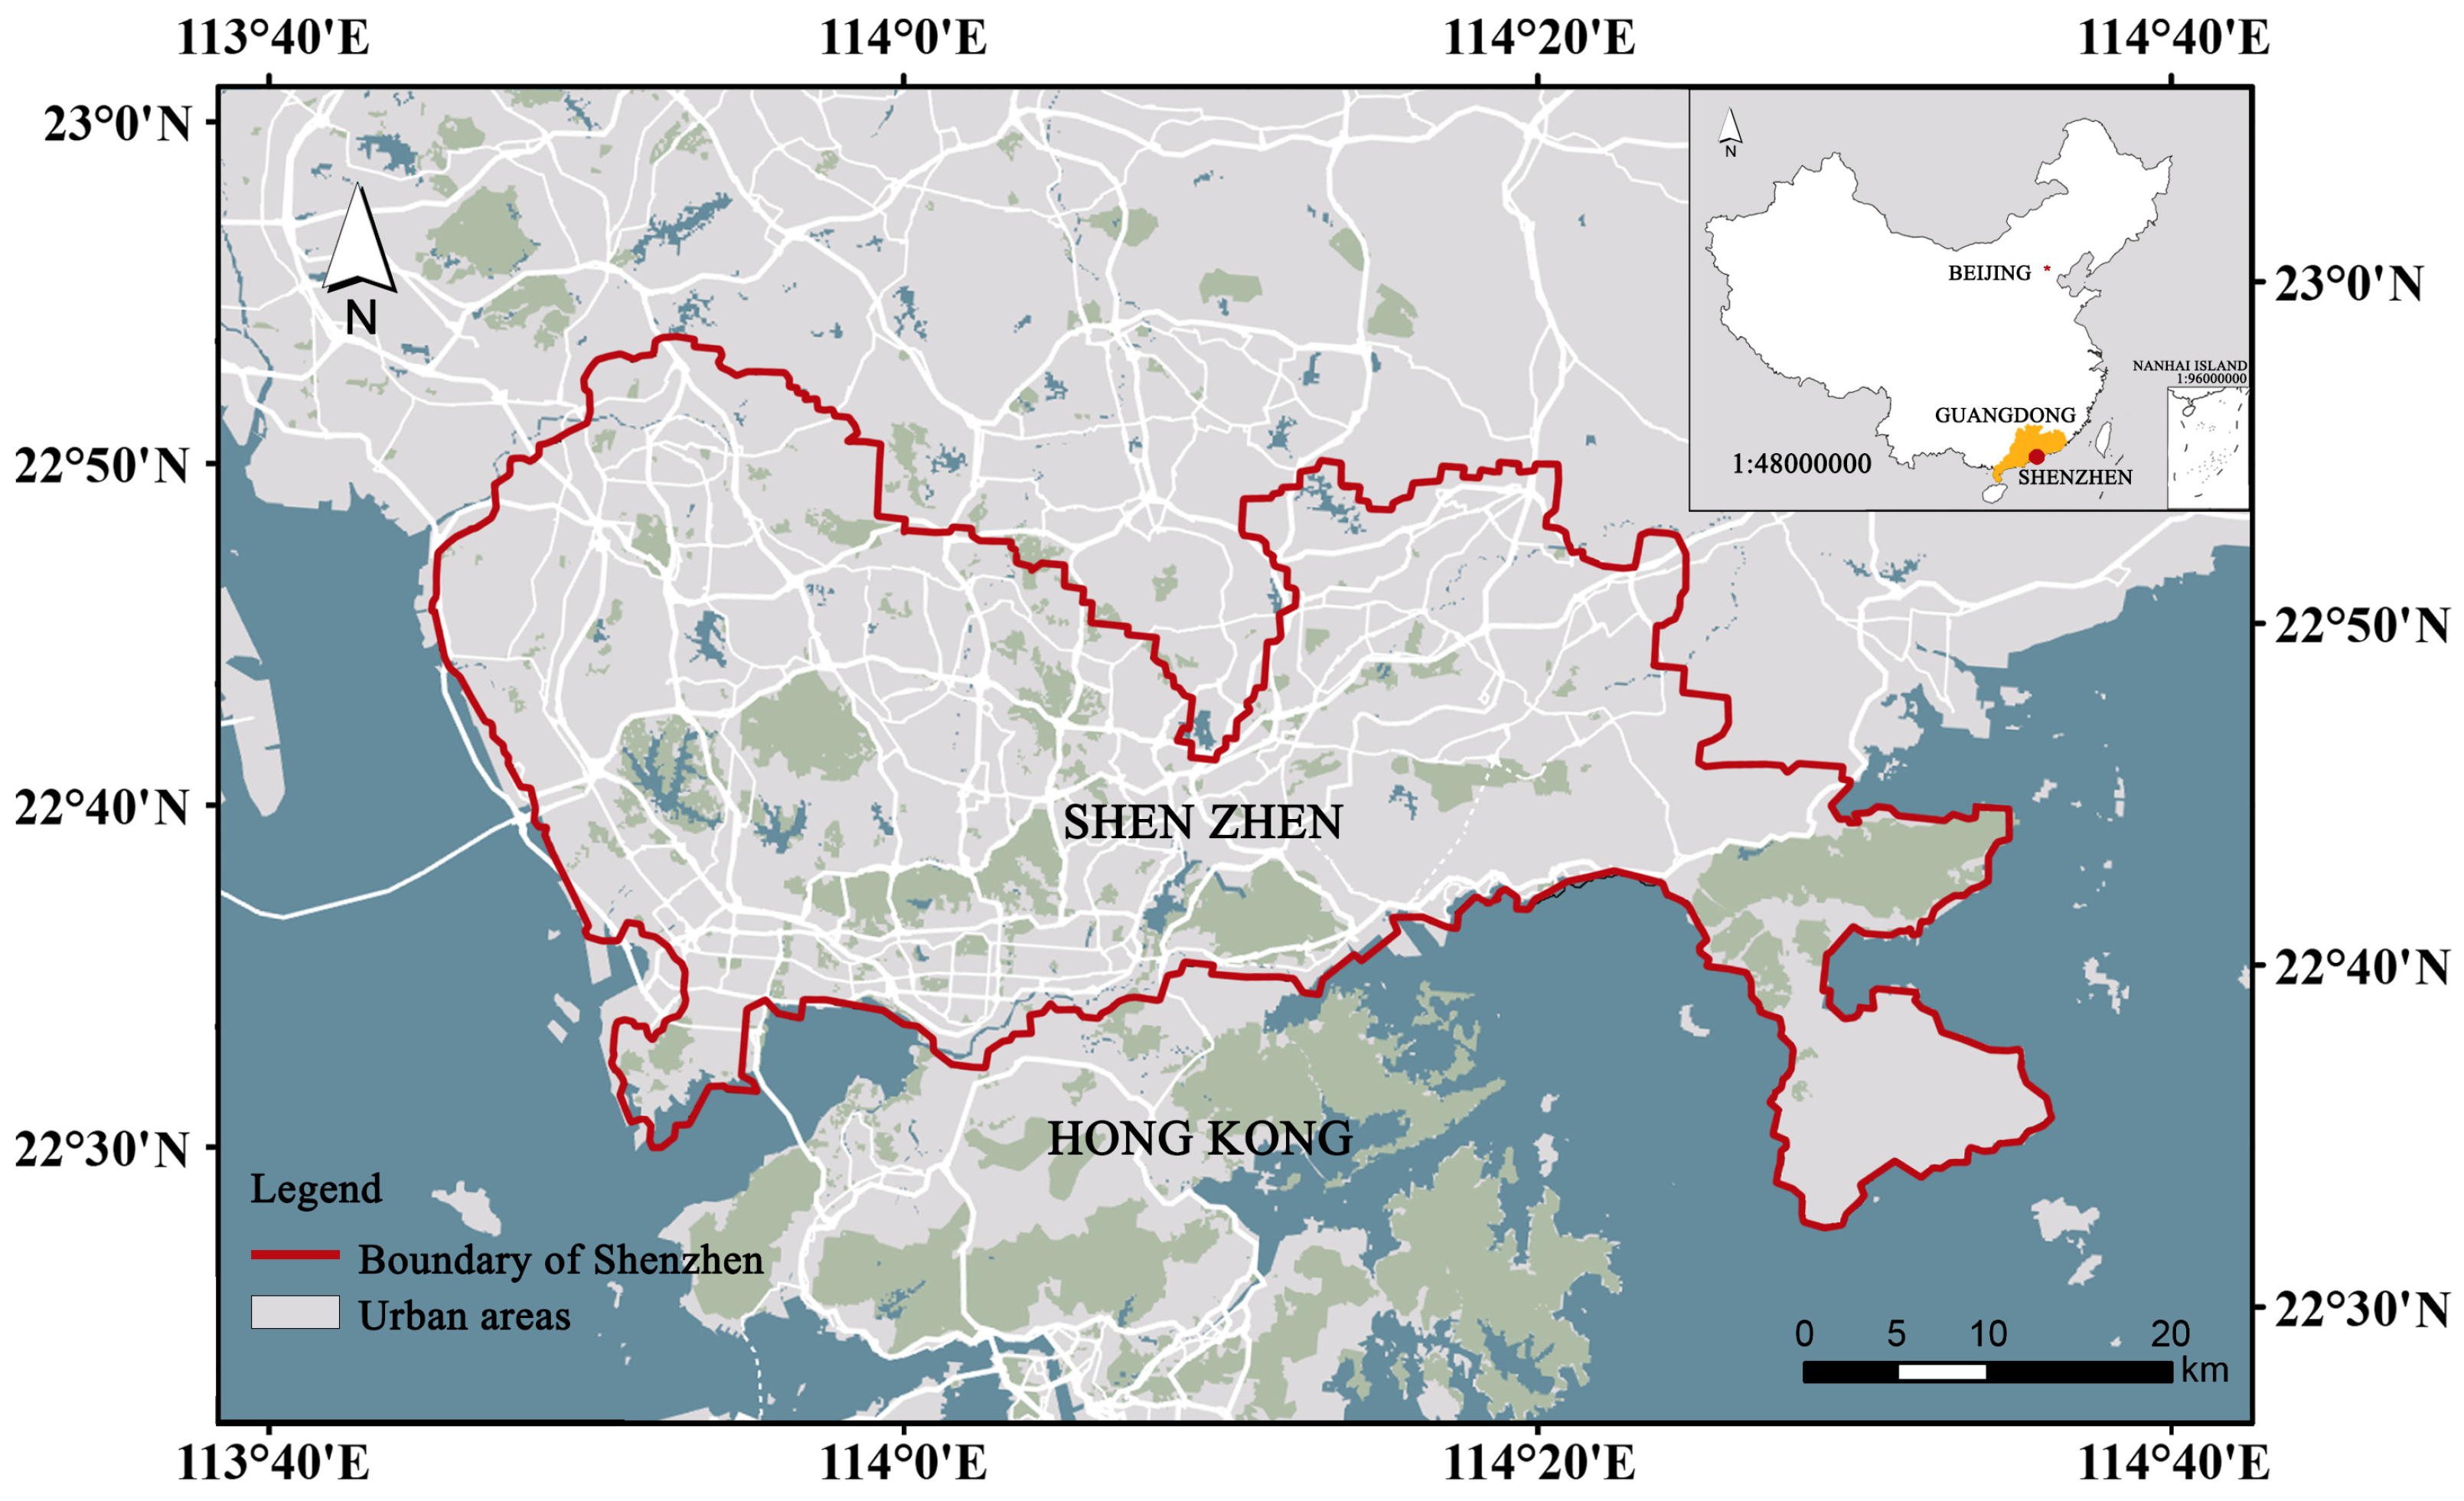
The study area (Figure 1), Shenzhen, is located in southern China (between 113°43′–114°38′ E, 22°24′–22°52′ N); Shenzhen faces Daya Bay and Mirs Bay to the east, the mouth of the Pearl River and Lingdingyang to the west, and Hong Kong across the Shenzhen River to the south. with a total land area of 1997.47 km2 [18]. Shenzhen has been one of the fastest-growing cities in the world since the 1990s. Located in southern Guangdong Province, it is a major financial and technology hub in southern China. In the past 40 years, with the rapid development of the city, the population has increased from 30,000 in 1979 to the current 20 million.
Figure 1.
The location of the study area.
Amid intensifying urbanization, farmland and green space have been significantly reduced. From 1980 to 2008, the urban built-up area increased from 9% to 40% of the city′s total land area, and the urbanization process was largely complete by 2016. That same year, Shenzhen was designated as a pilot city in the second batch of China’s national Sponge City initiative by the Ministry of Housing and Urban-Rural Development. As of July 2023, the total built-up area meeting sponge city standards in Shenzhen exceeded 330 km2.
2.1.1. Climatic Conditions
Shenzhen has a subtropical maritime monsoon climate with an average annual temperature of 23 °C and an average annual relative humidity of 79%. It has long summers and short winters, a mild climate with plenty of sunshine and plenty of rainfall. Summer is affected by the Pacific monsoon, the prevailing southeast wind, high temperatures, and rain. The average annual precipitation in Shenzhen is 1935.8 mm. Temporal distribution of precipitation is uneven, with 86% of precipitation concentrated between April and September. The uneven distribution of precipitation leads to floods in summer and water shortages in other seasons. In addition, Shenzhen is often affected by weather disasters such as extreme precipitation and typhoons. Shenzhen is affected by about 4.8 typhoons a year on average. Typhoons are often associated with extreme rainfall, which can lead to larger-scale precipitation. This phenomenon is a significant factor contributing to weather disasters in Shenzhen.
2.1.2. Hydrology and Groundwater
Shenzhen has a complex hydrological setting that includes 183 reservoirs and more than 160 rivers. Among them, there are six major rivers, including the Shenzhen River, Maozhou River, Longgang River, Guanlan River, Pingshan River, and Dasha River. The average annual surface runoff in Shenzhen is 1.81 billion m3. The total amount of groundwater resources is 650 million m3/year, and the actual groundwater extraction is only 5.9 million m3/year, with a low degree of groundwater resources exploitation [18].
2.1.3. Geology and Geomorphology
Shenzhen exhibits diverse topography. Hilly areas account for about 39.6% of the total area. Terraces, plains, and plateaus each account for more than 20% of the total area. The lower mountains occupy the smallest area. The terrain elevation varies greatly, but the ground slope is generally slower. More than 60% of the area has a slope of less than 10°. Shenzhen is surrounded by mountains and the sea, with complex geological conditions. Quaternary sediments are widely distributed in alluvial valleys and coastal plains, forming aquifers with high permeability and porosity. The maximum thickness of the Baoan Plain is 60 m. Sediments are interlayered with silt and quartz sand regolith. The tropical climate influences the even distribution of sediments along the foothills, with an average thickness of about 30 m. Shallow aquifers contain thicker groundwater. Groundwater circulation is limited due to the bedrock’s low porosity and metamorphic processes sealing fractures. It primarily occurs in local tectonic fault zones [18].
2.1.4. Data
The precipitation data of Shenzhen were monitored for 12 h by 71 stations of the Shenzhen Meteorological Bureau and recorded every 30 min. The simulation used measured rainfall data characterized as a 100-year return period event as the input. the input. The spatial distribution of precipitation in Shenzhen was generated by the inverse distance interpolation algorithm [19].
The DEM data of Shenzhen City is extracted from the SRTM data source provided by USGS, with a resolution of 30 m. The lithologic zoning data of Shenzhen City are derived from the hydrogeological map constructed by GBGP (unpublished regional hydrogeological survey report of the Geological Bureau of Guangdong Province, China, with a scale of 1:200,000, 1980) and Yang et al. in 2007 [20]. Shenzhen groundwater level data and calibration data are derived from GBGP (unpublished regional hydrogeological survey report of Guangdong Geological Bureau, China), and well restoration test analysis is derived from the groundwater regional survey report of the Shenzhen Water Bureau.
2.2. Methods
2.2.1. Modeling Framework
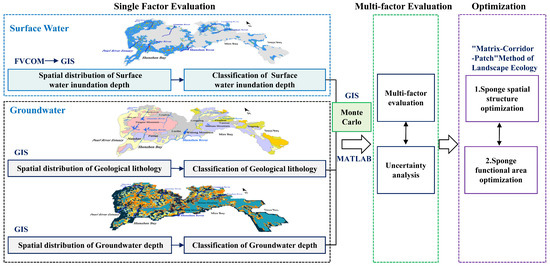
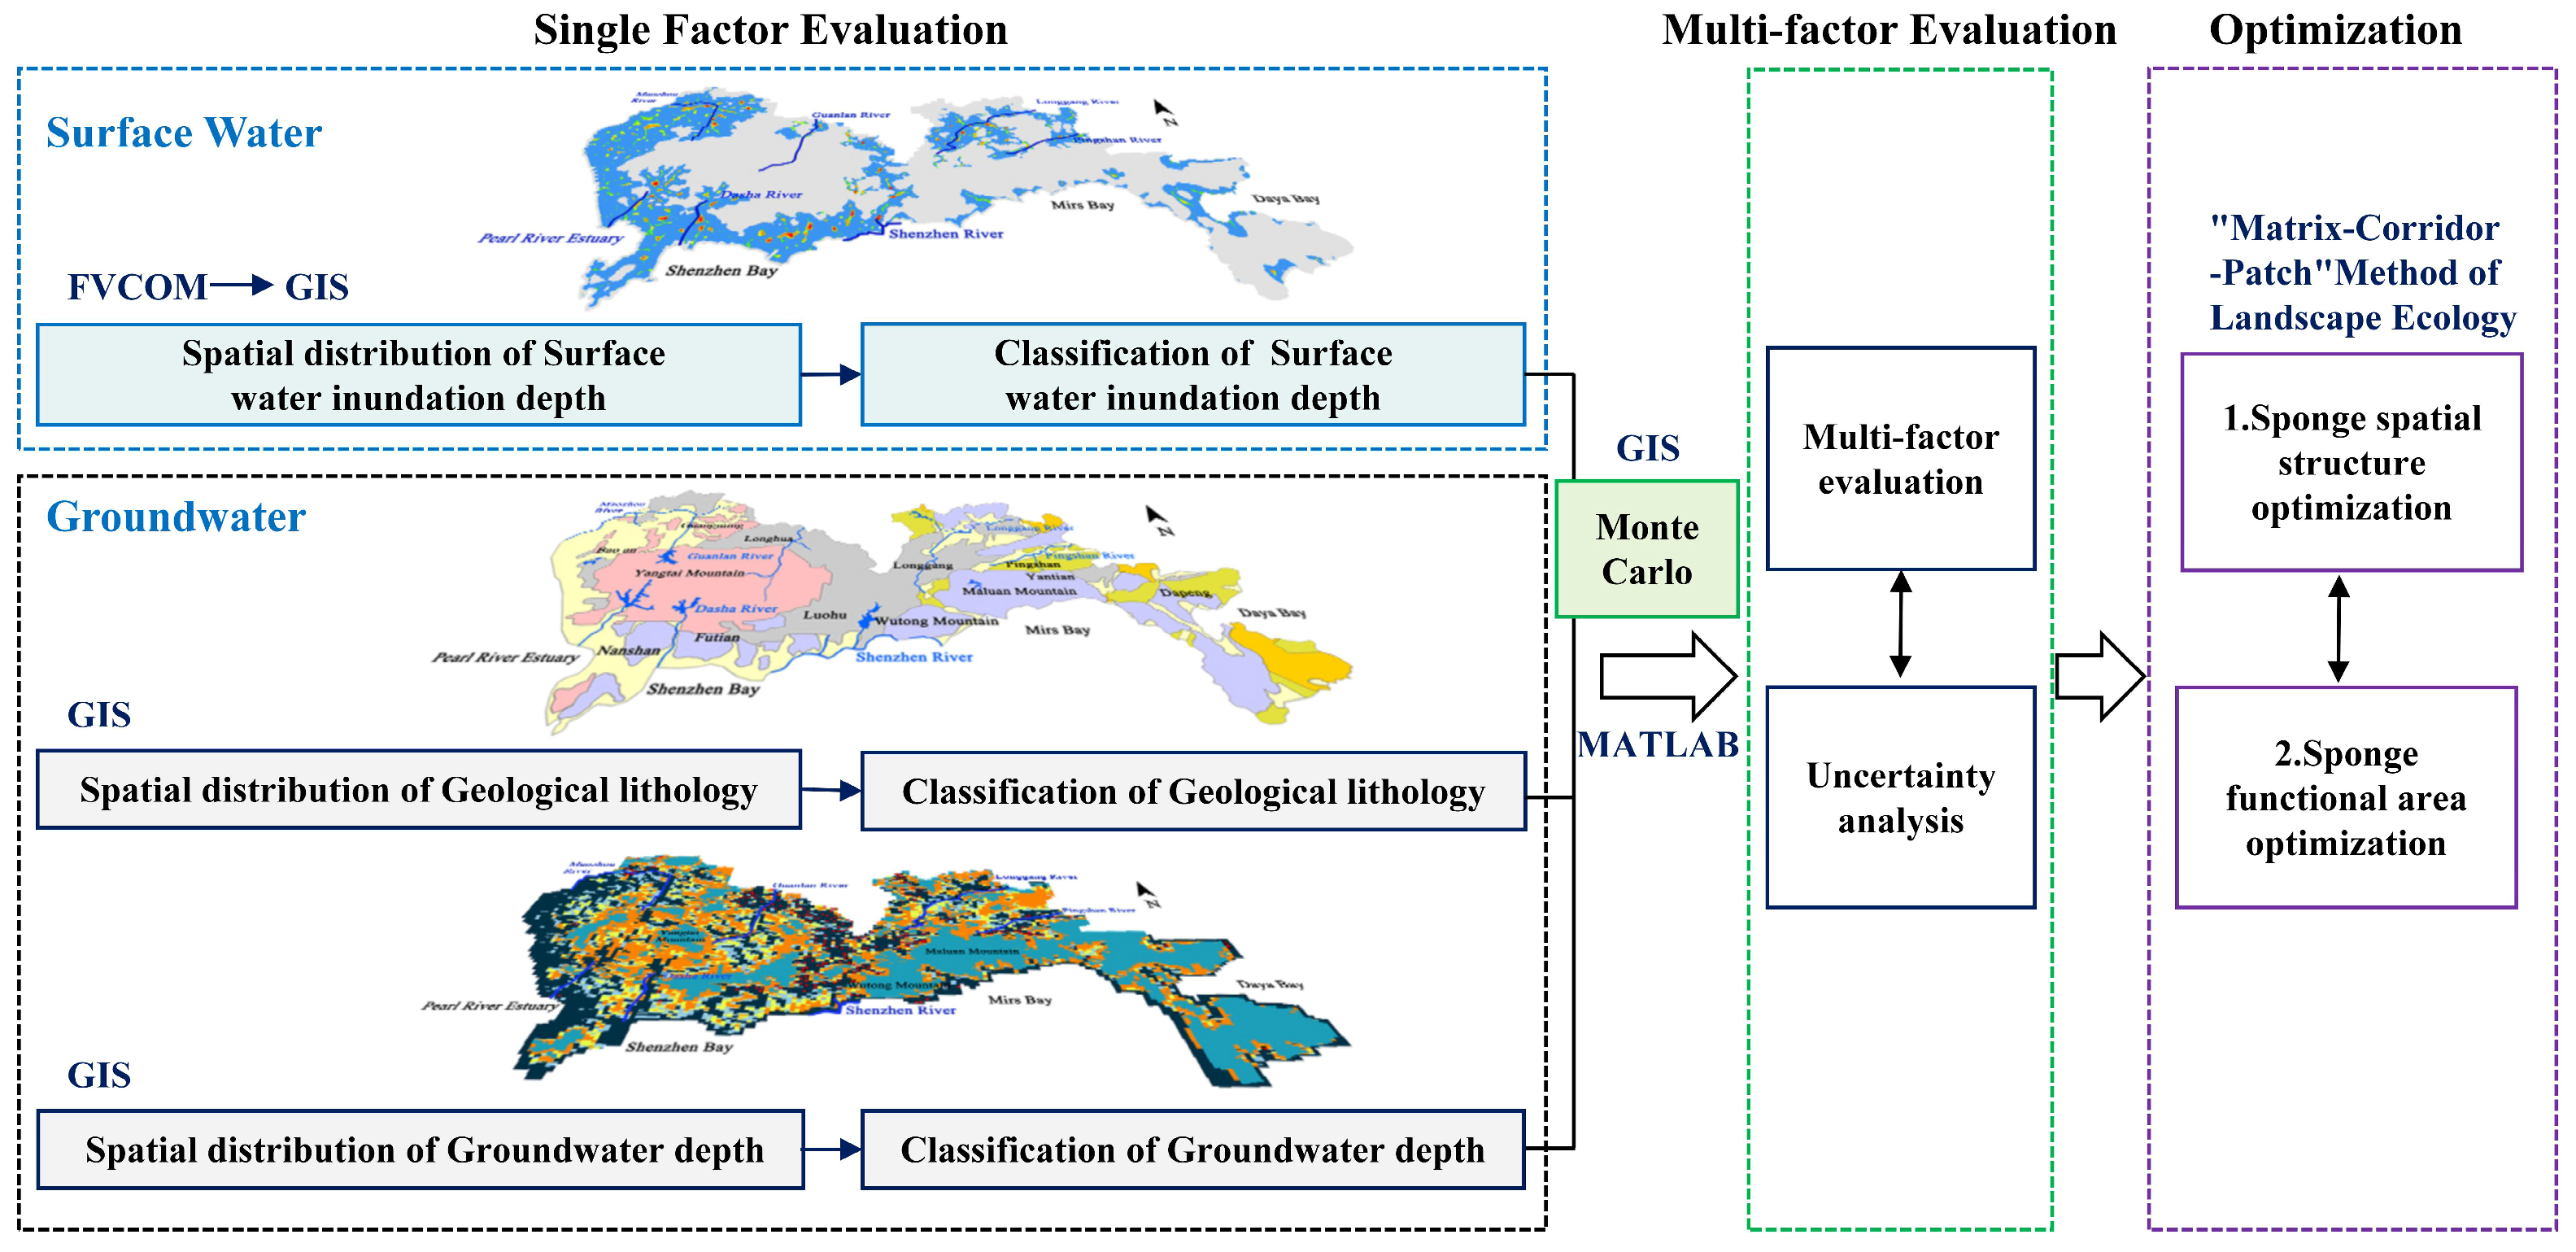
This study proposes a spatial optimization framework for urban-scale sponge systems that integrates hydrodynamic models, geographic information systems, and Monte Carlo simulation, as shown in Figure 2. The specific steps are as follows:
Figure 2.
Modeling framework. (1) The blue box represents Surface water inundation depth; (2) the black box represents Geological lithology and Groundwater depth; (3) the green box represents multi-factor evaluation; (4) the purple box represents sponge system structure and functional area optimization.
- The range, depth, and location of surface water inundation were simulated through the hydrodynamic model Finite-Volume Community Ocean Model (FVCOM).
- The distribution of surface water inundation, geological lithology, and groundwater depth was extracted using GIS technology, with the resolution of all three raster layers unified at 500 m.
- Based on the evaluation method of rainwater infiltration potential, the evaluation factors of each sponge facility were classified.
- The Monte Carlo method and a multi-factor comprehensive evaluation method were used to construct an evaluation system for sponge city suitability and to conduct an uncertainty analysis.
- The sponge system was constructed according to the “matrix-corridor-patch” method of landscape ecology.
2.2.2. FVCOM and Surface Water Inundation Depth
The FVCOM is based on an unstructured triangular mesh [21], and the original three-dimensional equations are differentially discretized by the finite volume method and internal and external mode separation techniques. In this study, we employed the FVCOM model and adopted an unstructured triangular mesh. This method has excellent geometric adaptability (performance advantage) and can precisely depict the complex urban terrain and coastline of Shenzhen. It is crucial for a precise cumulative simulation. In this study, the model was used to simulate the surface water inundation depth under extreme rainfall scenarios in Shenzhen. FVCOM was employed with the following consideration. First, complex boundaries and terrain can be accurately fitted by the vertical σ coordinate system and the horizontal grid of the unstructured triangle. Secondly, the finite volume method improves the computational efficiency and can satisfy the conservation of mass and momentum within the range. Third, the dry–wet discrimination technology can accurately identify the inundation area of surface water.
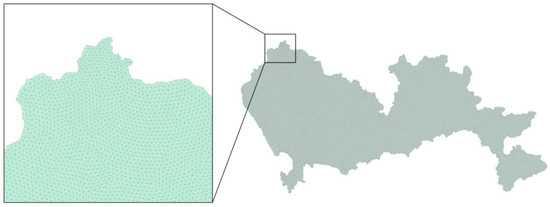
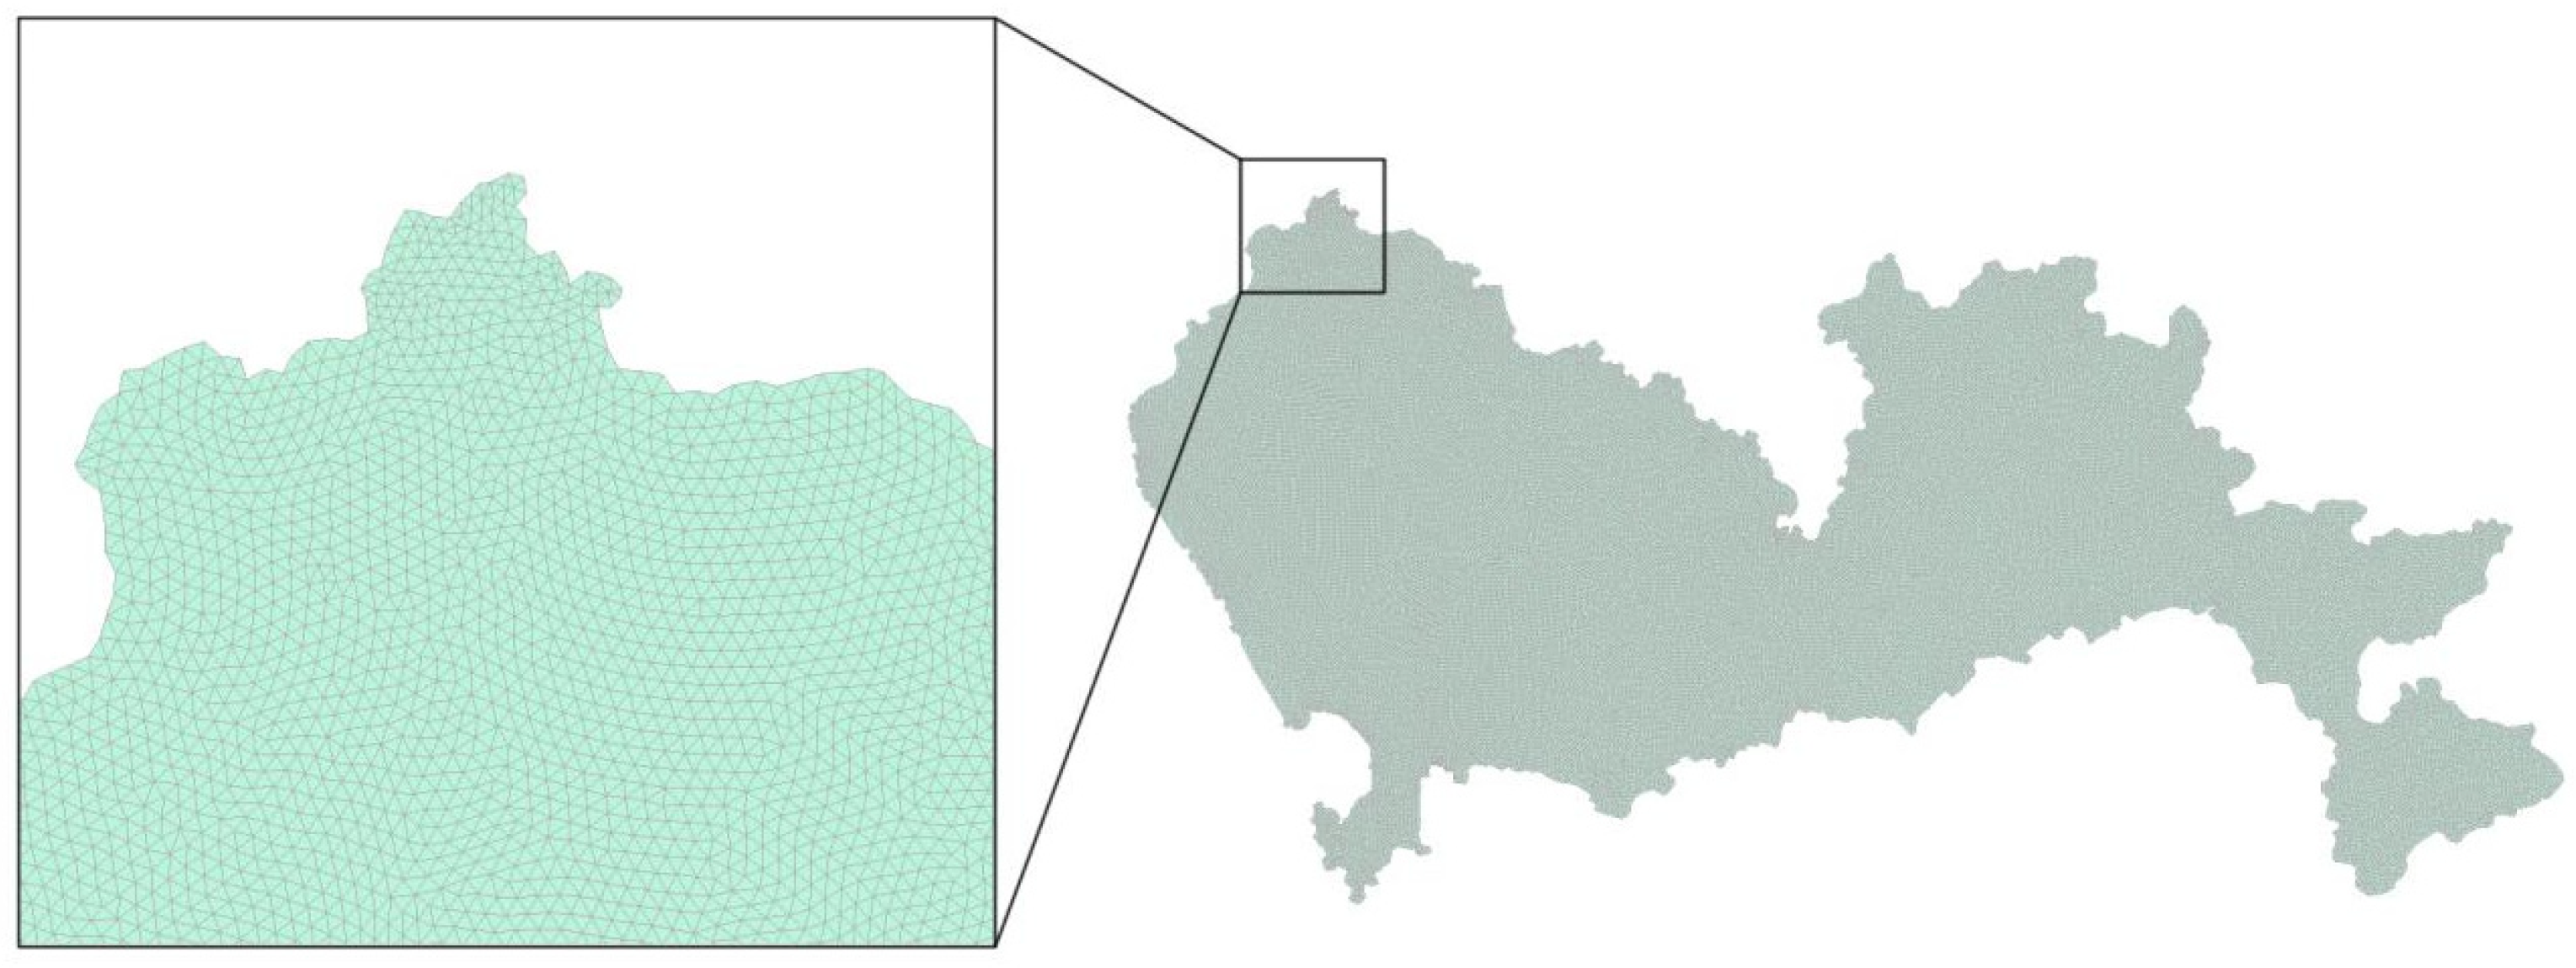
The calculation range of this model covers the whole city of Shenzhen, as shown in Figure 3. The study area is divided into 233,220 triangular nodes and 461,916 triangular units. We assign the corresponding DEM to each grid. The average side length of the grid is 100 m, and the time step is 0.2 s. Since the simulation target is the depth of surface water under the extreme precipitation scenario, the coastal boundary conditions are set to 0, and the initial water depth conditions are 0. The simulation results from the FVCOM unstructured triangular mesh were interpolated into raster datasets (500 m resolution) using the Natural Neighbor method in ArcGIS 10.2. This process ensured that the data resolution matched that of the hydrogeological layers.
Figure 3.
FVCOM domain and computation grid.
2.2.3. GIS Technology, Lithology Zoning, and Groundwater Depth
The hydrogeological zoning map of Shenzhen was extracted and generalized by GIS. The geological zoning map was drawn based on the regional hydrogeological survey report of the Geological Bureau of Guangdong Province, China, and divided Shenzhen into 6 hydrogeological units [20,22]. Different hydrogeological units have different lithology and permeability coefficients (K value). It can represent the capability of rainwater infiltration under different lithology conditions.
The groundwater burial depth factor is calculated by using GIS spatial analysis technology. The surface elevation DEM of Shenzhen City is subtracted from the groundwater Simulation model under steady-state conditions simulated by MODFLOW (previous research results) [18], and the spatial distribution data reflecting the regional natural hydrogeological background is obtained. This result characterizes the background status of groundwater burial depth under long-term average recharge and discharge conditions, without short-term human interference.
On the ArcGIS platform, both lithology zoning and groundwater depth are divided into spatial grids, with the grid size uniformly set at 500 m × 500 m to ensure consistency with the GIS grid for surface water inundation depth.
2.2.4. Classification of Single Factor Based on Infiltration of Sponge City
The study’s objective on the distribution of suitable sponge areas is to promote rainwater infiltration, and the influencing factors of rainwater infiltration are selected to be analyzed, including surface water inundation depth, stratigraphic lithology zoning, and groundwater depth.
The three factors are calculated in spatial superposition on the GIS platform, so the classification of the number of grades should be consistent. The depth of surface water is divided into six levels according to how deeply it is submerged. The lithology of strata can be divided into 6 grades according to the different properties and the size of the K value. Groundwater depth was classified into six categories. We rate the scale from 0 to 5 based on the ease of infiltration and infiltration of rainwater. A score of 5 indicates that it is most conducive to rainwater infiltration and penetration, and a score of 0 indicates that it is least susceptible to rainwater infiltration and penetration.
2.2.5. Assessment of Sponge Suitability Area by Monte Carlo Method
Monte Carlo, a stochastic simulation technique grounded in probability theory [23]. Its application is based on the premise that all relevant variables are mutually independent, as shown in Formula (1).
Y = f(x)
Here, the output Y is determined by the fundamental variables x1, x2, …. When xn is determined by a functional relationship, the model is as follows.
Where x—input quantity, x = x1, x2, … xn.
We use the Monte Carlo method for random calculations and assume that the weights are evenly distributed in the interval [0, 1]. Monte Carlo sampling was used to extract 10,000 groups of evaluation factors and assign weights, and then the probability distribution of scoring results was obtained. The mean represents the score of the suitable areas for sponges, while the standard deviation indicates the level of uncertainty in the study. Through the comparison and analysis of the results, we determined the distribution of sponge-suitable areas in Shenzhen. A sponge system was then constructed based on the characteristics of these suitable areas [24].
3. Results
3.1. Modeling and Classification of Surface Water Inundation Depth
Stagnant water accumulates when drainage is blocked or insufficient. The depth of water accumulation indicates that the degree of water accumulation is mainly affected by meteorological conditions (precipitation), topography (surface elevation), drainage systems, and other factors. In this study, FVCOM was used to simulate the once-in-a-hundred-year precipitation process and build a water accumulation depth model with surface elevation in Shenzhen. The results showed the location and range of water accumulation depth in Shenzhen and were graded according to the difficulty of infiltration and the risk of causing waterlogging.
3.1.1. Numerical Simulation of FVCOM
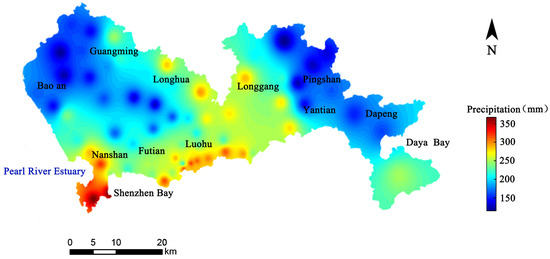
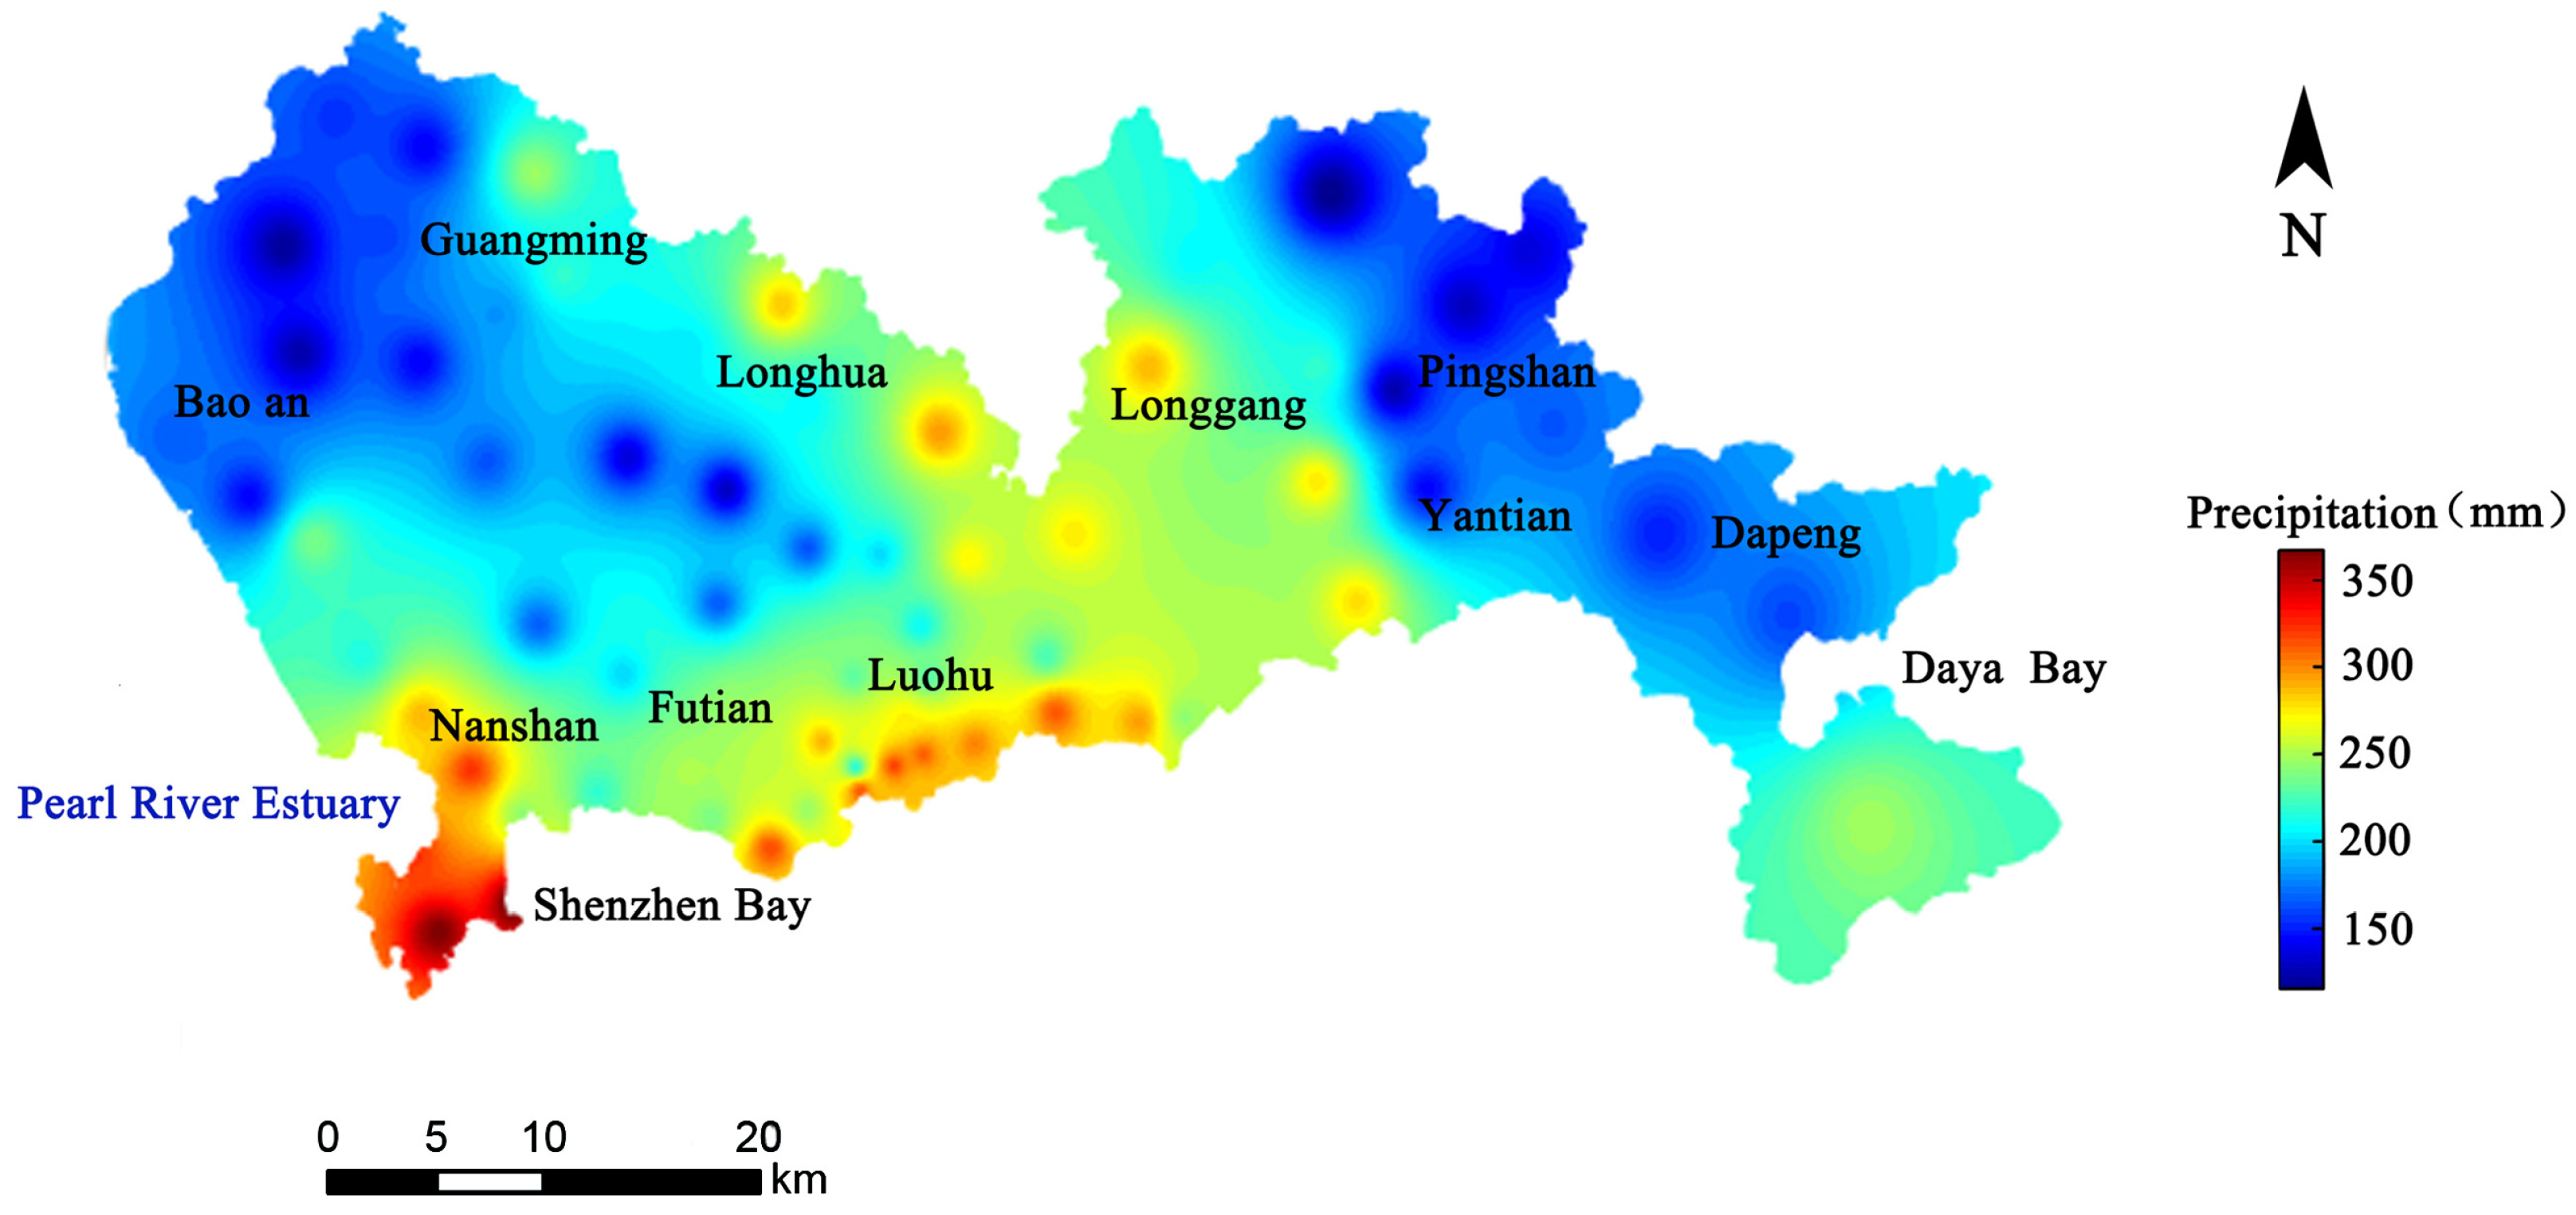
The precipitation data for the simulation were obtained from 74 monitoring stations operated by the Shenzhen Meteorological Bureau, recorded at 30 min intervals. The spatial distribution of precipitation across Shenzhen was generated using an inverse distance weighting interpolation algorithm. As shown in Figure 4, the precipitation in Nanshan and Shenzhen Bay is between 350 and 400 mm, while the precipitation in Baoan, Dapeng, and Pingshan is between 100 and 150 mm. The precipitation in Futian, Luohu, and Longgang is about 250–300 mm. The simulation started at 12:00 on 9 October 2021, with a total duration of 12 h. Based on local rainfall thresholds, the 12 h total precipitation for a 100-year return period was set at 371 mm. The FVCOM simulation of this extreme precipitation event yielded the spatial distribution of surface water inundation depth.
Figure 4.
Spatial distribution of once-in-a-century precipitation in Shenzhen on 9 October 2021.
3.1.2. Model Validation with Observed Waterlogging Points
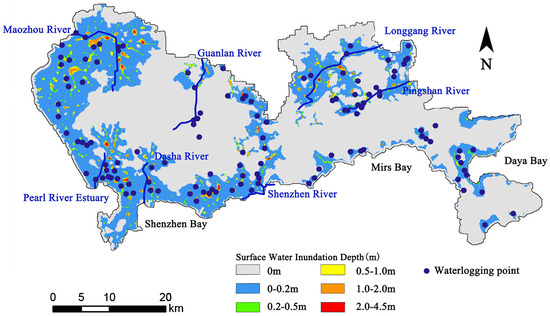
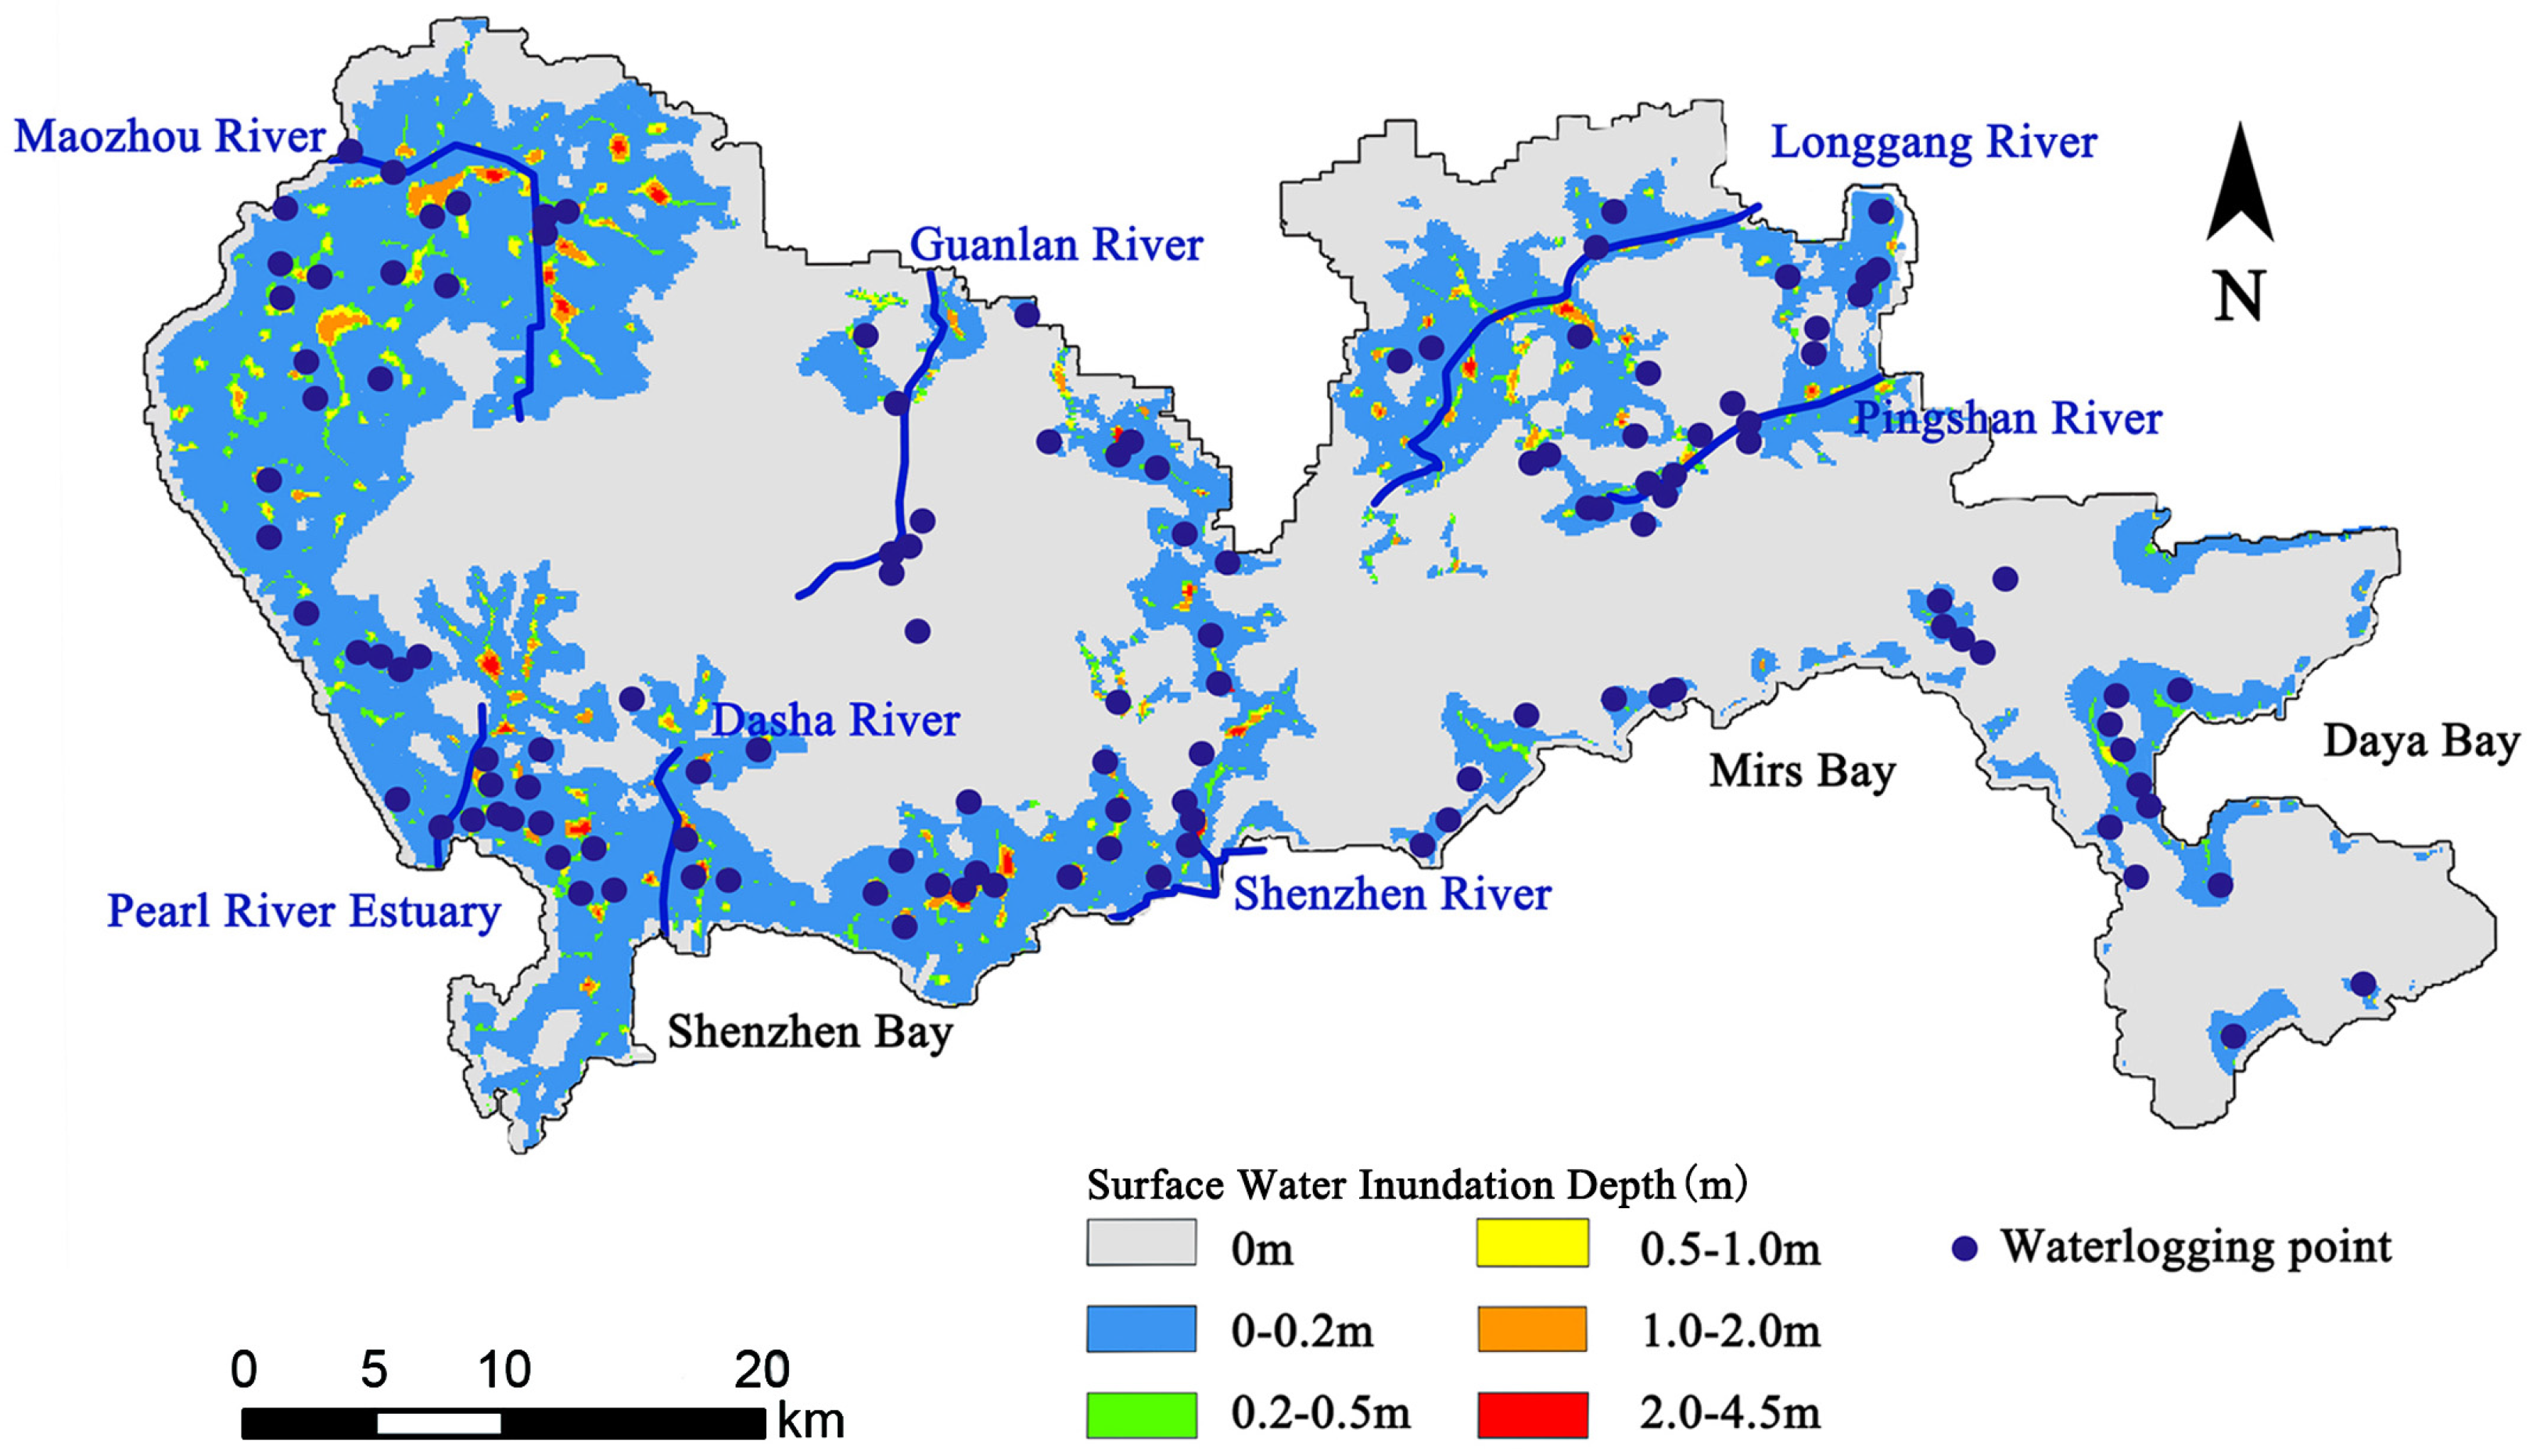
The website of the Shenzhen Meteorological Bureau provides the spatial distribution of waterlogging points in Shenzhen. It is the actual urban waterlogging point checked under extreme precipitation in Shenzhen. To validate the simulation results, the spatial distribution of actual waterlogging points during extreme precipitation events was compared with the FVCOM output. The comparison shows a strong agreement, with 84% of the observed waterlogging points falling within the simulated water accumulation areas; see Figure 5. The discrepancies between the model and observations are attributed to complexities in the urban environment not fully captured by the numerical simulation, such as drainage blockages caused by human activities or waterlogging near riverbanks.
Figure 5.
Comparison of simulated surface water inundation depth and waterlogging point distribution.
3.1.3. Risk-Based Classification of Surface Water Inundation Depth
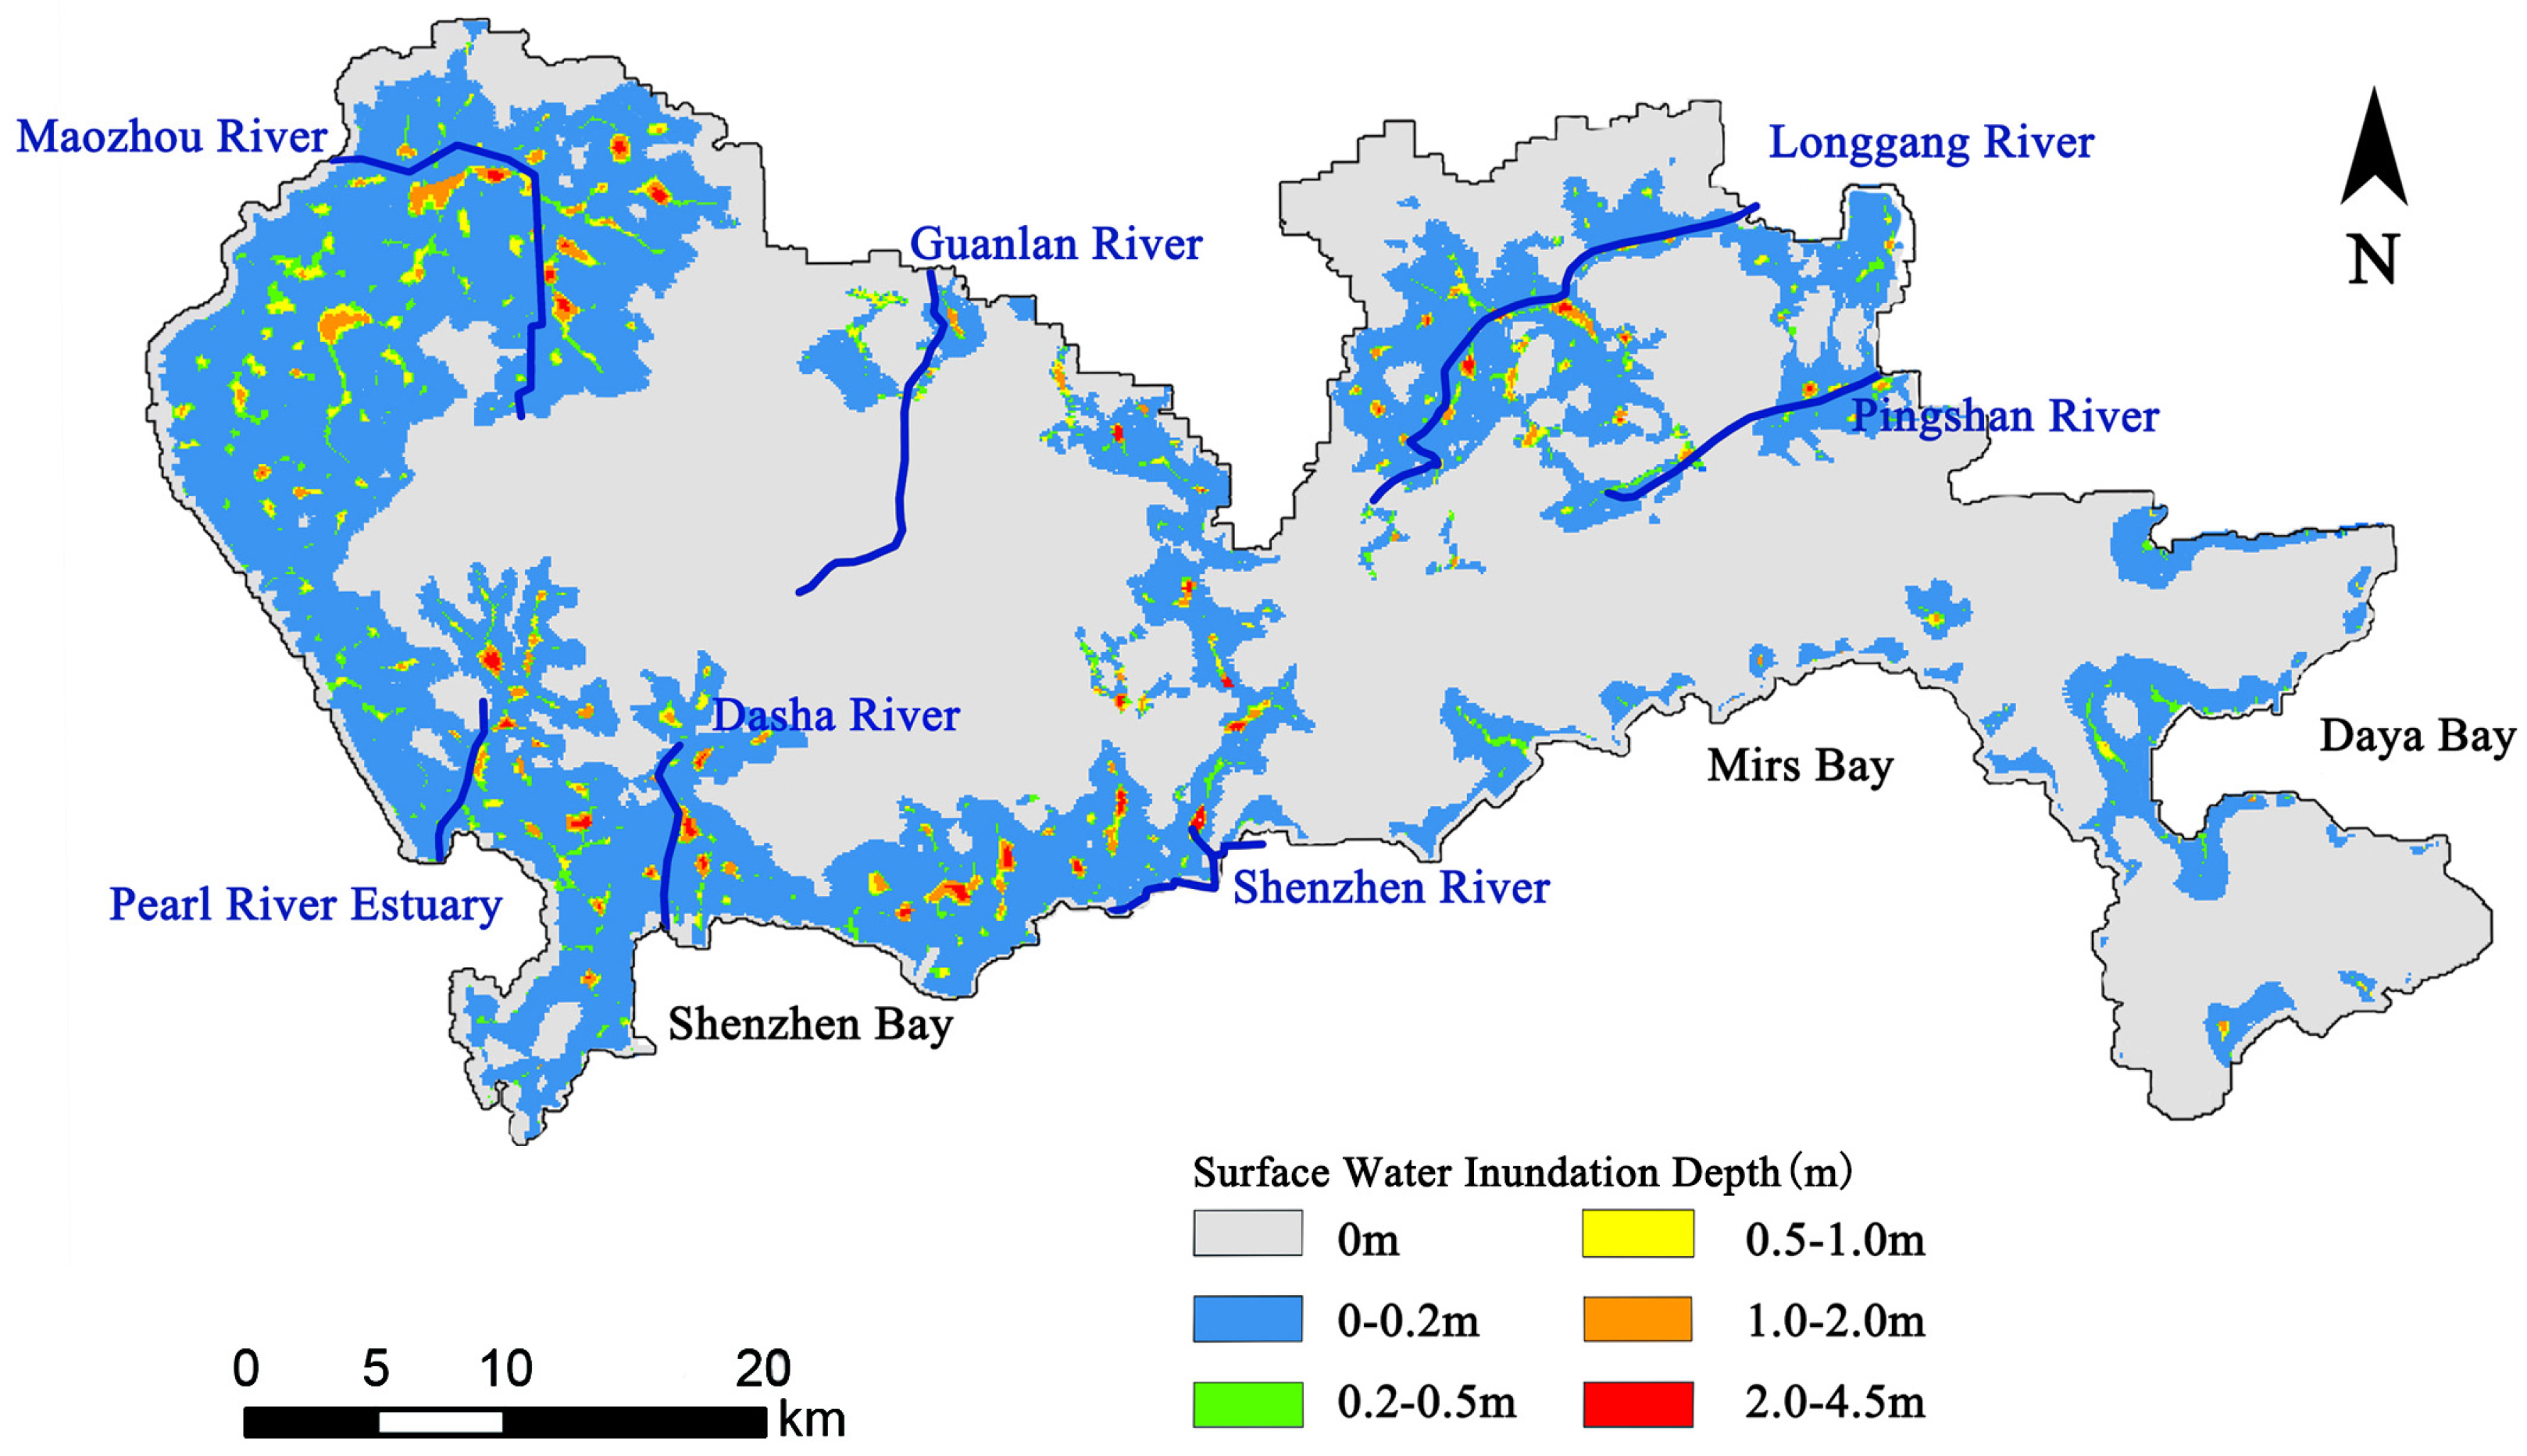
Surface water inundation depth is a key indicator of both rainwater infiltration potential and urban waterlogging risk. Insufficient depth prevents effective infiltration, while excessive depth significantly increases flooding hazards. The spatial distribution of the simulated surface water inundation depth is presented in Figure 6. For a detailed assessment, the surface water inundation depth was classified into six grades (Table 2), refining the three-grade scale (mild: D < 0.5 m, moderate: 0.5 ≤ D < 1.0 m, serious: D ≥ 1.0 m) suggested by the National Disaster Prevention Code. This refined classification specifically addresses the need for effective rainwater management.
Figure 6.
Spatial distribution of simulated surface water inundation depth.
Table 2.
Classification of surface water inundation depth.
- (1)
- Grade 5 (High: 0.2–0.5 m): This depth is optimal for infiltration, poses no waterlogging risk, and receives the highest score.
- (2)
- Grade 4 (Medium-High: 0–0.2 m): Covering the largest area (primarily in Baoan Plain, Nanshan Shenzhen Bay, and around Longgang District), this grade allows for groundwater permeation and scores 4.
- (3)
- Grade 3 (Intermediate: 0.5–1.0 m): This depth carries a certain flooding risk and is assigned a score of 3.
- (4)
- Grade 2 (Middle-Low: 1.0–2.0 m): Areas with this depth are at significant risk of waterlogging and require rapid drainage via pipes and pumps, scoring 2.
- (5)
- Grade 1 (Slight: 0 m): This indicates no surface water and, consequently, no infiltration, scoring 1.
- (6)
- Grade 0 (Low: >2.0 m): This represents a high-risk zone where infrastructure improvements are critical for disaster mitigation, resulting in a score of 0.
3.2. Stratigraphic Lithology Factors and Classification
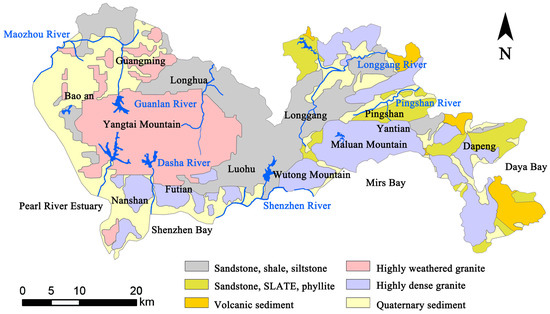
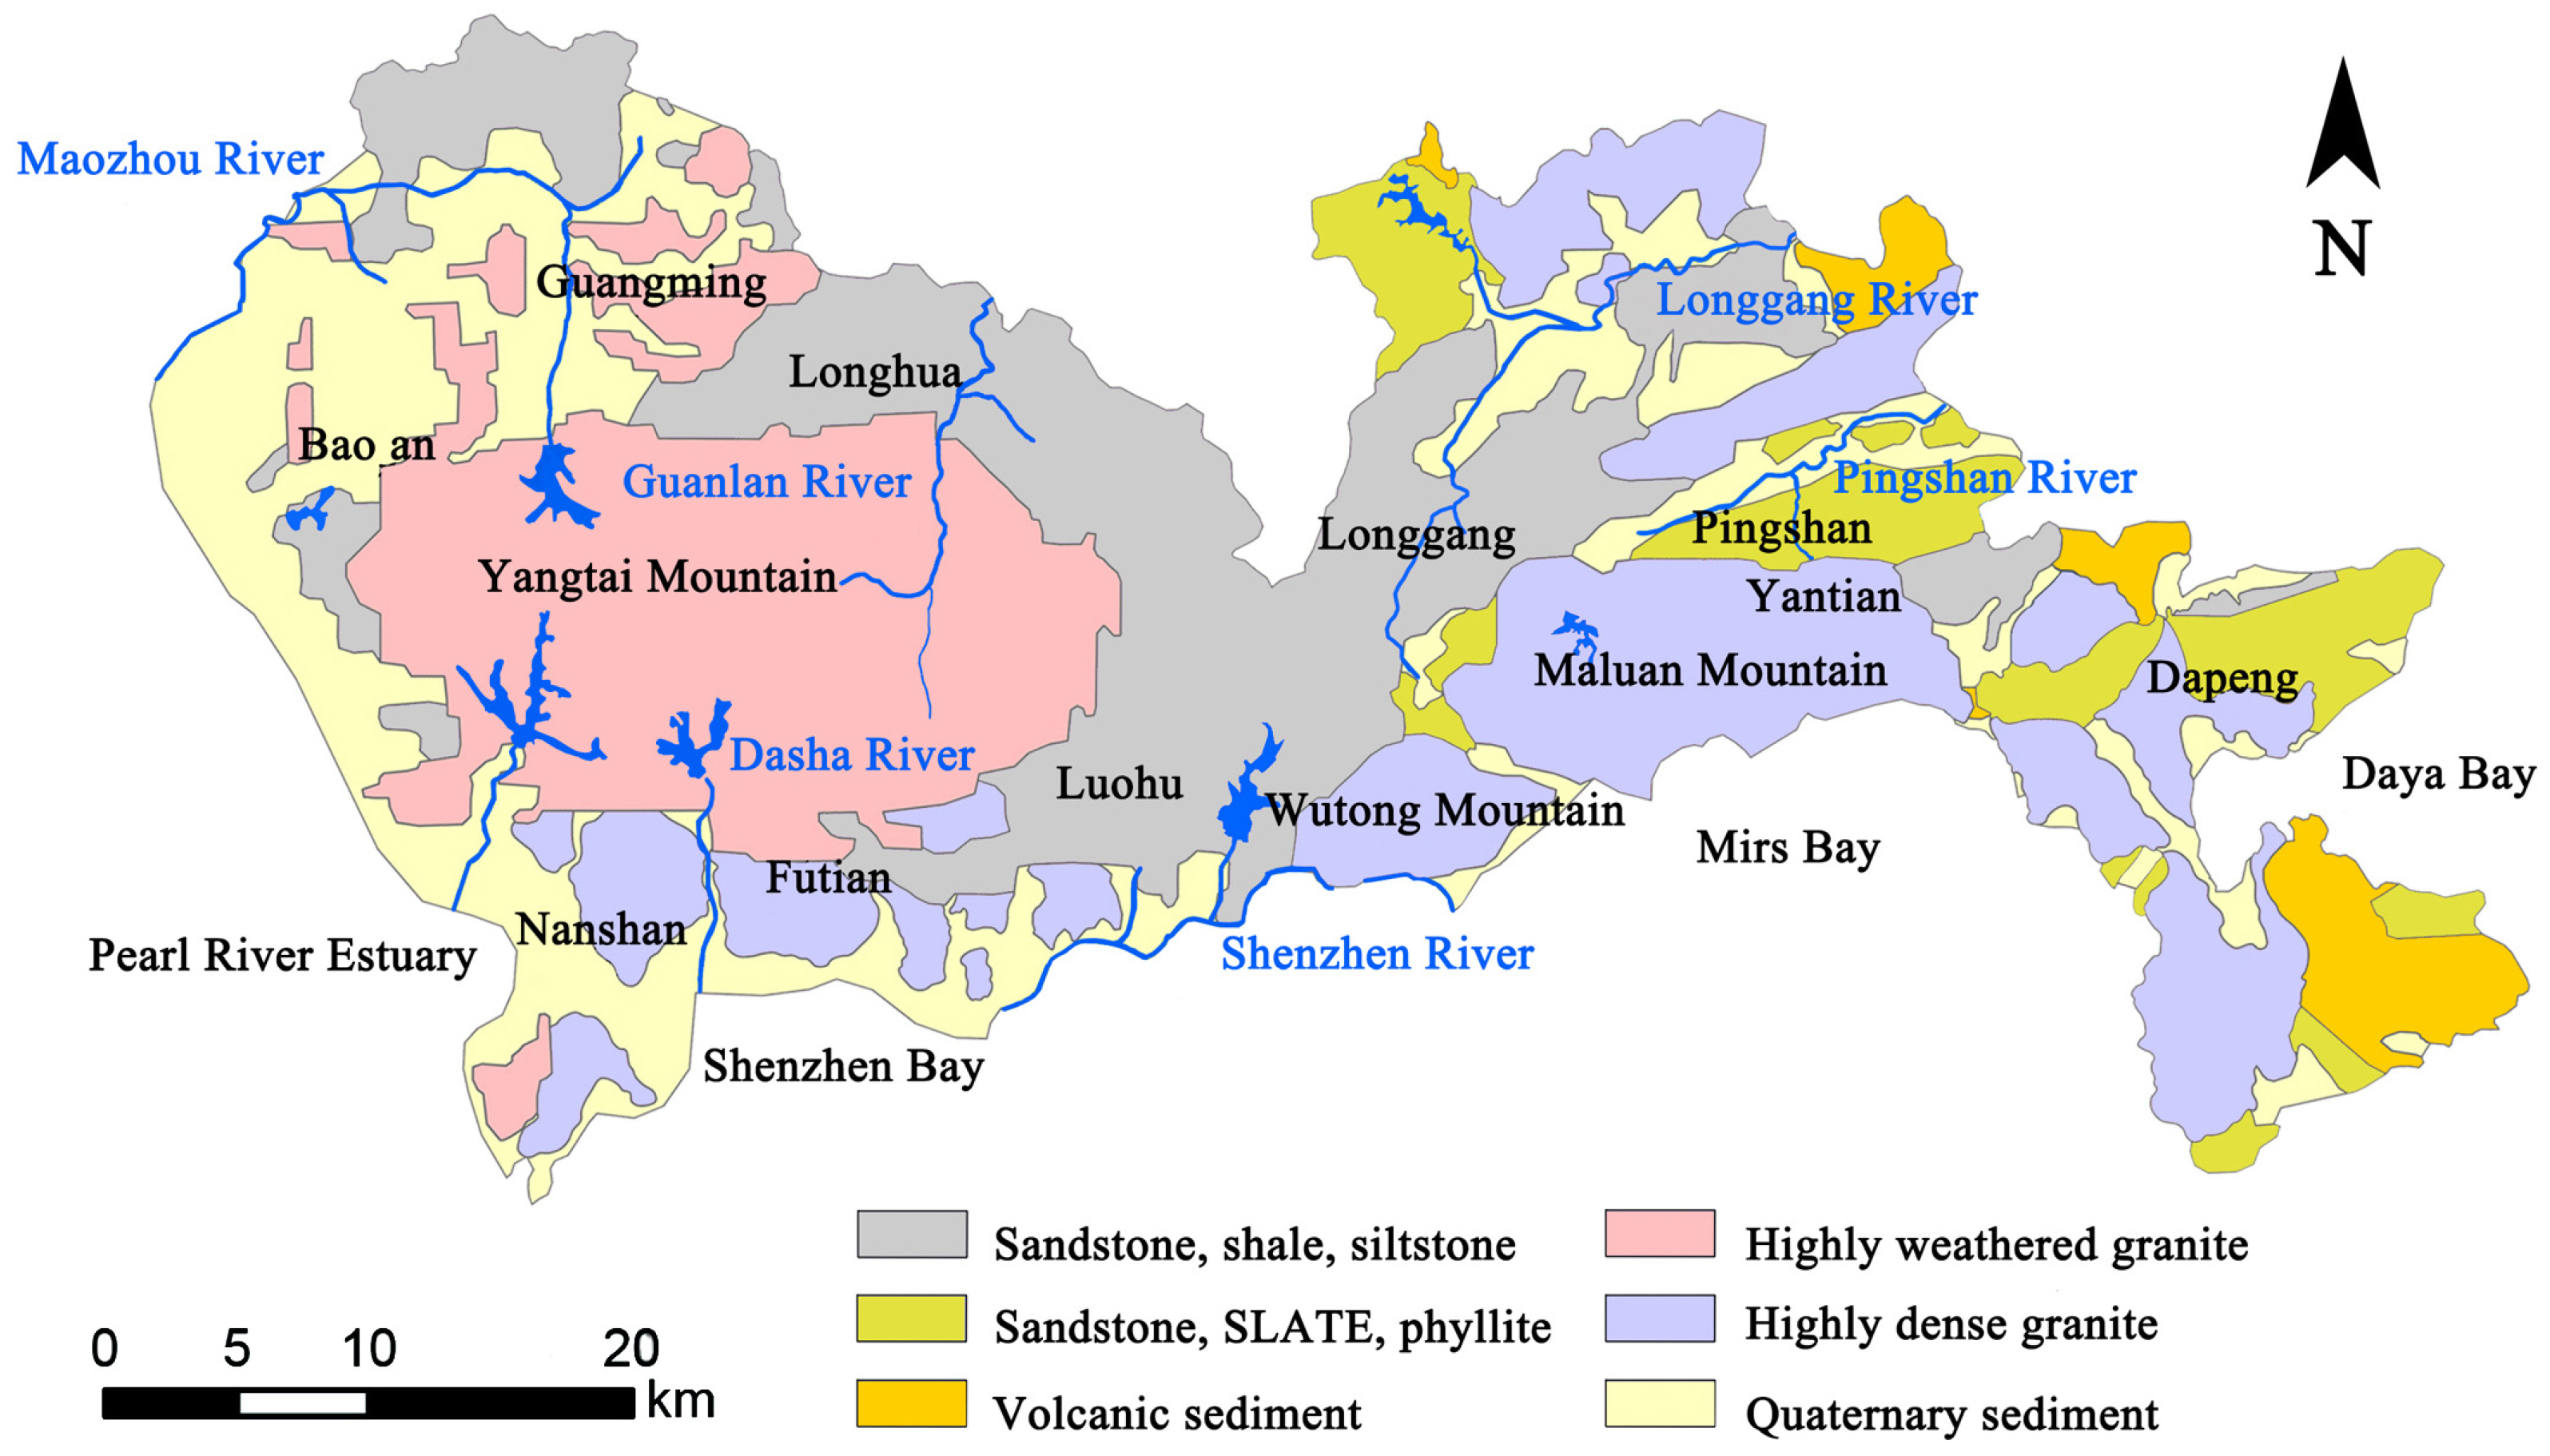
Stratigraphic lithology serves as the basis for classifying rock types such as granite, sedimentary rock, and sandstone [25,26]. Different lithologies exhibit varying capacities for water transmission, primarily characterized by the hydraulic conductivity (K). Both stratigraphic lithology and the K are used to evaluate the potential of rainwater to infiltrate into groundwater aquifers.
3.2.1. Formation Lithology Factors
Shenzhen’s subsurface comprises six distinct hydrogeological units, each defined by characteristic lithologies and associated hydraulic conductivity values, as illustrated in Figure 7. This classification is instrumental in assessing the potential capability of rainwater infiltration across different regions. For context, sponge city facilities are considered most effective in urban aquifers where the K exceeds 1 × 10⁻⁵ m/s [27].
Figure 7.
Spatial distribution of geological lithology.
The spatial distribution and characteristics of these units are detailed below:
- (1)
- Sandstone, shale, and siltstone. These lithologies are predominantly found in the Longhua, Longgang, and Luohu districts, particularly within the Guanlan Valley and Longgang River Valley.
- (2)
- Sandstone, SLATE, and phyllite. These are mainly located in the Pingshan River and Dapeng areas. It is noteworthy that the sandstone types in both this unit and the previous one generally exhibit low porosity.
- (3)
- Volcanic sediment. This unit, primarily distributed along the Longgang River and the Dapeng Peninsula, is characterized by a high capacity to absorb and transmit significant volumes of rainwater.
- (4)
- Highly weathered granite. Found mainly in Yantian Mountain and parts of Guangming District, this unit has moderate potential for infiltration.
- (5)
- Highly dense granite. Located in areas such as Maluan Mountain, Wutong Mountain, and the Dapeng Peninsula, the low porosity and minimal fracturing of this granite result in very low hydraulic conductivity and weak infiltration potential.
- (6)
- Quaternary sediment. These unconsolidated deposits, located in alluvial valleys and coastal plains (e.g., Guangming, Baoan, and Nanshan), typically possess high porosity and strong hydraulic conductivity, leading to excellent rainwater infiltration potential.
3.2.2. Classification of Geological Lithology Factors
Based on the lithological properties and their corresponding hydraulic conductivity, the six hydrogeological units are classified into a graded system. This classification provides a quantitative framework for evaluating the suitability of different areas for groundwater recharge and the implementation of sponge city strategies, as detailed in Table 3. A higher grade signifies more favorable conditions for infiltration.
Table 3.
Classification of geological lithology.
3.3. Groundwater Depth Factors and Classification
3.3.1. Groundwater Depth Factor
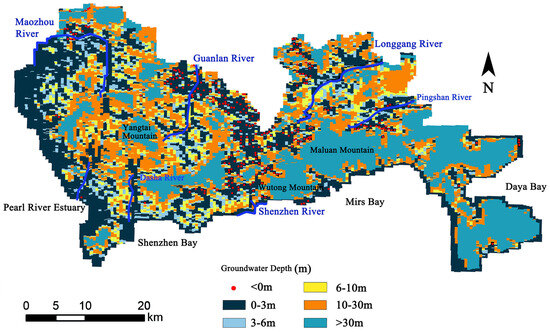
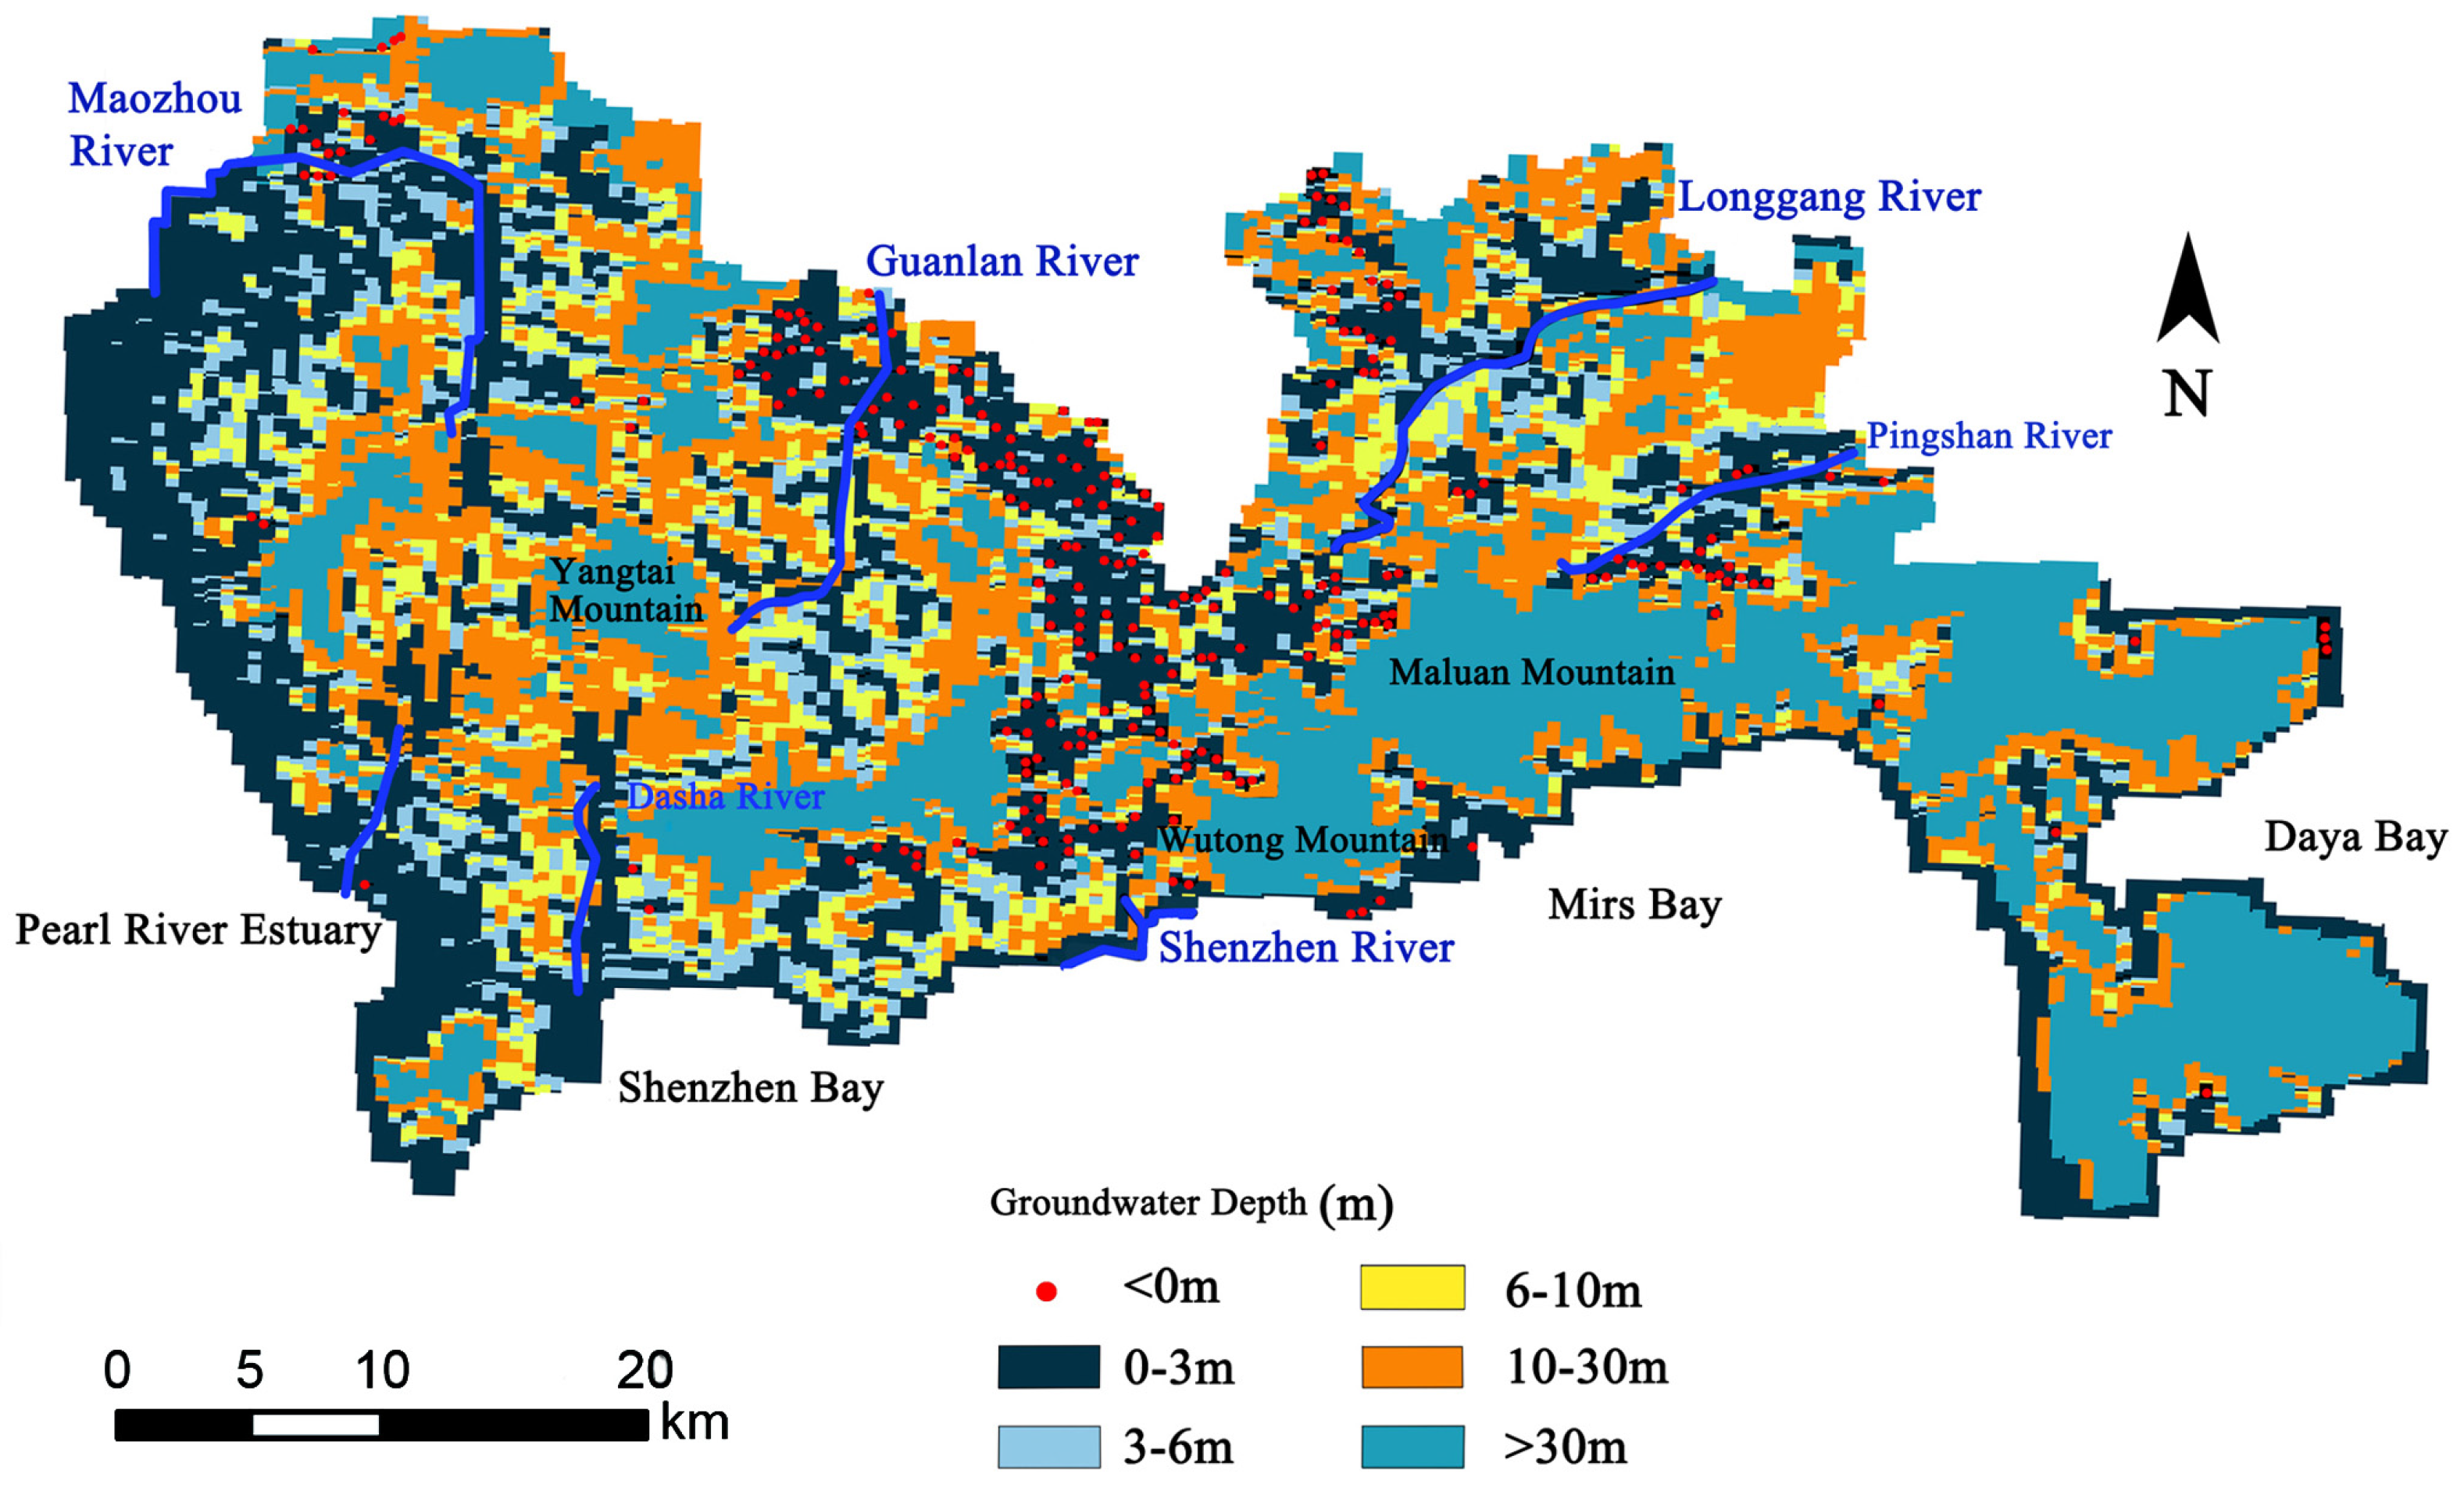
Owing to its coastal mountains, foothills, and hills, Shenzhen exhibits large spatial variability in groundwater depth. As illustrated in Figure 8, a 0.5–2.5 km wide coastal strip near Shekou Port and Yantian Port in Baoan District features very shallow groundwater depths (0–3 m), where the water table is near the surface, leaving minimal available storage capacity. Similarly, parts of the Longgang and Longhua valleys experience a high-water table, leading to waterlogged soils and an increased risk of flooding. In contrast, the foothill areas of Yantian Mountain, Wutong Mountain, and Maluan Mountain exhibit optimal groundwater depths, making them natural zones for water storage. For typical rainfall events, the groundwater level rise is generally between 0.3 and 0.5 m, while extreme precipitation events can cause a rise of 0.5–1.0 m, with a cumulative seasonal increase typically less than 3 m. Excessively shallow depths indicate limited storage space, hindering infiltration, while very deep depths (e.g., >30 m) suggest a lack of effective connection between surface water and the aquifer. Therefore, classifying groundwater depth is essential for evaluating suitable areas for sponge city initiatives.
Figure 8.
Spatial distribution of groundwater depth.
3.3.2. Classification of Groundwater Depth
A classification system for the groundwater depth factor was established based on its impact on groundwater storage capacity, as detailed in Table 4. The classification rationale is as follows: a groundwater depth range of 3–6 m is assigned the highest grade (Grade 5), as this depth range provides substantial storage without being so shallow as to cause waterlogging. A groundwater table depth of 6–10 m also possesses significant stormwater storage capacity and is assigned as Grade 4. A groundwater depth of 0–3 m offers some storage but carries a high flooding risk, resulting in a Grade 3. A groundwater depth of 10–30 m indicates that rainwater infiltration to the aquifer is challenging under ordinary conditions, thereby jusifying a Grade 2 classification. Depths exceeding 30 m suggest limited groundwater circulation, often confined to local fault zones, with very weak infiltration capacity (Grade 1). Finally, areas where the water table is above the surface present the greatest flooding risk and are assigned the classification Grade 0.
Table 4.
Classification of groundwater depth.
3.4. Monte Carlo Factor Calculation Results
Following the individual analysis of factors influencing sponge suitability, an integrated assessment was conducted. Each factor (surface water inundation depth, stratigraphic lithology, and groundwater depth) was classified into six grades based on its suitability for rainwater infiltration. The Monte Carlo method was employed to objectively determine the composite suitability by accounting for uncertainty in factor weighting.
The integration process involved three key steps:
- (1)
- Data Standardization. The spatial data for the three suitability factors were resampled to the spatial resolution of 500 m × 500 m.
- (2)
- Monte Carlo Simulation. Using MATLAB R2018b, a Monte Carlo numerical simulation was performed. This involved randomly generating 10,000 sets of weight combinations for the three factors. The weights were assumed to follow a uniform distribution within the interval [0, 1], with the constraint that for each simulation, the sum of the three weights must equal 1. This approach comprehensively explores the entire plausible weight space.
- (3)
- Spatial Overlay and Calculation. For each of the 10,000 weight combinations, a weighted overlay analysis was performed on the standardized grids. The suitability score for each grid cell was calculated as the weighted sum of its individual factor grades.
The spatial distribution of every single factor, expressed as the percentage of total area occupied by each grade, is summarized in Table 5. This provides a baseline understanding of the inherent suitability characteristics of the region before integration. Based on the 10,000 Monte Carlo simulations, the final composite suitability scores for each grid cell were aggregated and classified into four distinct categories of sponge suitability. The area proportion of each category within Shenzhen is presented in Table 6. The results indicate that the majority of the area falls into the “Suitable” and “Sub-suitable” categories, with a significant portion also classified as “Most Suitable.”
Table 5.
The area ratio of every single factor.
Table 6.
The area proportion of each sponge suitable area.
3.5. Sponge Suitable Area Evaluation and Uncertainty Analysis
3.5.1. Sponge Suitable Area Evaluation
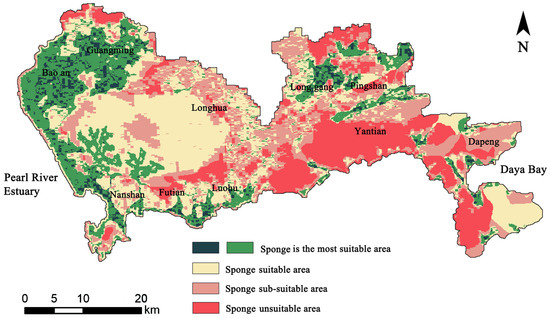
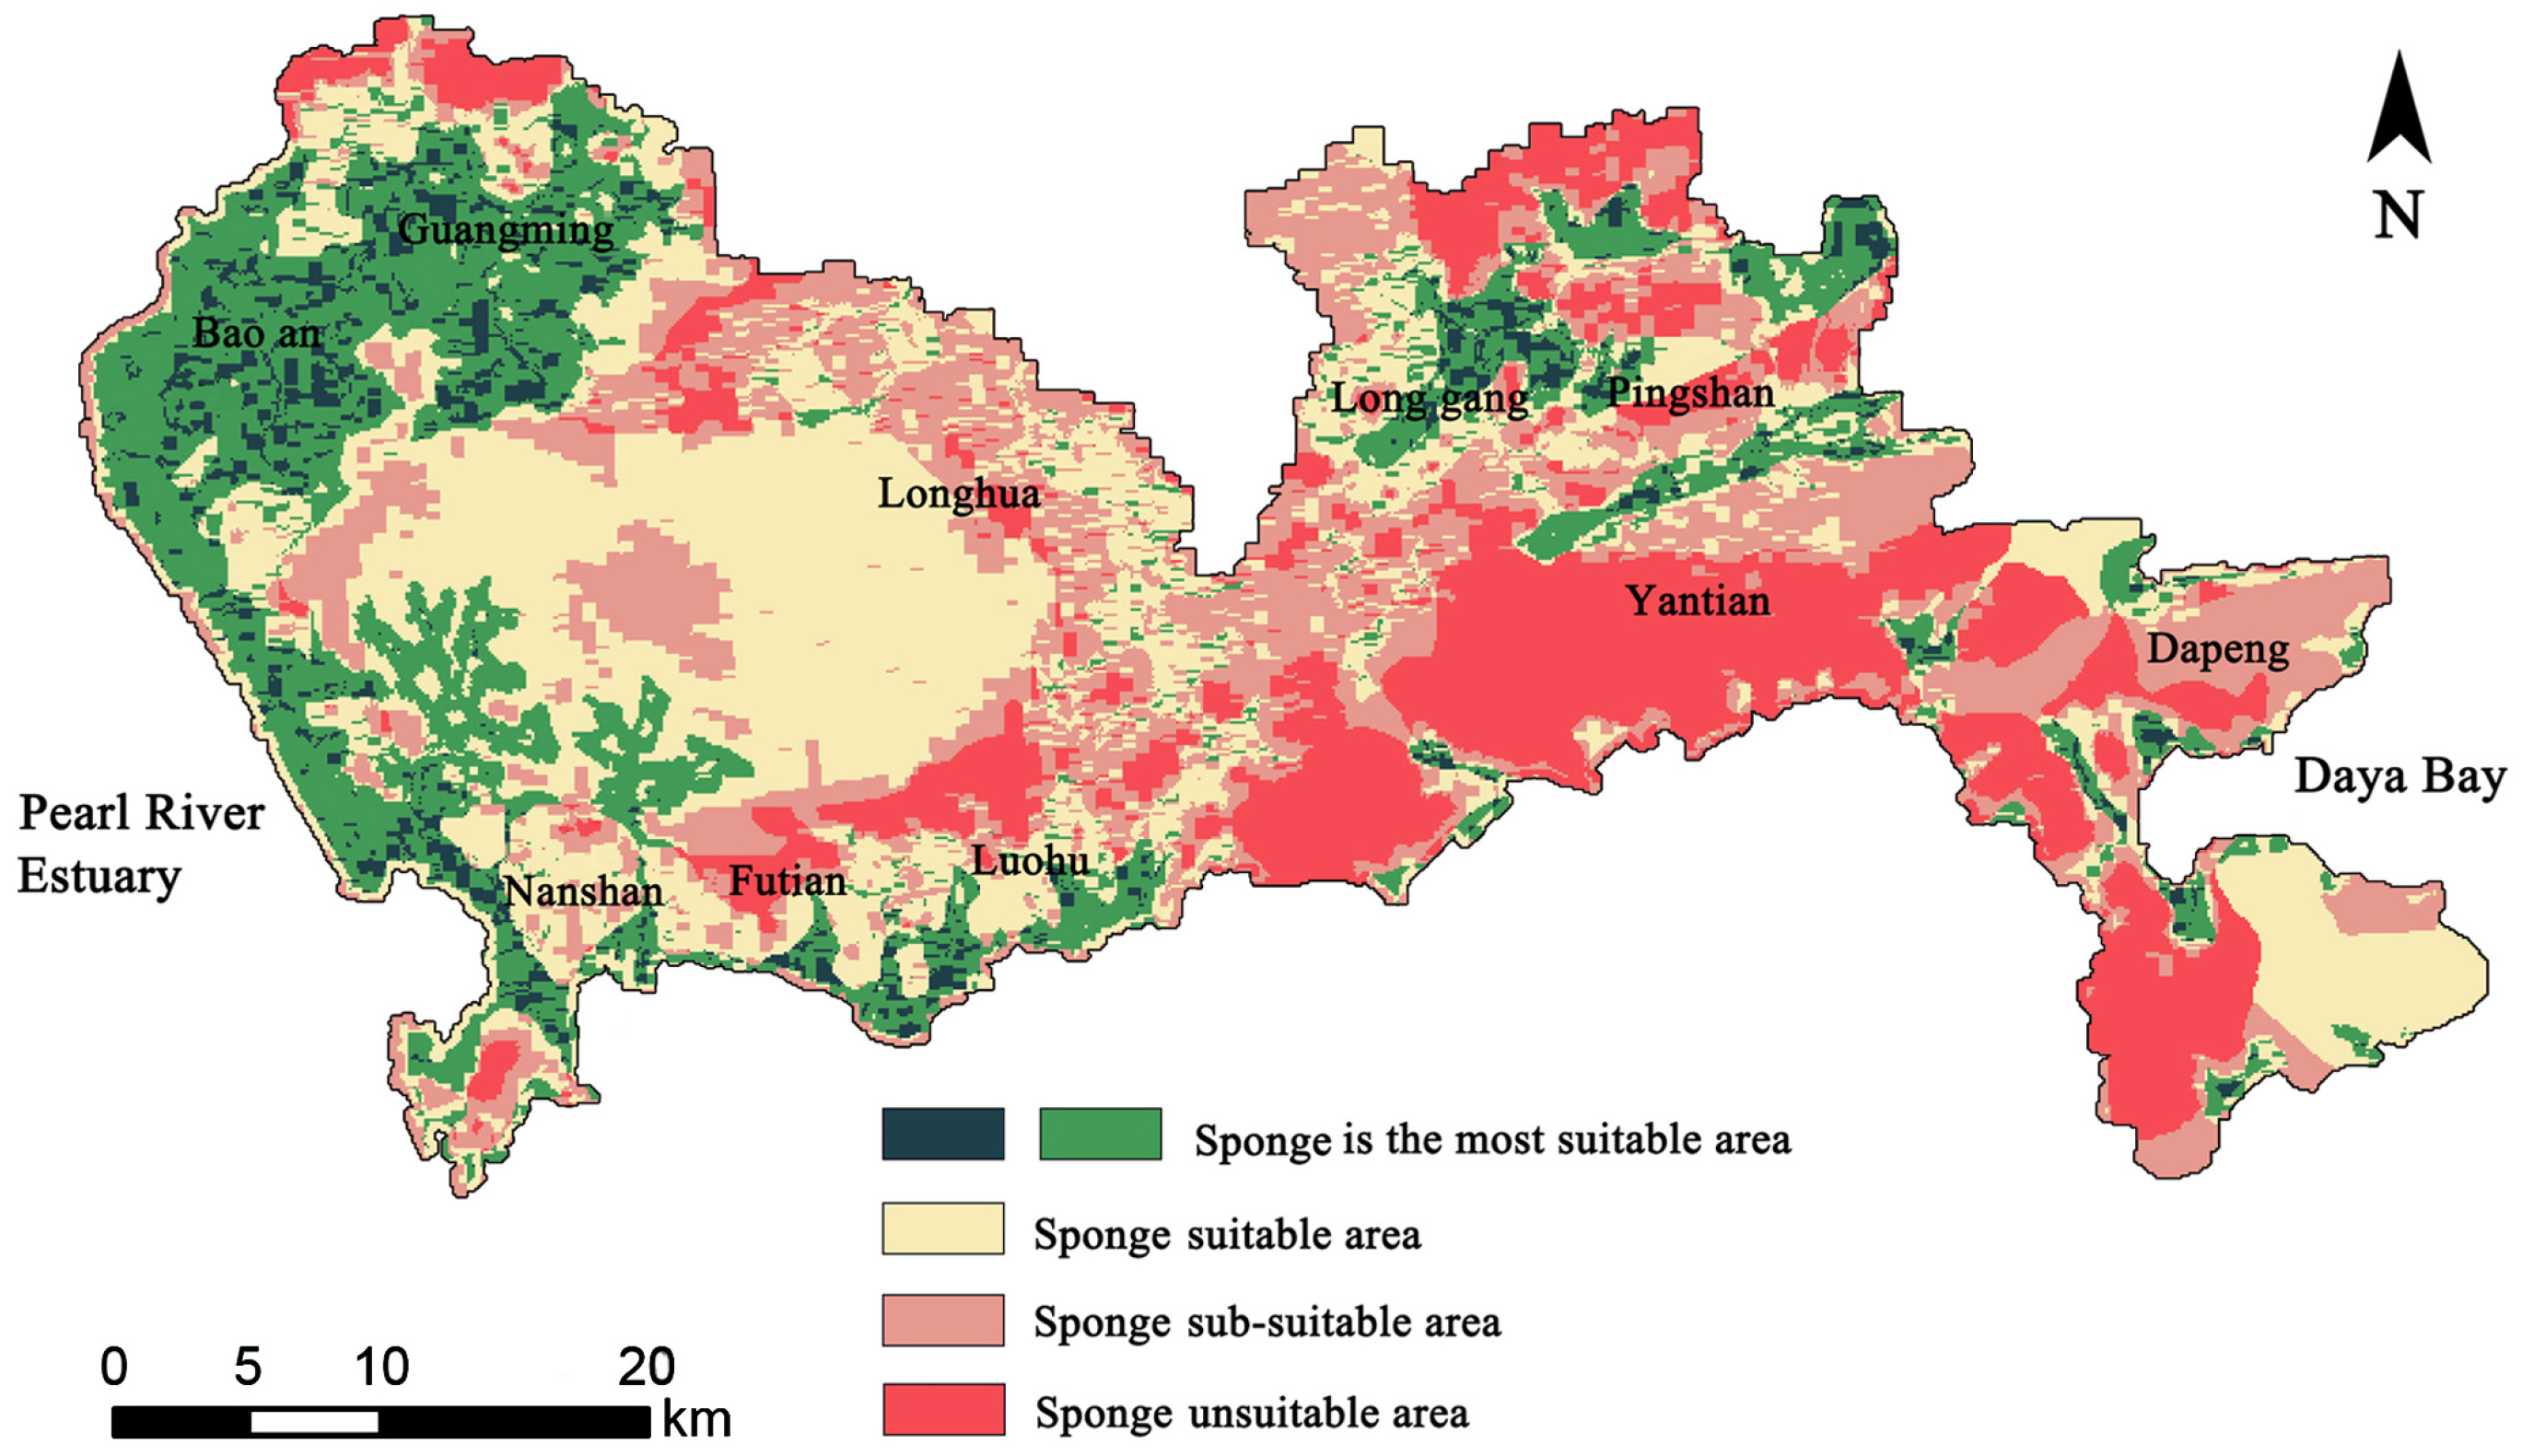
Based on the averaged results from the Monte Carlo simulation, which integrated the three evaluation factors (surface water inundation depth, stratigraphic lithology, and groundwater depth), the composite suitability scores were classified into four distinct levels. A higher score indicates greater suitability for sponge city construction. The spatial distribution of these four suitability classes across Shenzhen is shown in Figure 9. Key characteristics of each zone’s distribution include the following:
Figure 9.
Spatial distribution of sponge-suitable area.
- (1)
- Most Suitable Areas: These are primarily distributed in parts of Baoan District, Guangming District, and Pingshan District. These areas are suitable for water ecological protection, where surface water can infiltrate smoothly, rock strata exhibit good permeability, and there is sufficient groundwater storage space.
- (2)
- Suitable Areas: These are mainly found in Nanshan District, Luohu District, parts of the Dapeng Peninsula, narrow areas along the Pearl River Estuary, and the surroundings of Yantian Mountain. These areas serve as an ecological restoration buffer zone. These areas may experience some surface runoff and are characterized by slower infiltration rates due to lithology or limited groundwater storage capacity.
- (3)
- Sub-suitable Areas: These are distributed in parts of the Dapeng, Yantian, Longhua, and Longgang districts. These areas are characterized by a relatively poor ecological foundation, where the primary focus should be on ecological security protection. Geological conditions are unfavorable for infiltration, and groundwater storage is limited, with some locations prone to waterlogging.
- (4)
- Unsuitable Areas: These are concentrated in parts of Maluan Mountain, Wutong Mountain, and Dapeng. These areas are characterized by excessive surface water, extremely thin and impermeable aquifers in mountainous regions, or a water table at the surface, leaving no available groundwater storage space.
3.5.2. Uncertainty Analysis of Sponge Suitable Area
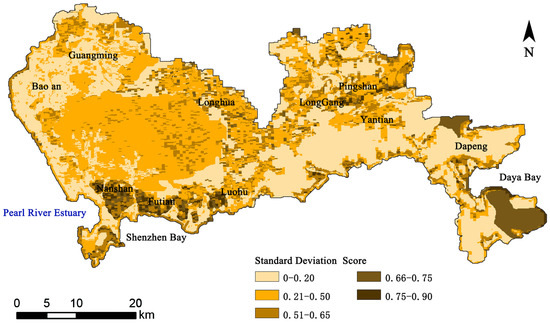
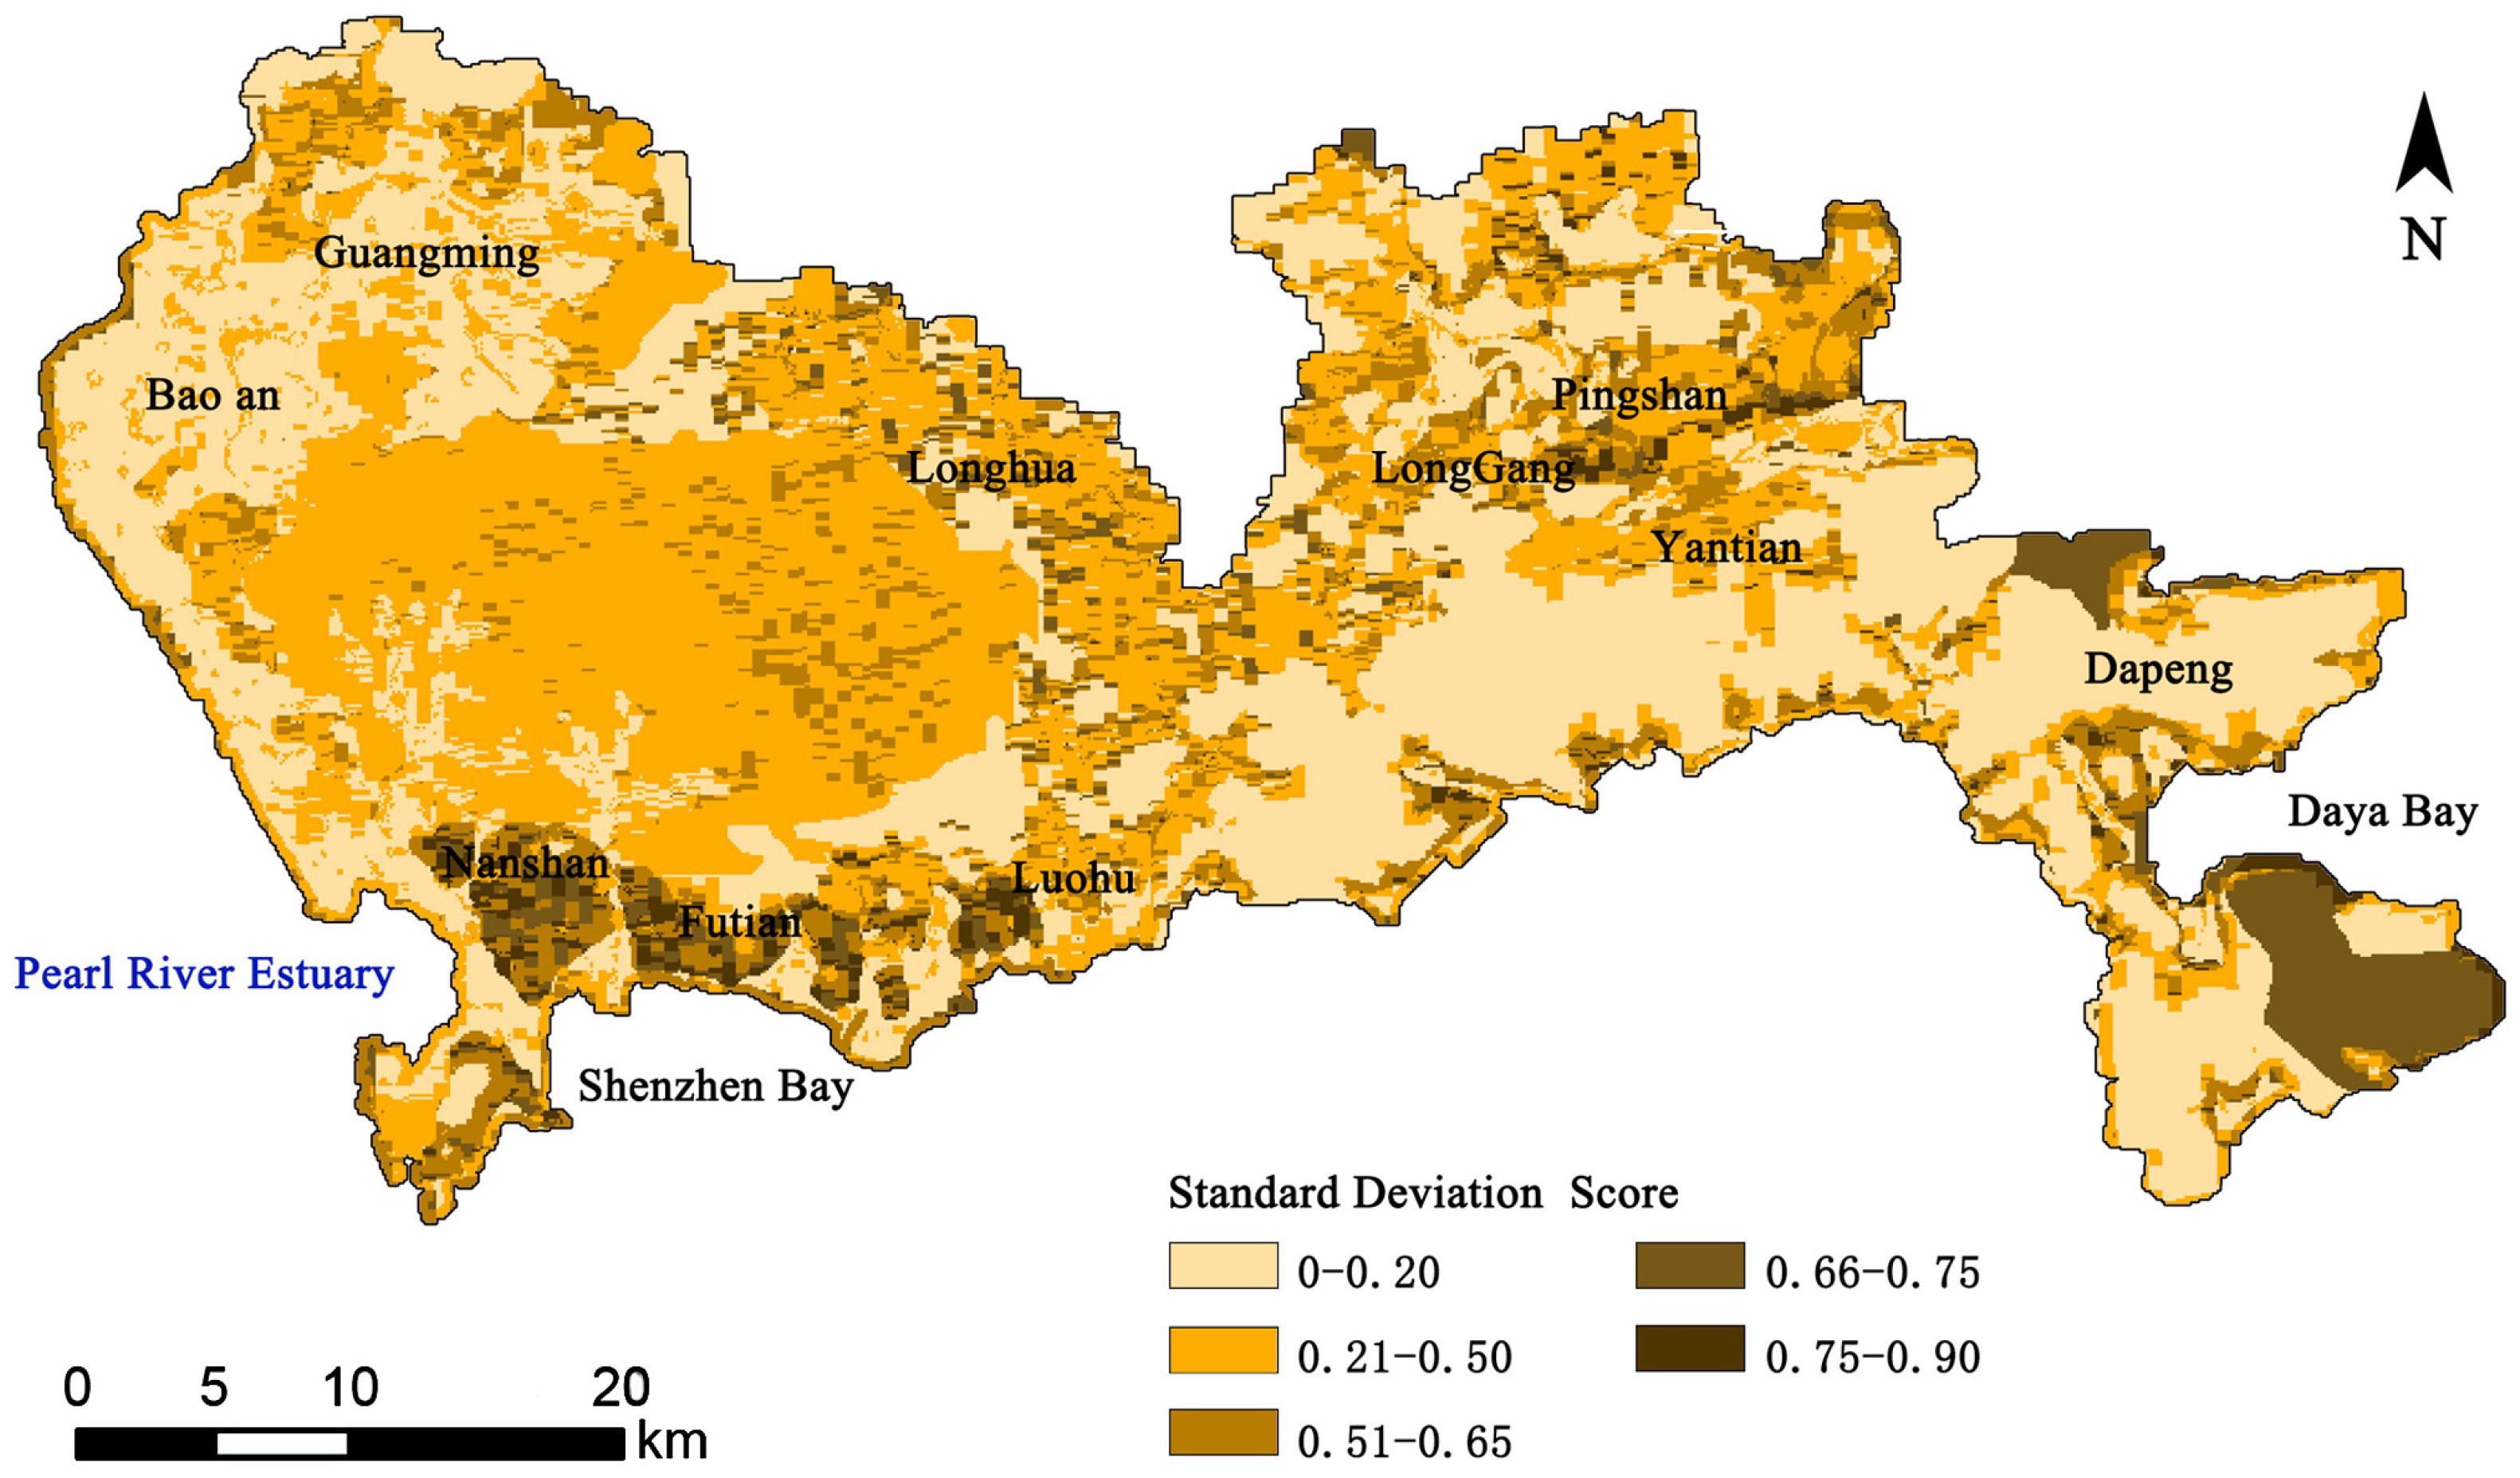
To assess the reliability of the suitability evaluation, an uncertainty analysis was conducted by calculating the standard deviation of the 10,000 composite suitability scores generated by the Monte Carlo simulation for each grid cell. The resulting spatial distribution of standard deviation is presented in Figure 10. A high standard deviation value (closer to 1) indicates significant variability in the output scores, meaning the result is highly sensitive to the weighting of the input factors. This translates to greater uncertainty and a higher risk associated with sponge construction planning in that location. Conversely, a low standard deviation (closer to 0) signifies result stability and lower risk, as the final suitability score remains consistent across a wide range of potential weight combinations.
Figure 10.
Spatial distribution of standard deviation in the sponge suitable area.
As shown in Figure 10, the standard deviation is low across most of the study area. This indicates that the three evaluation factors often received similar grades within the same grid cell, leading to stable composite scores and low associated risk for sponge construction. Areas of higher uncertainty and risk are primarily attributed to significant discrepancies between the factor ratings. For instance, parts of Nanshan, Futian, and Luohu exhibit higher uncertainty because the geological condition (highly dense granite with a low infiltration score of 0) conflicts with potentially more favorable ratings from the surface water inundation depth and groundwater depth factors. The elevated standard deviation calculated for the Daya Bay region arises from a key conflict: despite highly permeable volcanic deposits, the prevailing mountainous terrain offers minimal surface water storage and poses construction challenges for sponge facilities; this confers a significant risk profile to the area.
4. Discussion
4.1. Optimization Strategy for Sponge System’s Spatial Structure
Based on the spatial distribution of sponge-suitable area (Figure 9) and integrated with Shenzhen’s existing landscape planning and urban master plan, an optimized spatial structure for the sponge system was developed. This structure is founded on the landscape ecology theory of “matrix-corridor-patch” and aims to formulate targeted stormwater management objectives and planning approaches for different districts [28].
The construction of this spatial structure synthesizes the sponge suitability assessment results with Shenzhen’s established ecological spatial pattern, often described as the “Four Belts and Eight Corridors” in its territorial spatial master plan. The strategy is implemented through a two-step coupling analysis.
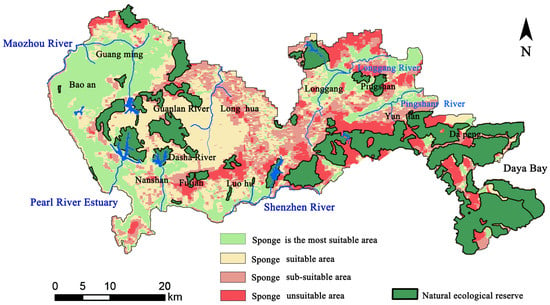
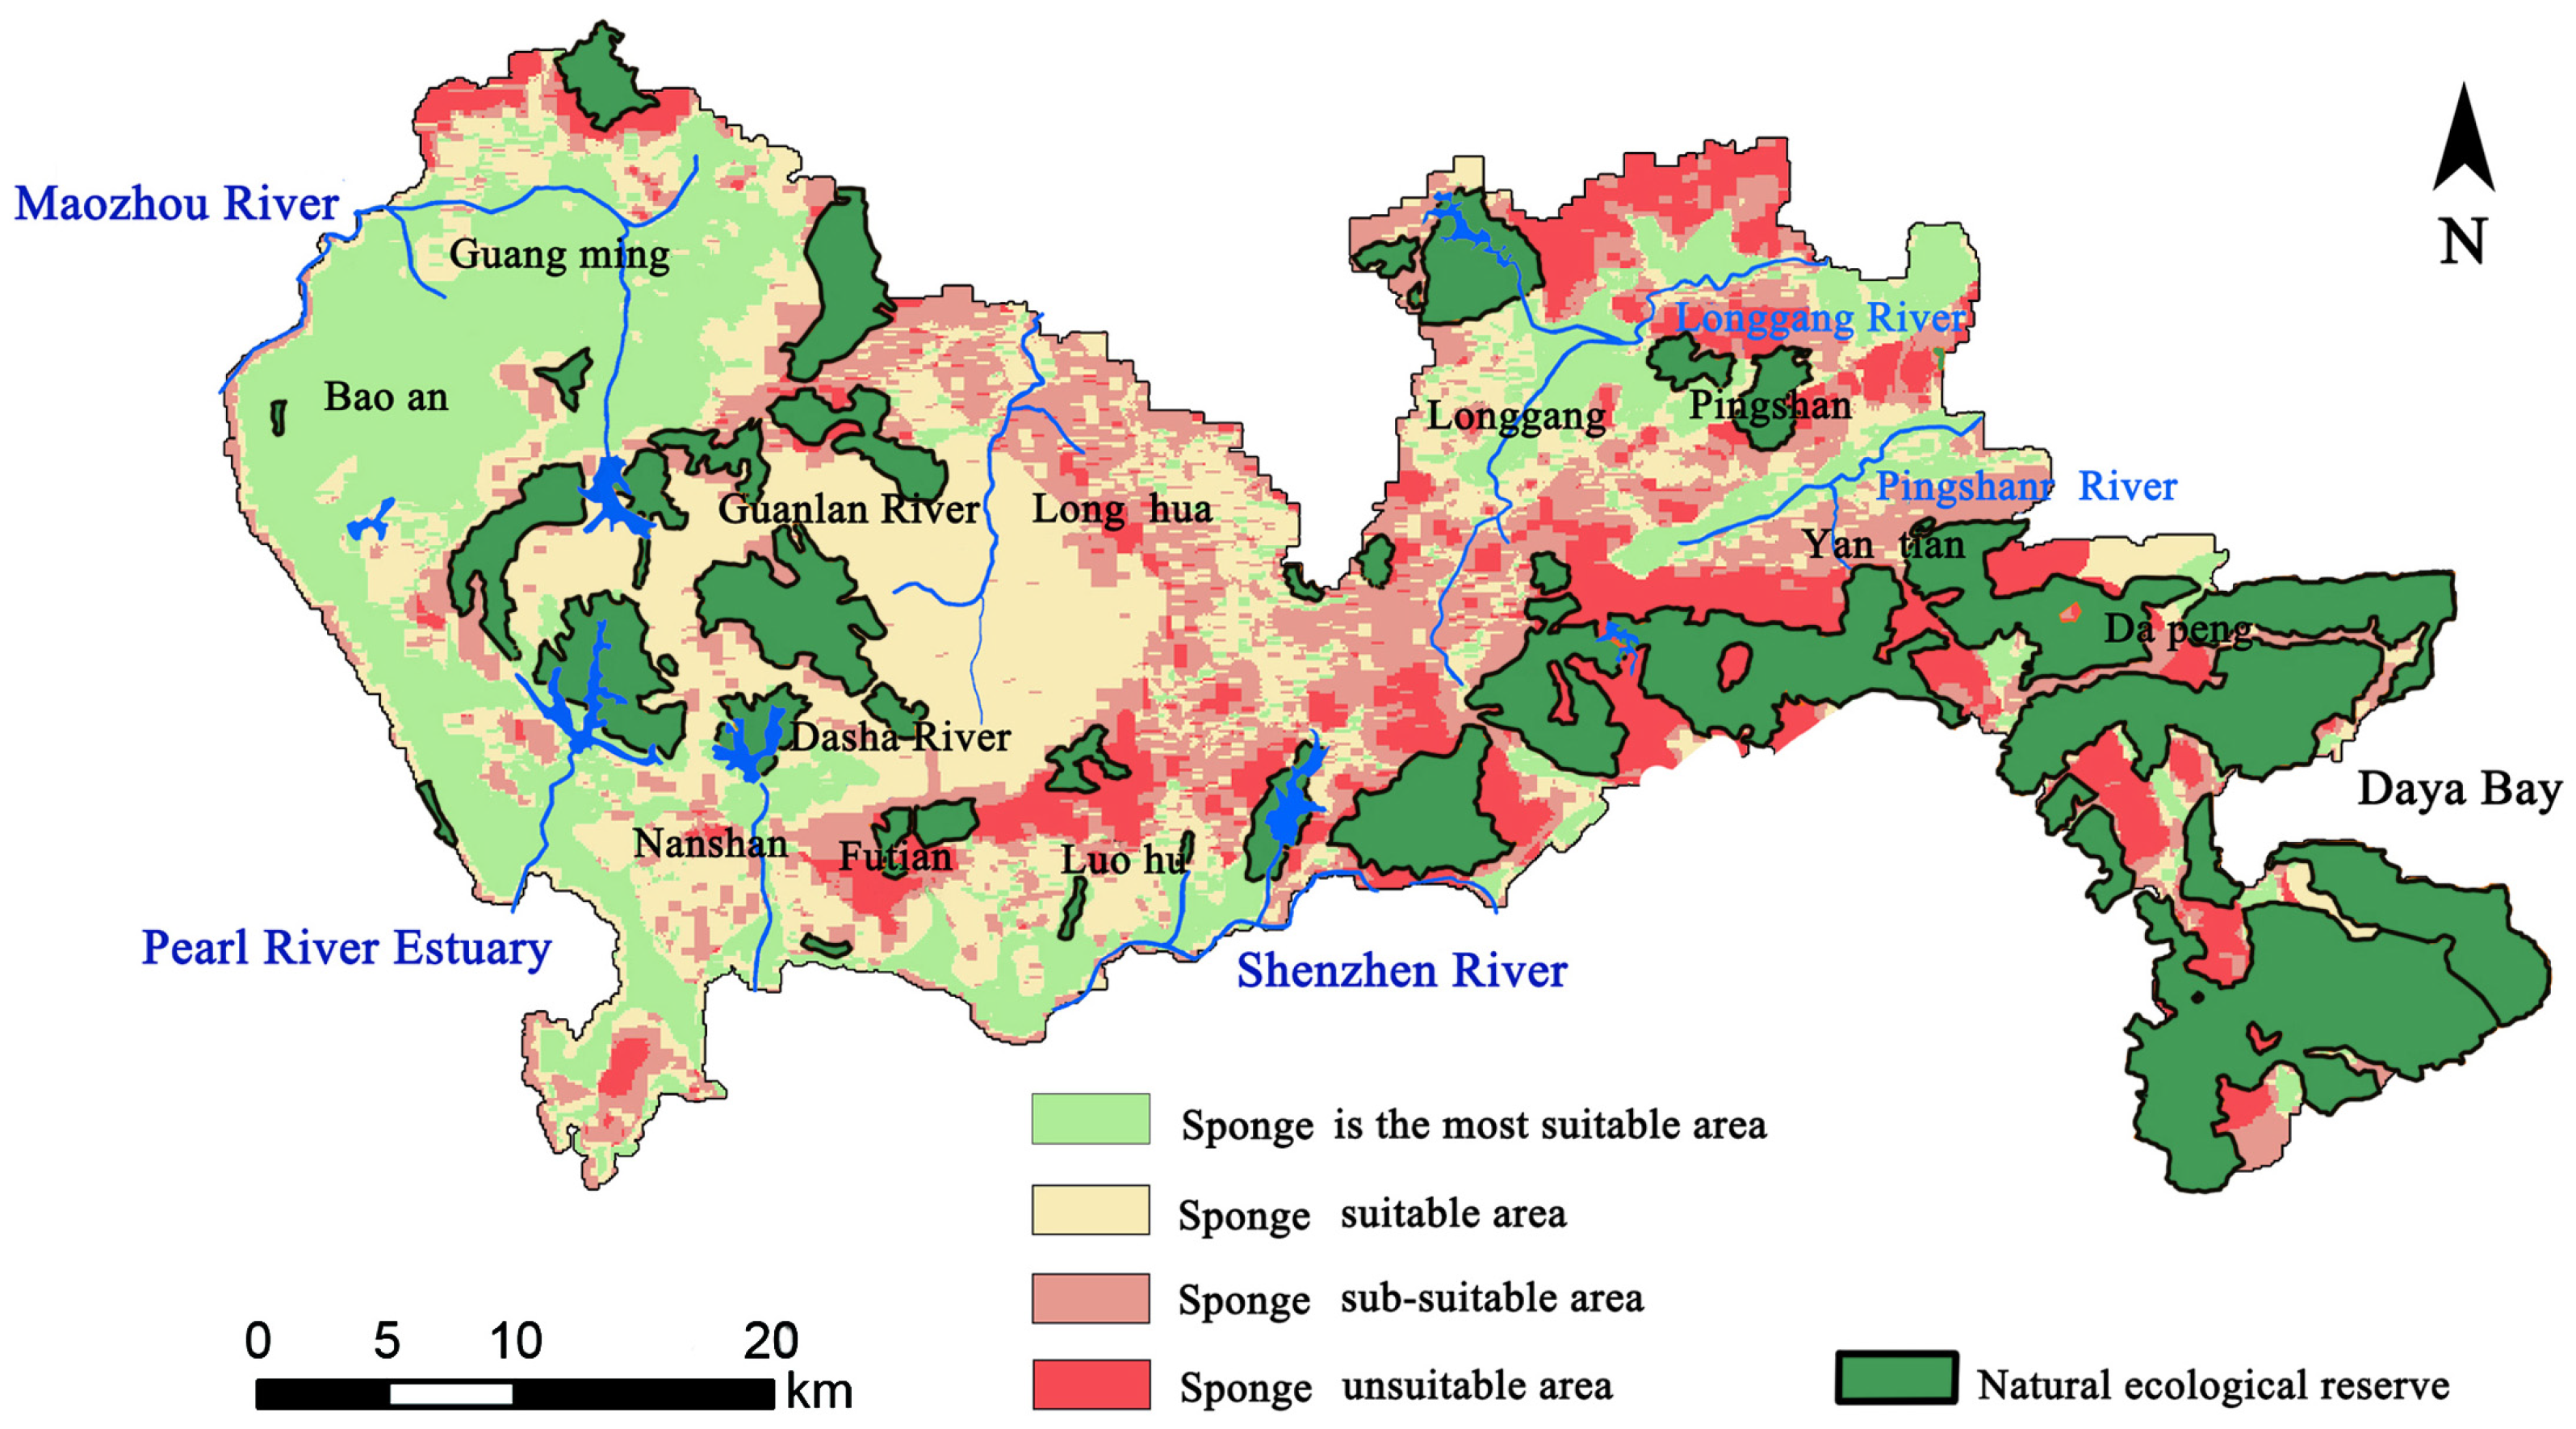
The first step is to conduct a superimposed analysis of the distribution of sponge-suitable areas with the natural ecological reserves in Shenzhen (2021–2035), as shown in Figure 11. The dark green areas are natural ecological conservation zones. It includes forest parks and other protected areas. Maintaining the ecological security of the region is of vital importance. The stability of these natural areas is the foundation for ensuring the overall environmental security. Urban development and construction are prohibited within the natural ecological reserve (whose scope highly overlaps with the “most suitable zone” and the “suitable Zone”) [29,30].
Figure 11.
The distribution of sponge-suitable area and the coupling of natural ecological reserve.
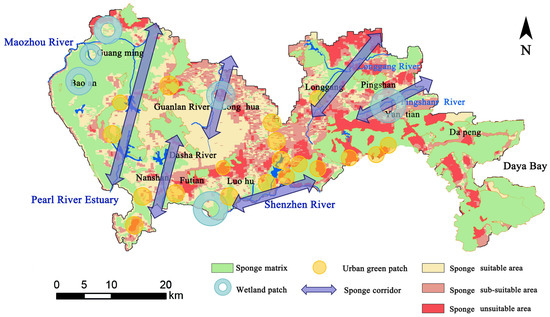
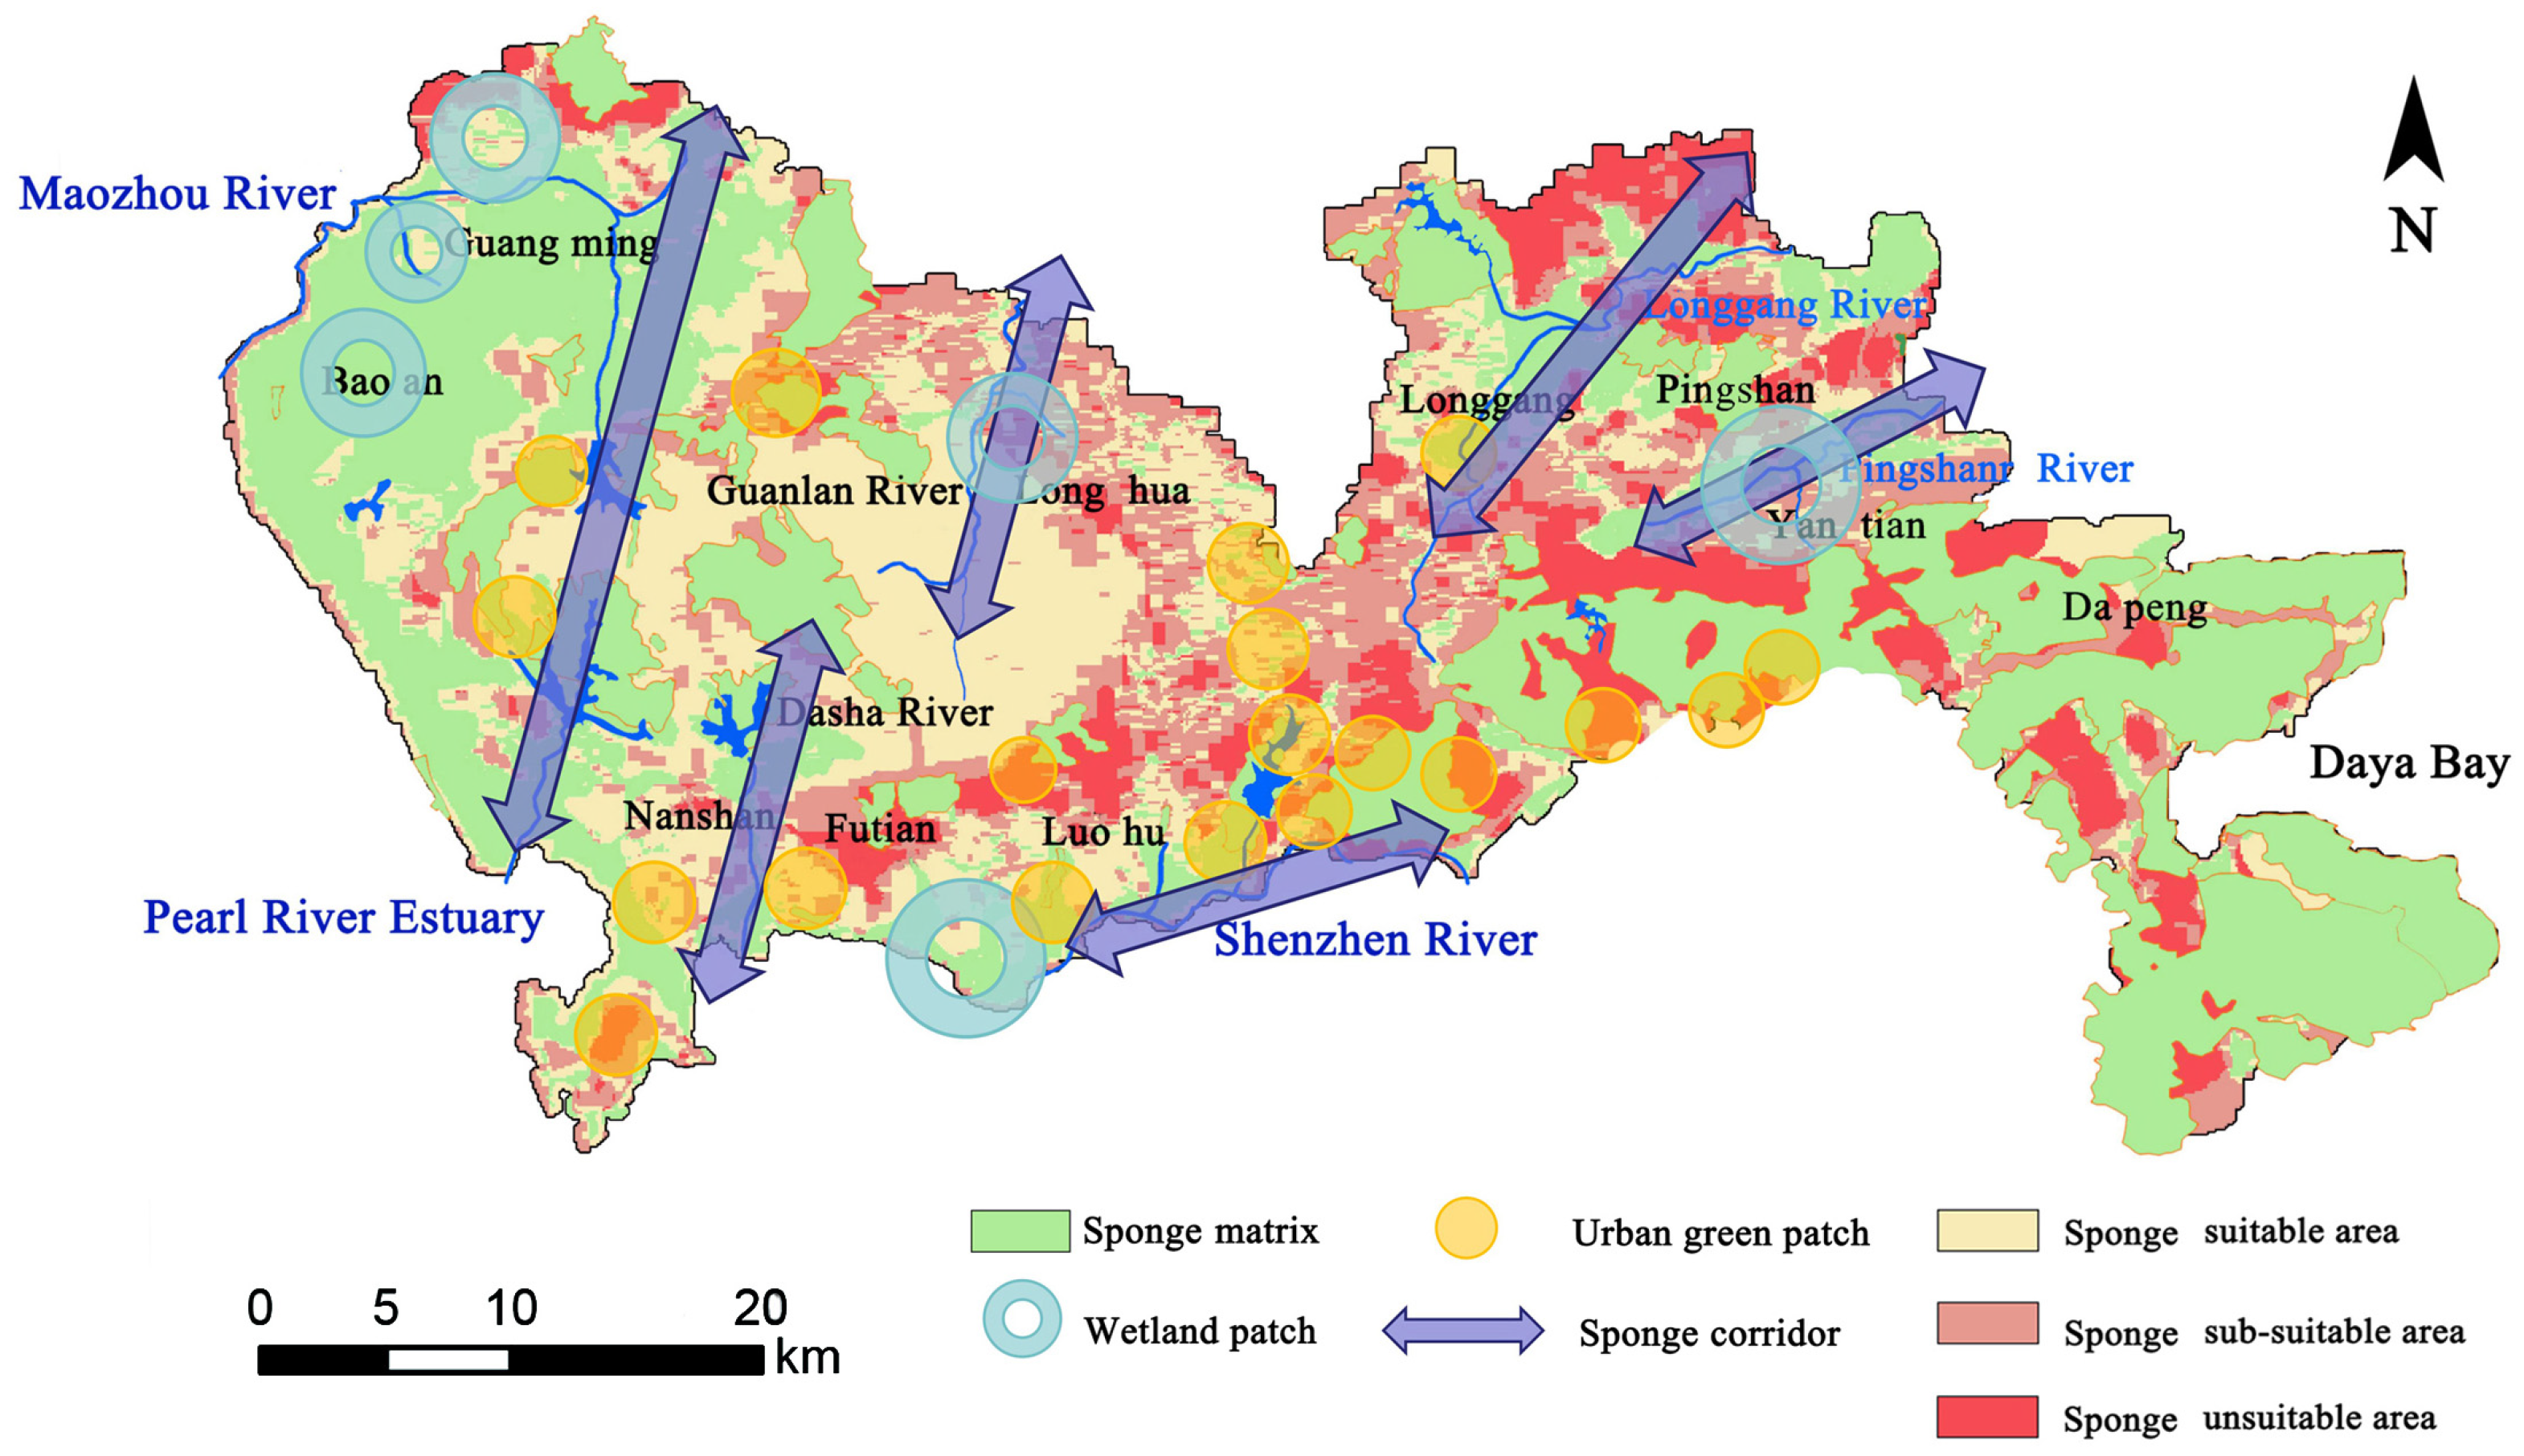
The second step utilizes the “matrix-corridor-patch” landscape analysis method to build a comprehensive spatial network for the sponge system, as shown in Figure 12. This structure is designed to systematically connect different sponge functional areas. The components of this structure are defined as follows:
Figure 12.
Spatial structure of sponge system.
- (1)
- Sponge matrices: This forms the large, continuous background system of the sponge structure. It primarily consists of the natural ecological reserve areas, mainly distributed in Dapeng District, Pingshan District, Yantian Mountain, and Wutong Mountain. These natural environments serve as the core water source conservation and infiltration zones.
- (2)
- Sponge corridors: These are linear elements that connect the matrix and patches, facilitating the movement and management of stormwater. The main sponge corridors in Shenzhen are based on its major river systems, including the Guanlan River, Dashahe River, Maozhou River–Xixiang River, Pingshan River, Longgang River, and Shenzhen River corridors. These corridors, integrated with their riparian green spaces, function as crucial safety spaces for storm-flood management, enabling water conveyance, retention, and drainage.
- (3)
- Sponge patches: These are smaller, discrete areas that supplement the sponge functions within the urban fabric. They are categorized into two types: wetland patches and urban green patches. Wetland patches are primarily located in areas like the Maozhou River, Shenzhen Bay, Guanlan River, and Pingshan River; these patches are vital for groundwater resource conservation and protection. Activities like mining are prohibited, and their function should be maintained through regular monitoring. Urban green patches are urban green spaces and parks, predominantly found in Futian, Nanshan, and other central districts. They play a key role in localized stormwater retention and help regulate the urban microclimate.
This interconnected network creates a resilient and systematic framework for stormwater management. For areas outside this core structure, protection, reconstruction, and planning measures should be guided by their specific classification in the sponge suitability distribution map (Figure 9).
4.2. Optimization Strategy for Sponge System’s Functional Area
During the special planning phase of a sponge city, differentiated stormwater control objectives and management strategies must be implemented according to the characteristics of each functional area. This targeted approach maximizes the effectiveness of sponge city planning and ensures scientific and rational stormwater management. The specific traits, primary objectives, and recommended management strategies for each sponge suitability area are detailed in Table 7.
Table 7.
Optimal management strategy of sponge system function area.
4.3. Addressing Uncertainty in Planning Strategies
The spatial distribution of the standard deviation shown in Figure 10 provides a basis for identifying areas of uncertainty in the sponge city suitability assessment. In areas such as Nanshan, Futian, and Luohu, the assessment results vary significantly due to the mismatch between geological conditions, characterized by high-density granite, and surface water conditions (standard deviation > 0.65). In planning, these areas should be considered high-risk or highly sensitive zones. It is recommended to adopt the following adaptive strategies:
- (1)
- Priority should be given to detailed geological exploration and the dynamic monitoring of groundwater levels.
- (2)
- A modular and adjustable LID facility combination should be implemented to optimize operating parameters using real-time hydrological data.
- (3)
- Elastic buffer zones should be reserved in the spatial layout to deal with the possible uncertain impacts brought by extreme rainfall events.
In contrast, regions with lower standard deviations (such as the Bao’an and Plain) have higher system stability. It can give priority to the layout of large-scale and long-term rainwater infiltration and storage facilities.
5. Conclusions
This study presents a comprehensive framework for urban-scale sponge system evaluation by integrating hydrodynamic modeling (FVCOM) with advanced spatial analysis (GIS) and probabilistic methods (Monte Carlo simulation). The research adopted a multi-factor comprehensive evaluation approach from the perspective of rainwater infiltration, establishing a graded assessment system for key ecological factors.
This framework effectively integrates high spatiotemporal resolution simulation of surface water dynamics (via FVCOM) with spatial analysis of subsurface conditions (lithology and groundwater depth via GIS), while incorporating the Monte Carlo simulation for computational modeling. It provides a robust foundation for quantitatively assessing the suitability of sponge systems and clearly quantifies associated uncertainties.
The application in Shenzhen revealed a nuanced spatial distribution of suitability. A significant portion of the city was classified as “Suitable” (31.89%) and “Sub-suitable” (30.26%), with substantial areas identified as “Most Suitable” (23.09%) for sponge functions, primarily in the Baoan, Guangming, and Pingshan districts. This detailed zoning provides a critical evidence base for spatial planning.
By coupling the suitability results with Shenzhen’s natural ecological reserve, an optimized “matrix-corridor-patch” spatial structure for the sponge system was developed. This was complemented by tailored management strategies for each functional area, moving from conservation and infiltration in high-suitability areas to safety and drainage in unsuitable zones, thereby translating theoretical assessment into actionable planning guidance.
The study demonstrates that the proposed framework offers a directly applicable decision-support tool for sponge city planning. It enhances urban climate resilience by promoting the synergistic management of surface and groundwater resources. Future work will focus on three key areas: first, developing a dynamic performance assessment module for the entire lifecycle of sponge facilities to enable closed-loop management from planning and design to operation and maintenance; second, establishing a cross-regional comparability index system that integrates regional characteristics with system functions, thereby promoting more standardized and scientific sponge city construction; and third, investigating the multi-dimensional coupling mechanisms between sponge systems and socio-economic factors. By applying and evolving this theoretical framework, we will validate and extend its application across diverse practical scenarios.
Author Contributions
Conceptualization, M.J. and Y.T.; methodology, M.J. and J.Y.; software, Q.Z.; validation, Q.Z., J.Y. and M.J.; formal analysis, M.J.; investigation, M.J.; resources, Y.S. and Y.Z.; data curation, Q.Z.; writing—original draft preparation, M.J.; writing—review and editing, Q.Z. and Y.T.; visualization, J.Y.; supervision, Y.S.; project administration, M.J.; funding acquisition, M.J. All authors have read and agreed to the published version of the manuscript.
Funding
This work was supported by the Shenzhen Science and Technology Program (Grant Number JCYJ20250604135903005).
Data Availability Statement
The original contributions presented in this study are included in the article. Further inquiries can be directed to the corresponding authors.
Conflicts of Interest
The authors declare no conflicts of interest.
References
- Deng, J.; Zhang, R.; Chen, S.; Li, Z.; Gao, L.; Li, Y.; Wei, C. Spatiotemporal evolution and influencing factors of flood resilience in Beibu Gulf Urban Agglomeration. Int. J. Disaster Risk Reduct. 2024, 103, 104025. [Google Scholar] [CrossRef] [Scilit]
- Wang, L.; Cui, S.; Li, Y.; Huang, H.; Manandhar, B.; Nitivattananon, V.; Fang, X.; Huang, W. A review of the flood management: From flood control to flood resilience. Heliyon 2022, 8, e11763. [Google Scholar] [CrossRef] [Scilit]
- Wang, N.; Sun, F.; Koutsoyiannis, D.; Iliopoulou, T.; Wang, T.; Wang, H.; Liu, W.; Sargentis, G.-F.; Dimitriadis, P. How can Changes in the Human-Flood Distance Mitigate Flood Fatalities and Displacements? Geophys. Res. Lett. 2023, 50, e2023GL105064. [Google Scholar] [CrossRef] [Scilit]
- Dunlop, T.; Khojasteh, D.; Cohen-Shacham, E.; Glamore, W.; Haghani, M.; Bosch, M.v.D.; Rizzi, D.; Greve, P.; Felder, S. The evolution and future of research on Nature-based Solutions to address societal challenges. Commun. Earth Environ. 2024, 5, 132. [Google Scholar] [CrossRef] [Scilit]
- Zhai, J.; Ren, J.; Xi, M. Multiscale watershed landscape infrastructure: Integrated system design for sponge city development. Urban For. Urban Green. 2021, 60, 127060. [Google Scholar] [CrossRef] [Scilit]
- Jiao, S.; Han, J.Y.; Zhou, M.; Cai, Y.; Han, Z.W.; Li, B. Study on urban low-impact development model based on stormwater safety pattern. Geogr. Res. 2018, 37, 1704–1713. [Google Scholar]
- Guo, R.; Wu, T.; Huang, M.S. Study on construction and planning measures of rain flood safety pattern in Harbin. In China Urban Planning Society, Guiyang City People’s Government New Normal: Inheritance and Change, Proceedings of the 2015 China Urban Planning Annual Conference (01 Urban Safety and Disaster Prevention Planning), Guiyang, China, 19–21 September 2015; China Society of Urban Planning: Beijing, China, 2014; pp. 203–204. [Google Scholar]
- Ding, S.Y.; Zeng, S.P.; Tian, J. Simulation and design strategy of flood safety pattern in Xiamen based on waterlogging disaster prevention and control. Urban Archit. 2017, 11, 118–122. [Google Scholar]
- Zhang, Q.P.; Li, X.C.; Chen, Y.F. Study on the security pattern of urban storm-flood landscape under the background of sponge city. Mod. Urban Res. 2016, 7, 6–11. [Google Scholar]
- Chaitanya, J.C.; Sridharan, B.; Kuiry, S.N. The Rain-on-Grid Modeling Approach in Hydrological and Hydraulic Processes over a River Basin. In Proceedings of the World Environmental and Water Resources Congress 2024, Milwaukee, WI, USA, 19–22 May 2024. [Google Scholar]
- Dai, B.W.; Zeng, L.T.; Han, X.L. The lowest cost route selection of scenic tour routes based on ecological security pattern: A case study of Fubucket Scenic Spot in Pingjiang County, Hunan Province. Mod. Urban Res. 2015, 1, 97–103. [Google Scholar]
- Jiang, H.Y.; Deng, S.H. The practical exploration of multi-factor comprehensive evaluation method in sponge city special planning. Planners 2019, 21, 77–84. [Google Scholar]
- Wei, B.; Li, Y.K.; Qi, Y.H. Flood risk assessment based on hydrodynamic and fuzzy integrated model. Water Resour. Hydropower 2022, 9, 45–56. [Google Scholar]
- Li, J.H.; Zhang, X.C.; Ren, B.B. A study on regional storm-flood safety pattern under the concept of resilient urban and rural areas: A case study of Fangshan District in Beijing. J. Hebei Univ. Technol. (Soc. Sci. Ed.) 2021, 2, 79–85. [Google Scholar]
- Ren, Z.B.; Fu, X.L.; Li, N.S. Risk analysis of urban waterlogging prevention: A case study of Wuhan Optics Valley Central City. Civ. Eng. 2019, 8, 233–243. [Google Scholar]
- Bailey, R.T.; Abbas, S.; Arnold, J.G.; White, M.J. SWAT + MODFLOW: A new hydrologic model for simulating surface-subsurface flow in managed watersheds. Geosci. Model Dev. 2025, 18, 5681–5697. [Google Scholar] [CrossRef] [Scilit]
- Jing, L.; Chen, B.; Zhang, B.; Li, P.; Zheng, J. Monte Carlo simulation–aided analytic hierarchy process approach: Case study of assessing preferred non-point-source pollution control best management practices. J. Environ. Eng. 2013, 139, 618–626. [Google Scholar] [CrossRef] [Scilit]
- Lancia, M.; Zheng, C.; Yi, S.; Lerner, D.N.; Andrews, C. Analysis of groundwater resources in densely populated urban watersheds with a complex tectonic setting: Shenzhen, southern China. Hydrogeol. J. 2018, 27, 183–194. [Google Scholar] [CrossRef] [Scilit]
- Shenzhen Meteorological Bureau. Shenzhen Meteorological Bureau Official Website. Available online: http://weather.sz.gov.cn/ (accessed on 9 October 2021).
- Yang, Z.; Yi, S.; Wang, X. Hydrogeological map of Shenzhen, Scale 1:50,000; Shenzhen Geological Construction Engineering Company: Shenzhen, China, 2007. [Google Scholar]
- Zhang, Z.K.; Ling, M.X.; Lin, W.; Sun, M.; Sun, W. “Yanshanian movement” induced by the westward subduction of the paleo-pacific plate. Solid Earth Sci. 2020, 5, 103–114. [Google Scholar] [CrossRef] [Scilit]
- Lancia, M.; Zheng, C.; He, X.; Lerner, D.N.; Andrews, C.; Tian, Y. Hydrogeological constraints and opportunities for “Sponge City”development: Shenzhen, Southern China. J. Hydrol. Reg. Stud. 2020, 28, 100679. [Google Scholar] [CrossRef] [Scilit]
- Pizarro, A.; Acuña, P.; Dimitriadis, P.; Iliopoulou, T.; Koutsoyiannis, D. Past, present, and future of the Hurst-Kolmogorov dynamics in Stochastics: A bibliometric analysis of the last 50 years in water resources. J. Hydrol. 2024, 643, 132008. [Google Scholar] [CrossRef] [Scilit]
- Ouyang, Z.Z.; Fan, S.P.; Sun, J. Ecological sensitivity analysis of sponge city planning. Yellow River 2020, 6, 33–35. [Google Scholar]
- Lancia, M.; Su, H.; Tian, Y.; Xu, J.; Andrews, C.; Lerner, D.N.; Zheng, C. Hydrogeology of the pearl river delta, southern China. J. Maps 2020, 16, 388–395. [Google Scholar] [CrossRef] [Scilit]
- Jin, M.; Lancia, M.; Tian, Y.; Viaroli, S.; Andrews, C.; Liu, J.; Zheng, C. The Role of Aquifers in Sustaining the Sponge City Concept in Chinese High-Density Housing. Water 2022, 14, 929. [Google Scholar] [CrossRef] [Scilit]
- Wu, J.S.; Zhang, P.H. The impact of urban landscape pattern on urban waterlogging: A case study of Shenzhen. Acta Geogr. Sin. 2017, 72, 444–456. [Google Scholar]
- Gao, H.; Sabo, J.L.; Chen, X.; Liu, Z.; Yang, Z.; Ren, Z.; Liu, M. Landscape heterogeneity and hydrological process: A review of landscape-based hydrological models. Landsc. Ecol. 2018, 33, 1460–1480. [Google Scholar] [CrossRef] [Scilit]
- O’DOnnell, E.; Thorne, C.; Ahilan, S.; Arthur, S.; Birkinshaw, S.; Butler, D.; Dawson, D.; Everett, G.; Fenner, R.; Glenis, V.; et al. The blue-green path to urban flood resilience. Blue-Green Syst. 2019, 2, 28–45. [Google Scholar] [CrossRef] [Scilit]
- Klemeš, V. Operational testing of hydrological simulation models Vérification, en conditions réelles, des modèles de simulation hydrologique. Hydrol. Sci. J. 1986, 31, 13–24. [Google Scholar] [CrossRef] [Scilit]

Disclaimer/Publisher’s Note: The statements, opinions and data contained in all publications are solely those of the individual author(s) and contributor(s) and not of MDPI and/or the editor(s). MDPI and/or the editor(s) disclaim responsibility for any injury to people or property resulting from any ideas, methods, instructions or products referred to in the content. |
© 2026 by the authors. Licensee MDPI, Basel, Switzerland. This article is an open access article distributed under the terms and conditions of the Creative Commons Attribution (CC BY) license.