


Abstract
This analysis examines long-term changes in water levels of the Mead and Glen Canyon reservoirs on the Colorado River. Both reservoirs display clear declining trends in water levels, particularly after 2003. The causes include a combination of climate change, megadrought, increased water consumption, and alterations in the hydrological regime. Lake Mead exhibits a stronger and more concerning decline than Lake Powell, including extreme drought conditions over the past three years. The Rescaled Adjusted Partial Sums (RAPS) analysis identifies three statistically distinct subperiods, with an unambiguous decline in the most recent period. The day-to-day (DTD) method indicates reduced day-to-day water level variability in Lake Mead following the commissioning of the Powell reservoir, confirming its regulating influence. The Standardized Hydrological Index (SHI) indicates an accelerating intensification of drought conditions over the past 20 years. Regression analysis confirms a strong relationship between the water levels of the two reservoirs, along with significantly increased water losses in the more recent period. The literature suggests that climate projections are highly unfavorable, with further reductions in Colorado River discharge expected. The study underscores the urgent need to adapt water-management policies and align consumption with the new hydrological realities.
1. Introduction
The Colorado River is one of the most important water resources in the western United States and northern Mexico. Without its waters, intensive agriculture, hydropower production, and overall regional development would not be possible.
The river originates in Rocky Mountain National Park in Colorado and flows southwest through seven U.S. states (Colorado, Wyoming, Utah, New Mexico, Arizona, Nevada, and California) and parts of two Mexican states (Baja California Norte and Sonora), before emptying into the Gulf of California. Estimates of the basin area range from 637,000 to 639,000 km2, while the river length is generally cited as between 2250 and 2330 km [1]. The variation reflects differing definitions of the source and mouth, as well as historical channel changes. It is the fifth-longest river in the United States. The name Colorado comes from Spanish, meaning “reddish,” referring to the high concentration of suspended sediment historically carried by the river.
The Colorado River Basin is one of the most complex hydrological systems in North America. Morphologically, it is a highly diverse region, characterized by steep plateaus, high mountain ranges, and deep canyons, the most famous being the Grand Canyon, formed through long-term erosion of Paleozoic and Mesozoic rock layers.
The basin is dominated by arid and semi-arid climatic conditions, with extremely low annual precipitation in the lower reaches, where the river flows along the margins of several deserts. The largest of these is the Mojave Desert, located in southeastern California, southern Nevada, and parts of Arizona.
The hydrology of the Colorado River is primarily governed by a snowmelt-dominated regime. Snowmelt in late spring and early summer represents the principal source of annual runoff, supplied mainly by tributaries originating in the Rocky Mountains. Mountainous areas in Colorado, Wyoming, and Utah serve as the main snow-accumulation zones that determine the seasonal flow regime. The river’s hydrological regime is highly variable and dependent on the amount of winter snowfall in the Rocky Mountains, which provides most of the spring and early-summer discharge. The upper reaches of the river are defined by steep gradients, swift flow, and deeply incised canyons, whereas the lower course transitions into drier, predominantly semi-arid to arid environments.
To meet increasing water demands across the Colorado River Basin, the U.S. Congress authorized the U.S. Bureau of Reclamation (USBR) to construct a network of dams, reservoirs, and canals for storage and water transfer within and beyond the basin. In total, 15 dams have been built along the river [2,3]. The largest dam in the United States, the Hoover Dam in Arizona, was completed in 1935, forming Lake Mead. The second largest reservoir, Lake Powell, was created by the construction of Glen Canyon Dam, completed in 1963. The Colorado River Basin area upstream of Glen Canyon Dam is estimated to be 280,600 km2 [4,5], while the basin area upstream of Hoover Dam is 434,600 km2 [4,5]. At a water level of 375 m above sea level (m a.s.l.), the Mead Reservoir has a surface area of 639 km2 and contains approximately 34 km3 of water. At an elevation of 1128 m a.s.l., the Powell Reservoir holds about 30 km3 of water, with a surface area of 689 km2.
Collectively, all 15 dams, and particularly Hoover and Glen Canyon and their reservoirs, have fundamentally altered the river’s natural hydrological regime by reducing peak flows, dampening variability, and enabling extensive control over regional water-resource management.
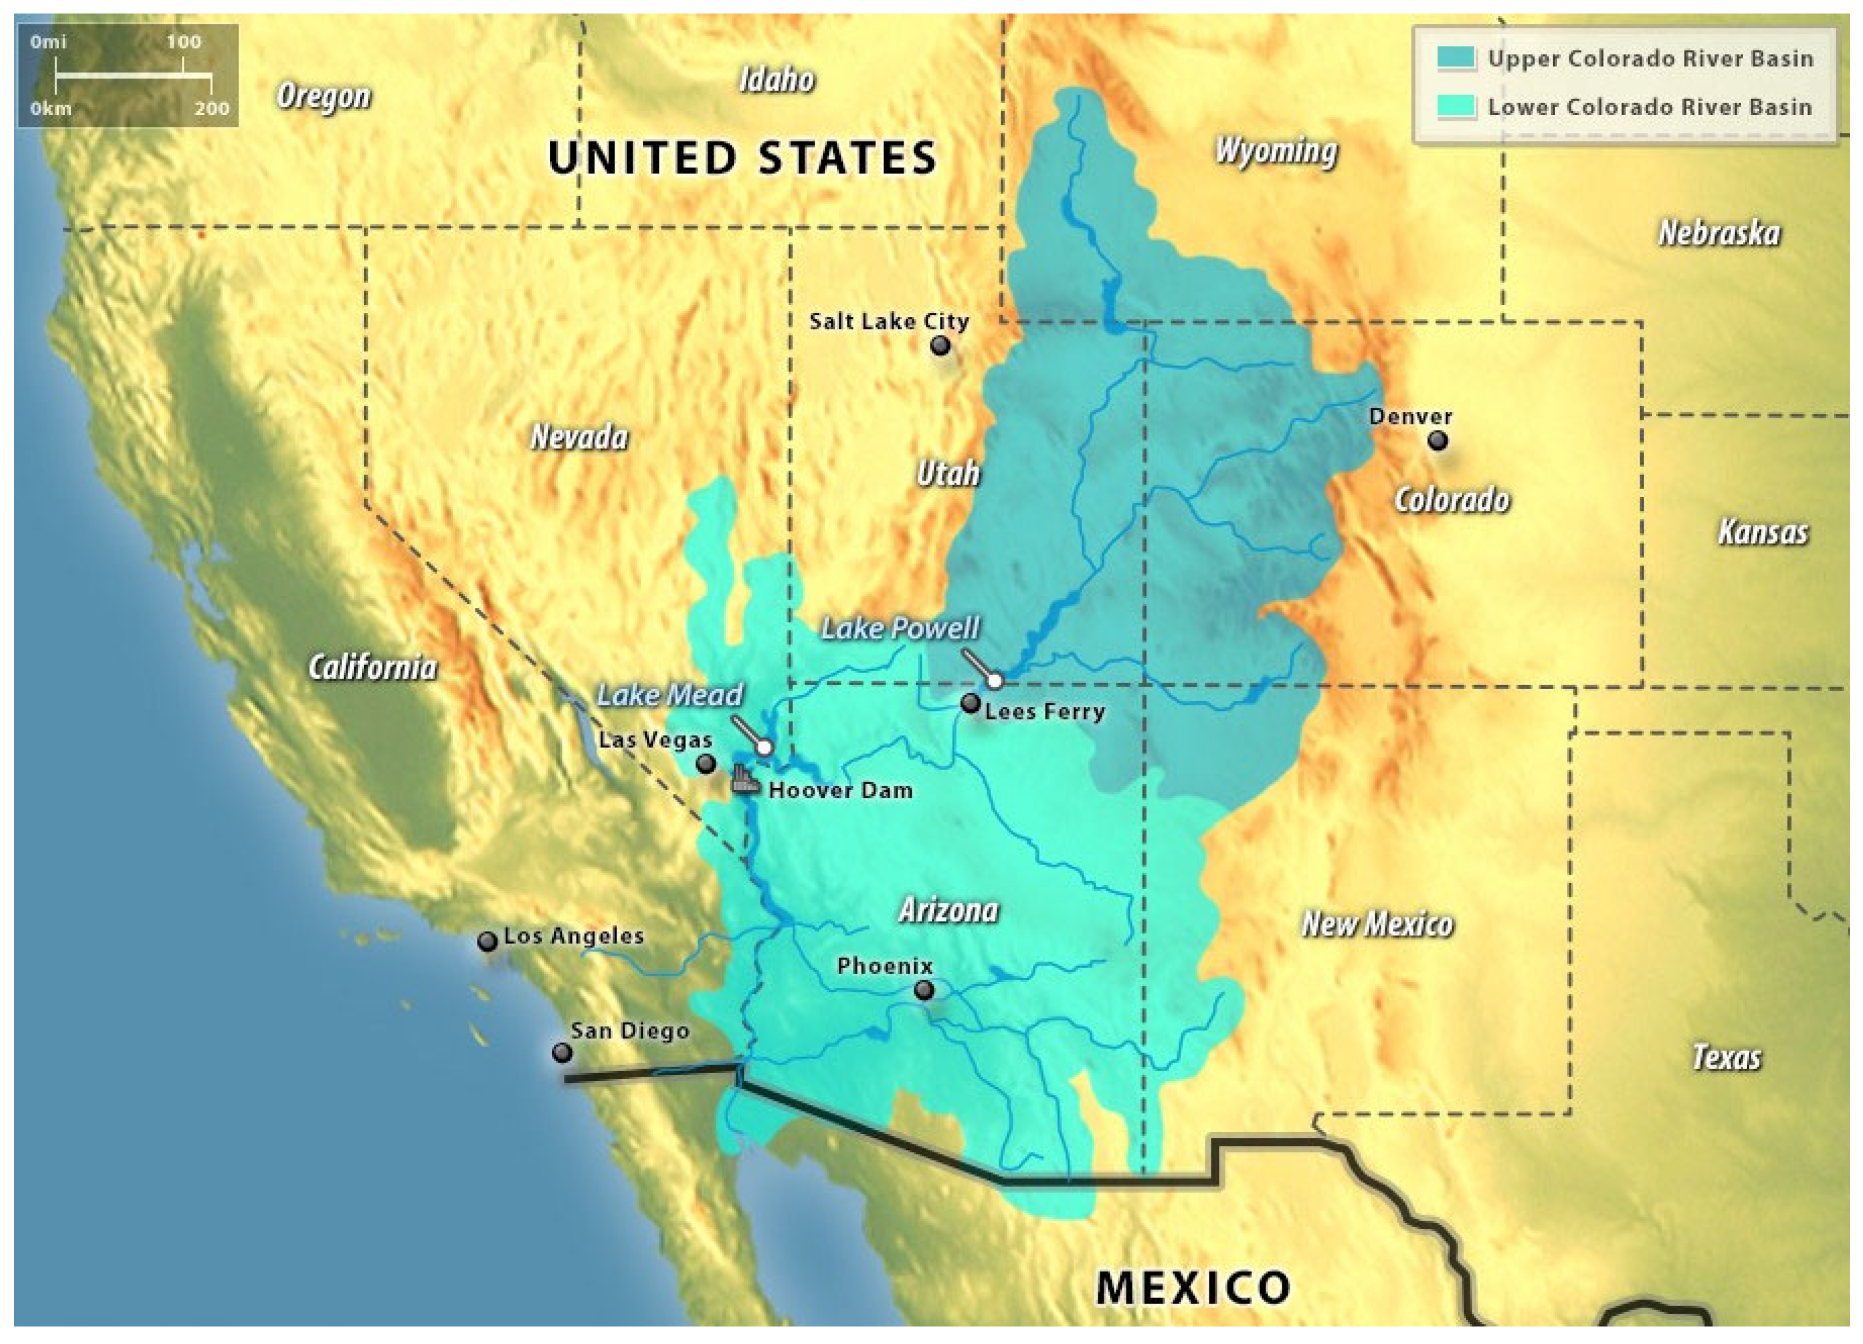
Figure 1 shows the Colorado River Basin in the United States, including the locations of Hoover Dam and Lakes Mead and Powell. For historical and legal reasons, the Colorado River Basin is divided into the upper and lower basins. This division forms the basis for water allocation agreements and has enabled equitable distribution of water among the states in the upper and lower parts of the basin. States in the upper basin receive more snowfall due to higher elevations, while the lower basin states rely on inflows from the upper basin. The upper basin (Colorado, Utah, Wyoming, New Mexico) is characterized by high mountains, a cooler climate, and major tributaries. The lower basin (Arizona, Nevada, and California) lies in extremely dry, desert regions and depends heavily on upstream inflows. Consequently, their water supply for irrigation, urban and industrial use, and energy production depends on inflows from the upper basin.
Figure 1.
Colorado River Basin with Lake Mead and Lake Powell. Modified from Udall [6], Colorado State University.
Hydrogeologically, the basin consists of extensive sandstone, carbonate, and metamorphic formations, with locally developed karst zones that contribute relatively little to river discharge compared to snowmelt. Milly and Dunne [7], using hydrological models and historical observations, demonstrated that declining Colorado River flows are largely due to increased evapotranspiration associated with reduced snow cover and the resulting decrease in surface albedo, which enhances solar radiation absorption.
Sediment dynamics of the Colorado River have also been profoundly altered by the construction of large dams. More than 90% of suspended sediment is retained in Lake Powell, substantially affecting geomorphological and numerous ecological processes downstream, particularly in the Grand Canyon [8,9,10]. Research indicates that reduced sediment supply has led to riverbank erosion and habitat degradation for numerous endemic species. To mitigate these impacts, periodic artificial “environmental flows” are released to partially restore natural sediment dynamics [11]. Grams et al. [12] found that controlled floods enhance the stability of downstream sandbars, promote channel morphology recovery, and reduce the retention of fine sediment in the reservoir.
In recent decades, the Colorado River Basin has been affected by prolonged megadrought conditions [13,14,15,16], rising temperatures, and diminishing snowpack, all contributing to alarming declines in annual flows. Importantly, the long-established water-allocation framework known as the “Law of the River” is increasingly misaligned with current hydrological and climatic realities, underscoring the urgent and radical need for a new, sustainable approach to water-resource management and climate adaptation [17].
The Colorado River Basin supplies water to more than 40 million people and supports intensive agriculture in Arizona, California, and Nevada. However, prolonged drought and climate change have drastically reduced inflows over the past two decades, resulting in historically low water levels in Lakes Mead and Powell. Numerous studies indicate that the combination of climate change, increased consumption, and management challenges has created persistent long-term water insecurity throughout the basin [18,19,20,21].
Climate models project an additional 20–30% decline in river flows by the mid-21st century, underscoring the urgent need for integrated management, revised allocation policies, and stronger interstate cooperation [22,23,24,25]. These pressures have made the Colorado River Basin one of the most thoroughly examined yet also one of the most heavily stressed river systems on the planet. From the perspective of hydrological dynamics and water security, it remains one of the most important and complex hydrological systems worldwide [13,17,19,22].
Water levels in the two largest reservoirs, Lakes Mead and Powell, have shown a continuous and dramatic decline over recent decades. These deeply concerning trends point to long-term structural changes in the hydrological regime, posing serious challenges not only to water management but also to broader biological and social sustainability across the region. Lakes Mead and Powell are central to the water supply and hydropower generation in the western United States. Although existing basin-management policies are set to expire in 2026 [26], effective planning remains difficult due to the intertwined effects of climatic variability and uncertainty surrounding water-use regulations. Wang et al. [27] demonstrated that, under current policies and projected flow declines, both reservoirs face a high risk (>80%probability) of reaching dead-pool levels before 2060. They further note that recently proposed alternative management strategies may reduce, but not eliminate, these risks.
The aim of this study is to analyze water-level trends and variations in Lakes Mead and Powell on an annual time scale using several less commonly applied concepts and analytical methods.
2. Materials and Methods
Daily water-level data measured in Lakes Mead and Powell were obtained from the U.S. Geological Survey Nevada Water Science Center (Lake Mead) and the U.S. Geological Survey Utah Water Science Center (Lake Powell). Measurements in Lake Mead began on 2 February 1935, while measurements in Lake Powell began on 28 December 1963. All analyses were performed at an annual time scale.
The relationship between mean annual water levels in Lakes Mead and Powell for the period 1964–2024 was examined using linear regression. The linear regression model was adopted as a first-order approximation of the coupling between the upstream (Lake Powell) and downstream (Lake Mead) reservoirs at the annual time scale. At this temporal resolution, short-term nonlinear effects related to reservoir operations, seasonal inflow variability, and release timing are effectively averaged out, and the dominant control on downstream water levels is the integrated upstream storage state. The regression is therefore applied as a diagnostic tool to assess long-term connectivity and regime shifts between the two reservoirs, rather than as a predictive operational model.
The linear regression is defined as follows:
where is the dependent variable (water level in the downstream reservoir, Lake Mead), is the independent variable (water level in the upstream reservoir, Lake Powell), and and are regression coefficients estimated by the least squares method. The coefficient represents the slope of the regression line: a positive slope denotes a direct relationship between the variables, while a negative slope indicates an inverse relationship.
Y = A + (B × X)
The relationship between mean annual water levels in Lake Powell and Mead was evaluated using Pearson’s linear correlation coefficient (R) and the coefficient of determination (R2) within a linear regression framework. Interpretation of correlation strength follows the Chaddock scale [28,29].
The RAPS (Rescaled Adjusted Partial Sums) method [30] was used to detect and quantify fluctuations (jumps and/or drops) in the time series of mean annual water levels for the two analyzed reservoirs. RAPS visualization highlights trends, shifts, clustering, irregular fluctuations, and periodicities in the data. This RAPS-based visualization approach reduces the influence of small systematic changes and short-term variability in the series [31] and is calculated as follows:
where Ht is the mean annual water level in year t, Hav is the average of the entire analyzed series, SD is the standard deviation of the entire series containing n members, and k (1, 2, …, n) is the cumulative index for year k.
RAPSk = Σk (Ht − Hav)/SD, k = 1, 2, …, n
To determine the statistical significance of differences in variances and average values between adjacent subsets identified using the RAPS method, the F-test and t-test were applied [32]. Pairwise t-tests were used because the comparisons were restricted to sequential subperiods representing predefined and physically meaningful regime transitions rather than exploratory comparisons across all groups. This stepwise testing approach is commonly applied in hydrological time-series analyses to evaluate changes in mean conditions associated with regime shifts. In both tests, statistical significance was set at p < 0.01.
The applied parametric tests were used as diagnostic tools to compare mean values between clearly defined subperiods identified by the RAPS analysis, rather than for distributional interference or prediction. Given the long record length and the aggregation to an annual time scale, these tests are generally robust to moderate departures from normality and stationarity commonly observed in hydrological time series. Variance homogeneity was explicitly evaluated using the F-test, while the remaining assumptions were considered acceptable within the exploratory and regime-comparison context of this study.
The day-to-day (DTD) method is relatively new and widely used as an effective metric for climate-change analysis. It has been applied primarily to daily air-temperature series but is used here for daily water-level data. The method was applied to water levels by Bonacci and Roje–Bonacci [33] for the Sava River in Zagreb. The DTD framework for temperature variability was first introduced by Karl et al. [34] and later further developed by Gough [35], Tam and Gough [36], Gough and Hu [37], and many others. DTD variability of the analyzed parameter, in this case water level, is based on the absolute difference between values on two consecutive days and is calculated as follows:
where n is the number of observations in the series, i is the day index, Hᵢ is the mean daily water level on day i, Hᵢ−1 is the mean value on the preceding day, and the vertical bars denote absolute values.
DTD = Σ |Hi − Hi−1|/(n − 1)
Drought-monitoring and early-warning systems commonly rely on drought indicators such as the Standardized Precipitation Index (SPI) or the Standardized Precipitation Evapotranspiration Index (SPEI) [38]. To improve drought-hazard assessment in the United Kingdom, Barker et al. [39] linked SPI with the Standardized Streamflow Index (SQI). Nalbantis and Tsakiris [40] applied SQI to drought analysis on the Evinos River in Greece. In this study, the Standardized Hydrological Index (SHI) was used, calculated from the available mean annual water-level series H for Lakes Mead and Powell and defined as follows:
where H is the mean annual water level for the analyzed period, Hav is the average of the series, and SD is its standard deviation. Although commonly used drought indices such as SPI, SPEI, and SQI are valuable for meteorological and hydrological drought assessment, this study applies SHI because it directly reflects the integrated response of large reservoirs to climatic forcing, upstream regulation, and water withdrawals. SHI is therefore particularly suitable for highly managed systems such as the Lakes Mead and Powell.
SHI = (H − Hav)/SD
Drought-intensity classes follow the SPEI scale: mild drought for SHI values between 0 and −1.0, moderate drought (−1.0 to −1.5), severe drought (−1.5 to −2.0), and extreme drought for SHI values below −2.0.
3. Results and Discussion
3.1. Lake Mead
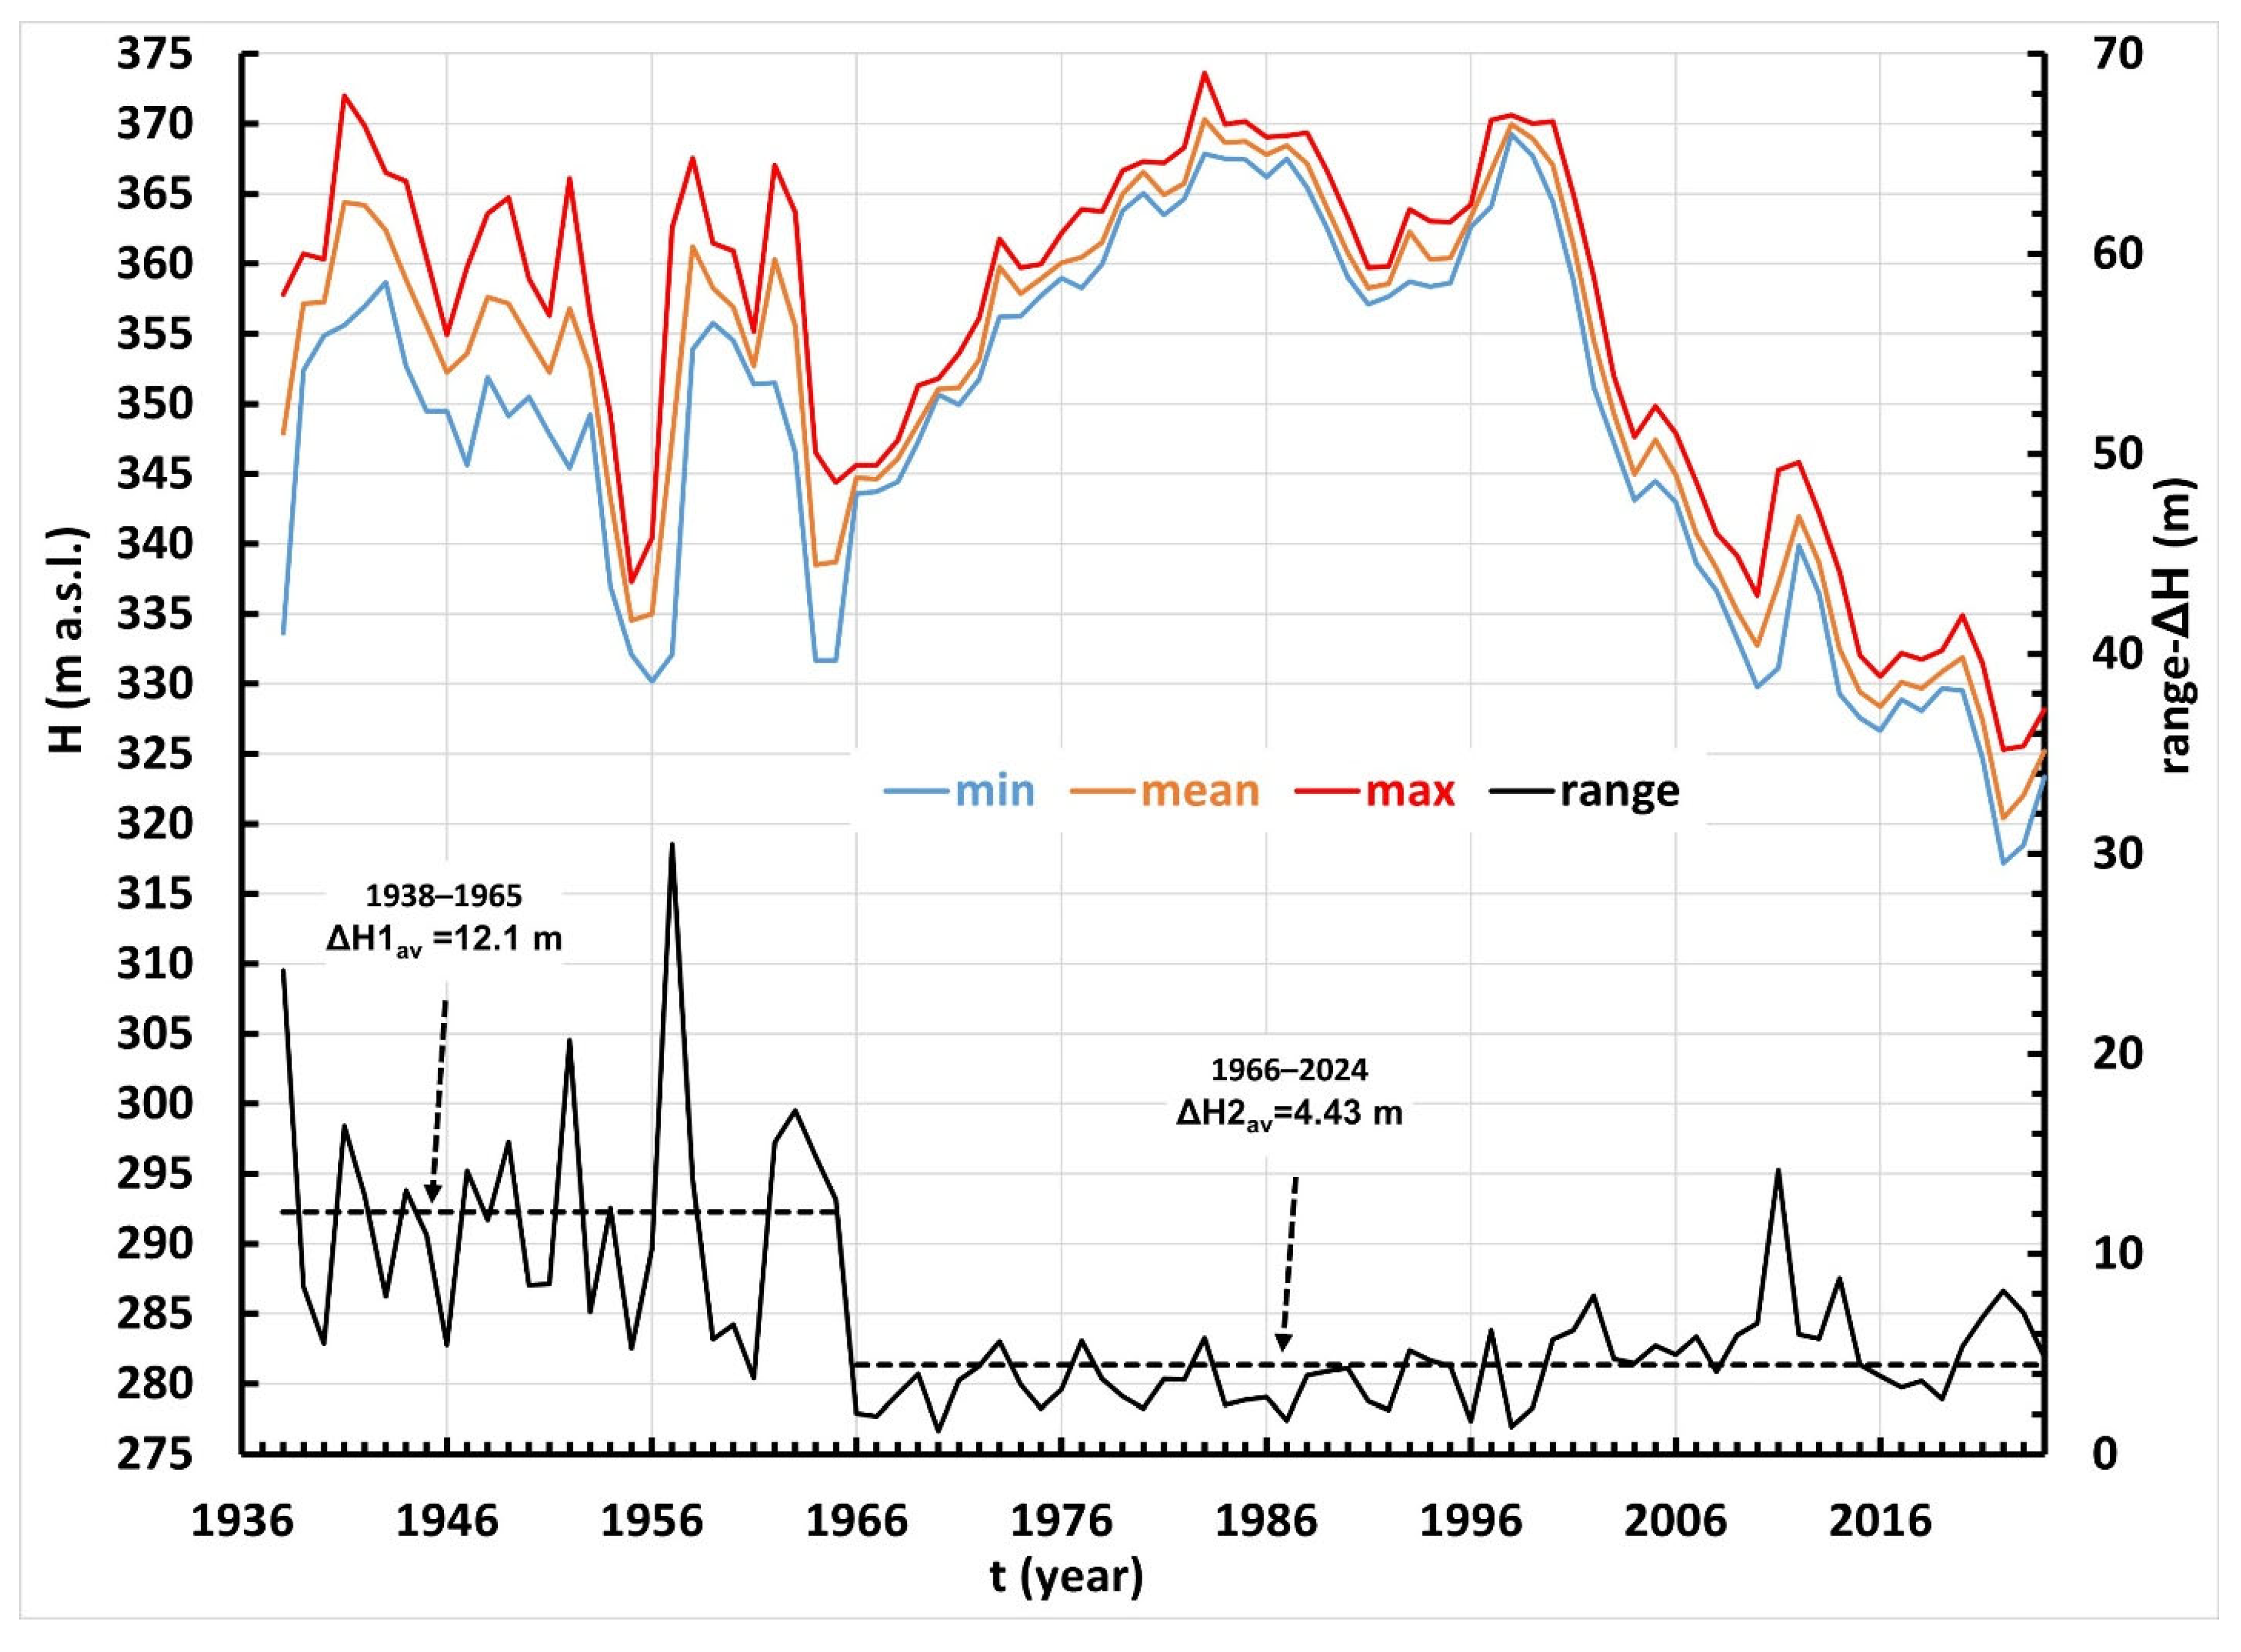
Figure 2 shows the series of minimum (blue), mean (brown), and maximum (red) water levels observed in Lake Mead for the period 1938–2024. The annual water-level ranges, ΔH = Hmax − Hmin, defined as the difference between the maximum and minimum water level in each year, are also plotted.
Figure 2.
Series of minimum (Hmin), mean (Hmean), and maximum (Hmax) annual water levels, and the annual water-level range ΔH = Hmax − Hmin, measured in Lake Mead during 1938–2024.
The lowest water level during the study period was 317.6 m a.s.l., recorded on 28 July 2022. The highest water level was 373.6 m a.s.l., measured on 24 July 1983. The long-term average annual water level (1938–2024) is 351.6 m a.s.l. The highest mean annual water level (370.32 m a.s.l.) occurred in 1983, and the lowest mean annual level (320.28 m a.s.l.) in 2022.
It is important to note the sharp decline in the range between the highest and lowest annual water level, ΔH, during the period 1966–2024 compared to 1938–1965. In the first subperiod (1938–1965), before Lake Mead was affected by regulated inflow from Lake Powell, the average ΔH was 12.10 m. In the second subperiod (1966–2024), under the influence of regulated inflow from Lake Powell, the average range decreased to 4.43 m. A t-test showed that the average ranges for the two subperiods differ statistically significantly, with p = 3.8 × 10⁻⁷. The variance in the first subperiod was 37.3, whereas in the second it was statistically significantly lower at 1.52. The F-test yielded p = 6.3 × 10⁻¹¹.
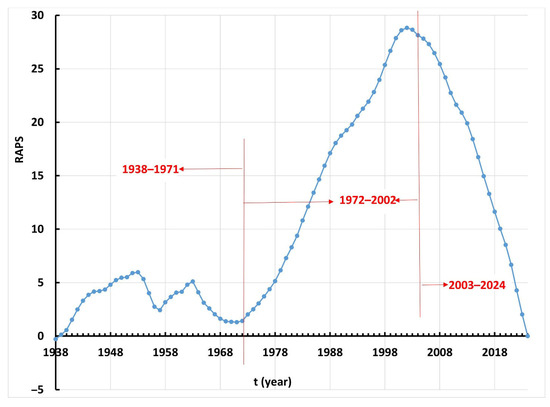
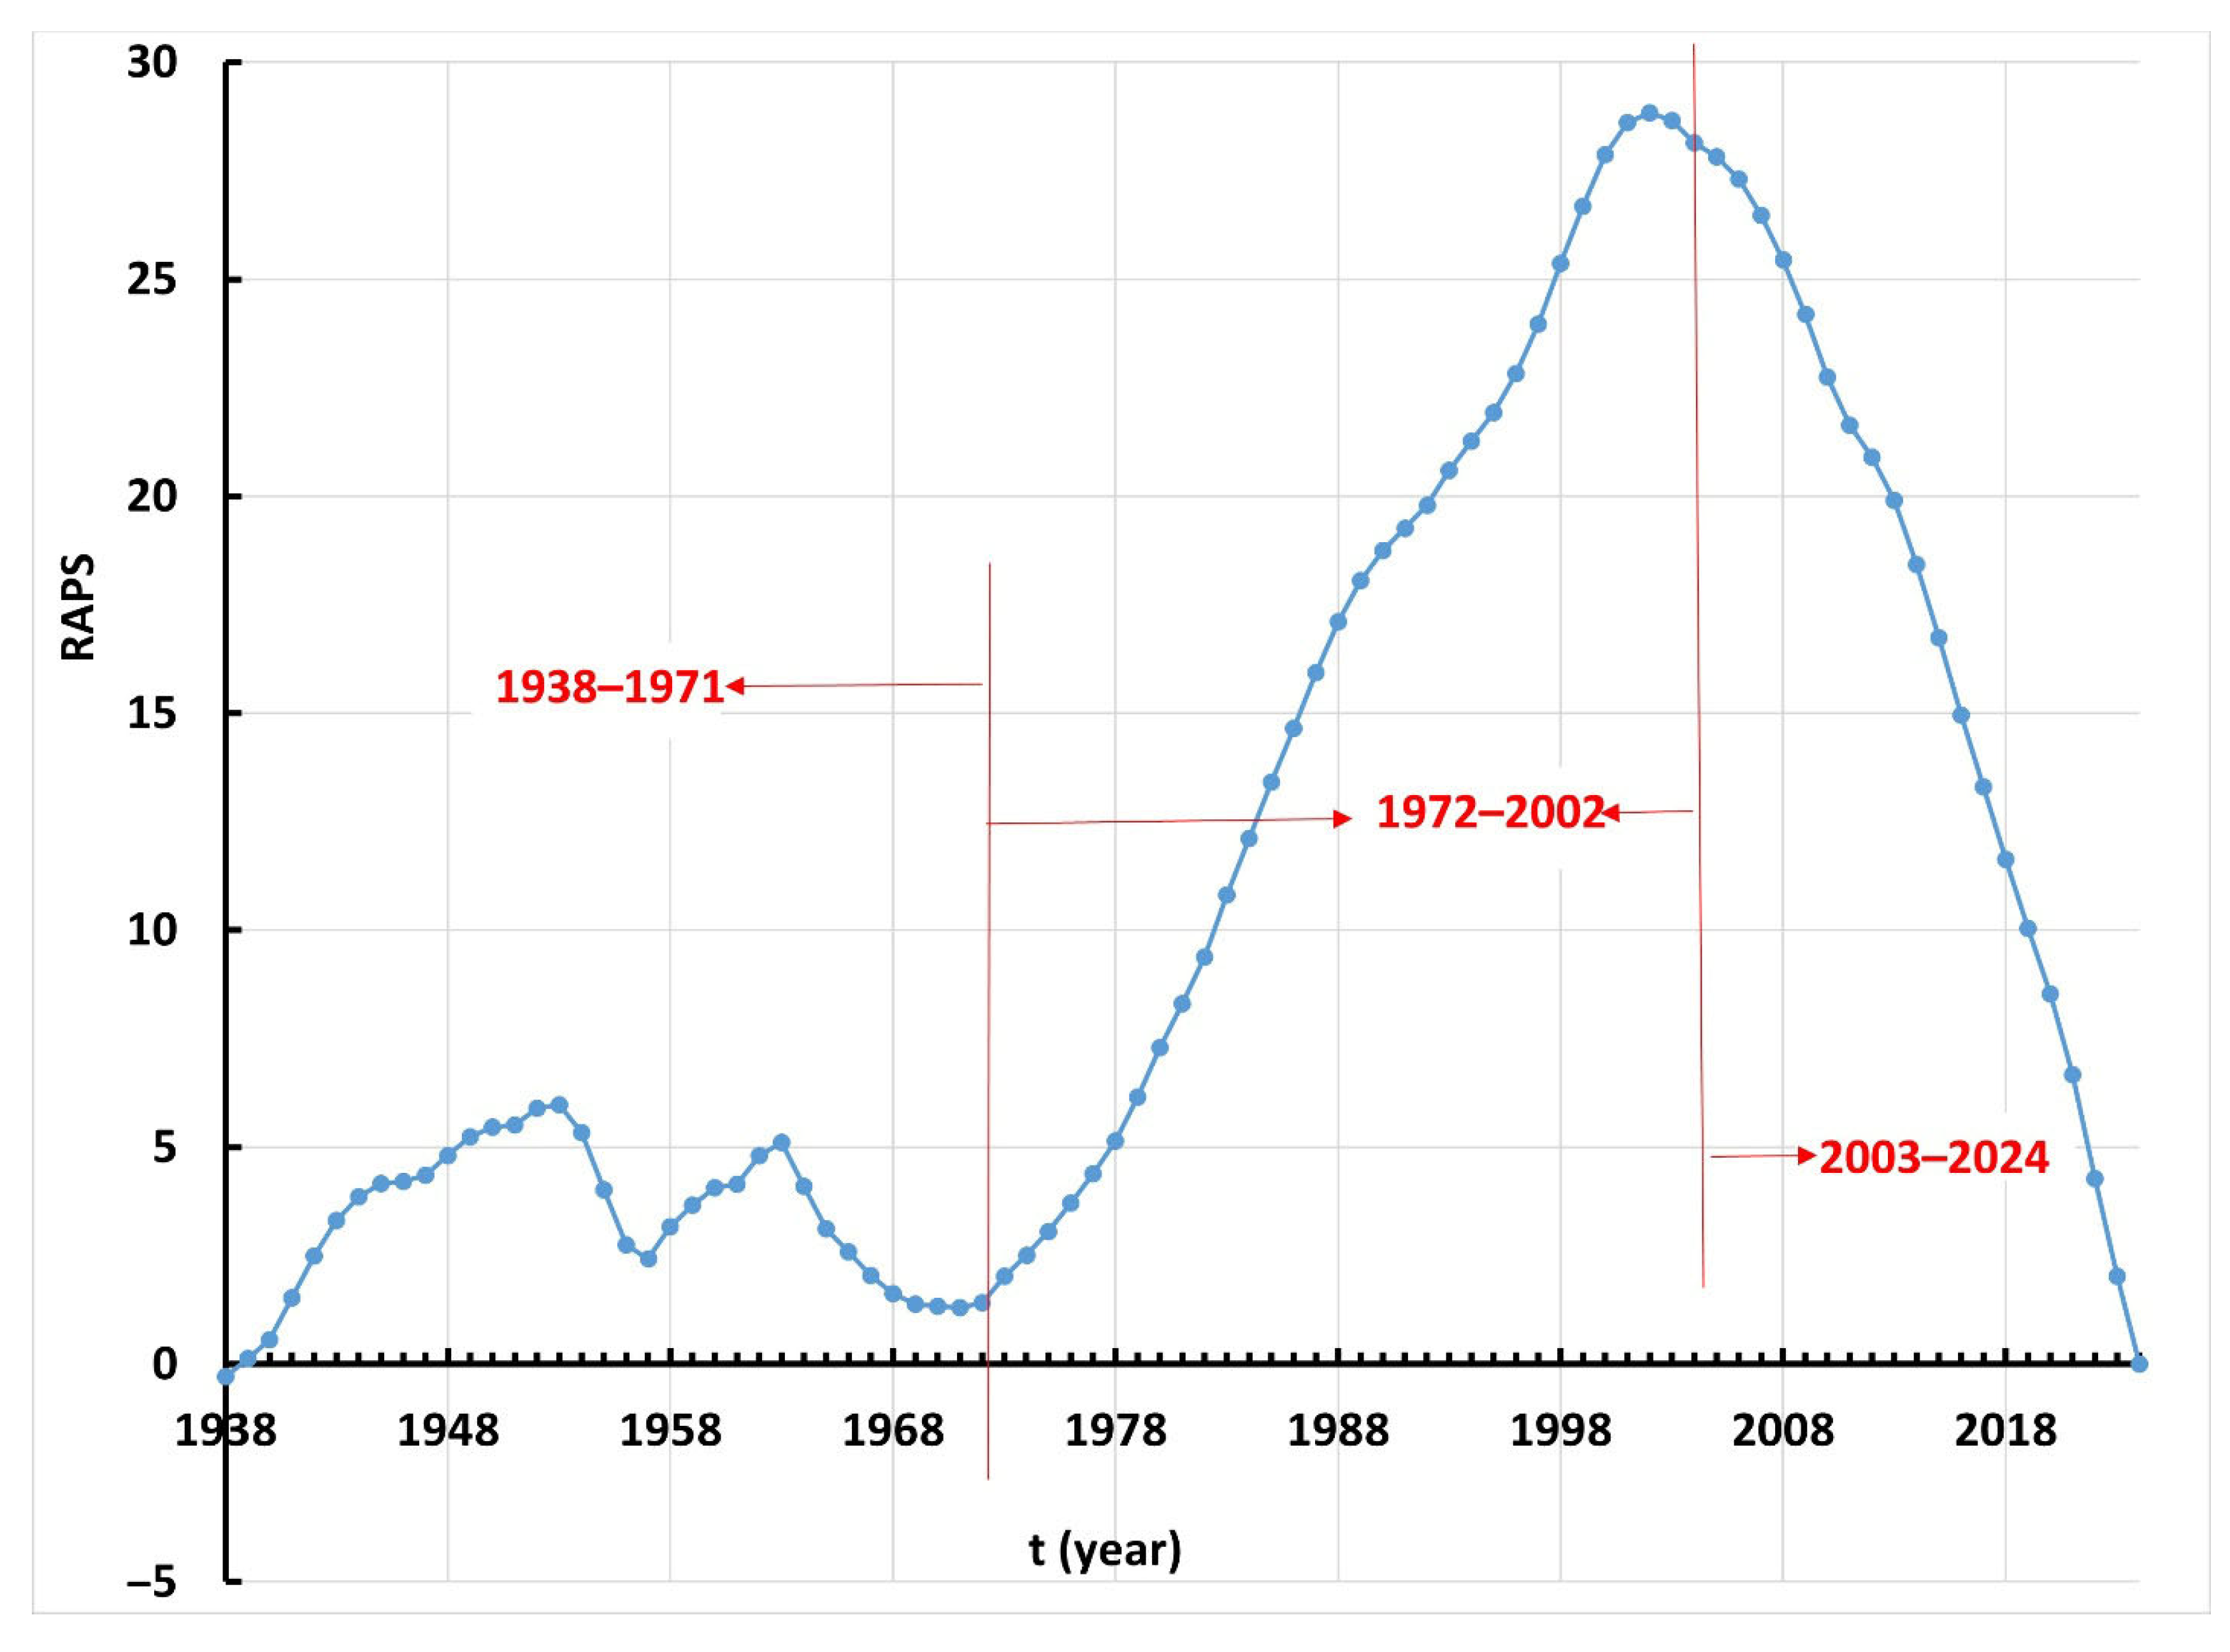
Figure 3 graphically presents the RAPS time series of mean annual water levels in Lake Mead for the period 1938–2024. The plot indicates three subperiods with distinct water-level patterns: (1) 1938–1971, (2) 1972–2002, and (3) 2003–2024. Table 1 lists the average values of mean annual water levels in Lake Mead for these subperiods, along with p-values for differences in variances (F-test) and average values (t-test) between adjacent subperiods. The very low p-values (p < 0.01) for both variances and averages indicate statistically significant differences. It should be noted that the most recent subperiod (2003–2024) is characterized by a sharp and statistically significant decline in water levels.
Figure 3.
RAPS series of mean annual water levels in Lake Mead, with three subperiods indicated.
Table 1.
Average values of mean annual water levels in Lake Mead for the three RAPS-defined subperiods, and p-values for differences in variances (F-test) and in average values (t-test) between adjacent subperiods.
3.2. Lake Powell
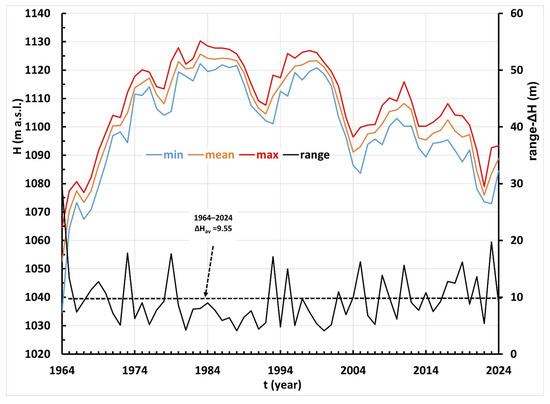
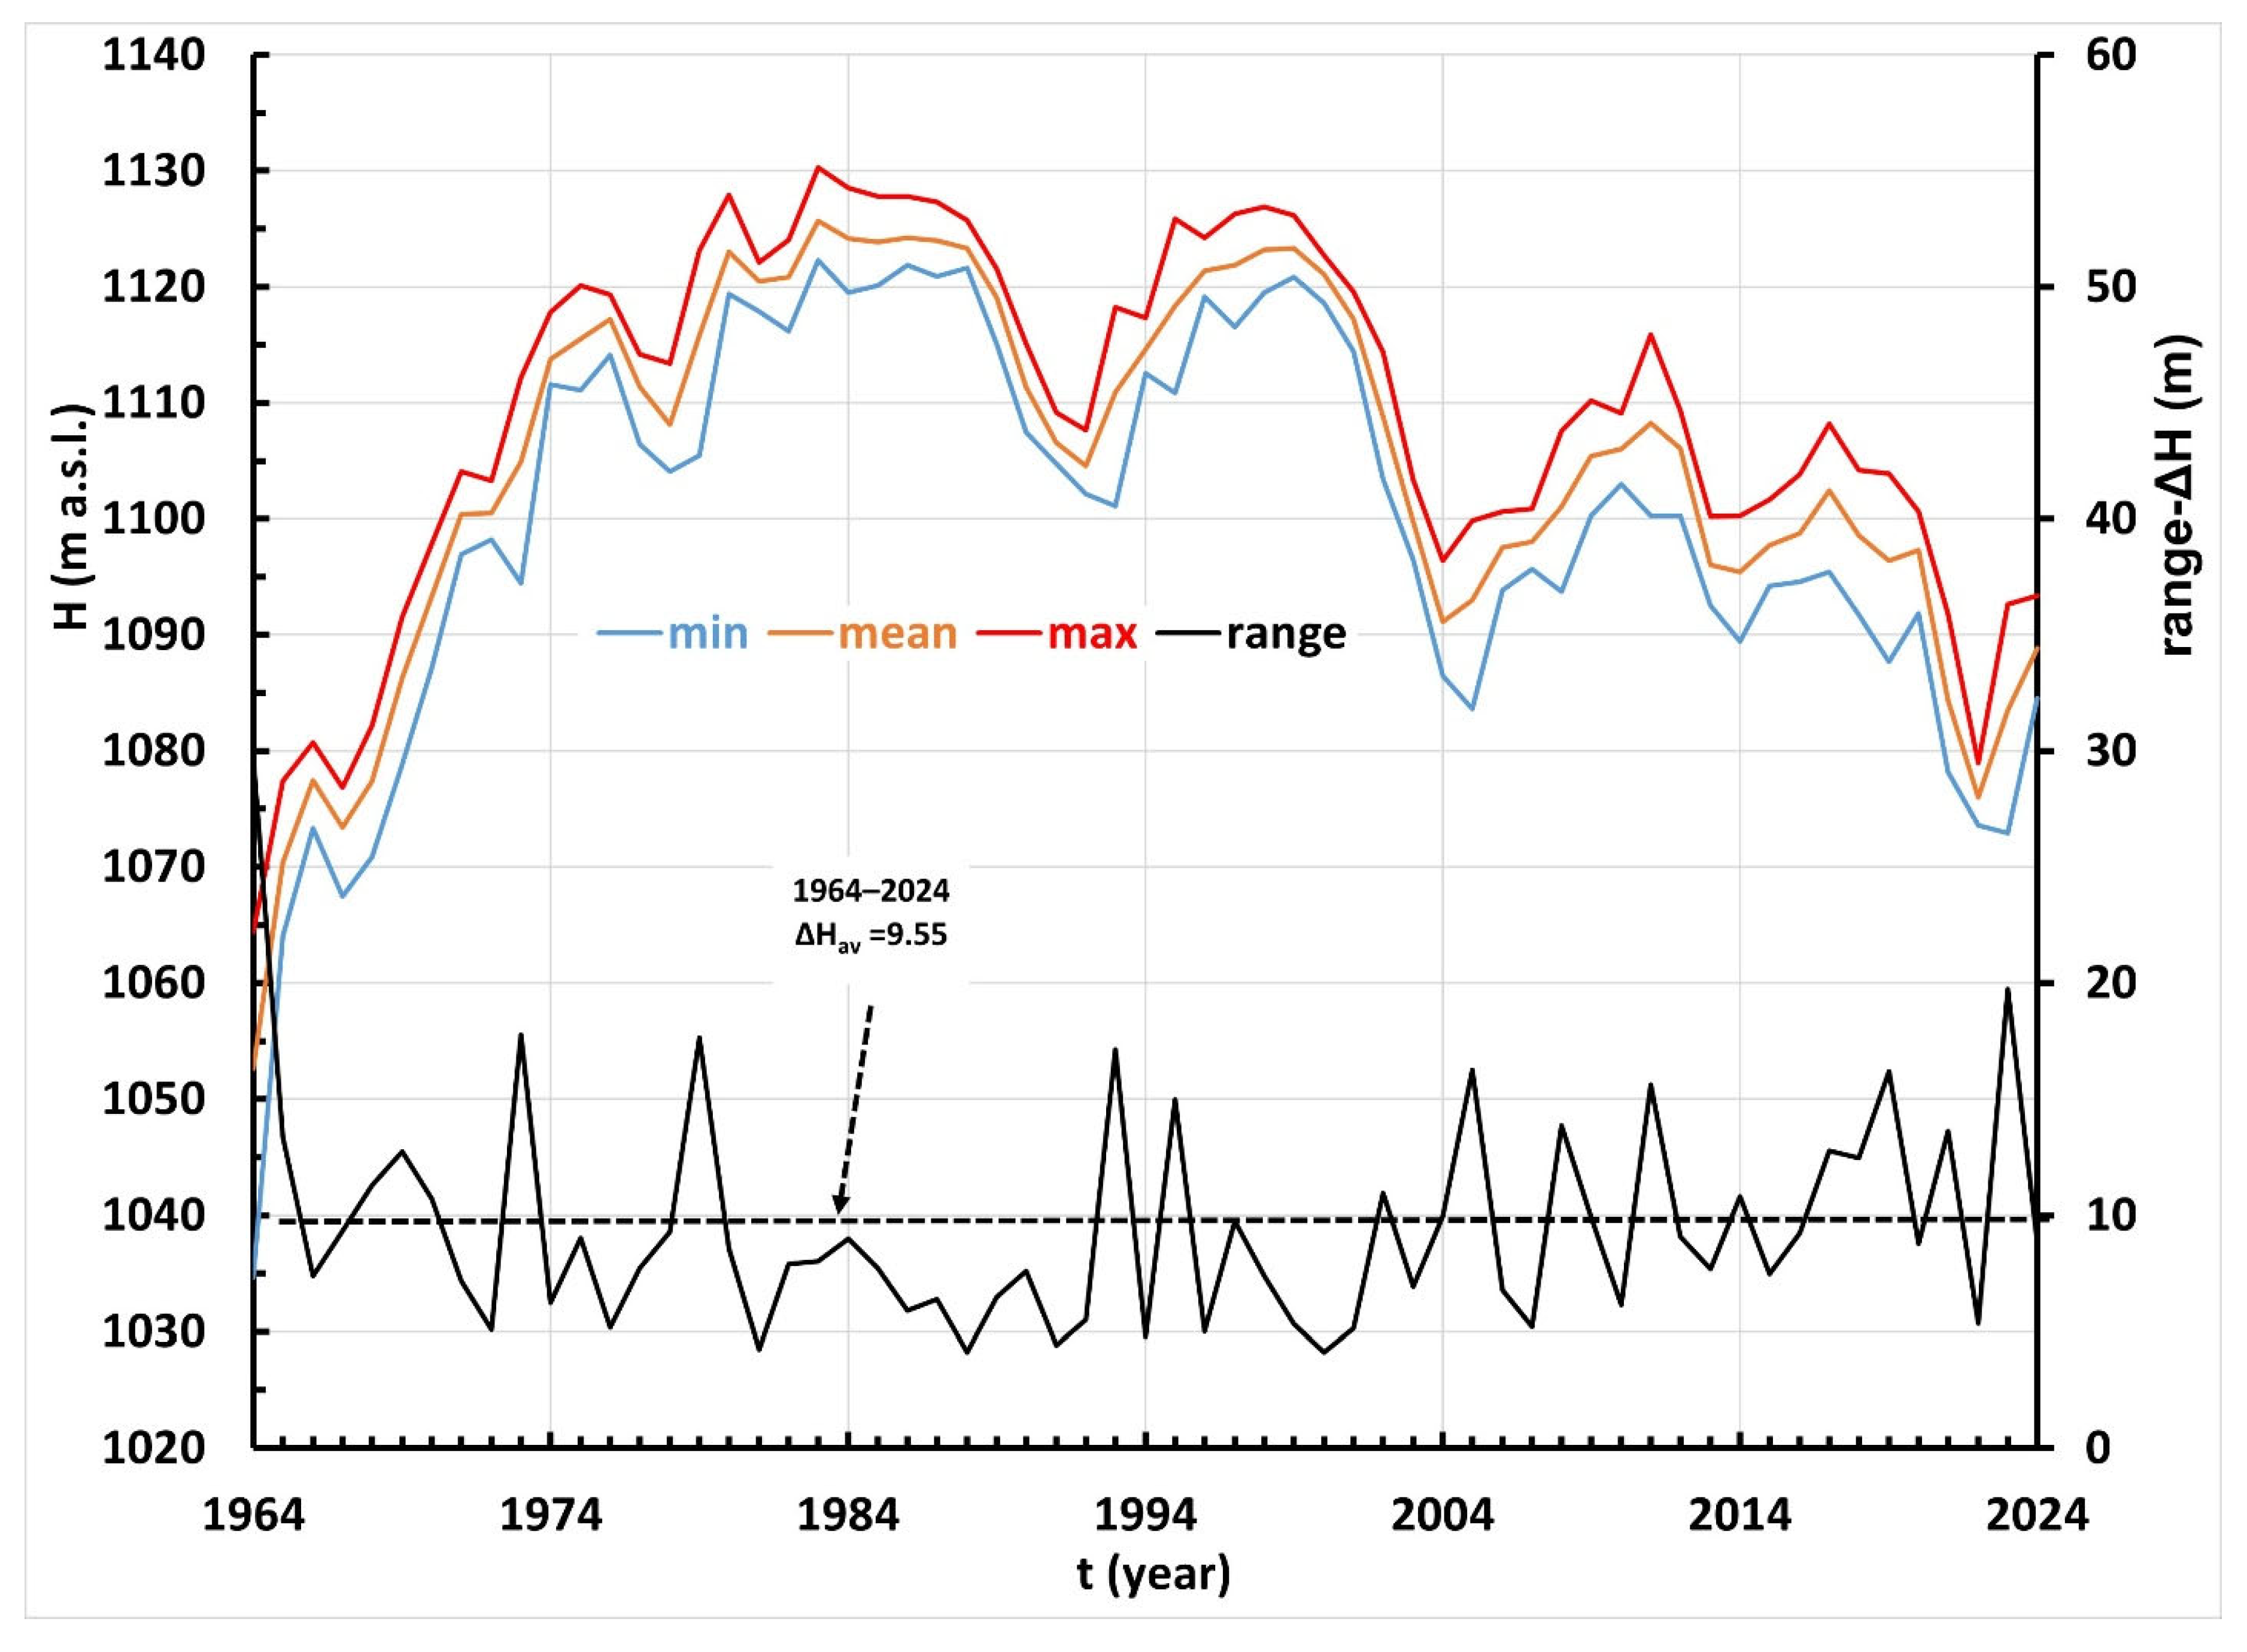
Figure 4 shows the series of minimum (blue), mean (brown), and maximum (red) water levels observed in Lake Powell during 1964–2024. The annual water-level ranges, ΔH = Hmax − Hmin, defined as the difference between the maximum and minimum water level in each year, are also plotted.
Figure 4.
Series of minimum (Hmin), mean (Hmean), and maximum (Hmax) annual water levels, and the annual water-level range ΔH = Hmax − Hmin, measured in Lake Powell during 1964–2024.
The lowest water level during 1964–2024 was 1034.6 m a.s.l., recorded on 11 May 1964. Since this value was measured during the reservoir filling period, it is also important to note the lowest water level observed during the more recent megadrought period, which was 1072.9 m a.s.l. on 13 April 2023. The highest water level during 1964–2024 was 1130.3 m a.s.l., recorded on 14 July 1983. The long-term average of mean annual water levels for the period was 1104.4 m a.s.l. The highest mean annual water level (1125.7 m a.s.l.) occurred in 1983, while the lowest (1052.6 m a.s.l.) was recorded in 1964. No trends or abrupt changes were observed in the annual water-level ranges. The average range was 9.56 m, varying from 4.11 m (2000) to 29.7 m (1964).
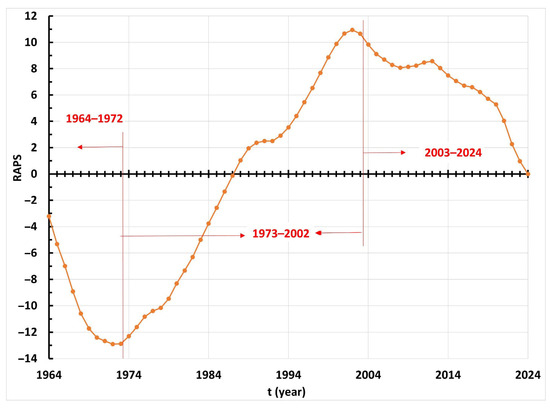
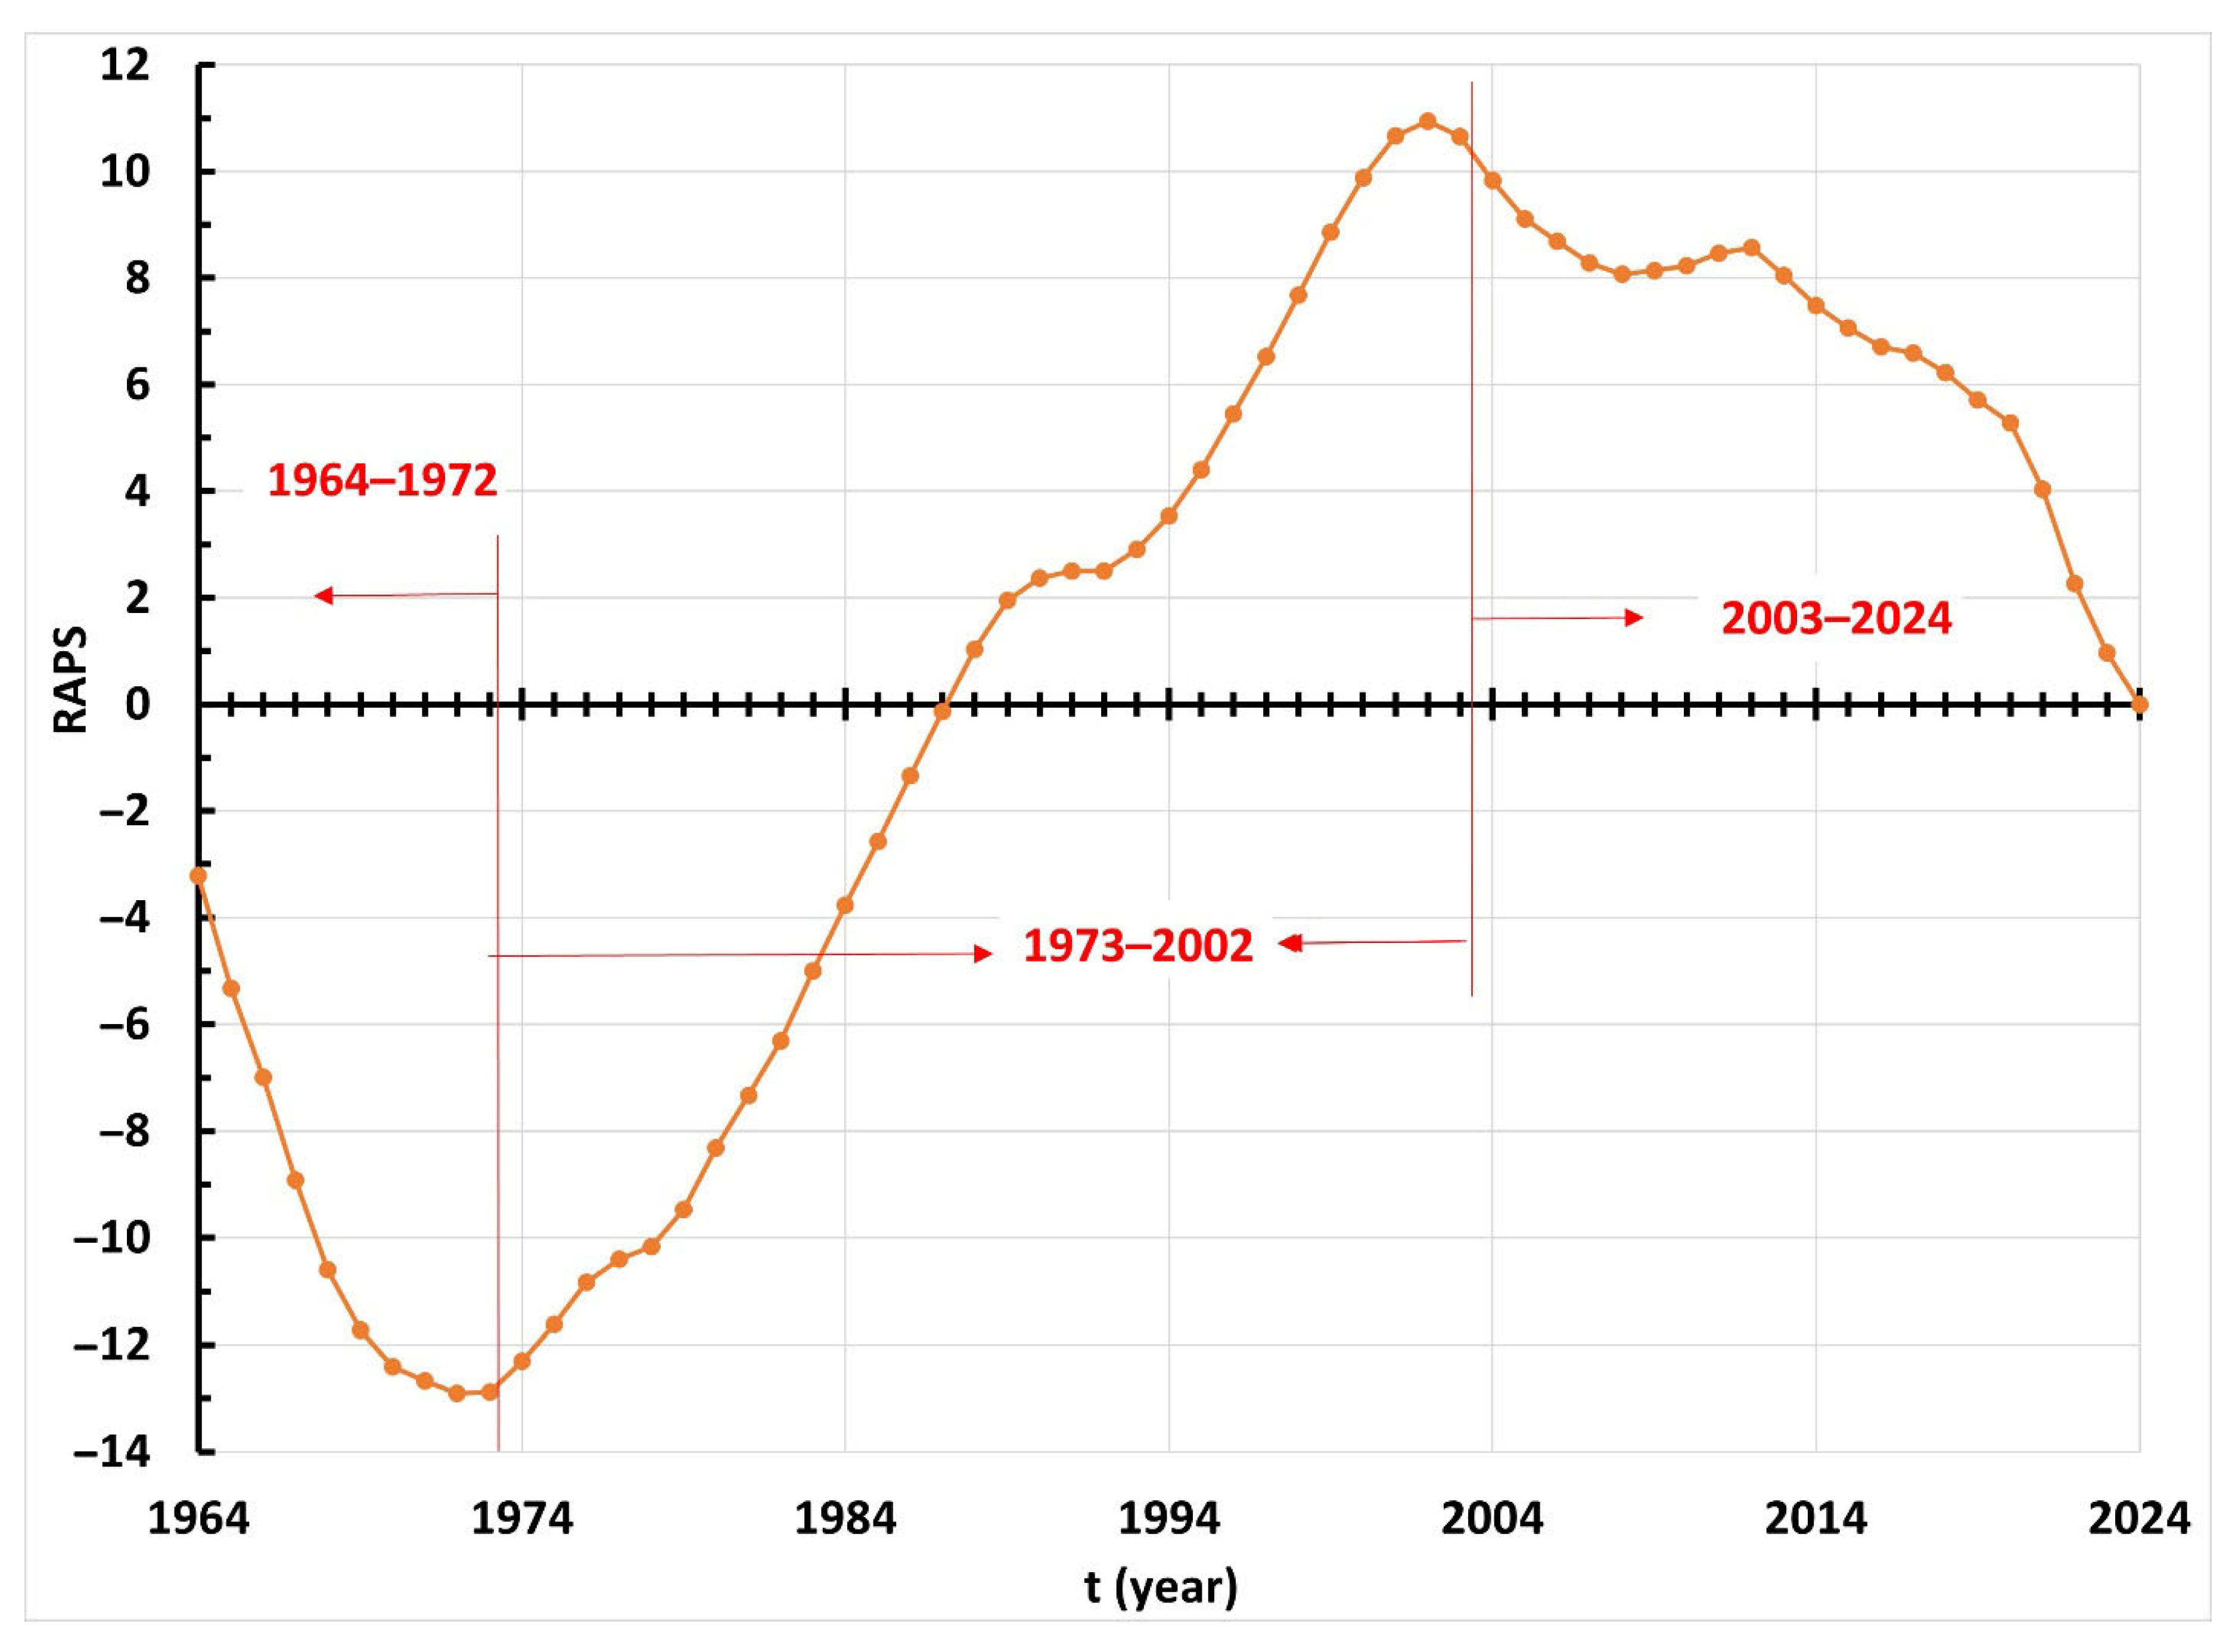
Figure 5 graphically presents the RAPS time series of mean annual water levels in Lake Powell for the period 1964–2024. The analysis indicates the existence of three subperiods with distinct water-level behavior: (1) 1964–1972; (2) 1973–2002; (3) 2003–2024. Table 2 lists the average values of mean annual water levels in Lake Powell for these subperiods, along with p-values for differences in variances (F-test) and average values (t-test) between adjacent subperiods. Very low p-values (p < 0.01) for both variances and averages indicate statistically significant differences, except that the variances of the second and third subperiods do not differ significantly. It should be noted that the most recent subperiod (2003–2024) is characterized by a sharp and statistically significant decline in water levels.
Figure 5.
RAPS series of mean annual water levels for Lake Powell with three identified subperiods.
Table 2.
Average values of mean annual water levels in Lake Powell for the three RAPS-defined subperiods, and the p-values for differences in variances (F-test) and average values (t-test) between adjacent subperiods.
3.3. Relationship Between Reservoir Water Levels
It should be emphasized that the regression between the water levels of Lakes Powell and Mead is used here as an observational diagnostic of long-term system coupling and regime change rather than as a causal or predictive model with the integrated water-level signal implicitly reflecting the combined effect of climate forcing, reservoir operations, evaporation, and consumptive use. The primary aim of this analysis is to empirically characterize system-level behavior and structural coupling between the two largest reservoirs in the Colorado River system using long-term, internally consistent water-level observations. In this context, the regression serves as a diagnostic indicator of coupled system changes over time under combined climatic and anthropogenic pressures.
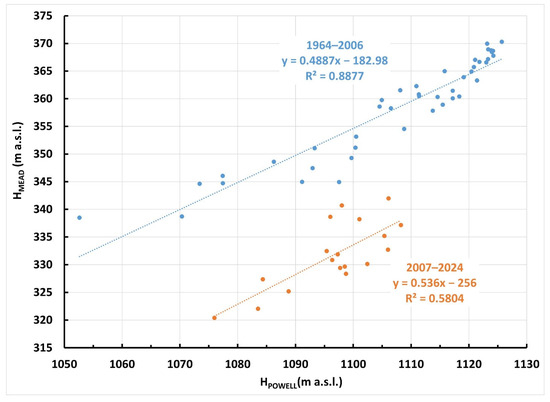
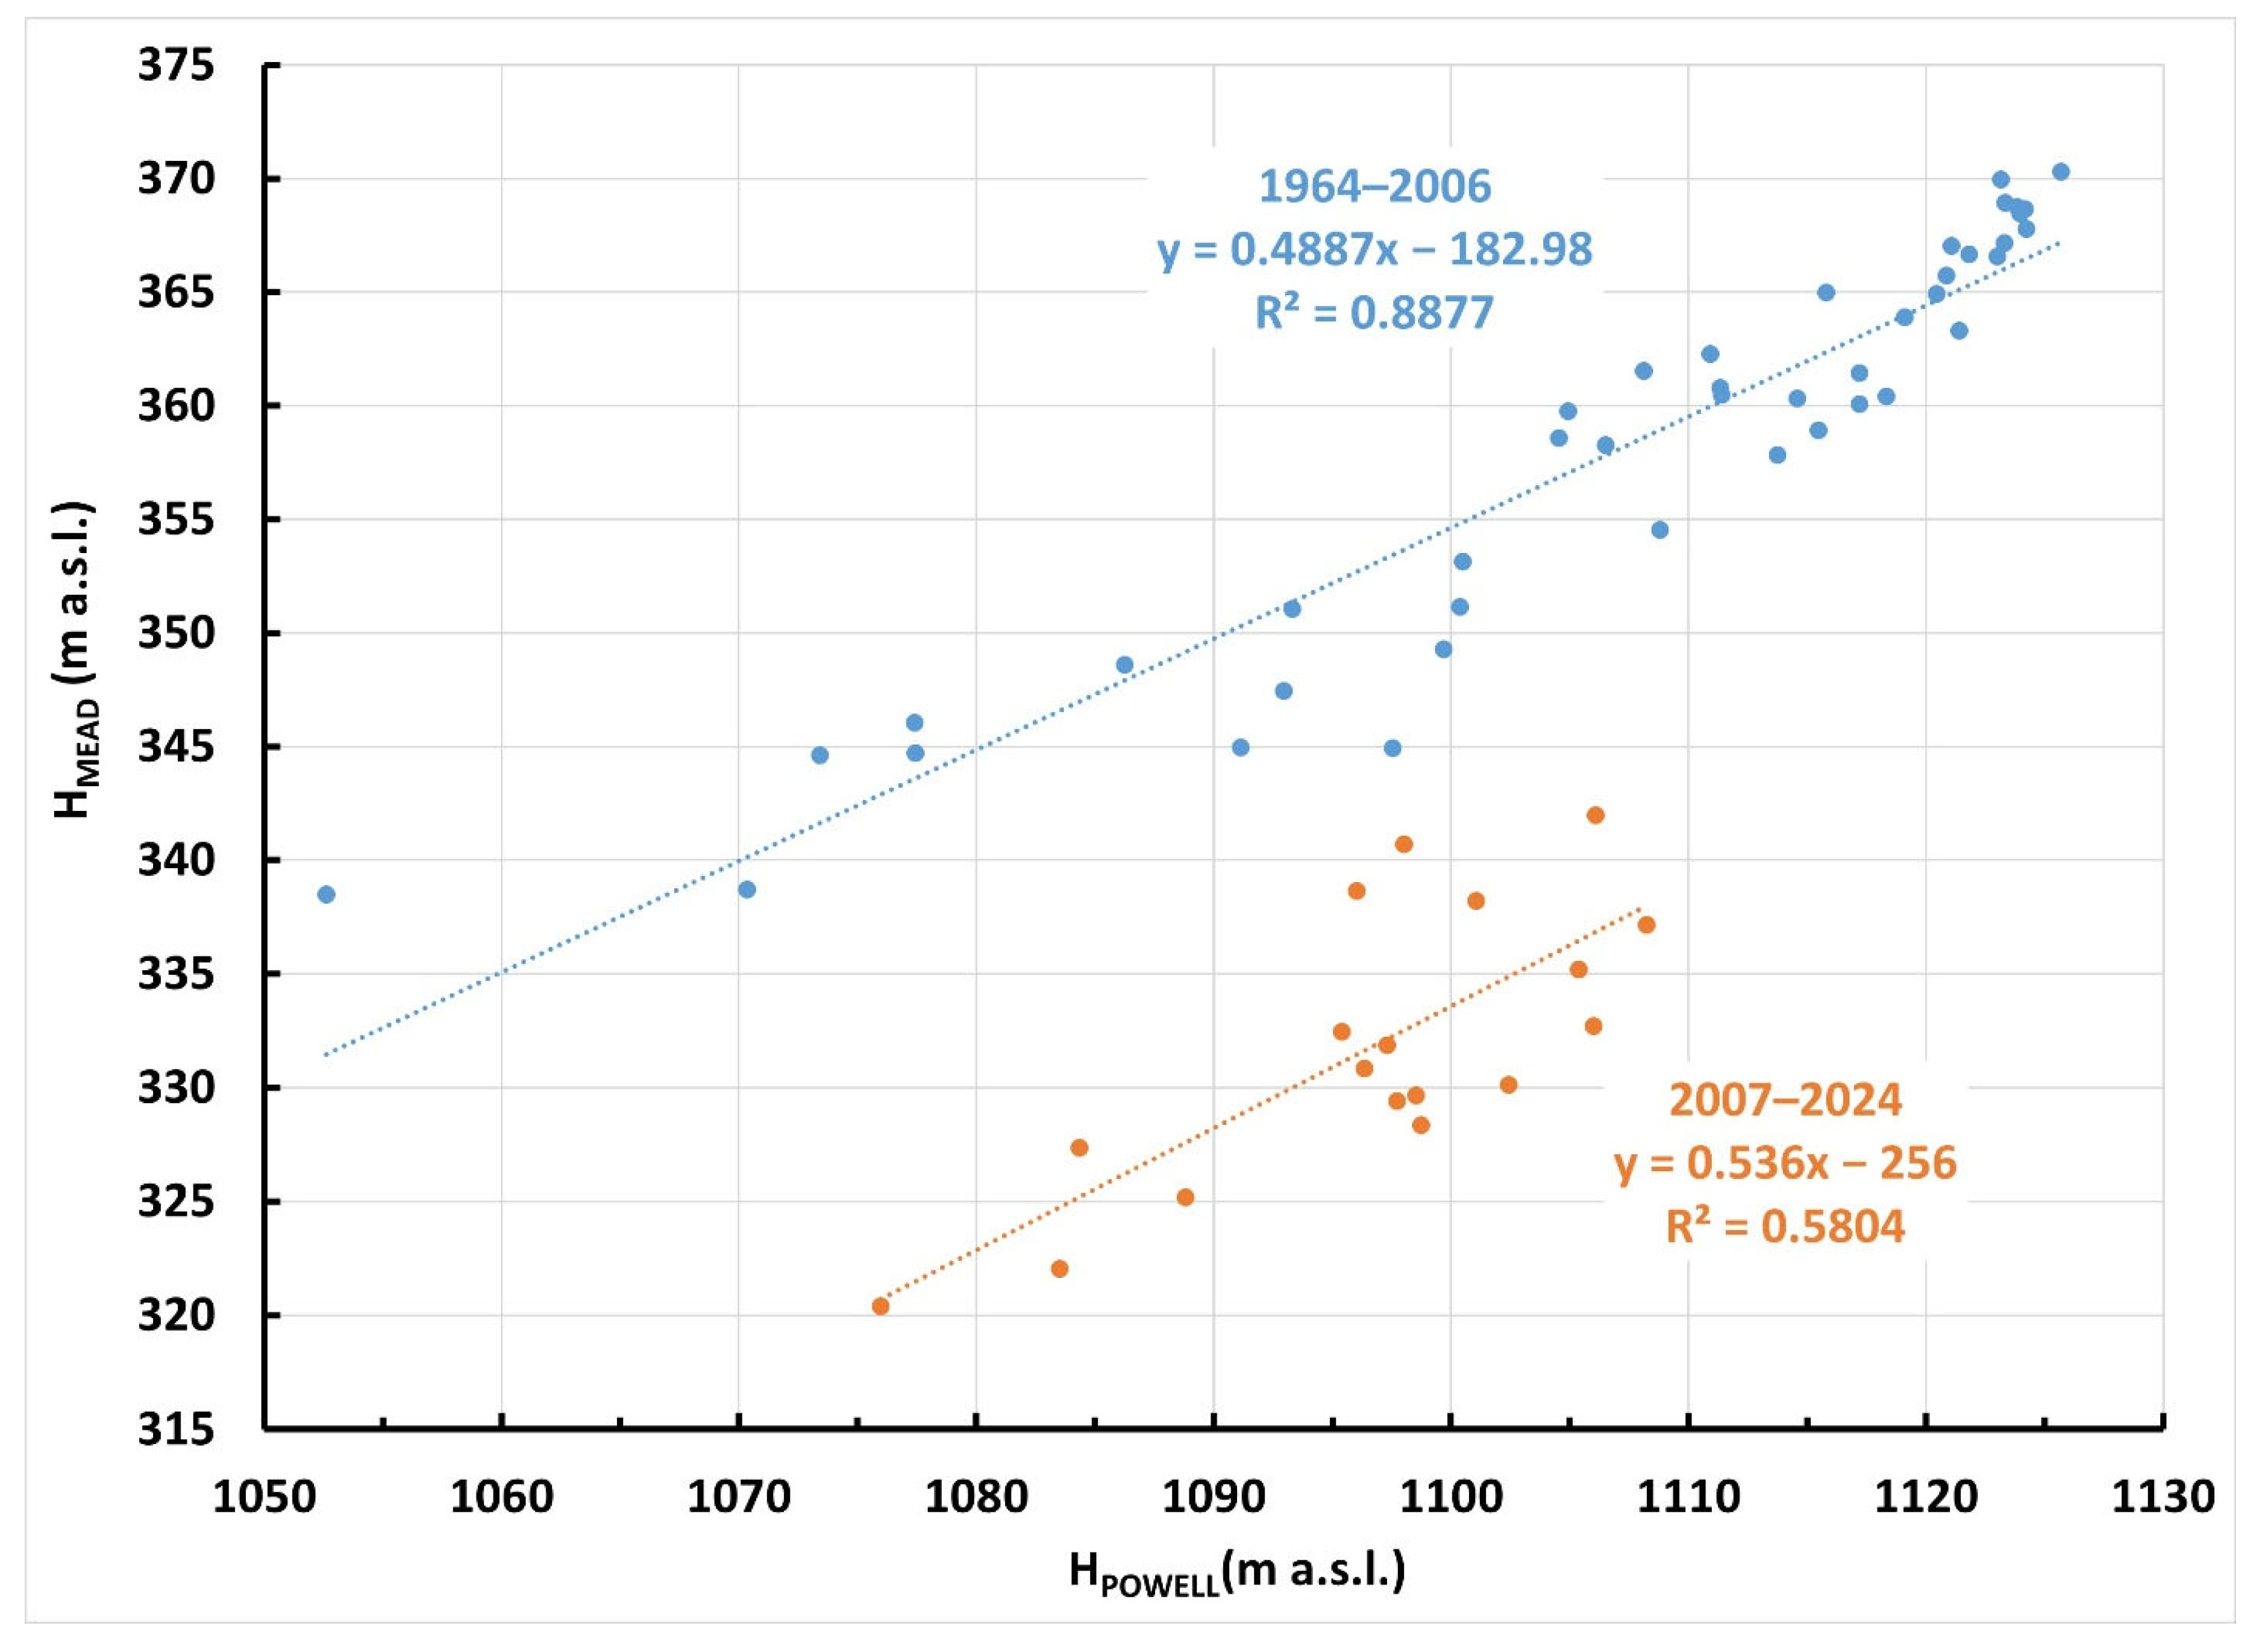
Figure 6 shows the relationship between average annual water levels in Lake Mead and those in Lake Powell. Two distinct subperiods emerge: (1) 1964–2006; (2) 2007–2024. The regression lines for these periods are nearly parallel, indicating a persistent coupling between the upstream and downstream reservoirs.
Figure 6.
Relationship between mean annual water levels in Lake Mead and mean annual water levels in Lake Powell.
However, for the same water levels in Lake Powell, mean annual water levels in Lake Mead during the recent subperiod are, on average, approximately 22 m lower than in the earlier subperiod. In the first subperiod, the coefficient of determination was high (R2 = 0.888), whereas in the recent subperiod, it declined to R2 = 0.580. This behavior primarily reflects the fact that mean annual water levels in Lake Mead during the recent subperiod are systematically lower for comparable water levels in Lake Powell, rather than differences in the form of the regression itself. The reduced coefficient of determination (R2) in the recent period indicates increased downstream variability, likely caused by additional processes affecting Lake Mead. One plausible explanation is increased water loss from Lake Mead due to enhanced evaporation under rising temperatures, combined with sustained water withdrawals. Although evaporation has also increased in Lake Powell, its upstream position, greater storage depth, and regulatory operation reduce the relative impact of these losses compared to downstream Lake Mead. Fully determining the causes of this concerning trend would require extensive additional data, which, unfortunately, were not available for this study.
3.4. Day-to-Day (DTD) Water-Level Variability
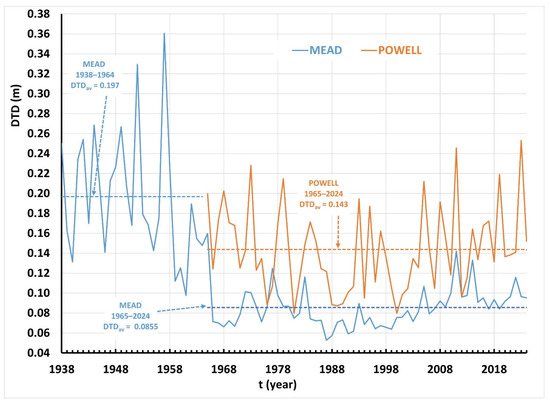
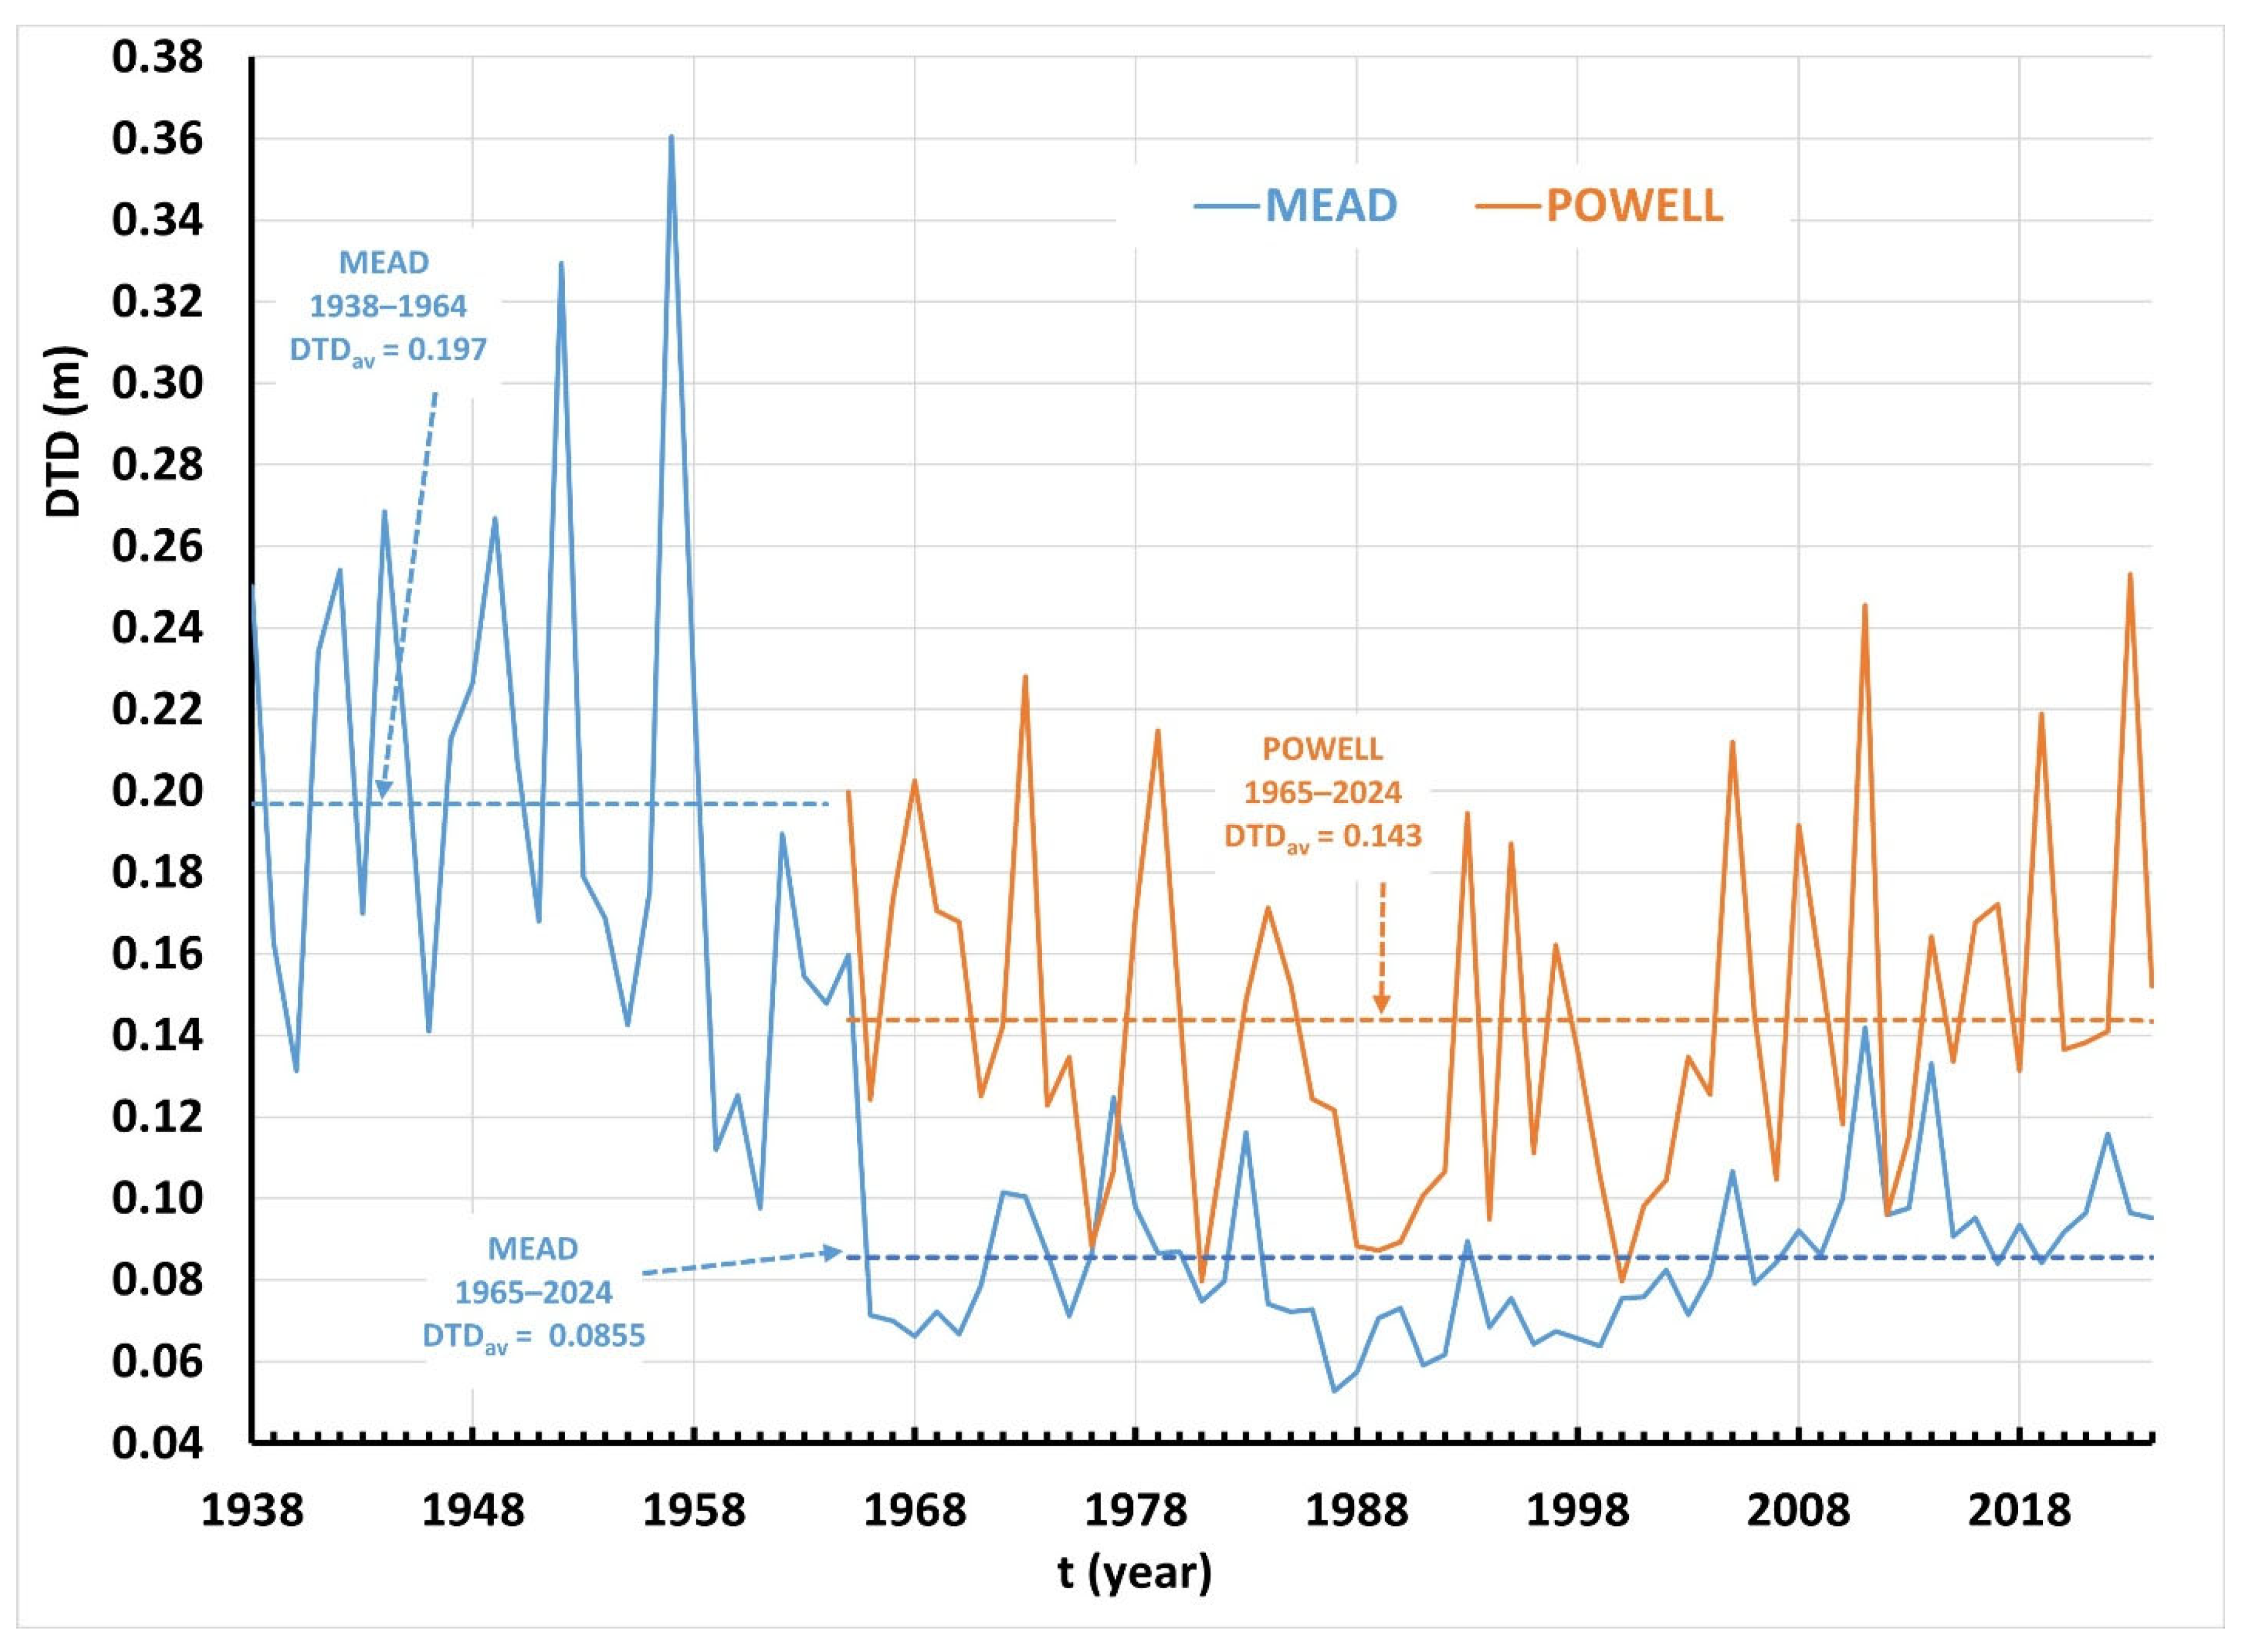
Figure 7 shows the annual DTD values for Lake Mead (1938–2024) and Lake Powell (1965–2024). The DTD series for Lake Mead clearly reflects the influence of Lake Powell operations on its hydrological regime. In the subperiod 1938–1964, the average DTD was 0.197 m. In the following subperiod, 1965–2024, it decreased significantly to 0.0855 m, with a t-test indicating a probability of p = 1.1 × 10⁻⁹. A statistically significant difference between the variances of the two adjacent subperiods was confirmed by the F-test (p = 9.0 × 10⁻¹³).
Figure 7.
Annual DTD values for Lake Mead (blue) for 1938–2024 and Lake Powell (brown) for 1965–2024.
For the DTD series of Lake Powell, the average value for 1965–2024 was 0.143 m, which is significantly higher than that for Lake Mead over the same period. It is important to note that neither series shows any increasing or decreasing trend during 1965–2024.
The DTD metric clearly demonstrates the impact of upstream Lake Powell operations on the hydrological regime of downstream Lake Mead. In this study, Lake Powell operations refer to the regulated releases from Glen Canyon Dam designed to meet downstream water-delivery obligations, hydropower generation requirements, and flow-stabilization objectives for Lake Mead and the Lower Colorado River Basin. These operations include annual and seasonal release scheduling that buffers interannual inflow variability from the upper basin and moderates downstream water-level fluctuations.
3.5. Water Level Index (SHI) as a Measure of Drought
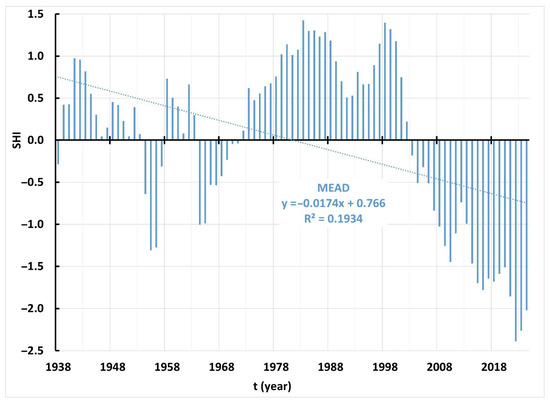
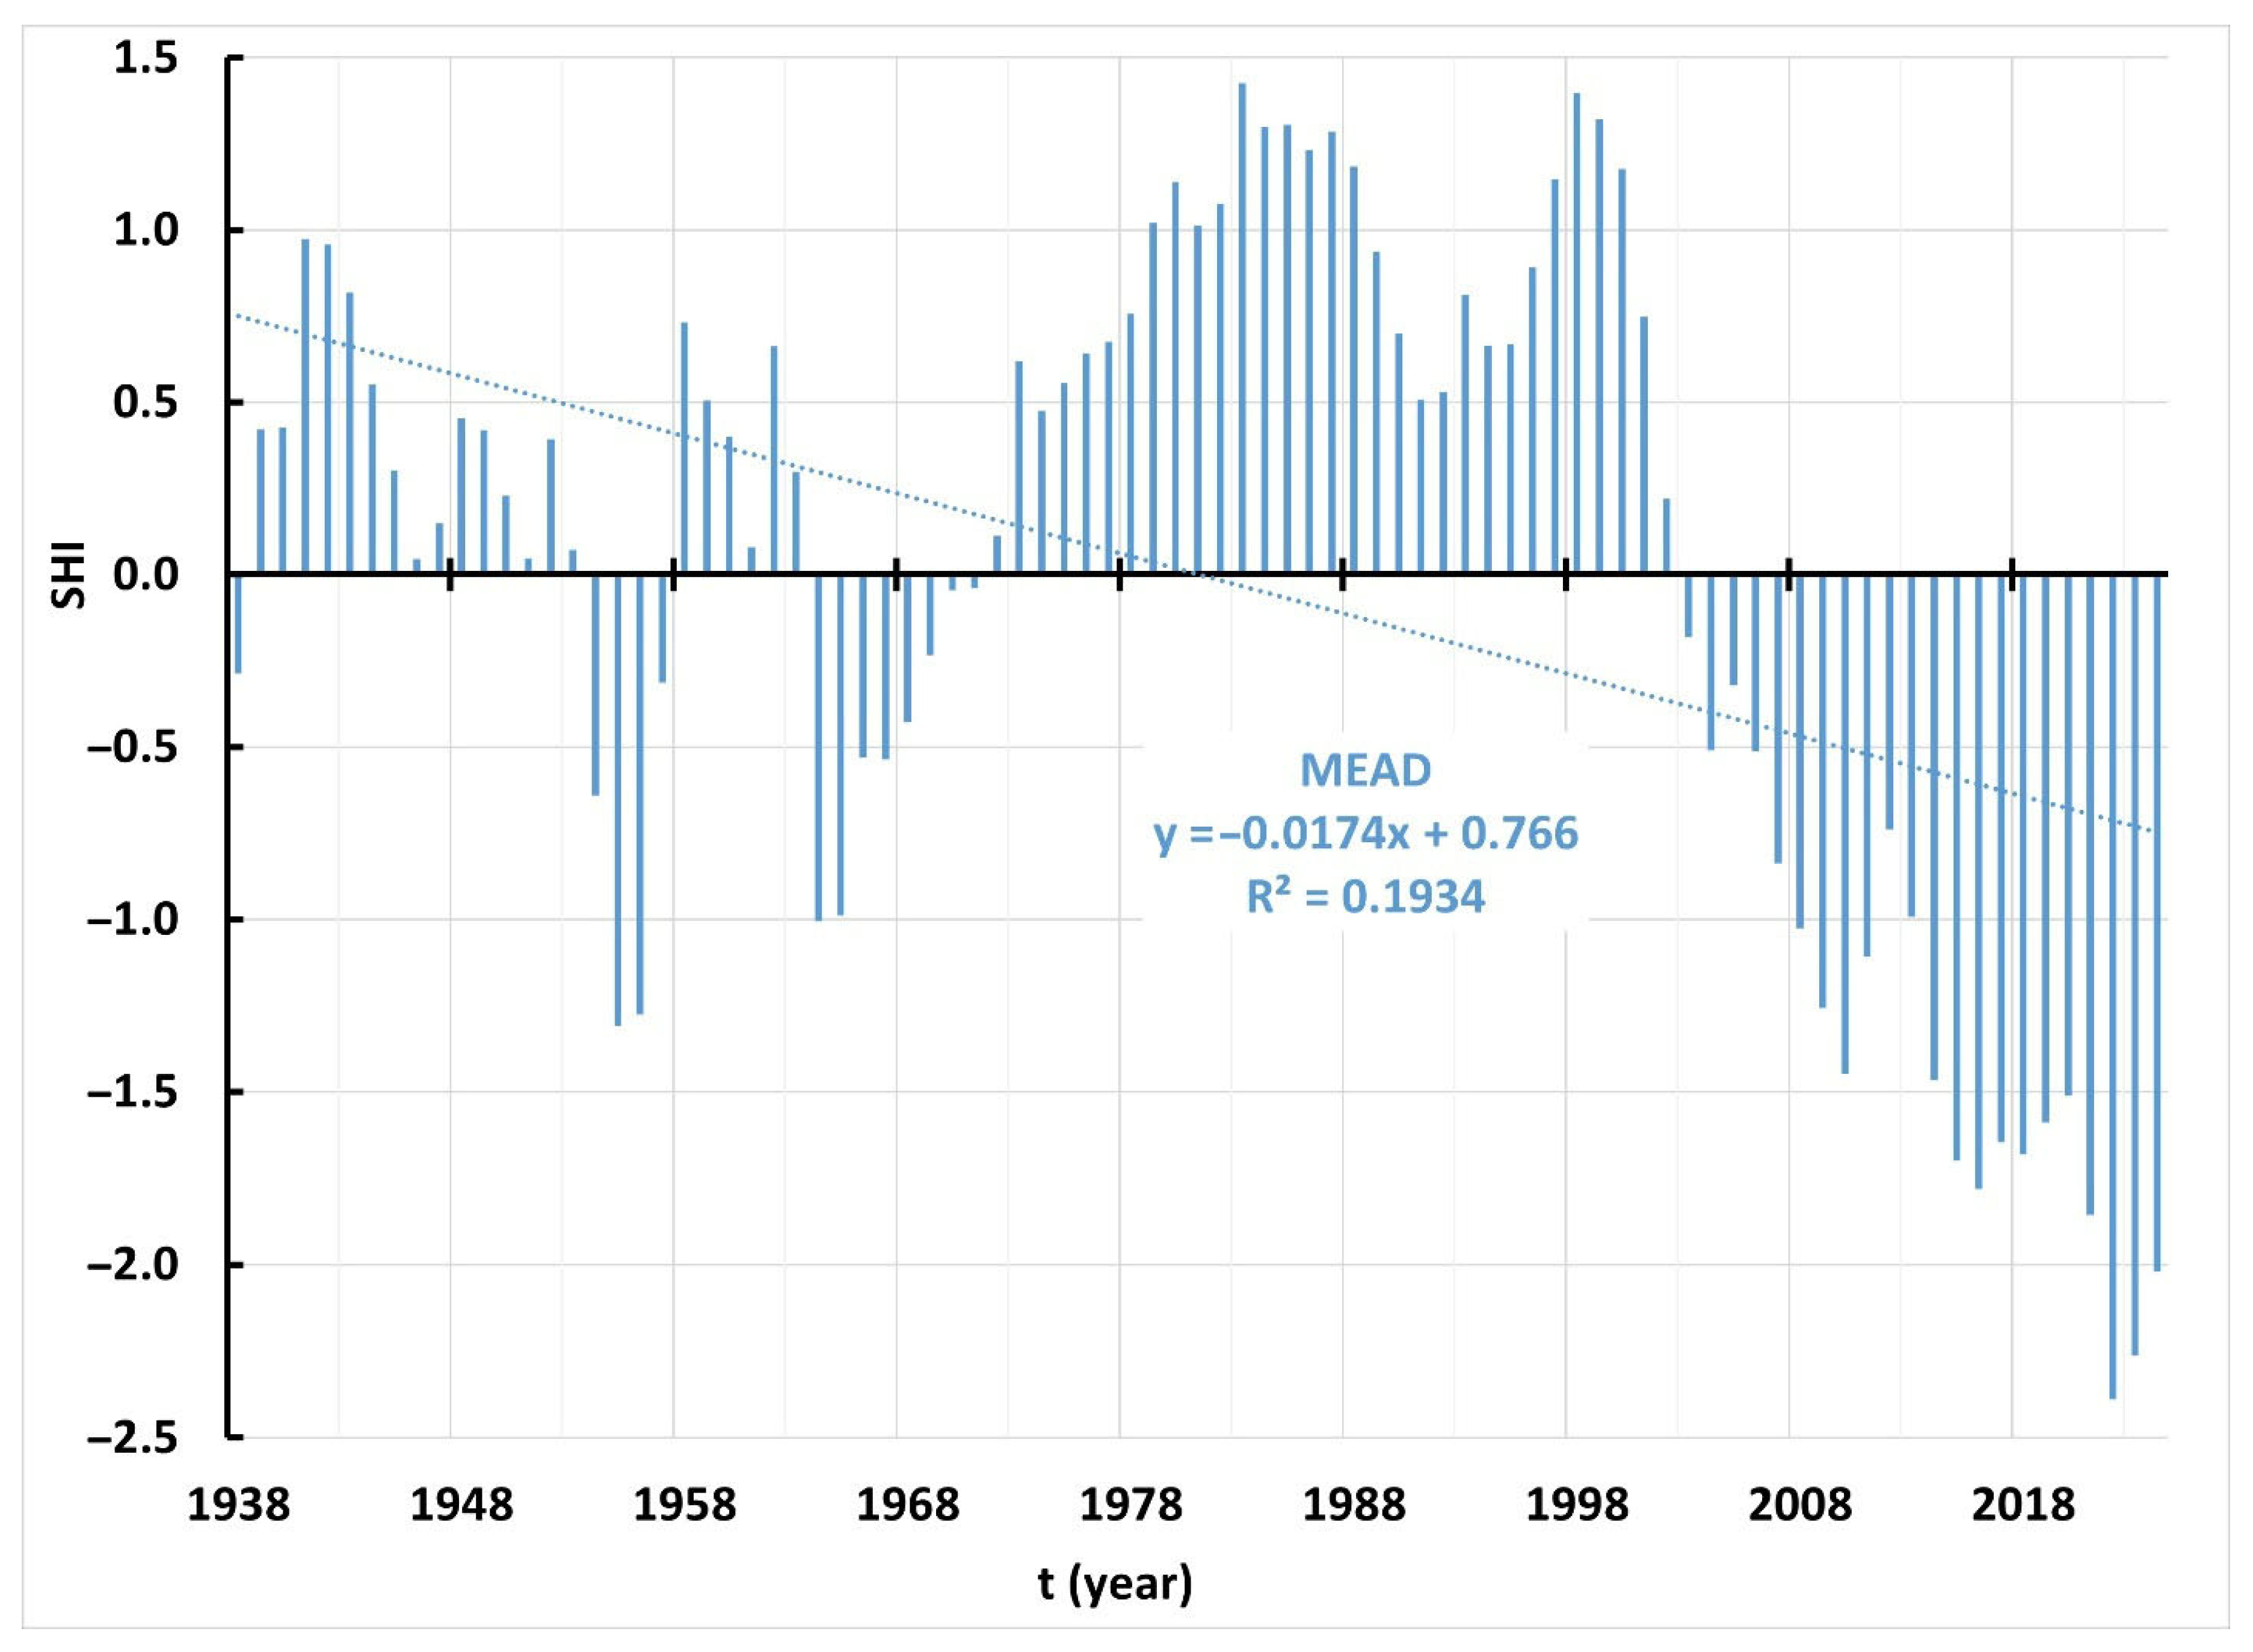
Figure 8 presents the SHI series for mean annual water levels in Lake Mead (1938–2024). A pronounced trend toward intensifying drought conditions begins around 2003. Over the last 22 years (2003–2024), three years exhibit extreme drought (SHI < −2.0), all occurring in the final three years of the record (2022–2024), with 2022 being the driest year.
Figure 8.
Annual values of the Standardized Hydrological Index (SHI) calculated for Lake Mead for the period 1938–2024.
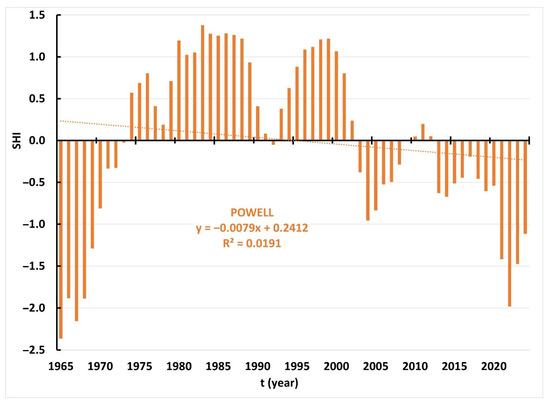
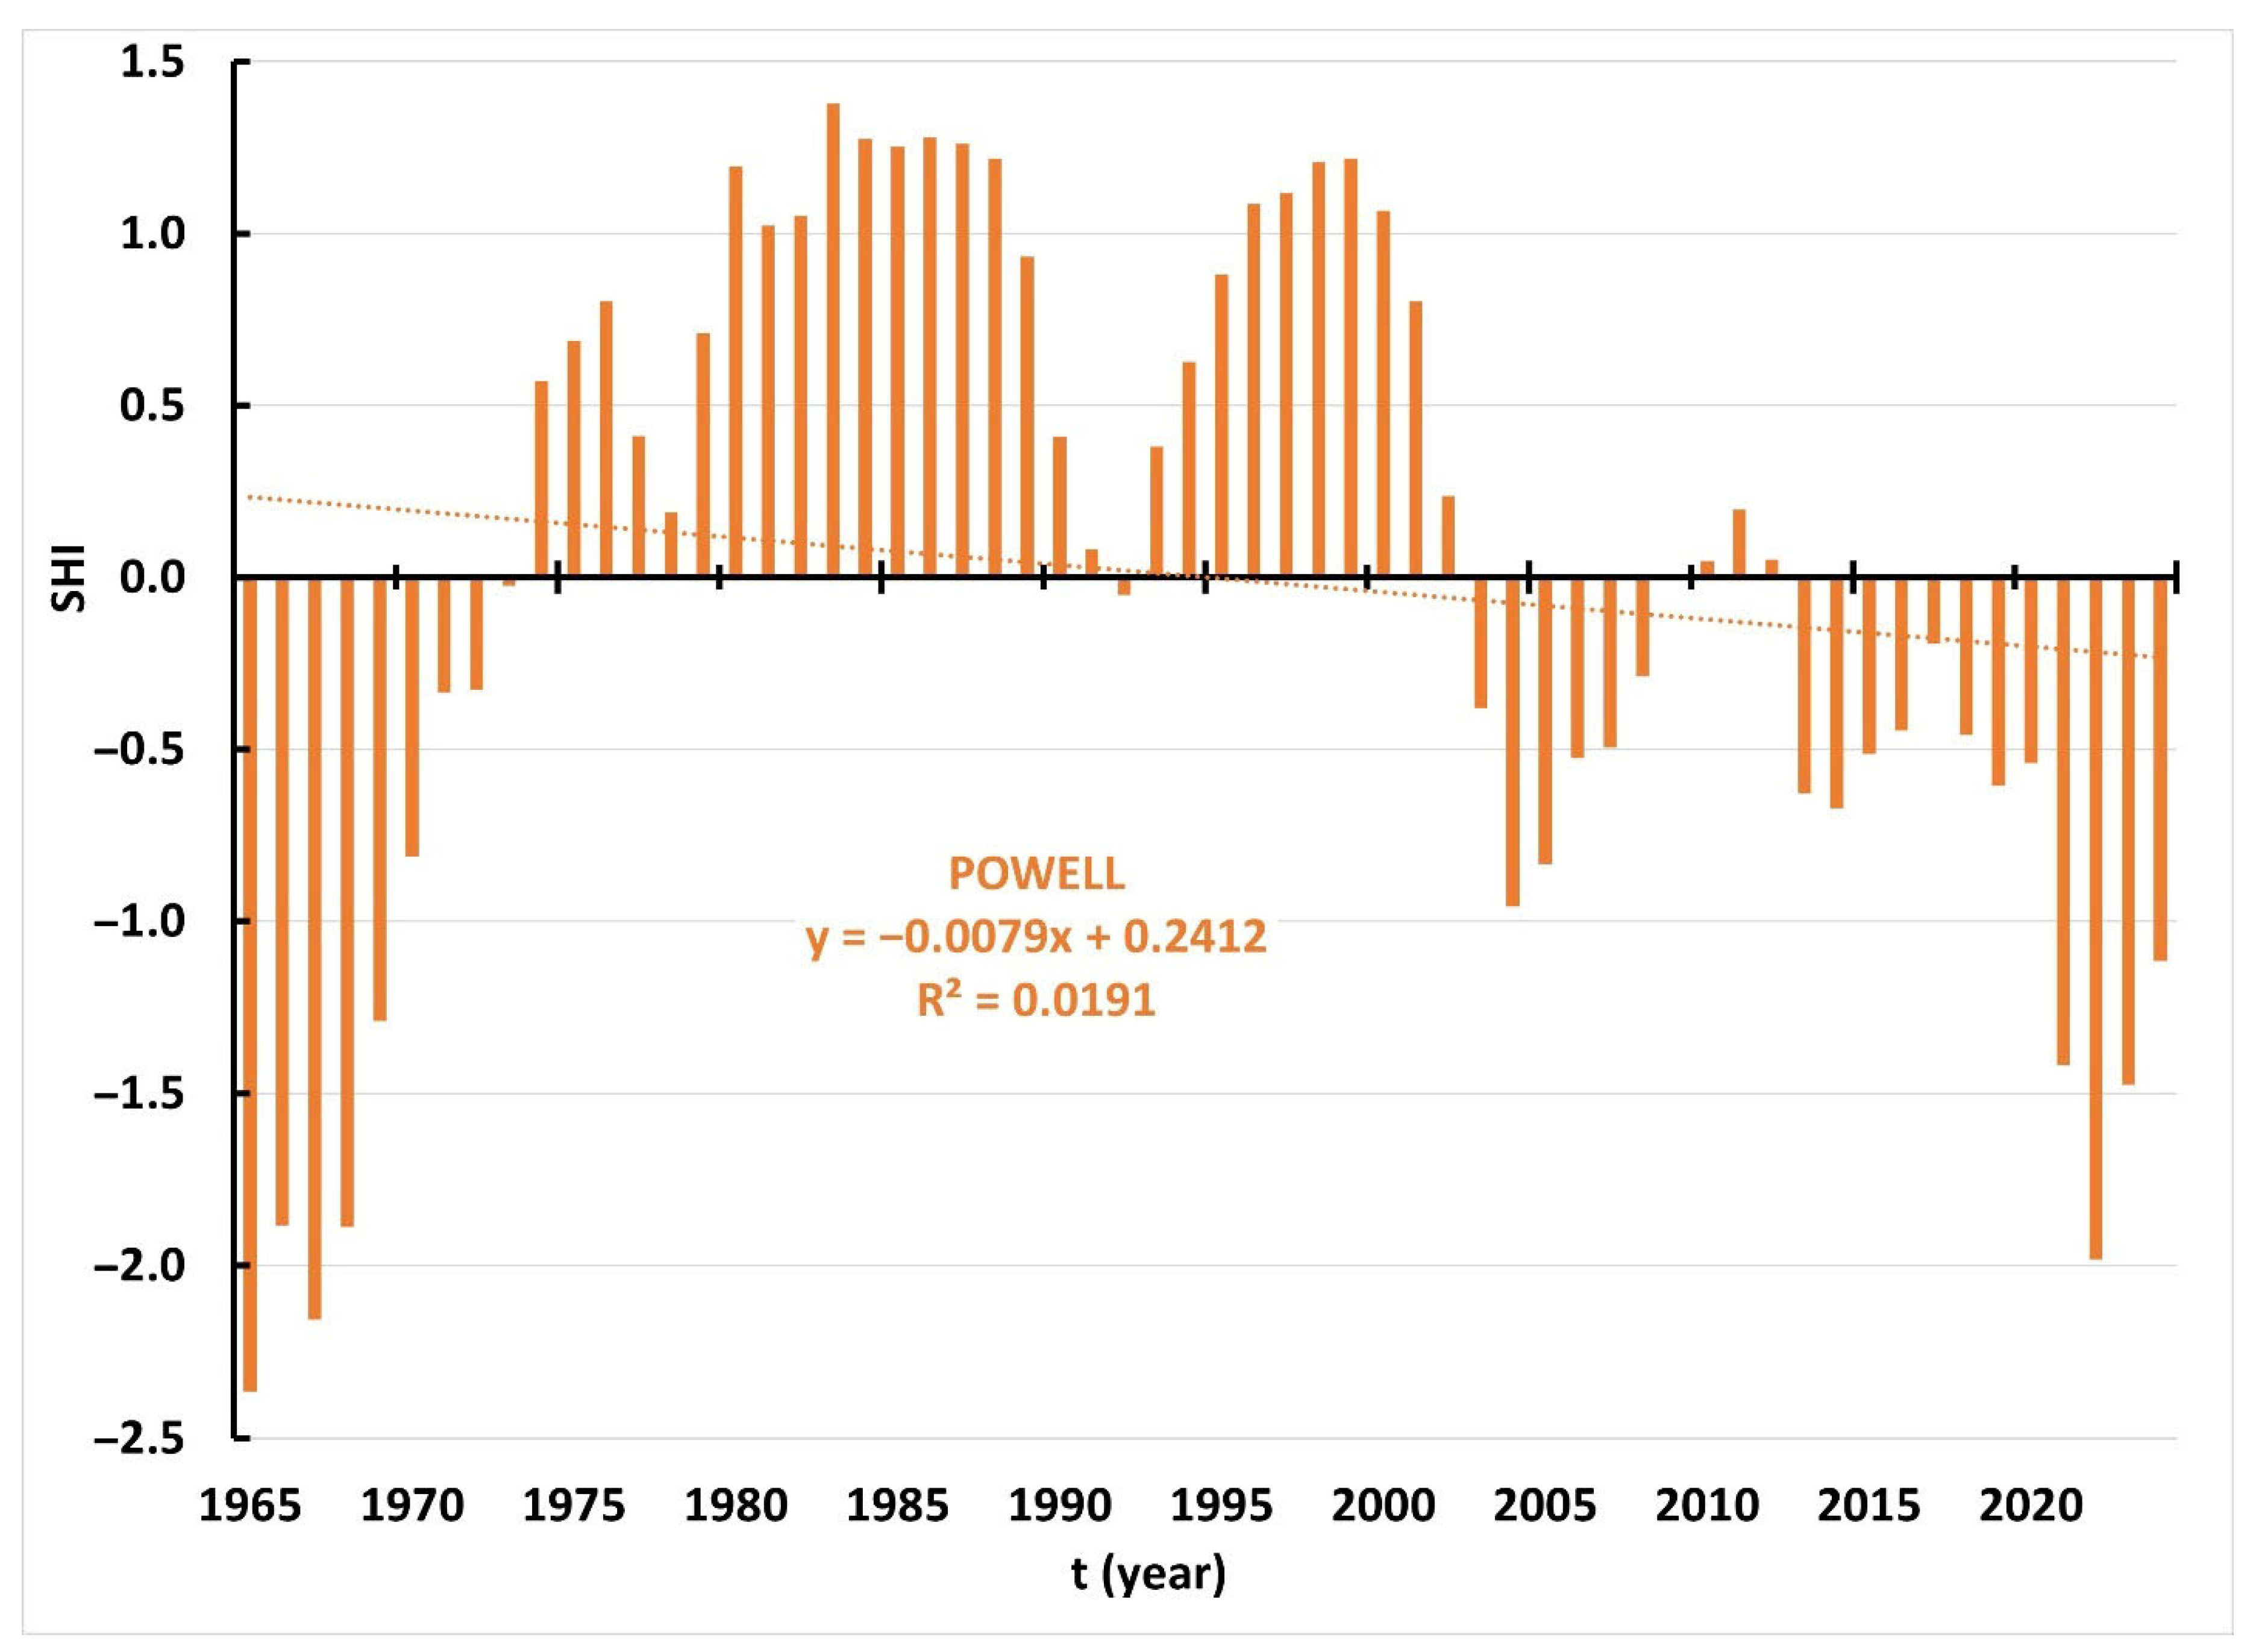
Figure 9 shows the SHI series for Lake Powell (1965–2024). The drought trend is present but somewhat less severe compared to Lake Mead.
Figure 9.
Annual values of the Standardized Hydrological Index (SHI) calculated for Lake Powell for the period 1965–2024.
3.6. Interpretation of Water-Management Implications
Quantitative results confirm that Lake Powell significantly regulates the downstream water-level variability in Lake Mead. After 1964, the mean annual water-level range in Lake Mead decreased from 12.10 m to 4.43 m, while mean DTD values declined from 0.197 m to 0.0855 m (p < 10−9), demonstrating effective damping of short-term and interannual fluctuations.
Despite this regulation, both reservoirs exhibit a statistically significant decline after 2003. SHI analysis indicates increasing drought severity, with extreme drought (SHI < 2.0) occurring only during 2022–2024. Regression results further show that Lake Mead levels in 2007–2024 are, on average, ~22 m lower for comparable Lake Powell levels than in 1964–2006, indicating increased system losses.
These results imply that while Lake Powell reduces variability, it cannot offset long-term climate-driven inflow reductions. The findings highlight the need to incorporate declining inflows, evaporation losses, and a demand reduction into post-2026 reservoir operating and allocation policies.
4. Conclusions and Recommendations for Further Analysis
The conducted analysis of water levels in Lake Mead and Lake Powell clearly confirms strong, long-term, and concerning declining trends, particularly after the beginning of the 21st century. Lake Mead Reservoir exhibits a markedly accelerated decrease in water levels, including the occurrence of extreme drought years after 2022. A similar pattern is observed in Lake Powell Reservoir, although the decline there is less pronounced. RAPS analysis indicates the existence of three statistically distinct subperiods in both reservoirs, with a clear and pronounced decline in the recent period (2003–2024). DTD variability confirms the regulatory influence of Lake Powell on the downstream Lake Mead, resulting in reduced daily fluctuations in water levels. The Standardized Hydrological Index (SHI) further confirms a significant intensification of droughts over the last two decades, indicating a long-term state of hydrological deficit.
Regression analysis between Lake Powell and Lake Mead water levels provides a data-driven indicator of long-term system coupling and structural regime shifts. While not intended as a predictive management tool in isolation, it reflects the combined influence of climatic variability, reservoir operations, evaporation, and consumptive water use, highlighting that the downstream efficiency of the reservoir cascade has changed over time. This empirical perspective complements process-based studies and underscores the multi-factor nature of hydrological responses in the Colorado River system, emphasizing that current water-management assumptions may no longer align with observed system dynamics. Overall, hydrological processes in the Colorado River basin are entering a new phase of climate-induced vulnerability, as also corroborated by international studies.
Recommendations for further analyses include the following:
- Detailed assessment of evaporation losses using a combination of satellite data and energy balance models.
- Quantification of sectoral water use and its relationship with declining reservoir levels.
- Climate–hydrological modeling of future inflows up to 2050 and 2100 under various emission scenarios.
- Hydrodynamic simulations of ecological floods to optimize sediment balance.
- In-depth analysis of changes in the snow regime and its impact on seasonal inflow patterns.
- Development of integrated water resources management models incorporating climatic, social, and institutional variables.
- Comparative analysis with other megadrought-affected river systems (e.g., Murray–Darling, Ebro).
- Evaluation of technical solutions to reduce evaporation losses.
- Analysis of transboundary policy scenarios and potential reforms post-2026.
- Modeling of minimum inflows required to maintain ecological stability in downstream areas.
Author Contributions
Conceptualization, O.B.; methodology, O.B. and T.R.-B.; software, O.B. and A.Ž.-Ć.; validation, A.Ž.-Ć. and T.R.-B.; formal analysis, O.B. and T.R.-B.; investigation, O.B. and A.Ž.-Ć.; data curation, O.B. and A.Ž.-Ć.; writing—original draft preparation, O.B.; writing—review and editing, A.Ž.-Ć.; visualization, O.B. and A.Ž.-Ć.; supervision, T.R.-B.; project administration, T.R.-B. All authors have read and agreed to the published version of the manuscript.
Funding
This research received no external funding.
Data Availability Statement
The original contributions presented in this study are included in the article. Further inquiries can be directed to the corresponding author.
Conflicts of Interest
The authors declare no conflicts of interest.
References
- U.S. Geological Survey–USGS. Water Resources of the Colorado River Basin; USGS Circular Series; U.S. Geological Survey–USGS: Reston, VA, USA, 2021.
- Graf, W.L. Dam Nation: A Geographic Census of American Dams and Their Large-Scale Hydrologic Impacts. Water Resour. Res. 1999, 35, 1305–1311. [Google Scholar] [CrossRef] [Scilit]
- Graf, W.L. Dam Nation: A Geographic History of American Dams and Their Impact on the Colorado River System; Yale University Press: New Haven, CT, USA, 2003. [Google Scholar]
- U.S. Bureau of Reclamation. Colorado River Basin Water Supply and Demand Study; U.S. Department of the Interior: Washington, DC, USA, 2012.
- U.S. Bureau of Reclamation. Hydrology, Water Accounting, and Climate Conditions in the Colorado River Basin; BOR Technical Report Series; U.S. Bureau of Reclamation: Washington, DC, USA, 2020.
- Udall, B. Climate Change is Shrinking the Colorado River; Colorado State University: Fort Collins, CO, USA, 2017; Available online: https://source.colostate.edu/climate-change-shrinking-colorado-river/ (accessed on 1 November 2025).
- Milly, P.C.D.; Dunne, K.A. Colorado River flow dwindles as warming-driven loss of reflective snow energizes evaporation. Science 2020, 367, 1252–1255. [Google Scholar] [CrossRef] [Scilit] [PubMed]
- Hazel, J.E., Jr.; Topping, D.J.; Schmidt, J.C. Influence of Glen Canyon Dam on Fine-Sediment Storage in the Colorado River; USGS Scientific Investigations Report; U.S. Geological Survey–USGS: Reston, VA, USA, 2006. Available online: https://pubs.usgs.gov (accessed on 1 November 2025).
- Schmidt, J.C.; Wilcock, P.R. Metrics for assessing the downstream effects of dams. Water Resour. Res. 2008, 44, W04404. [Google Scholar] [CrossRef] [Scilit]
- Kemper, J.T.; Knox, R.; Raffae, M.; Schulz, E.; Bailey, R.T.; Morrison, R.R.; Wohl, E. Estimating catchment-scale sediment storage in a large river basin, Colorado River, USA. River Res. Appl. 2024, 40, 1379–1392. [Google Scholar] [CrossRef] [Scilit]
- Salter, G.; Mueller, E.; Grams, P.E. Reservoir operational strategies for sustainable sand management model code and input data for Lake Powell, Lake Mead, and the Colorado River in Grand Canyon, Arizona. US Geol. Surv. (USGS) Data Release 2025, 834S. [Google Scholar] [CrossRef]
- Grams, P.E.; Topping, D.J.; Salter, G.; Chapman, K.; Tusso, R.B.; Mueller, E.R. Implementation of controlled floods for sediment management in Lake Powell. River Res. Appl. 2025, 41, 334–348. [Google Scholar] [CrossRef] [Scilit]
- Udall, B.; Overpeck, J. The twenty-first century Colorado River hot drought and implications for the future. Water Resour. Res. 2017, 53, 2404–2418. [Google Scholar] [CrossRef] [Scilit]
- Williams, A.P.; Cool, E.R.; Smerdon, J.E.; Cook, B.I.; Abatziglu, J.T.; Bolles, K.; Baek, S.H.; Badger, A.M.; Livneh, B. Large contribution from anthropogenic warming to an emerging North American megadrought. Science 2020, 368, 314–318. [Google Scholar] [CrossRef] [Scilit]
- Hannoun, D.; Tietjen, T. Lake management under severe drought: Lake Mead, Nevada/Arizona. JAWRA J. Am. Water Resour. Assoc. 2023, 59, 416–428. [Google Scholar] [CrossRef] [Scilit]
- McCabe, G.J.; Wolock, D.M.; Gangopadhyay, S. Past and projected future droughts in the Upper Colorado River Basin. Geophys. Res. Lett. 2024, 51, e2023GL107978. [Google Scholar] [CrossRef] [Scilit]
- Grigg, N.S. Colorado River Basin: Conflict management under hydrologic stress and institutional gridlock. Int. J. River Basin Manag. 2025, 23, 45–53. [Google Scholar] [CrossRef] [Scilit]
- Dawadi, S.; Ahmad, S. Changing climatic conditions in the Colorado River Basin: Implications for water resources management. J. Hydrol. 2012, 430–431, 127–141. [Google Scholar] [CrossRef] [Scilit]
- Fleck, J.; Udall, B. Managing Colorado River risk. Science 2021, 372, 885. [Google Scholar] [CrossRef] [Scilit] [PubMed]
- Juricich, R. Colorado River Basin: Governance, decision-making, and alternative approaches. J. Water Resour. Plan. Manag. 2022, 148, 02522004. [Google Scholar] [CrossRef] [Scilit]
- Abdelmohsen, K.; Famiglietti, J.S.; Ao, Y.Z.; Mohajer, B.; Chandanpurkar, H. Declining Freshwater Availability in the Colorado River Basin Threatens Sustainability of Its Critical Groundwater Supplies. Geophisical Res. Lett. 2025, 52, e2025GL115593. [Google Scholar] [CrossRef] [Scilit]
- Barnett, T.P.; Pierce, D.W. When will Lake Mead go dry? Water Resour. Res. 2008, 44, W03201. [Google Scholar] [CrossRef] [Scilit]
- Christian-Smith, J.; Gleick, P.H.; Cooley, H. Effects of climate change on the Colorado River system. Clim. Change 2015, 132, 123–135. [Google Scholar] [CrossRef] [Scilit]
- Booker, J.F. Colorado River Water Use and Climate: Model and Application. J. Am. Water Resour. Assoc. 2022, 58, 673–689. [Google Scholar] [CrossRef] [Scilit]
- Pierce, D.W.; Cayan, D.R.; Goodrich, J.; Das, T.; Munévar, A. Evaluating global climate models for hydrological studies of the upper Colorado river basin. J. Am. Water Resour. Assoc. 2022, 58, 709–734. [Google Scholar] [CrossRef] [Scilit]
- Bureau of Reclamation. Colorado River Post-2026 Operations–BRCRO (2023). Available online: https://www.usbr.gov/ColoradoRiverBasin/post2026/index.html (accessed on 19 November 2025).
- Wang, B.; Bass, B.; Hall, A.; Rahimi, H.; Huang, K. Disentangling climate and policy uncertainties for the Colorado River post-2026 operations. Nat. Commun. 2025, 16, 8625. [Google Scholar] [CrossRef] [Scilit]
- Chaddock, R.E. Principles and Methods of Statistics; Houghton Mifflin: Cambridge, UK, 1925; p. 471. [Google Scholar]
- Borovskaya, R.; Krivoguz, D.; Chernyi, S.; Kozhurin, E.; Khorosheltseva, V.; Zinchenko, E. Surface water salinity evaluation and identification for using remote sensing data and machine learning approach. J. Mar. Sci. Eng. 2022, 10, 257. [Google Scholar] [CrossRef] [Scilit]
- Garbrecht, J.; Fernandez, G.P. Visualization of trends and fluctuations in climatic records. Water Resour. Bull. 1994, 30, 297–306. [Google Scholar] [CrossRef] [Scilit]
- Bonacci, O. Analysis of Long-Term (1878–2004) Mean Annual Discharges of the Karst Spring Fontaine de Vaucluse (France). Acta Carsologica 2007, 36, 151–156. [Google Scholar] [CrossRef] [Scilit]
- McGhee, J.W. Introductory Statistics; West Publishing Company: St Paul, MN, USA, 1985; p. 650. [Google Scholar]
- Bonacci, O.; Roje-Bonacci, T. Hydrological analysis of water level and discharge series of the Sava River at the Zagreb gauging station. Hrvat. Vode 2023, 31, 173–184. [Google Scholar]
- Karl, T.R.; Knight, R.W.; Plummer, N. Trends in high-frequency climate variability in the twentieth century. Nature 1995, 377, 217–220. [Google Scholar] [CrossRef] [Scilit]
- Gough, W.A. Theoretical considerations of day-to-day temperature variability applied to Toronto and Calgary, Canada data. Theor. Appl. Climatol. 2008, 94, 97–105. [Google Scholar] [CrossRef] [Scilit]
- Tam, B.Y.; Gough, W.A. Examining past temperature variability in Moosonee Thunder Bay, and Toronto, Ontario, Canada through a day-to-day variability framework. Theor. Appl. Climatol. 2012, 110, 103–113. [Google Scholar] [CrossRef] [Scilit]
- Gough, W.A.; Hu, Y. Day-to-day temperature variability for four urban areas in China. Urban Clim. 2016, 17, 80–88. [Google Scholar] [CrossRef] [Scilit]
- Vicente-Serrano, S.M.; Beguería, S.; López-Moreno, J.I. A multiscalar drought index sensitive to global warming: The standardized precipitation evapotranspiration index—SPEI. J. Clim. 2010, 23, 1696–1718. [Google Scholar] [CrossRef] [Scilit]
- Barker, L.J.; Hannaford, J.; Chiverton, A.; Svensson, C. From meteorological to hydrological drought using standardised indicators. Hydrol. Earth Syst. Sci. 2016, 20, 2483–2505. [Google Scholar] [CrossRef] [Scilit]
- Nalbantis, I.; Tsakiris, G. Assessment of hydrological drought revisited. Water Resour. Manag. 2007, 23, 881–897. [Google Scholar] [CrossRef] [Scilit]

Disclaimer/Publisher’s Note: The statements, opinions and data contained in all publications are solely those of the individual author(s) and contributor(s) and not of MDPI and/or the editor(s). MDPI and/or the editor(s) disclaim responsibility for any injury to people or property resulting from any ideas, methods, instructions or products referred to in the content. |
© 2026 by the authors. Licensee MDPI, Basel, Switzerland. This article is an open access article distributed under the terms and conditions of the Creative Commons Attribution (CC BY) license.