


Abstract
High wind and photovoltaic (PV) penetration reshapes intra-annual residual energy demand and changes hydropower generation space and operating patterns. Conventional medium- to long-term scheduling methods struggle to coordinate renewable-energy integration, supply reliability, and seasonal hydropower utilization. This study proposes a medium- to long-term cascade stored-energy dispatch-chart method under high-renewable penetration and derives the corresponding dispatch charts. A generation-space quantification model is developed for cascade hydropower, considering renewable-energy integration and thermal minimum-output constraints. The model describes how renewable expansion compresses hydropower generation space across planning years. Four key control points are then identified, including the end of drawdown, flood-season end, impoundment completion, and year-end. Stagewise recursion and closed-loop iteration are used to determine suitable stored-energy ranges at these points. Upper and lower envelopes of multi-scenario stored-energy trajectories are further used to construct a zoned dispatch chart. Generation-adjustment rules are then formulated according to the identified stored-energy zone. The method is validated using nine cascade hydropower stations in the Wujiang River Basin under a 2035 high-renewable scenario. Results show that hydropower generation-space contraction occurs mainly from the pre-flood period to the flood season. In April and May 2035, the upper bound of Wujiang cascade generation space falls to 19% to 24% of installed capacity. The end-of-drawdown control point should therefore be advanced from late April to late March. With the proposed dispatch chart, total cascade generation under the 2035 normal inflow increases from 27.80 to 28.45 TWh. Renewable-energy curtailment decreases from 2.43 to 1.22 TWh, a reduction of 49.8%. The proposed method converts complex operating boundaries into practical zonal stored-energy control rules. It supports medium- to long-term cascade hydropower operation under high-renewable penetration.
1. Introduction
Large-scale integration of wind, PV, and other renewables is reshaping power-system generation portfolios and operating patterns. Because renewable output depends strongly on weather, it is variable, uncertain, and intermittent. As renewable penetration rises, operation must coordinate power and energy across monthly, seasonal, and annual time scales. This challenge is especially acute during flood-to-dry-season transitions and periods of high-renewable output, when supply reliability and renewable-energy integration may conflict.
Hydropower units can start and stop rapidly, adjust output flexibly, and shift energy over time. Hydropower is therefore a key resource for smoothing renewable variability and supporting system flexibility. In cascade hydropower systems with seasonal or multiyear regulation, reservoir stored energy reallocates water energy across seasons. Large-scale wind and PV integration, however, can make hydropower output overlap with renewable output during the flood season. This increases competition for transmission capacity and raises curtailment risk. In the dry season, low hydropower output may coincide with low renewable output, increasing supply-reliability pressure. The core issue is the temporal mismatch between hydropower generation and renewable-output profiles. The leading reservoir can store part of flood-season inflow and release it during the dry season. This reduces transmission competition and improves peak-supply capability. Conventional medium- to long-term scheduling remains hydropower-centered and generation-oriented. It rarely accounts for the need to reserve generation space for renewables. As a result, it cannot actively adjust stored-energy drawdown timing in response to residual energy demand.
Operating rules bridge optimization models and real-world reservoir operation by translating optimization results into practical operating plans. For hydropower station groups, these rules are usually represented by dispatch charts or dispatch functions. They determine generation and release decisions from system states such as water level, inflow, and stored energy. Early studies focused on rule curves for individual reservoirs and joint operating rules for cascade reservoirs. Labadie (2004) [1] reviewed linear programming, dynamic programming, stochastic optimization, and intelligent algorithms for multireservoir operation. The review identified the gap between high-dimensional nonlinear modeling and practical operation as a key challenge. Chang et al. (2005) [2] applied genetic algorithms to reservoir rule-curve optimization. Chen et al. (2007) [3] used multiobjective genetic algorithms to coordinate water-supply and hydropower objectives. For cascade reservoirs, Liu et al. (2011) [4] derived aggregation-based joint rule curves by combining deterministic long-term optimization, rule-curve identification, and simulation optimization. Taghian et al. (2014) [5], Li et al. (2019) [6], and Ara et al. (2022) [7] further improved operating rules using hedging-rule coupling, multiobjective algorithms, and intelligent optimization. Together, these studies established operating rules as a core tool for reservoir operation and laid the foundation for more complex cascade rules.
As coordinated cascade operation has become more important, research has shifted from reservoir-specific control lines to the aggregate energy state of the cascade. The cascade stored-energy dispatch chart has therefore emerged as a rule-based tool for cascade hydropower operation. Unlike conventional water-level dispatch charts, it uses a unified stored-energy index to represent water level, storage, and output relationships. This index describes the cascade energy state more directly and helps operators identify operating zones and develop generation plans. Liu et al. (2011) [4] helped convert optimized trajectories into implementable joint operating rules through deterministic long-term optimization and rule-curve identification. Li et al. (2014) [8] used genetic programming to identify operating rules for multireservoir hydropower systems. They found that stored-energy variables describe hydropower decisions more effectively than water-volume variables alone. Ji et al. (2014) [9] used support vector regression to describe nonlinear relationships among optimized decisions, inflow, water levels, and stored-energy states. Jiang et al. (2016) [10] developed a discriminant-coefficient framework for stored-energy dispatch charts. The framework coordinates total cascade output, inter-station allocation, and the storage-release sequence. Jiang et al. (2018) [11] improved computational efficiency using a multistage progressive optimality algorithm and verified its applicability to large cascade systems. These studies advanced cascade operating rules from individual-reservoir water-level curves to joint dispatch charts based on aggregate stored energy.
Recent studies have extended operating-rule research to hydro–wind–PV complementary systems. Ding et al. (2024) [12] investigated forecast-informed long-term operating rules for a hydro–wind–PV system. They found that adding forecast information to rule parameters can improve operational benefits. Ming et al. (2019) [13] examined hydropower reservoir reoperation for large-scale PV integration. They argued that conventional rules should be reconsidered as PV penetration increases. Su et al. (2023) [14] proposed a rule-development method for long-term optimal scheduling of cascade hydro–wind–PV systems under transmission-corridor constraints. Zhang et al. (2019) [15] studied coordinated operation of integrated hydro–wind–solar systems and highlighted hydropower’s role in smoothing wind and solar variability. Lu et al. (2024) [16] proposed a medium- to long-term interval optimal scheduling method for hydro–PV systems under multiple uncertainties. Lin et al. (2024) [17] linked long-term multiobjective optimization with short-term peak-shaving needs in large cascade hydro–wind–PV systems. Tian et al. (2025) [18] further proposed a long-term scheduling method that considers comprehensive water-use requirements and load characteristics.
Broader reservoir-operation research provides a complementary methodological foundation. State-of-the-art reviews summarized reservoir management and multireservoir operation models [19], while operating-rule formulations and simulation-optimization frameworks established practical ways to handle coupled reservoir decisions [20,21,22]. Recent work has continued to improve hydropower multireservoir rule curves using advanced optimization methods [23].Renewable–hydropower coordination has also been examined at shorter time scales. Wind–hydro studies addressed storage sizing and plant operation [24] and daily scheduling [25], and stochastic optimization was later applied to wind-farm and pumped-hydro storage operation [26]. More recent studies investigated short-term cascade hydro-PV operation [27], vibration-avoidance strategies for cascade hydro-wind-PV generation [28], multistage transmission-section restrictions in hydro-wind-solar scheduling [29], and multiobjective wind-PV-hydro complementary operation [30].
Although these studies have advanced operating rules for hydro–wind–PV systems, two limitations remain. First, most studies focus on individual reservoirs and source-side complementarity between one hydropower station and its wind–PV base. The resulting rules mainly support single-reservoir decisions and do not describe cascade-scale stored-energy coordination. Second, most studies adopt a project-level generation-side perspective. They maximize generation or minimize curtailment within a wind–PV base and use hydropower mainly to smooth local renewable variability. Few studies adjust annual stored-energy drawdown for cascade hydropower from the perspective of system-wide power balance and renewable-energy integration. Existing methods therefore do not explain how key control points and boundaries of a cascade stored-energy dispatch chart should respond to renewable expansion. Clarifying this response is essential for shifting hydropower from passive adaptation to proactive support for system-wide renewable-energy integration.
To address these issues, this study proposes a method for constructing medium- to long-term cascade stored-energy dispatch charts under high-renewable penetration. The method quantifies renewable-driven compression of hydropower generation space, adjusts key control points, and derives zonal dispatch rules through trajectory simulation and envelope construction. The main contributions are as follows. (1) A generation-space quantification model is developed that considers renewable-energy integration and thermal minimum-output constraints. (2) A dynamic mechanism identifies stored-energy control ranges at key control points through stagewise recursion, year-end verification, and closed-loop iteration. (3) A chart-construction framework integrates control-point identification, period-specific scheduling simulation, and dispatch-line generation for multiple inflow scenarios. The method is evaluated using nine cascade stations in the Wujiang River Basin. The evaluation focuses on hydropower utilization efficiency and renewable-energy integration.
2. Methodology
High renewable penetration compresses the generation space available to hydropower. This compression results from wind and PV output and the minimum technical output of thermal units. Conventional cascade stored-energy rules may therefore fail to satisfy grid-side power-balance and renewable-energy integration requirements. This study dynamically identifies key stored-energy control points and quantifies their control ranges. A medium- to long-term cascade stored-energy dispatch chart is then constructed for multiple inflow scenarios.
(1) Quantification of cascade hydropower generation space: Based on power and energy balance, the upper and lower bounds of hydropower generation space are calculated using load demand, renewable output, and thermal minimum output. The results describe how renewable generation compresses hydropower generation space and support the determination of stored-energy control boundaries.
(2) Determination of stored-energy control ranges at key control points: The end of drawdown, flood-season end, impoundment completion, and year-end are identified as key control points. Stagewise recursion and closed-loop iteration are used to determine appropriate stored-energy ranges at these points. This establishes an adaptive mechanism through which control points respond to hydropower generation-space changes.
(3) Construction and application of the stored-energy dispatch chart: Upper and lower envelopes of multi-scenario stored-energy trajectories are used to develop zonal dispatch rules. A generation-adjustment method is then proposed based on stored-energy zone identification.
2.1. Quantification of Hydropower Generation Space
Cascade hydropower generation space provides the basis for determining stored-energy control boundaries under high-renewable penetration. The feasible hydropower-output range is governed by hydrologic conditions and unit characteristics. It is also constrained by renewable output and the operating boundaries of thermal and other power sources. This section therefore proposes a power- and energy-balance method to quantify the upper and lower bounds of hydropower generation space. Definitions of key terms are provided in Appendix A.
2.1.1. Upper Bound of Generation Space
The upper bound of generation space is the maximum hydropower output that can be accommodated after wind and PV output and the minimum output of thermal and other sources are subtracted from system load demand. The installed-capacity limit of the cascade hydropower system is also considered.
where is the upper bound of hydropower generation space; is the grid load; is the renewable-output trajectory; is the minimum output of thermal and other power sources; is the conversion coefficient for maximum cascade generation space, generally defined as the ratio of cascade installed capacity to total system hydropower installed capacity. is the maximum available output of hydropower station , generally taken as the installed capacity of station .
2.1.2. Lower Bound of Generation Space
The lower bound of generation space is the minimum hydropower output required to ensure system energy supply and meet comprehensive water-use requirements.
where is the lower bound of hydropower generation space; is the grid load curve; is the maximum output of thermal and other power sources, generally taken as their total installed capacity; and is the minimum required output of hydropower station , generally taken as the mandatory output required to meet comprehensive water-use requirements.
2.2. Period-Specific Scheduling Strategy
Cascade stored energy changes across operating stages within the year. During the non-flood season, the leading reservoir supplements downstream stations, and cascade stored energy declines. During the flood season, increased inflow allows the leading reservoir to store water, causing cascade stored energy to rise. Based on these transition points, this study selects four key control points. Their stored-energy control ranges serve as the core boundaries for period-specific scheduling and dispatch-chart construction:
(1) End of drawdown: determines the drawdown strategy and supply-reliability capability, and directly affects flood-season spill risk;
(2) Flood-season end: represents the maximum stored-energy level reached during the flood season and reflects inflow utilization and flood-control compliance;
(3) Impoundment completion: represents the stored-energy state after replenishment during the flood-to-dry transition and determines initial dry-season water availability;
(4) Year-end: determines generation capability and system regulation space for the following dry season.
These control points divide the hydrologic-year scheduling cycle into three periods: balanced drawdown, passive rising, and active adjustment. The scheduling strategy and stored-energy recursion relationship for each period are described below.
(1) Balanced Drawdown Period:
The balanced drawdown period extends from the beginning of the year to the end of drawdown. During this period, cascade stored energy declines from its initial value to the drawdown target. The leading reservoir mainly supplements downstream stations, while downstream stations maintain stable generation. Monthly generation is determined by natural-inflow generation capability and stored-energy changes:
where is the known initial cascade stored energy; is the cascade stored energy at the end of drawdown; and is the drawdown duration. is the total number of days from the beginning of the year to the end of drawdown; is the number of days in month . is the generation capability from natural inflow in month ; is the scheduled cascade generation in month t; and is the maximum monthly cascade generation. The remaining variables are defined above.
The model must satisfy the main operational constraints of cascade reservoirs, including water balance, hydraulic connection, reservoir water level, release discharge, generation discharge, output limits, and system boundaries.
- ①
- Water-balance constraintwhere and are the initial storage volumes of hydropower station in periods and , respectively; is the release discharge of station in period ; is the inflow to station in period ; and is the duration of the period.
- ②
- Hydraulic-connection constraintwhere is the inflow to hydropower station in period ; is the release discharge from upstream station after the water travel time; is the water travel time; and is the intervening inflow to station in period .
- ③
- Reservoir water-level constraintwhere is the reservoir water level of hydropower station in period ; and are its lower and upper bounds, respectively.
- ④
- Release-discharge constraintwhere and are the lower and upper bounds of release discharge for hydropower station in period , respectively. Each station must satisfy the minimum downstream ecological-flow requirement in this study.
- ⑤
- Turbine-discharge constraintwhere and are the lower and upper bounds of the generation discharge of hydropower station in period , respectively.
- ⑥
- Station-output constraintwhere and are the lower and upper bounds of hydropower output for station in period , respectively. The upper bound is generally limited by the transmission corridor.
- ⑦
- Transmission-corridor constraintwhere is the hydropower output of station in period (MW); is the renewable output (wind and PV) integrated at station in period (MW); and is the capacity limit of the system transmission corridor (MW). In this study, it is the capacity limit of the existing hydropower transmission corridor.
- ⑧
- Generation-shape constraintwhere and are the hydropower outputs of station in periods and , respectively; and is the maximum allowable output variation of the station. The generation-shape constraint must be met during the dry season.
- ⑨
- Allowable control deviation for end-of-drawdown water levelwhere and are the calculated and predefined water levels at the end of drawdown during the reservoir scheduling period, respectively; and is the allowable control deviation of the end-of-drawdown water level.
(2) Passive Rising Period:
The passive rising period runs from the end of drawdown to the flood-season end. During this period, flood-season inflows are concentrated, while renewable output compresses hydropower generation space. Cascade stored energy therefore evolves passively with natural inflow and system residual energy demand. End-of-month cascade stored energy is updated recursively from stored energy at the end of drawdown, natural-inflow generation capability, and actual cascade generation:
where is the monthly generation of the cascade; is the monthly generation capability from cascade natural inflow; and is the maximum monthly generation capability of downstream cascade stations excluding the leading station. and are the cascade stored energy at the end of months and , respectively.
(3) Active Adjustment Period:
The active adjustment period extends from the flood-season end to year-end. It includes a flood-to-dry transition period and a dry season, separated by impoundment completion. During the transition period, water levels are raised to maintain the stored-energy level reached at the flood-season end. During the dry season, cascade stored energy is adjusted gradually toward the year-end target:
(a) Flood-to-dry transition period
(b) Dry season
where is the target cascade stored energy at year-end; is the cascade stored energy at the end of the flood season; and is the duration of stored-energy adjustment. The remaining variables are defined above.
2.3. Construction of the Stored-Energy Dispatch Chart
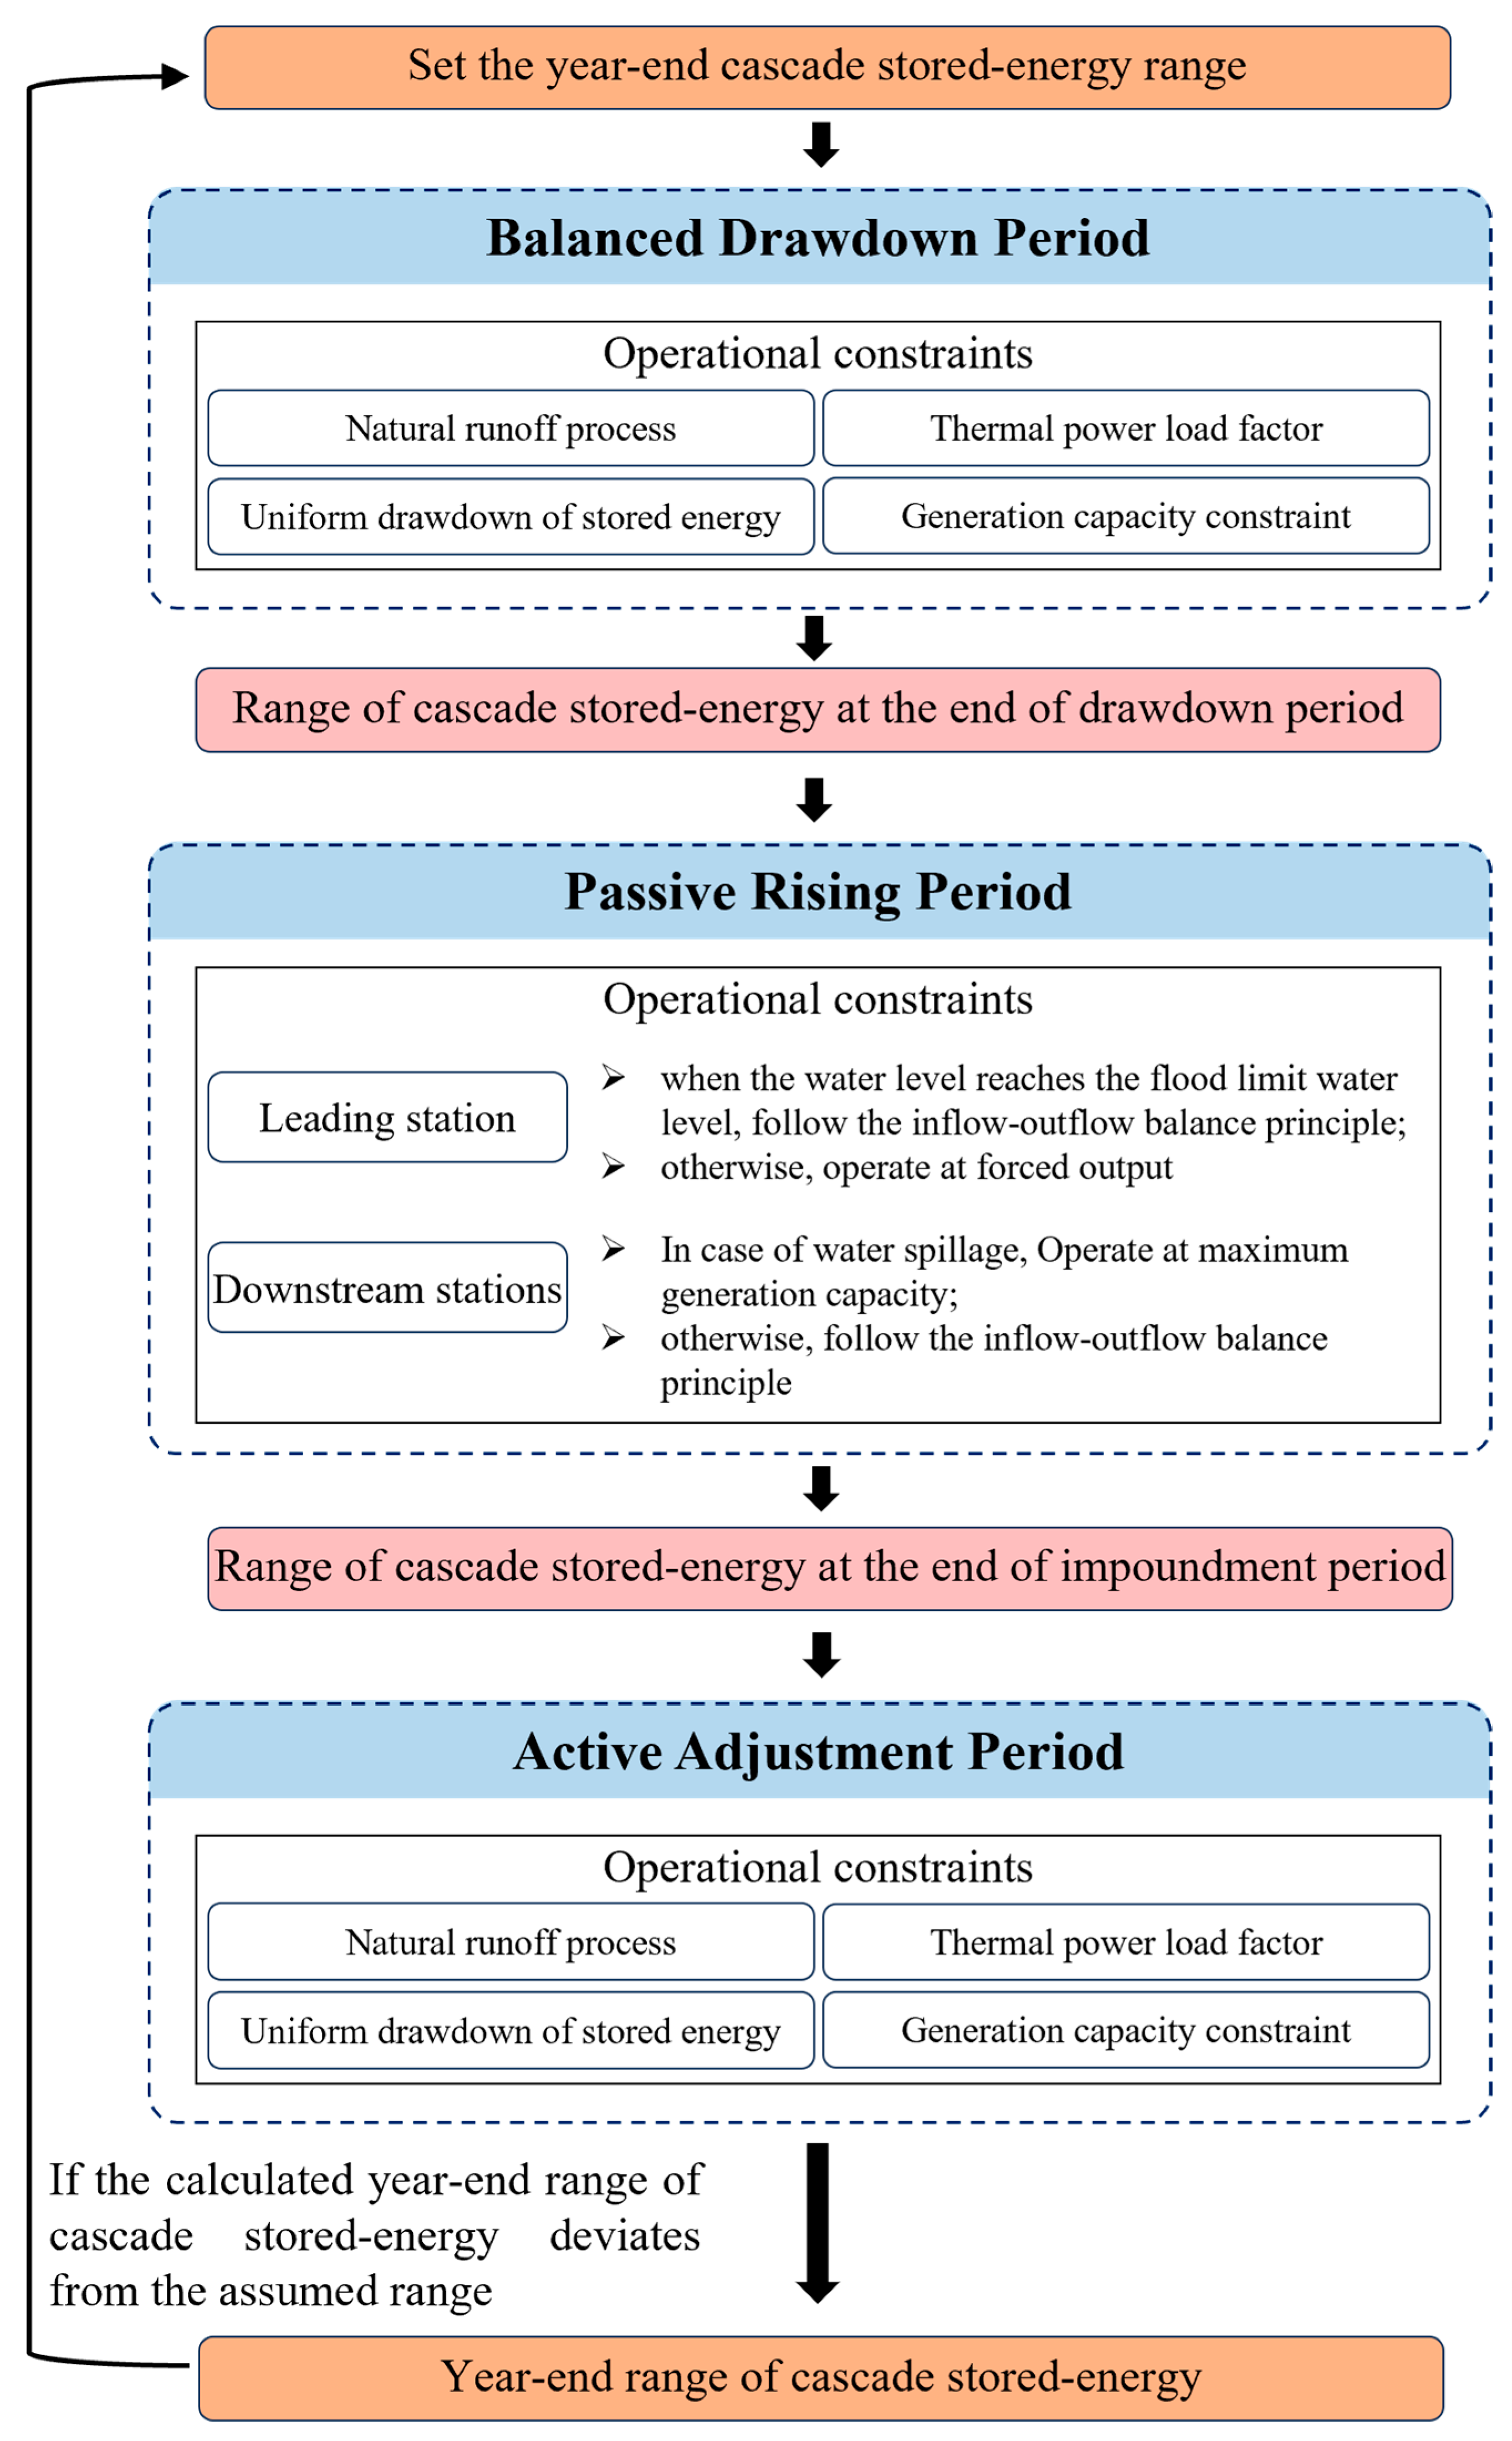
For the key control points identified above, this section calculates the stored-energy control ranges by combining stagewise recursion with closed-loop iteration. The overall calculation workflow is illustrated in Figure 1. The stored-energy control ranges at these points are determined as follows:
(1) Inputs: The calculation requires assumed initial stored-energy ranges for the beginning and end of the year. It also requires monthly natural-runoff trajectories under different inflow scenarios, cascade operating constraints, thermal load-factor constraints, and the upper and lower bounds of hydropower generation space.
(2) Forward monthly simulation using period-specific scheduling strategies: An initial stored energy at the beginning of the year is assumed. The strategies in Section 2.2 are then applied sequentially to simulate monthly stored-energy trajectories for the balanced drawdown, passive rising, and active adjustment periods.
(3) Convergence test: After the full-year simulation, average thermal output and the thermal load factor are calculated from the system energy-balance results. If the initial and final thermal load factors are consistent, the stored-energy trajectory is considered converged and retained. Otherwise, the initial stored energy is adjusted, and the simulation is repeated.
(4) System-constraint verification: During each iteration, the model checks year-end stored-energy convergence and constraints on water level, discharge, output, ecological flow, flood-limit water level, and transmission-corridor capacity. The thermal load factor affects cascade drawdown depth and system energy balance, so it must match the inflow scenario. If hydropower output violates generation-space constraints, a key water level exceeds its limit, or year-end stored energy fails to converge, the thermal load factor or trial year-end stored energy is adjusted. The calculation is then repeated.
(5) Outputs: After convergence, the model obtains stored-energy control ranges at the end of drawdown, flood-season end, impoundment completion, and year-end for each inflow scenario. It also obtains the corresponding water-level combinations and monthly stored-energy trajectories. The upper and lower trajectory envelopes define the normal stored-energy zone in the cascade dispatch chart. These boundaries support hydropower-output adjustment and medium- to long-term operating decisions under different stored-energy conditions.
Figure 1.
Schematic of the method for calculating cascade stored-energy control ranges at key control points.
2.4. Application of the Stored-Energy Dispatch Chart
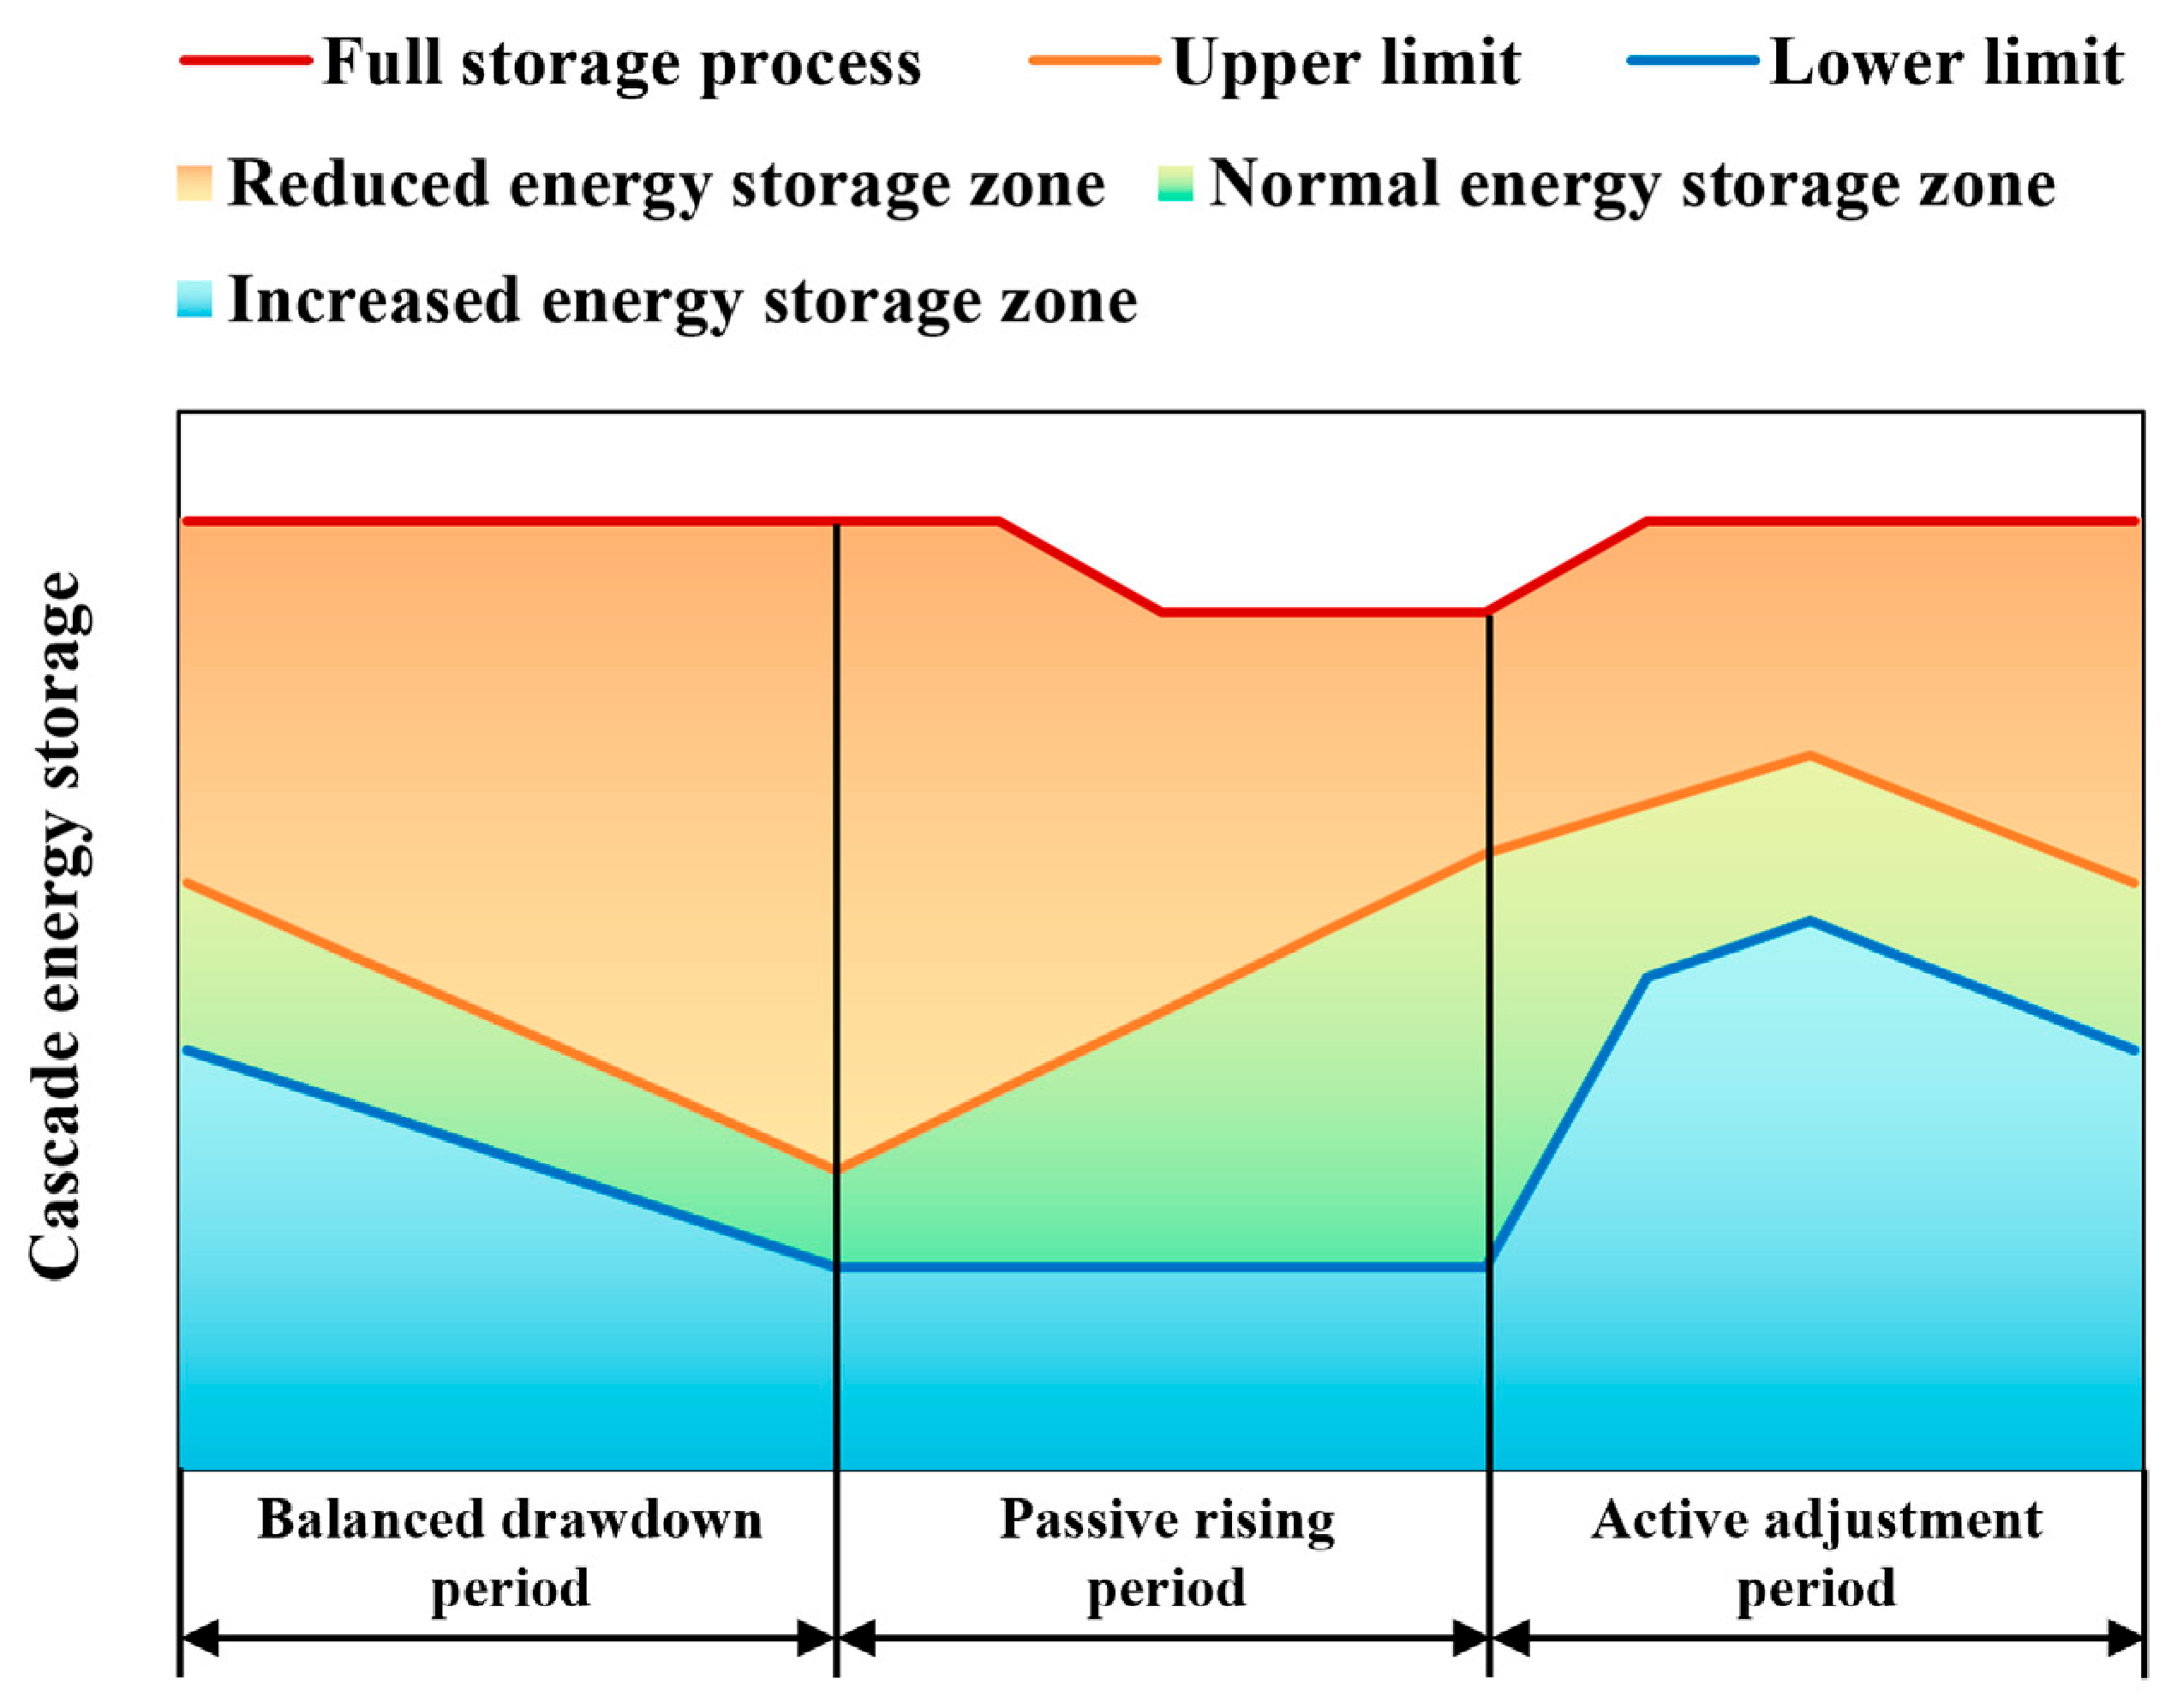
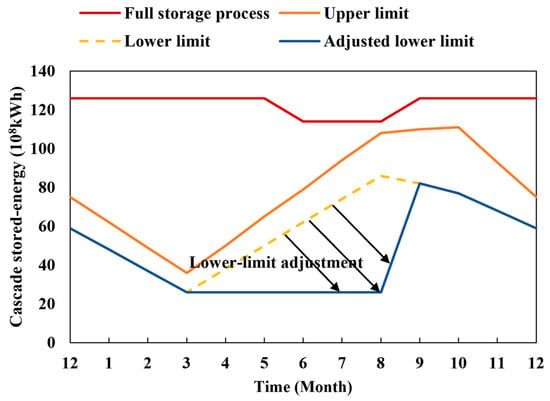
In the stored-energy dispatch chart, the horizontal axis shows time in the scheduling year, and the vertical axis represents aggregate cascade stored energy. The full-storage trajectory and the upper and lower dispatch lines divide the chart into normal, reduced, and increased stored-energy zones. The schematic structure of the stored-energy dispatch chart is illustrated in Figure 2. The operating mode is determined by the zone containing actual cascade stored energy in each period:
(1) Normal stored-energy zone: this zone is the target operating range between the upper and lower stored-energy dispatch lines. When actual stored energy lies within this range, the reservoir system meets the scheduling requirements for that period. Generation can therefore follow the established operating rules.
(2) Reduced stored-energy zone: when actual stored energy exceeds the upper dispatch line, cascade stored energy is too high. Subsequent operation may face insufficient storage capacity before the flood season, lower inflow-utilization efficiency, or increased spill risk. Generation should therefore be increased above the baseline schedule in steps. This adjustment returns stored energy to the normal zone and may offset power shortages caused by insufficient renewable output.
(3) Increased stored-energy zone: when actual stored energy falls below the lower dispatch line, cascade stored energy is too low. Maintaining the original generation schedule may reduce dry-season generation capability and system regulation space. Hydropower generation should therefore be reduced relative to the baseline schedule. Part of the inflow can then be retained as reservoir stored energy until cascade stored energy returns to the normal zone.
In actual operation, cascade stored energy should generally remain near the centerline of the normal zone. Water-level combinations and station-output allocations can be determined from the relationships among water level, storage volume, and stored energy at each station. This produces a cascade generation plan that satisfies system power and energy balance, reservoir operating constraints, and renewable-energy integration requirements.
Figure 2.
Schematic of the stored-energy dispatch chart.
3. Study Area and Data
3.1. Study Area
The Wujiang River is a first-order tributary on the right bank of the upper Yangtze River. Its basin lies mainly in Guizhou Province, which contains China’s sixth-largest hydropower base. The basin has a cascade hydropower system centered on the HJD leading reservoir, which provides multiyear regulation. The system also includes stations with seasonal and daily regulation capacity. With a total installed capacity of 8665 MW, the cascade is suitable for coordinated operation and stored-energy control.
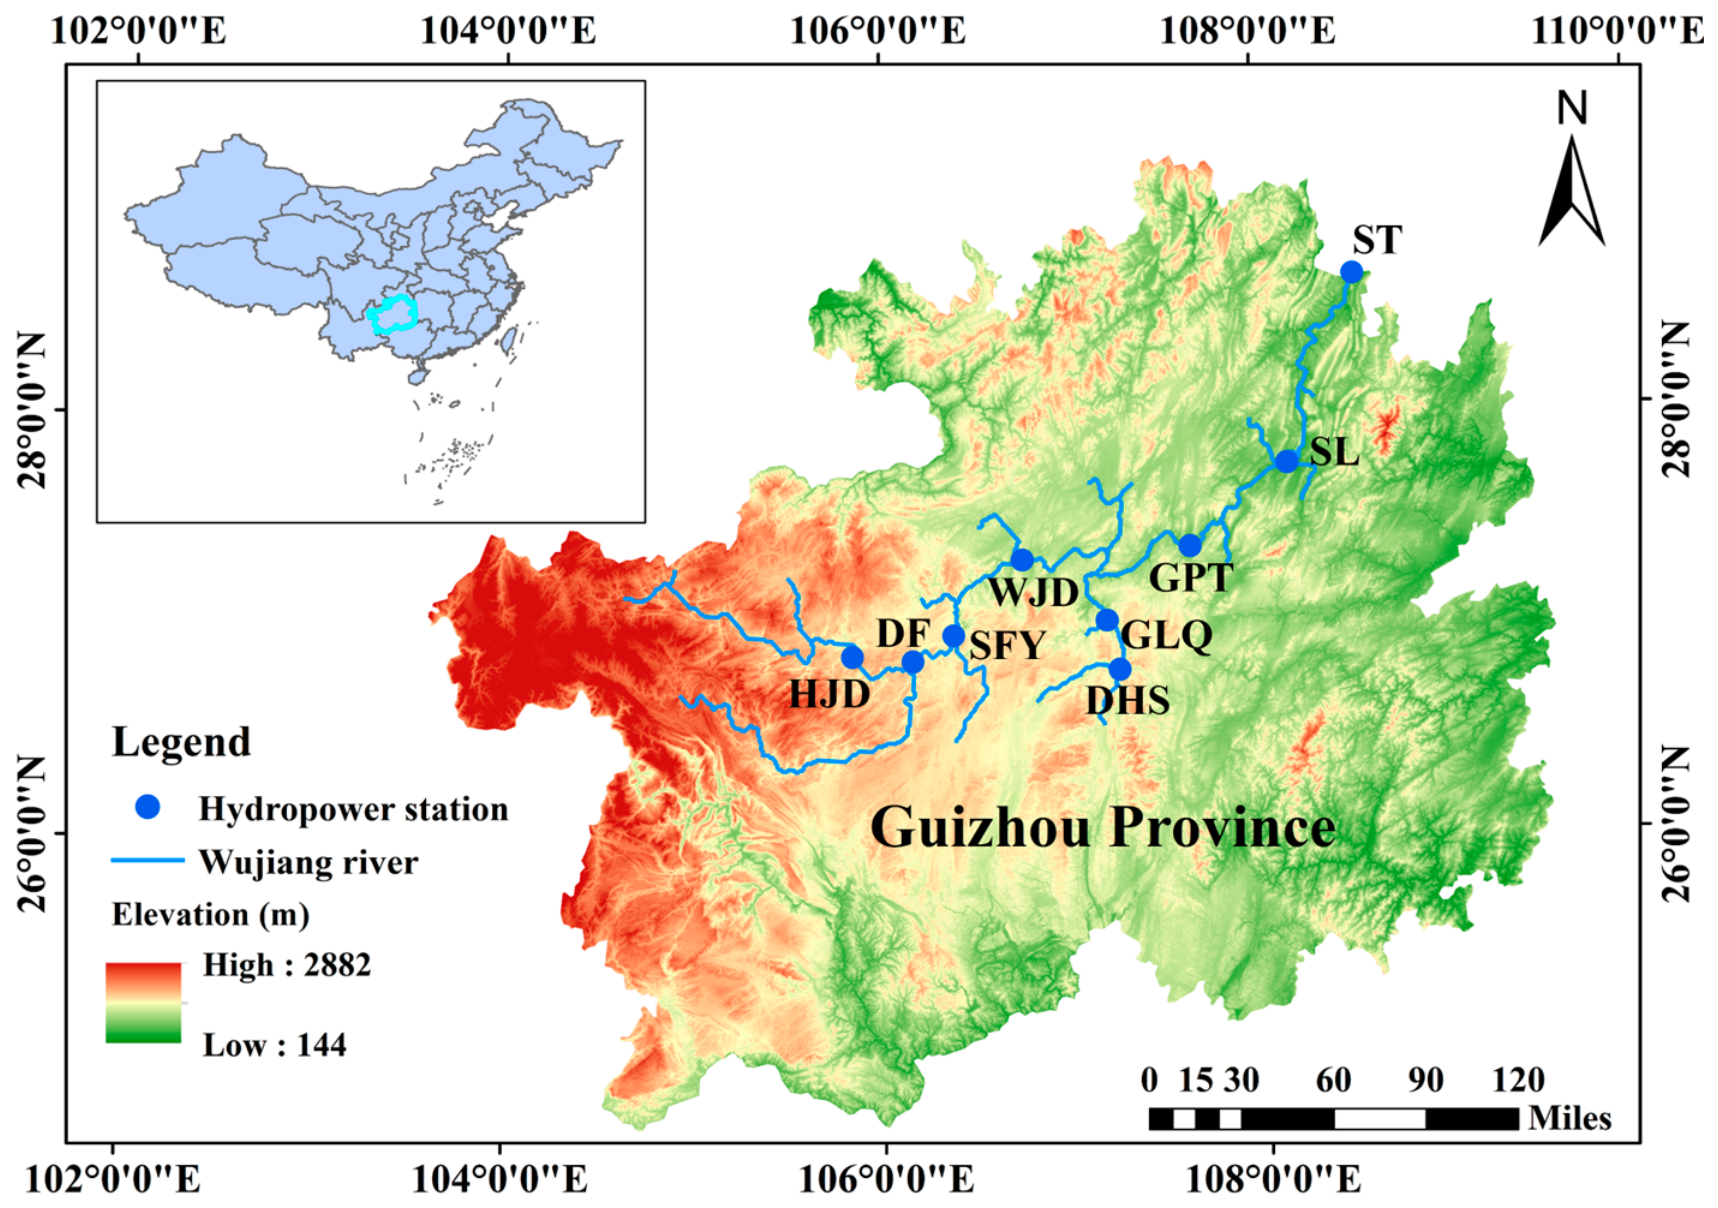
In 2025, Guizhou had 12,750 MW of installed wind capacity and 23,160 MW of installed PV capacity. According to the “14th Five-Year Plan for New Energy and Renewable Energy Development in Guizhou Province” and the associated medium- and long-term development plans issued by the Guizhou Provincial Energy Administration, these capacities will reach 15,000 MW and 60,000 MW by 2030, and 20,000 MW and 85,000 MW by 2035. As wind and PV capacity expands, concentrated renewable output from April to September will further compress flood-season hydropower generation space. During the dry season, lower wind and PV output will increase the pressure on hydropower and thermal generation to maintain supply reliability. This study examines cascade stored-energy scheduling across planning years, analyzes hydropower generation-space evolution, and validates the proposed method under a high-renewable scenario. The topography of the Wujiang River Basin and the distribution of the cascade hydropower stations are shown in Figure 3.
Figure 3.
Topography of the Wujiang River Basin and distribution of cascade hydropower stations.
3.2. Data
Guizhou’s total electricity consumption in 2025 was 204.871 TWh, and its maximum centrally dispatched load was 30,080 MW. According to the provincial power development plan, total electricity consumption and maximum load will reach 270 TWh and 53,200 MW by 2030, and 303 TWh and 60,000 MW by 2035. Based on the measured 8760 h load data of the Guizhou power grid in 2025, monthly average loads were calculated to obtain the base-year monthly load profile. For each planning year, the load sequences were generated by proportional scaling, where the scaling factor is the ratio of the target-year annual electricity consumption to the base-year annual electricity consumption. This ensures that the annual electricity consumption matches the planning target while preserving the temporal distribution of the base-year load profile.
Guizhou has 13,483 MW of installed hydropower capacity and 41,362.4 MW of thermal capacity. Nine cascade hydropower stations lie along the main stem of the Wujiang River, with a combined installed capacity of 8665 MW. Installed capacity, regulation capability, reservoir storage capacity, and characteristic water levels were used as basic reservoir parameters. These data support the hydropower generation-space quantification model and the medium- to long-term cascade stored-energy scheduling model.
Renewable-energy boundary conditions were defined from system-level installed capacity and source-side bundled operation. At the system level, based on the measured 8760 h wind and PV output data of the Guizhou power grid in 2025, monthly average outputs were calculated to obtain the base-year (2025) monthly wind and PV output profiles. According to the “14th Five-Year Plan for New Energy and Renewable Energy Development in Guizhou Province” and the associated medium- and long-term development plans issued by the Guizhou Provincial Energy Administration, Guizhou’s PV and wind capacities will reach 60,000 MW and 15,000 MW by 2030, and 85,000 MW and 20,000 MW by 2035. Renewable-driven compression of hydropower generation space will therefore become stronger. At the source level, stations such as HJD, SFY, and ST operate in bundles with nearby wind farms and PV plants. When high hydropower output coincides with high wind and PV output, transmission-corridor capacity constrains coordinated hydro–wind–PV operation.
Thermal boundary conditions mainly include minimum technical output and the thermal load factor. Minimum technical output is the lowest output required for safe and stable thermal-unit operation. It is used to calculate the upper bound of hydropower generation space. The thermal load factor reflects the medium- to long-term balance between hydropower and thermal generation. According to the power and energy balance, the required thermal generation is determined by subtracting the available generation of priority sources, such as hydropower and renewable energy, from the system-wide generation demand. Considering the effect of inflow differences on thermal output demand, two extreme scenarios are set: under dry inflow, the available hydropower generation decreases, so the thermal generation that must be supplied increases, corresponding to the upper bound of thermal output; under wet inflow, the available hydropower generation increases, so the required thermal generation decreases, corresponding to the lower bound of thermal output. In addition, considering that the minimum technical output of thermal units for safe and stable operation corresponds to a load factor of approximately 50–52%, after adding a safety margin, the lower bound of the comparison range is set to 53%; combined with the 2035 electricity demand growth and peak-shaving requirements, the upper bound of the comparison range is set to 56%. Accordingly, four schemes—53%, 54%, 55%, and 56%—are compared in this study. During the comparison, the primary criterion is that the year-end stored energy converges to a reasonable range while satisfying water level and energy-balance constraints throughout the simulation. Under this premise, a lower thermal load factor is preferred to preserve greater system regulation space for renewable-energy integration without affecting stored-energy recovery and system security. After comparative calculations, the minimum acceptable load factor under normal inflow is 54%; under moderately dry inflow, the 54% case fails to restore stored energy to the target range by the end of the dry season, and the load factor is therefore increased to 55%. The comparison results and the stored-energy control ranges at key control points under different schemes are presented in Table 1, Table 2 and Table 3.
Table 1.
Upper bounds of monthly hydropower generation space across planning years.
Table 2.
Stored-energy control ranges at key control points under different thermal load factors (normal inflow, unit: 0.1 TWh).
Table 3.
Stored-energy control ranges at key control points under different thermal load factors (moderately wet inflow: 0.1 TWh).
4. Results and Discussion
4.1. Hydropower Generation Space in Different Planning Years
Monthly hydropower generation space in 2025, 2030, and 2035 was calculated using Equations (1) and (2). The calculation used Guizhou grid load demand, wind and PV output trajectories, and the minimum technical output of thermal units as boundary conditions. The analysis then examined how hydropower generation space evolves across planning years.
System-wide results indicate aggregate regulation trends but cannot directly define the operating boundaries of the Wujiang cascade, which is dispatched as an independent entity. Its available generation space must therefore be scaled by its installed-capacity share to determine whether generation-space compression requires changes in operating rules. Accordingly, the analysis is conducted at two scales. At the system-wide scale, it characterizes the timing and magnitude of changes in the upper bound of hydropower generation space. At the Wujiang cascade scale, it evaluates the operating implications of generation-space compression after capacity-share scaling and determines whether conventional rules remain feasible.
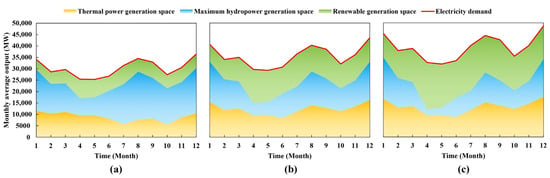
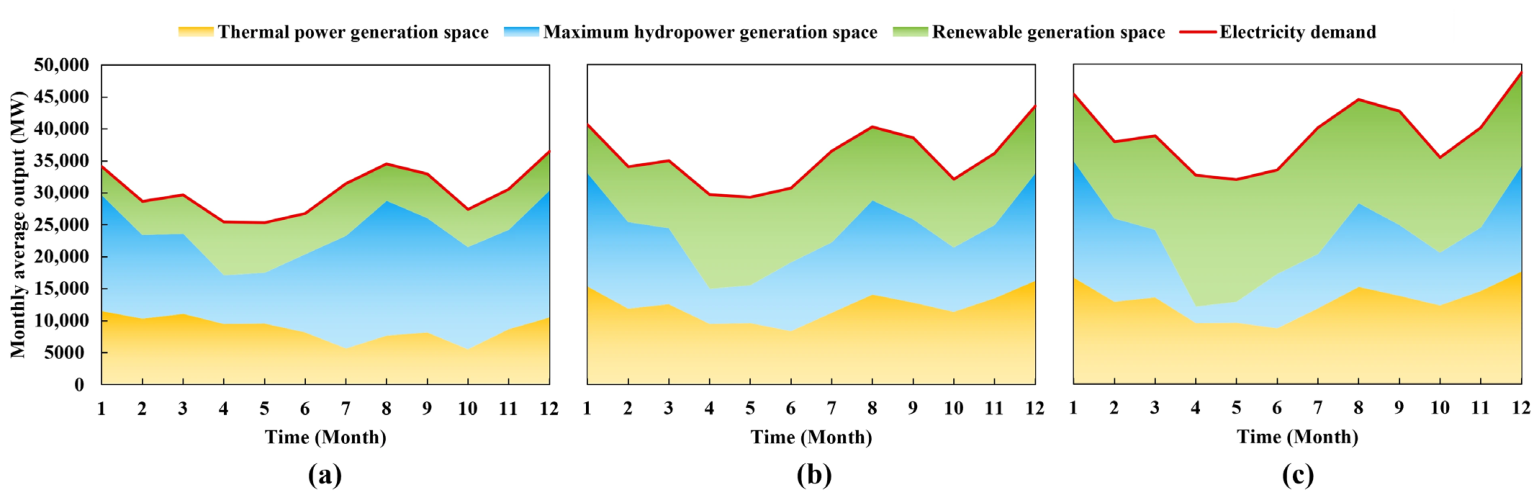
At the system-wide scale, Figure 4 shows that the upper bound of hydropower generation space declines progressively across planning years. The contraction is concentrated from the pre-flood period to the flood season, especially in April and May. In April, system-wide hydropower generation space decreases from 7644 MW in 2025 to 5459 MW in 2030 and 2571 MW in 2035. This is a reduction of more than 66%. The reduction is concentrated in this period because system load remains relatively low, while combined wind and PV output substantially lowers residual energy demand. As a result, the maximum hydropower output that can be accommodated is sharply reduced. This period is also the traditional window for hydropower drawdown and flood-storage preparation. The narrowing of generation space means that hydropower no longer has enough space to complete drawdown. By contrast, the upper bound remains close to total system hydropower capacity in the dry season, especially in December and January. Renewable output is then relatively low and load demand rises, so hydropower must provide stronger system regulation. However, available water energy is limited by inflow. Operators must therefore balance current generation against later supply reliability.
Figure 4.
Maximum monthly hydropower generation space at different planning years: (a) 2025 low-renewable scenario; (b) 2030 transition scenario; (c) 2035 high-renewable scenario.
For the Wujiang cascade, the upper bound of generation space in April 2030 is 3509 MW. This remains above the output required during balanced drawdown under the existing rules, so the current stored-energy control mode can be maintained. Although compression is evident, it has not changed the current medium- to long-term scheduling framework. By 2035, however, the April and May upper bounds fall to 1652 MW and 2091 MW, respectively. These values account for only 19% and 24% of total cascade installed capacity, as shown in Table 4. This severe compression changes the basic operating logic. The conventional strategy of setting drawdown completion in late April and scheduling high hydropower output in April and May is no longer viable. By late April, the system cannot accommodate the large hydropower output required for drawdown. The end-of-drawdown point should therefore be advanced so that the main drawdown can be completed from January to March. During this period, load demand is relatively high and renewable output remains low. This motivates the reconstruction of the dispatch chart. The lower bound of generation space is constrained by rigid comprehensive water-use requirements, such as ecological flow and navigation water levels. It therefore cannot decrease without limit when renewable output is high. During periods of low load and high wind and PV output, the cascade must maintain mandatory output even if the hydropower share of residual energy demand declines further. This rigid lower bound creates a chain of conflicts. Thermal units must ramp down more deeply to accommodate mandatory hydropower output. Once thermal units reach their minimum technical output, renewable curtailment occurs if residual demand cannot accommodate both wind–PV output and mandatory hydropower output. Thus, the 2035 lower bound of hydropower generation space is not only a hydropower operating boundary. It also affects renewable-energy integration and total system operating cost.
Table 4.
Basic operating parameters of the Wujiang cascade hydropower stations.
The preceding analysis shows that wind and PV expansion in 2030 remains within the range that existing hydropower scheduling rules can accommodate. In 2035, however, pre-flood generation space is materially compressed. The April to May upper bound for the Wujiang cascade falls to about 20% of installed capacity. A static strategy that sets drawdown completion in late April and schedules high hydropower output in April and May is therefore infeasible. Accordingly, 2035 is selected as the core scenario for dispatch-chart reconstruction and effectiveness validation.
4.2. Analysis of Hydropower Stored-Energy Dispatch Charts in Different Planning Years
Using the method in Section 2.3, this section recalculates the stored-energy control ranges at key control points for 2035 and constructs the corresponding dispatch chart. A comparison with the 2025 low-renewable scenario and the existing rules shows how high-renewable penetration affects the stored-energy dispatch chart.
The thermal load factor represents the average thermal output assumed in the system. It is a key parameter affecting hydropower generation space and drawdown depth. To analyze its effect on stored-energy control ranges, the range defined in Section 3.2 was used to select recommended values. Two criteria were applied. First, year-end stored energy must converge to a reasonable range after iteration without violating water-level limits or spill limits. Second, while ensuring stored-energy recovery, a lower thermal load factor is preferred to preserve space for wind and PV integration. After the 53% to 56% cases were evaluated, the recommended values were identified. Under normal and moderately wet inflow, hydropower capability is relatively sufficient, and a 54% load factor maintains stored-energy recovery while preserving greater system regulation space for renewable-energy integration. Under moderately dry inflow, natural inflow and hydropower capability decline, so the load factor should increase to 55%. This reduces the adverse effect of excessive hydropower drawdown on dry-season supply reliability. Table 2, Table 3 and Table 5 list the stored-energy control ranges at key control points under different thermal load factors.
Table 5.
Stored-energy control ranges at key control points under different thermal load factors (moderately dry inflow: 0.1 TWh).
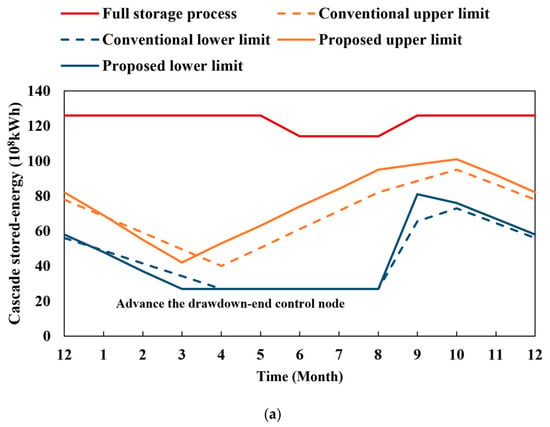
As shown in Figure 5, the proposed method revises the existing rules according to the operating period and inflow condition. Because available hydropower generation space declines markedly in April and May, drawdown cannot be completed within the original period. The end-of-drawdown control point is therefore advanced from late April to late March. The associated stored-energy range is adjusted so that drawdown can be completed before high wind and PV output occur. After the flood season begins, the lower dispatch line of the normal stored-energy zone is revised according to flood-control constraints, inflow variation, and hydropower generation-space recovery. This revision expands the flood-season buffer for stored-energy regulation.
Figure 5.
Adjusted Wujiang cascade stored-energy dispatch chart (2035).
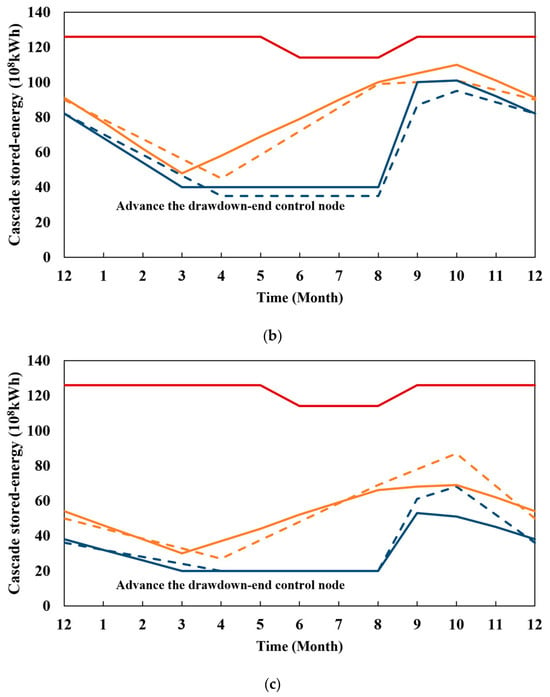
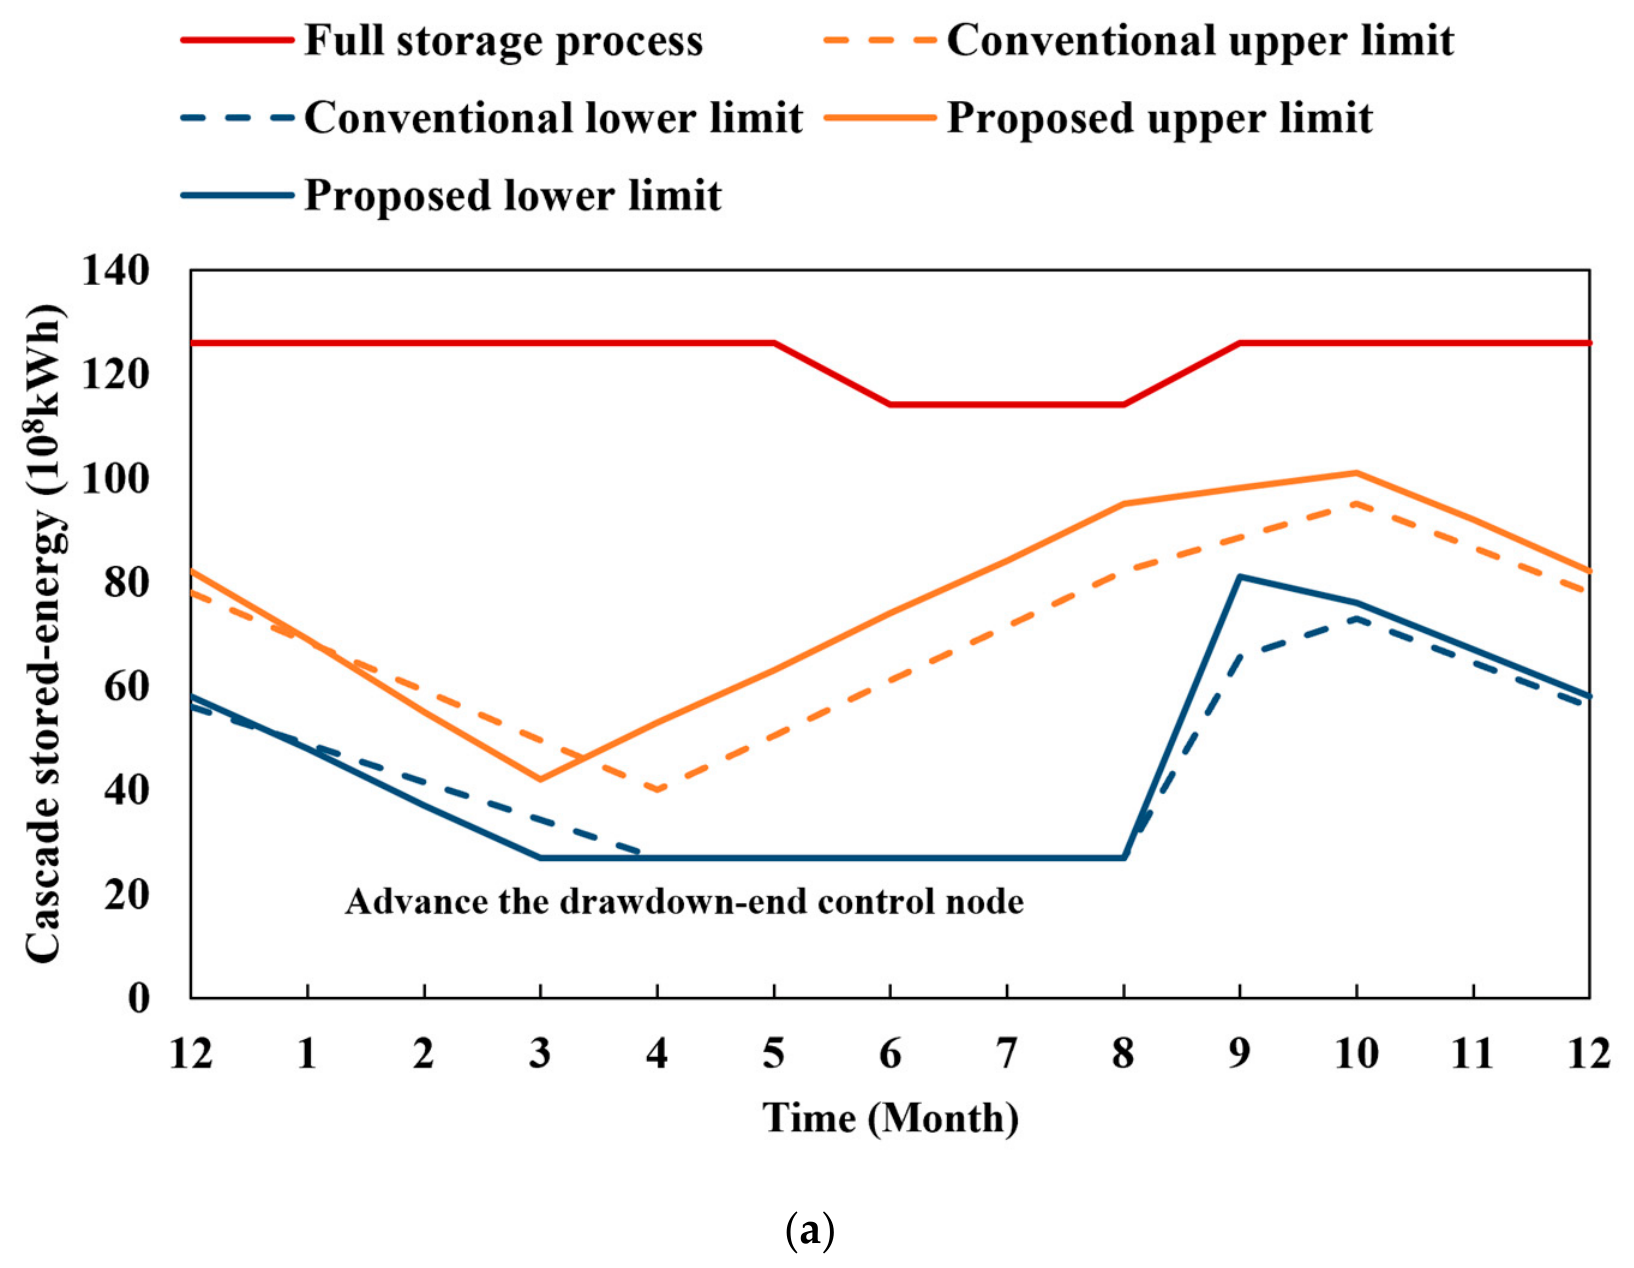
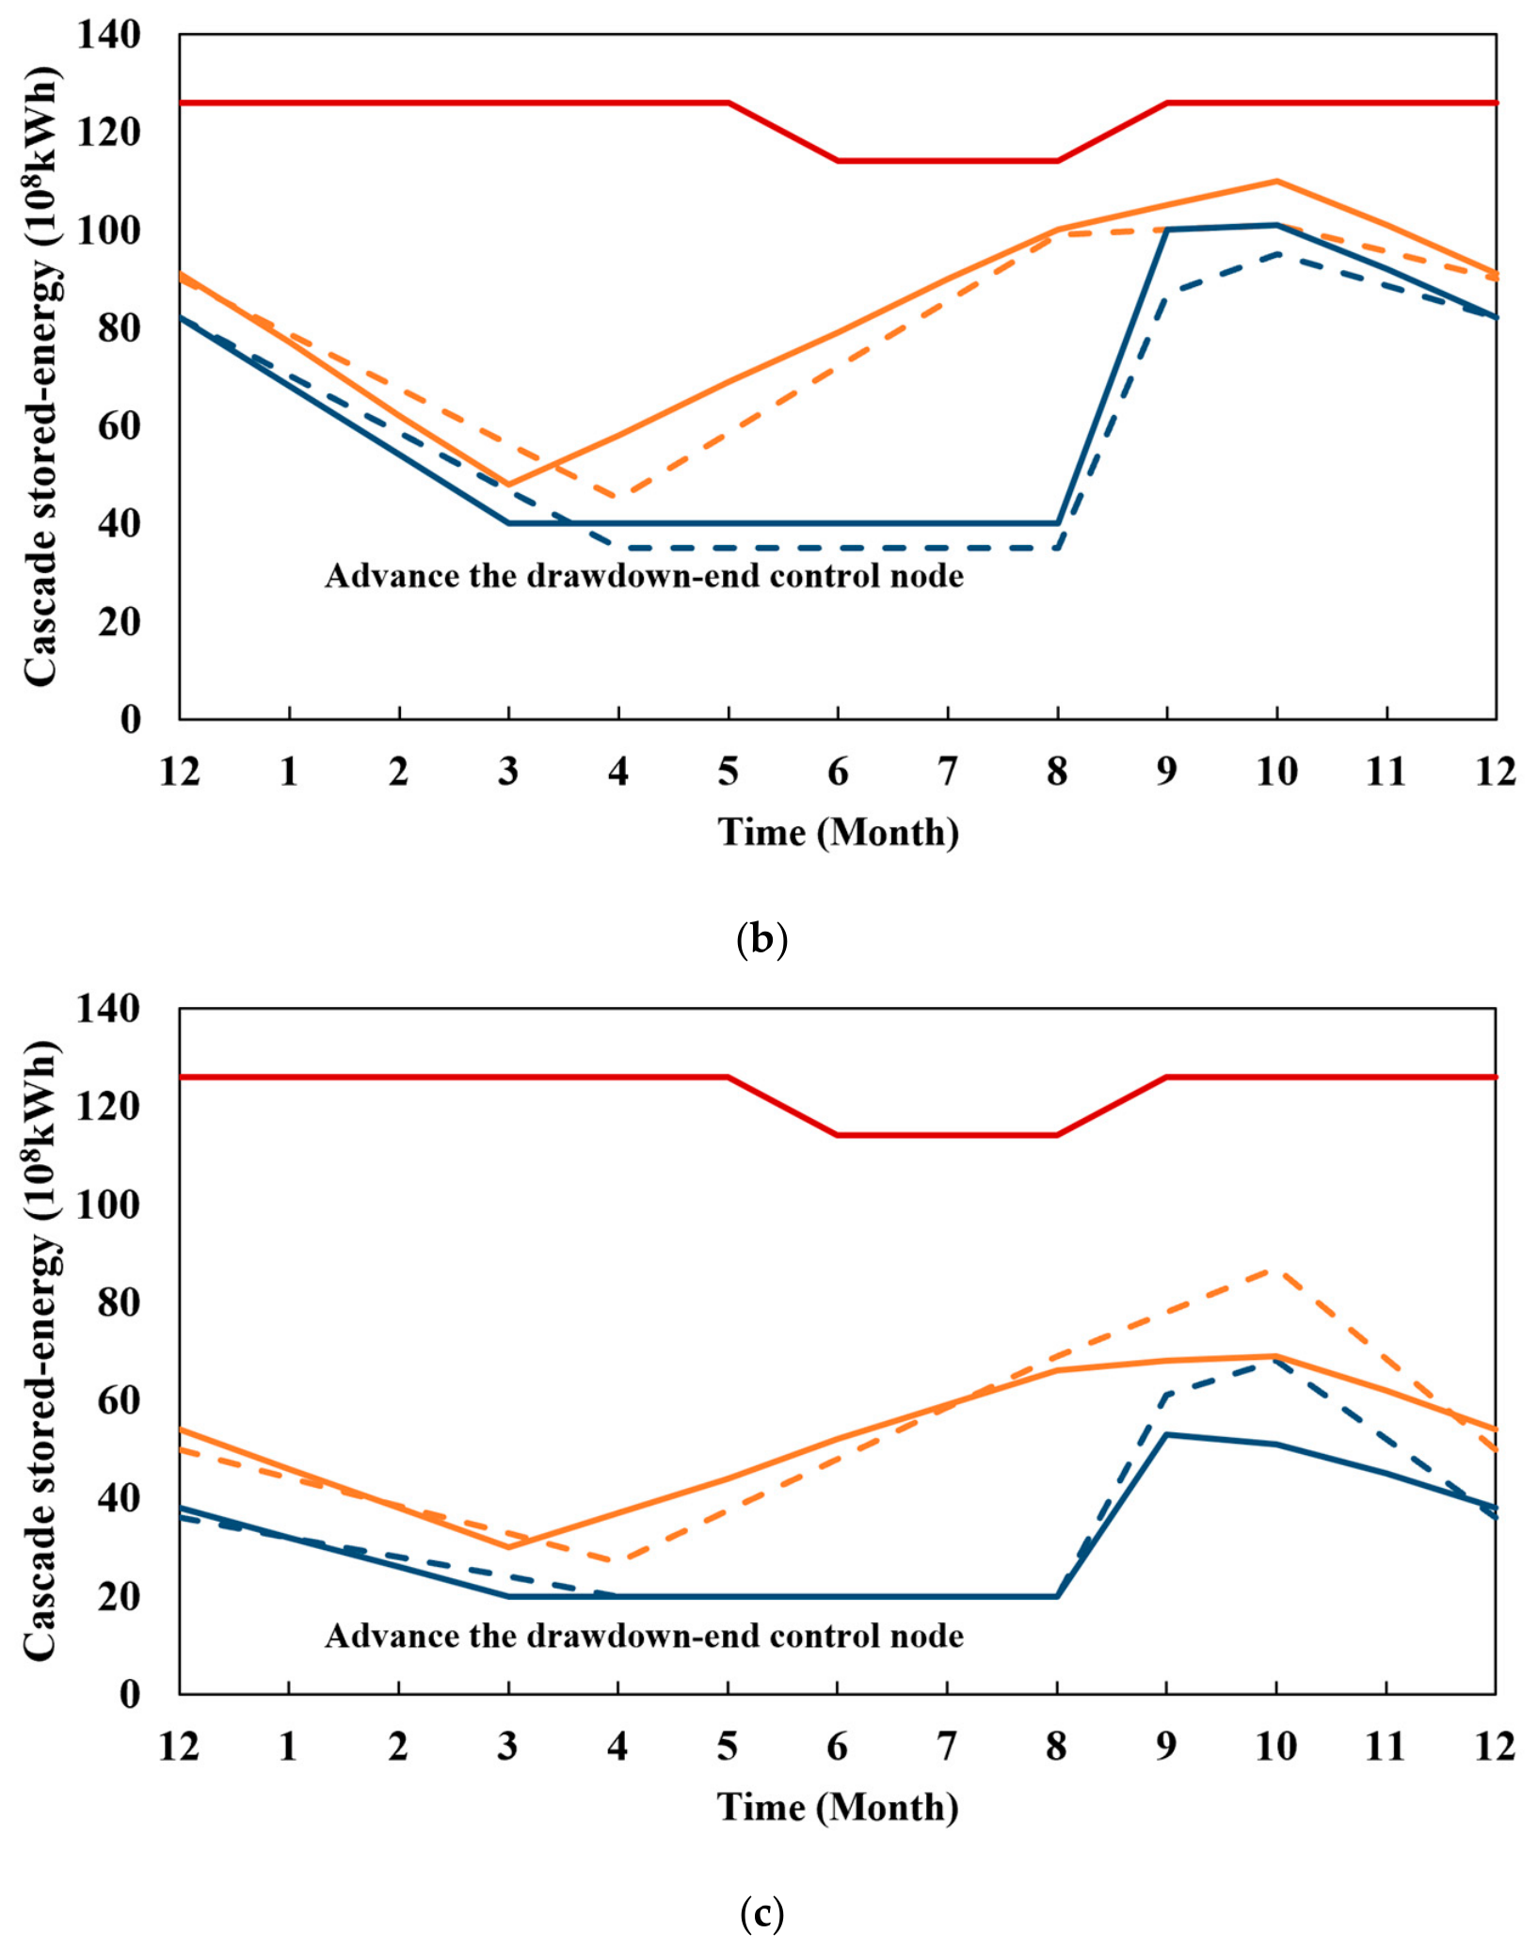
Figure 6 overlays the 2025 dispatch chart, the 2035 chart under existing rules, and the proposed 2035 chart in a common coordinate system. Table 6 compares the stored-energy ranges at the four control points under the existing rules and the proposed method. The main changes are as follows:
Figure 6.
Cascade stored-energy dispatch charts for different inflow scenarios: (a) normal inflow scenario; (b) moderately wet inflow scenario; (c) moderately dry inflow scenario.
Table 6.
Stored-energy control ranges at key control points, 2035 (0.1 TWh).
(1) Under the existing rules, drawdown ends in late April. The proposed method advances drawdown to late March, with both dispatch lines lower than those under the existing rules. This indicates greater dry-season drawdown and hydropower generation. By late April, the proposed method has entered the subsequent regulation stage, while the existing rules have just completed drawdown. Under moderately wet, normal, and moderately dry inflow, the proposed end-of-March stored-energy ranges are 4.0 to 4.8, 2.7 to 4.2, and 2.0 to 3.0 TWh, respectively. The corresponding end-of-April ranges under the existing rules are 3.5 to 4.5, 2.7 to 4.0, and 1.9 to 2.7 TWh. Although the comparison points differ by one month, the higher proposed range reflects an active response to compressed generation space. It retains dispatchable water energy to reduce spill risk and provide more operating space for the dry season.
(2) After the passive rising period begins, the proposed dispatch lines gradually exceed those under the existing rules, and the normal stored-energy zone widens. High wind and PV output from the pre-flood period to the flood season continue to compress hydropower generation space. The cascade can no longer draw down stored energy as prescribed by conventional rules. Instead, it stores water passively while meeting flood-control and water-use constraints. This effect is most pronounced under moderately wet inflow, where the lower and upper bounds increase by 0.5 and 0.3 TWh, respectively. Under normal inflow, the upper bound rises by 0.2 TWh. Under moderately dry inflow, the lower and upper bounds rise by 0.1 and 0.3 TWh. The upward shift and widening of the flood-season dispatch chart therefore result mainly from competition for generation space between hydropower and renewables. Under system-level constraints, this competition passively raises the stored-energy range.
(3) The passively increased stored energy provides dispatchable water energy for the dry season from October to the following March. Compared with the existing rules, the proposed method produces a larger drawdown from the post-flood period to the dry season. Water energy retained before and during the flood season because of limited generation space is therefore released more during the dry season. This release occurs when renewable output is relatively low, and system regulation demand is higher. The method thus shifts hydropower energy from the pre-flood and flood seasons to October and the following March. This shift reduces competition between hydropower and renewable generation during periods of high wind and PV output. It also strengthens dry-season supply and system regulation. Changes in the year-end control range also reflect this need. Under moderately wet inflow, the range changes from 8.2 to 9.0 TWh and from 8.2 to 9.1 TWh. Under normal inflow, it changes from 5.6 to 7.8 TWh and from 5.8 to 8.2 TWh. Under moderately dry inflow, it changes from 3.6 to 5.0 TWh and from 3.8 to 5.4 TWh.
Overall, the wider stored-energy range produced by the proposed method results from passive storage caused by constrained hydropower generation space. The method advances the end-of-drawdown point, increases dry-season drawdown, and retains flood-season water energy that cannot be released in constrained periods. In this way, it shifts part of hydropower generation from high-renewable-output periods to the dry season. The chart adjustment therefore changes more than stored-energy values at key control points. It reconstructs the annual storage and release timing of the cascade and improves coordination between renewable-energy integration and dry-season supply reliability.
In summary, advancing the end-of-drawdown point from late April to late March allows the cascade to complete its main stored-energy drawdown before high wind and PV output occur. The flood-season stored-energy range is wider than that under the existing rules because constrained generation space causes passive stored-energy accumulation. Greater post-flood and dry-season drawdown shifts part of hydropower generation from the pre-flood and flood seasons to the dry season. This temporal coordination avoids direct competition between hydropower and renewable generation during periods of low residual energy demand.
4.3. Validation of Dispatch-Chart Application
To validate the operational performance of the proposed stored-energy dispatch chart, cascade operation in 2035 is compared under the existing rules and the proposed chart. The year 2035 is selected because hydropower generation-space constraints are most pronounced, as shown in Section 4.1. The validation focuses on the normal inflow scenario. The evaluation indicators include total cascade generation, renewable-energy curtailment, spill volume, stored energy at key control points, and water-level compliance. This validation focuses on the normal inflow scenario to illustrate the mechanism by which the dispatch chart adjusts hydropower output and stored energy.
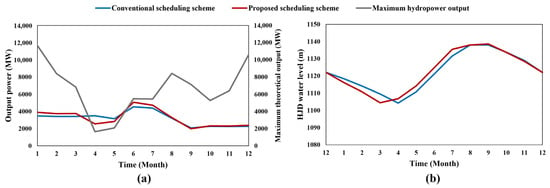
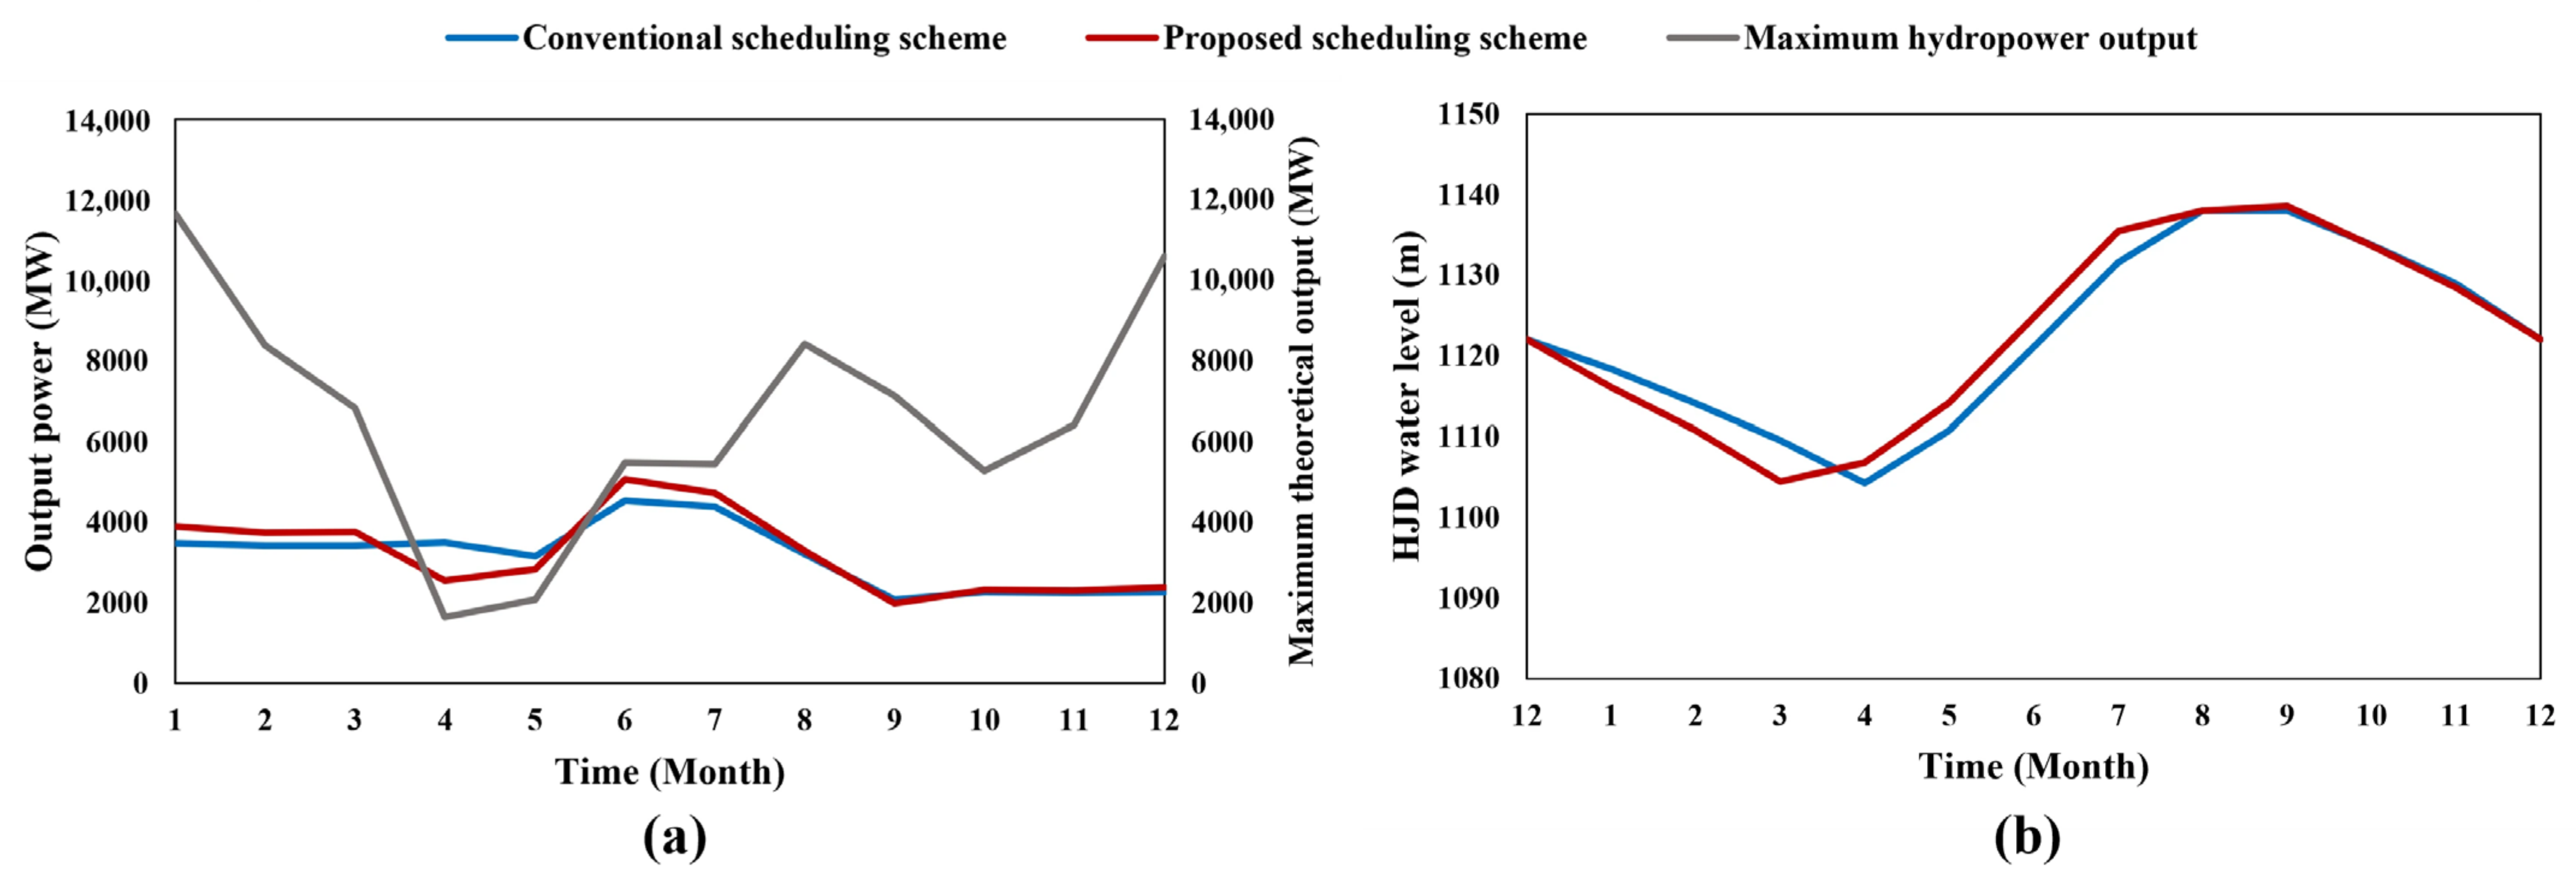
Under normal inflow, the existing rules use 7.2 TWh of initial stored energy and 3.4 TWh at the end of drawdown as the main control conditions. The proposed approach organizes monthly generation and water-level trajectories according to adjusted stored-energy ranges at key control points. As shown in Figure 7, the main differences occur during the transition from the pre-flood period to the flood season. The proposed approach completes the main stored-energy drawdown earlier, from January to March. It then reduces hydropower output in April and May, when wind and PV output are high. This reduces competition for generation space between hydropower and renewable generation. April and May are the months when hydropower generation space is most severely compressed by high wind and PV output, with upper bounds of only 1652 MW and 2091 MW, respectively. Under the existing rules, hydropower is still scheduled to generate heavily in April and May to complete the drawdown, reaching 3503 MW and 3164 MW, which far exceeds the generation-space limits and results in substantial hydropower curtailment. In the proposed method, the end-of-drawdown point is advanced from late April to late March, so the main drawdown task is completed from January to March. During this period, renewable output is relatively low, and hydropower generation space is relatively abundant; hydropower output from January to March increases from 3480 MW, 3421 MW, and 3428 MW under the existing rules to 3896 MW, 3760 MW, and 3773 MW. In April and May, hydropower output is actively reduced to 2564 MW and 2846 MW, avoiding competition with wind and PV for the compressed generation space. Through this temporal reallocation, hydropower generation is shifted away from the period of most severe generation-space compression, which increases total cascade generation and reduces hydropower curtailment. After the flood season begins, hydropower output increases with rising inflow and changing stored energy. This prevents stored energy from accumulating too rapidly. The process coordinates hydropower output with wind and PV output. The HJD water-level trajectory further illustrates this mechanism. The proposed approach completes the main drawdown by late March, creating pre-flood regulation space earlier than the existing rules. After the flood season begins, water-level recovery is broadly similar to that under the existing rules and exceeds 1138 m by late August. Advancing drawdown completion therefore does not weaken flood-season storage recovery. Instead, the adjusted release timing provides greater flexibility for renewable-energy integration in April and May and for subsequent flood-season stored-energy control.
Figure 7.
Comparison of cascade scheduling trajectories in the Wujiang River Basin under conventional and proposed schemes: (a) output power process; (b) HJD water-level process.
Under normal inflow in 2035, total cascade generation under the proposed approach is 28.45 TWh, which is 0.65 TWh higher than the 27.80 TWh under the existing rules. Hydropower curtailment decreases from 2.43 to 1.22 TWh, representing a 49.8% reduction. These results show that the adjusted medium- to long-term cascade stored-energy dispatch chart can optimize stored-energy ranges at key control points and monthly hydropower-output allocation. It thereby improves hydropower utilization efficiency and renewable-energy integration. It also enhances the role of cascade hydropower in system regulation under high wind and PV penetration.
In summary, the proposed method translates changes in grid-side hydropower generation space into annual release and stored-energy arrangements for cascade hydropower under normal inflow. It completes the main drawdown before the flood season, reduces hydropower output during periods of high wind and PV output, and adjusts hydropower output and stored-energy levels during the flood season according to inflow. These measures reduce competition for generation space. While satisfying water-level control and stored-energy recovery requirements, the scheduling approach improves cascade hydropower utilization efficiency and markedly reduces renewable-energy curtailment. It therefore provides an effective scheduling basis for medium- to long-term cascade hydropower operation under high wind and PV penetration.
5. Conclusions
High wind and PV penetration fundamentally alters the intra-annual distribution of system residual energy demand and reshapes hydropower generation space and operating patterns. Conventional medium- to long-term scheduling methods have difficulty coordinating renewable-energy integration, supply reliability, and seasonal hydropower utilization. To address this issue, this study proposes a method for medium- to long-term cascade stored-energy dispatch charts. The method quantifies generation space, dynamically identifies stored-energy control ranges at key control points, and constructs a zonal dispatch chart. It translates complex system operating boundaries into implementable control rules. The approach is validated using nine cascade hydropower stations in the Wujiang River Basin. The key findings are as follows:
(1) Under high-renewable penetration, hydropower generation-space contraction occurs mainly between the pre-flood and flood seasons. The co-occurrence of low residual energy demand and high-renewable output reduces available generation space and requires earlier drawdown completion. In the Wujiang case, the upper bound of cascade generation space in April and May 2035 is reduced to 19% to 24% of installed capacity. The drawdown completion point should therefore be advanced from late April to late March to avoid periods of high renewable generation.
(2) The proposed method uses stagewise recursion, year-end verification, and closed-loop iteration to determine stored-energy control ranges under inflow and system constraints. Based on these ranges, the annual operation cycle is divided into balanced drawdown, passive rising, and active adjustment phases. This yields a dispatch-chart-construction procedure that links key control points with period-specific scheduling strategies. In the Wujiang case, the resulting control ranges support stored-energy trajectory convergence and satisfy the prescribed water-level constraints under the normal inflow condition.
(3) The proposed dispatch chart supports time-shifted coordination between hydropower and renewables through temporal restructuring. Hydropower output and reservoir drawdown are increased during the dry season, when renewable output is relatively low. Output is reduced during periods of low residual energy demand to reserve generation capacity for renewables. Stored energy is then adjusted dynamically during the flood season. Under normal inflow in 2035, applying the proposed chart to the Wujiang system increases total cascade generation from 27.80 to 28.45 TWh. Hydropower curtailment decreases from 2.43 to 1.22 TWh, representing a 49.8% reduction.
Future work may integrate runoff-forecast uncertainty, coupled source–grid–load–storage constraints, and multi-timescale scheduling linkages. Adaptive updates to dispatch control boundaries under evolving generation mixes and transmission capacities could also be explored. These extensions would improve the robustness and transferability of the proposed framework across regional systems.
Author Contributions
Conceptualization, T.Z.; methodology, T.Z.; software, R.H.; writing—original draft preparation, J.Z. (Jiang Zhu); writing—review and editing, L.Z.; visualization, Y.L.; supervision, J.Z. (Jinjiang Zhou); project administration, X.W. All authors have read and agreed to the published version of the manuscript.
Funding
This research was funded by the National Natural Science Foundation of China (grant number 52479013, 52509013), and the Basic Research Program of Jiangsu (grant number BK20251481).
Data Availability Statement
The original contributions presented in this study are included in the article. Further inquiries can be directed to the first author.
Conflicts of Interest
Authors Tiancai Zuo, Jiang Zhu, Lei Zheng, Yuanjun Li, and Jinjiang Zhou were employed by Guizhou Wujiang Hydropower Development Co., Ltd. The remaining authors declare that the research was conducted in the absence of any commercial or financial relationships that could be construed as potential conflicts of interest.
Appendix A
Nomenclature
Table A1 defines the key terms used throughout this manuscript. All terms are presented with their abbreviations (where applicable), definitions, and units to ensure terminological consistency.
Table A1.
Key terms and definitions.
References
- Labadie, J.W. Optimal operation of multireservoir systems: State-of-the-art review. J. Water Resour. Plan. Manag. 2004, 130, 93–111. [Google Scholar] [CrossRef] [Scilit]
- Chang, F.J.; Chen, L.; Chang, L.C. Optimizing the reservoir operating rule curves by genetic algorithms. Hydrol. Process. 2005, 19, 2277–2289. [Google Scholar] [CrossRef] [Scilit]
- Chen, L.; McPhee, J.; Yeh, W.W.G. A diversified multiobjective GA for optimizing reservoir rule curves. Adv. Water Resour. 2007, 30, 1082–1093. [Google Scholar] [CrossRef] [Scilit]
- Liu, P.; Guo, S.L.; Xu, X.W.; Chen, J.H. Derivation of aggregation-based joint operating rule curves for cascade hydropower reservoirs. Water Resour. Manag. 2011, 25, 3177–3200. [Google Scholar] [CrossRef] [Scilit]
- Taghian, M.; Rosbjerg, D.; Haghighi, A.; Madsen, H. Optimization of conventional rule curves coupled with hedging rules for reservoir operation. J. Water Resour. Plan. Manag. 2014, 140, 693–698. [Google Scholar] [CrossRef] [Scilit]
- Li, J.; Zhu, L.J.; Qin, H.; Zhang, Z.; Yao, L.; Gul, E.; Jiang, Z.; Wang, Y.; Mo, L.; Pei, S. Operation rules optimization of cascade reservoirs based on multi-objective tangent algorithm. IEEE Access 2019, 7, 161949–161962. [Google Scholar] [CrossRef] [Scilit]
- Ara, I.; Yasar, M. Optimization of the operation rule curves for cascade reservoirs using the cuckoo search algorithm. Adv. Civ. Eng. 2022, 2022, 8463358. [Google Scholar] [CrossRef] [Scilit]
- Li, L.P.; Liu, P.; Rheinheimer, D.E.; Deng, C.; Zhou, Y.L. Identifying explicit formulation of operating rules for multi-reservoir systems using genetic programming. Water Resour. Manag. 2014, 28, 1545–1565. [Google Scholar] [CrossRef] [Scilit]
- Ji, C.M.; Zhou, T.; Huang, H.T. Operating rules derivation of Jinsha Reservoirs system with parameter calibrated support vector regression. Water Resour. Manag. 2014, 28, 2435–2451. [Google Scholar] [CrossRef] [Scilit]
- Jiang, Z.Q.; Li, A.Q.; Ji, C.M.; Qin, H.; Yu, S.; Li, Y. Research and application of key technologies in drawing energy storage operation chart by discriminant coefficient method. Energy 2016, 114, 774–786. [Google Scholar] [CrossRef] [Scilit]
- Jiang, Z.Q.; Ji, C.M.; Qin, H.; Feng, Z.K. Multi-stage progressive optimality algorithm and its application in energy storage operation chart optimization of cascade reservoirs. Energy 2018, 148, 309–323. [Google Scholar] [CrossRef] [Scilit]
- Ding, Z.Y.; Fang, G.H.; Wen, X.; Tan, Q.F.; Mao, Y.C.; Zhang, Y. Long-term operation rules of a hydro-wind-photovoltaic hybrid system considering forecast information. Energy 2024, 288, 129634. [Google Scholar] [CrossRef] [Scilit]
- Ming, B.; Liu, P.; Guo, S.L.; Cheng, L.; Zhang, J.W. Hydropower reservoir reoperation to adapt to large-scale photovoltaic power generation. Energy 2019, 179, 268–279. [Google Scholar] [CrossRef] [Scilit]
- Su, H.Y.; Wei, H.Q.; Wei, X.C.; Wang, G.S.; Zhang, Y.; Wang, R.R. Long-term optimal operation of the cascade hydro-wind-photovoltaic hybrid system considering transmission section constraints. Math. Probl. Eng. 2023, 2023, 8484804. [Google Scholar] [CrossRef] [Scilit]
- Zhang, H.X.; Lu, Z.X.; Hu, W.; Wang, Y.T.; Dong, L.; Zhang, J.T. Coordinated optimal operation of hydro-wind-solar integrated systems. Appl. Energy 2019, 242, 883–896. [Google Scholar] [CrossRef] [Scilit]
- Lu, N.; Wang, G.Y.; Su, C.G.; Ren, Z.M.; Peng, X.Y.; Sui, Q. Medium- and long-term interval optimal scheduling of cascade hydropower-photovoltaic complementary systems considering multiple uncertainties. Appl. Energy 2024, 353, 122085. [Google Scholar] [CrossRef] [Scilit]
- Lin, M.K.; Shen, J.J.; Cheng, C.T.; Lü, Q.; Wang, Y.Q. Long-term multi-objective optimal scheduling for large cascaded hydro-wind-photovoltaic complementary systems considering short-term peak-shaving demands. Energy Convers. Manag. 2024, 301, 118063. [Google Scholar] [CrossRef] [Scilit]
- Tian, Y.Y.; Chang, J.X.; Wang, Y.M.; Wang, X.B.; Zhao, J.S.; Meng, X.J.; Jing, Z.Q.; Zhang, J.H. A long-term scheduling method for cascade hydro-wind-PV complementary systems considering comprehensive utilization requirements and load characteristics. J. Clean. Prod. 2025, 494, 145032. [Google Scholar] [CrossRef] [Scilit]
- Yeh, W.W.G. Reservoir management and operations models: A state-of-the-art review. Water Resour. Res. 1985, 21, 1797–1818. [Google Scholar] [CrossRef] [Scilit]
- Oliveira, R.; Loucks, D.P. Operating rules for multireservoir systems. Water Resour. Res. 1997, 33, 839–852. [Google Scholar] [CrossRef] [Scilit]
- Rani, D.; Moreira, M.M. Simulation-optimization modeling: A survey and potential application in reservoir systems operation. Water Resour. Manag. 2010, 24, 1107–1138. [Google Scholar] [CrossRef] [Scilit]
- Karamouz, M.; Houck, M.H.; Delleur, J.W. Optimization and simulation of multiple reservoir systems. J. Water Resour. Plan. Manag. 1992, 118, 71–81. [Google Scholar] [CrossRef] [Scilit]
- Ahmadianfar, I.; Samadi-Koucheksaraee, A.; Razavi, S. Design of optimal operating rule curves for hydropower multi-reservoir systems by an influential optimization method. Renew. Energy 2023, 211, 508–521. [Google Scholar] [CrossRef] [Scilit]
- Castronuovo, E.D.; Lopes, J.A.P. Optimal operation and hydro storage sizing of a wind-hydro power plant. Int. J. Electr. Power Energy Syst. 2004, 26, 771–778. [Google Scholar] [CrossRef] [Scilit]
- Castronuovo, E.D.; Lopes, J.A.P. On the optimization of the daily operation of a wind-hydro power plant. IEEE Trans. Power Syst. 2004, 19, 1599–1606. [Google Scholar] [CrossRef] [Scilit]
- Ding, H.; Hu, Z.; Song, Y. Stochastic optimization of the daily operation of wind farm and pumped-hydro-storage plant. Renew. Energy 2012, 48, 571–578. [Google Scholar] [CrossRef] [Scilit]
- Zhang, Y.S.; Ma, C.; Yang, Y.; Pang, X.L.; Liu, L.; Lian, J.J. Study on short-term optimal operation of cascade hydro-photovoltaic hybrid systems. Appl. Energy 2021, 291, 116828. [Google Scholar] [CrossRef] [Scilit]
- Jia, R.; He, M.J.; Zhang, X.Y.; Zhao, Z.W.; Han, S.; Jurasz, J.; Chen, D.Y.; Xu, B.B. Optimal operation of cascade hydro-wind-photovoltaic complementary generation system with vibration avoidance strategy. Appl. Energy 2022, 324, 119735. [Google Scholar] [CrossRef] [Scilit]
- Liu, B.X.; Liu, T.Y.; Liao, S.L.; Lu, J.; Cheng, C.T. Short-term coordinated hybrid hydro-wind-solar optimal scheduling model considering multistage section restrictions. Renew. Energy 2023, 217, 119160. [Google Scholar] [CrossRef] [Scilit]
- Zhao, G.; Wan, C.X.; Zuo, W.Q.; Zhang, K.F.; Shu, X.Y. Research on multiobjective optimal operation strategy for wind-photovoltaic-hydro complementary power system. Int. J. Photoenergy 2022, 2022, 5209208. [Google Scholar] [CrossRef] [Scilit]

Disclaimer/Publisher’s Note: The statements, opinions and data contained in all publications are solely those of the individual author(s) and contributor(s) and not of MDPI and/or the editor(s). MDPI and/or the editor(s) disclaim responsibility for any injury to people or property resulting from any ideas, methods, instructions or products referred to in the content. |
© 2026 by the authors. Licensee MDPI, Basel, Switzerland. This article is an open access article distributed under the terms and conditions of the Creative Commons Attribution (CC BY) license.