


Abstract
Bubble curtains are non-physical fish-guidance devices that modify the hydrodynamic and acoustic environment near water intakes. This study quantified the liquid-phase velocity field generated by a bubble curtain placed in the vicinity of a water intake in a laboratory open-channel testing rig using planar Particle Image Velocimetry (PIV). Measurements were carried out at a background water velocity of 0.33 m/s for air-injection rates of 0, 5, 8, 10.5, and 15 L/min. Velocity fields were obtained at distances of 0, 20, 30, and 50 mm from the porous hose, with detailed analysis performed at 20 mm. Bubble regions were identified and masked before liquid-phase image correlation. Air injection modified the local velocity direction and produced localized velocity increases, with a maximum local liquid-phase velocity magnitude of approximately 0.42 m/s. Relative to the no-airflow reference velocity of 0.33 m/s, the spatially averaged velocity magnitude increased by approximately 6.7%, 11.8%, 15.2% and 16.7% at airflow rates of 5, 8, 10.5 and 15 L/min, respectively; however, the incremental increase between consecutive airflow conditions decreased from approximately 4.7% between 5 and 8 L/min to 3.1% between 8 and 10.5 L/min and 1.3% between 10.5 and 15 L/min. The spatially averaged velocity magnitude increased with airflow rate, while the incremental response decreased progressively at higher air-injection rates. Thus, 8 L/min represents a candidate energy-efficient operating condition under the tested laboratory conditions. The results provide hydraulic information relevant to subsequent fish-behavior experiments; however, fish-guidance performance cannot be inferred from the present hydrodynamic measurements alone. The results provide a hydraulic basis for designing subsequent fish-behavior experiments. Because no fish were present during the measurements, the study does not assess fish attraction, avoidance, movement restriction, passage, entrainment, or guidance efficiency. Fish-guidance performance cannot be inferred from the present hydrodynamic measurements alone.
1. Introduction
Fish habitat protection in the vicinity of water-diversion and water-intake structures is a recurring concern in hydraulic and ecological engineering. Hydrotechnical constructions can modify local hydrodynamic conditions and may lead to injury or mortality in fish fauna [1]. To mitigate these effects, fishways and related guidance measures are increasingly integrated into hydraulic infrastructure [2] with the aim of preserving or restoring longitudinal river connectivity.
To protect the fish habitat and restore river connectivity, various systems and installations for fish guidance (physical or behavioral) have been developed, such as [1,3]: exclusion screens, steering panels, grates, acoustic sensors, gas bubble injection systems, etc. Fish guidance systems are designed to discourage migration of certain species or to direct fish away from hydropower facilities and water intakes, using either physical (structural) or non-physical (behavioral) barriers. Conventional physical devices such as grates and screens may be ineffective for some smaller or juvenile fish and for species with specific swimming performance, so design criteria must consider body size, biomechanics, age, and species-specific behavior [4]. National and international legislation on aquatic habitat protection has been progressively updated to require fish-protection alternatives in passage, diversion, and catchment structures [5,6]. These regulations emphasize not only safe transit through such constructions but also prevention of injury or mortality during operation. Accordingly, optimal systems for capturing and/or guiding fish to or away from water intakes should be designed with due consideration of the size and behavior of the local species.
Numerous investigations have sought to improve the efficiency of fishways or fish guidance systems by addressing the influence of certain stimuli on fish behavior: changes in hydrodynamic regime, water velocity [7], turbulence [8,9], and the presence of obstacles in the flow (boulders, grates, various constructions) [7]. By analyzing different studies on fish swimming behavior in altered flows, Liao C. [9] showed that the fish are deterred by chaotic flows with high velocity fluctuations, while they can be attracted by flows “that have a component of predictability.”
Among the literature studies addressing the fish ladders efficiency, Bunt et al. [2] analyze and compare the results of numerous fish passage types and various species of fish, showing that the system efficiency depends both on biological characteristics of the fish and on design and hydraulic parameters. To enhance fish attraction or diversion, Ref. [10] examined whether hydraulic noise generated by turbulence can mask velocity-gradient cues. The experimental results showed that the detection of such stimuli is reduced under high turbulence. Other work has focused on the role of hydrodynamics in fish behavior and swimming efficiency. Using numerical modeling and field data (bathymetry, acoustic telemetry, and ADCP measurements), Silva et al. [11] investigated how hydrodynamic patterns affect fine-scale fish movements near water intakes. Hockley et al. [7] related fish behavior to flow conditions (velocity and turbulence) while accounting for body size and sex. In experiments with guppies (Poecilia reticulata) in a free-surface channel modified by boulders, larger individuals preferred zones with higher velocity and lower turbulence, whereas smaller fish spent more time in areas with lower velocity and higher turbulence, typically downstream of the boulders.
Mogdans [12] showed that fish possess specialized organs that act as velocity and pressure-gradient detectors, such as the lateral line of the auditory/sensory system. These detectors help fish orientation. The neural signals generated by these detectors can be exploited to guide fish away from hazardous areas or to attract them along predefined routes.
Given the existence of the specialized fish organs mentioned above, several alternative fish barrier/guidance technologies have been developed based on different stimuli (sound, light, chemical, etc.).
The broader application of the investigated bubble curtain is fish guidance near water intakes. However, the specific objective of the present study is limited to quantifying the liquid-phase velocity field generated by the curtain in the absence of fish. This fish-guidance solution was chosen considering that the bubble curtains generate in-water sound waves related to the propagation and splitting of the bubbles while creating a visual barrier in the aquatic environment and changing the local velocity. Thus, this behavioral barrier creates separate acoustic and hydrodynamic fields that can be detected by fish. It is to be noted that the sound of the bubbles splitting is close to the acoustic range of the fish auditory organs, as reported by Popper and Schilt [13] and Braun et al. [14]. The current study is performed on a water-intake experimental model with a behavioral barrier and investigates the local water-velocity modification due to the bubbles’ presence by Particle Image Velocimetry (PIV) measurements. This approach represents a further analysis of the velocity field measurements previously obtained by the authors using a Pitot-Prandtl tube [15] placed inside the scale model. While the previous Pitot-Prandtl measurements provided velocity information at discrete locations, the present PIV measurements provide spatially resolved velocity fields, enabling the visualization and quantification of local flow modifications induced by the bubble curtain. In the authors’ previous study [15], the velocity induced by the bubble curtain was investigated using pointwise Pitot-Prandtl measurements at airflow rates of 10.5 and 15 L/min. The present study extends this investigation by applying PIV and including two additional lower airflow rates, 5 and 8 L/min. This experimental design enables spatially resolved characterization of the velocity field and allows the hydrodynamic response to be evaluated over a broader range of airflow conditions, including the identification of a possible saturation of the velocity response at lower airflow rates. In the current research, PIV measurements are performed in the absence of fish to characterize the spatial distribution of water velocity within the experimental tank. The resulting hydraulic conditions will be subsequently related to the swimming behavior and spatial distribution of fish exposed to the same flow conditions, allowing behavioral responses to be evaluated against local flow velocities. Thus, this work does not evaluate fish behavior directly. It establishes the spatially resolved hydraulic conditions required for subsequent fish-guidance experiments. The novelty of the present study compared with our previous Pitot-Prandtl measurements [15] lies in the use of Particle Image Velocimetry to obtain spatially resolved two-dimensional velocity fields in the vicinity of the bubble curtain. While previous measurements provided velocity information at discrete measurement locations, the present PIV approach enables the spatial distribution of velocity magnitude, velocity vectors, and flow fluctuations to be characterized over an extended measurement plane. In addition, the present study quantitatively evaluates the hydrodynamic response as a function of airflow rate using spatially averaged velocity variation, RMS fluctuations, and measurement uncertainty. This allows the identification of an airflow rate above which no further measurable hydrodynamic benefit is obtained.
2. Conceptual Background on Behavioral Barriers for Water Intakes
Compared with other guidance technologies, behavioral barriers based on bubble curtains represent a low-cost and reduced-maintenance solution that does not alter river morphology and is suitable for shallow water bodies with rapid level changes [16]. Because combined solutions are generally more effective, stroboscopic lighting can be used together with bubble curtains to enhance the deterrent effect. Ambient light influences fish orientation, feeding, communication, etc., while strobe lights introduce artificial illumination that can trigger avoidance responses. The performance of such systems depends on the target species, light intensity and design, turbidity, and ambient light conditions [17]. To improve efficiency under real operating conditions, the authors have proposed a patent application [18] that combines a bubble curtain with an optoelectronic device generating strobe light, forming a behavioral barrier intended to reduce the accidental entry of small fish and juveniles through the intake openings.
Given that a bubble curtain may act as a behavioral barrier influencing fish movement, it is necessary to determine and examine the corresponding velocity field in order to assess how effective it could be for particular species or fish sizes. Published swimming-performance metrics, including Ucrit, may provide a preliminary hydraulic reference when designing subsequent behavioral experiments. However, these metrics cannot be interpreted as behavioral thresholds or used alone to predict fish avoidance, passage, guidance, or movement restriction. If a velocity-based deterrent is considered in a future design, its effectiveness must be established experimentally for the target species, size classes, and hydraulic conditions. Exceeding a published swimming-performance value [19] alone is not sufficient to demonstrate a behavioral barrier.
When designing and constructing fish guidance systems, whether intended to attract or deter fish, it is essential to consider both the characteristics of the water body (flow, depth, seasonal variations, etc.) and the fish species present, together with their swimming traits (anaerobic and aerobic capabilities). As outlined in the following paragraphs, numerous studies have examined fish swimming capacity and the changes in behavior that occur when fish encounter physical or non-physical barriers.
Velocity barriers can be effective when used to guide or repel fish away from specific structures, for example, to prevent their entrainment in water intakes. However, if the local velocities generated by such barriers in rivers are excessively high, they may impede fish movement and disrupt longitudinal connectivity of the species in the river. According to Castro-Santos and Haro [20], the performance of a fish passage “is the product of locomotor behavior generally, including guidance, attraction, and ascent or descent through the fishway”, and does not depend only on swimming ability. Sanz-Ronda et al. [21] assessed a velocity barrier based on a Flat-V gauging weir for the Iberian barbel (Luciobarbus bocagei), focusing on the velocity field along the barrier. Kapitze [22] reviewed barrier and fishway types for road crossings, relating hydraulic characteristics (total, partial, or temporal barriers) to fish swimming ability and speed. Sanchez-Gonzalez et al. [23] examined passage through velocity barriers for the northern straight-mouth nase (Pseudochondrostoma duriense) in rivers from Portugal and Spain, showing that swimming capacity depends mainly on fish size, with larger individuals performing better at high velocities, while body shape also plays a significant role.
Fish population protection and species continuity are also approached by different studies [24,25]. O’Connor et al. [24] analyzed different barrier types, with their advantages and disadvantages, and elaborated a guide for deploying fish passages at small structures in order to diminish biodiversity loss and fish population decline. Liang et al. [25] studied velocity preference in Schizothorax oconnori Lloyd using four channels with velocities up to 0.75 m/s. The preferred velocity varied with season and time of day, indicating that non-uniform flow fields offering different depths and light levels are preferable.
In the current study, the velocity field in the free-surface channel is modified by both water capture through the water-intake orifices and the presence of the bubble curtain. Even if the authors do not expect to find a radically modified velocity field (meaning a highly increased velocity), it is necessary to determine the local modification of the hydrodynamics. In this scope, PIV can be applied to study two-phase flows, representing a reliable and detailed method. This technique is used by researchers in studies aimed at an in-depth characterization of the flow for different specific cases. In two-phase flows, PIV can be applied under both static and dynamic liquid-phase conditions to investigate mixing and homogenization, mass transfer, bubble size, rise velocity, and flow regime, among other aspects. Kovats et al. [26] used PIV in a bubble column to measure continuous-phase (water) velocities, thereby improving flow characterization and supporting a better understanding of the mass-transfer mechanism. Murgan et al. [27] combined PIV with Laser-Induced Fluorescence (LIF) to map the continuous-phase velocity field generated by a sparger in a column with quiescent water. Laakkonen et al. [28] employed PIV to quantify bubble-size distribution and gas holdup in water moving within a stirred tank.
Concerning the application of PIV to free-surface flows, the literature reports several specific cases in which this technique has yielded valuable insights. Yao et al. [29] used PIV to quantify turbulence generated by a grid installed in a free-surface channel. In naval research, Seol et al. [30] employed towed underwater PIV to measure vertical and horizontal velocity fields behind a floating body, characterizing the turbulent wake and the effect of the free surface. Muste et al. [31] demonstrated that image velocimetry can be applied to relatively large free-surface flows, such as rivers; tests have been conducted in a large laboratory channel where PIV was combined with controlled surface-wave image velocimetry to support sediment management at a river water intake, obtaining velocity fields, streamlines, and vorticity. Lindmark [32] combined Laser Doppler Velocimetry and PIV to measure velocity and flow structure in a channel, investigating attraction and guidance strategies for directing fish upstream or deterring them from the intake.
Recent work has made growing use of PIV to explore the coupling between fish swimming behavior and the adjacent flow field. Stoilova et al. [33] evaluated a bubble curtain and a physical net barrier for downstream guidance of European eel (Anguilla anguilla) under flow velocities ranging from 0.1 m/s to 1 m/s. The bubble curtain did not produce a significant change in passage rates relative to the control test, whereas the net barrier produced a stronger guidance effect. These results indicate that the efficiency of behavioral barriers depends on the interaction between barrier characteristics, flow conditions, and species-specific responses.
PIV has also been applied to characterize the hydrodynamic mechanisms associated with fish locomotion. Tu et al. [34] used time-resolved tomographic PIV to reconstruct the three-dimensional wake of swimming fish, identifying coherent vortex structures associated with tail movements and thrust production. Similarly, Ref. [35] combined PIV with pressure-field reconstruction to estimate the hydrodynamic stimuli acting on swimming fish. Their results demonstrate that PIV can provide information not only on velocity fields but also on pressure gradients and flow structures potentially detected by the fish lateral-line system.
Particularly relevant to experiments involving juvenile cyprinids, the research in [36] used PIV to investigate the movement of juvenile Carassius auratus during different swimming types. The highest swimming speed was observed during C-shaped turning, while forward swimming was associated with sustained locomotion. The PIV analysis showed that vorticity around the caudal fin was closely related to propulsive force, with intensified vortical structures occurring during acceleration and turning. These findings demonstrate that changes in swimming mode are accompanied by measurable modifications in the surrounding flow field and provide a useful basis for relating fish swimming speed and acceleration to local hydrodynamic conditions.
In the current research, PIV measurements were performed in the absence of fish to determine the spatial distribution of water velocity inside the experimental tank. The resulting hydraulic conditions will be subsequently related to the swimming behavior and spatial distribution of fish exposed to the same flow conditions, allowing behavioral responses to be evaluated against local flow velocities.
3. Experimental Setup
3.1. Laboratory Water Intake Experimental Setup
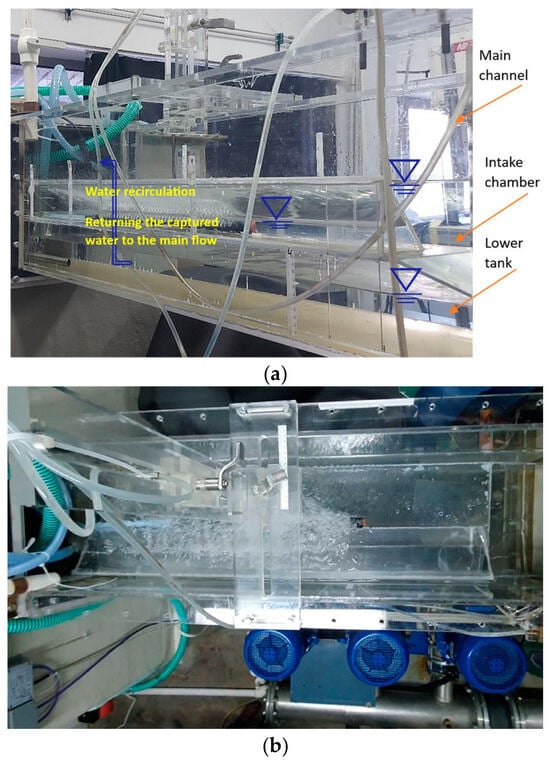
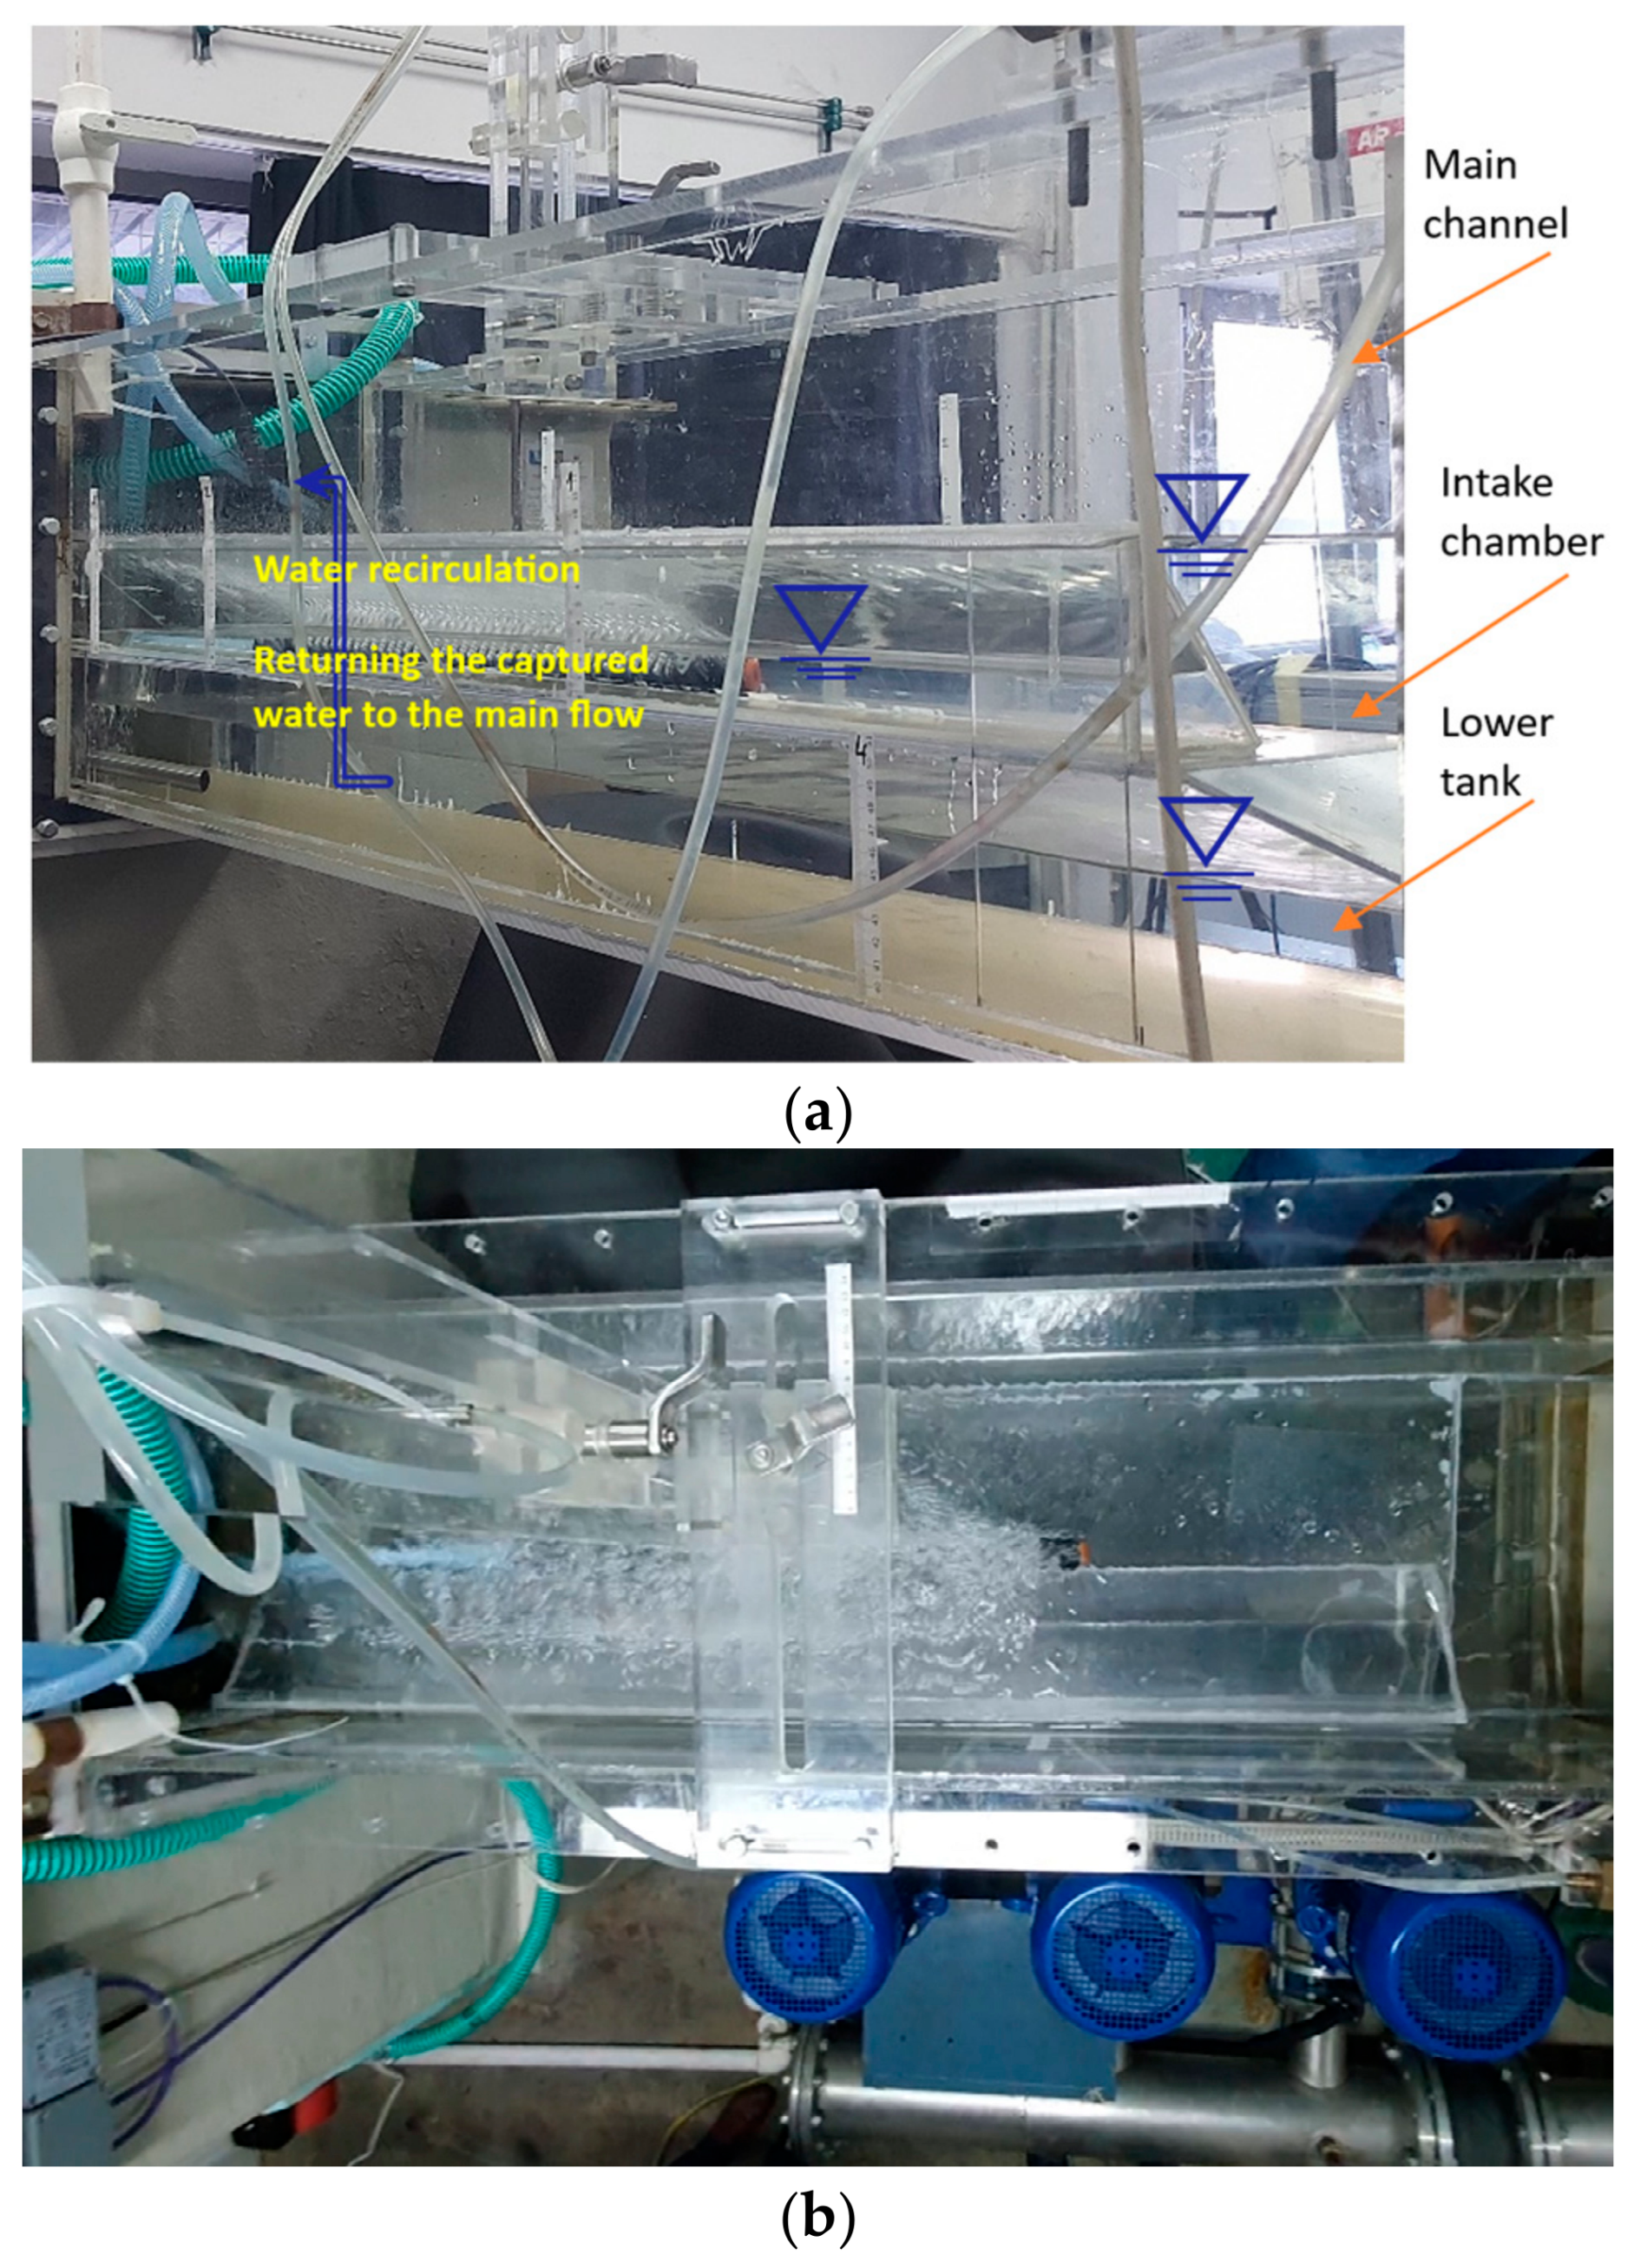
To determine the flow velocities associated with the operation in tandem of a behavioral barrier consisting of a bubble curtain with an ecological water intake, a specially designed experimental setup was used. The laboratory water-intake model and bubble-curtain configuration used in the present study are based on the experimental setup previously described by Cîrciumaru et al. [15,37], who reported a detailed characterization of the hydraulic and dissolved-oxygen response using pointwise Pitot–Prandtl measurements. To test the operation of the water intake with a behavioral barrier, the components were placed into a free-surface closed-circuit channel. The hydraulic setup is provided with a transparent test and visualization section, recirculation pumps, variable-speed motors, a measurement and control system of the water flow rate and velocity in the test section, as well as a data acquisition, analysis, and processing system. The test and visualization section is 375 × 300 × 1015 mm; water velocity in this area can change in the range 0.1–1 m/s. The experimental setup represents a laboratory-scale physical model intended primarily for comparative hydrodynamic characterization of the bubble curtain. The model was not designed for direct extrapolation of the measured results to a full-scale installation; therefore, the results should be interpreted within the tested laboratory conditions. Inside this hydraulic setup there were placed the water intake model and the porous hose for the bubble curtain generation. Considering that the experiments were carried out in a closed-circuit test channel, the water intake model has been designed and built to operate in these specific conditions. Thus, it consists of an intake chamber, a lower tank, and a hydraulic circuit provided with a pump that recirculates the water, returning it to the main flow inside the channel (Figure 1).
Figure 1.
Experimental setup: (a) The water intake with behavioral barrier integrated in the free surface channel; (b) Top view of the experimental setup.
Hence, the water captured from the main channel through some orifices perforated into the intake chamber lateral wall is gravitationally discharged into a lower tank; from this enclosure, with the help of a pump, the water is brought back into the main channel. The discharge from the intake is measured with a flow meter, integrated into the recirculation circuit.
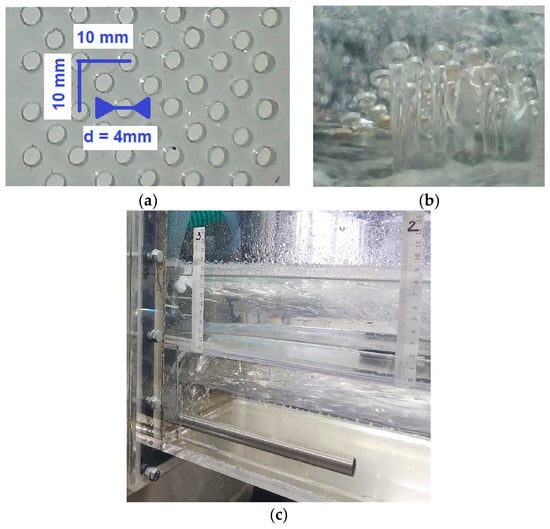
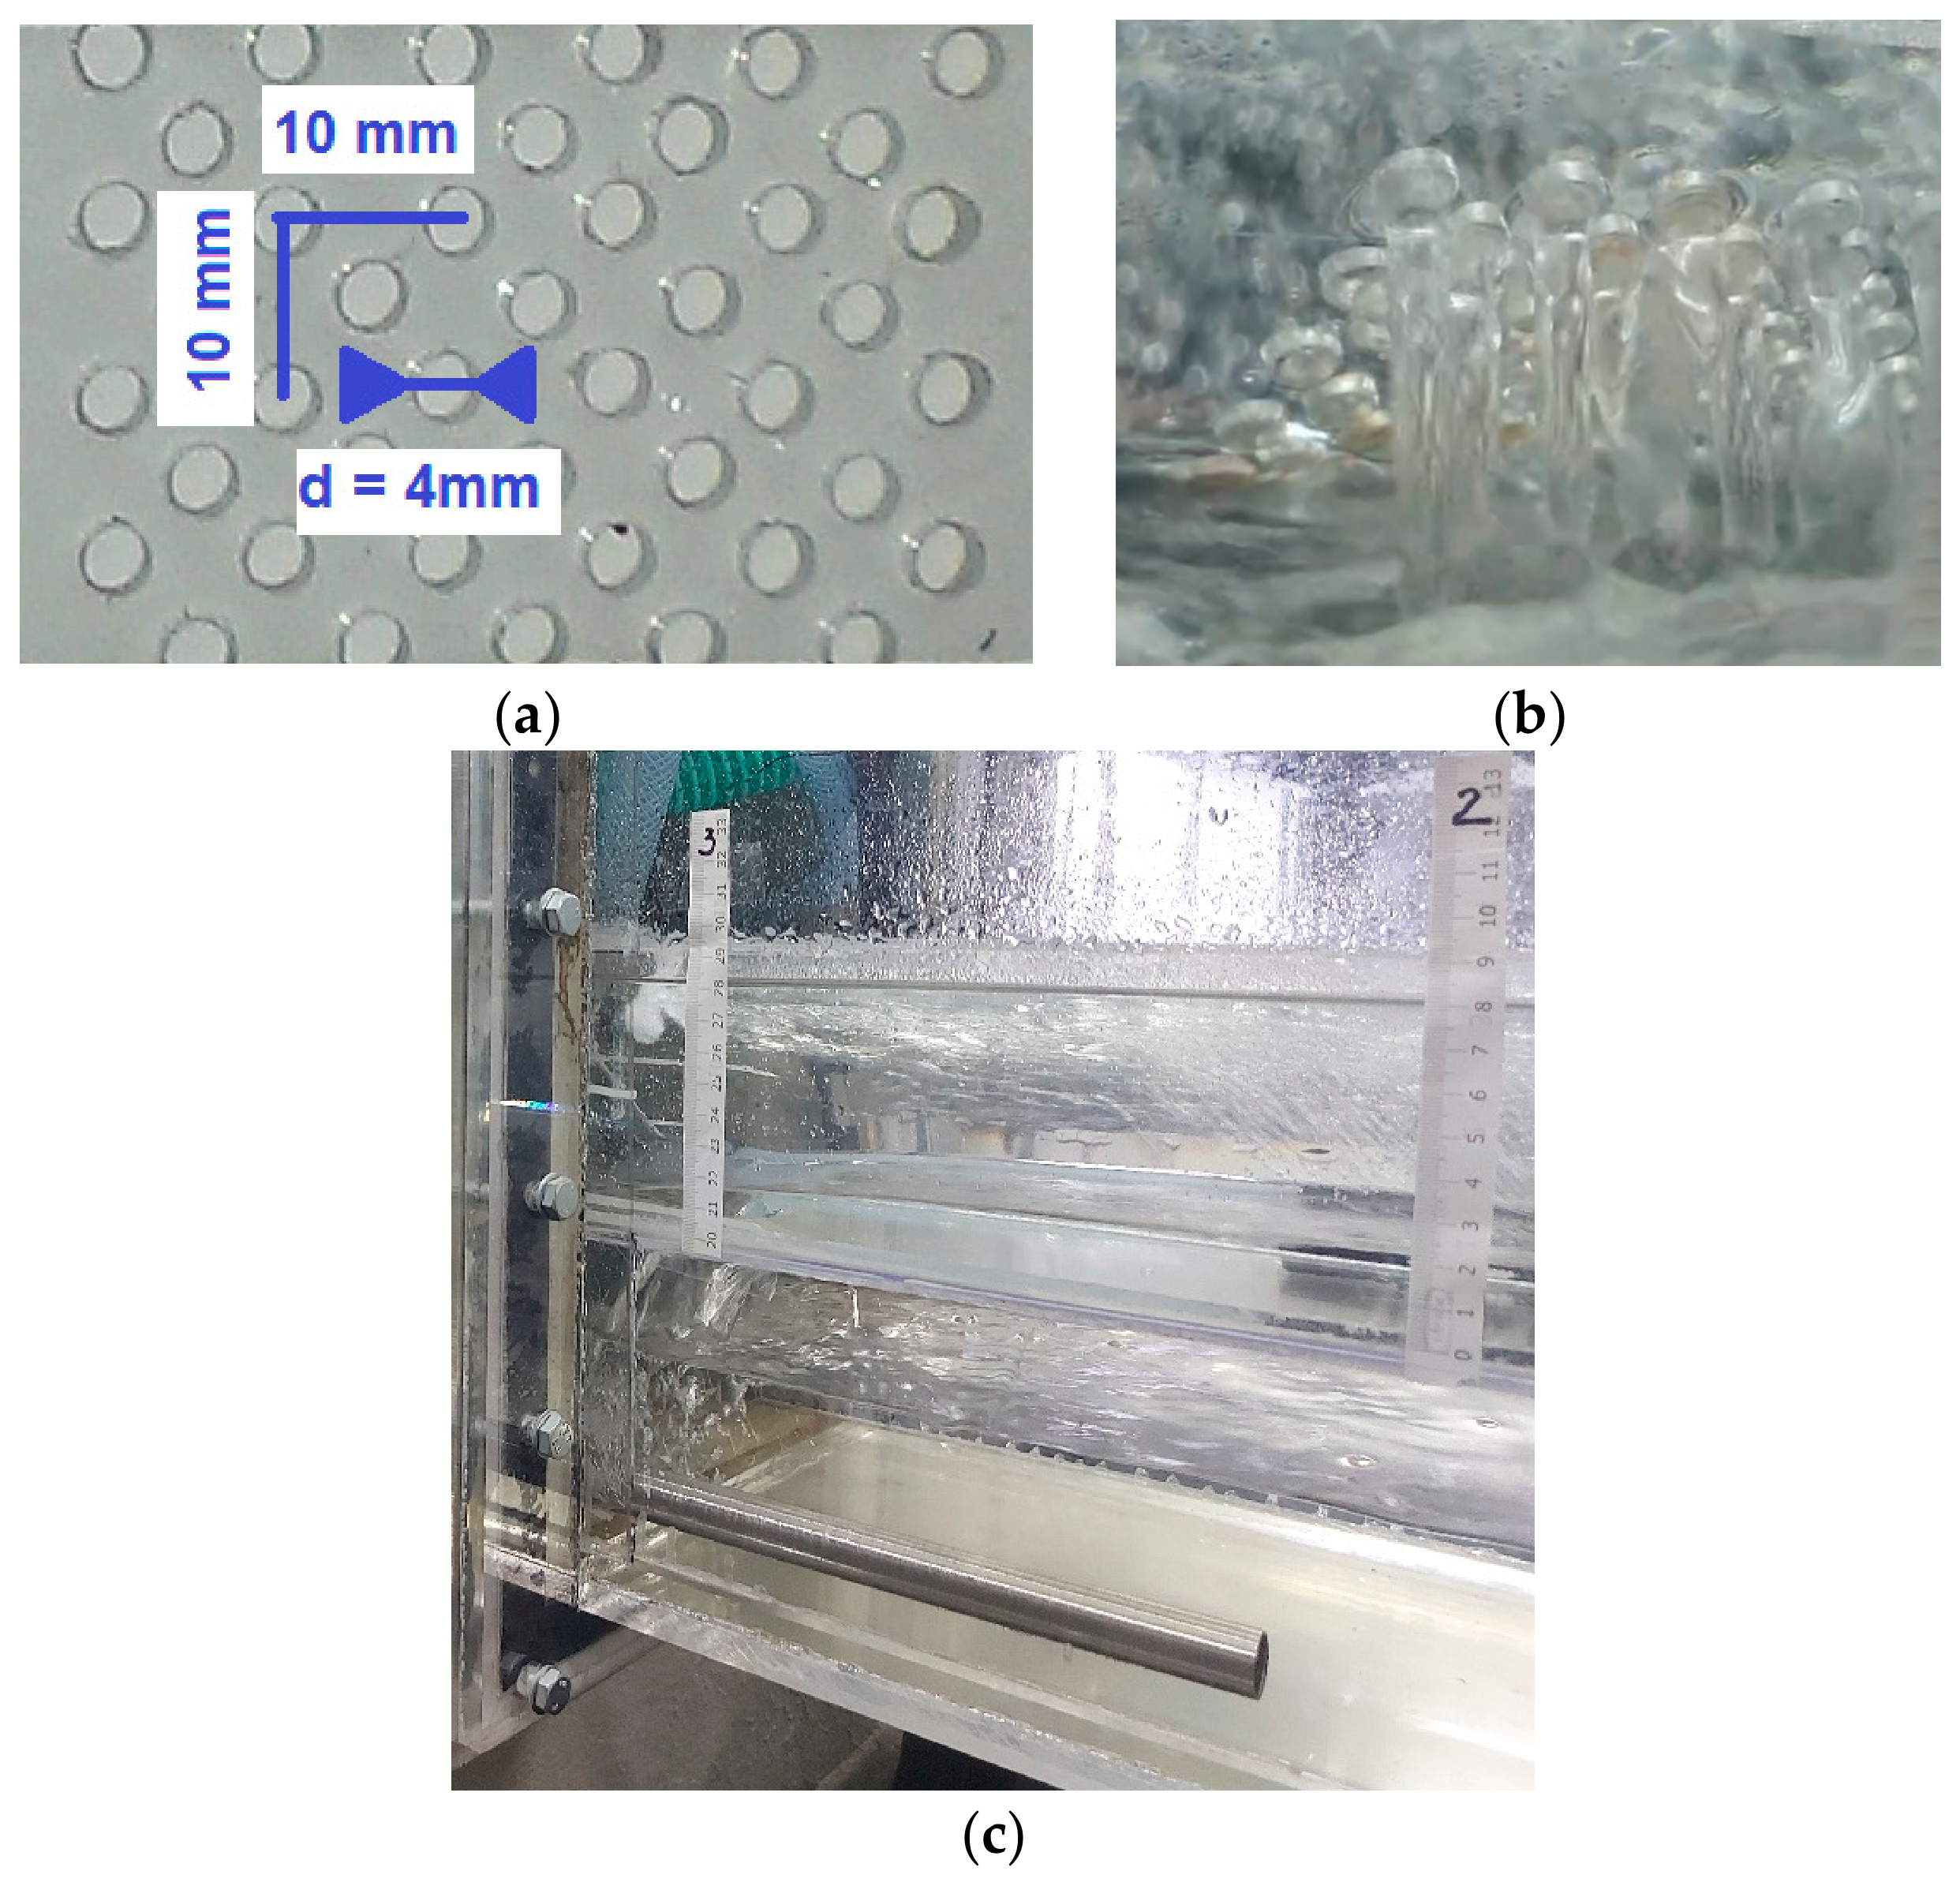
To characterize the local liquid-phase velocity modification produced by the bubble curtain, the water-circulation system was first operated under the no-airflow reference condition until a channel velocity of 0.33 m/s and a water level of 92 mm were established. After this reference condition had been reached, the water-pump settings and the channel-flow control settings were kept unchanged while compressed air was introduced through the porous hose at the selected airflow rates. The resulting velocity fields were then measured using PIV. Therefore, the value of 0.33 m/s represents the established no-airflow reference velocity and was not re-imposed after each change in airflow rate. Throughout the tests, the water level in the intake reservoir was maintained constant, and the discharge captured by the water intake was kept at 2.04 m3/h using the same intake configuration, with 80 of the 440 available 4 mm orifices active. These controls ensured that the principal water-flow and intake boundary conditions remained unchanged while the airflow rate was varied. Five imposed airflow conditions were investigated: a no-airflow reference condition (0 L/min) and four non-zero airflow rates up to 15 L/min. The selection of the airflow rates was based on the operating conditions investigated in the authors’ previous study [15], where the water velocity of the liquid phase induced in the water by the presence of the bubble curtain was measured using a Pitot-Prandtl tube (Paul Gothe GmbH, Bochum, Germany) at airflow rates of 10.5 and 15 L/min. In the present study, these two airflow rates were retained to allow comparison with the previous measurements, while two additional lower airflow rates, 5 and 8 L/min, were introduced to provide a more detailed characterization of the hydrodynamic response at reduced air injection rates. The zero-airflow condition (0 L/min) was used as the reference case. This selection of five conditions (0, 5, 8, 10.5 and 15 L/min) therefore allows the present PIV measurements to both complement the previous pointwise measurements and investigate whether the hydrodynamic effect of the bubble curtain reaches a saturation level at lower airflow rates. Thus, images were taken at different distances from the porous hose for each of the five cases. This test method allows separate determination of the velocity field in single-phase and two-phase flow regimes, respectively. Therefore, the bubble curtain influence on the water flow in the channel can be determined. Following the same operation method, the induced speed of the water was previously determined [15] using a Pitot-Prandtl tube. The water velocity in the main channel was determined using the water flow rate and velocity measurement and control system of the hydraulic channel, which has incorporated a Pitot-Prandtl tube connected to an AppliSens model of differential pressure transducer, model type APRE-2000 (Getinge Applikon, Delft, The Netherlands); it has an accuracy of ±0.1% of the range −5 to 70 mbar. The captured water flow rate was measured with an Axioma smart ultrasonic flowmeter (UAB Axioma Metering, Biruliskes, Lithuania), Qalcosonic W1 model. Figure 2a shows a detailed view of the perforated surface of the water intake, while Figure 2b presents the water entering the intake chamber through the perforated orifices. Figure 2c shows of the water flow from the intake chamber to the lower chamber.
Figure 2.
Details on the water intake: (a) The perforated surface of the water intake; (b) Water entering the intake chamber through the perforated orifices; (c) Gravitational flow from the upper to the lower chamber of the water intake.
For generating the bubble curtain, a porous hose was used. The injected airflow rate was measured using a 0 to 20 L/min Cole-Parmer flowmeter (Vernon Hills, IL, USA) having an accuracy of ±5% of the full scale.
3.2. PIV Experimental Setup for the Water Intake
The essential principle of the PIV method is to determine the local flow velocities, starting from the local displacements of the seeding particles.
This technique is based on the intercorrelation of images of a flow, recorded by CCD or CMOS sensors. The flow is pre-seeded with fine solid or liquid particles. If, in a very short time ∆t, a particle moves from position x to position x + ∆x, the local velocity of movement can be expressed by the relation [38]
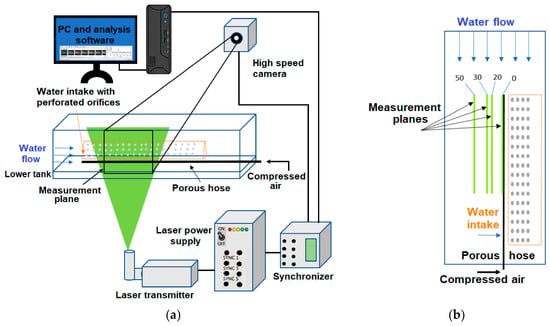
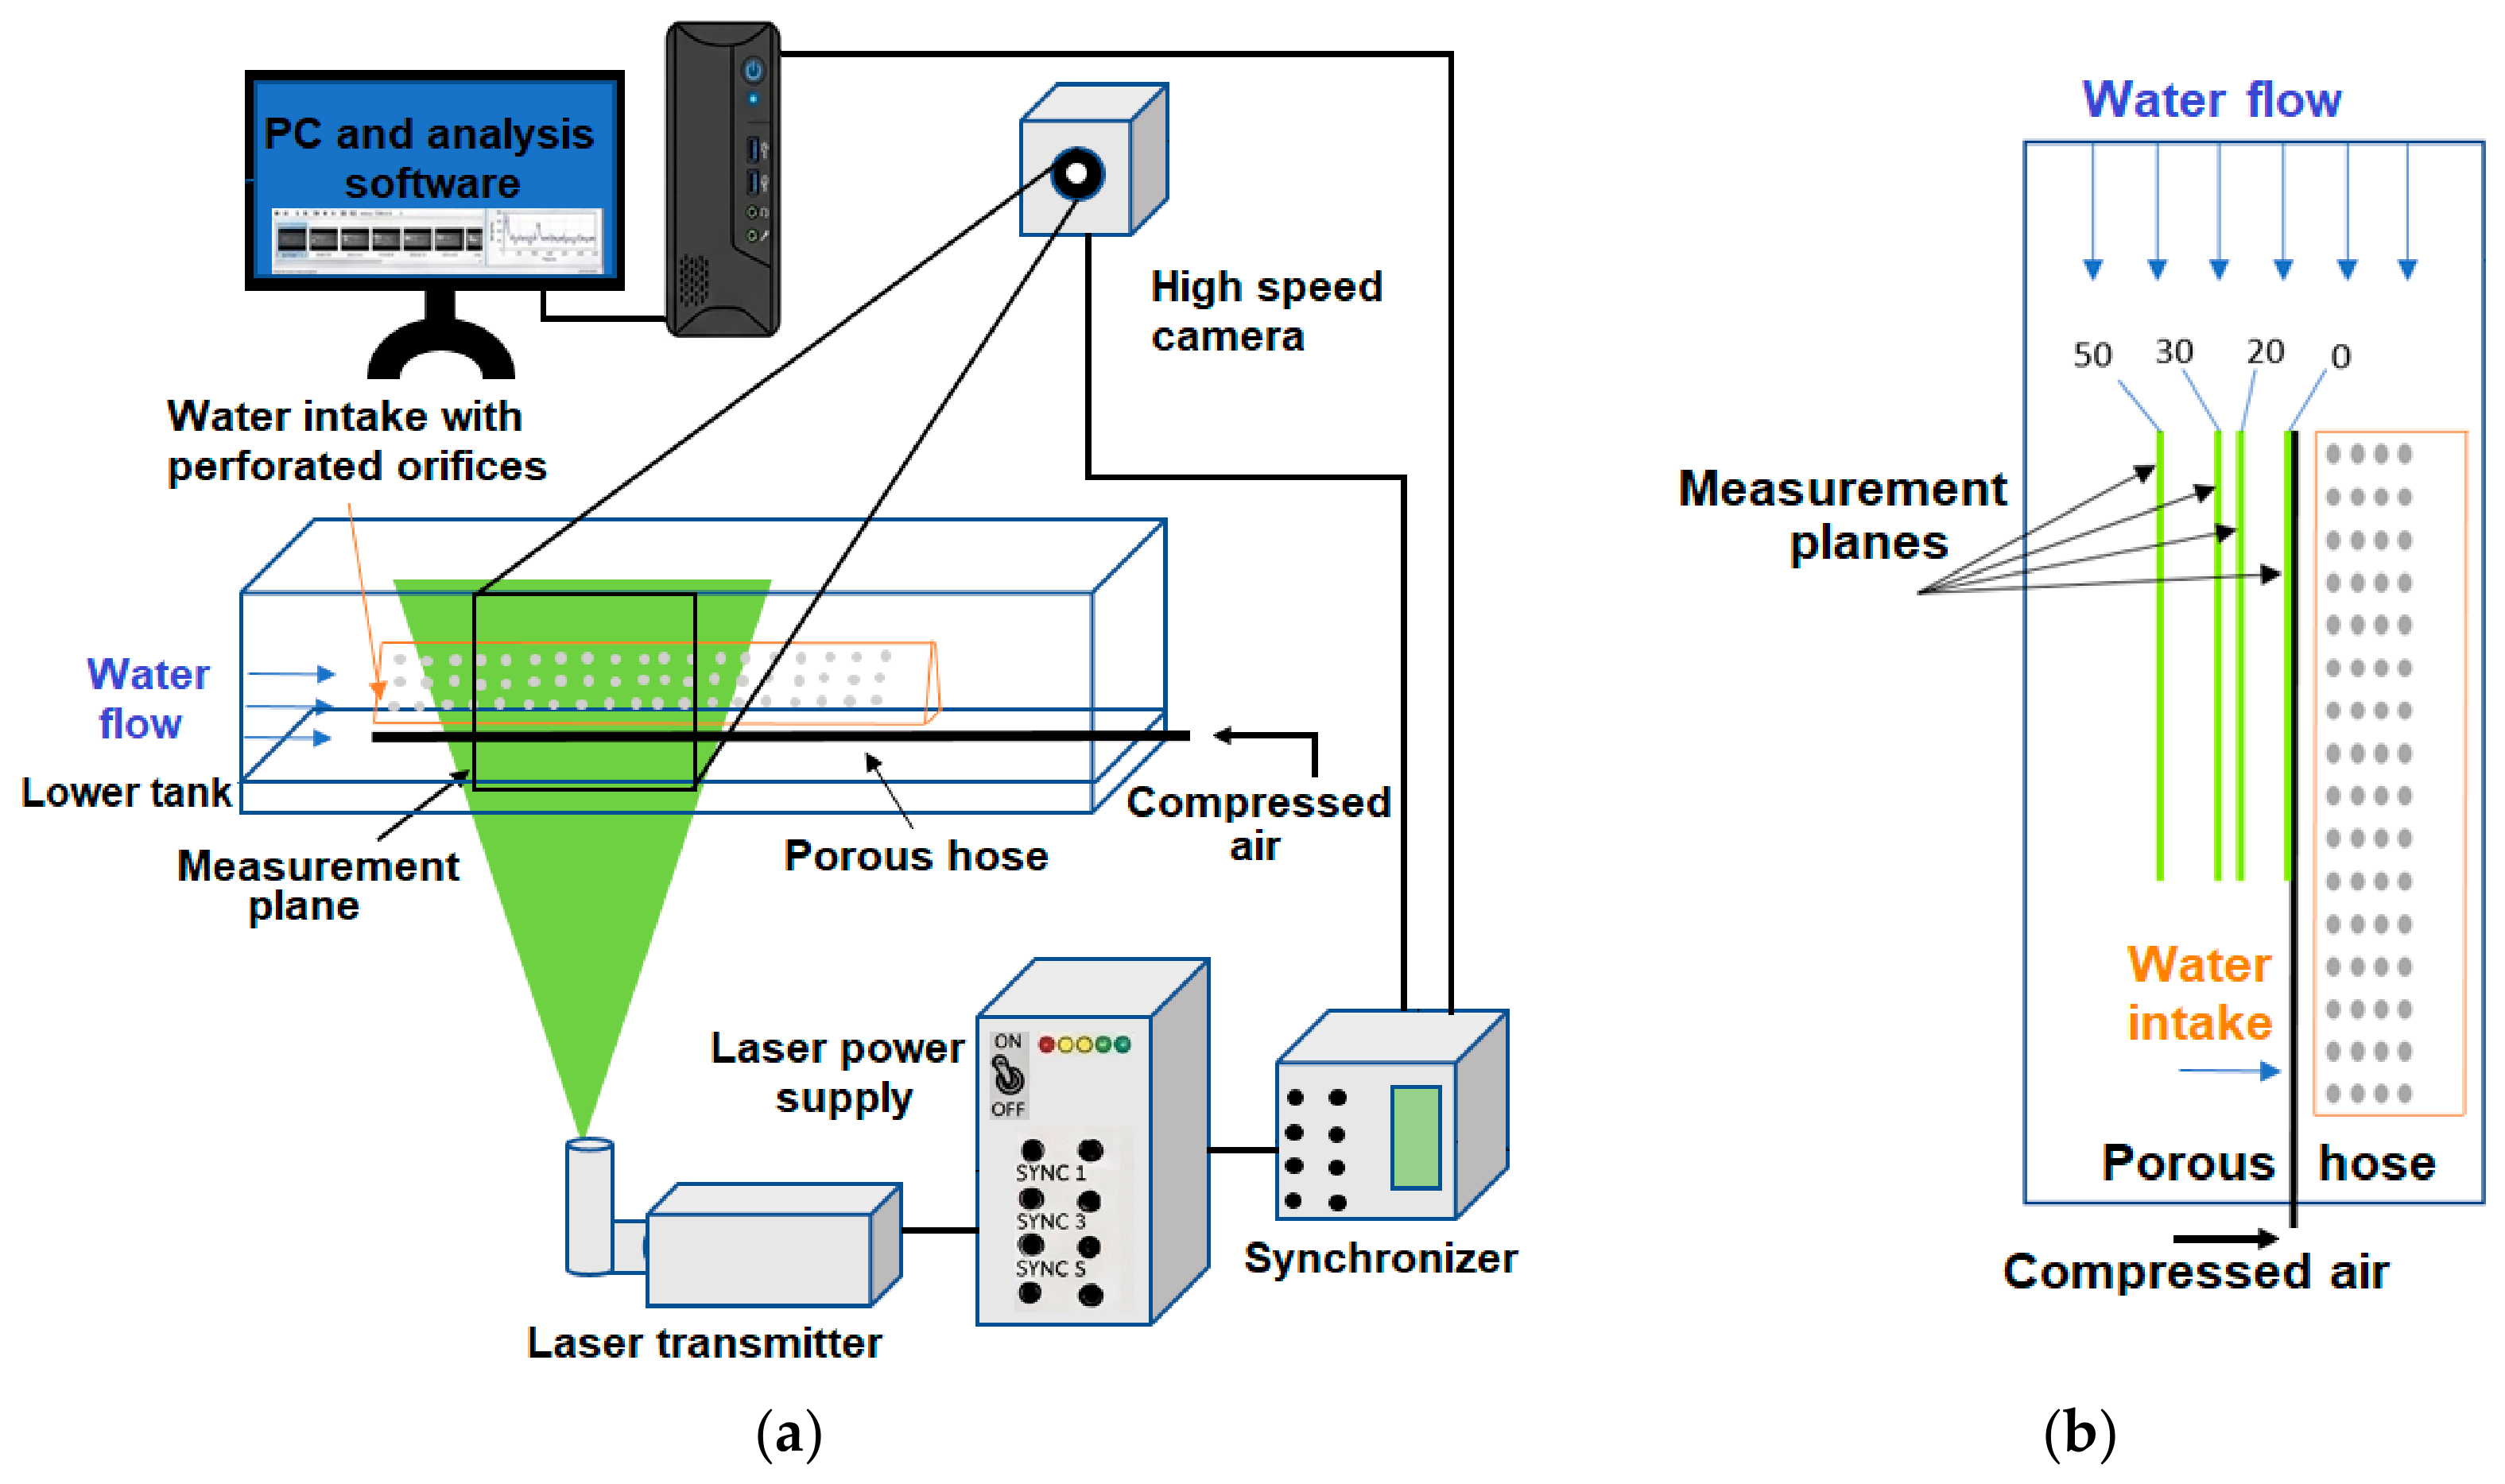
The PIV system used in the present research consists of a Litron Nd:YAG pulsed laser (Litron Lasers, Rugby, UK) with a light sheet generator, with the purpose of highlighting seeded particles from the studied flow; a CCD FlowSenseEO_4M-32 camera (Dantec Dynamics, Skovlunde, Denmark) to capture frames with seeded particles from the interest zone at the imposed time between a pair of two consecutive frames. The synchronization of the two components was made with a BNC 575 synchronizer, its purpose being to simultaneously trigger the laser and camera, in order to take pictures when the laser illuminates the area of interest. PIV system control and setup were done using a PC with Dynamic Studio 7.2 software installed. For this case study, hollow spherical particles with a diameter of 10 µm were used. Figure 3 presents a schematic diagram of the PIV system [39].
Figure 3.
Schematic representation of the PIV system (a) and measurement planes (b).
For each test case, the following conditions were imposed: 4 Hz frequency, 100% laser power, and different time values between pulses (frames). The last parameter is the most important, being considered in the velocity vector calculation. Thus, for each experimental condition, one measurement sequence consisting of 250 image pairs was acquired.
2D PIV measurements were performed along the flow at different distances from the porous hose (see Figure 3). Using this method, we obtained the spatial distribution of velocity magnitude without disturbing the flow of water.
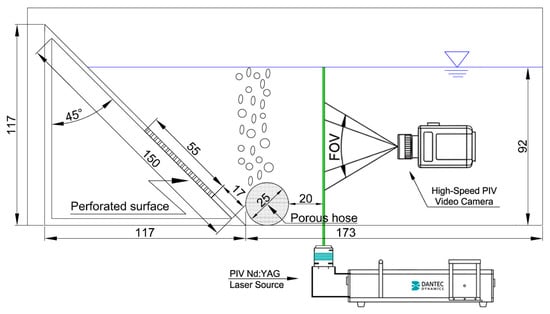
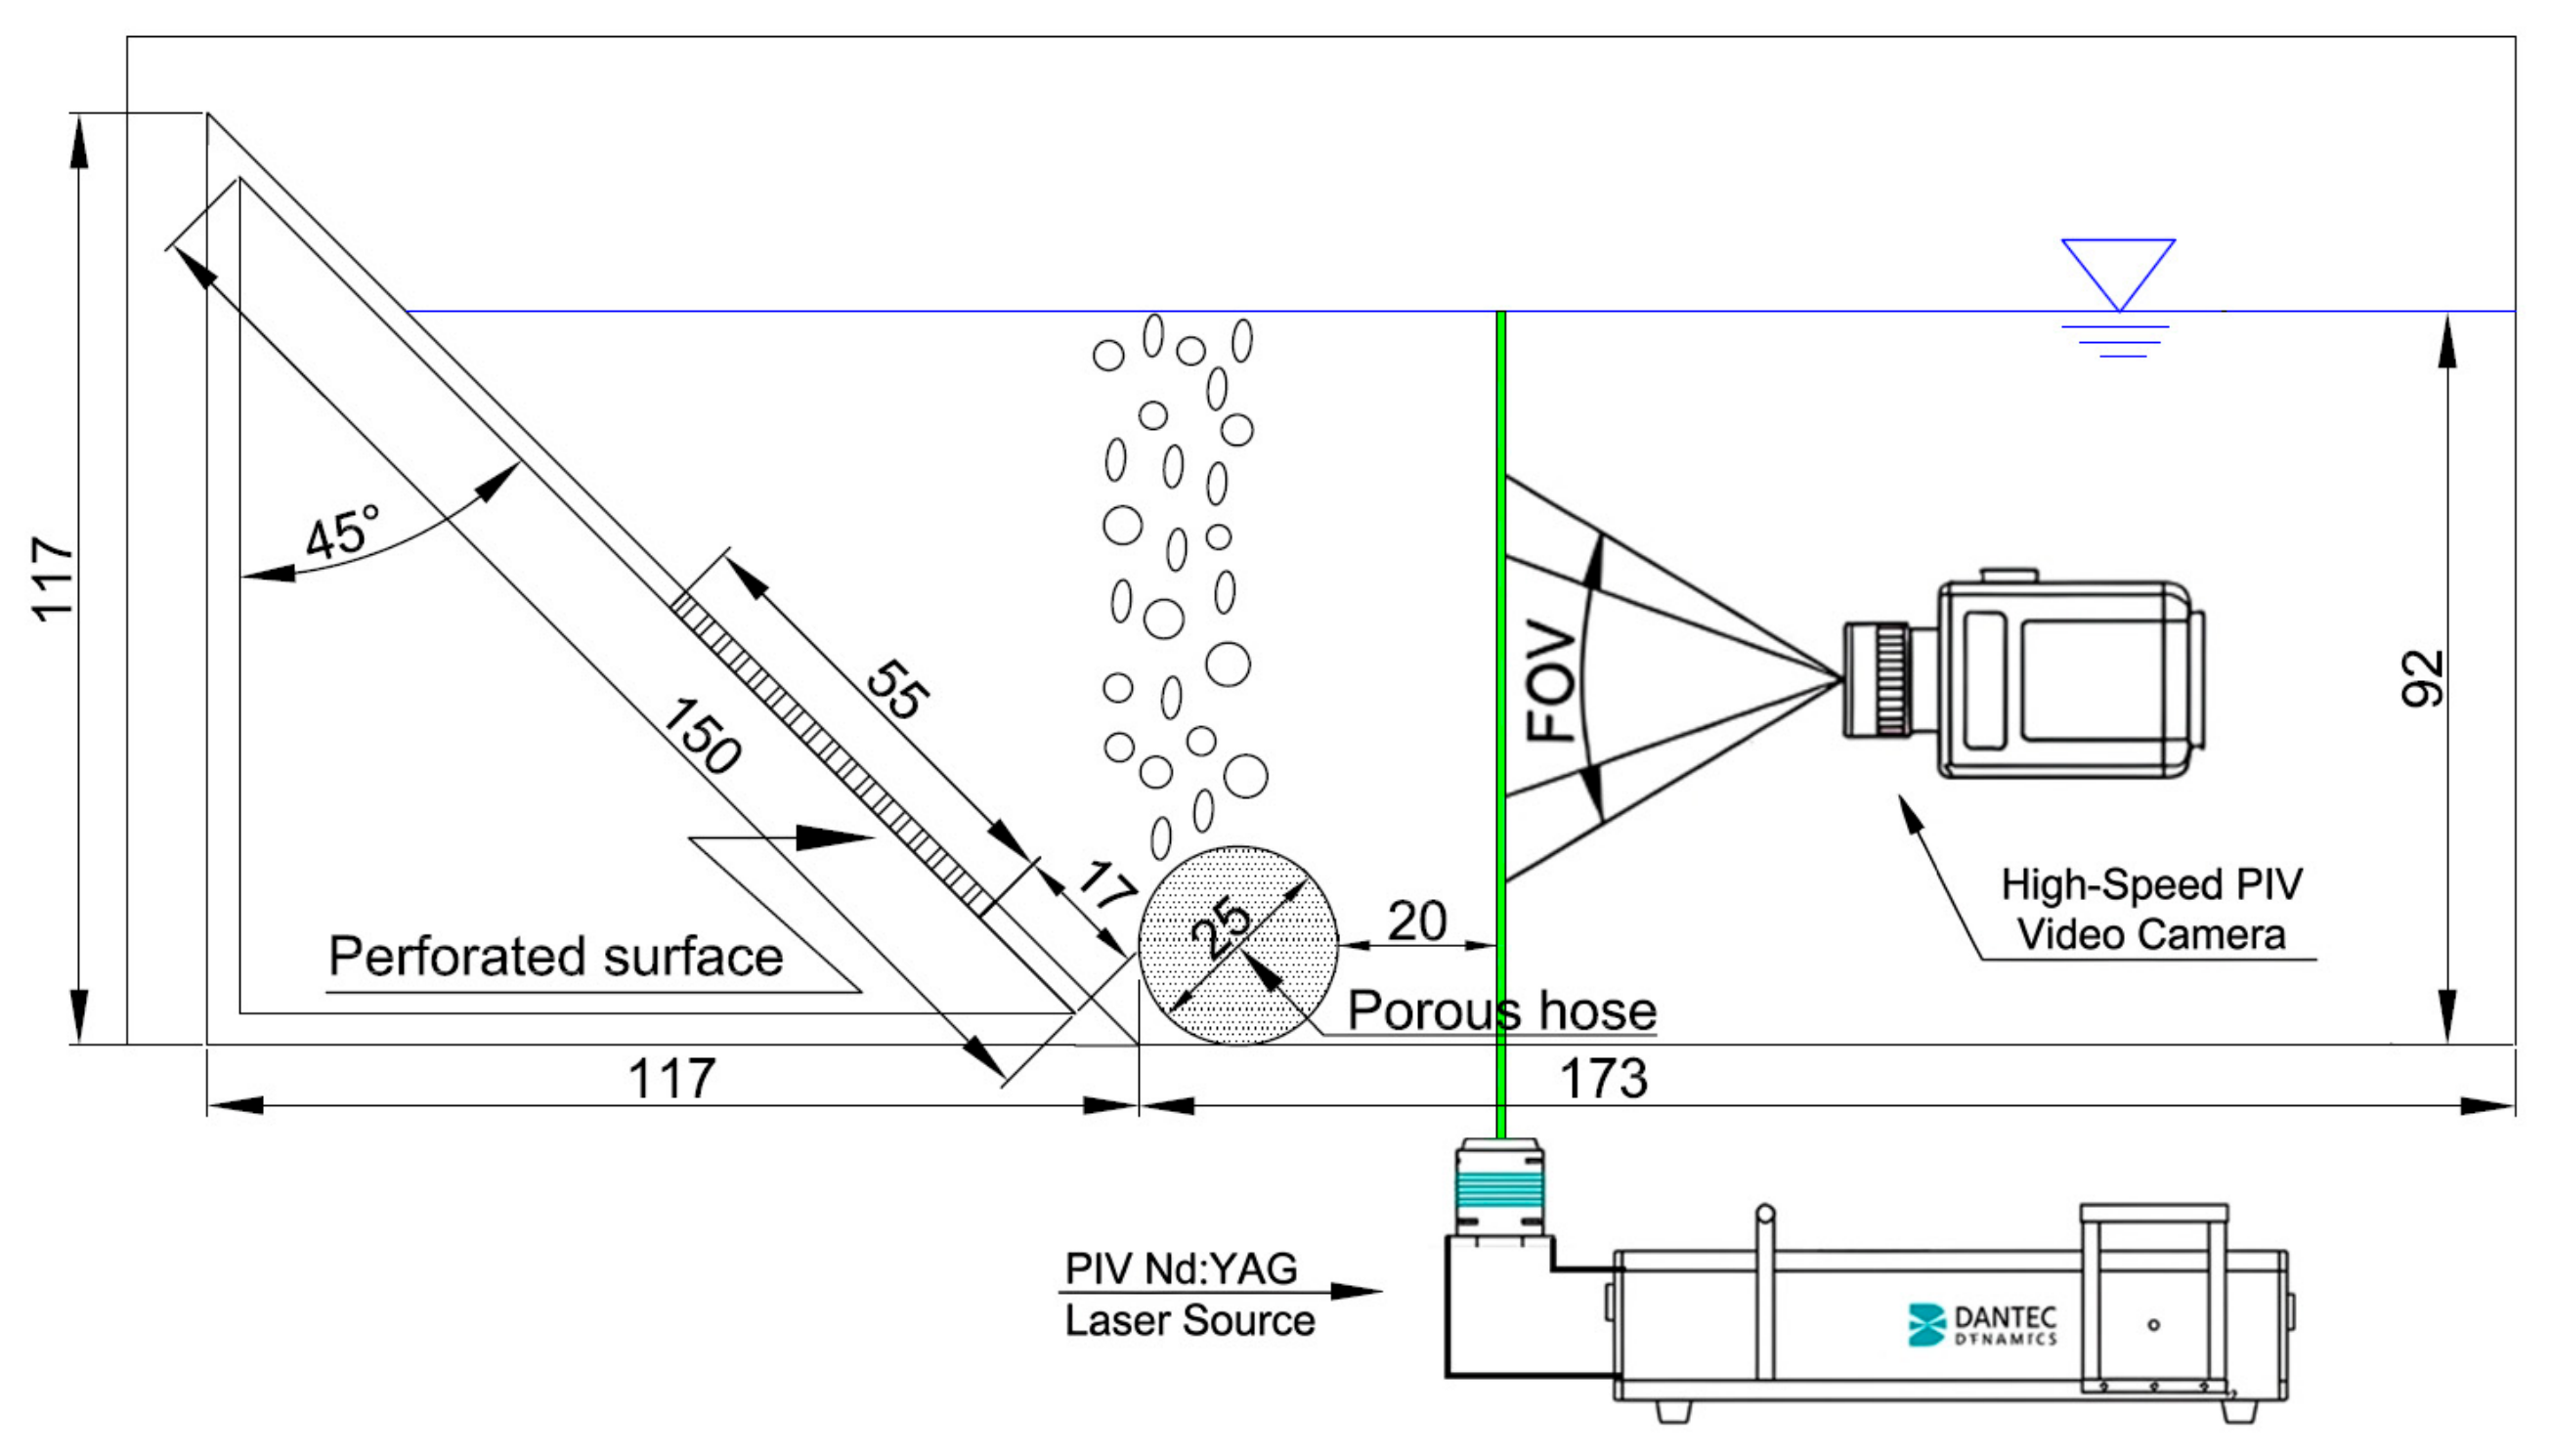
A general schematic diagram of the experimental setup used for the current research is provided in Figure 4.
Figure 4.
General schematic diagram of the experimental setup.
The laser sheet thickness was maintained at approximately 1.5–2.0 mm (corresponding to 20–25 pixels in the image plane). To minimize velocity-bias errors, the light sheet was aligned with the flow coordinate system using a custom-made calibration target (280 × 400 mm). The dual-cavity laser beams were co-aligned through a mirror system to ensure spatial coincidence at the measurement plane.
Images were captured using a high-speed FlowSense EO camera (Dantec Dynamics, Skovlunde, Denmark) equipped with an AF Micro-Nikkor 60 mm f/2.8D lens and a 532 nm narrow-band pass filter. The camera’s optical axis was positioned strictly perpendicular to the light sheet to prevent perspective distortion. The resulting FOV was 340 × 340 mm.
An interrogation window size of 32 × 32 pixels and 50% overlap was used. Vector validation was performed using a median filter and signal-to-noise ratio thresholding to ensure data integrity.
Temporal and Seeding Parameters: Due to the complex flow, each measurement was performed for three different time intervals between pulses, Δt, for the represented vectorial maps, which were 800 μs, ensuring particle displacement remained within the recommended limits of the interrogation window. Hollow glass spheres 10 μ were used for seeding at a concentration sufficient to ensure an average of 8–10 particles per interrogation window. Based on the peak-locking analysis and calibration precision, the estimated uncertainty in the velocity measurements is approximately ±2%.
Before measurement, the system calibration must be performed. It is an essential procedure that influences the test’s accuracy. Its goal is to build a connection between the size of the research area in the flow under study and the size of the pixel-based image. This process was accomplished by setting up a standardized dotted plate on the measuring plane, taking numerous photographs, and using the best of those images to establish the reference for performing the tests.
3.3. Data Processing
In a single-phase normal flow, data treatment consists of a mask application (optional in some cases) and treating pairs of images by applying correlation methods. For the cases analyzed in this article, data processing is more complicated due to the two-phase flow. For this reason, a phase separation procedure was introduced in the data processing process. Thus, air bubbles were isolated and removed from the raw pictures before applying correlation functions. The post-processing technique has no special function to automatically accomplish the above-mentioned actions. The bubble detection was performed by applying a series of functions with different purposes in order to obtain a relevant and correct separation. In the following section, all the steps used to perform data treatment are presented.
3.3.1. Masking
In order to perform the data treatment, the first step is to create a mask. Its role is to cover images that are not located in the region of interest; in our case, the area where only the water flows. In this scope, a mask was necessary to be created for each studied case since the free-surface waveform is very different from one case to another.
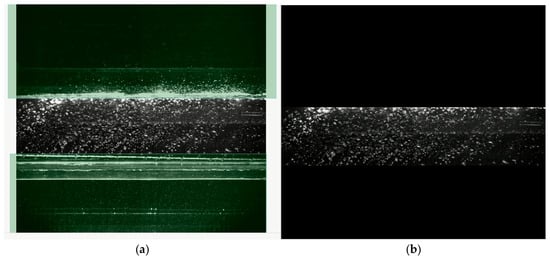
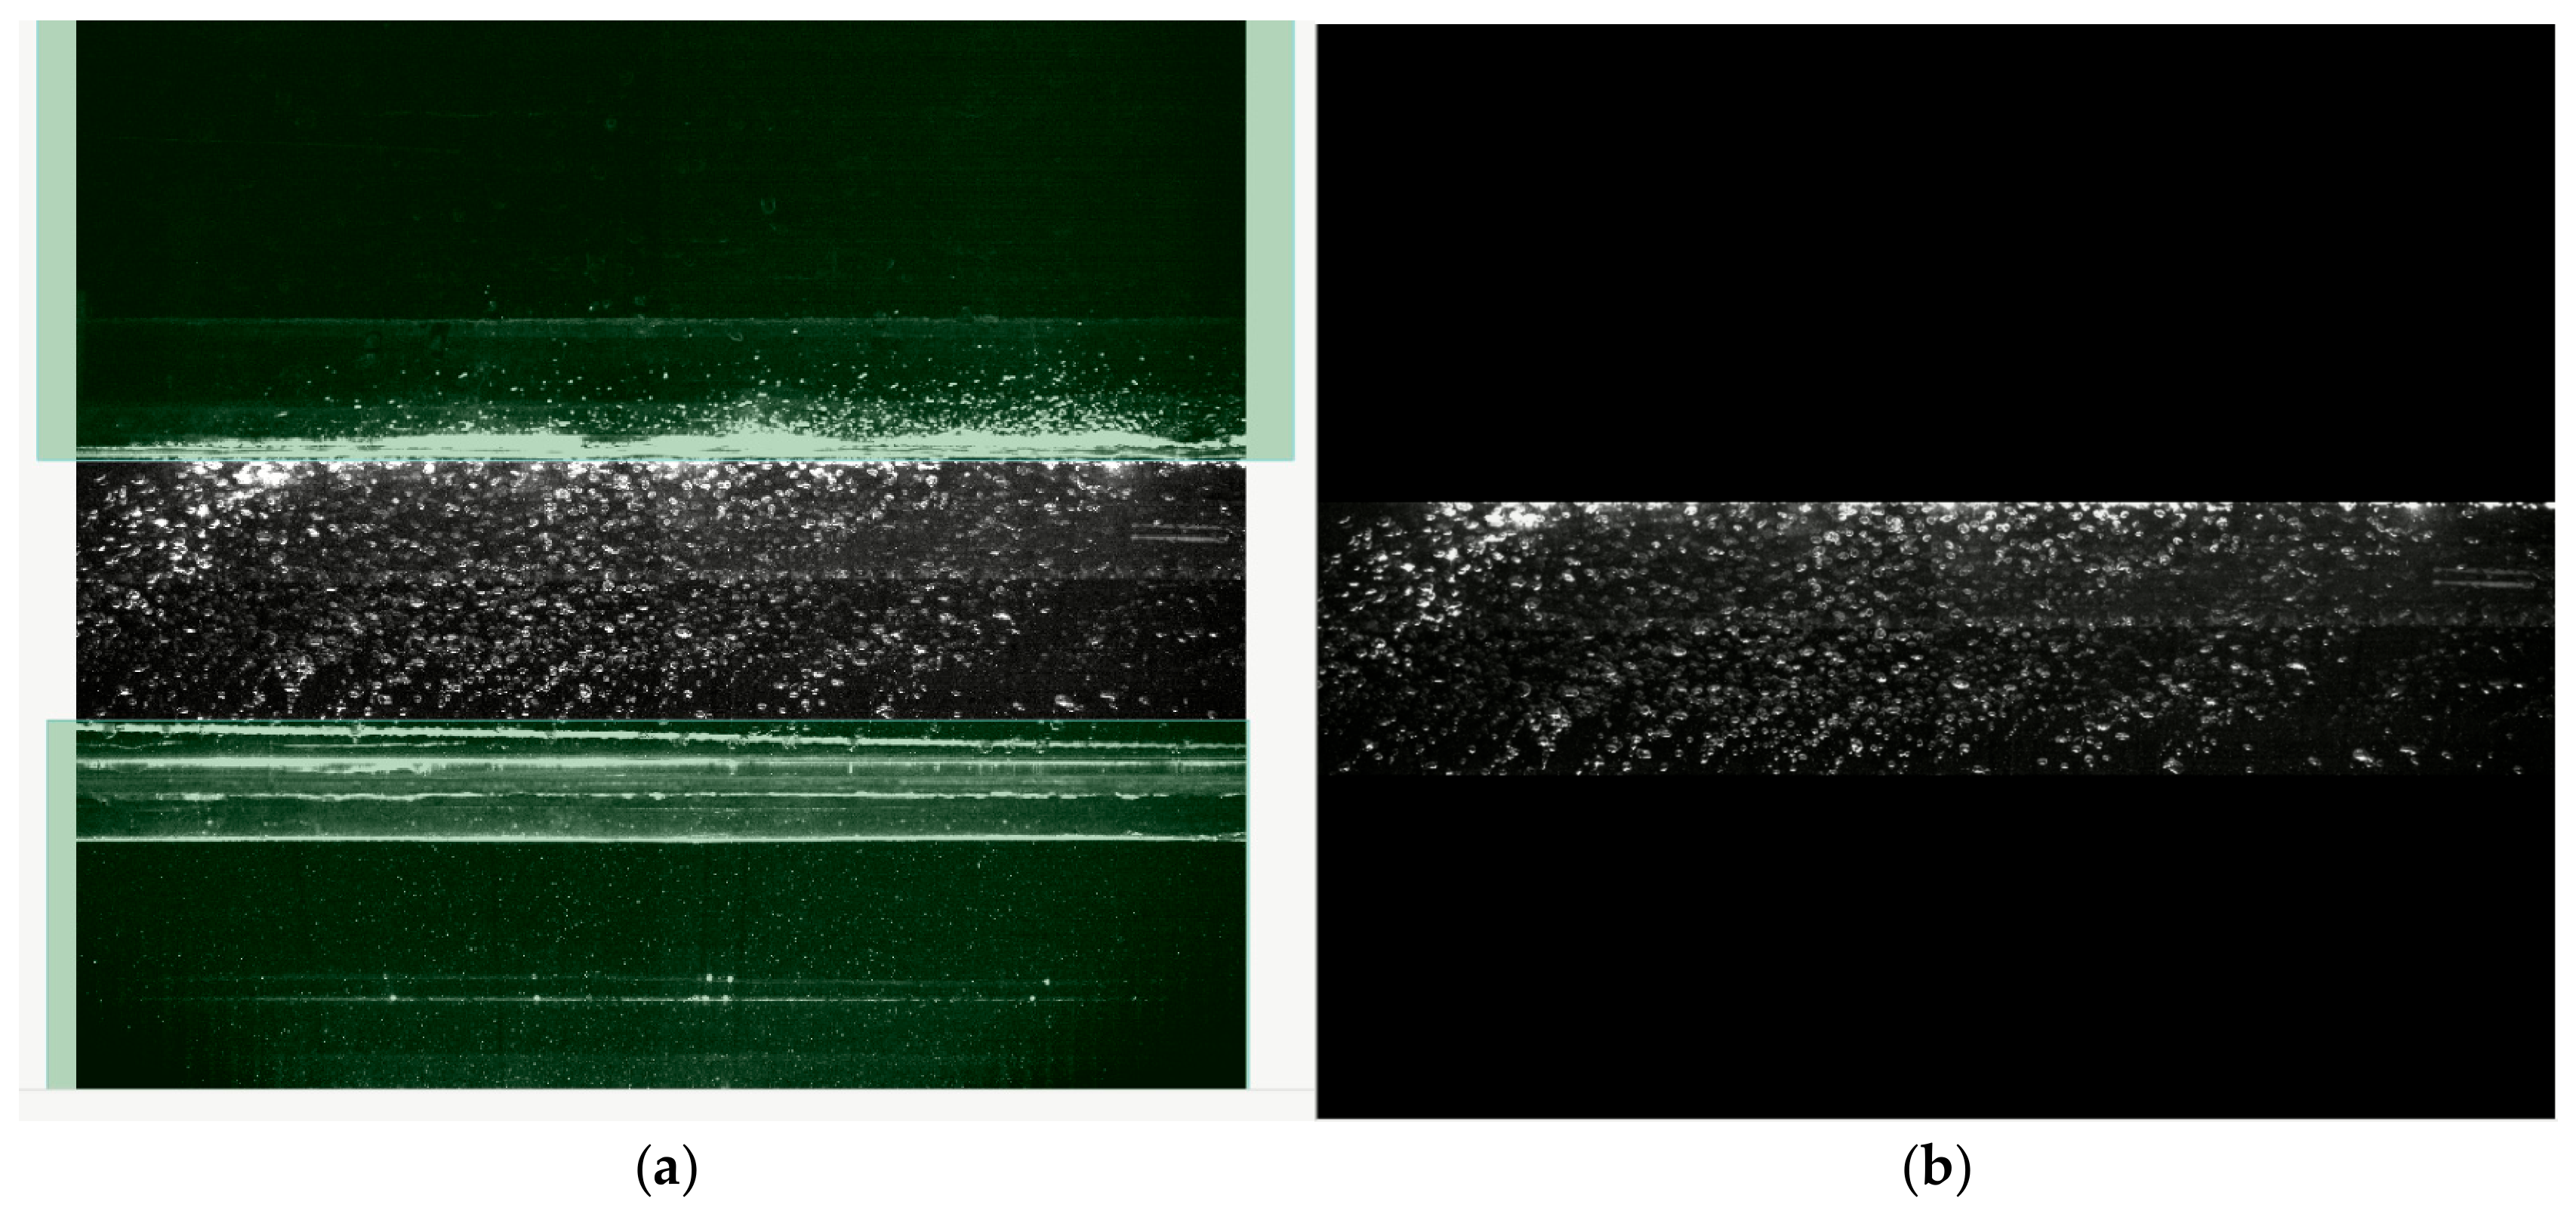
The mask was made to cover the lower storage chamber and the free surface. These areas are in contact with the laser beam, resulting in strong reflections, as shown in Figure 5a; Figure 5b presents the same frame with the mask applied.
Figure 5.
Example of a mask applied to a frame. (a) unmasked image; (b) image with the mask applied.
3.3.2. Bubble Zone Delimitation
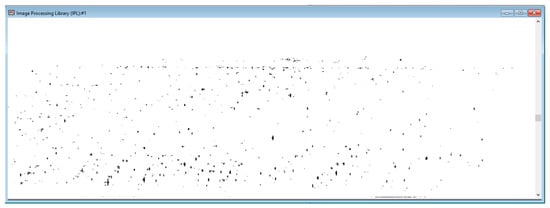
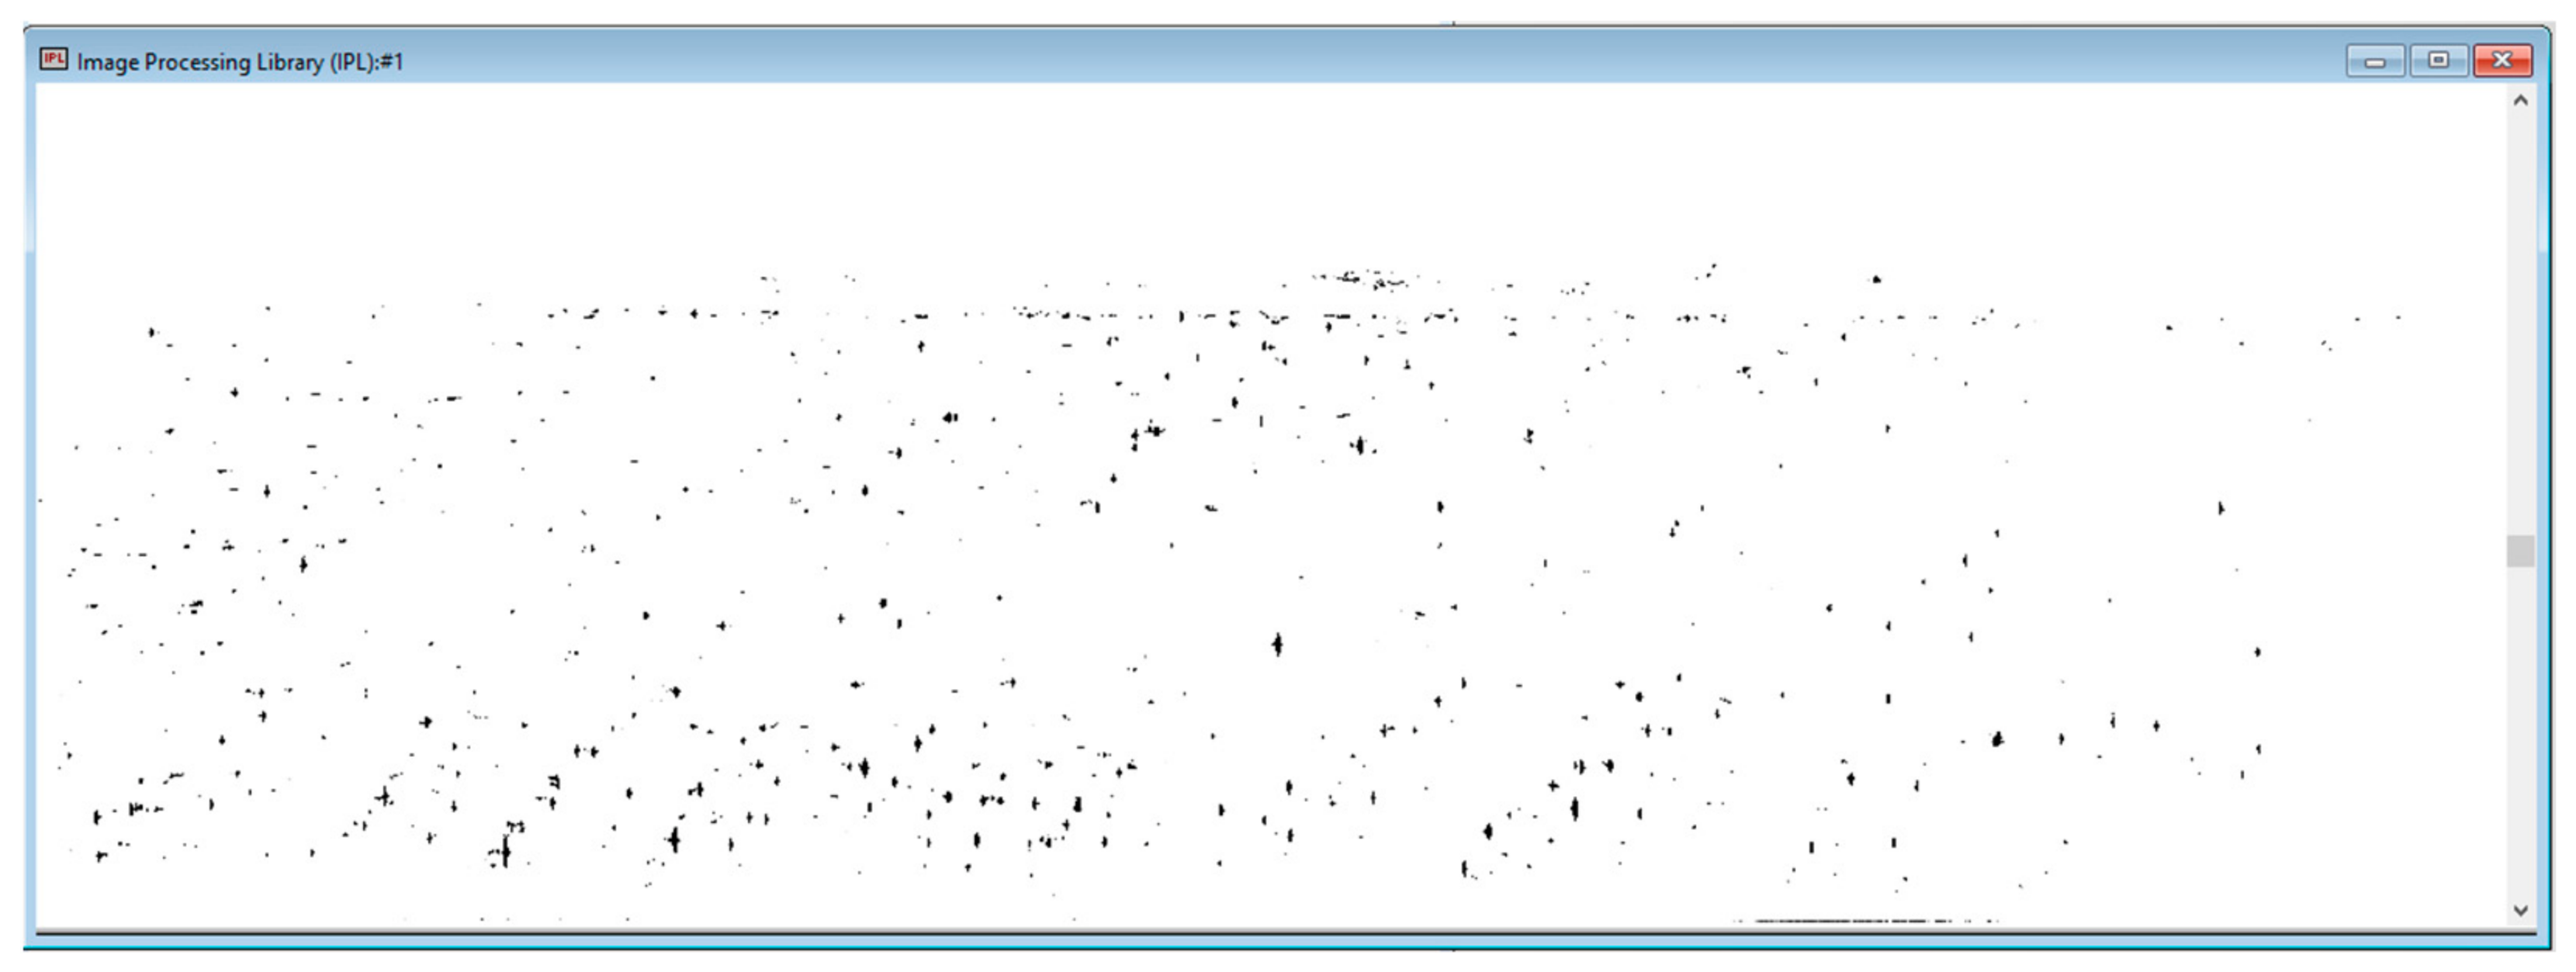
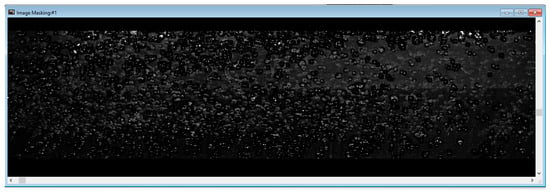
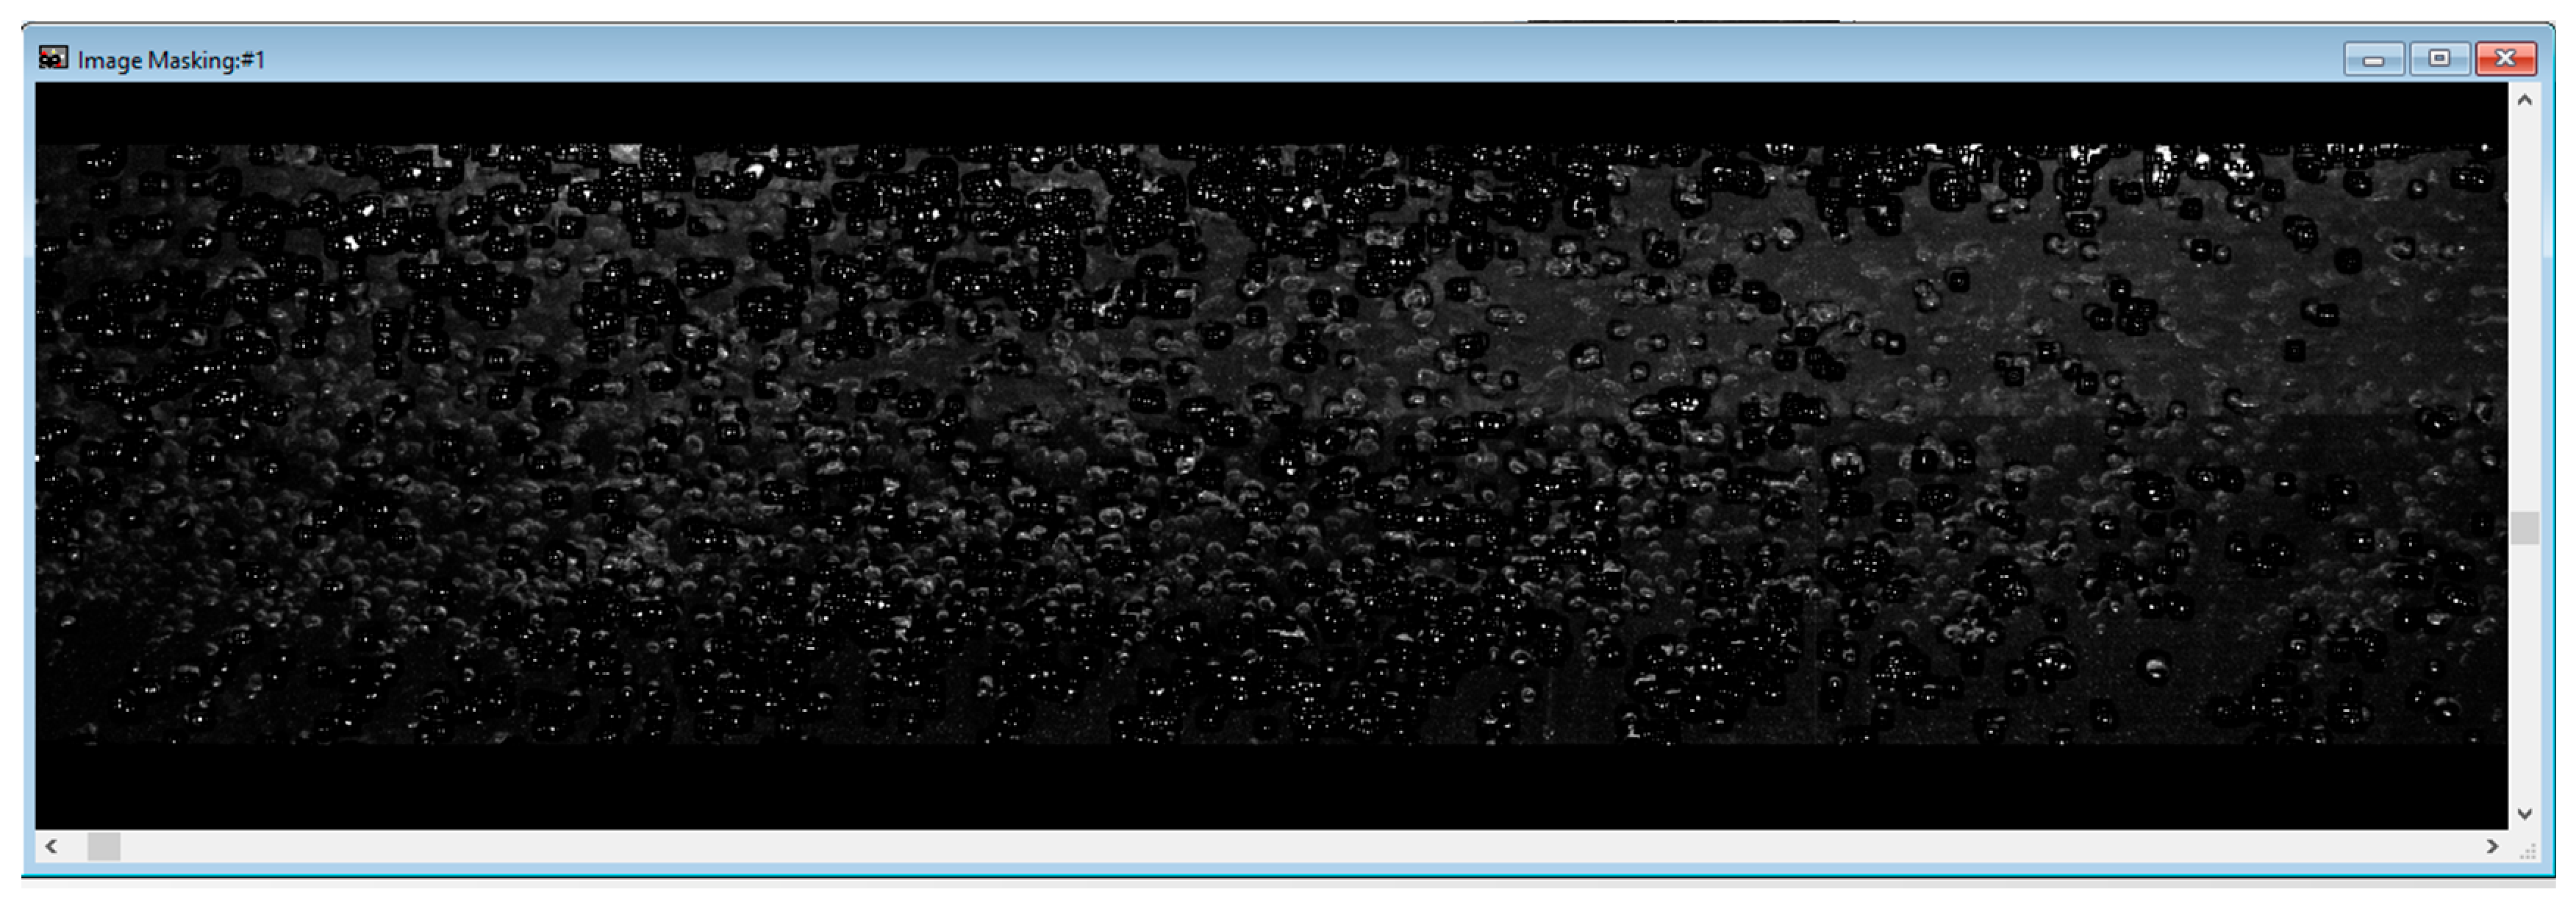
Phase separation was achieved by applying several arithmetic calculation relations available in the Dynamic Studio 7.2 software library. The captured images are composed of a multitude of gray color levels. Therefore, bubble region delimitation was performed taking into account these levels. As can be seen in Figure 6, the bubbles appear in white or very light gray.
Figure 6.
Example of bubble distribution result map.
The following paragraphs present the operations applied to images in order to isolate the bubble region.
- The “Invert Pixel Values” function was first applied to produce a negative image. Using this function, the black pixels become white and vice versa.
- Secondly, the median filter function was used. Non-linear filters replace the central pixel of the kernel with the median value and order the (N × N) components by intensity (grayscale or scalar value such as concentration or temperature). Thus, the median filter reduces high-frequency noise while maintaining edges. The median filter is more appropriate than the mean filter for applications involving fluid mechanics. Applying a threshold filter enables setting higher and lower limits on the acceptable gray-scale values in the picture. Gray scale values outside the defined ranges may be adjusted to the limit values or to the lowest and highest values that the picture will support. In our case, this filter determines the edge identification.
- The Laplacian function, which is part of the high-pass filter category, is then used to subtract the local mean of the convolution kernels. The 3 × 3 Laplacian filter is in fact identical to the 3 × 3 High-Pass filter, while the 5 × 5 Laplacian can be interpreted as a 3 × 3 Gaussian followed by a 3 × 3 Laplacian.
- By using the Gaussian filter, which is a linear filter, the two-dimensional Gaussian distribution is generated for the new value at the kernel’s center pixel. This type of filter differentiates the grayscale values at the center of the kernel from those on the edges, in contrast to other linear low-pass filters.
- In a 3 × 3 neighborhood, a dilation filter allows bright pixels to flood darker neighbors. This is roughly the same as the Maximum filter, but by continually applying the filter, you can really build kernels that are much bigger than those that the Maximum filter can handle.
- In contrast, an erosion filter allows dark pixels to flood lighter neighbors within a 3 × 3 area. This is essentially the same as the Minimum filter, but by applying the filter more than once, you can create filtering kernels that are substantially bigger this time.
- N erosions and N dilations combine to form the Opening filter. Smaller bright patches will vanish, and adjacent dark regions will often mix. (Kernel size depends on N in the same manner as dilation and erosion filters were discussed above). The opening filter may be used for background estimation in photos with few bright particles on a dark backdrop since a big enough kernel will guarantee that all (isolated) particle images are eliminated.
- The Closing filter starts with N Dilations and then moves on to N Erosions. Smaller-sized dark regions will vanish, and nearby light areas will often blend. If you are staring at dark objects against a light backdrop, you may also use this to estimate the background. Calculated as the difference between a 1-pass dilation and a 1-pass erosion, the morphological gradient filter is a 1-pass filter.
- The Distance transform calculates the separation between each pixel in the picture and its closest neighbor pixel with a value of zero. Thus, already-zero pixels will not change, but non-zero pixels will have their grayscale value changed to roughly the distance to the closest pixel with a zero value.
- For reproducibility, the image-processing sequence was rechecked using a fixed set of parameters. A 3 × 3 pixel median-filter kernel was used for noise reduction. After image inversion, bubble regions were identified using lower and upper grayscale intensity thresholds of 0 and 85, respectively, on an 8-bit intensity scale. Edge enhancement was performed using a 3 × 3 Laplacian kernel, followed by a 3 × 3 Gaussian filter. The binary image was then refined using one dilation iteration, one erosion iteration, one opening iteration, and two closing iterations. The nominal intensity threshold was selected during preliminary tests on representative images from the investigated airflow conditions as a compromise between capturing the full high-intensity bubble regions and minimizing removal of the surrounding liquid phase containing valid PIV seeding particles. The resulting masks were also visually inspected to verify consistent delineation of the bubble boundaries.
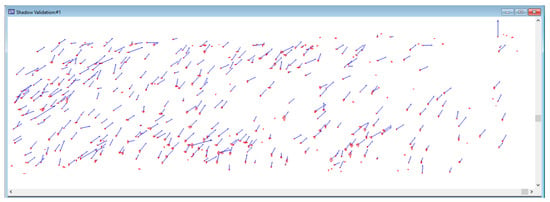
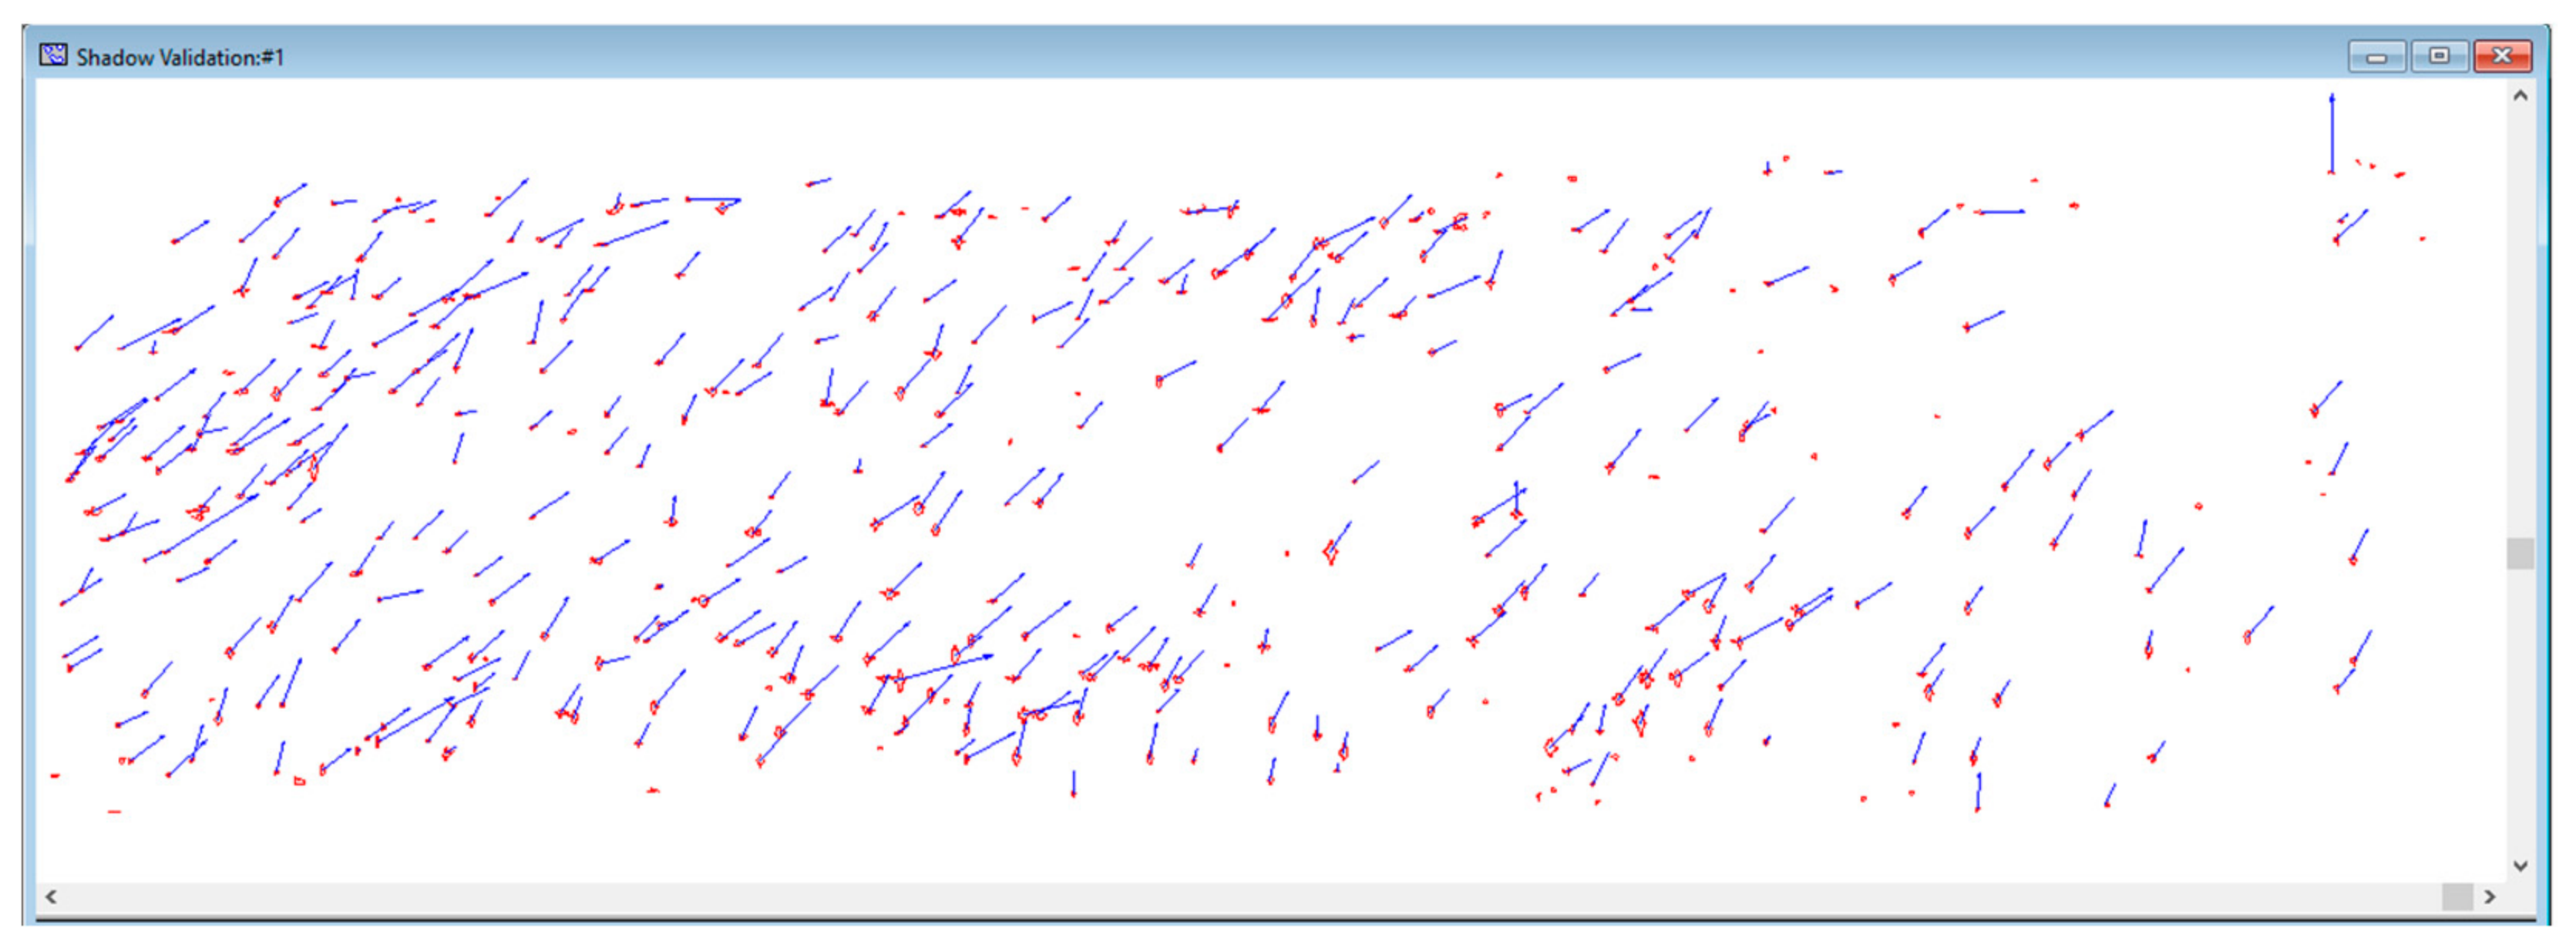
After applying the sequence of operations mentioned above, the resulting image appears as in Figure 6. The bubble zones are represented in black; these areas are further removed from the captured images. For each captured picture, a bubble map was determined.
Thus, the bubble displacement velocity can be determined, resulting in a vectorial map as in Figure 7.
Figure 7.
Example of vectorial map distribution for the extracted bubbles (red—bubbles, blue—velocity vectors).
3.3.3. Phase Separation
Phase separation was accomplished by applying a subtraction operation, removing the bubble areas from the raw images. An example of the image resulting after this operation is shown in Figure 8.
Figure 8.
Image resulting after the bubble extraction.
By converting bubbles into binary masks, we ensure that the cross-correlation algorithm only considers pixels corresponding to the liquid-phase seeding particles. To prevent gas-phase contamination of the liquid-phase velocity field, vectors located at the immediate boundary of the mask were validated using a secondary median filter (normalized residual threshold of 2.0).
On average, the masked area accounted for approximately 30% of the total field of view. The threshold-sensitivity test was performed by varying the nominal value by ±10%; the resulting change in total masked area remained below 1.5%, supporting the robustness of the selected threshold against moderate intensity variations.
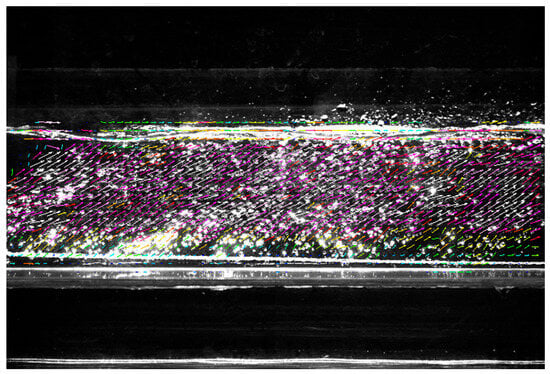
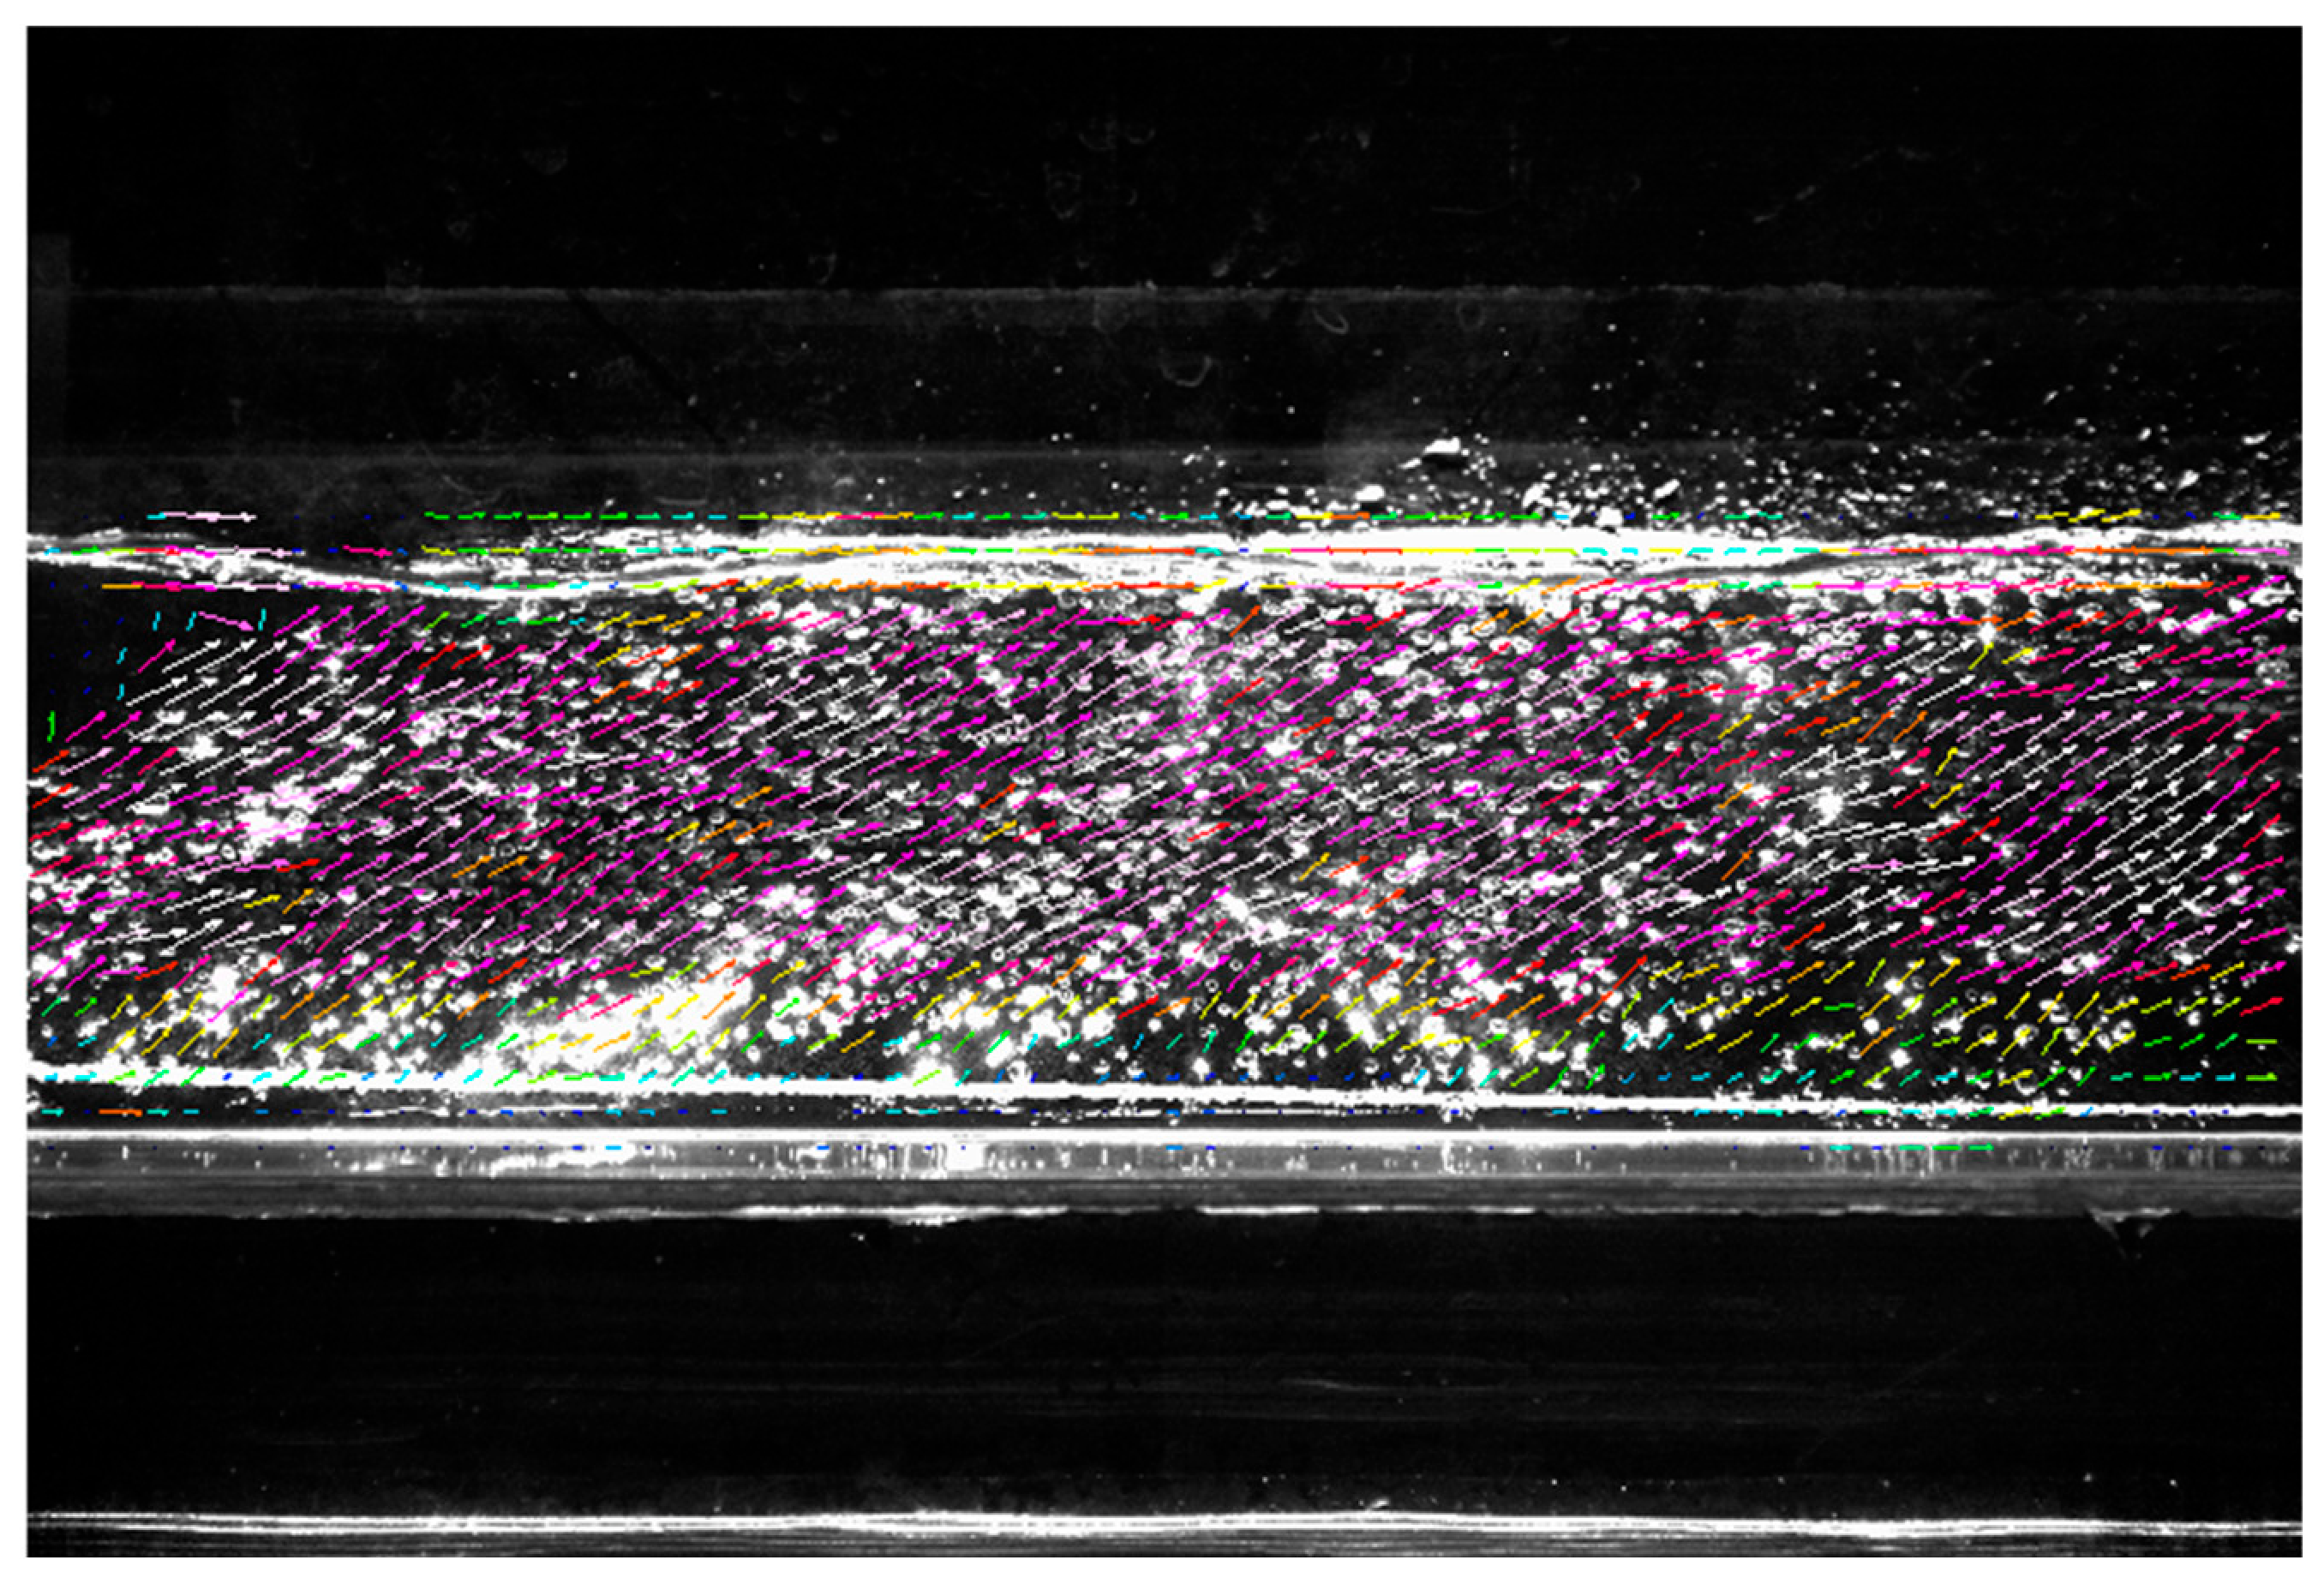
While this article presents images of the mean fields, erroneous vectors from the instantaneous fields were handled by discarding those identified within the masked bubble regions without replacing them through interpolation. This ‘blanking’ method ensures that the reported statistics for the water phase are not contaminated by spurious data from the bubbles. Figure 9 shows an example of an instantaneous image with the corresponding displacement vectors superimposed on an image of the bubble curtain.
Figure 9.
Instantaneous image with the corresponding displacement vectors superimposed on an image of the bubble curtain.
3.3.4. Image Correlation
The image correlation represents the final step of the data-treatment procedure, resulting in 2D vectorial maps of velocities. The principle of correlation is described in chapter 3.3. Two correlation methods (“Average Correlation” and “Adaptive PIV”) were applied to one of the studied cases, and the resulting velocity fields were visually analyzed and assessed. The method that presented more satisfactory results was chosen to be applied in the other cases.
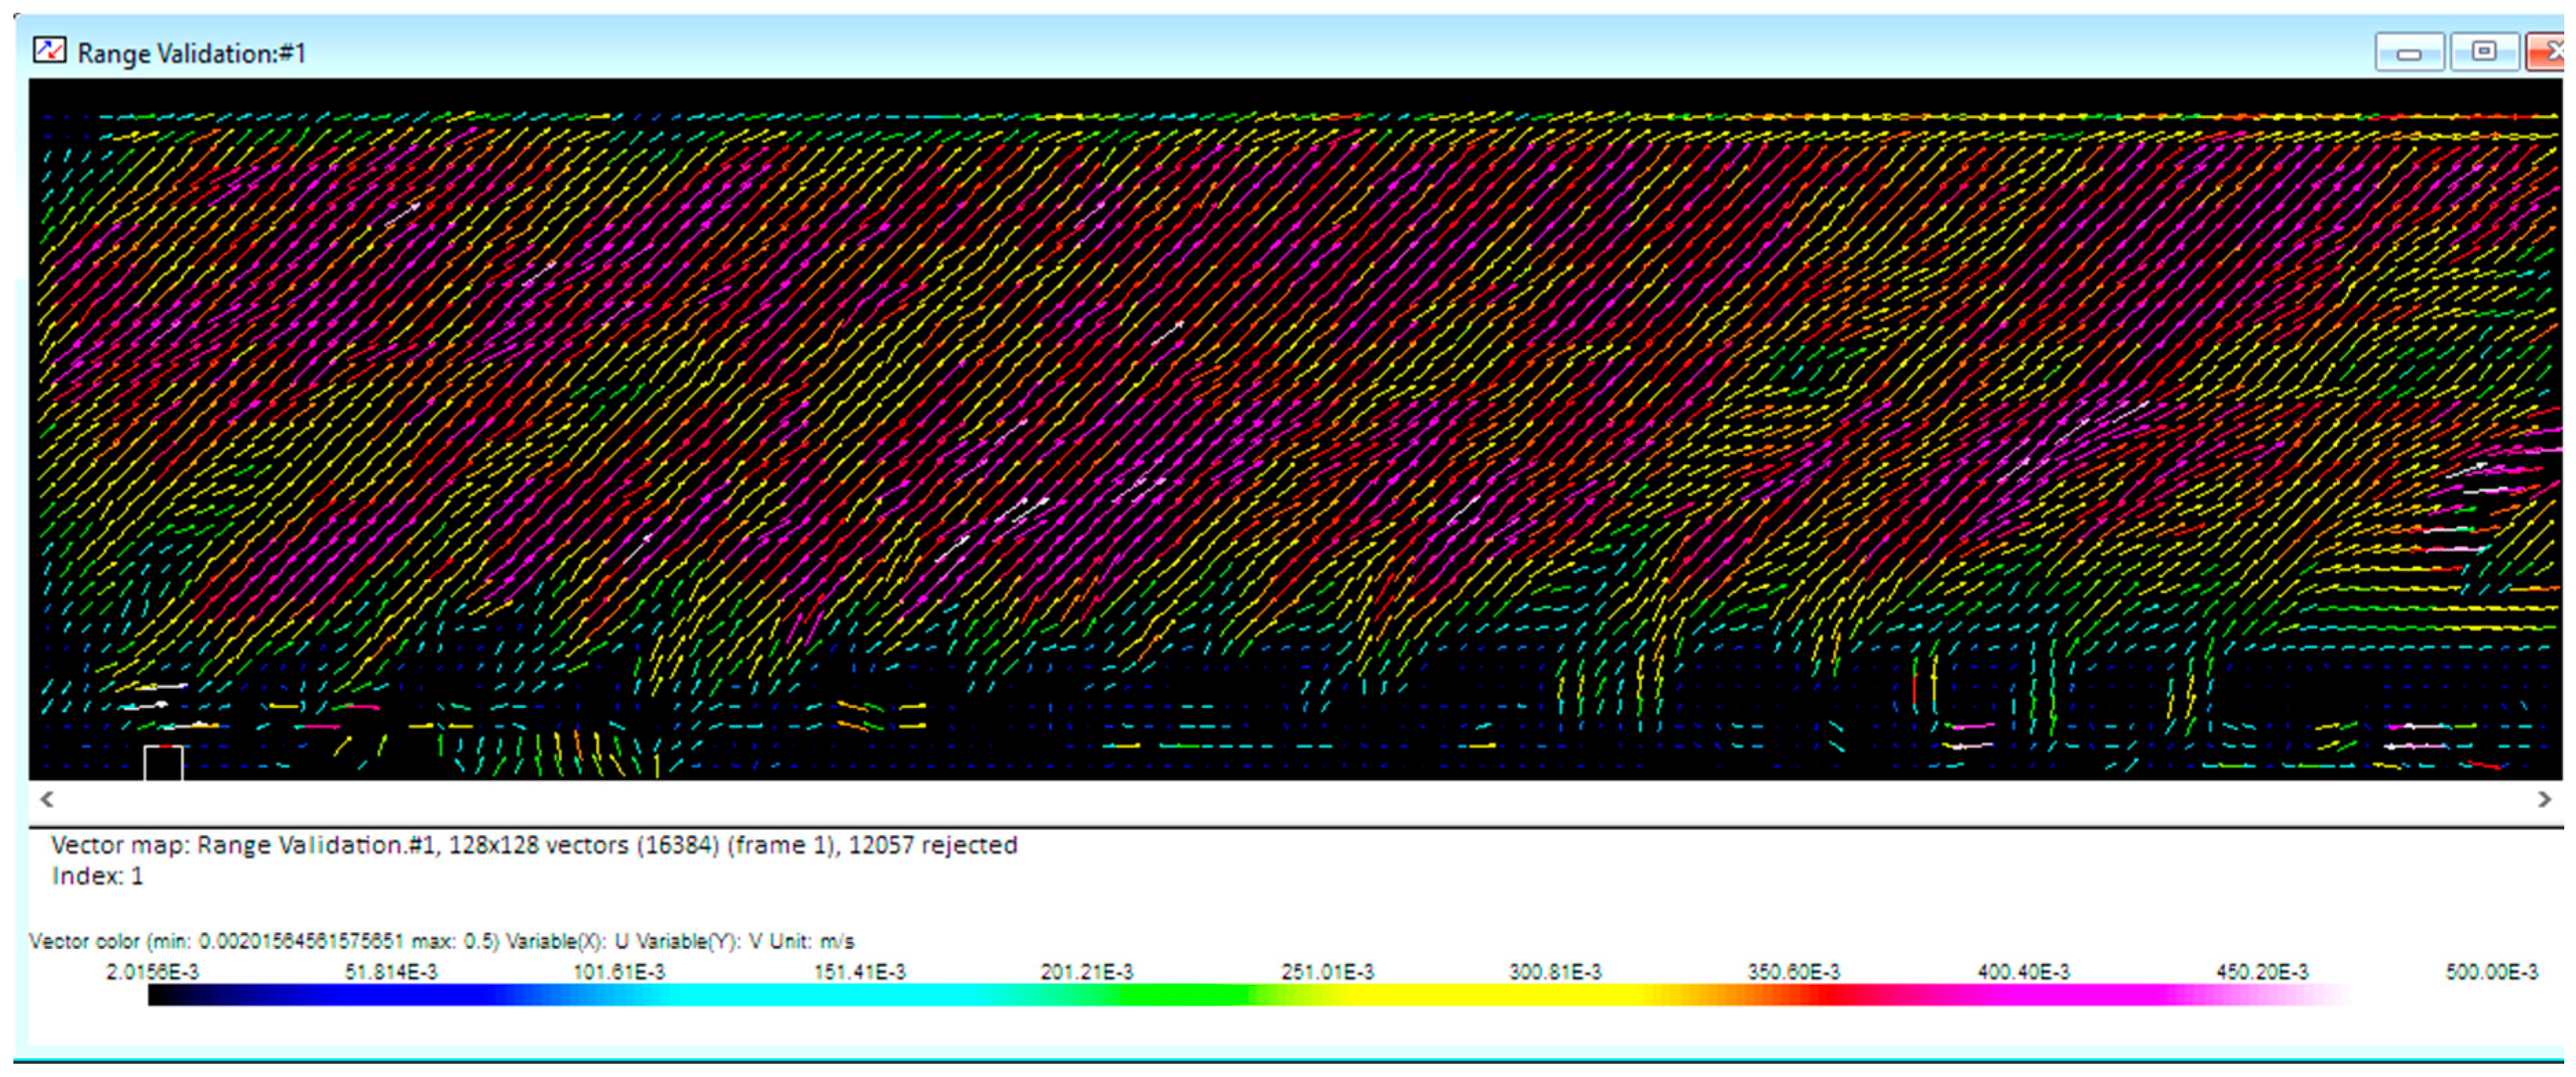
An example of the 2D vectorial maps resulting after applying the correlation is shown in Figure 10.
Figure 10.
Example of vectorial map distribution resulting from the images after the bubble extraction, for a water mean velocity of 0.33 m/s.
3.3.5. Quantitative Metrics and Uncertainty Analysis
To quantitatively assess the hydrodynamic influence of the bubble curtain, spatially averaged and fluctuation-based velocity metrics were derived from the PIV data for each airflow condition. The spatially averaged velocity magnitude was computed over the effective measurement area A over which the averaging is performed in the plane located at 20 mm from the outer surface of the porous hose, according to
In Equation (2), the quantity u(x,y) represents the local velocity vector of the liquid phase at coordinates (x,y) within the measurement plane, obtained from PIV measurements. The area A denotes the effective measurement area containing valid liquid-phase vectors after masking the free surface, air-bubble regions, optical reflections, and rejected vectors.
The relative variation with respect to the reference no-airflow case was expressed as:
In Equation (3), represents the relative variation in the spatially averaged velocity magnitude (of the liquid phase), expressed as a percentage with respect to the reference no-airflow condition. The term denotes the spatially averaged velocity magnitude obtained from the PIV field, corresponding to the imposed airflow rate Qa, while denotes the spatially averaged velocity magnitude for the reference case without air injection (0 L/min).
Velocity fluctuations were characterized using the root-mean-square (RMS) of the velocity magnitude, calculated from the spatial distribution of velocity vectors. All hydrodynamic metrics are reported as relative (%) variations, which provides robustness against small absolute differences and minimizes the influence of PIV calibration uncertainty, phase-separation residuals, and spatial resolution limitations. For each airflow rate, 95% confidence intervals were estimated assuming spatial statistical independence of velocity vectors. The PIV velocity measurement uncertainty was estimated at approximately ±2%, based on the peak-locking analysis and calibration precision. Considering additional contributions from PIV calibration, timing accuracy, and image processing, the combined total experimental uncertainty was conservatively estimated at ±2–3% of the measured velocity magnitude.
4. Results and Discussions
4.1. Results of the PIV-Based Measurements
Measurements were performed at planes 0, 20, 30, and 50 mm from the porous hose, generating the bubble curtain (see Figure 3b). The imposed airflow conditions are summarized in Table 1. By keeping the water velocity inside the channel constant and imposing 5 airflow rates for each considered plane, this resulted in 20 studied cases. The water velocity in the channel was maintained at 0.33 m/s using the hydraulic channel flow-control system. Prior to each PIV measurement sequence, the flow rate was monitored to maintain the prescribed velocity in the test section. This procedure preserved the same water-pump operating condition and allowed the local hydrodynamic modification caused by the bubble curtain to be evaluated without compensating for its effect through a subsequent adjustment of the water flow.
Table 1.
Water velocity and imposed airflow conditions used during PIV measurements.
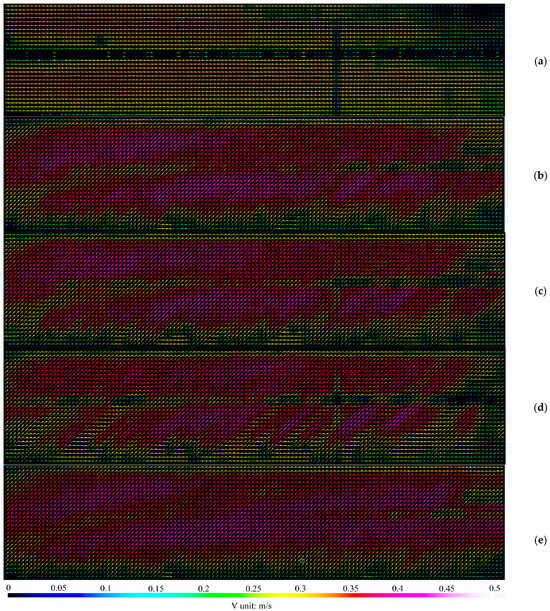
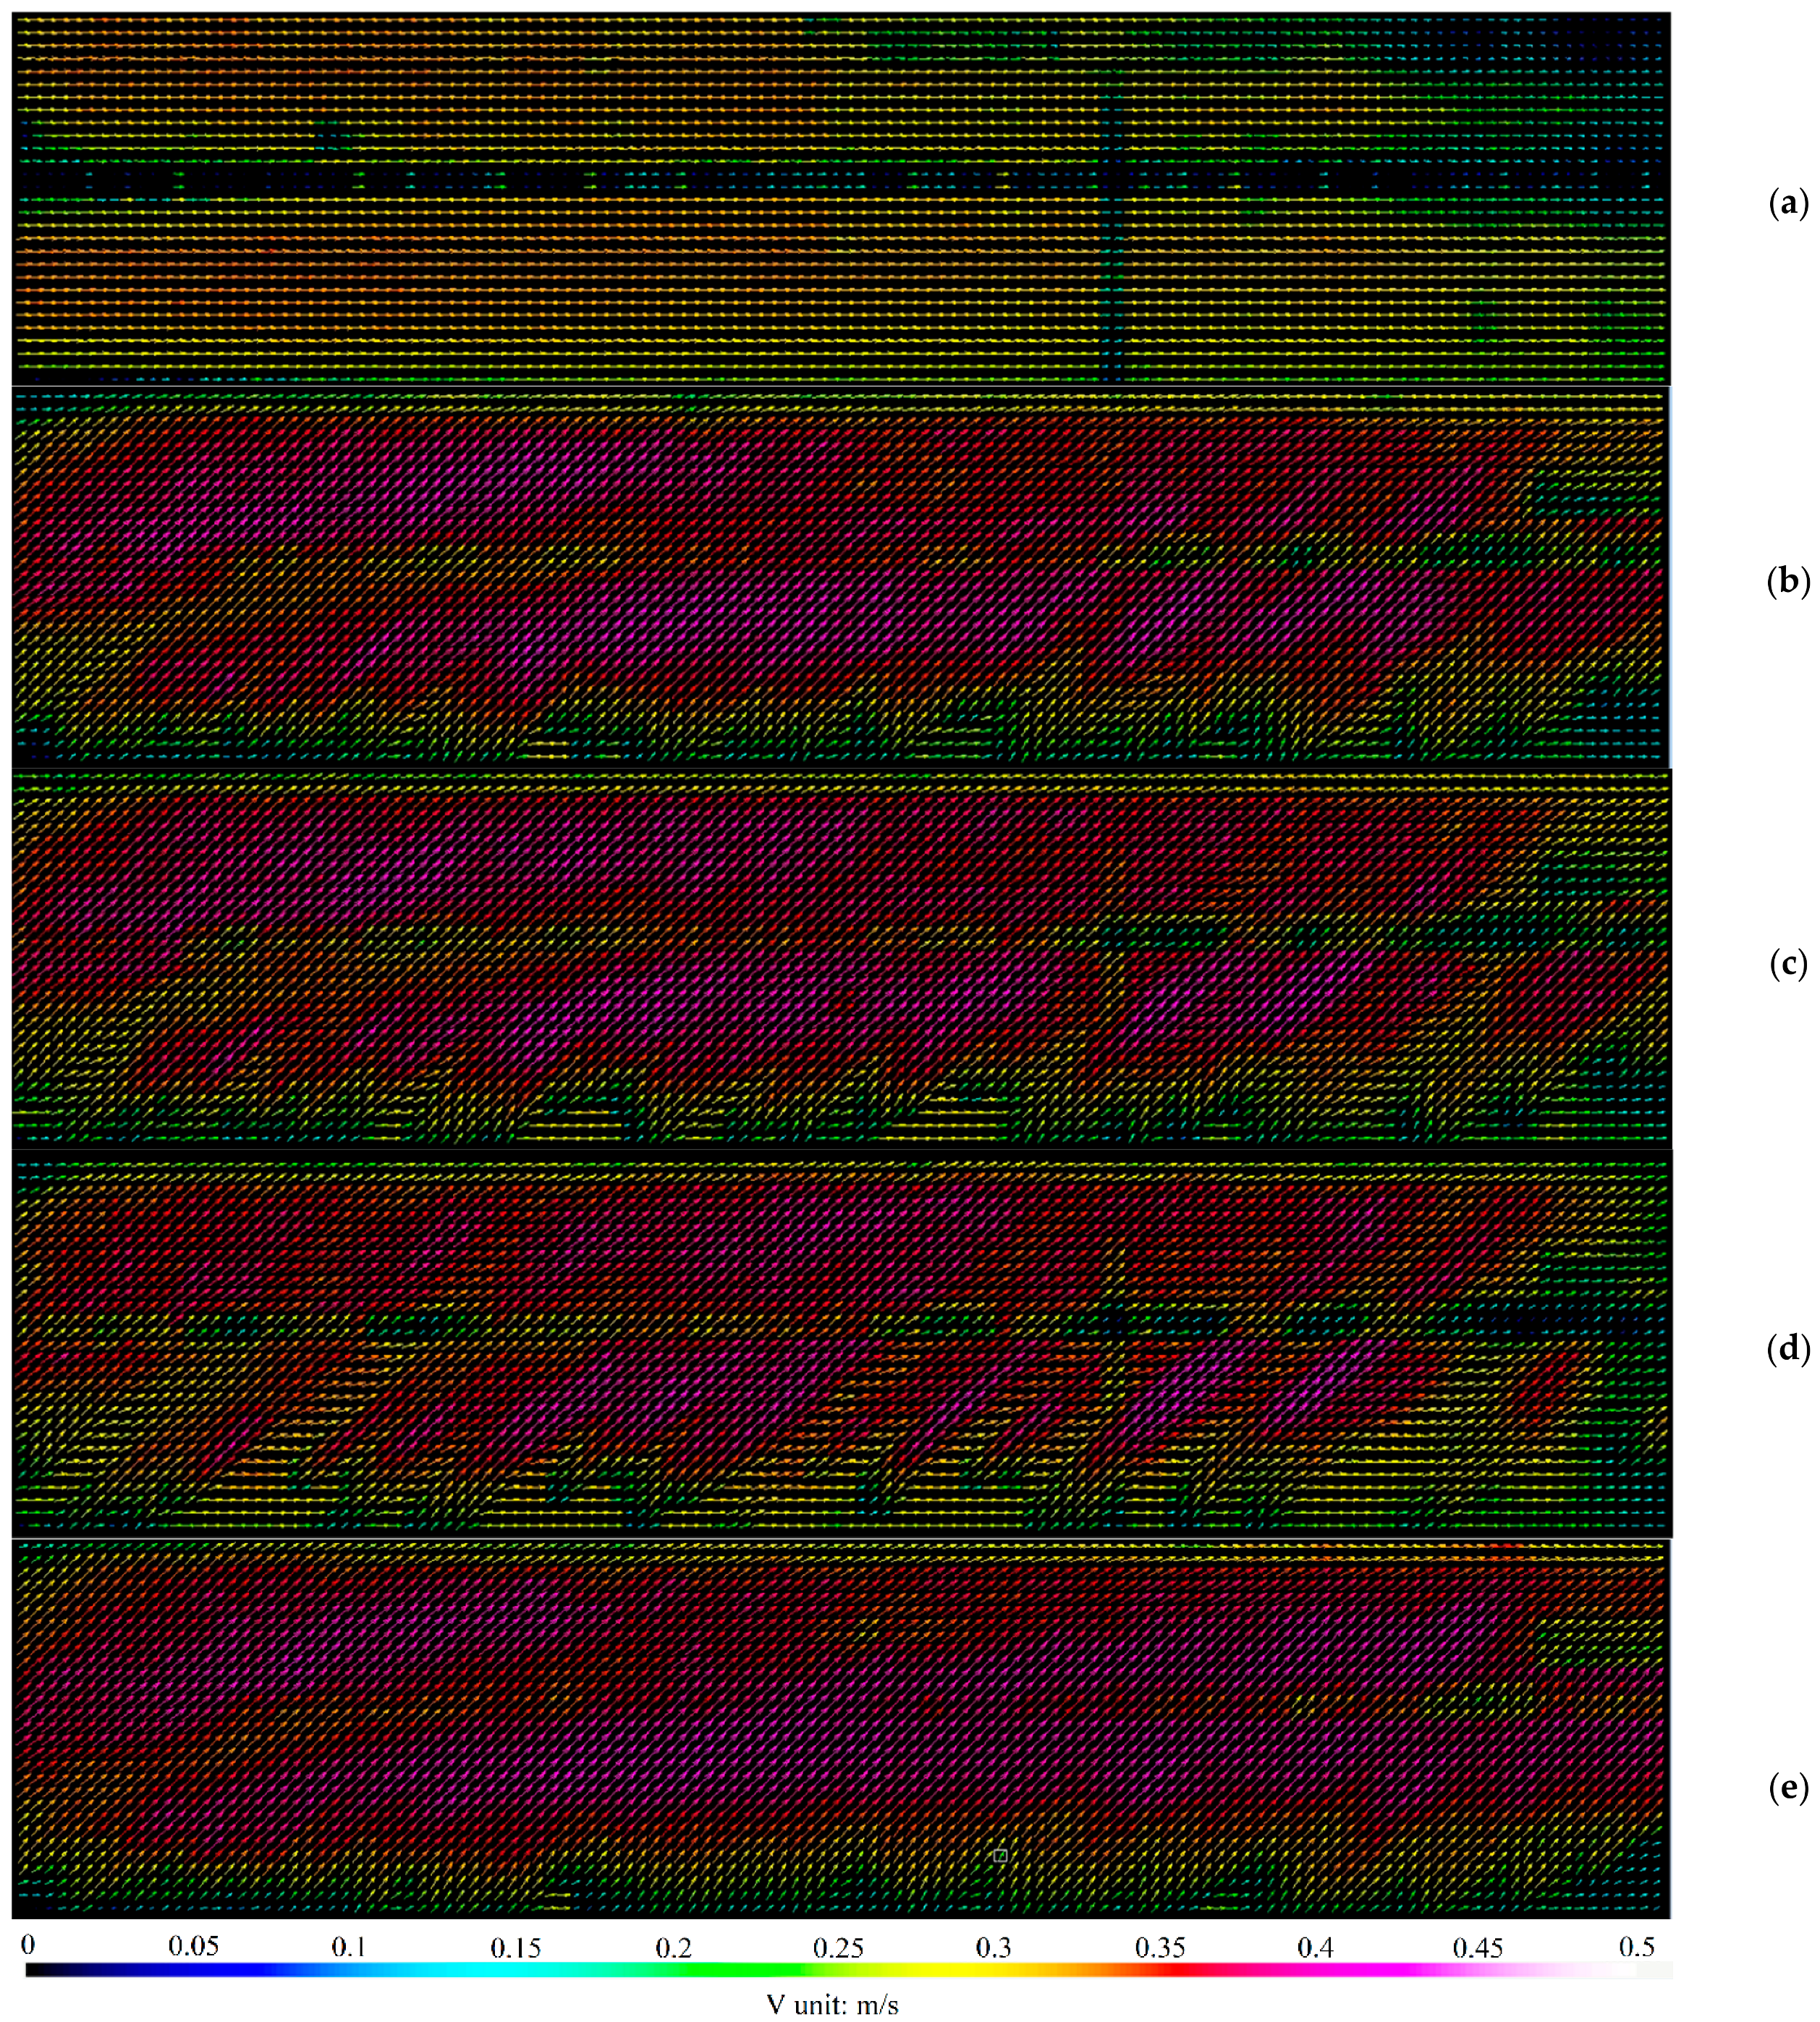
In this article are presented, analyzed and discussed the measurements performed at the plane situated 20 mm away from the outer surface of the porous hose generating the bubble curtain. This distance is considered representative for demonstrating the influence that bubbles have on the velocity of the surrounding water. Figure 11 shows the water velocity vectors in the main channel of the water intake for airflow rates from 0 to 15 L/min.
Figure 11.
Water vectorial map distribution for: (a) flow without bubbles (zero airflow rate), (b) 5 L/min airflow rate; (c) 8 L/min airflow rate; (d) 10.5 L/min airflow rate; (e) 15 L/min airflow rate.
Figure 11a shows a quasi-constant water velocity along the analyzed section. The indigo horizontal line situated at approximately 40 mm on the Oy axis presents a reduced velocity due to the glowing effect of the water free surface against the transparent wall of the intake chamber, placed behind the main channel measuring section. The vertical indigo line situated at 225 mm along the Ox axis is due to a reflection of a bubble trapped between the main testing channel and the lower tank of the water intake setup.
Quantitative analysis of the PIV measurements confirms that the introduction of the bubble curtain induces measurable modifications exceeding the estimated experimental uncertainty of the local velocity field compared to the no-airflow condition. The spatially averaged velocity magnitude increased with airflow rate, whereas the incremental increase became progressively smaller at higher air-injection rates.
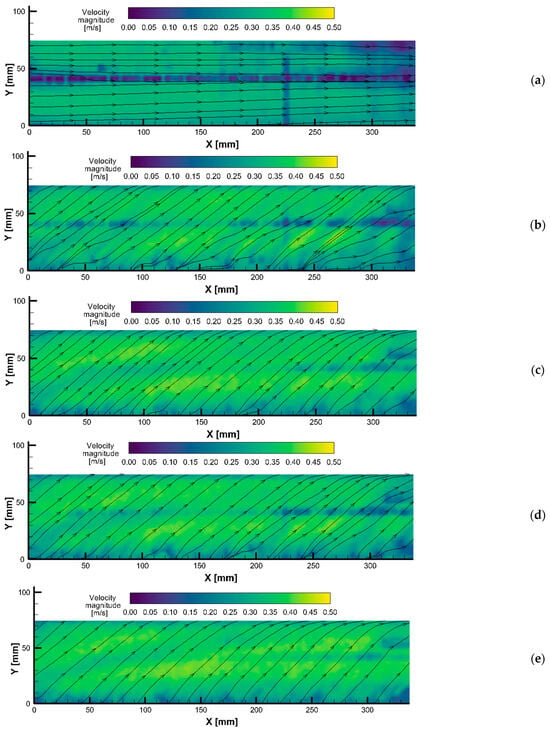
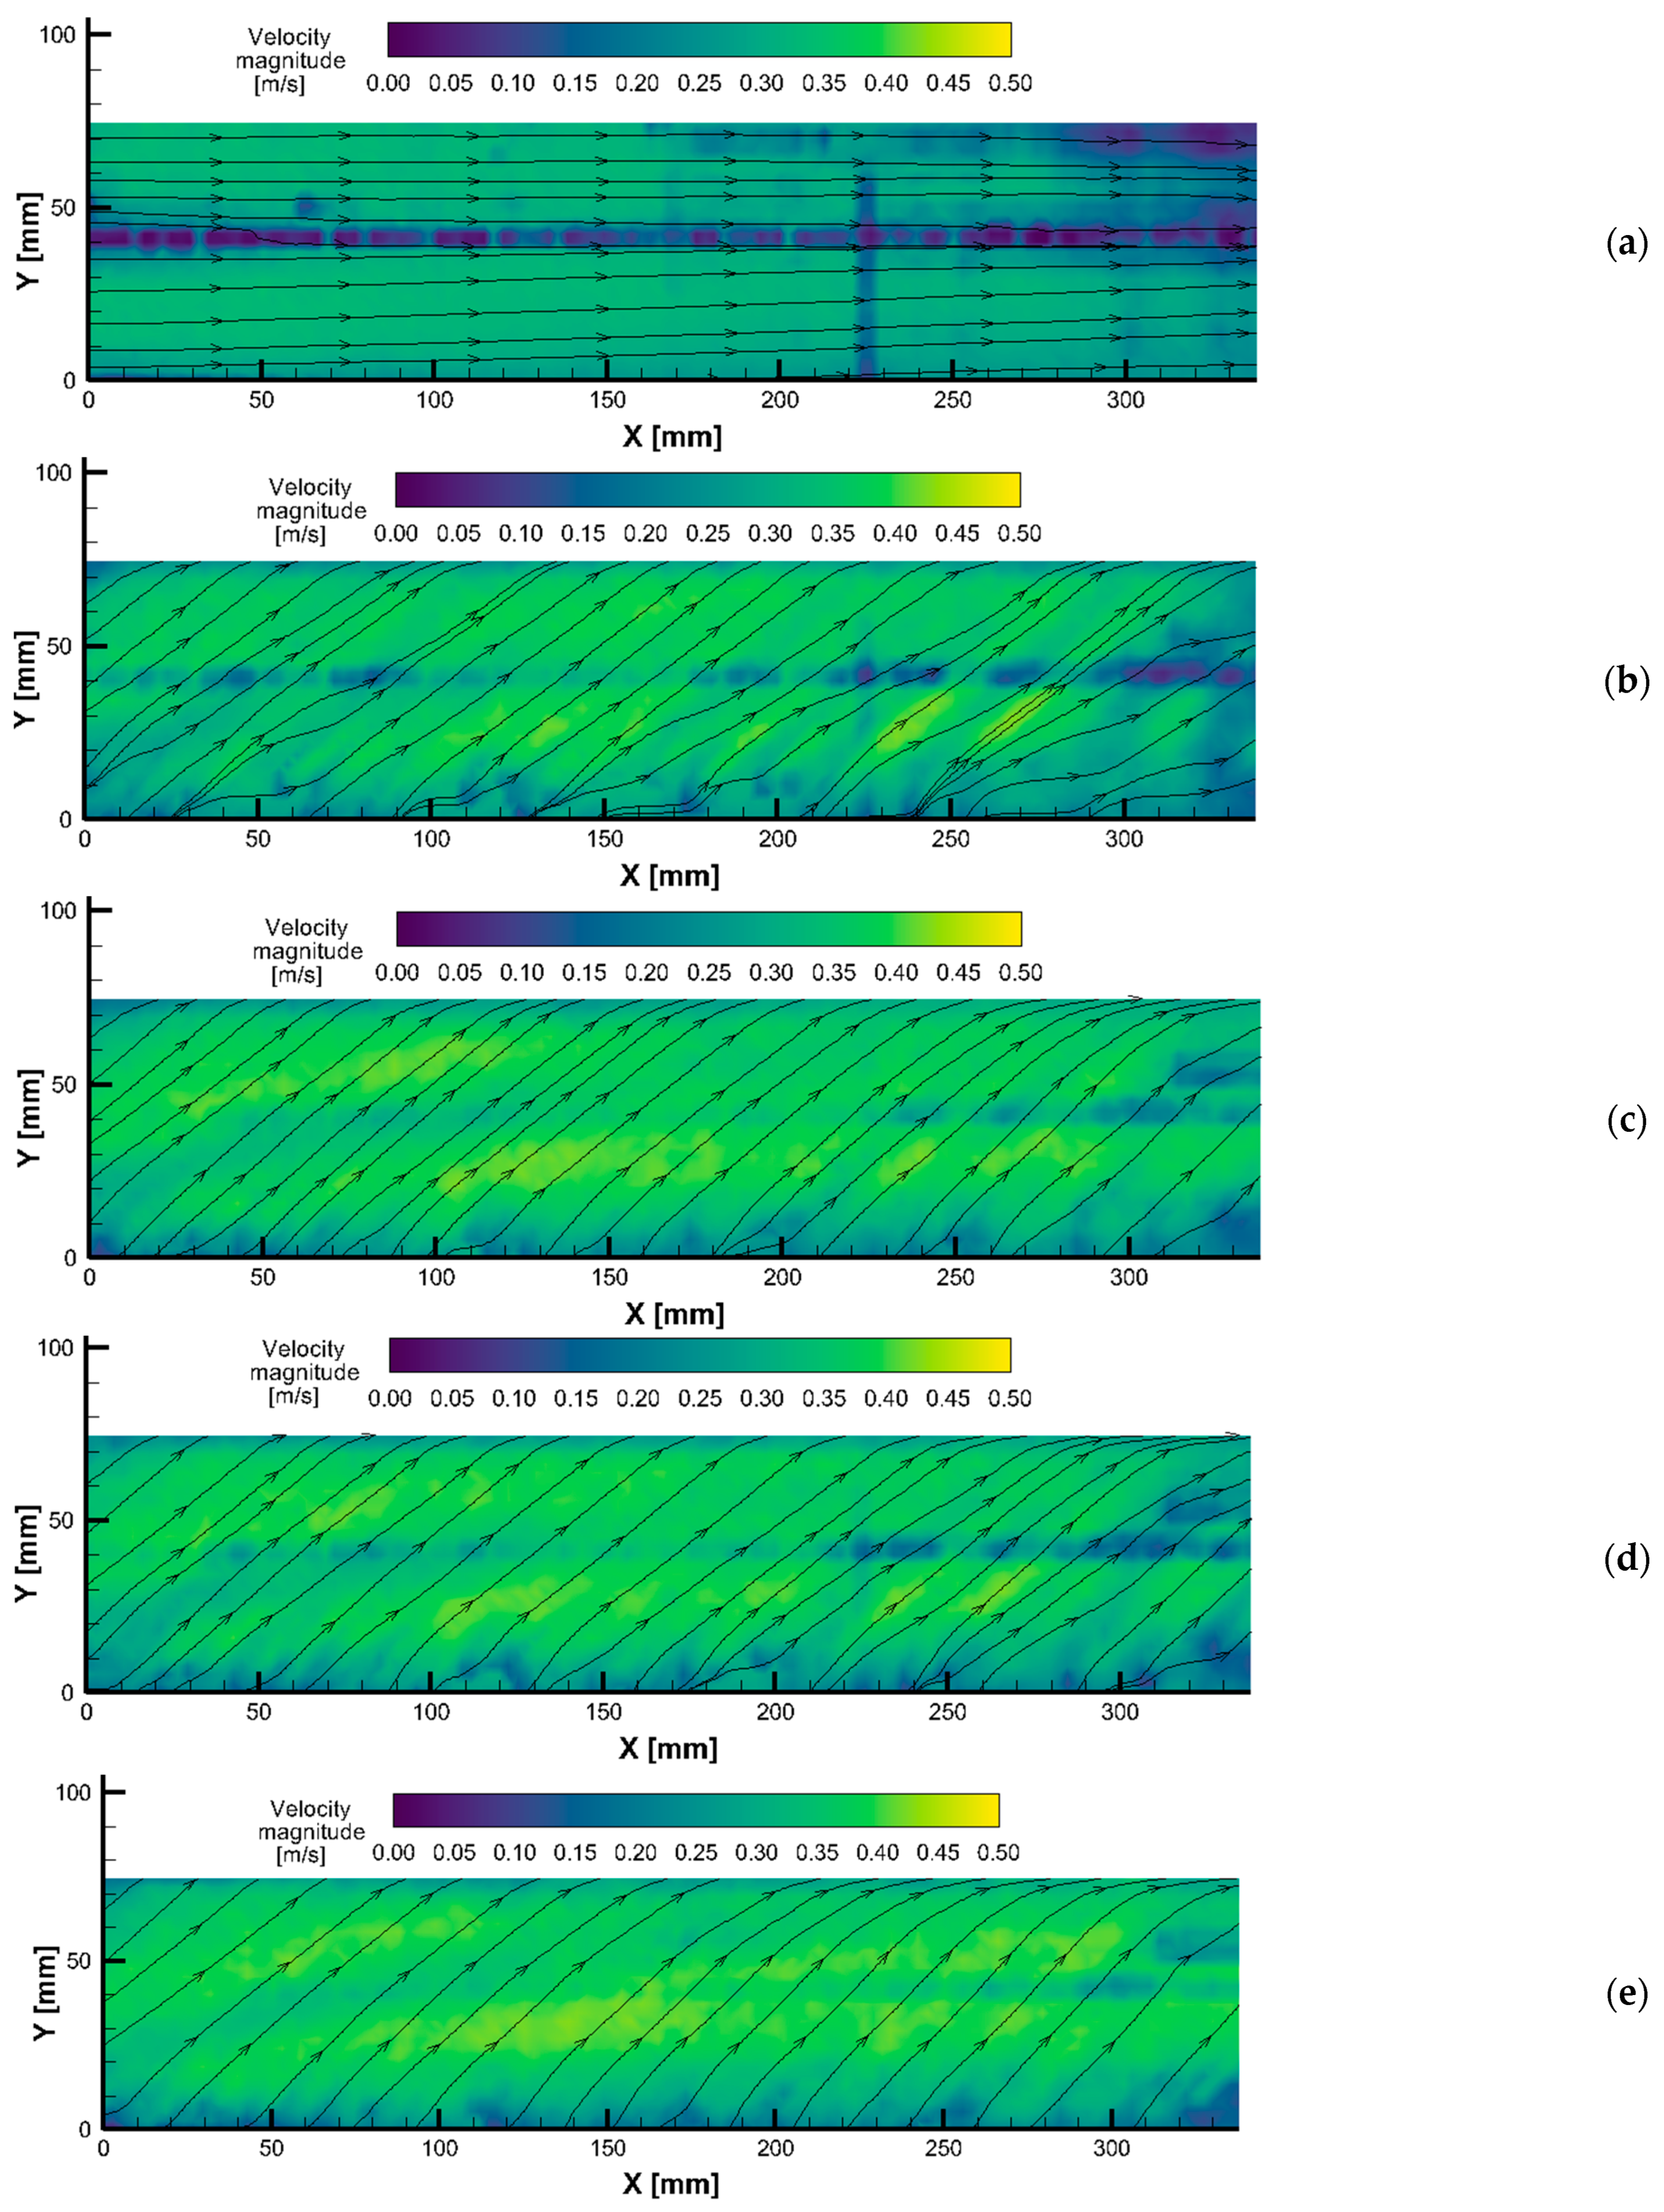
For a better visualization of the velocity induced by the bubbles, the previously analyzed cases were further processed using Tecplot CFD (Bellevue, WA, USA) Post-processing Data Visualization and Analysis software. Thus, the images in Figure 12 show the velocity-magnitude isocontours and the streamlines for airflow rates from 0 to 15 L/min. The X and Y values in Figure 12 are correlated with the experimental setup dimensions: X represents the distance from the porous hose generating the bubbles, while Y represents a slice of the water depth, starting from the porous hose toward the water free surface.
Figure 12.
Velocity magnitude isocontours and streamlines for: (a) flow without bubbles (zero airflow rate), (b) 5 L/min airflow rate; (c) 8 L/min airflow rate; (d) 10.5 L/min airflow rate; (e) 15 L/min airflow rate.
The velocity fields demonstrate that the hydrodynamic effect of the bubble curtain is strongly non-uniform. The largest local velocity magnitudes are concentrated in and around the bubble-plume region, particularly near the lateral plume boundaries where the rising bubble motion interacts with the background channel flow. The surrounding liquid region remains comparatively closer to the reference flow, indicating that the response cannot be described as a uniform increase in channel velocity.
The velocity vectors also show a progressive change in flow direction with increasing airflow rate. In the no-airflow condition, the vectors are predominantly aligned with the main channel direction. After air injection, the vectors near the plume become inclined, while the influence decreases with increasing distance from the porous hose. This spatial organization confirms that the bubble curtain produces a localized modification of both velocity magnitude and direction.
The streamlines and vector fields did not show a clearly closed recirculation cell within the valid PIV domain. Local changes in vector direction were observed near the bubble-plume edges, but these changes did not form a closed streamline pattern that could be identified as a resolved recirculation zone. Therefore, the present results support the presence of localized directional deflection and shear rather than a demonstrated large-scale recirculation cell.
Under the investigated experimental conditions, the water velocity in the experimental setup was 0.33 m/s. The presence of the water intake, together with the formation of the bubble column resulting from the introduction of compressed air through the porous hose, induces a local increase in water velocity. The velocity-magnitude fields indicated a maximum local liquid-phase velocity of approximately 0.42 m/s within the analyzed cases. This increase highlights the combined influence of the intake geometry and air injection on the local flow velocity distribution.
Considering the background water velocity of 0.33 m/s as the reference value, the spatially averaged PIV velocity magnitude increased by approximately 6.72%, 11.76%, 15.24%, and 16.70% at air-injection rates of 5, 8, 10.5, and 15 L/min, respectively. The corresponding mean velocities were 0.3522, 0.3688, 0.3803, and 0.3851 m/s. Although the mean velocity continued to increase with airflow rate, the incremental increase progressively decreased, from 0.0166 m/s between 5 and 8 L/min to only 0.0048 m/s between 10.5 and 15 L/min, indicating a tendency toward hydrodynamic saturation at higher air-injection rates.
As summarized in Table 2, the relative mean velocity change and RMS velocity fluctuation variations reach a plateau at 8 L/min, with differences between airflow rates ≥ 8 L/min remaining within the estimated experimental uncertainty and showing strong overlap of 95% confidence intervals. These results indicate a diminishing marginal hydrodynamic response at higher airflow rates.
Table 2.
Compressor energy demand and hydrodynamic response at different airflow rates.
A good processing procedure applied to the images taken during the PIV measurements is demonstrated by the image showing the flow without bubbles. The velocity vectors (Figure 11) and streamlines (Figure 12) are parallel to the channel bottom. Compared to the zero-airflow case, the introduction of air injection modifies the local velocity field in the vicinity of the porous hose. As the airflow rate increases, a more important influence on the water velocity is noticed, with the velocity vectors being inclined in the direction of the flow. Thus, by analyzing the water velocity vector maps for the cases with air injection (Figure 11), as well as the velocity magnitude isocontours and streamlines (Figure 12), one can find that water flow inside the channel is influenced by the bubble curtain presence in the same manner. The relative increase in spatially averaged velocity magnitude, calculated with respect to the nominal 0.33 m/s background velocity, ranged from 6.72% at 5 L/min to 16.70% at 15 L/min. However, the incremental increase between consecutive airflow conditions decreased progressively at higher air-injection rates. For economic reasons, it is recommended to operate the behavioral barrier at an 8 L/min airflow rate. Additional measurements regarding the operation time of the air compressor and the energy consumption for each analyzed case confirm that the use of an 8 L/min airflow rate represents an economic option for the bubble curtain operation. For the compressed air supply over a 24 h period, the required energy for 1 m of porous hose is 2.54 kWh at an 8 L/min airflow rate, while 4.81 kWh are necessary for supplying 15 L/min. Thus, the PIV results show that increasing the airflow rate from 5 to 15 L/min leads to water velocity magnitude variations below 5%, indicating no substantial improvement in the hydrodynamic effect of the behavioral barrier at higher air injections. In contrast, the energy demand for compressed air supply increases significantly, from 2.54 kWh per day per meter of porous hose at 8 L/min to 4.81 kWh at 15 L/min, representing an increase of approximately 90%. Consequently, airflow rates above 8 L/min result in reduced energy efficiency without measurable hydraulic benefits. The airflow rate of 8 L/min is therefore identified as an economically viable operating condition, providing the identified hydrodynamic effect at a lower energy demand. Therefore, the 8 L/min represents a promising operating condition for subsequent behavioral experiments investigating the response of small fish to the hydrodynamic stimulus provided by the bubble curtain.
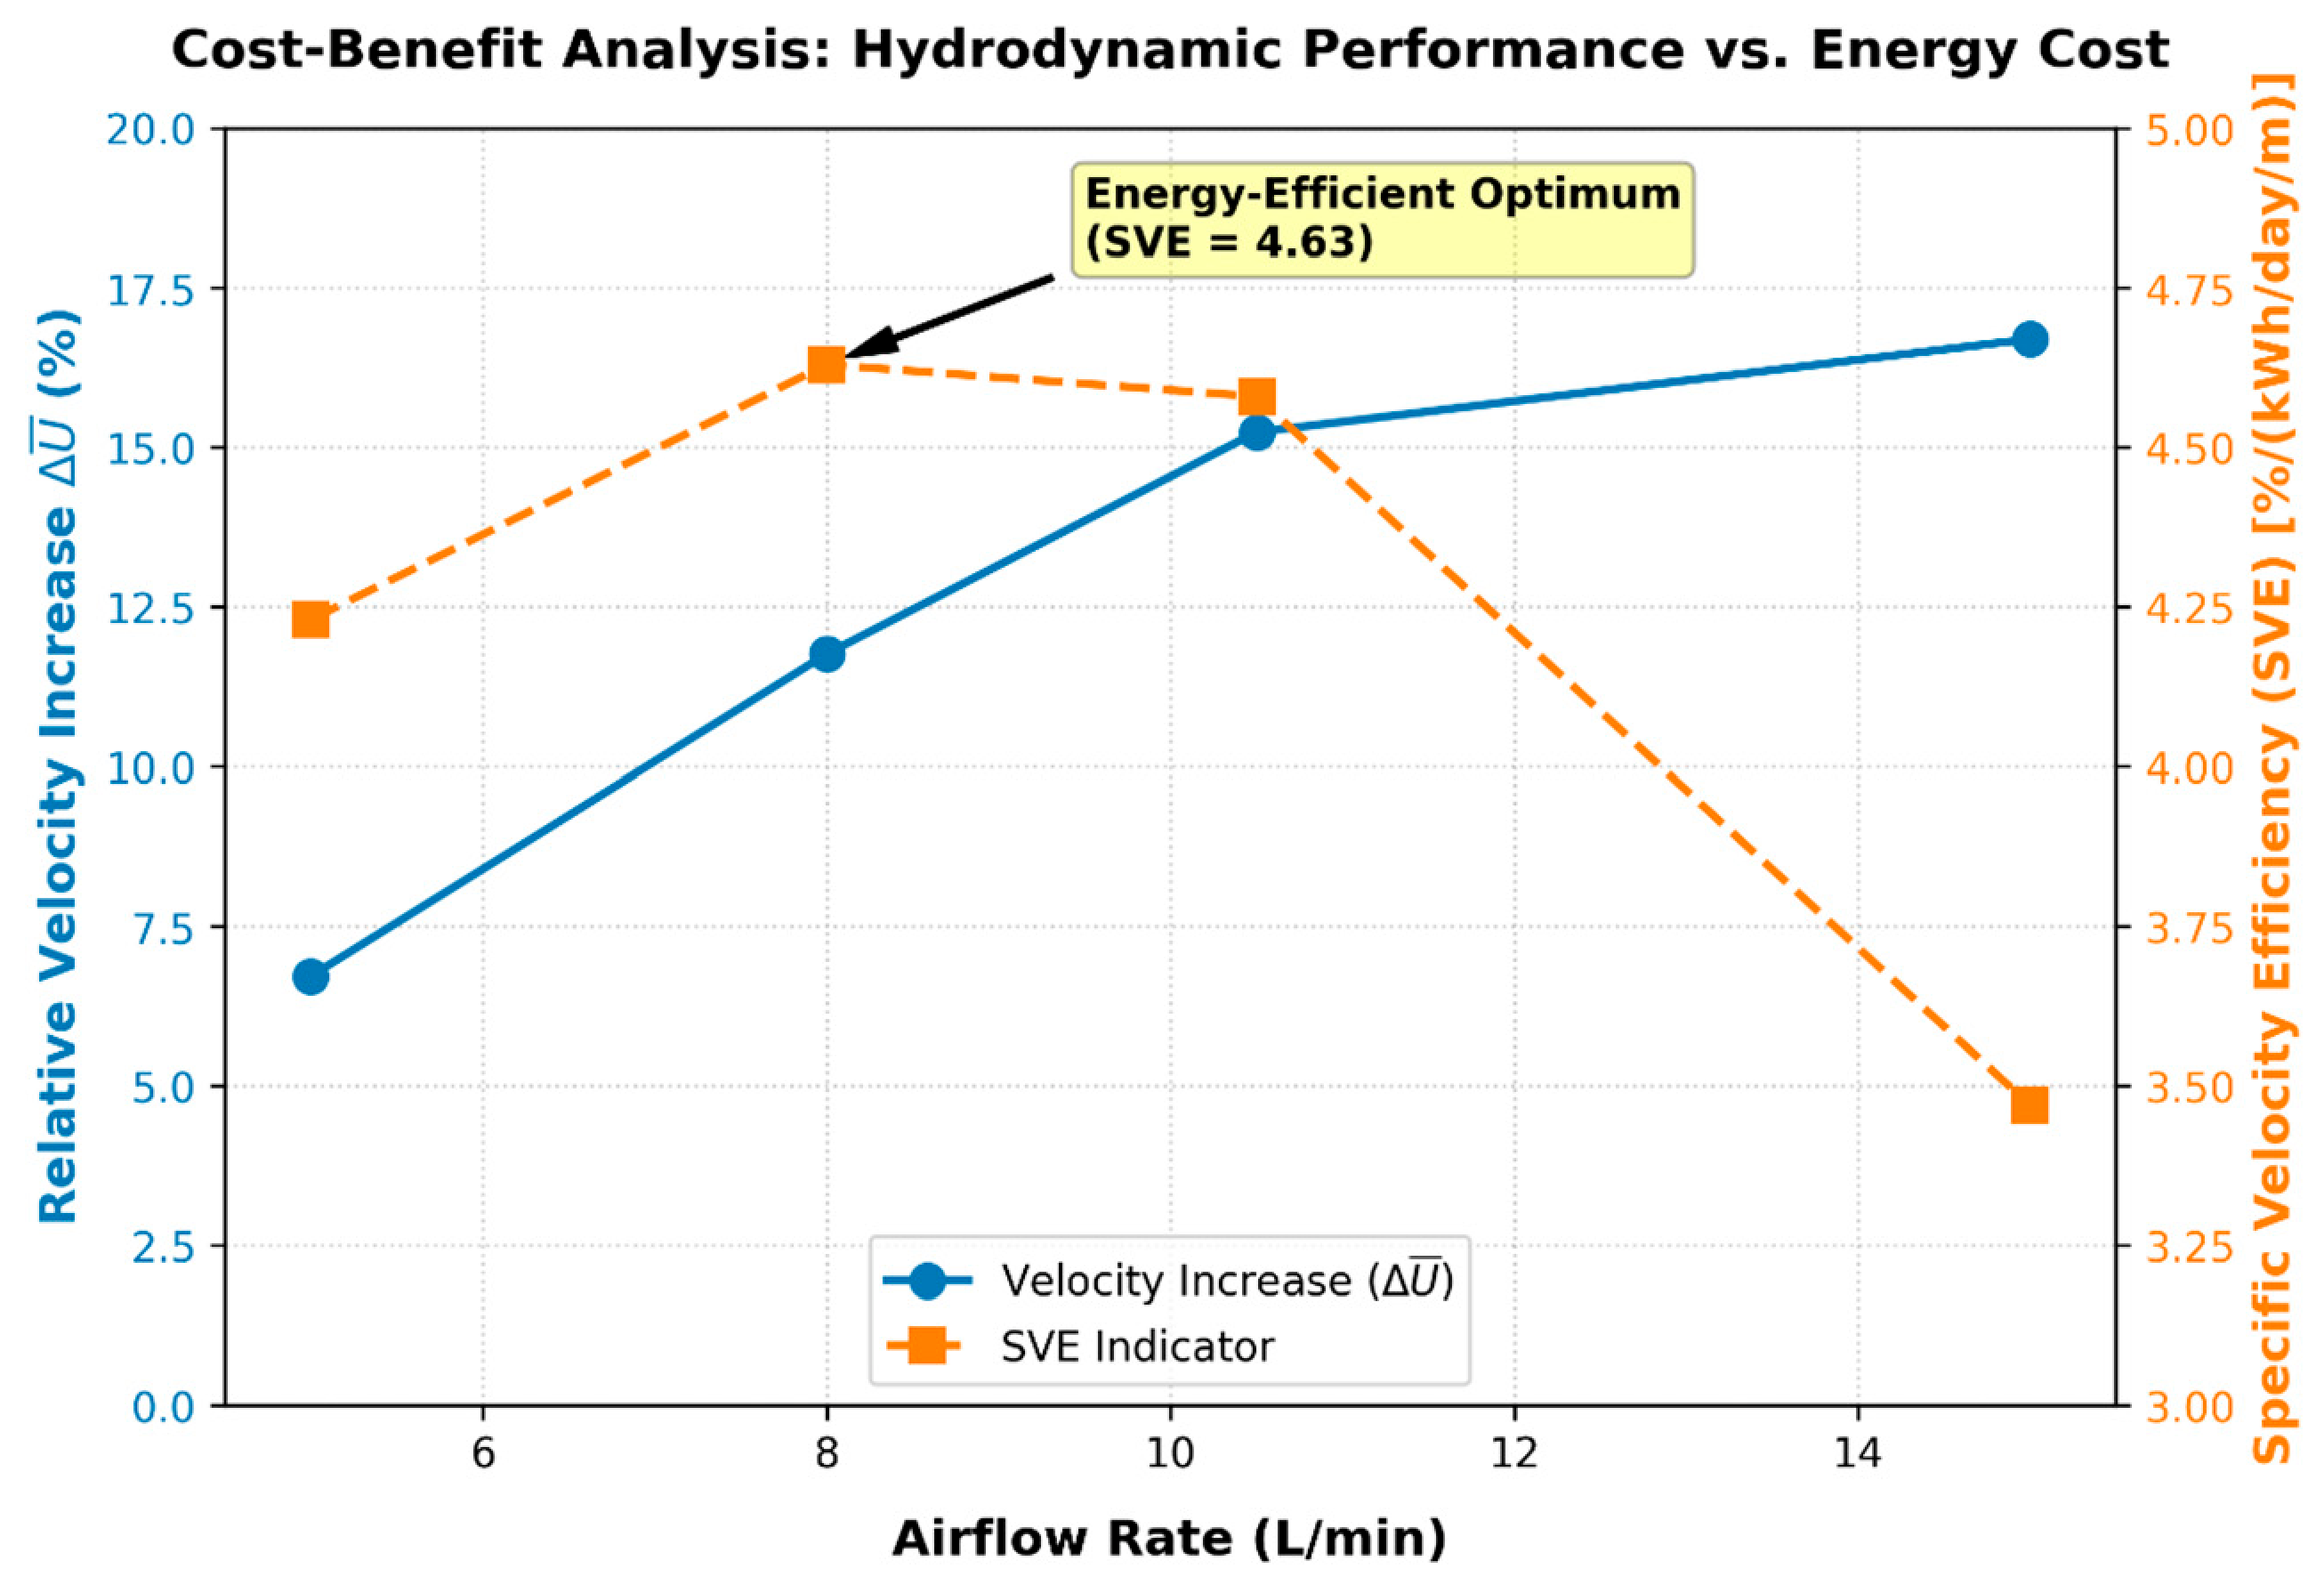
To systematically evaluate the trade-off between the velocity magnitude benefit and the energy cost, a Specific Velocity Efficiency (SVE) indicator was defined as follows: , where is the relative variation in the spatially averaged velocity magnitude, and E is the energy required by the compressor. The higher SVE value at 8 L/min (4.63) compared to 15 L/min (3.47) demonstrates that the 8 L/min operating condition (see Table 2) delivers the highest spatially averaged velocity benefit per unit of electrical energy consumed by the compressor, confirming it as the energy-efficient optimum, as shown in Figure 13.
Figure 13.
Hydrodynamic performance vs. Energy Cost.
It should be noted that this economic and energy assessment is strictly valid for the present laboratory scale and experimental geometry. Extrapolation of these operating conditions to full-scale prototype conditions requires caution, as site-specific factors, hydrodynamics, and geometric scaling laws may significantly alter the system’s performance. Therefore, site-specific validation is mandatory before industrial implementation.
4.2. Airflow-Rate Dependence of the Hydrodynamic Response
The hydrodynamic response of the bubble curtain was evaluated in relation to the imposed airflow rate using the spatially averaged velocity magnitude and its relative variation with respect to the nominal background water velocity of 0.33 m/s. As shown in Table 3, for the analyzed measurement plane, the spatially averaged velocity magnitude increased from the no-airflow reference value to 0.3522, 0.3688, 0.3803 and 0.3851 m/s at airflow rates of 5, 8, 10.5 and 15 L/min, respectively. These values correspond to increases of approximately 6.72%, 11.76%, 15.24%, and 16.70% relative to the 0.33 m/s background flow.
Table 3.
Spatially averaged velocity magnitude and incremental hydrodynamic response at different airflow rates for the measurement plane located 20 mm from the outer surface of the porous hose.
Although the spatially averaged velocity magnitude increased with airflow rate, the incremental increase between consecutive operating conditions became progressively smaller. The increase was approximately 0.0166 m/s between 5 and 8 L/min, 0.0115 m/s between 8 and 10.5 L/min, and 0.0048 m/s between 10.5 and 15 L/min. Expressed relative to the preceding airflow condition, these increments correspond to approximately 4.73%, 3.11% and 1.27%, respectively. This trend indicates a diminishing marginal hydrodynamic response at higher airflow rates, although complete saturation cannot be established from the present measurements alone.
The velocity-magnitude fields and streamlines further show that air injection modifies not only the magnitude but also the direction of the local liquid-phase flow. The hydrodynamic modification is therefore spatially non-uniform and should not be interpreted solely as a uniform acceleration of the background current. The observed response reflects the combined influence of air injection, bubble rise and the geometry of the laboratory-scale water intake.
Considering the hydrodynamic response together with the compressed-air demand, 8 L/min may be regarded as a good energy-efficient option for the tested geometry and background flow. This designation should not be interpreted as a universal hydrodynamic threshold or optimum, because the present study does not include fish-behavior measurements and does not assess other channel velocities, water depths, intake geometries, or field conditions.
4.3. Reference-Flow Condition and Mass-Balance Limitation
The experimental procedure was designed to maintain the same water-pump and channel-flow settings while varying the airflow rate, rather than to re-adjust the water velocity after each air-injection condition. The water level in the intake reservoir and the captured intake discharge were maintained constant. These controls support the comparability of the investigated operating conditions; however, they do not constitute a complete independent verification of mass conservation over the entire channel cross-section.
In particular, the present study did not integrate the velocity field over the full channel section for each airflow condition, nor did it provide simultaneous measurements of the full-section discharge and free-surface distribution. Therefore, possible redistribution of the bulk velocity field outside the PIV measurement plane cannot be completely excluded. The reported values should consequently be interpreted as spatially averaged liquid-phase velocities over the valid PIV measurement area, relative to the no-airflow reference condition.
4.4. Assessment of Bubble-Induced Liquid-Phase Velocity in Relation to Fish Swimming Capacity and Implications for Fish Movement
The hydraulic conditions generated by the bubble curtain are a key factor determining its potential to influence fish movement and behavior. Particle Image Velocimetry provides a non-intrusive and spatially resolved characterization of the velocity field generated within the experimental facility, allowing local flow velocities to be quantified throughout the test section. The measured velocity field is reported as a hydraulic characterization of the experimental configuration and not as a biological assessment of the bubble curtain. This approach is particularly relevant for assessing the potential of the bubble curtain to act as a behavioral barrier for fish species with relatively limited swimming performance, like common carp (Cyprinus carpio) and crucian carp (Carassius auratus). In the present experiments, the maximum measured water velocity was 0.42 m/s. When comparing the reported [40] critical swimming speed of approximately 0.60–0.82 m/s for common carp and 0.85 ± 0.032 m/s for crucian carp [41], it can be seen that the measured velocity is within the range of values in the literature for swimming performance under the specific conditions of those studies. However, it does not establish whether fish would enter, avoid, cross, remain within, or be diverted by the bubble curtain. Thus, the maximum flow velocity measured into the experimental setup corresponds to approximately 51–70% of Ucrit for common carp and approximately 49% of Ucrit for crucian carp. Although the maximum velocity generated by the bubble curtain remained below the reported Ucrit values for both species, it represents a substantial fraction of their sustained swimming capacity. The critical swimming speed provides a useful species-specific reference for assessing the hydraulic challenge imposed by the bubble curtain. The comparison between PIV-derived velocities and Ucrit indicates that the 0.42 m/s velocity associated with the upward motion of the bubble curtain represents a substantial proportion of the sustained swimming capacity reported for common carp and crucian carp, although it remains below their critical swimming thresholds. Consequently, the hydraulic conditions generated by the bubble curtain may impose a considerable swimming demand and potentially influence fish orientation, swimming behavior, and movement trajectories. The spatially resolved PIV measurements are particularly valuable in this context, as they allow localized high-velocity regions within the bubble curtain to be identified and related to species-specific swimming performance.
Critical swimming speed should not be interpreted as a behavioral threshold since it is an experimentally defined performance metric that depends on species, body size, life stage, acclimation, temperature, test protocol, flow uniformity, duration, and individual condition. Thus, it cannot be used alone to predict fish orientation, swimming trajectories, avoidance, passage success, or entrainment risk in the present non-uniform, two-phase flow field.
4.5. Implications of Bubble-Induced Flow Structures for Fish Passage and Future Research
The PIV results show that the bubble curtain creates a spatially non-uniform hydrodynamic field, with localized increases in velocity, changes in flow direction, and velocity gradients near the porous hose and rising bubbles. At a background velocity of 0.33 m/s, the spatially averaged velocity increased to 0.3522, 0.3688, 0.3803, and 0.3851 m/s at airflow rates of 5, 8, 10.5, and 15 L/min, respectively, with a maximum local velocity of approximately 0.42 m/s. These conditions may influence fish orientation, swimming effort, and passage routes through changes in flow magnitude and direction. Although 0.42 m/s remained below reported critical swimming velocities for common carp and crucian carp, it may still represent a behavioral or energetic challenge, particularly for smaller or weaker-swimming individuals.
The airflow-rate results indicate diminishing increases in mean velocity at higher air supply, with a greater increase between 5 and 8 L/min than between 10.5 and 15 L/min. Thus, 8 L/min may provide a useful starting condition for behavioral testing, although it cannot be considered a universal optimum. The hydrodynamic field may constitute one component of the stimulus environment investigated in future fish-behavior experiments; whether it promotes lateral or vertical displacement remains untested. Still, the present PIV measurements do not demonstrate effective fish diversion or reduced entrainment. Future experiments should therefore combine PIV with synchronized fish tracking to relate fish position, swimming speed, body orientation, tail-beat frequency, turning behavior, and passage success to local velocity magnitude, direction, and fluctuations.
Further research should assess the effects of fish size and species, as well as background velocity, water depth, intake discharge, hose position, and distance from the intake. Additional parameters such as velocity gradients, vorticity, turbulence intensity, and bubble void fraction should be considered to better characterize the bubble curtain. Combining these measurements with fish behavior would help distinguish hydrodynamic, visual, and acoustic effects and support the development of species-specific and energy-efficient bubble-curtain fish-guidance systems.
The present study was designed as a preliminary hydrodynamic characterization of the bubble curtain in the absence of fish, with the explicit aim of quantifying the separate effect of the bubble-induced velocity field on the surrounding flow. This approach allows the hydraulic conditions generated by the curtain to be established before interpreting fish-behavioral responses, thereby avoiding confounding effects between flow modification and biological variability. Introducing a real or artificial fish model into the flow field would inevitably alter the local velocity distribution through body-induced displacement, wake formation, and additional turbulence, particularly in a laboratory-scale channel with limited cross-section. While such experiments are valuable for understanding fish–flow interactions, they were carried out in the framework of a research project [42] that envisaged the analysis of the flow-field modification induced by the bubble curtain near a water intake. A subsequent research project [43] is currently investigating the bubble curtain influence, along with other stimuli, on different species of live fish. Thus, tests with live fish have been initiated after completion of the present PIV measurements, and future work will assess fish responses to flow-field modification and how these modifications relate to passage decisions.
5. Conclusions
The present study used planar Particle Image Velocimetry to characterize the liquid-phase flow near a bubble curtain installed adjacent to a laboratory-scale river water intake. At a background channel velocity of 0.33 m/s, air-injection rates of 5, 8, 10.5, and 15 L/min modified the local velocity direction and magnitude. Considering the background water velocity as the reference value, the spatially averaged velocity magnitude increased to 0.3522, 0.3688, 0.3803, and 0.3851 m/s, corresponding to increases of approximately 6.72%, 11.76%, 15.24%, and 16.70%, respectively. The maximum local velocity reached approximately 0.42 m/s at 8 L/min. Although the spatially averaged velocity magnitude continued to increase with airflow rate, the incremental increase became progressively smaller, decreasing from 0.0166 m/s between 5 and 8 L/min to 0.0048 m/s between 10.5 and 15 L/min.
These results indicate that the bubble curtain substantially modifies the local hydrodynamic conditions near the water intake. The reduction in the incremental velocity increase at higher air-injection rates suggests a tendency toward hydrodynamic saturation. Within the tested operating range, 8 L/min may therefore be considered a candidate energy-efficient operating condition because it produces substantial hydrodynamic modification while requiring less compressed air than the 10.5 and 15 L/min conditions. However, the present data do not establish 8 L/min as a universal hydrodynamic effectiveness threshold or optimum for other channel geometries, background velocities, or field installations.
According to Liao J.C. [9] and Castro-Santos and Haro [21], fish response is governed by relative changes in velocity magnitude and velocity fluctuations rather than by absolute flow velocities. The measured velocity gradients and fluctuations may constitute hydrodynamic stimuli relevant to fish orientation, even if the values do not exceed the typical sustained swimming capacities of small fish; however, their detectability and behavioral effect were not assessed in the present study. Although higher airflow rates produced additional increases in spatially averaged velocity magnitude, their marginal hydrodynamic benefit decreased progressively. Because no fish were present during the experiments, the measured velocity changes demonstrate hydrodynamic perturbation only and do not establish behavioral guidance efficiency. The comparison with fish swimming-performance data should therefore be regarded as a preliminary hydraulic assessment rather than evidence of fish avoidance or diversion.
Overall, the present study demonstrates a measurable modification of the liquid-phase flow field produced by the bubble curtain under the tested laboratory conditions. It does not demonstrate fish-guidance performance. The identified 8 L/min condition should therefore be regarded only as a candidate operating point for subsequent biological validation. Future studies should combine the present PIV measurements with synchronized fish tracking and species- and size-specific behavioral experiments, reporting endpoints such as orientation, swimming speed, residence time, crossing probability, avoidance, and entrainment under field-relevant conditions involving different background velocities, water depths, intake configurations, and operating conditions.
6. Patents
The work reported in this article has partially led to the elaboration of the patent application A/00357/23.06.2022, Priză de apă pentru râuri cu barieră comportamentală pentru reducerea impactului asupra faunei piscicole (River water intake with behavioral barrier to reduce impact on fish fauna), Cîrciumaru G., Chihaia R.A., Dancă P.A., Voina A.
Author Contributions
Conceptualization, G.C., R.-A.C. and P.A.D.; methodology, G.C., R.-A.C. and P.A.D.; software, P.A.D.; validation, P.A.D. and G.C.; formal analysis, G.C., R.-A.C. and L.-A.E.-L.; data curation, P.A.D.; writing—original draft preparation, G.C.; writing—review and editing, G.C., R.-A.C. and L.-A.E.-L.; visualization, P.A.D. and L.-A.E.-L.; project administration, G.C. All authors have read and agreed to the published version of the manuscript.
Funding
This research was funded by the Ministry of Research, Innovation and Digitization, CCCDI—UEFISCDI, project number PN-IV-P7-7.1-PTE-2024-0249 within PNCDI IV, by Nucleu Program, contract no. 42N/2023, project no. PN23140101 and by a grant of the Ministry of Research, Innovation and Digitization, CNCS/CCCDI—UEFISCDI, project number PN-IV-P8-8.1-PRE-HE-ORG-2025-0350, within PNCDI IV.
Data Availability Statement
During experiments, large amounts of raw data were generated. Only relevant data for the current analyzed case were selected, processed, discussed, and included in this article. The processed PIV data supporting the findings of this study are available from the corresponding author upon reasonable request.
Conflicts of Interest
The authors declare no conflicts of interest. The funders had no role in the design of the study; in the collection, analysis, or interpretation of data; in the writing of the manuscript; or in the decision to publish the results.
Abbreviations
The following abbreviations are used in this manuscript:
| ADCP | Acoustic Doppler Current Profiler |
| LIF | Laser-Induced Fluorescence |
| PIV | Particle Image Velocimetry |
| RMS | Root-Mean-Square |
References
- Poletto, J.B.; Cocherell, D.E.; Mussen, T.D.; Ercan, A.; Bandeh, H.; Kavvas, M.L.; Cech, J.J.; Fangue, N.A. Fish-protection devices at unscreened water diversions can reduce entrainment: Evidence from behavioural laboratory investigations. Conserv. Physiol. 2015, 3, cov040. [Google Scholar] [CrossRef] [Scilit] [PubMed]
- Bunt, C.M.; Castro-Santos, T.; Haro, A. Performance of fish passage structures at upstream barriers to migration. River Res. Appl. 2012, 28, 457–478. [Google Scholar] [CrossRef] [Scilit]
- U.S. Department of the Interior, Bureau of Reclamation. Fish Protection at Water Diversions—A Guide for Planning and Designing Fish Exclusion Facilities; U.S. Department of the Interior, Bureau of Reclamation: Denver, CO, USA, 2006.
- Linnansaari, T.; Wallace, B.; Curry, R.; Yamazaki, G. Fish Passage in Large Rivers: A Literature Review; Mactaquac Aquatic Ecosystem Study Report Series 2015-016; Canadian Rivers Institute, University of New Brunswick: Fredericton, NB, Canada, 2015. [Google Scholar] [CrossRef]
- European Parliament; Council of the European Union. Directive 2000/60/EC of the European Parliament and of the Council of 23 October 2000 establishing a framework for Community action in the field of water policy. Off. J. Eur. Communities 2000, L327, 1–72. [Google Scholar]
- WWF-România. Analiza Legislației Specifice din Domeniul Planificării și Emiterii Actelor de Reglementare Aferente Construirii și Funcționării Microhidrocentralelor în RO; WWF: Bucharest, Romania, 2013. [Google Scholar]
- Hockley, F.A.; Wilson, C.A.M.E.; Brew, A.; Cable, J. Fish responses to flow velocity and turbulence in relation to size, sex and parasite load. J. R. Soc. Interface 2014, 11, 20130814. [Google Scholar] [CrossRef] [Scilit] [PubMed]
- Gisen, D.C.; Schütz, C.; Weichert, R.B. Development of behavioral rules for upstream orientation of fish in confined space. PLoS ONE 2022, 17, e0263964. [Google Scholar] [CrossRef] [Scilit] [PubMed]
- Liao, J.C. A review of fish swimming mechanics and behaviour in altered flows. Philos. Trans. R. Soc. B Biol. Sci. 2007, 362, 1973–1993. [Google Scholar] [CrossRef] [Scilit] [PubMed]
- Kerr, J.R.; Kemp, P.S. Masking a fish’s detection of environmental stimuli: Application to improving downstream migration at river infrastructure. J. Fish Biol. 2019, 95, 228–237. [Google Scholar] [CrossRef] [Scilit] [PubMed]
- Silva, A.T.; Bærum, K.M.; Hedger, R.D.; Baktoft, H.; Fjeldstad, H.-P.K.; Gjelland, Ø.; Økland, F.; Forseth, T. The effects of hydrodynamics on the three-dimensional downstream migratory movement of Atlantic salmon. Sci. Total Environ. 2020, 705, 135773. [Google Scholar] [CrossRef] [Scilit] [PubMed]
- Mogdans, J. Sensory ecology of the fish lateral-line system: Morphological and physiological adaptations for the perception of hydrodynamic stimuli. J. Fish Biol. 2019, 95, 53–72. [Google Scholar] [CrossRef] [Scilit] [PubMed]
- Popper, A.N.; Schilt, C.R. Hearing and acoustic behavior: Basic and applied considerations. In Fish Bioacoustics; Webb, J.F., Fay, R.R., Popper, A.N., Eds.; Springer: New York, NY, USA, 2008; pp. 17–48. [Google Scholar] [CrossRef] [Scilit]
- Braun, C.B.; Sand, O. Functional overlap and nonoverlap between lateral line and auditory systems. In The Lateral Line System; Coombs, S., Bleckmann, H., Fay, R., Popper, A., Eds.; Springer Handbook of Auditory Research; Springer: New York, NY, USA, 2013; Volume 48, pp. 281–312. [Google Scholar] [CrossRef] [Scilit]
- Cîrciumaru, G.; Chihaia, R.-A.; Voina, A.; Gogoașe Nistoran, D.-E.; Simionescu, Ș.-M.; El-Leathey, L.-A.; Mândrea, L. Experimental analysis of a fish guidance system for a river water intake. Water 2022, 14, 370. [Google Scholar] [CrossRef] [Scilit]
- Zielinski, D. Bubble Barrier Technologies for Common Carp. Master’s Thesis, University of Minnesota, Minneapolis, MN, USA, 2011. [Google Scholar]
- Li, L.; Maaswinkel, H. Visual sensitivity and signal processing in teleosts. In Sensory Systems Neuroscience; Hara, T.J., Zielinski, B.S., Eds.; Elsevier: Amsterdam, The Netherlands, 2007; pp. 180–227. [Google Scholar]
- Cîrciumaru, G.; Chihaia, R.-A.; Dancă, P.A.; Voina, A. Priză de Apă pentru Râuri cu Barieră Comportamentală pentru Reducerea Impactului asupra Faunei Piscicole. Romanian Patent Application A/00357/23.06.2022, 23 June 2022. [Google Scholar]
- Noatch, M.R.; Suski, C.D. Non-physical barriers to deter fish movements. Environ. Rev. 2012, 20, 71–82. [Google Scholar] [CrossRef] [Scilit]
- Castro-Santos, T.; Haro, A. Fish guidance and passage at barriers. In Fish Locomotion: An Eco-Ethological Perspective; Domenici, P., Kapoor, B.G., Eds.; CRC Press: Boca Raton, FL, USA, 2010; pp. 62–89. [Google Scholar] [CrossRef] [Scilit]
- Sanz-Ronda, F.J.; Fuentes-Pérez, J.F.; Bravo-Córdoba, F.J.; García-Vega, A.; Ruiz-Legazpi, J.; Martínez de Azagra, A. Estimating fish passage over velocity barriers for non-uniform flow conditions: A case study in flat-V gauging weirs. Biol. Life Sci. Forum 2022, 13, 20. [Google Scholar] [CrossRef] [Scilit]
- Kapitze, R. Culvert Fishway Planning and Design Guidelines, Part C—Fish Migration Barriers and Fish Passage Options for Road Crossings; Version 2.0; James Cook University, School of Engineering and Physical Sciences: Townsville, Australia, 2010; Available online: https://www.jcu.edu.au/__data/assets/pdf_file/0007/120202/jcuprd1_053871.pdf (accessed on 13 January 2026).
- Sánchez-González, J.R.; Morcillo, F.; Ruiz-Legazpi, J.; Sanz-Ronda, F.J. Fish morphology and passage through velocity barriers: Experience with northern straight-mouth nase (Pseudochondrostoma duriense Coelho, 1985) in an open channel flume. Hydrobiologia 2022, 849, 1351–1366. [Google Scholar] [CrossRef] [Scilit]
- O’Connor, J.; Stuart, I.; Campbell-Beschorner, R. Guidelines for Fish Passage at Small Structures; Arthur Rylah Institute for Environmental Research, Technical Report Series No. 276; Department of Environment, Land, Water and Planning: Heidelberg, Australia, 2017. Available online: https://www.ari.vic.gov.au/__data/assets/pdf_file/0027/123399/ARI-Technical-Report-276-Guidelines-for-fish-passage-at-small-structures.pdf (accessed on 13 January 2026).
- Liang, Y.; Hou, Y.; Hu, W.; Johnson, D.; Wang, J. Flow velocity preference of Schizothorax oconnori Lloyd swimming upstream. Glob. Ecol. Conserv. 2021, 32, e01902. [Google Scholar] [CrossRef] [Scilit]
- Kováts, P.; Thévenin, D.; Zähringer, K. Characterizing fluid dynamics in a bubble column aimed for the determination of reactive mass transfer. Heat Mass Transf. 2018, 54, 453–461. [Google Scholar] [CrossRef] [Scilit]
- Murgan, I.; Bunea, F.; Ciocan, G.D. Experimental PIV and LIF characterization of a bubble column flow. Flow Meas. Instrum. 2017, 54, 224–235. [Google Scholar] [CrossRef] [Scilit]
- Laakkonen, M.; Honkanen, M.; Saarenrinne, P.; Aittamaa, J. Local bubble size distributions, gas–liquid interfacial areas and gas holdups in a stirred vessel with Particle Image Velocimetry. Chem. Eng. J. 2005, 109, 37–47. [Google Scholar] [CrossRef] [Scilit]
- Yao, H.; Cao, L.; Wu, D.; Gao, Y.; Qin, S.; Yu, F. PIV study on grid-generated turbulence in a free surface flow. Water 2021, 13, 909. [Google Scholar] [CrossRef] [Scilit]
- Seol, D.M.; Seo, J.H.; Rhee, S.H. Towed underwater PIV measurement for free-surface effects on turbulent wake of a surface-piercing body. Int. J. Nav. Archit. Ocean Eng. 2013, 5, 404–413. [Google Scholar] [CrossRef] [Scilit]
- Muste, M.; Xiong, Z.; Schöne, J.; Li, Z. Validation and extension of image velocimetry capabilities for flow diagnostics in hydraulic modeling. J. Hydraul. Eng. 2004, 130, 175–185. [Google Scholar] [CrossRef] [Scilit]
- Lindmark, E.M. Flow Design for Migrating Fish. Ph.D. Thesis, Luleå University of Technology, Luleå, Sweden, 2008. Available online: https://www.diva-portal.org/smash/get/diva2:998852/FULLTEXT01.pdf (accessed on 13 January 2026).
- Stoilova, V.; Bergman, E.; Aldven, D.; Bowes, R.E.; Calles, O.; Nyquist, N.; Nyqvist, D.; Rowinski, P.; Greenberg, L. Downstream guidance performance of a bubble curtain and a net barrier for the European eel, Anguilla anguilla, in an experimental flume. Ecol. Eng. 2025, 215, 107599. [Google Scholar] [CrossRef] [Scilit]
- Tu, H.; Wang, F.; Wang, H.; Gao, Q.; Wei, R. Experimental study on wake flows of a live fish with time-resolved tomographic PIV and pressure reconstruction. Exp. Fluids 2022, 63, 25. [Google Scholar] [CrossRef] [Scilit]
- Calicchia, M.A.; Mittal, R.; Seo, J.-H.; Ni, R. Reconstructing the pressure field around swimming fish using a physics-informed neural network. J. Exp. Biol. 2023, 226, jeb244983. [Google Scholar] [CrossRef] [Scilit] [PubMed]
- Zhang, Y.; Jing, D.; Huang, X.; Chen, X.; Liu, B.; Kong, X. Comparison study of hydrodynamic characteristics in different swimming modes of Carassius auratus. Fishes 2024, 9, 365. [Google Scholar] [CrossRef] [Scilit]
- Cîrciumaru, G.; Chihaia, R.-A.; El-Leathey, L.-A.; Voina, A. Experimental Study of a Fish Behavioral Barrier Based on Bubble Curtains for a River Water Intake. In Inland Waters—Ecology, Limnology and Environmental Protection; Rashed, M.N., Ed.; IntechOpen: London, UK, 2024. [Google Scholar] [CrossRef] [Scilit]
- Bunea, F.; Dancă, P.A.; Năstase, I. Determinarea Vitezelor în Curgeri cu Ajutorul Imaginilor de Particule—PIV. Noțiuni Generale și Aplicații; CD-ROM Edition; Editura Universității București: București, Romania, 2021; ISBN 978-973-0-34566-7. [Google Scholar]
- Dancă, P.A.; Simionescu, S.-M.; Cîrciumaru, G.; Gogoașe Nistoran, D.-E.; Chihaia, R.-A.; Băbuțanu, C. Fish guidance system for a river water intake—Experimental and numerical study. IOP Conf. Ser. Earth Environ. Sci. 2023, 1185, 012018. [Google Scholar] [CrossRef] [Scilit]
- Li, J.; Liu, H.; Xiao, Z.; Wei, X.; Liu, Z.; Zhang, Z. Swimming performance of Cyprinus carpio (Carp) in China. Heliyon 2023, 9, e17014. [Google Scholar] [CrossRef] [Scilit] [PubMed]
- Hou, Y.; Wang, X.; He, F.; Wang, X.; Zhu, L.; Cai, L. Morphology and energetics of the wake behind a continuously swimming crucian carp at different flow velocities. Sci. Rep. 2026, 16, 15970. [Google Scholar] [CrossRef] [Scilit] [PubMed]
- Eco-Hybrid Water Intake with Behavioural Barrier to Reduce the Impact on Fish Fauna and River Morphology; Project Number PN-III-P2-2.1-PED-2019-1444, Funded by the Ministry of Research, Innovation and Digitization; CCCDI—UEFISCDI: Bucharest, Romania, 2019.
- Automated Behavioral Barrier for Biodiversity Protection by Detterring Fish from River Water Intakes; Project Number PN-IV-P7-7.1-PTE-2024-024, Funded by the Ministry of Research, Innovation and Digitization; CCCDI—UEFISCDI: Bucharest, Romania, 2024.

Disclaimer/Publisher’s Note: The statements, opinions and data contained in all publications are solely those of the individual author(s) and contributor(s) and not of MDPI and/or the editor(s). MDPI and/or the editor(s) disclaim responsibility for any injury to people or property resulting from any ideas, methods, instructions or products referred to in the content. |
© 2026 by the authors. Licensee MDPI, Basel, Switzerland. This article is an open access article distributed under the terms and conditions of the Creative Commons Attribution (CC BY) license.