


Abstract
River health assessment in arid seasonal rivers is challenging because strong hydrological seasonality, spatial heterogeneity, and intensive human intervention can produce substantial differences among river reaches. Conventional basin-scale assessments may obscure localized ecological and management problems when indicators with different spatial characteristics are evaluated using a uniform spatial unit. This study developed a spatially differentiated river health assessment approach for the Yarkant River Basin, an arid seasonal river basin in northwestern China. River health was considered an integrated condition encompassing basin structure, water conditions, aquatic biota, and socio-economic service functions. A multi-dimensional indicator system comprising 12 indicators across four criteria was established. The main methodological feature is that indicators were evaluated using spatial units consistent with their physical meanings, monitoring characteristics, and available data. Reach-based indicators were calculated separately for the upper, middle, and lower reaches, whereas ecological-flow and water-quality-related indicators were evaluated using hydrological control sections and water function zones, respectively, and then linked to the corresponding reaches for aggregation. Fish retention, public satisfaction, water supply reliability, and drinking-water-source compliance were also calculated separately for the three reaches using reach-specific data. A composite weighting method integrating a guideline-based least-squares weighting component and an entropy-based objective weighting component was used to aggregate the indicator scores. The Yarkant River obtained an overall River Health Index (RHI) of 84.24, corresponding to the “healthy” category under the adopted classification scheme. The upper, middle, and lower reaches scored 83.23, 87.03, and 83.32, respectively. However, the Biota criterion scored only 68.00, substantially lower than the Water (88.47) and Socio-economic service (90.41) criteria. This contrast indicates that the composite RHI should not be interpreted as evidence of uniformly good ecological integrity, particularly because the biological assessment is represented by a single fish-based indicator. The results highlight the value of retaining indicator-specific spatial information and interpreting the composite RHI together with its individual ecological and functional dimensions.
1. Introduction
River health assessment provides an important basis for characterizing river condition and supporting watershed management and ecosystem conservation [1]. Depending on the assessment objective, river health may refer narrowly to ecological integrity or more broadly to the integrated condition of a river system. In this study, river health is used in the latter sense and encompasses basin structure, water conditions, aquatic biota, and socio-economic service functions. The inclusion of socio-economic services does not imply that human-use performance is equivalent to ecological health; rather, it reflects the dual role of highly regulated arid rivers in sustaining ecological processes and essential water-resource services. Accordingly, the ecological and socio-economic dimensions are evaluated separately before being aggregated into the composite RHI so that a high service-function score does not obscure weaknesses in biological integrity [2,3,4,5,6].
River health assessment is particularly challenging in arid regions. Under the combined effects of climate change and intensive human activities, water scarcity, altered hydrological regimes, and ecological degradation have become major pressures on river ecosystems [7,8,9]. Seasonal rivers in these regions are commonly dominated by glacier and snowmelt recharge and exhibit pronounced intra-annual variations in runoff [10]. Consequently, river ecological conditions can differ substantially between flood and non-flood periods. At the same time, the longitudinal gradient from mountainous headwaters to irrigated oases and downstream desert environments creates strong spatial differences in hydrological conditions, river morphology, ecological functions, and anthropogenic pressures. These characteristics make spatially explicit river health assessment particularly important for arid seasonal rivers [7,11,12,13].
A variety of approaches have been developed for river health assessment. Early approaches commonly focused on individual components, such as hydrological conditions, water quality, or biological communities [14,15]. More recent studies have increasingly adopted multi-indicator assessment systems that integrate hydrology and water resources [12,16], water environment [17], aquatic ecology [18], and socio-economic service functions [19]. The development of composite assessment methods and weighting techniques has further enabled different indicators to be integrated into a single quantitative index [20]. In addition, remote sensing and multi-source environmental data have improved the spatial representation of river conditions and provided new opportunities for refined environmental assessment [21,22].
Despite these advances, two methodological limitations remain particularly important for large arid seasonal river basins. First, assessments based primarily on annual or basin-wide averages may smooth pronounced seasonal variations and underrepresent ecological stress during low-flow periods [23,24,25]. Second, spatially explicit assessment does not necessarily resolve scale mismatch among indicators. Different components of river health are observed or managed using different spatial units: channel and riparian conditions are reach-specific, ecological-flow performance is linked to hydrological control sections, and water-quality management is organized by water function zones. Applying a single spatial unit to all indicators can therefore introduce scale mismatch and obscure localized constraints [4,26,27]. The methodological gap addressed here is not merely to map river-health scores spatially but to match indicator calculation and aggregation to spatial units that are consistent with their physical meanings and data support.
The Yarkant River Basin in southwestern Xinjiang provides a representative setting for addressing this challenge. The basin extends from high-altitude mountainous areas through intensively irrigated oasis regions to an ecologically fragile desert environment. Its runoff is strongly dependent on glacier and snowmelt, and most annual discharge occurs during the flood season. Meanwhile, large-scale water diversion and hydraulic engineering have substantially modified the natural flow regime and river connectivity. Consequently, hydrological conditions, water environmental status, aquatic ecological conditions, and socio-economic functions vary considerably among different river reaches. A basin-wide assessment based on a single spatial unit may therefore fail to adequately represent these differences. These characteristics mean that both the magnitude and the spatial expression of river-health constraints depend on where and at what management unit an indicator is evaluated, providing a direct rationale for the spatially differentiated assessment adopted in this study.
To address this scale-matching problem, this study develops a spatially differentiated river health assessment framework for the Yarkant River Basin. The framework integrates four criteria—basin structure, water conditions, aquatic biota, and socio-economic services—and 12 indicators. Its central feature is that indicators are not forced into a common spatial unit. Reach-based indicators are calculated separately for the upper, middle, and lower reaches; ecological flow is evaluated at hydrological control sections; water-quality-related indicators are evaluated by water function zones; and the resulting indicator information is linked to the corresponding reaches before hierarchical aggregation. Accordingly, this study aims to: (1) quantify criterion-level and composite RHI values for the overall river and the upper, middle, and lower reaches; (2) identify the dimensions and indicators responsible for spatial differences and for the contrast between the composite RHI and biological condition; and (3) evaluate the diagnostic applicability of matching indicators to spatial units consistent with their physical meanings and data characteristics. The framework is demonstrated for the Yarkant River, while its transferability to other arid seasonal rivers requires further validation.
2. Materials and Methods
2.1. Study Area
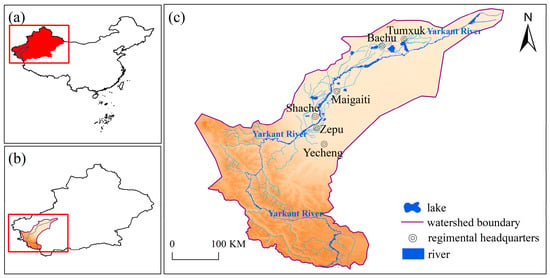
The Yarkant River is located in southwestern Xinjiang, China, and originates from the Karakoram Mountains. It flows from southwest to northeast through Yecheng, Tashkurgan, Shache, Maigaiti, and Bachu, and ultimately discharges into the Tarim River, serving as one of its major tributaries (Figure 1). The Yarkant River Basin, located in southwestern Xinjiang, China, covers approximately 85,800 km2 and has a main-stem length of approximately 1281 km. The basin has a typical arid continental climate characterized by scarce precipitation, strong evaporation, and pronounced spatial and seasonal variability. Annual precipitation is generally below 100 mm in the low-elevation areas but increases substantially toward the high-mountain headwaters. Runoff is predominantly supplied by glacier and snowmelt and is strongly seasonal, with approximately 79–80% of the annual runoff occurring from June to September. At the Kaqun hydrological station, long-term mean annual runoff is approximately 6.6–6.9 × 10⁹ m3. Downstream of the mountain outlet, the river flows through an extensive oasis irrigation region, and the Yarkant River Irrigation District has a design irrigation area of approximately 5.58 million mu (about 3720 km2). Consequently, the river exhibits a pronounced longitudinal transition from a relatively natural mountainous headwater system to an intensively regulated oasis reach and, further downstream, to a desert river system strongly influenced by upstream water allocation and ecological releases.
Figure 1.
Study area. Location and general geographical characteristics of the Yarkant River Basin. (a) Location of Xinjiang in China; (b) location of the Yarkant River Basin in Xinjiang; and (c) basin boundary and main river network of the Yarkant River Basin. The red boxes in (a) and (b) indicate the locations of the regions enlarged in (b) and (c), respectively.
The basin shows pronounced spatial heterogeneity under the combined influence of natural conditions and human activities. The upstream region is dominated by high-altitude mountainous terrain with strong water conservation capacity. The midstream region represents the core oasis irrigation zone with intensive human activities and high water resource utilization. The downstream region, adjacent to the Taklimakan Desert, is ecologically fragile and highly sensitive to changes in water availability. Large-scale hydraulic engineering and irrigation development have significantly altered the natural flow regime and river connectivity, thereby affecting hydrological conditions and aquatic ecosystems. Although the overall water quality remains at Class II, several issues persist, including reduced bank stability, biodiversity decline, obstruction of fish migration, discontinuities in flood control systems, and mismatches between water supply and demand. These problems exhibit clear spatial variability among river reaches.
Given these characteristics, the Yarkant River represents a typical seasonal river in arid regions with significant anthropogenic disturbance. Its “mountain–oasis–desert” continuum leads to substantial differences in hydrological processes, ecological functions, and human impacts across river reaches, making it an ideal case for developing a segmented and zonal river health assessment framework.
2.2. River Segmentation
According to the Technical Guidelines for River and Lake Health Assessment in Xinjiang (Trial) and considering geomorphological, hydrological, and anthropogenic factors, the main stem of the Yarkant River was divided into three representative reaches:
- (1)
- Upstream perennial mountainous reach (source–Kaqun headworks):
Length: ~564 km. Located in the alpine runoff generation zone, with flow mainly derived from glacier and snowmelt. The river remains in near-natural condition with negligible flow interruption. The channel is narrow with a steep gradient and strong hydrodynamic conditions, and is minimally affected by human activities.
- (2)
- Midstream seasonal irrigation reach (Kaqun headworks–Ailiketamu headworks):
Length: ~332 km. This reach is the most intensively developed irrigation area. Large-scale water diversion significantly alters the flow regime, and flow interruption frequently occurs during the non-flood season. The channel exhibits dynamic equilibrium between erosion and deposition, with strong lateral erosion and intensive anthropogenic disturbance.
- (3)
- Downstream ecological reach (Ailiketamu headworks–river outlet):
Length: ~385 km. This reach primarily functions to deliver ecological water downstream. Located in a desert region, its flow is highly dependent on upstream inflow and regulation, resulting in unstable hydrological conditions. Riparian vegetation is dominated by desert species such as Populus euphratica, and the ecosystem is highly sensitive to water availability.
The three-reach segmentation was not based solely on geographic position. Boundaries were selected where major changes in geomorphology, hydrological regime, regulation intensity, land use, and ecological function coincide. The upstream reach is characterized by high elevation, steep channel gradients, glacier- and snowmelt-dominated runoff, and relatively limited direct water abstraction. The middle reach corresponds to the principal oasis-irrigation corridor, where diversion intensity and flow regulation are greatest and seasonal flow interruption is most evident. The downstream reach is located in the desert environment and is strongly dependent on regulated upstream releases for ecological water delivery. The boundaries and lengths of the three reaches are summarized in Table 1.
Table 1.
River segmentation of the Yarkant River.
2.3. Field Survey and Data Collection
Monitoring sites were selected based on a combination of representativeness and randomness, while considering spatial heterogeneity across the basin and the requirements of subsequent assessment. A stratified sampling design was adopted for different survey components. Field investigations were conducted from March to June 2023, while water-quality information was obtained from routine monitoring records for 2023.
Riparian condition monitoring was conducted in accordance with the Technical Guidelines for River and Lake Health Assessment in Xinjiang (Trial). Key factors, including bank slope, bank height, vegetation coverage, bank-protection type, and bank erosion conditions, were considered to identify representative river sections within each sub-region. Within each selected survey zone, multiple cross-sections were established to characterize variations in bank morphology and stability.
Water-quality information was obtained from the existing national- and provincial-level monitoring network to ensure data continuity, consistency, and reliability. Monitoring sections were selected according to the Water Function Zoning of the Xinjiang Uygur Autonomous Region. In accordance with the Technical Guidelines for River and Lake Health Assessment in Xinjiang (Trial), routine water-quality monitoring covered the assessment year at a monthly frequency. Accordingly, monthly monitoring data for 2023 were collected and compiled for the present study.
Fish surveys were conducted at representative sites along different river reaches using a combination of field sampling, fishery-catch investigation, market surveys, and interviews with local fishers and fisheries management authorities. Collected fish were identified to species level, and basic biological characteristics, including body length and weight, were recorded. Scale samples were collected where necessary for age determination, and selected specimens were examined for sex, gonadal maturity, and feeding characteristics. Specimens and biological samples requiring further examination were preserved using appropriate fixatives. Information obtained from field sampling, fishery catches, market surveys, and interviews was compiled to characterize fish species composition and the current status of fish resources.
A questionnaire survey was also conducted from March to June 2023 to investigate public perceptions of river-related conditions, including the water environment, water resources, water safety, and water landscape. The survey combined on-site questionnaires with an online WeChat-based questionnaire. Respondents included river-management personnel, local residents, tourists, and researchers or technical personnel engaged in river- and lake-related work. A total of 106 questionnaires were distributed, and all 106 completed questionnaires were returned.
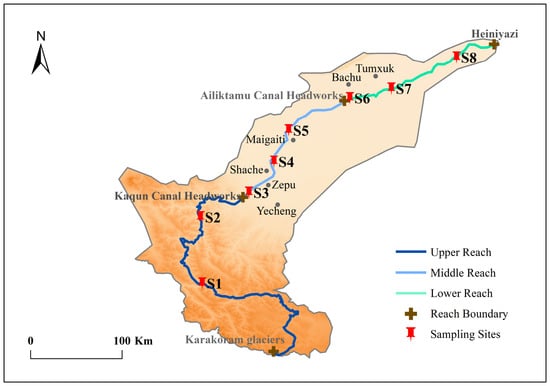
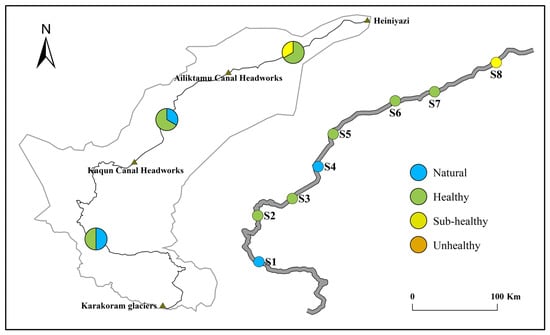
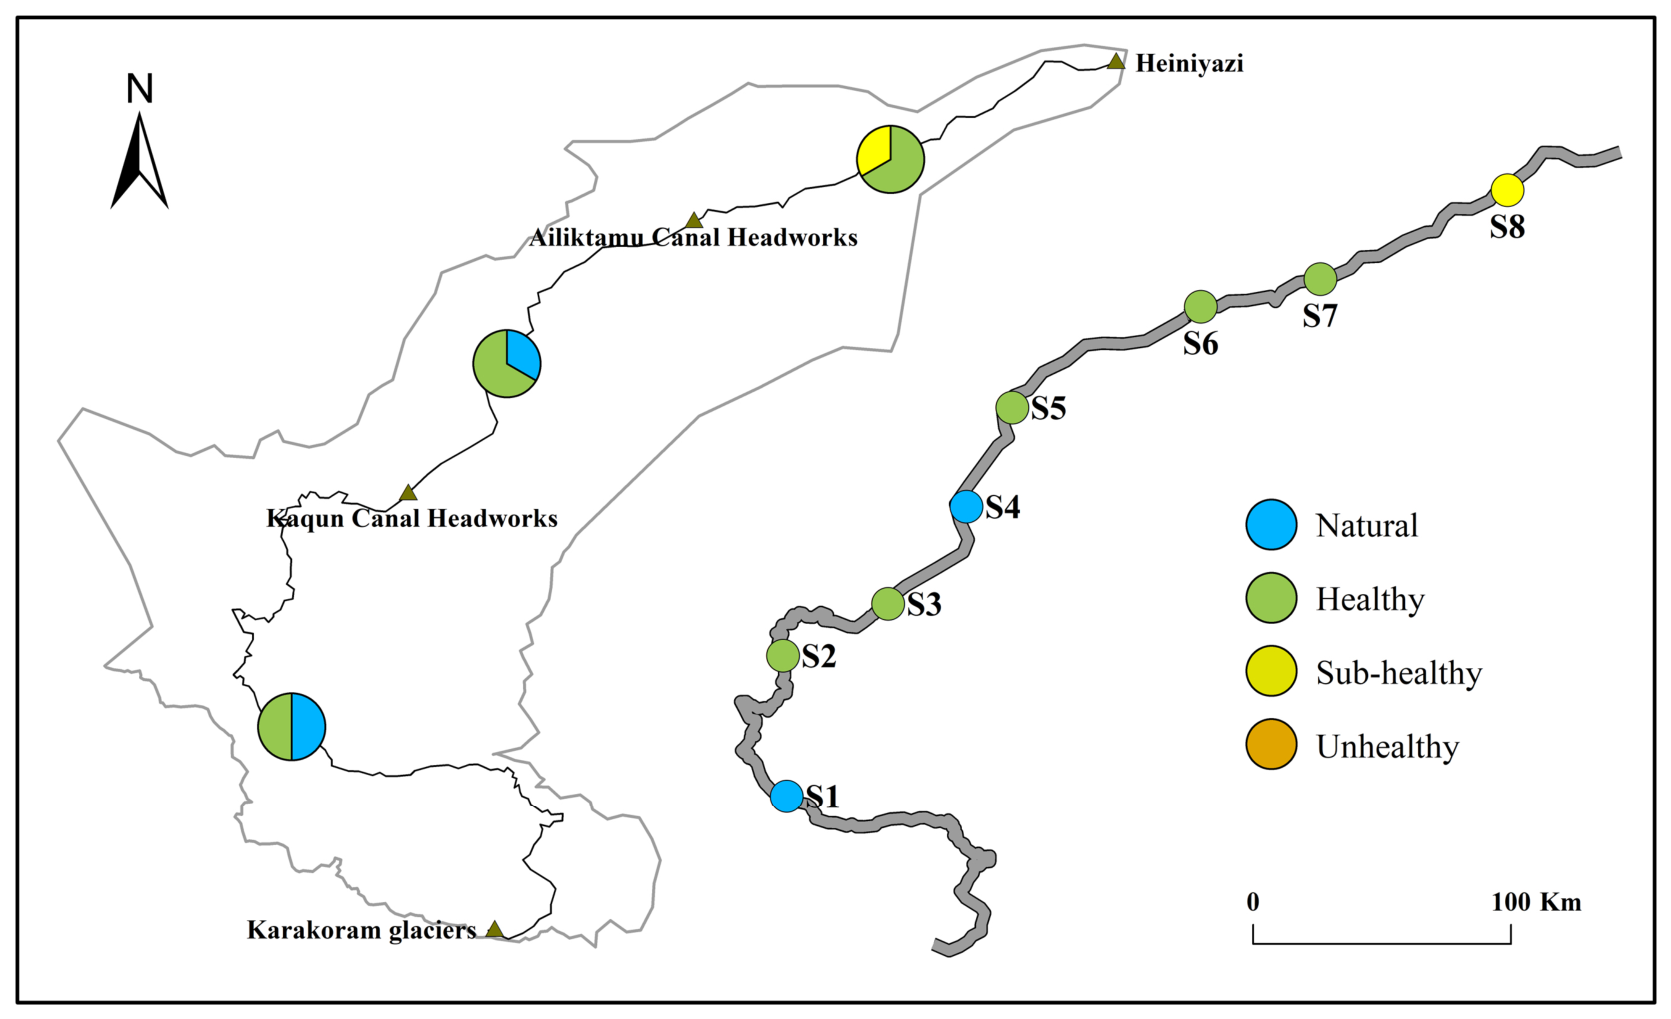
Overall, the monitoring network was designed to highlight the key characteristics of different river reaches while ensuring the feasibility and consistency of data acquisition. In total, eight representative survey zones (approximately 1 km in length each) were established across the upstream, middle, and downstream reaches. Within each zone, three cross-sections were arranged at intervals of approximately 200–300 m. The spatial distribution of the survey zones and sampling locations is shown in Figure 2.
Figure 2.
River Segmentation and Sampling Locations in the Yarkant River.
2.4. Assessment Framework
2.4.1. Indicator System
Following the Technical Guidelines for River and Lake Health Assessment in Xinjiang (Trial) and considering the hydrological characteristics and seasonal flow intermittency of the Yarkant River, a hierarchical river health assessment framework was established. The framework consists of four criterion layers: basin structure (“Basin”), water system (“Water”), aquatic biota (“Biota”), and socio-economic service functions (“Socio-economic”) (Table 2).
Table 2.
River Health Assessment Indicator System for the Yarkant River.
Indicator selection followed four main principles: (1) relevance to the integrated definition of river health adopted in this study; (2) representativeness of the major structural, water-related, biological, and socio-economic functions of the river; (3) consistency with the Technical Guidelines for River and Lake Health Assessment in Xinjiang (Trial); and (4) availability and comparability of data across assessment units. Data availability was treated as a core selection principle because indicators could only be incorporated into the quantitative assessment when sufficiently consistent spatial and temporal information was available for the study period. Accordingly, the final indicator set was designed to balance conceptual relevance with practical measurability. For example, fish retention was selected as the biological indicator because comparable observations of other biological groups were unavailable, while lateral floodplain connectivity and detailed channel-morphology characteristics were not included as independent quantitative indicators because consistent observations were unavailable across the study area.
The “Basin” criterion reflects river morphological characteristics and the degree of anthropogenic disturbance, including three indicators: longitudinal connectivity index (T1), riparian natural condition (T2), and shoreline utilization compliance (T3). The “Water” criterion characterizes water resources and water environmental conditions, including ecological flow satisfaction (T4), water quality status (T5), and dissolved oxygen condition (T6). The “Biota” criterion characterizes fish-community condition using the fish retention index (T7). Because no comparable multi-taxon biological dataset was available for the assessment period, this criterion should not be interpreted as a comprehensive measure of aquatic ecological integrity. The “Socio-economic” criterion reflects human service functions and management effectiveness, including public satisfaction (T8), flood control compliance rate (T9), water supply reliability (T10), compliance rate of centralized drinking water sources (T11), and shoreline utilization management index (T12).
T1 was calculated from the density of dams, sluices, diversion headworks, and other cross-channel structures per 100 km of river length. Accordingly, T1 is interpreted in the present study as a proxy for longitudinal fragmentation pressure rather than a comprehensive measure of river connectivity. In particular, lateral connectivity between the main channel and floodplain is not explicitly represented by this indicator.
Although T3 and T12 both concern shoreline management, they represent different aspects. T3 reflects shoreline utilization compliance as a pressure-related indicator. In this study, the standardized construction rate of river/lake sewage outlets was used as a proxy for T3 because consistent data on other forms of unauthorized shoreline development and utilization were not available across all three reaches. In contrast, T12 evaluates the overall implementation of shoreline utilization and protection management. Likewise, T5 characterizes ambient river-water quality within water function zones, whereas T11 measures compliance of designated drinking-water sources and therefore reflects a specific water-supply service and regulatory requirement. These indicators were retained separately because their assessment objects and management implications differ.
The current T4 formulation evaluates ecological-flow performance primarily in terms of compliance frequency. The magnitude of flow deficit on non-compliant days is not explicitly incorporated because consistent daily deficit data were not available for all ecological-flow control sections during the assessment period. T4 should therefore be interpreted as an ecological-flow compliance indicator rather than a complete characterization of the severity of ecological-flow deficits.
The number of indicators differs among the four criteria because indicator selection was constrained by the availability and comparability of monitoring data during the assessment period. In particular, the Biota criterion is represented by a single fish-based indicator (T7), because spatially and temporally consistent observations of other biological groups were not available for the study period. Therefore, T7 should be interpreted as an indicator of fish-community condition rather than as a comprehensive representation of aquatic ecological integrity.
T10 characterizes water-supply reliability using the fulfillment information available under the existing assessment dataset and guideline. It does not explicitly quantify the volumetric magnitude of unmet irrigation demand because spatially consistent records of irrigation demand and actual supply volumes were not available for all irrigation units during the assessment period. Therefore, T10 reflects supply reliability rather than the complete magnitude of irrigation-water shortage.
The current indicator system includes selected structural and riparian attributes but does not constitute a comprehensive hydromorphological assessment. In particular, lateral floodplain connectivity, inundation dynamics, and detailed channel-morphology characteristics are not explicitly quantified because consistent observations were unavailable across the study area.
Overall, the proposed framework comprises four criterion layers and twelve indicators, forming a multi-dimensional and integrated river health assessment system.
2.4.2. Indicator Calculation Methods
The calculation of each indicator follows the principles of standardization and operability, integrating statistical analysis, remote sensing interpretation, and field investigation. The specific formulations are described as follows (Table 3).
Table 3.
Indicator definitions and calculation methods.
2.4.3. Indicator Weight Determination
To reduce the potential bias associated with a single weighting method, a composite weighting model integrating a least-squares-based weighting method and an entropy-based objective weighting method was established [28,29,30]. The indicator importance relationships used in the least-squares weighting method were derived from the Technical Guidelines for River and Lake Health Assessment in Xinjiang (Trial), rather than from an additional expert-scoring procedure. The entropy-based method, in contrast, determines weights according to the information contained in the standardized indicator data.
A compromise coefficient β (0 ≤ β ≤ 1) was introduced to balance the contributions of the two weighting methods. Based on the guideline-based decision matrix F = (fij) and the entropy-based decision matrix C = (cij), the integrated decision matrix Q = (qij) is constructed as:
The composite weighting model is then formulated as the following quadratic optimization problem:
where is the weight vector to be determined, and e is an n-dimensional vector with all elements equal to 1.
By solving the above optimization problem, the final weights can be obtained as:
In the present assessment, the compromise coefficient β was set to 0.5, thereby assigning equal importance to the guideline-based and entropy-based weighting components. This value was adopted as a neutral compromise because there was no sufficient basis for preferentially emphasizing either weighting component. The derived weights were subsequently used in the hierarchical aggregation of indicator scores to calculate criterion-level scores and reach-level RHI values.
2.5. Assessment Method
2.5.1. Spatially Differentiated Indicator Calculation
Considering the pronounced seasonality and spatial heterogeneity of the Yarkant River, a spatially differentiated evaluation strategy was adopted. Rather than applying a single spatial unit uniformly to all indicators, each indicator was calculated using a spatial unit consistent with its physical meaning, monitoring characteristics, and available data. The spatial scheme for indicator calculation is summarized in Table 4.
Table 4.
Spatial Units Used for Indicator Calculation in the Yarkant River.
- (1)
- Indicators related to river morphology and anthropogenic disturbance, including longitudinal connectivity (T1), riparian condition (T2), Shoreline utilization compliance (T3), flood control compliance (T9), and shoreline management (T12), were calculated separately for the upper, middle, and lower reaches.
- (2)
- Ecological flow satisfaction (T4) was evaluated at the corresponding hydrological control sections to characterize temporal compliance with ecological flow requirements. The resulting information was linked to the corresponding river reaches for reach-level assessment.
- (3)
- Water quality status (T5) and dissolved oxygen condition (T6) were evaluated according to the corresponding water function zones, consistent with the spatial organization of regional water-quality monitoring and management. The resulting scores were linked to the corresponding river reaches for subsequent aggregation.
- (4)
- Fish retention (T7), public satisfaction (T8), water supply reliability (T10), and drinking water source compliance (T11) were calculated separately for the upper, middle, and lower reaches using the data corresponding to each reach, rather than assigning a single basin-wide score uniformly to all three reaches.
Thus, the spatial unit used for indicator calculation varied according to the characteristics and data support of each indicator, while reach-level indicator scores were ultimately obtained for the upper, middle, and lower reaches for subsequent RHI aggregation. This approach was designed to reduce spatial scale mismatch among indicators and preserve reach-specific information during aggregation.
2.5.2. Indicator Scoring and Classification Criteria
To ensure comparability among indicators with different units and magnitudes, all indicators were converted into a dimensionless scoring system ranging from 0 to 100 based on predefined grading criteria. The river health status was classified into five categories (Table 5).
Table 5.
River health classification standard.
The scoring criteria for each indicator were established based on national technical guidelines and domain-specific standards (Table 6).
Table 6.
Indicator scoring criteria.
The grading thresholds and scoring criteria presented in Table 5 and Table 6 were adopted from the Technical Guidelines for River and Lake Health Assessment in Xinjiang (Trial). Depending on the form of the original scoring criteria specified in the Guidelines, two scoring approaches were applied. For indicators defined by discrete categories, the corresponding score specified for each category was assigned directly. For indicators defined by continuous threshold intervals, scores between adjacent grading thresholds were calculated by linear interpolation. Therefore, linear interpolation was applied only to indicators with continuous scoring criteria, rather than uniformly to all indicators.
2.5.3. Aggregation of River Health Index
The River Health Index (RHI) was calculated using a hierarchical weighted aggregation procedure that integrates spatially differentiated indicator scores, indicator-level weights, and criterion-level weights. The procedure consisted of four steps.
- (1)
- Spatial aggregation of indicator scores
For indicators calculated from multiple monitoring sections or spatial units within the same evaluation reach, the indicator scores were aggregated using the corresponding spatial weighting scheme to obtain a representative score for each reach.
- (2)
- Criterion-level aggregation:
For each evaluation reach, indicators belonging to the same criterion were aggregated using their respective indicator weights. The score of the j-th criterion for the i-th reach was calculated as:
where Cij is the score of the j-th criterion for the i-th reach; Sijk is the standardized score of the k-th indicator within the j-th criterion; ωik is the corresponding indicator weight; and is the number of indicators included in the j-th criterion.
- (3)
- Reach-level RHI
The RHI of each evaluation reach was then calculated by aggregating the criterion-level scores using the corresponding criterion weights:
where RHIi is the RHI of the j-th evaluation reach; Cij is the score of the j-th criterion for the i-th reach; Wj is the weight of the j-th criterion; and m is the total number of criteria.
- (4)
- Basin-scale evaluation:
Finally, the basin-level RHI was calculated using the length-weighted average of the evaluation reaches:
where RHIbasin is the overall river health index; RHIi is the health score of the i-th evaluation reach; Li is the length of the i-th reach (km); N is the total number of evaluation reaches.
River length was used as the primary basin-scale aggregation weight because the assessment targets the longitudinal main-stem condition and because consistent discharge-, habitat-area-, and population-based weights were not available for all three reaches. This choice should therefore be interpreted as a spatial representation of main-stem extent rather than as a measure of ecological importance.
3. Results
3.1. Indicator Weights
The weights of the river health assessment indicators are presented in Table 7. At the criterion level, the Basin and Biota criteria each received a weight of 0.20, whereas the Water and Socio-economic criteria each received a weight of 0.30 under the adopted composite weighting procedure.
Table 7.
Weights of Criteria and Indicators for River Health Assessment.
3.2. River Health Assessment
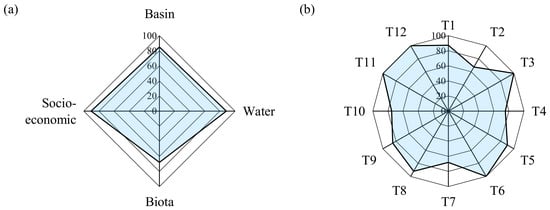
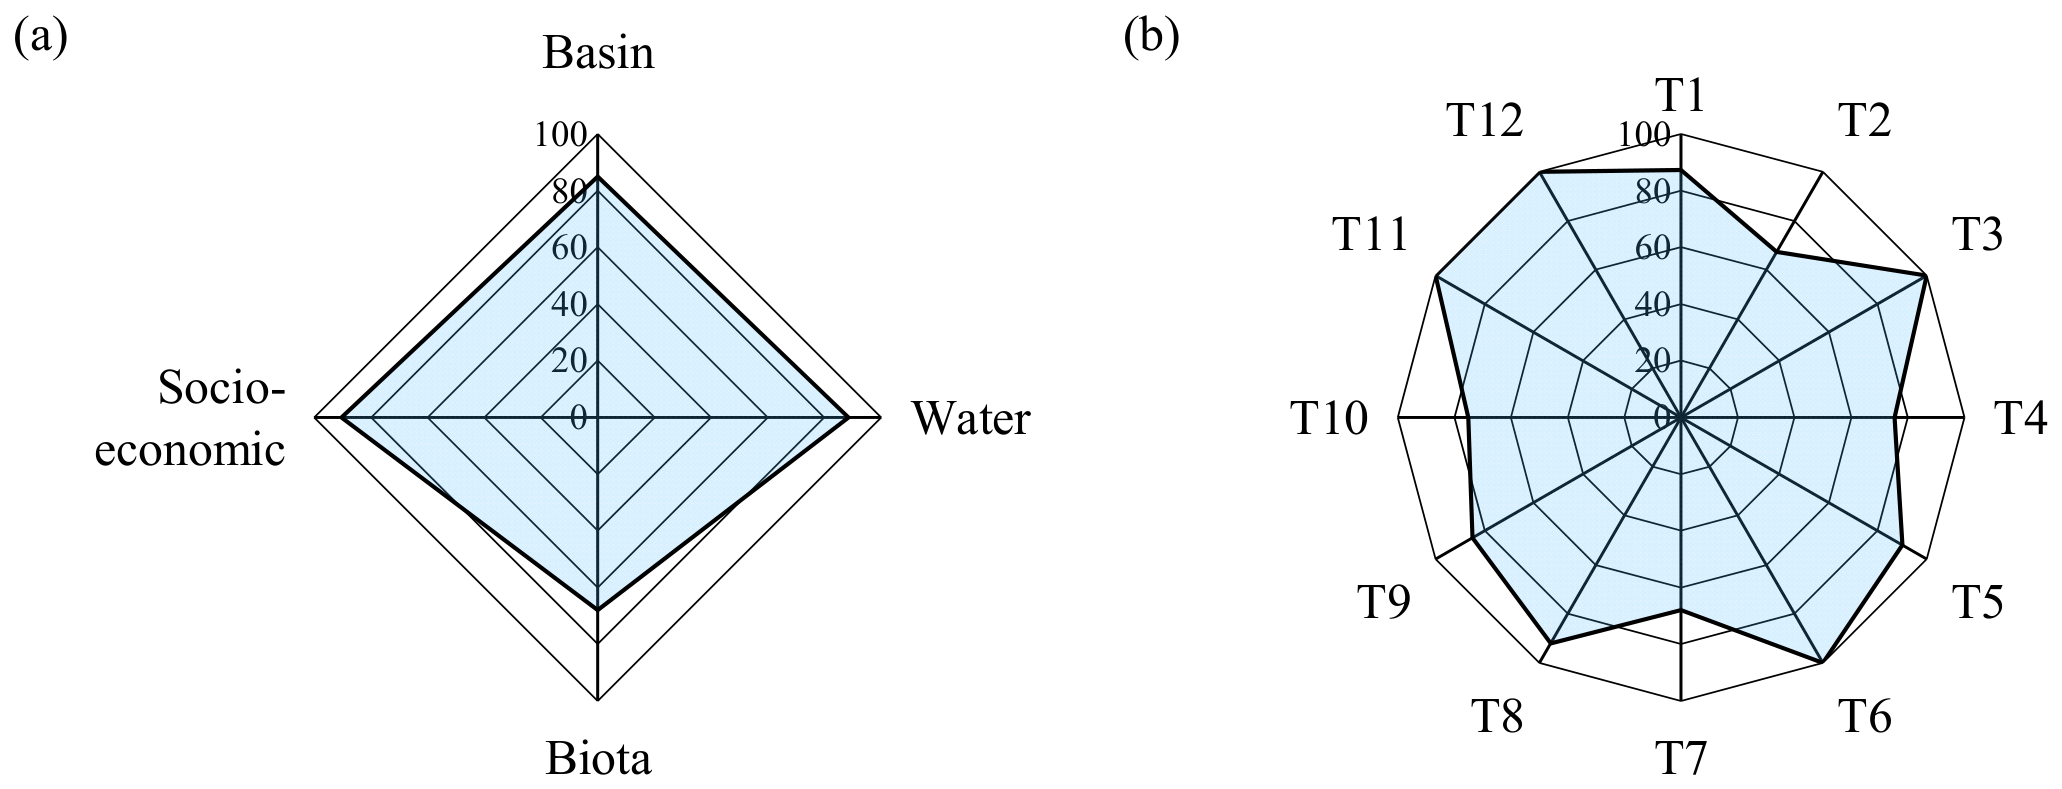
The overall river health assessment results are shown in Figure 3 and Figure 4. Under the adopted classification scheme, the composite RHI of the Yarkant River was 84.24, corresponding to Class II (“healthy”). This classification should be interpreted together with the criterion-level results rather than as evidence of uniformly good ecological condition. The Basin, Water, Biota, and Socio-economic criteria scored 84.89, 88.47, 68.00, and 90.41, respectively. In particular, the markedly lower Biota score indicates that biological integrity remains a major limitation despite the relatively high composite RHI.
Figure 3.
Overall River Health Assessment Results.
Figure 4.
Scores for the entire Yarkant River. (a) Criterion-level scores; (b) indicator-level scores (T1–T12). Scores are shown on a scale of 0–100; the corresponding numerical values are reported in the text.
These results indicate a structural imbalance among different functional dimensions, with strong performance in water and socio-economic functions but relatively weak ecological integrity.
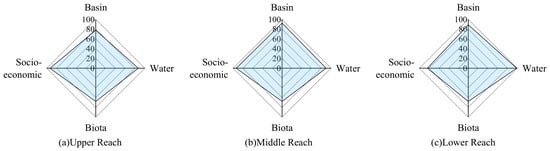
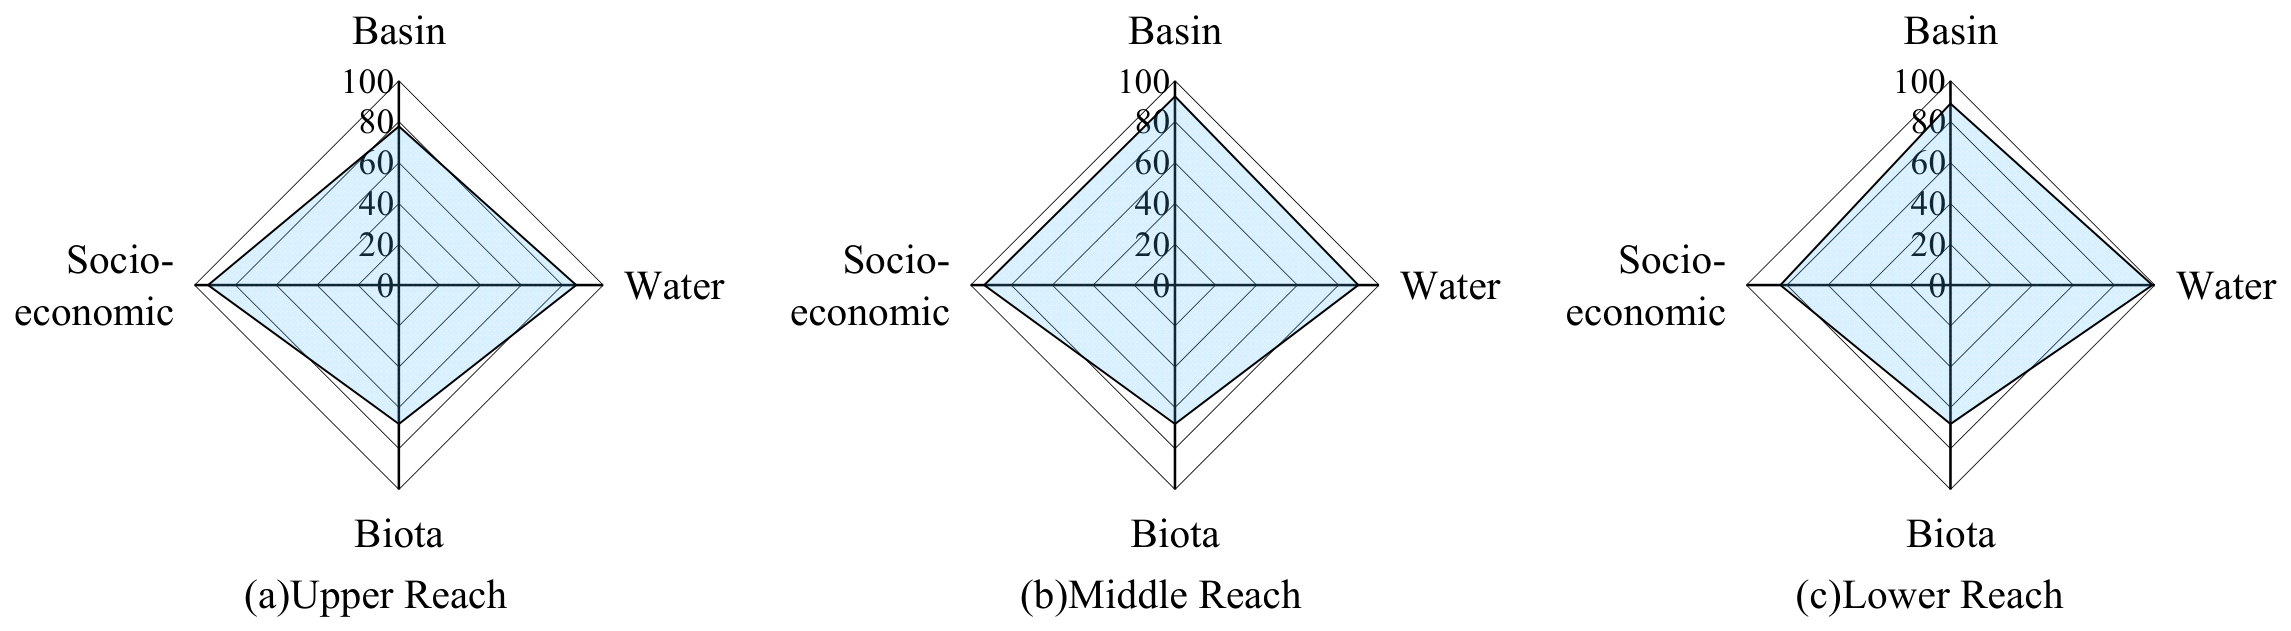
The assessment results for different river reaches are presented in Figure 5a. The scores for the basin, water, biota, and socio-economic service criteria were 77.71, 86.86, 68.00, and 93.42, respectively, yielding an overall reach score of 83.23. The evaluation results for the middle reach are shown in Figure 5b, where the scores for the basin, water, biota, and socio-economic service criteria were 92.45, 89.73, 68.00, and 93.42, respectively, resulting in an overall score of 87.03. The assessment results for the lower reach are presented in Figure 5c. The corresponding scores for the basin, water, biota, and socio-economic service criteria were 88.90, 89.73, 68.00, and 83.42, respectively, with a composite score of 83.32. According to the classification criteria specified in the Technical Guidelines for River and Lake Health Assessment in Xinjiang (Trial), all reaches of the Yarkant River are classified as “healthy”.
Figure 5.
Criterion-level scores for the three reaches of the Yarkant River: (a) upper reach; (b) middle reach; and (c) lower reach. Scores are shown on a scale of 0–100; the corresponding numerical values are reported in the text.
4. Discussion
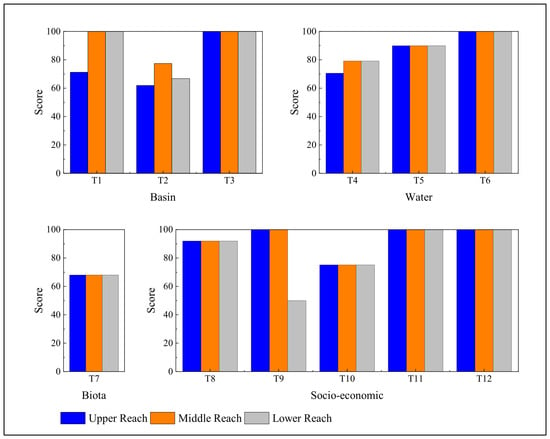
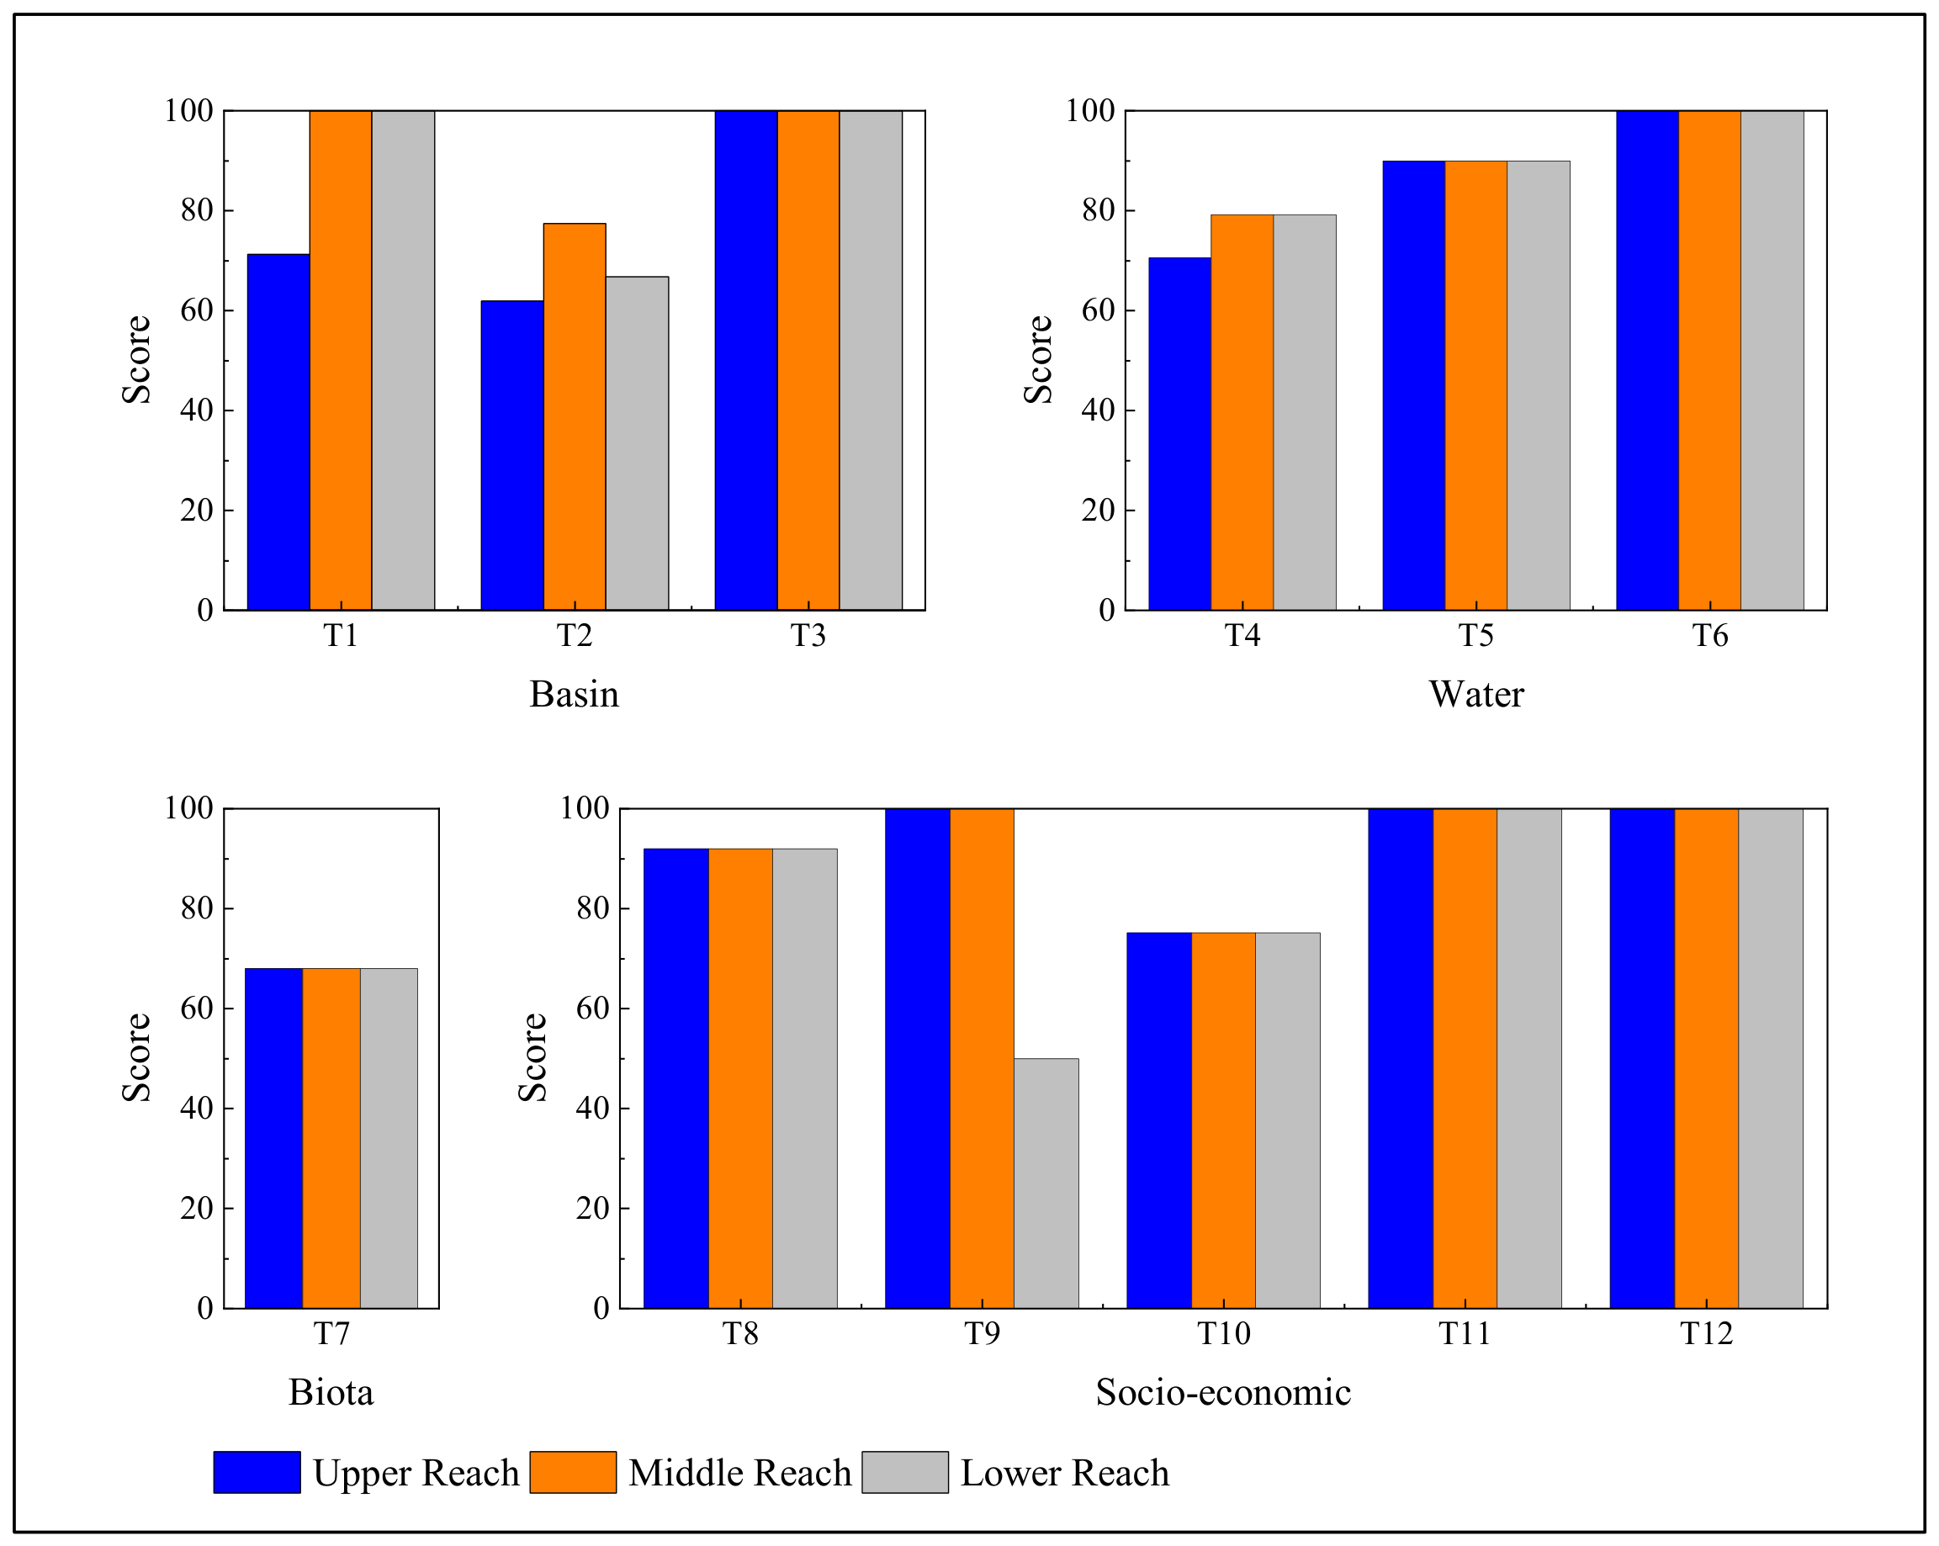
The indicator scores for different river reaches are presented in Figure 6.
Figure 6.
Indicator scores across different river reaches. T1, longitudinal connectivity; T2, riparian natural condition; T3, Shoreline utilization compliance; T4, ecological flow satisfaction; T5, water quality status; T6, dissolved oxygen condition; T7, fish retention index; T8, public satisfaction; T9, flood control compliance rate; T10, water supply reliability; T11, compliance rate of drinking water sources; T12, shoreline utilization management index.
Overall, the Yarkant River exhibits pronounced spatial heterogeneity and structural imbalance across the four functional dimensions—basin, water, biota, and socio-economic services. The reach-based and zonal assessment framework adopted in this study reveals these differences by assigning indicators to spatial units that correspond to their physical meanings and data characteristics. The varying responses of indicators among the upper, middle, and lower reaches reflect the inherent complexity of seasonal rivers under the combined influences of natural processes and human activities.
Basin function
The basin dimension, including longitudinal connectivity, riparian naturalness, and shoreline utilization compliance, shows clear spatial variability. The middle reach achieves the highest score (92.45), followed by the lower reach, while the upper reach records a relatively lower score (77.71). Notably, riparian naturalness performs better in the upper reach (71.20), whereas longitudinal connectivity and shoreline utilization show declining trends in the middle and lower reaches. This pattern is primarily attributed to intensified anthropogenic disturbances downstream. Hydraulic structures such as dams and sluices, together with shoreline development, have altered the natural channel morphology and reduced longitudinal connectivity. In addition, some reaches still rely on low-standard bank protection measures (e.g., brushwood and woven sandbags), which are prone to failure under flood scouring, thereby increasing bank erosion risks.
These findings indicate that reach-specific assessment is particularly important for identifying localized impacts of hydraulic infrastructure and shoreline development. Rather than treating the river as a homogeneous system, the segmented framework allows differences in connectivity and riparian condition to be explicitly represented, providing a more spatially informative basis for river health diagnosis and management.
Water function
The water dimension, comprising ecological flow satisfaction, water quality status, and dissolved oxygen condition, generally exhibits high scores across all reaches, with relatively small spatial differences. The middle and lower reaches show slightly higher overall scores than the upper reach, while ecological flow satisfaction in the lower reach is comparatively weaker (79.20), representing a key limiting factor. This is mainly associated with the pronounced seasonality of runoff in the Yarkant River and the strong dependence of downstream flows on upstream regulation. Although hydraulic regulation helps maintain water availability and water quality, it also alters the natural flow regime, particularly during the dry season.
Therefore, greater attention should be given to ecological flow regulation during low-flow periods, particularly in the downstream reach, to improve the balance between water resource utilization and ecological requirements.
Biota dimension
The biota dimension, represented solely by the fish retention index, shows consistently low values across all reaches (68.00), with minimal spatial variation. This indicates an overall deficiency in ecological integrity at the basin scale. Field observations suggest that fish communities are characterized by miniaturization and structural simplification. The relatively low fish-retention score may be associated with reduced longitudinal connectivity and altered flow conditions, but the present assessment does not directly quantify causal effects of individual hydraulic structures on fish populations. Cross-channel structures can potentially restrict fish movement and fragment habitats, while reduced dry-season discharge may alter hydraulic habitat availability. These mechanisms are therefore interpreted as plausible contributing factors rather than as demonstrated primary causes in the Yarkant River.
To mitigate these impacts, it is necessary to improve fish passage facilities, implement ecological restoration measures such as stock enhancement, and optimize flow regulation to improve downstream ecohydrological conditions.
A major limitation of the biological assessment is that the Biota criterion is represented by a single fish-based indicator. Consistent observations of other biological groups, such as benthic macroinvertebrates and aquatic vegetation, were not available for the assessment period and therefore could not be incorporated reliably into the present framework. Consequently, the Biota score should not be interpreted as a complete measure of aquatic ecological integrity. Future assessments should incorporate multiple biological groups and standardized multi-season monitoring to provide a more comprehensive characterization of biological condition.
Socio-economic service function
The socio-economic service dimension—including public satisfaction, flood control compliance, water supply reliability, drinking water source quality compliance, and shoreline management—generally performs well, with higher scores in the middle and lower reaches and relatively lower performance in the upper reach. Among these indicators, water supply reliability and flood control compliance are comparatively weaker, with average scores of 75.10 and 84.97, respectively. These limitations arise from two main factors. First, water supply efficiency is constrained by infrastructure conditions and insufficiently refined operational management; for example, actual flows in some conveyance channels are significantly lower than their design capacities. Second, flood control systems exhibit spatial discontinuities, particularly in the middle and lower reaches, where insufficient protection capacity, combined with strong channel migration, increases localized flood risks. In addition, shoreline management remains inadequate in certain sections.
The relatively high socio-economic scores, particularly in the middle reach, indicate that intensive water-resource development has effectively supported human-oriented functions. However, this apparent functional advantage should be interpreted together with the relatively low biotic score. The contrast suggests that improvements in water supply and flood-control services do not necessarily translate into corresponding improvements in ecological integrity.
Synthesis
Previous river-health studies have adopted different conceptual and methodological frameworks. Zhang et al. [16] developed an integrated assessment framework based on physical, chemical, and biological elements, emphasizing the ecological condition of river systems. For semi-arid basins, Yang et al. [9] further demonstrated the importance of adapting ecological-health assessment to regional environmental characteristics. More recently, Qi et al. [31] developed a seasonal-river health assessment system for arid and semi-arid regions, highlighting the need to consider the distinctive hydrological characteristics of seasonal rivers. Compared with these studies, the present study does not aim to propose a universal new indicator set; rather, its methodological emphasis is on matching indicator calculation to spatial units consistent with the physical meaning, monitoring characteristics, and data structure of each indicator. The Yarkant River results further show that a relatively high composite RHI can coexist with weaker biological condition, reinforcing the need to report criterion-level ecological information together with the overall RHI. Direct numerical comparison among these studies should nevertheless be made cautiously because their indicator composition, scoring criteria, weighting methods, and definitions of river health differ.
The contrast between the composite RHI (84.24) and the Biota score (68.00) is a central result of this assessment. It demonstrates that favorable water-condition and socio-economic service scores can compensate numerically for weaker biological integrity during aggregation. Therefore, the composite RHI should be interpreted as an integrated management-oriented index rather than as a surrogate for ecological integrity alone. For regulated arid rivers, reporting the composite RHI together with criterion-level ecological results is essential to avoid masking biological constraints.
Overall, although the Yarkant River is classified as “healthy”, significant imbalances exist among functional dimensions. The water and socio-economic service functions perform relatively well, whereas the biota dimension remains notably weak, and certain indicators within the basin dimension exhibit deficiencies. This structural imbalance reflects a broader pattern in which river management has improved resource utilization and engineering capacity but has not achieved corresponding improvements in ecological integrity. Fundamentally, this imbalance arises from the combined effects of hydrological seasonality and engineering regulation. Wet-season flows contribute to improved water conditions, while ecological stress during the dry season tends to be underestimated in annual assessments. Meanwhile, engineering measures that enhance water supply and flood control exert persistent impacts on river connectivity and habitat conditions.
Therefore, for seasonal rivers in arid regions, reach-based assessment and spatially differentiated indicator calculation are important for identifying spatially varying health conditions and supporting targeted river management.
Limitations and future improvements
Several limitations of the present assessment should be considered when interpreting the results. First, the Biota criterion is represented by a single fish-based indicator because spatially and temporally consistent observations of other biological groups were not available for the assessment period; the Biota score therefore does not provide a comprehensive measure of aquatic ecological integrity. Second, the current connectivity assessment primarily reflects longitudinal fragmentation pressure and does not explicitly quantify lateral channel–floodplain connectivity or broader hydromorphological processes. Third, the ecological-flow indicator emphasizes compliance frequency but does not incorporate the magnitude of flow deficits on non-compliant days, while the water-supply reliability indicator does not explicitly quantify volumetric irrigation-water shortages. Fourth, the adopted three-reach segmentation and the use of reach length for basin-scale aggregation introduce spatial-aggregation uncertainty; alternative segmentation schemes or alternative aggregation weights could yield different reach- or basin-level RHI values. Fifth, directly comparable long-term daily discharge series were not available for all three reaches, limiting detailed cross-reach comparison of flow-duration characteristics. Finally, although a compromise coefficient of β = 0.5 was adopted to balance the guideline-based and entropy-based weighting components, sensitivity to alternative β values was not systematically evaluated.
From a hydromorphological perspective, the present framework nevertheless captures selected structural attributes through T1 (longitudinal connectivity) and T2 (riparian natural condition). These indicators provide information on longitudinal fragmentation pressure and riparian condition, but they do not characterize the full hydromorphological state of the river. In particular, the Basin scores obtained in this study should not be interpreted as evidence that lateral channel–floodplain connectivity, inundation dynamics, channel morphology, and habitat diversity are in a similarly favorable condition. This distinction is particularly relevant to the Yarkant River, where water diversion, flow regulation, and pronounced hydrological seasonality may affect longitudinal connectivity, riparian conditions, and floodplain processes through different pathways. Therefore, the present framework provides only a partial representation of the hydromorphological conditions relevant to aquatic habitat and biodiversity.
Future applications should therefore extend the present framework in several directions. Lateral connectivity between river channels and floodplains should be incorporated when reliable spatial and temporal data become available, together with more comprehensive hydromorphological indicators describing channel morphology, floodplain connectivity, and habitat diversity. Ecological-flow assessment could also be strengthened by combining compliance frequency with drought duration and flow-deficit magnitude to better characterize hydrological stress in seasonal rivers. In addition, long-term continuous discharge observations and flow-duration analysis would allow a more detailed and comparable characterization of hydrological regimes among river reaches. Future assessments should also incorporate multi-taxon biological monitoring, volumetric water-shortage information, and explicit sensitivity analyses of segmentation, aggregation, and weighting choices.
5. Conclusions
This study developed and applied a spatially differentiated river-health assessment framework to the Yarkant River Basin. The methodological contribution lies in matching indicator calculation and aggregation to spatial units according to their physical meanings and available data, rather than forcing all indicators into a single uniform spatial unit.
Under the adopted classification scheme, the composite RHI of the Yarkant River was 84.24, and the upper, middle, and lower reaches scored 83.23, 87.03, and 83.32, respectively. However, the Biota criterion scored only 68.00, substantially below the Water and Socio-economic criteria. The composite “healthy” classification should therefore not be interpreted as evidence of uniformly good ecological integrity. Instead, the results reveal a functional imbalance in which relatively strong water-condition and human-service performance coexist with weaker biological condition.
The reach-level assessment identified spatial differences in basin-structure and socio-economic performance and highlighted ecological-flow constraints in the downstream reach. These findings illustrate the diagnostic value of retaining indicator-specific spatial information for the Yarkant River. The framework has been demonstrated in one arid seasonal basin, and its transferability to other river systems requires further testing.
Several limitations should be acknowledged. The biological assessment relies on a single fish-based indicator; lateral connectivity and broader hydromorphological processes are not explicitly represented; and the available data do not support consistent quantification of ecological-flow deficit magnitude or volumetric irrigation-water shortages across all assessment units. In addition, uncertainty remains in reach segmentation, spatial aggregation, and weighting, and the assessment is based largely on a limited temporal window. Future studies should incorporate multi-season and long-term monitoring, multiple biological groups, hydromorphological and lateral-connectivity indicators, more detailed hydrological and water-use information, and explicit sensitivity analyses to further evaluate and improve the framework.
Author Contributions
Conceptualization, Y.S. and L.G.; methodology, Y.S.; formal analysis, Y.S. and Y.L.; investigation, Y.S.; data curation, Y.L.; writing—original draft preparation, Y.S.; writing—review and editing, L.L.; visualization, Y.S.; supervision, L.G. All authors have read and agreed to the published version of the manuscript.
Funding
This work was supported by the Special Fund of the Chinese Central Government for Basic Scientific Research Operations in Commonweal Research Institutes (Grant No. Y125017) and the National Key Research and Development Program of China (Grant No. 2022YFC3202605).
Institutional Review Board Statement
Fish sampling was conducted under the sampling authorization of the research project. The questionnaire survey was anonymous and involved only non-sensitive questions. Participation was voluntary, and oral informed consent was obtained from all respondents prior to the survey. According to the applicable institutional requirements, this anonymous and non-sensitive satisfaction survey was exempt from formal ethics review.
Informed Consent Statement
Informed consent was obtained from all subjects involved in the study.
Data Availability Statement
The data supporting the findings of this study are available from the corresponding author upon reasonable request, subject to approval by the relevant data management authorities. Some data are not publicly available due to institutional data-sharing restrictions and privacy considerations.
Conflicts of Interest
The authors declare no conflicts of interest.
References
- Miao, L.; Zhou, H.; Adyel, T.M.; Chen, Y.; Kong, M.; You, G.; Wu, J.; Hou, J. Assessment of riverine water ecological health from multi-indicator and land use perspectives. Process Saf. Environ. Prot. 2025, 199, 107341. [Google Scholar] [CrossRef] [Scilit]
- Sadat, M.A.; Guan, Y.; Zhang, D.; Shao, G.; Cheng, X.; Yang, Y. The associations between river health and water resources management lead to the assessment of river state. Ecol. Indic. 2020, 109, 105814. [Google Scholar] [CrossRef] [Scilit]
- Gao, X.; Liu, Y.; Tang, C.; Lu, M.; Zou, J.; Li, Z. Evaluating river health through respirogram metrics: Insights from the Weihe River basin, China. Sci. Total Environ. 2024, 919, 170805. [Google Scholar] [CrossRef] [Scilit] [PubMed]
- Acuña, V.; Datry, T.; Marshall, J.; Barceló, D.; Dahm, C.N.; Ginebreda, A.; McGregor, G.; Sabater, S.; Tockner, K.; Palmer, M.A. Why should we care about temporary waterways? Science 2014, 343, 1080–1081. [Google Scholar] [CrossRef] [Scilit] [PubMed]
- Zhu, H.; Zhang, Y.-Z.; Peng, Y.-C.; Shi, B.-C.; Liu, T.; Dong, H.-B.; Wang, Y.; Ren, Y.-C.; Xi, Y.-L. Assessing the ecological health of the Qingyi River Basin using multi-community indices of biotic integrity. Ecol. Indic. 2023, 156, 111160. [Google Scholar] [CrossRef] [Scilit]
- Pinto, U.; Powell, M.; Ling, J.; Svozil, D.; Larkin, Z.; Potts, J.; Wen, L.; Scanes, P. Building community trust and stewardship through a multi-indicator approach to monitoring aquatic ecosystem restoration. Environ. Dev. Sustain. 2025. [Google Scholar] [CrossRef] [Scilit]
- Gain, A.K.; Giupponi, C. A dynamic assessment of water scarcity risk in the Lower Brahmaputra River Basin: An integrated approach. Ecol. Indic. 2015, 48, 120–131. [Google Scholar] [CrossRef] [Scilit]
- Kadam, A.; Wagh, V.; Jacobs, J.; Patil, S.; Pawar, N.; Umrikar, B.; Sankhua, R.; Kumar, S. Integrated approach for the evaluation of groundwater quality through hydro geochemistry and human health risk from Shivganga river basin, Pune, Maharashtra, India. Environ. Sci. Pollut. Res. 2022, 29, 4311–4333. [Google Scholar] [CrossRef] [Scilit] [PubMed]
- Yang, Y.; Cao, H.; Xia, Y.; Liu, D.; Liu, Y.; Qiao, J. Assessing ecological health in a semi-arid basin: A case study of the Wei River Basin, China. Environ. Sci. Pollut. Res. 2024, 31, 21687–21708. [Google Scholar] [CrossRef] [Scilit] [PubMed]
- O’connor, T.G. Effect of small catchment dams on downstream vegetation of a seasonal river in semi-arid African savanna. J. Appl. Ecol. 2001, 38, 1314–1325. [Google Scholar] [CrossRef] [Scilit]
- Khaing, T.T.; Jargal, N.; Kim, J.Y.; An, K.-G. Ecological health Assessments, based on chemical pollution and the multimetric fish model, in a temperate monsoon river and their spatiotemporal variability. Water Air Soil Pollut. 2024, 235, 816. [Google Scholar] [CrossRef] [Scilit]
- Zhang, Q.; Xu, C.-Y.; Tao, H.; Jiang, T.; Chen, Y.D. Climate changes and their impacts on water resources in the arid regions: A case study of the Tarim River basin, China. Stoch. Environ. Res. Risk Assess. 2010, 24, 349–358. [Google Scholar] [CrossRef] [Scilit]
- Alsaeed, B.S.; Hunt, D.V.L.; Sharifi, S. Sustainable water resources management assessment frameworks (SWRM-AF) for arid and semi-arid regions: A systematic review. Sustainability 2022, 14, 15293. [Google Scholar] [CrossRef] [Scilit]
- Ma, D.; Luo, W.; Yang, G.; Lu, J.; Fan, Y. A study on a river health assessment method based on ecological flow. Ecol. Model. 2019, 401, 144–154. [Google Scholar] [CrossRef] [Scilit]
- Nehring, R.B.; Anderson, R.M. Determination of population-limiting critical salmonid habitats in Colorado streams using the Physical Habitat Simulation System. Rivers 1993, 4, 1–19. [Google Scholar]
- Zhang, X.; Meng, Y.; Xia, J.; Wu, B.; She, D. A combined model for river health evaluation based upon the physical, chemical, and biological elements. Ecol. Indic. 2018, 84, 416–424. [Google Scholar] [CrossRef] [Scilit]
- Sundaray, S.K.; Panda, U.C.; Nayak, B.B.; Bhatta, D. Multivariate statistical techniques for the evaluation of spatial and temporal variations in water quality of the Mahanadi river–estuarine system (India)—A case study. Environ. Geochem. Health 2006, 28, 317–330. [Google Scholar] [CrossRef] [Scilit] [PubMed]
- Zhao, Y.; Yang, Z. Integrative fuzzy hierarchical model for river health assessment: A case study of Yong River in Ningbo City, China. Commun. Nonlinear Sci. Numer. Simul. 2009, 14, 1729–1736. [Google Scholar] [CrossRef] [Scilit]
- Bunn, S.E.; Abal, E.G.; Smith, M.J.; Choy, S.C.; Fellows, C.S.; Harch, B.D.; Kennard, M.J.; Sheldon, F. Integration of science and monitoring of river ecosystem health to guide investments in catchment protection and rehabilitation. Freshw. Biol. 2010, 55, 223–240. [Google Scholar] [CrossRef] [Scilit]
- Zheng, R.; Fei, L.; Wang, Q.; Peng, Y.; Shen, F.; Liu, N. Multi-uncertainty river health assessment in the Loess Plateau based on a novel comprehensive similarity cloud model. Ecol. Indic. 2024, 161, 111928. [Google Scholar] [CrossRef] [Scilit]
- Liang, Y.; Ding, F.; Liu, L.; Yin, F.; Hao, M.; Kang, T.; Zhao, C.; Wang, Z.; Jiang, D. Monitoring water quality parameters in urban rivers using multi-source data and machine learning approach. J. Hydrol. 2025, 648, 132394. [Google Scholar] [CrossRef] [Scilit]
- Chen, W.; Gu, T.; Zeng, J. Urbanisation and ecosystem health in the Middle Reaches of the Yangtze River urban agglomerations, China: A U-curve relationship. J. Environ. Manag. 2022, 318, 115565. [Google Scholar] [CrossRef] [Scilit] [PubMed]
- Chessman, B.C. Rapid assessment of rivers using macroinvertebrates: A procedure based on habitat-specific sampling, family level identification and a biotic index. Aust. J. Ecol. 1995, 20, 122–129. [Google Scholar] [CrossRef] [Scilit]
- Bhatt, S.; Mishra, A.P.; Chandra, N.; Sahu, H.; Chaurasia, S.K.; Pande, C.B.; Agbasi, J.C.; Khan, M.Y.A.; Abba, S.I.; Egbueri, J.C.; et al. Characterizing seasonal, environmental and human-induced factors influencing the dynamics of Rispana River’s water quality: Implications for sustainable river management. Results Eng. 2024, 22, 102007. [Google Scholar] [CrossRef] [Scilit]
- Patel, V.; Parikh, P. Assessment of seasonal variation in water quality of River Mini, at Sindhrot, Vadodara. Int. J. Environ. Sci. 2013, 3, 1424–1436. [Google Scholar] [CrossRef]
- McClain, M.E.; Boyer, E.W.; Dent, C.L.; Gergel, S.E.; Grimm, N.B.; Groffman, P.M.; Hart, S.C.; Harvey, J.W.; Johnston, C.A.; Mayorga, E. Biogeochemical hot spots and hot moments at the interface of terrestrial and aquatic ecosystems. Ecosystems 2003, 6, 301–312. [Google Scholar] [CrossRef] [Scilit]
- Steward, A.L.; Marshall, J.C.; Sheldon, F.; Harch, B.; Choy, S.; Bunn, S.E.; Tockner, K. Terrestrial invertebrates of dry river beds are not simply subsets of riparian assemblages. Aquat. Sci. 2011, 73, 551–566. [Google Scholar] [CrossRef] [Scilit]
- Pan, G.; Xu, Y.; Yu, Z.; Song, S.; Zhang, Y. Analysis of river health variation under the background of urbanization based on entropy weight and matter-element model: A case study in Huzhou City in the Yangtze River Delta, China. Environ. Res. 2015, 139, 31–35. [Google Scholar] [CrossRef] [Scilit] [PubMed]
- Shan, C.; Yang, J.; Dong, Z.; Huang, D.; Wang, H. Study on river health assessment weight calculation. Pol. J. Environ. Stud. 2020, 29, 1839–1848. [Google Scholar] [CrossRef] [Scilit] [PubMed]
- Shan, C.; Dong, Z.; Lu, D.; Xu, C.; Wang, H.; Ling, Z.; Liu, Q. Study on river health assessment based on a fuzzy matter-element extension model. Ecol. Indic. 2021, 127, 107742. [Google Scholar] [CrossRef] [Scilit]
- Qi, Q.; Wang, Z.; Yin, H.; Zhang, Z.; Wang, F. Construction and Application of a Seasonal River Health Evaluation System in Arid and Semi-Arid Areas. Water 2024, 16, 691. [Google Scholar] [CrossRef] [Scilit]

Disclaimer/Publisher’s Note: The statements, opinions and data contained in all publications are solely those of the individual author(s) and contributor(s) and not of MDPI and/or the editor(s). MDPI and/or the editor(s) disclaim responsibility for any injury to people or property resulting from any ideas, methods, instructions or products referred to in the content. |
© 2026 by the authors. Licensee MDPI, Basel, Switzerland. This article is an open access article distributed under the terms and conditions of the Creative Commons Attribution (CC BY) license.