


Abstract
In response to the paradigm shift in urban wastewater treatment that has been driven by emerging regulatory requirements for the removal of chemical contaminants of emerging concern (CECs), it has become essential to evaluate the environmental and economic implications of wastewater treatment upgrades using Life Cycle Assessment (LCA) and comparative cost analysis. The present study evaluates, using full-scale operational data, strategies that can be used in activated sludge systems and downstream ozonation that target CECs and conventional pollutants. Human toxicity, global warming, freshwater ecotoxicity, and freshwater eutrophication were considered midpoint categories, whereas human health and freshwater ecosystems were assessed as endpoint categories, together with a comparative cost analysis. The results show that higher CEC removals mainly reduced freshwater ecotoxicity, although this improvement had a relatively minor effect on the freshwater ecosystems endpoint, which was mostly driven by nutrient emissions. Higher ozone doses reduced the impacts on freshwater ecosystems due to enhanced CEC removal, but increased costs and negatively affected human health, mainly through the impacts of global warming that are associated with electrical energy consumption and oxygen production and transport. Ozonation showed total unit costs of 0.065–0.083 €/m3, and the smallest impacts on freshwater ecosystems under the tested conditions were observed at costs around 0.07 €/m3, corresponding to organic-carbon-normalized ozone doses of approximately 0.8 mgO3/mgC. Integrating LCA and cost analysis supports the identification of environmental–economic trade-offs when selecting wastewater treatment strategies. However, the application of LCA to CEC removal remains limited by the lack of characterization factors for many CECs, which may lead to underestimation of CEC-related impacts, although the magnitude of this potential bias remains uncertain. Further development of CEC characterization factors and site-specific environmental–economic assessment is therefore important to support treatment and regulatory decisions.
1. Introduction
The introduction of new regulatory requirements for contaminants of emerging concern (CECs) in urban wastewater treatment, particularly through the European Urban Wastewater Treatment Directive recast [1], is expected to promote significant changes in wastewater treatment practices. In this context, understanding the environmental and economic consequences associated with treatment upgrades will become increasingly relevant.
This study investigates, based on full-scale operational data, different operating strategies for activated sludge treatment and downstream ozonation, considering the removal of both conventional pollutants and CECs. Their environmental and economic performance was examined using Life Cycle Assessment (LCA) and comparative cost analysis.
LCA is a structured, comprehensive, and internationally standardized methodology that quantifies resource use, emissions, and associated environmental and human health impacts across the life cycle of goods and services [2]. The ISO 14040 and 14044 standards [3,4] provide the overarching framework for LCA. By integrating multiple environmental indicators within a single framework, LCA supports informed decision-making by identifying trade-offs among energy demand, greenhouse gas (GHG) emissions, eutrophication, resource depletion, and other impact categories [5,6,7].
Activated sludge (AS) is the most widely used biological process for secondary treatment in urban wastewater plants (WWTPs) worldwide [8], and its operational optimization may enhance the removal of some CECs, e.g., those under low-charge, those with extended aeration regimes, and those that promote nitrifiers to grow [9,10]. Ozonation is often considered a consolidated technology for quaternary treatment, i.e., as a complementary downstream barrier due to its ability to remove CECs that are poorly removed during biological treatment [11,12,13], although its additional energy and oxygen requirements may increase environmental impacts and costs. Assessing these two complementary approaches is therefore relevant for identifying the trade-offs between improved CEC removal [14] and the environmental and economic burdens associated with treatment intensification.
The CECs monitored within the study mainly comprised pharmaceuticals from different therapeutic classes and iodinated contrast media, representing compounds with different behavior during wastewater treatment and potential environmental relevance upon discharge.
Against this background, the present study does not aim to close all of the methodological and knowledge gaps identified (Section 2), but rather aims to evaluate the environmental and economic implications of strategies developed within the LIFE Fitting project for improving AS systems and downstream ozonation towards the removal of both conventional pollutants and CECs. The primary objective was to assess and compare: (i) operational strategies in full-scale AS treatment, based on different food-to-microorganism ratios and nitrification conditions, which are characteristics of low-charge extended aeration regimes; (ii) different ozone doses applied as downstream treatments; and (iii) integrated AS–ozonation treatments.
The novelty of the study lies in the combined assessment, using real full-scale operational data, of biological treatment optimization and downstream ozonation within a common LCA framework, complemented by a comparative cost analysis. Rather than emphasizing the absolute magnitude of the impacts associated with each individual strategy, the study aims to provide a consistent and transparent comparison of their environmental–economic trade-offs to support WWTP management decisions.
The analysis follows ISO 14040/14044 standards [3,4], adopts harmonized system boundaries, functional units, and impact categories in line with recent recommendations for wastewater treatment LCA, and was complemented by a cost analysis to explore the relationship between environmental and economic performance.
2. Literature Review
In the wastewater treatment sector, LCA has been extensively applied to assess the environmental performance of conventional WWTPs, particularly AS systems, considering construction, operation, and end-of-life phases [7,15,16,17]. Historically, most wastewater treatment LCAs focused on conventional performance parameters and a core set of impact categories, such as global warming, eutrophication, human toxicity, and freshwater ecotoxicity [18,19,20]. LCA results for wastewater treatment systems are strongly influenced by context-specific factors, including system boundaries [21], functional units [18], plant scale [4,7,16], influent characteristics [22], operational conditions, and the local energy mix [23].
As WWTPs progressively shift from pollution-control facilities to resource-recovery systems, LCA applications have expanded to compare conventional AS configurations with advanced and alternative technologies, including ozonation [24], adsorption [23,25], membrane bioreactors [26], disinfection [27,28], anaerobic processes [21], and nature-based solutions [29]. Recent studies have also increasingly addressed sludge-management strategies, nutrient, and energy recovery pathways and the integration of circular-economy principles into wastewater systems [17,20,30,31].
In parallel, regulatory developments, advances in analytical techniques, and growing awareness of ecological and human-health risks associated CECs have driven their progressive inclusion in wastewater-related LCA studies [24,28,32,33,34,35]. Despite this, the integration of CECs into LCA remains challenging due to analytical limitations, scarce monitoring data, and the unavailable or highly uncertain characterization factors [32,36,37,38].
Moreover, the choice of impact method has been shown to significantly influence toxicity-related impact categories—which are the impact pathways most directly affected by CECs—while exerting a more limited influence on conventional categories such as global warming or energy demand [7,22,32,39]. Several studies report that reductions in aquatic ecotoxicity or human toxicity achieved through advanced treatments are frequently offset by increases in other life cycle impacts, highlighting the need for harmonized methodological frameworks capable of jointly capturing conventional impacts and CEC-related trade-offs [24,25,33,35].
3. Methods
3.1. LCA Goal and Scope Definition
The main goal of this LCA was to assess and compare the potential environmental impacts of each strategy proposed in the LIFE Fitting project for improving the performance of AS systems and downstream ozonation towards chemical CECs to support decision-making in WWTP management. The LCA was conducted according to ISO 14040 [3] and 14044 [4] standards using the openLCA software (version 2.4.1). The target audience of this study comprises water utilities and environmental agencies.
Since this study focuses on the impacts of WWTP operation, a ‘cradle-to-gate’ approach was adopted, starting with the wastewater influent to the WWTP and ending with the effluent discharged into water bodies (liquid line) and the sludge (solids line) transported to final destination (for valorization or disposal). The boundary was limited to wastewater treatment operations (AS or ozonation), excluding infrastructure construction and end-of-life impacts. Wastewater flow rate and pollution loads were considered in a foreground system and energy and chemical production in a background system [2].
The schematic diagrams of the three WWTPs studied are detailed in Silva et al. [14]. Serzedelo I WWTP (SI) has extended aeration plug flow reactors (EA-PFRs) with mechanical aerators, Serzedelo II WWTP (SII) has oxidation ditches (ODs) with air diffusers, and Lordelo WWTP (LOR) has pure-oxygen AS reactors. The strategies tested were:
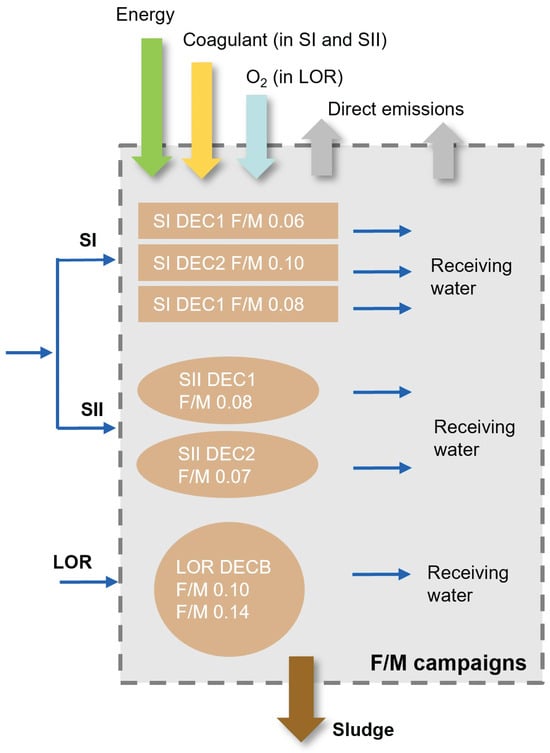
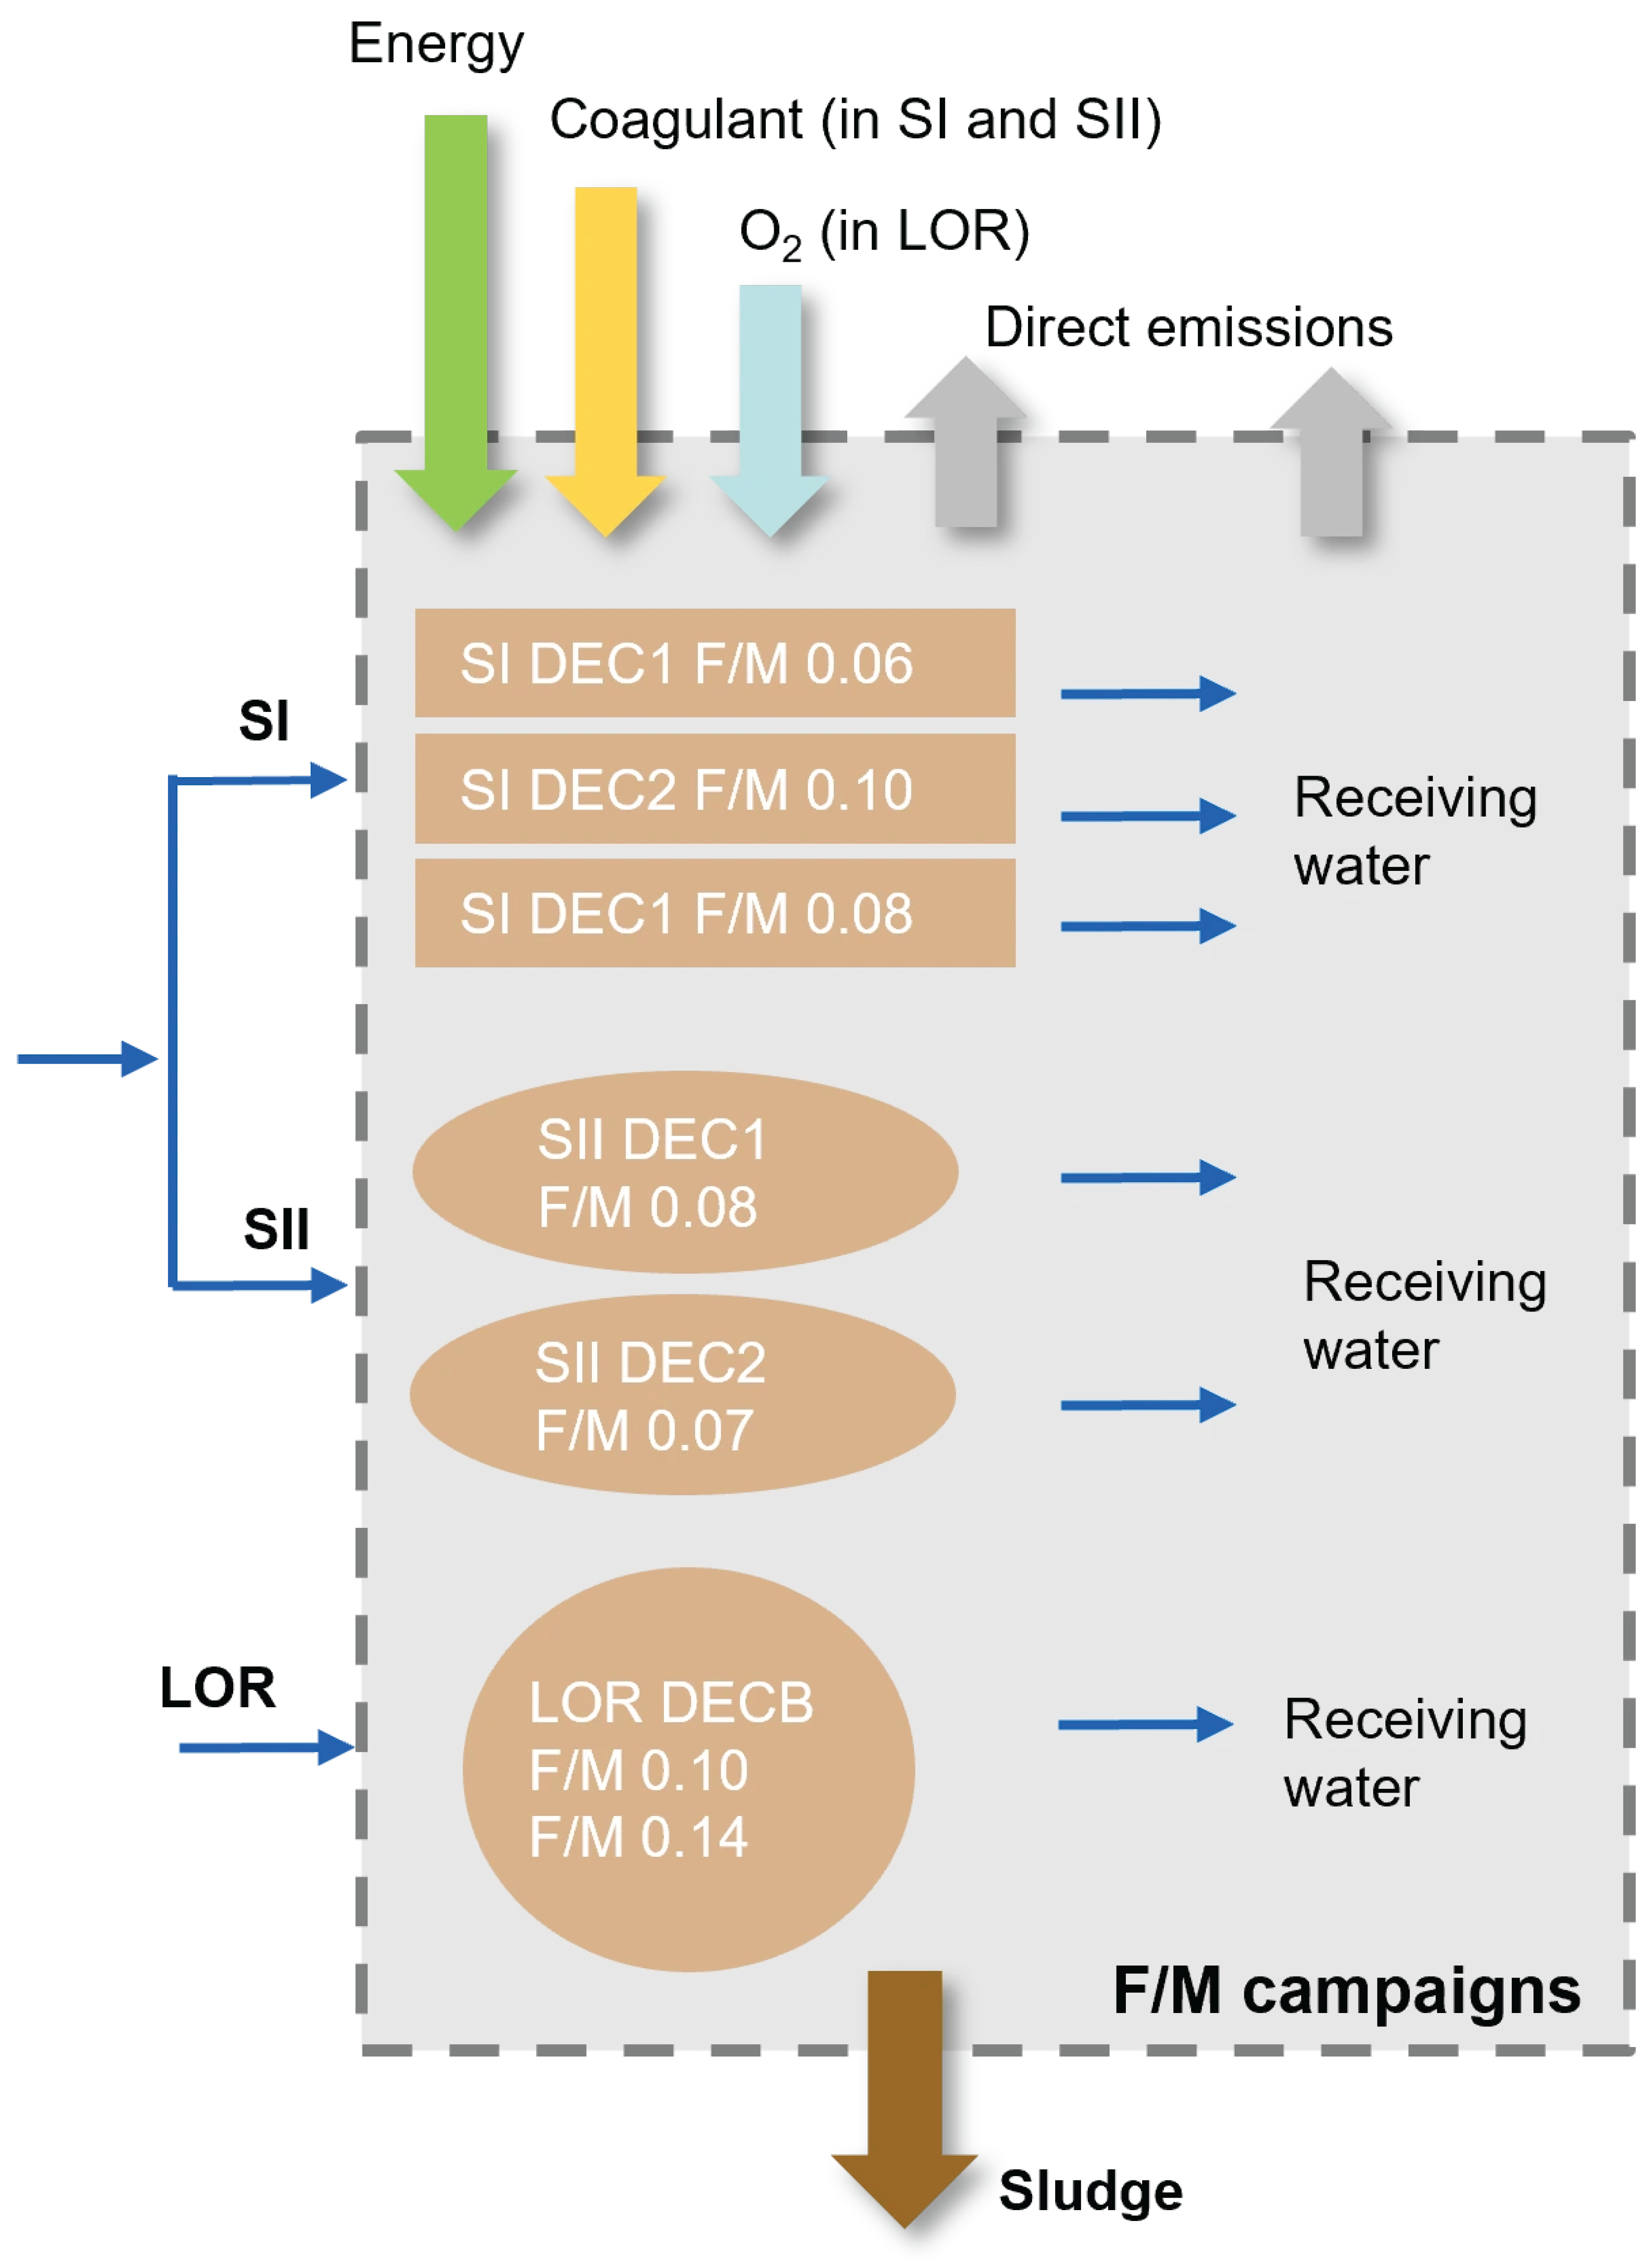
- Different food/microorganisms (F/M) conditions (Figure 1) in three AS parallel lines in SI, two parallel lines in SII, and two sequential periods in LOR—F/M campaigns [14]. The tested conditions resulted in median F/M values of 0.06–0.10 d−1 in SI, 0.07–0.08 d−1 in SII, and 0.10–0.14 d−1 in LOR. These conditions were obtained by varying MLSS through sludge wasting flow adjustments and represented feasible full-scale operational modifications within the low F/M range of the studied systems.
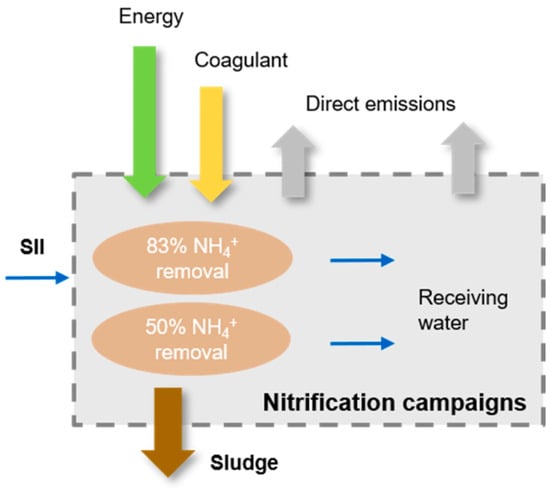
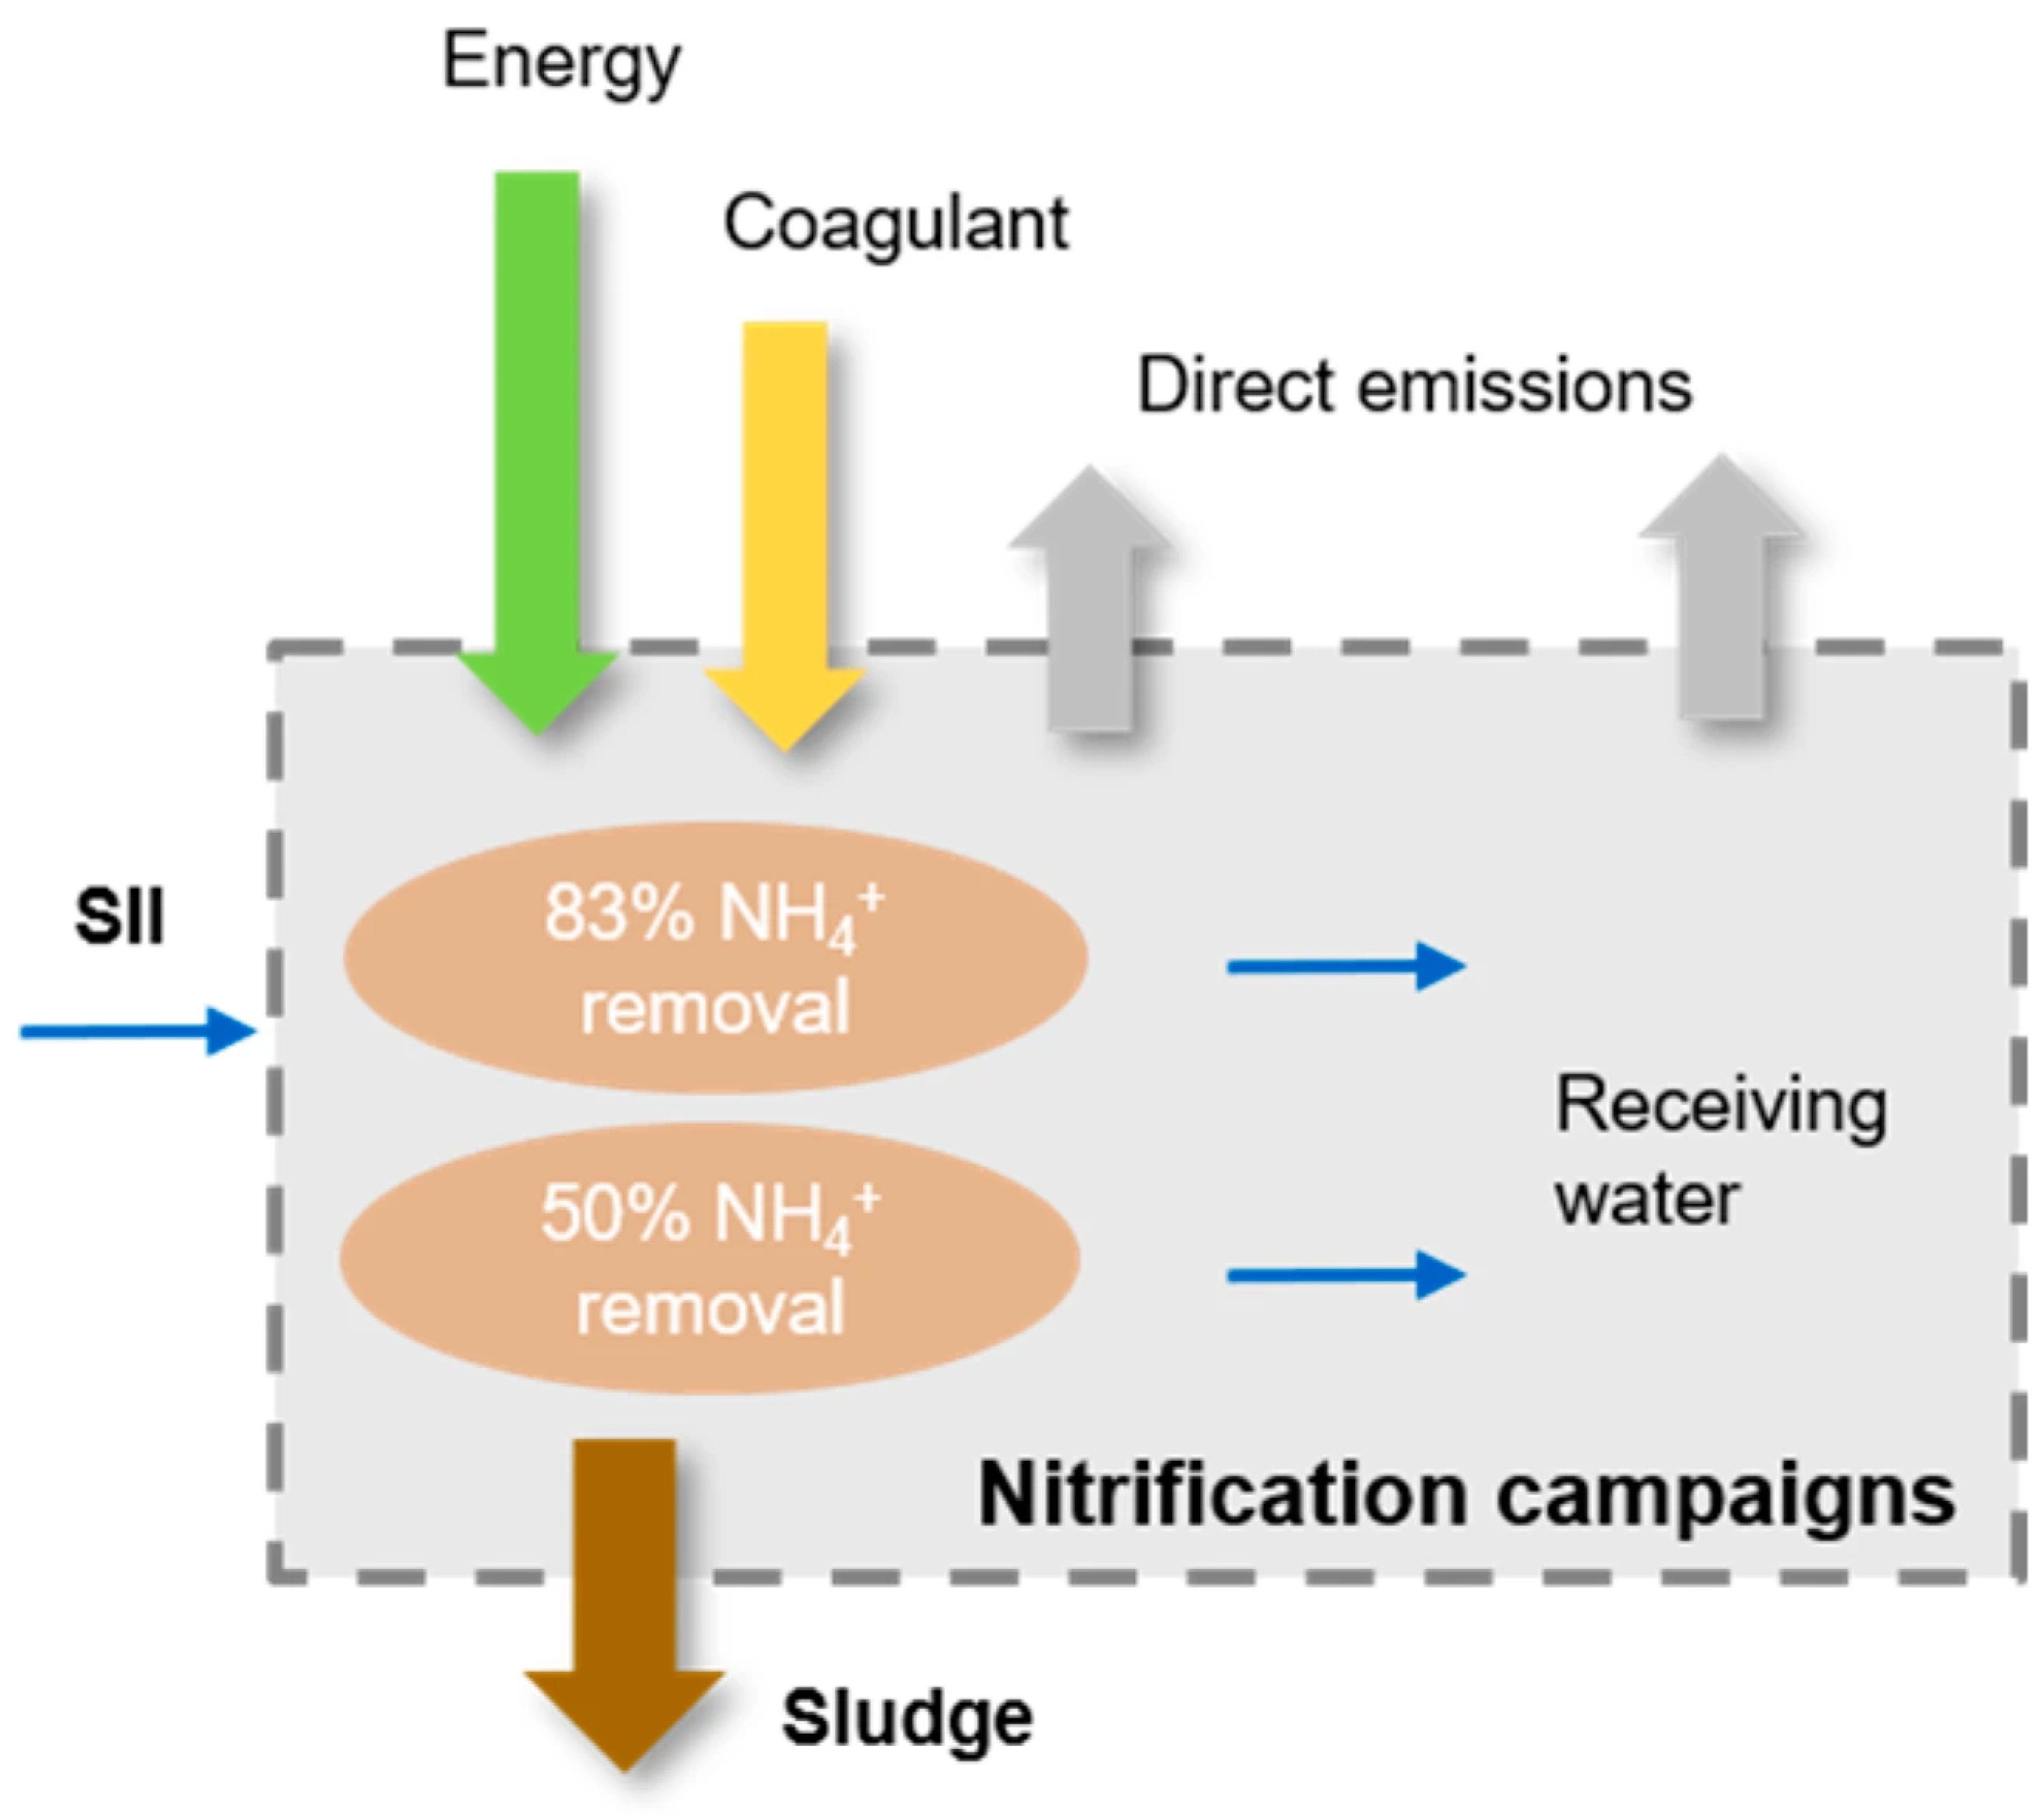
- Different nitrification conditions (Figure 2) in two AS parallel lines in SII: Nitrification campaigns [14].
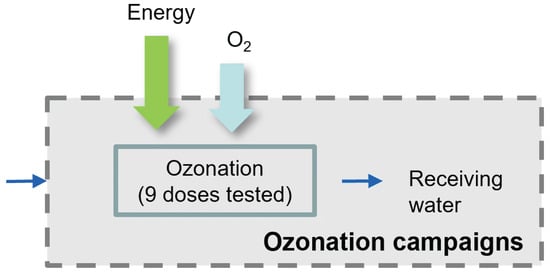
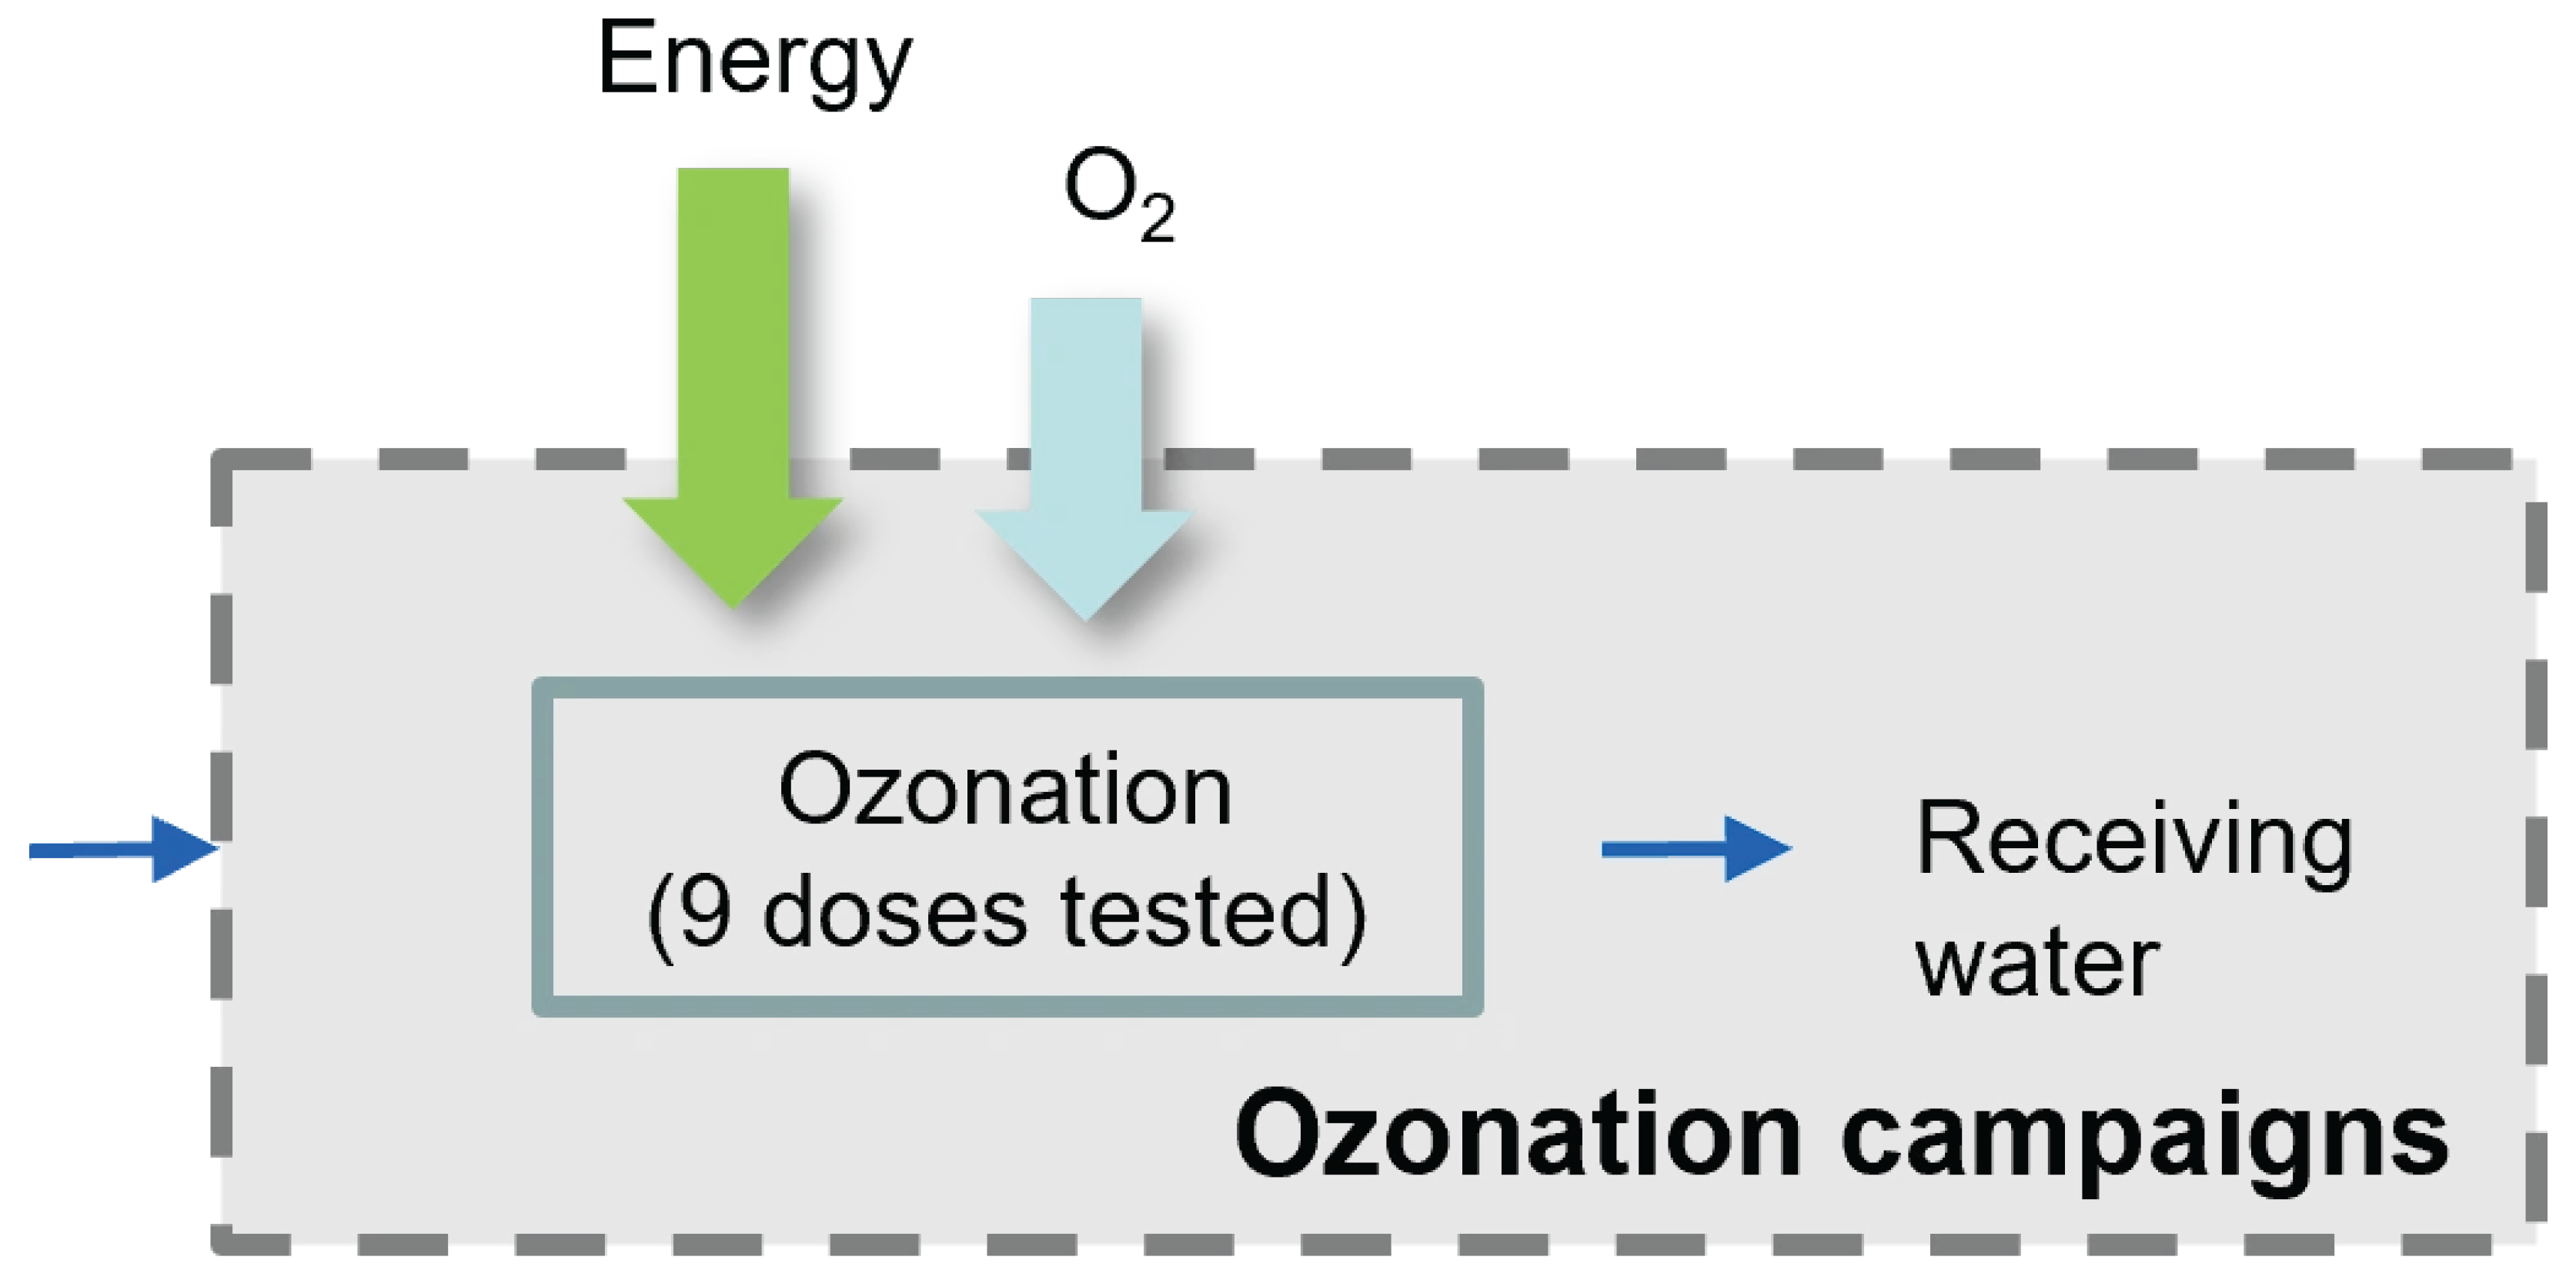
- Different ozone doses in LOR (Figure 3): Three full-scale ozonation campaigns, each testing three generated ozone doses within 14–30 gO3/m3, corresponding to transferred ozone doses of 11.6–24.2 gO3/m3 and organic-carbon-normalized doses of 0.41–0.98 mgO3/mgC [12,13].
Figure 1.
Strategies tested in F/M campaigns: three parallel AS lines in SI (F/M = 0.06–0.10 d−1), two parallel AS lines in SII (F/M = 0.07–0.08 d−1), and two sequential periods in LOR (F/M = 0.10–0.14 d−1).
Figure 2.
Strategies tested in nitrification campaigns in two parallel AS lines of SII, corresponding to 83% and 50% NH4+ removal, respectively.
Figure 3.
Strategies tested in ozonation campaigns in LOR, comprising nine organic-carbon-normalized ozone doses ranging from 0.41 to 0.98 mgO3/mgC.
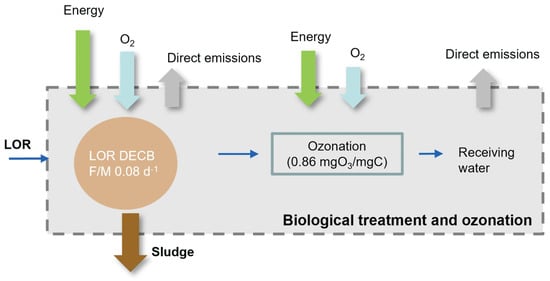
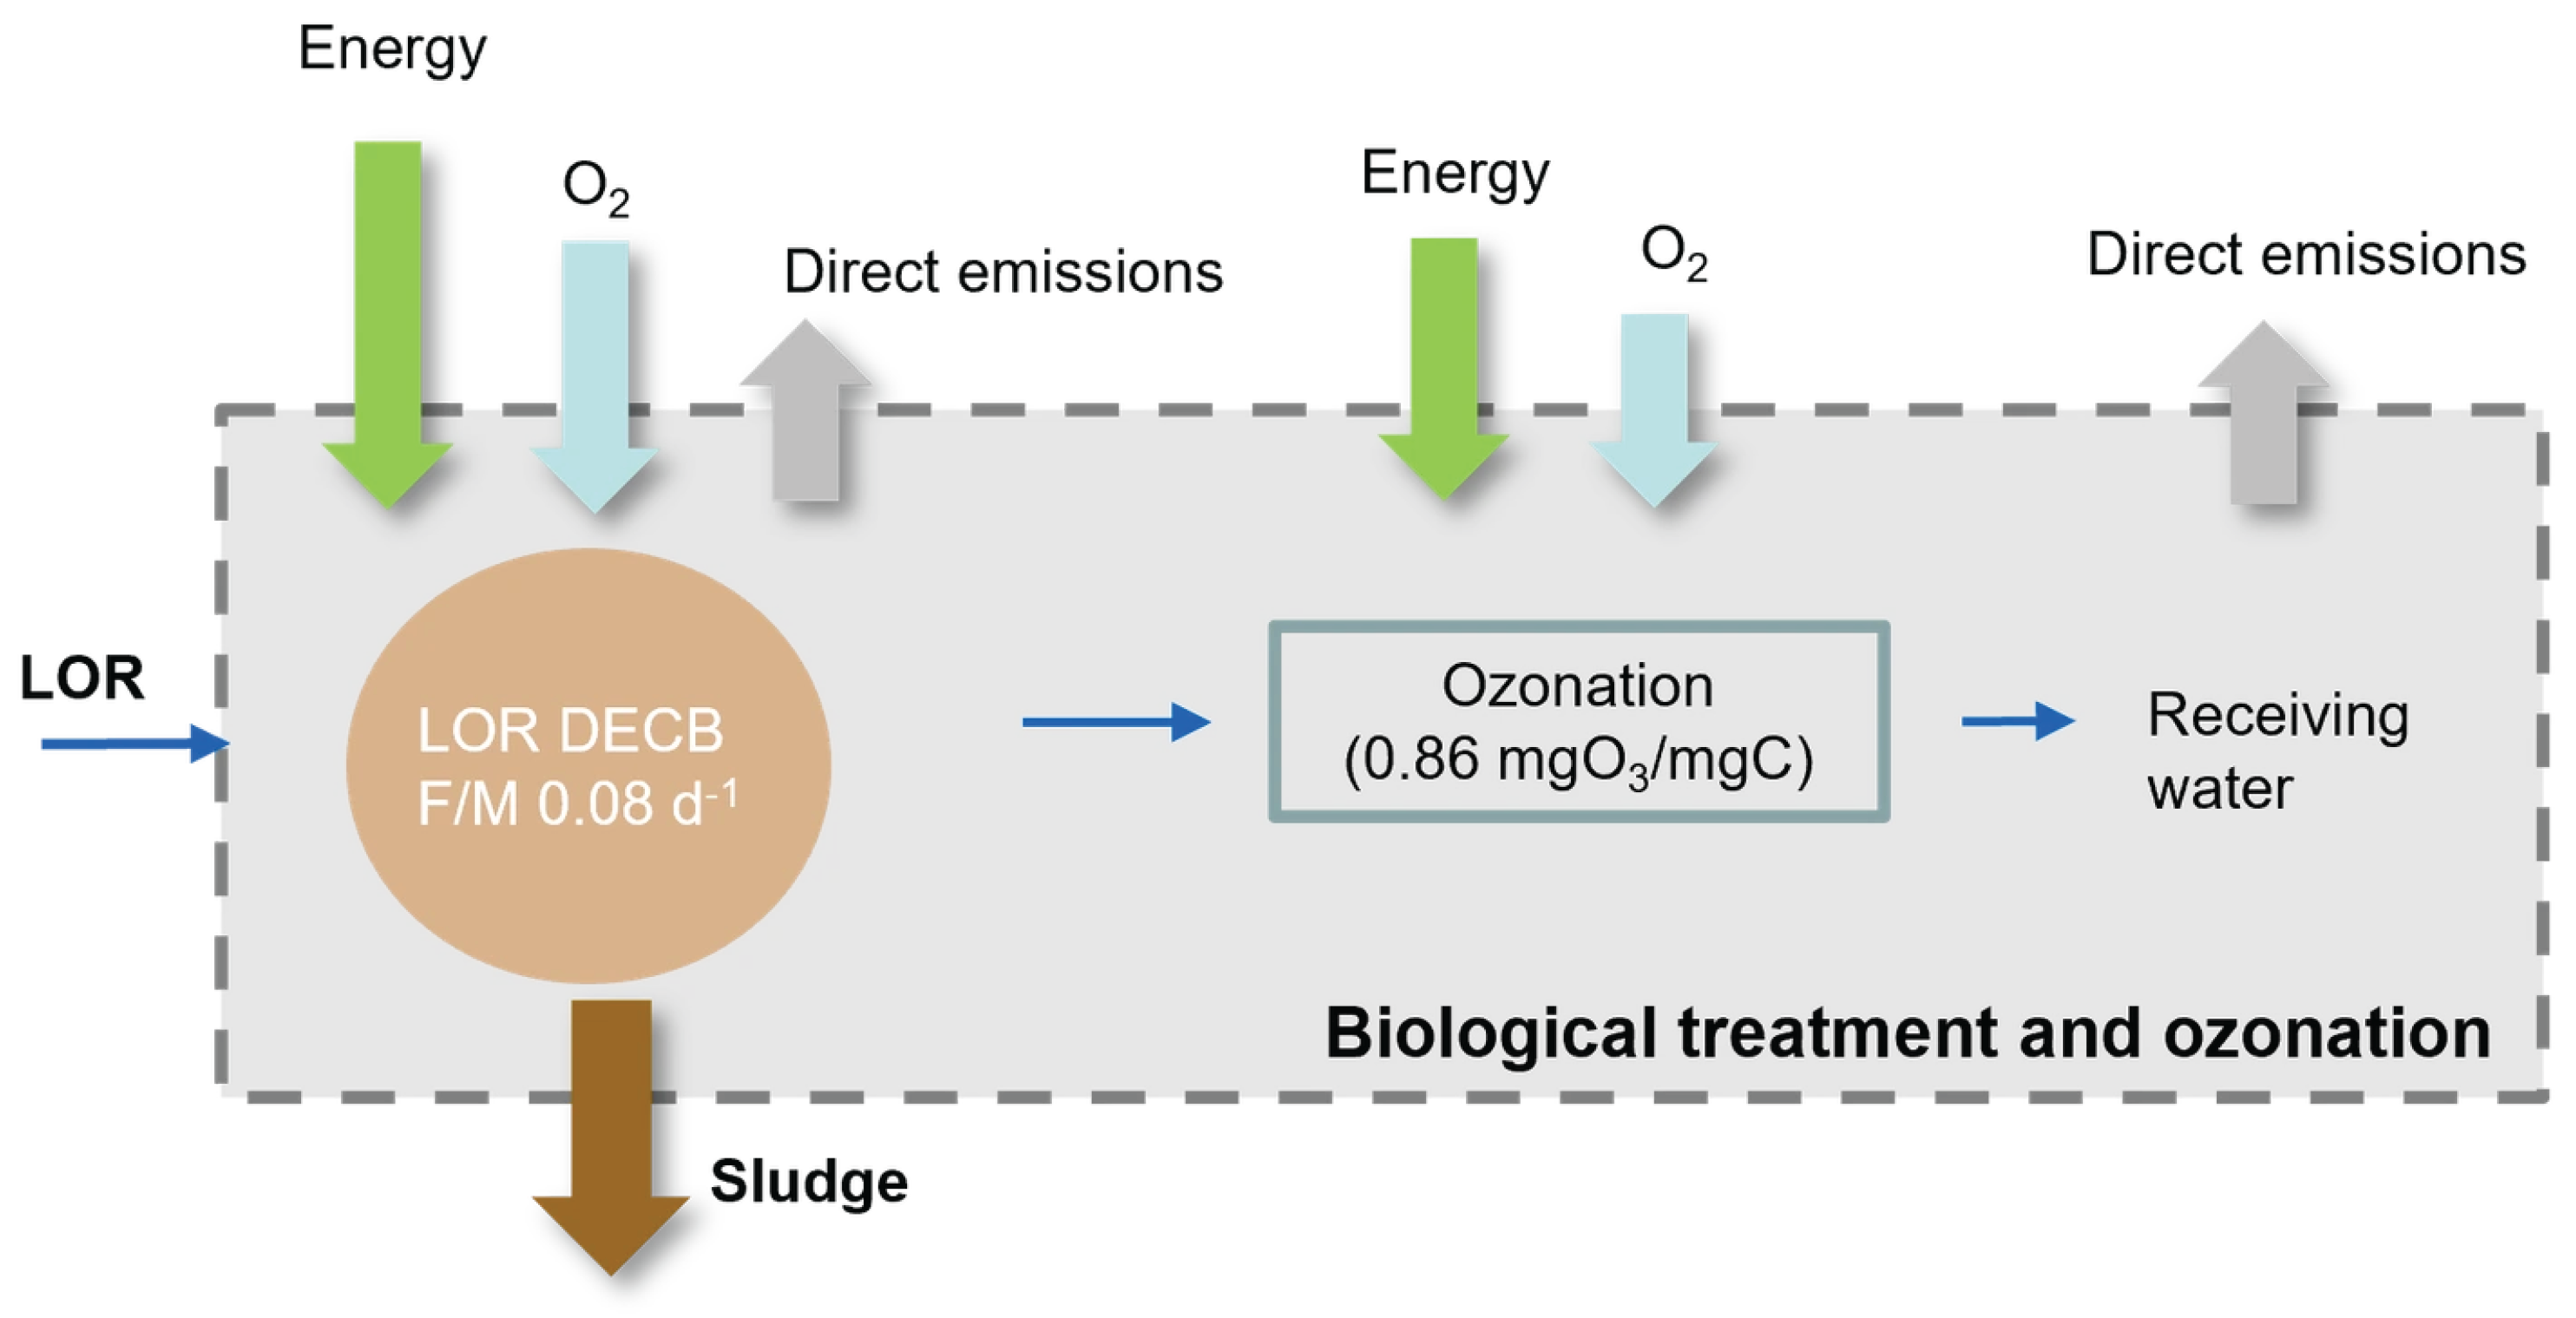
The dual-barrier treatment at LOR, i.e., AS followed by ozonation, was also analyzed in an integrated LCA (Figure 4).
Figure 4.
Dual-barrier treatment configuration analyzed in LOR: AS (F/M = 0.08 d−1) followed by ozonation (0.86 mgO3/mgC).
The primary functional unit was the volume of treated wastewater (m3) [6,19]. For the F/M and nitrification campaigns, the mass of chemical oxygen demand (COD) removed was additionally considered to account for differences in organic loading associated with the significant industrial contribution to the WWTPs.
3.2. Inventory Analysis
The life cycle inventory (LCI) included the data of the input and output parameters of each treatment operation studied (foreground data) are as follows:
- Energy consumption, coagulant consumption, and oxygen consumption for biological treatment and ozonation (input);
- Chemical transport (input);
- Sludge production and sludge transport (output);
- Influent pollutants, including CECs (input): 57 chemical CECs were monitored, as detailed in Silva et al. [14], of which 8 (only 3 of the 12 micropollutant indicators listed in the UWWTD recast [1]) were included in the LCA based on the availability of characterization factors: caffeine, carbamazepine, citalopram, diclofenac, iopromide, naproxen, paracetamol, and sulfamethoxazole;
- Effluent pollutants, including CECs (output);
- Direct GHG emissions from the AS treatment (output);
- Direct GHG emissions from the discharge into the receiving waters (output).
The background data, relative to energy, coagulant, and oxygen production, were derived using the ELCD database and openLCA Nexus. The direct GHG emissions from wastewater treatment and discharge were computed according to the Intergovernmental Panel on Climate Change (IPCC) [40].
For this LCA, data from 2023 and/or 2024 were used, depending on the strategy analyzed. For each strategy, the median value of each parameter per functional unit was computed and is presented in Tables S1–S3 in the Supplementary Materials for the F/M campaigns, nitrification campaigns, and ozonation campaigns, respectively.
3.3. Impact Assessment
The impact assessment was conducted using the ReCiPe 2016 method as the main framework, applying midpoint and endpoint impact categories under a hierarchist approach [41]. The midpoint categories considered were human toxicity (kg 1,4-DCB/m3), global warming (kg CO2eq/m3), freshwater ecotoxicity (kg 1,4-DCB/m3), and freshwater eutrophication (kg Peq/m3). The endpoint categories considered were human health (DALY/m3), integrating human toxicity and global warming, and freshwater ecosystems (species·year/m3), integrating freshwater ecotoxicity, eutrophication, and global warming.
The characterization factors of the midpoint categories (Tables S4 and S5) were selected according to the type of input and output data and expressed in common midpoint reference units to enable their integration within the assessment framework. The following sources were used: (i) CML-IA method [42] for conventional pollutants, such as chemical oxygen demand (COD), phosphorus (P), and nitrogen (N); (ii) USES-LCA 2.0 methodology for freshwater emission compartment [36] for CECs; (iii) ReCiPe 2016 midpoint [41] for energy and chemicals production; and (iv) IPCC [40] characterization factors for direct GHG emissions. Endpoint impacts were subsequently determined using the corresponding ReCiPe 2016 midpoint-to-endpoint characterization factors [41] (Table S6).
3.4. Interpretation
The LCA results were interpreted to assess the contribution of the inputs and outputs inventoried to the midpoint and endpoint impact categories. This interpretation aimed to help us understand the differences in the impact of the strategies tested and how the change of inventory data affects LCA results. Contaminant input data were used to assess the impacts if the WWTPs did not exist.
3.5. Comparative Cost Analysis
A comparative cost analysis was conducted to benchmark costs across the strategies evaluated for improving CEC removal in WWTPs. For AS treatment, the improvement strategies were only operational (F/M control and nitrification campaigns); therefore, only operational expenditures (OPEX, €/m3) were compared. For WWTP upgrades with ozonation, total costs were compared, combining OPEX and annualized capital expenditures (CAPEX) expressed per treated volume (€/m3).
For AS treatment OPEX, five cost categories were considered: the fees for water resources for treated wastewater discharge (discharge fee), calculated as a function of discharged BOD5, COD, total nitrogen (Nt) and total phosphorus (Pt); energy; coagulant consumption; oxygen; and sludge disposal.
For ozonation OPEX, site-specific costs from LOR WWTP were used for oxygen, electricity, and annual maintenance. OPEX was calculated from the measured oxygen and electricity consumptions associated with each ozone dose. No chemicals were used for pH adjustment during ozonation, and therefore no pH-adjustment costs were included in the cost analysis. Ozonation CAPEX was estimated from the investment costs reported by Baresel et al., as explained in [43], and scaled to the WWTP design capacity. CAPEX was annualized assuming a 20-year service life and a 3% interest rate (annuity factor = 0.0672). The annual treated flow was then used to express annualized CAPEX per treated volume (€/m3).
4. Results
4.1. F/M Campaigns
The results of the impact assessment of each F/M condition in the three WWTPs were structured into midpoint and endpoint categories and are expressed per volume (m3) of treated wastewater. The COD mass removed per treated volume, also reported in Table S1, was similar among the SI and SII lines (0.72–0.73 kg COD/m3), whereas a wider range was observed in LOR (0.54–0.82 kg COD/m3).
Cross-WWTP comparisons reflect the combined influence of plant-specific characteristics, including reactor configuration, aeration or oxygen supply, influent characteristics, and F/M conditions, and should therefore not be interpreted as the isolated effect of F/M.
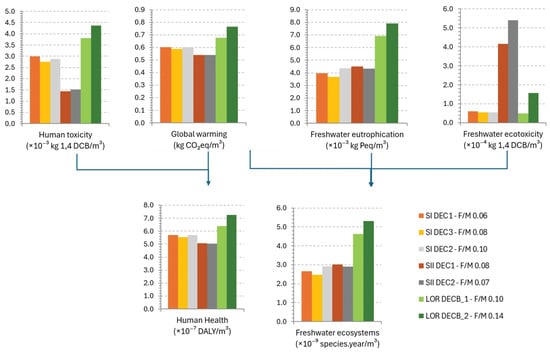
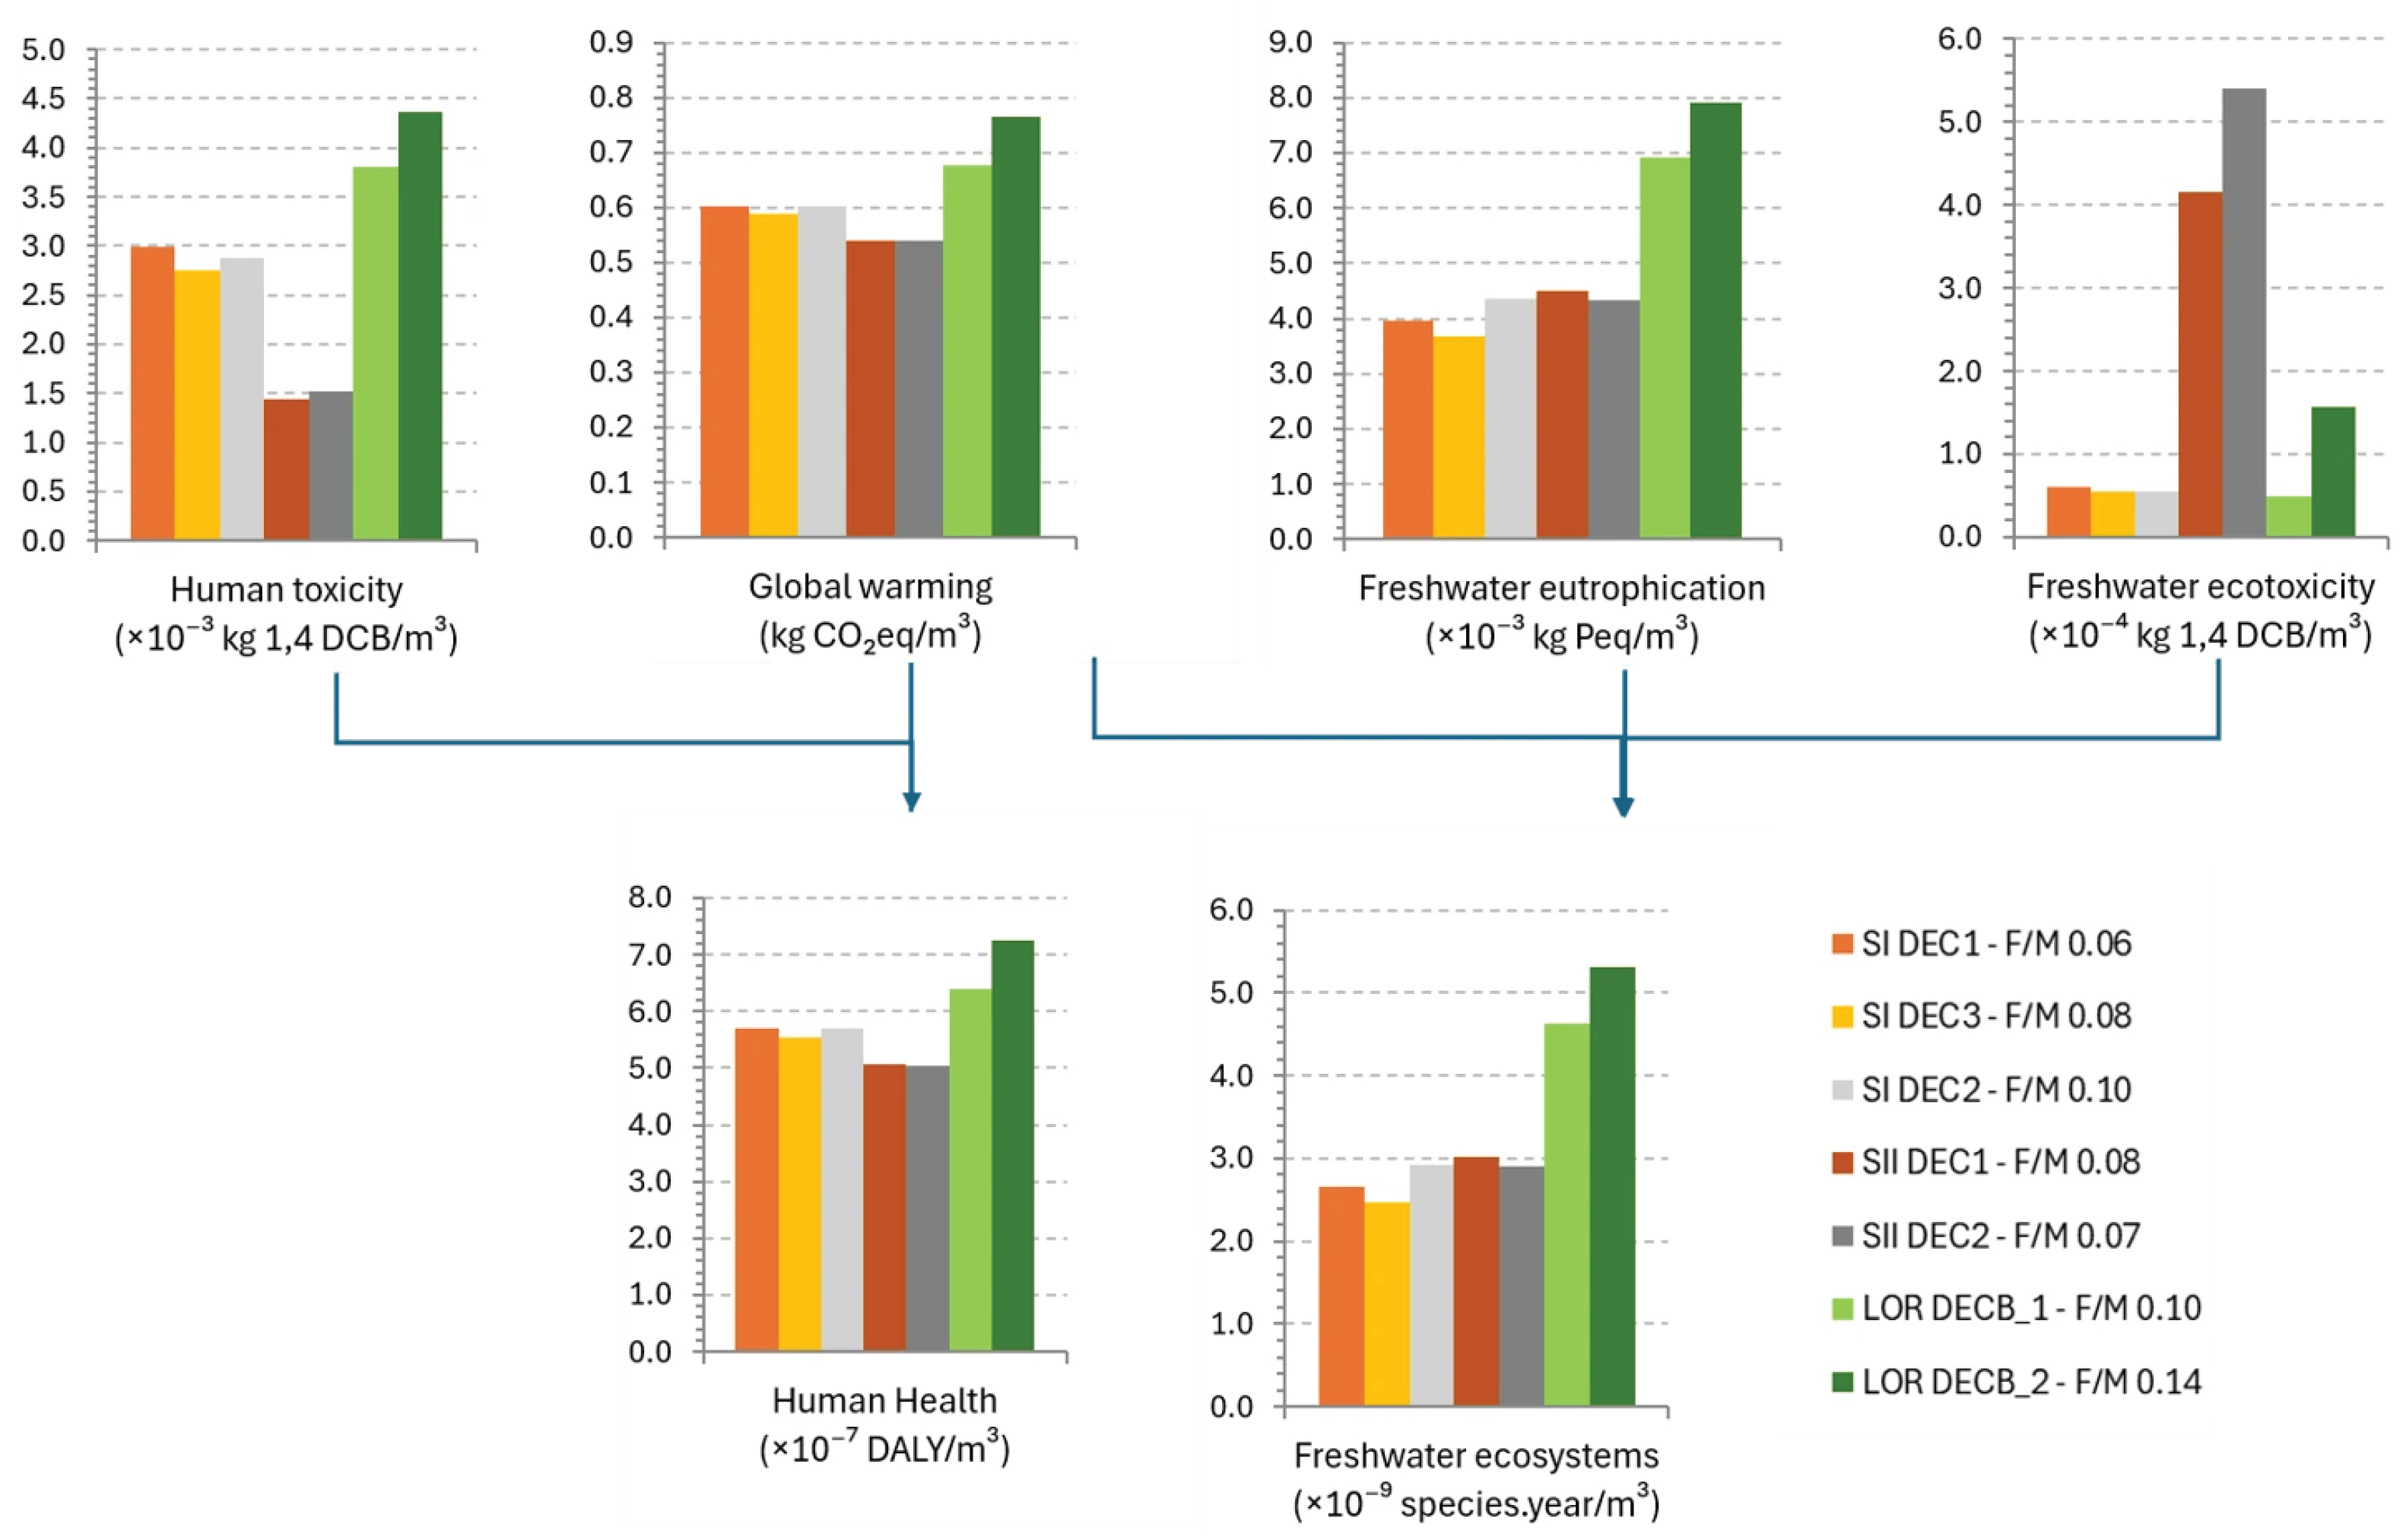
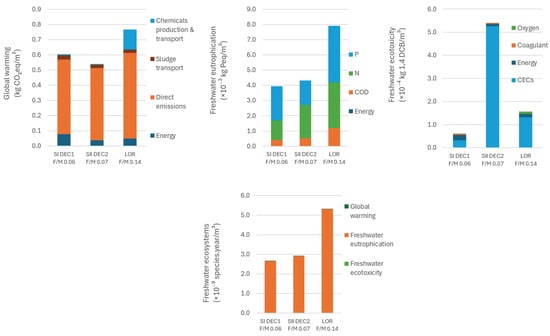
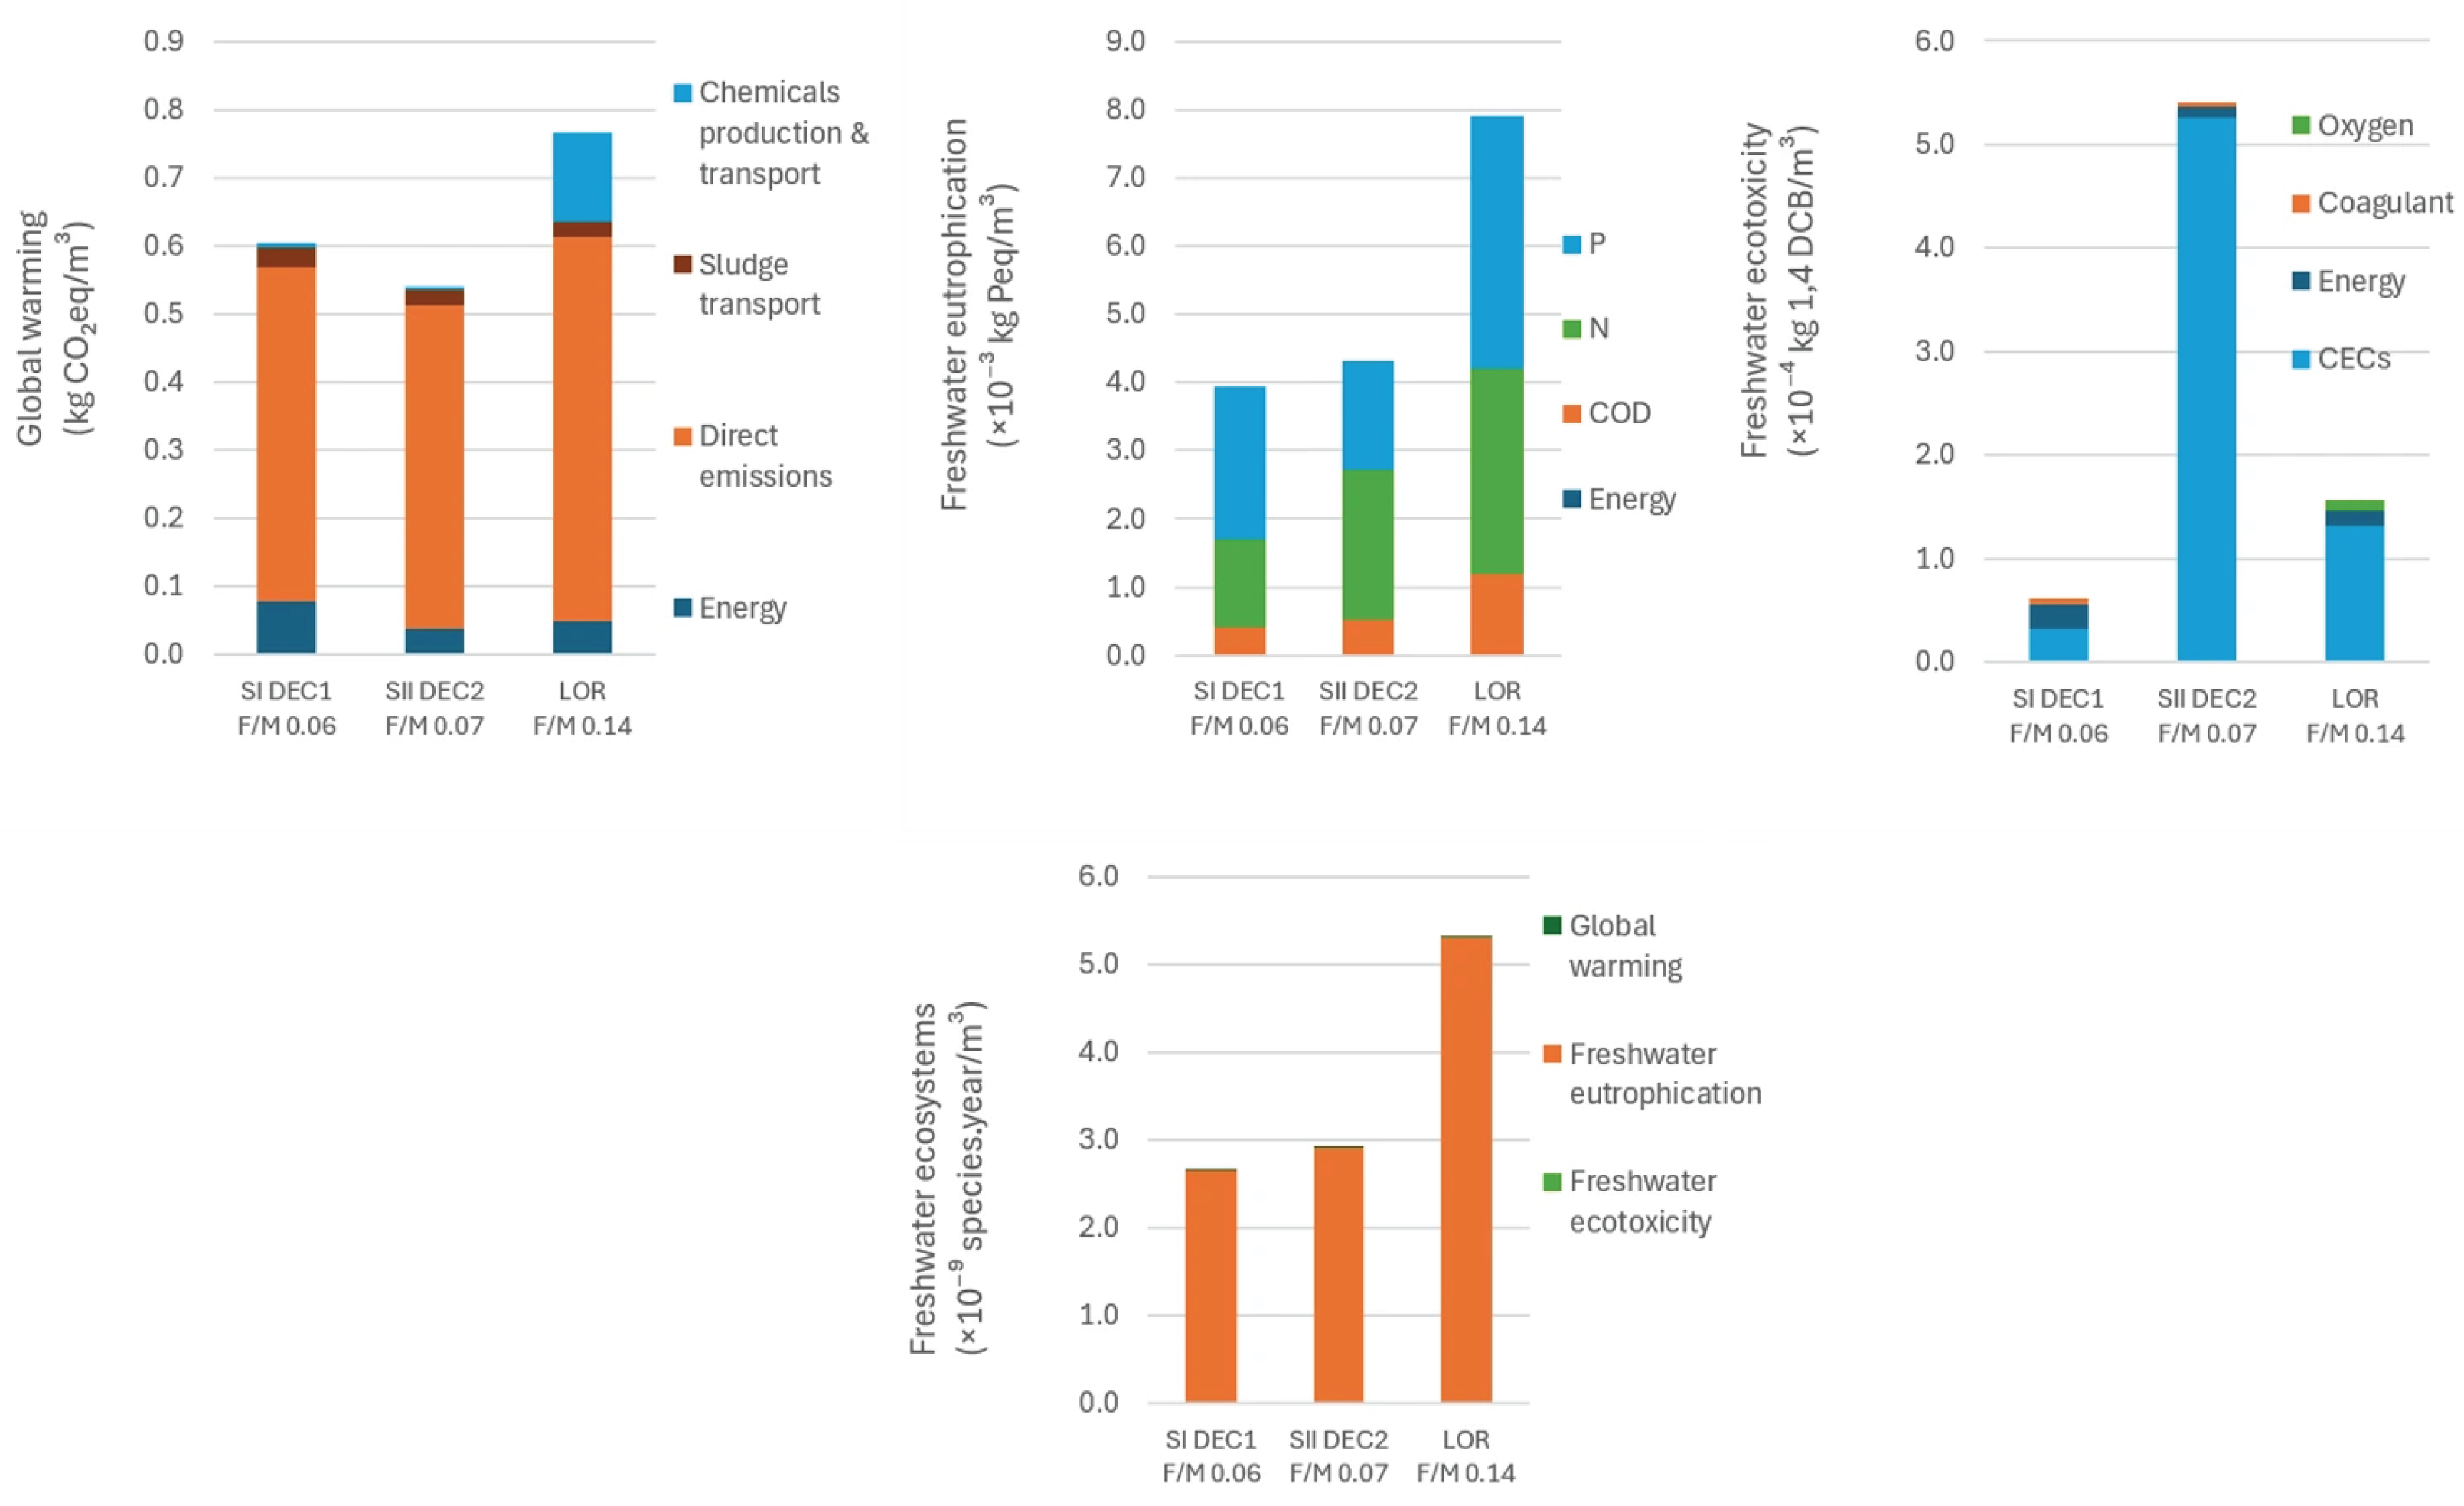
As illustrated in Figure 5, LOR pure oxygen AS treatment consistently shows the highest impact for all categories except freshwater ecotoxicity, and both SII ODs present the highest impact in freshwater ecotoxicity and the lowest in human toxicity. The translation from midpoint to endpoint reveals the cumulative burden of pollution and emissions, especially visible in the higher impact on human health and freshwater ecosystems of LOR, which has the AS treatment with a stronger midpoint impact on human toxicity, global warming, and freshwater eutrophication (Figure 5). The magnitude of the impact values obtained is consistent, with ranges reported in previous LCA studies of urban wastewater treatment systems for global warming [7,19,20], freshwater eutrophication [7,17], and human toxicity and ecotoxicity [39].
Figure 5.
LCA results of midpoint and endpoint impact categories for the F/M conditions tested in seven AS lines in three WWTPs: three parallel lines in SI (0.06–0.10 d−1), two parallel lines in SII (0.07–0.08 d−1), and two sequential lines in LOR (0.10–0.14 d−1). Complete inventory data are provided in Table S1.
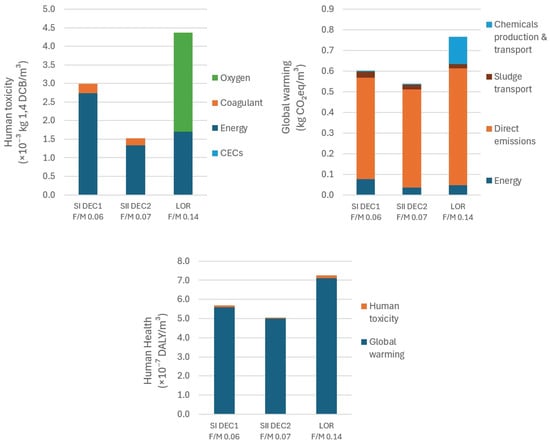
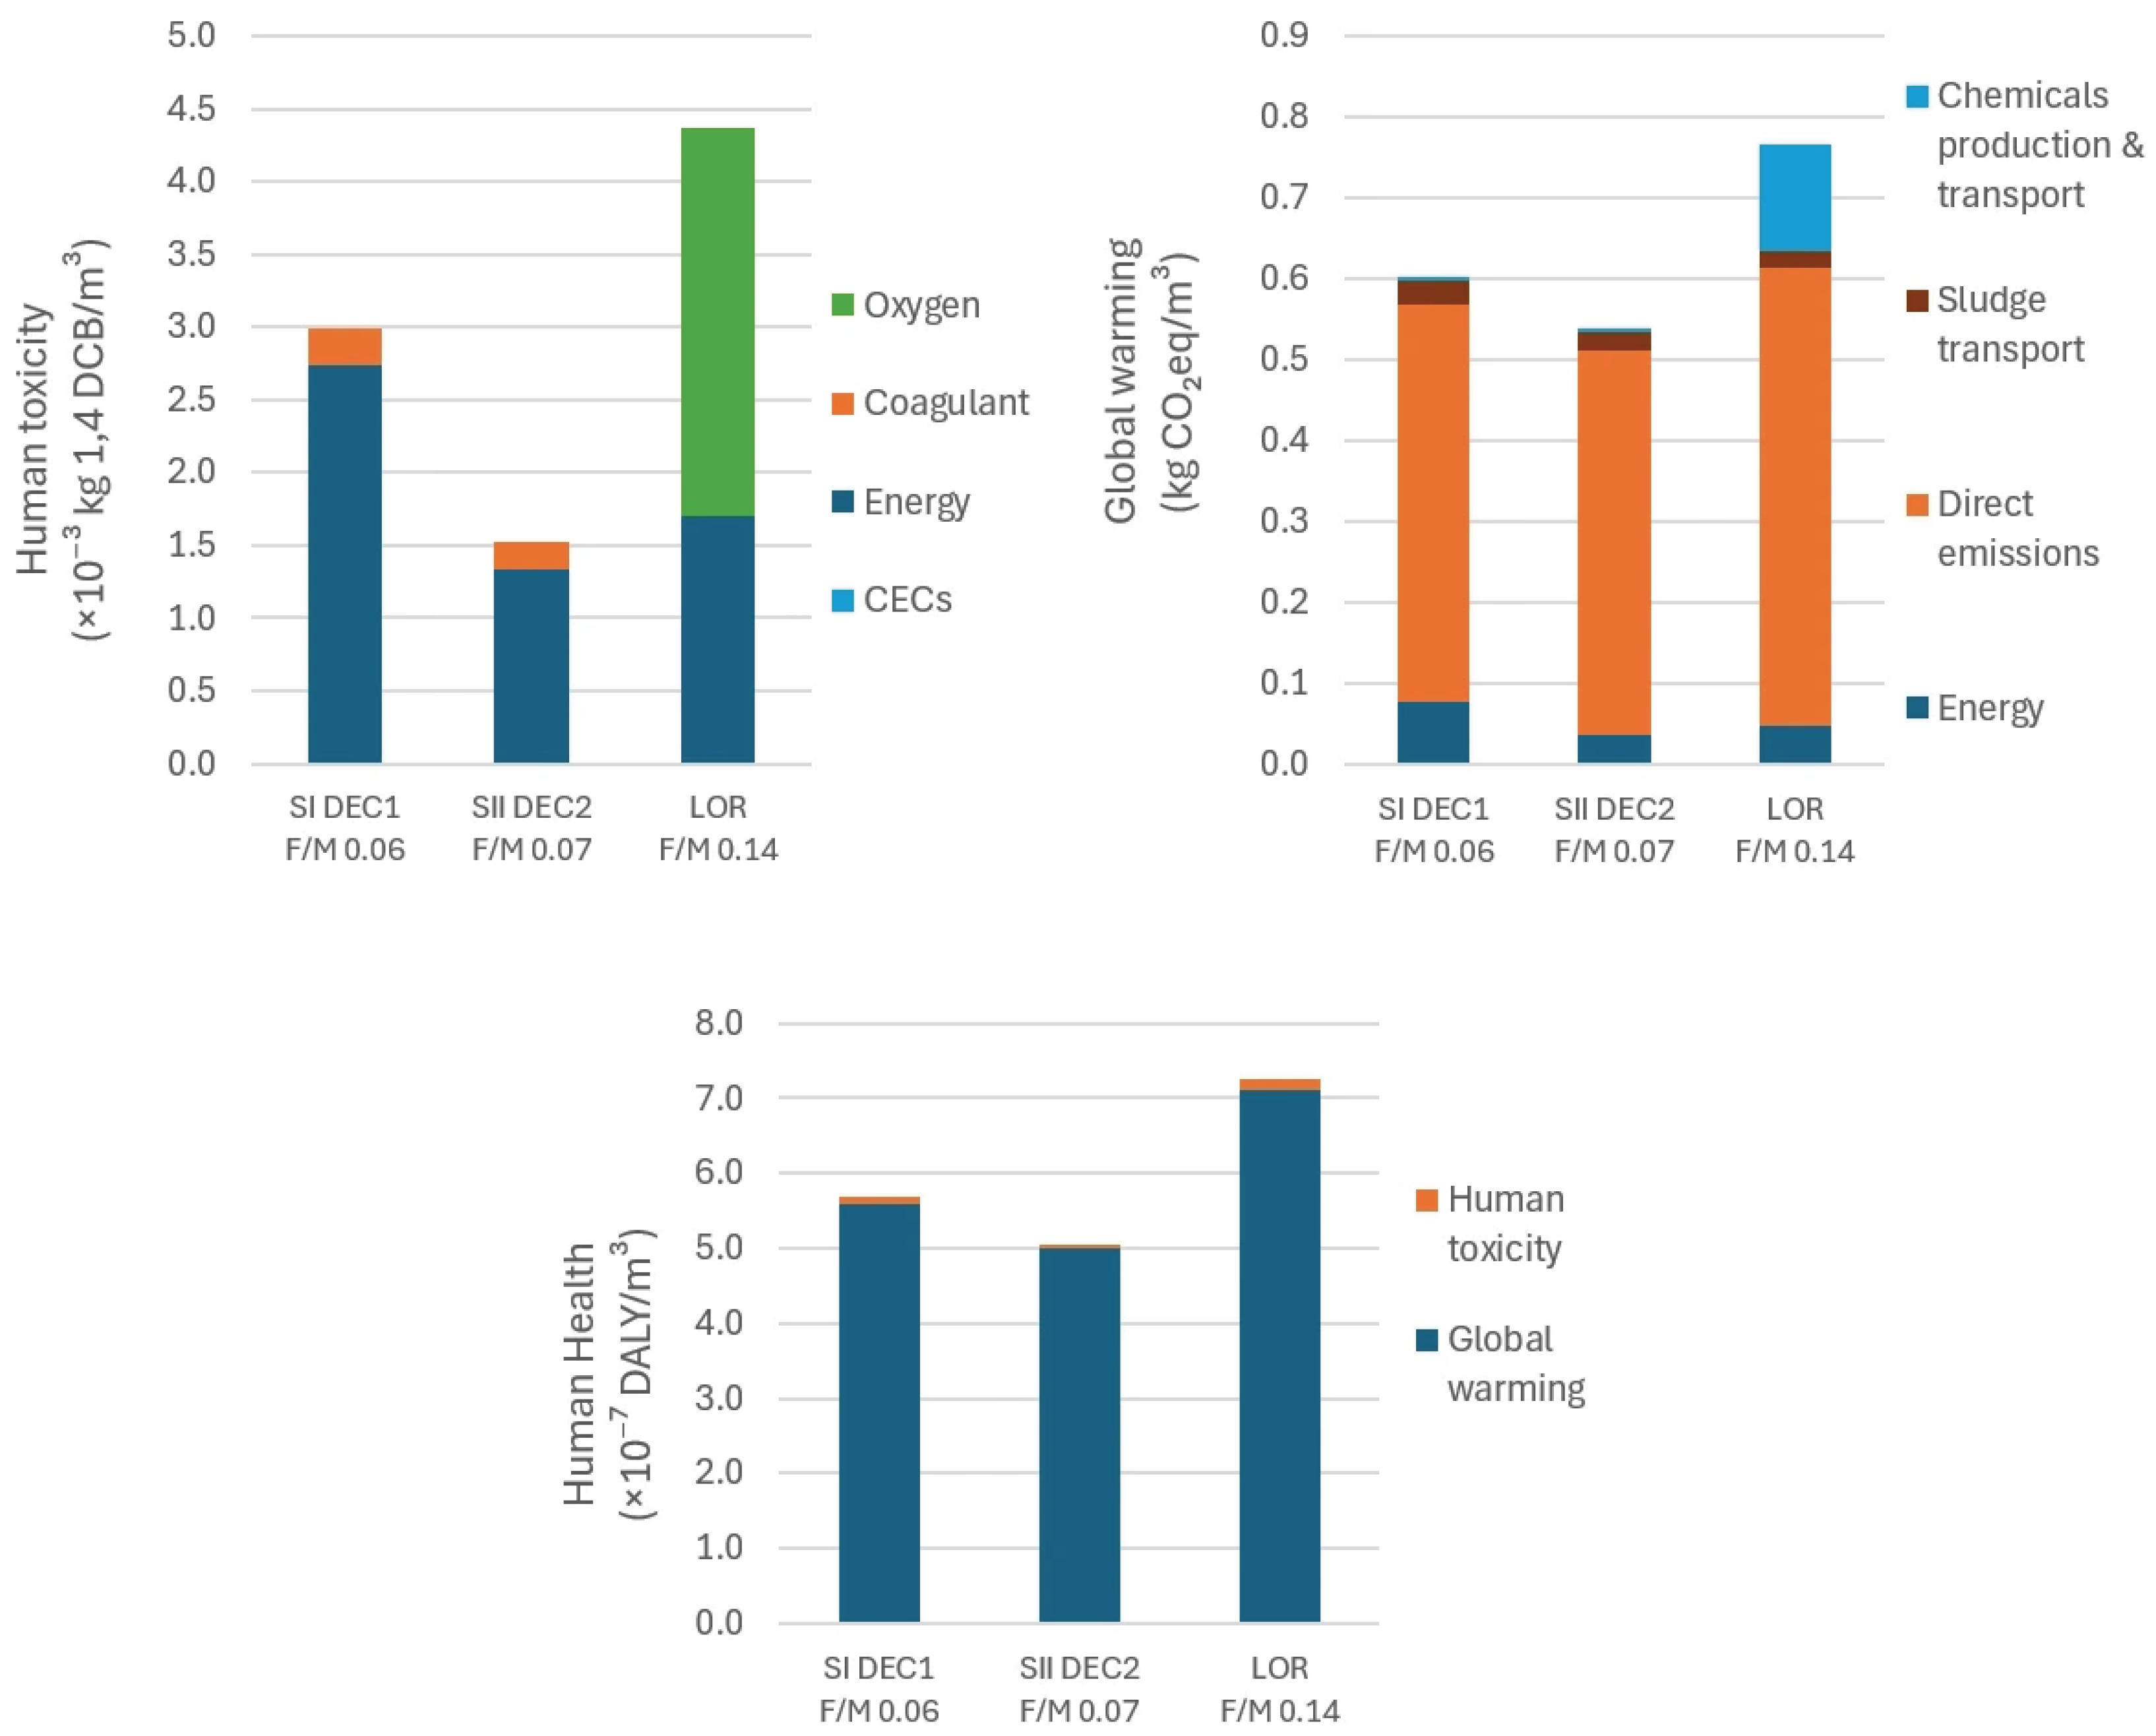
The contribution of the different inputs and outputs to each impact category at the midpoint and endpoint levels was also analyzed in Figure 6 and Figure 7 for three AS lines, one of each WWTP. The midpoint categories are as follows:
Figure 6.
Contribution of the different inputs and outputs to each impact category of human health illustrated for SI (F/M = 0.06 d−1), SII (F/M = 0.07 d−1), and LOR (F/M = 0.14 d−1).
Figure 7.
Contribution of the different inputs and outputs to each impact category of freshwater ecosystems illustrated for SI (F/M = 0.06 d−1), SII (F/M = 0.07 d−1), and LOR (F/M = 0.14 d−1).
- Human toxicity: The largest impact comes from energy consumption in SI and SII and from oxygen consumption in LOR. The differences between WWTPs reflect plant-specific characteristics, including the aeration system: SI biological treatment (EA-PFRs with mechanical aerators) consumes around twice the energy of SII (ODs with air diffusers), which is slightly below the LOR consumption. CECs discharged and coagulant consumption have minor impacts (Figure 6).
- Freshwater eutrophication: The impact is dominated by nitrogen and phosphorus emissions, followed by COD, while energy consumption is not expressive (Figure 7).
- Freshwater ecotoxicity: The primary contributors are by far CEC emissions into the receiving waters, especially in SII, which presents the lower removals of the studied CECs. The energy consumption in the three lines, the coagulant consumption in SI and SII, and the oxygen consumption in LOR represent minor impacts (Figure 7).
The endpoint categories are as follows:
- Human health: The impact is mainly driven by global warming (from direct GHG emissions, as explained above). The LOR biological treatment line has the highest value of DALY/m3, reflecting the higher direct GHG emissions (Figure 6).
- Freshwater ecosystems: The most significant contributor by far is freshwater eutrophication, whereas freshwater ecotoxicity and global warming are almost negligible. Thus, in this category, the impact is mainly due to nitrogen and phosphorus emissions, followed by COD emissions (Figure 7).
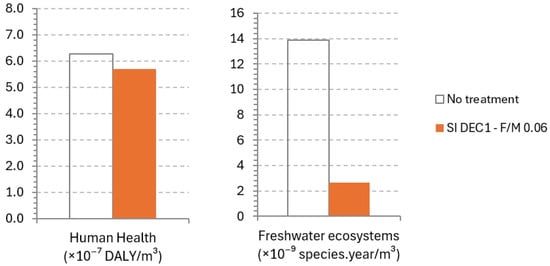
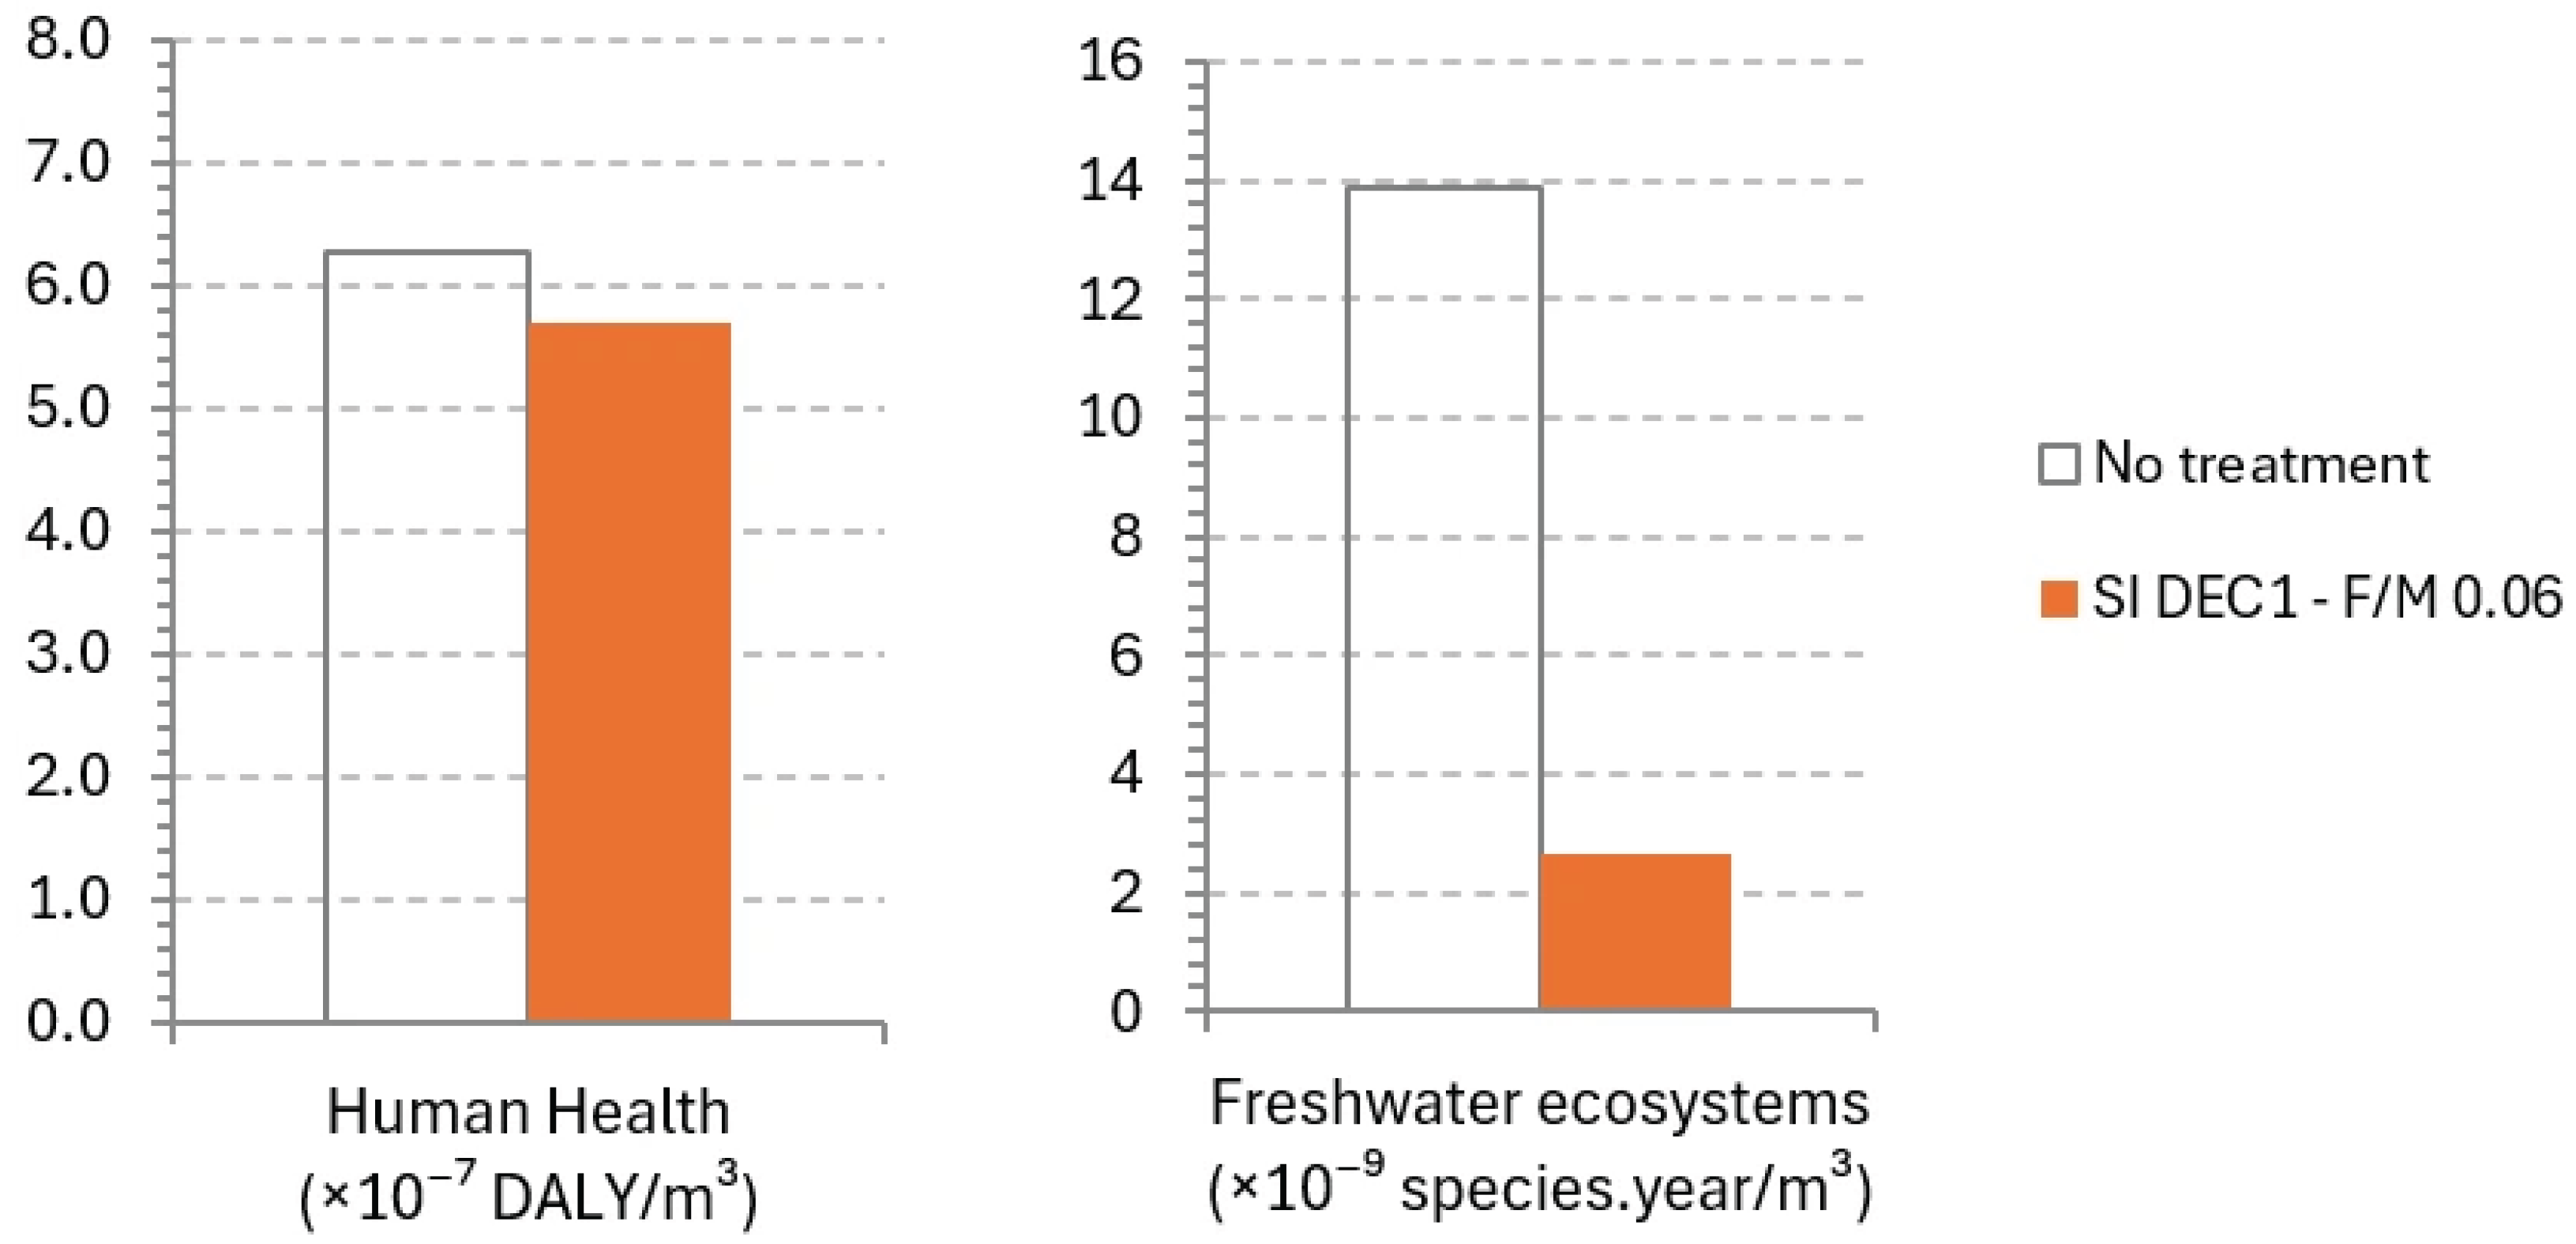
An analysis was also made regarding the impact of discharging wastewater without treatment on human health and on freshwater ecosystems. Discharging untreated wastewater results in higher impact to human health, as shown in Figure 8. Treatment substantially reduces this impact by nearly 11% due to the reduction in the direct GHG emissions in wastewater discharge. The impact on freshwater ecosystems is drastically reduced through wastewater treatment. Namely, the untreated discharges show a potential impact nearly five times higher than treated effluents and this is due to freshwater eutrophication.
Figure 8.
The impact of discharging wastewater without treatment on human health and freshwater ecosystems illustrated for SI (F/M = 0.06 d−1).
4.2. Nitrification Campaigns
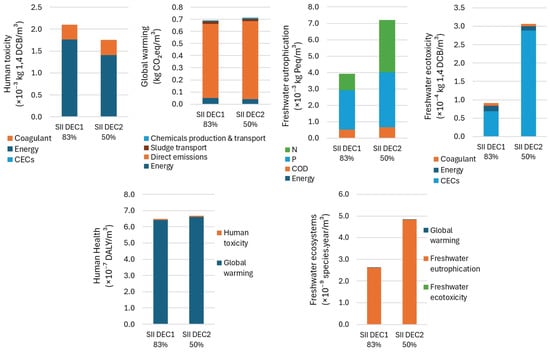
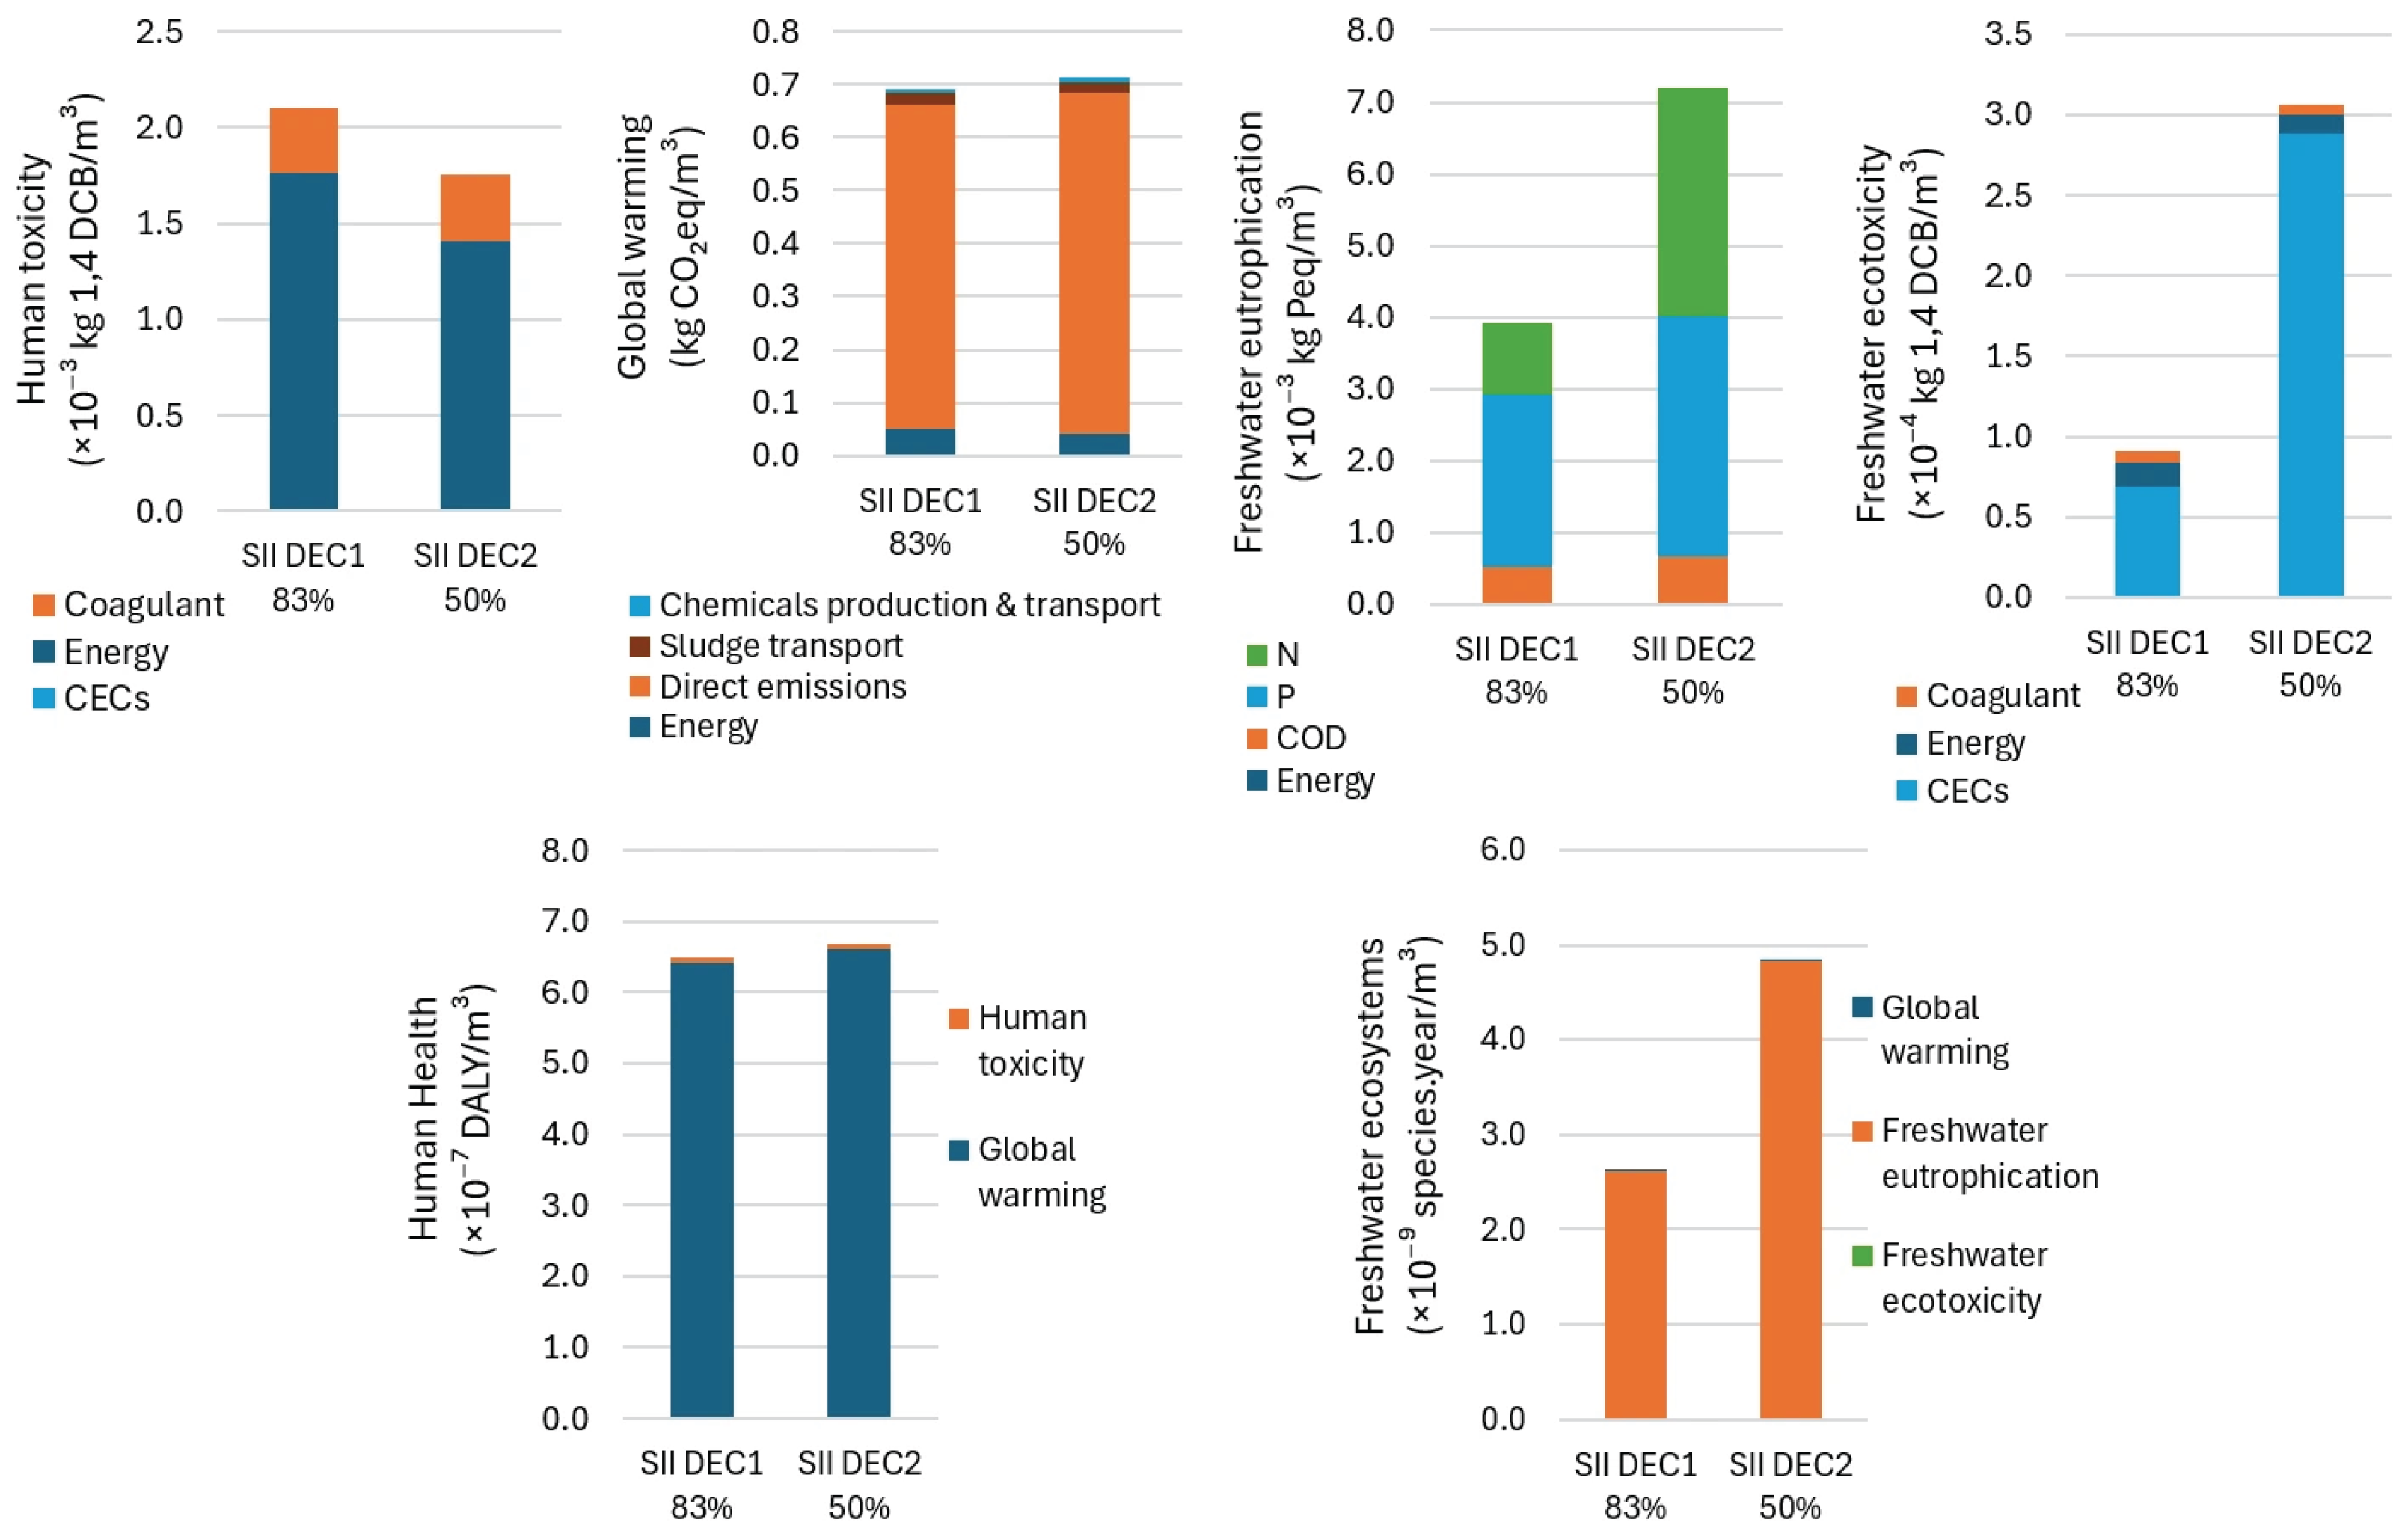
The results of the impact assessment of each nitrification condition tested in SII WWTP (ODs with air diffusors) were structured into midpoint and endpoint categories and expressed per volume (m3) of treated wastewater. The COD mass removed per treated volume was similar for the two nitrification conditions (0.79 and 0.77 kg COD/m3, respectively; Table S2). As illustrated in Figure 9, the AS line with lower nitrification (50% NH4+ removal; 64% Nt removal) consistently shows higher impacts than the AS line with higher nitrification (83% NH4+ removal; 88% Nt removal) for all categories except human toxicity, and this impact is particularly higher on freshwater ecotoxicity and freshwater eutrophication. The translation from midpoint to endpoint reveals the cumulative burden of pollution and emissions, especially visible on freshwater ecosystems due to freshwater eutrophication.
Figure 9.
Contribution of the different inputs and outputs to each impact category of Human health and Freshwater ecosystems illustrated for each nitrification condition tested in SII WWTP: 83% NH4+ and 88% Nt removal (line 1), and 50% NH4+ and 64% Nt removal (line 2). Complete inventory data are provided in Table S2.
The contribution of the different inputs and outputs to each impact category at the midpoint and endpoint levels are also analyzed in Figure 9. The midpoint categories are as follows:
- Human toxicity: The largest impact comes from energy consumption, and the differences between the two lines rely on the nitrification conditions. Line 1, with higher NH4+ removal, consumes ca. more 20% energy than line 2. CEC emissions and coagulant consumption have minor impacts.
- Global warming: As discussed earlier regarding the F/M campaigns, direct GHG emissions of treatment and discharge are by far the largest contributor, followed by energy consumption. Line 2, with higher nitrogen concentration in the discharge, shows the higher impact. Sludge transport and the production of coagulant are minor contributors.
- Freshwater eutrophication: The impact is dominated by nitrogen and phosphorus emissions, followed by COD, while energy consumption is not expressive.
- Freshwater ecotoxicity: The primary contributor is CEC emissions into the receiving waters, especially in line 2, which presents the lower CEC removal, associated with lower nitrification. Energy consumption and the coagulant consumption represent minor impacts.
The endpoint categories are as follows:
- Human health: The impact is mainly driven by global warming (from direct emissions, as explained above). Line 2 has slightly higher DALY value, reflecting the higher direct emissions.
- Freshwater ecosystems: The most significant contributor by far is freshwater eutrophication, whereas freshwater ecotoxicity and global warming are almost negligible. Thus, in this category, the impact is mainly due to nitrogen and phosphorus emissions, followed by COD emissions.
4.3. Ozonation Campaigns
The results of the impact assessment of each ozone dose in LOR WWTP were also structured into the midpoint and endpoint categories and expressed per volume (m3) of treated wastewater. As ozonation is not designed to (and does not) remove the nutrients or organic compounds responsible for eutrophication and direct emissions in the discharge (as shown by the influent and effluent concentrations in Table S3), the freshwater eutrophication category and the direct emissions of the global warming category were excluded from the LCA.
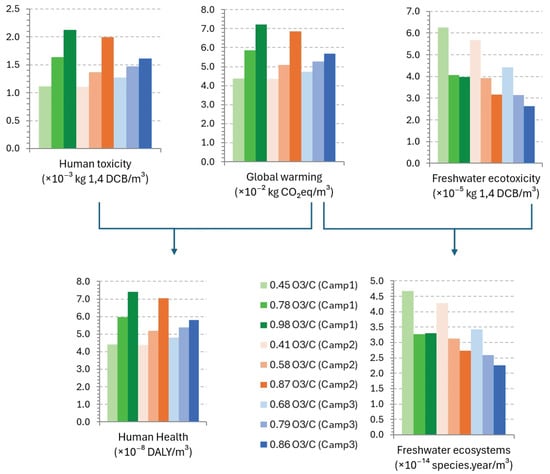
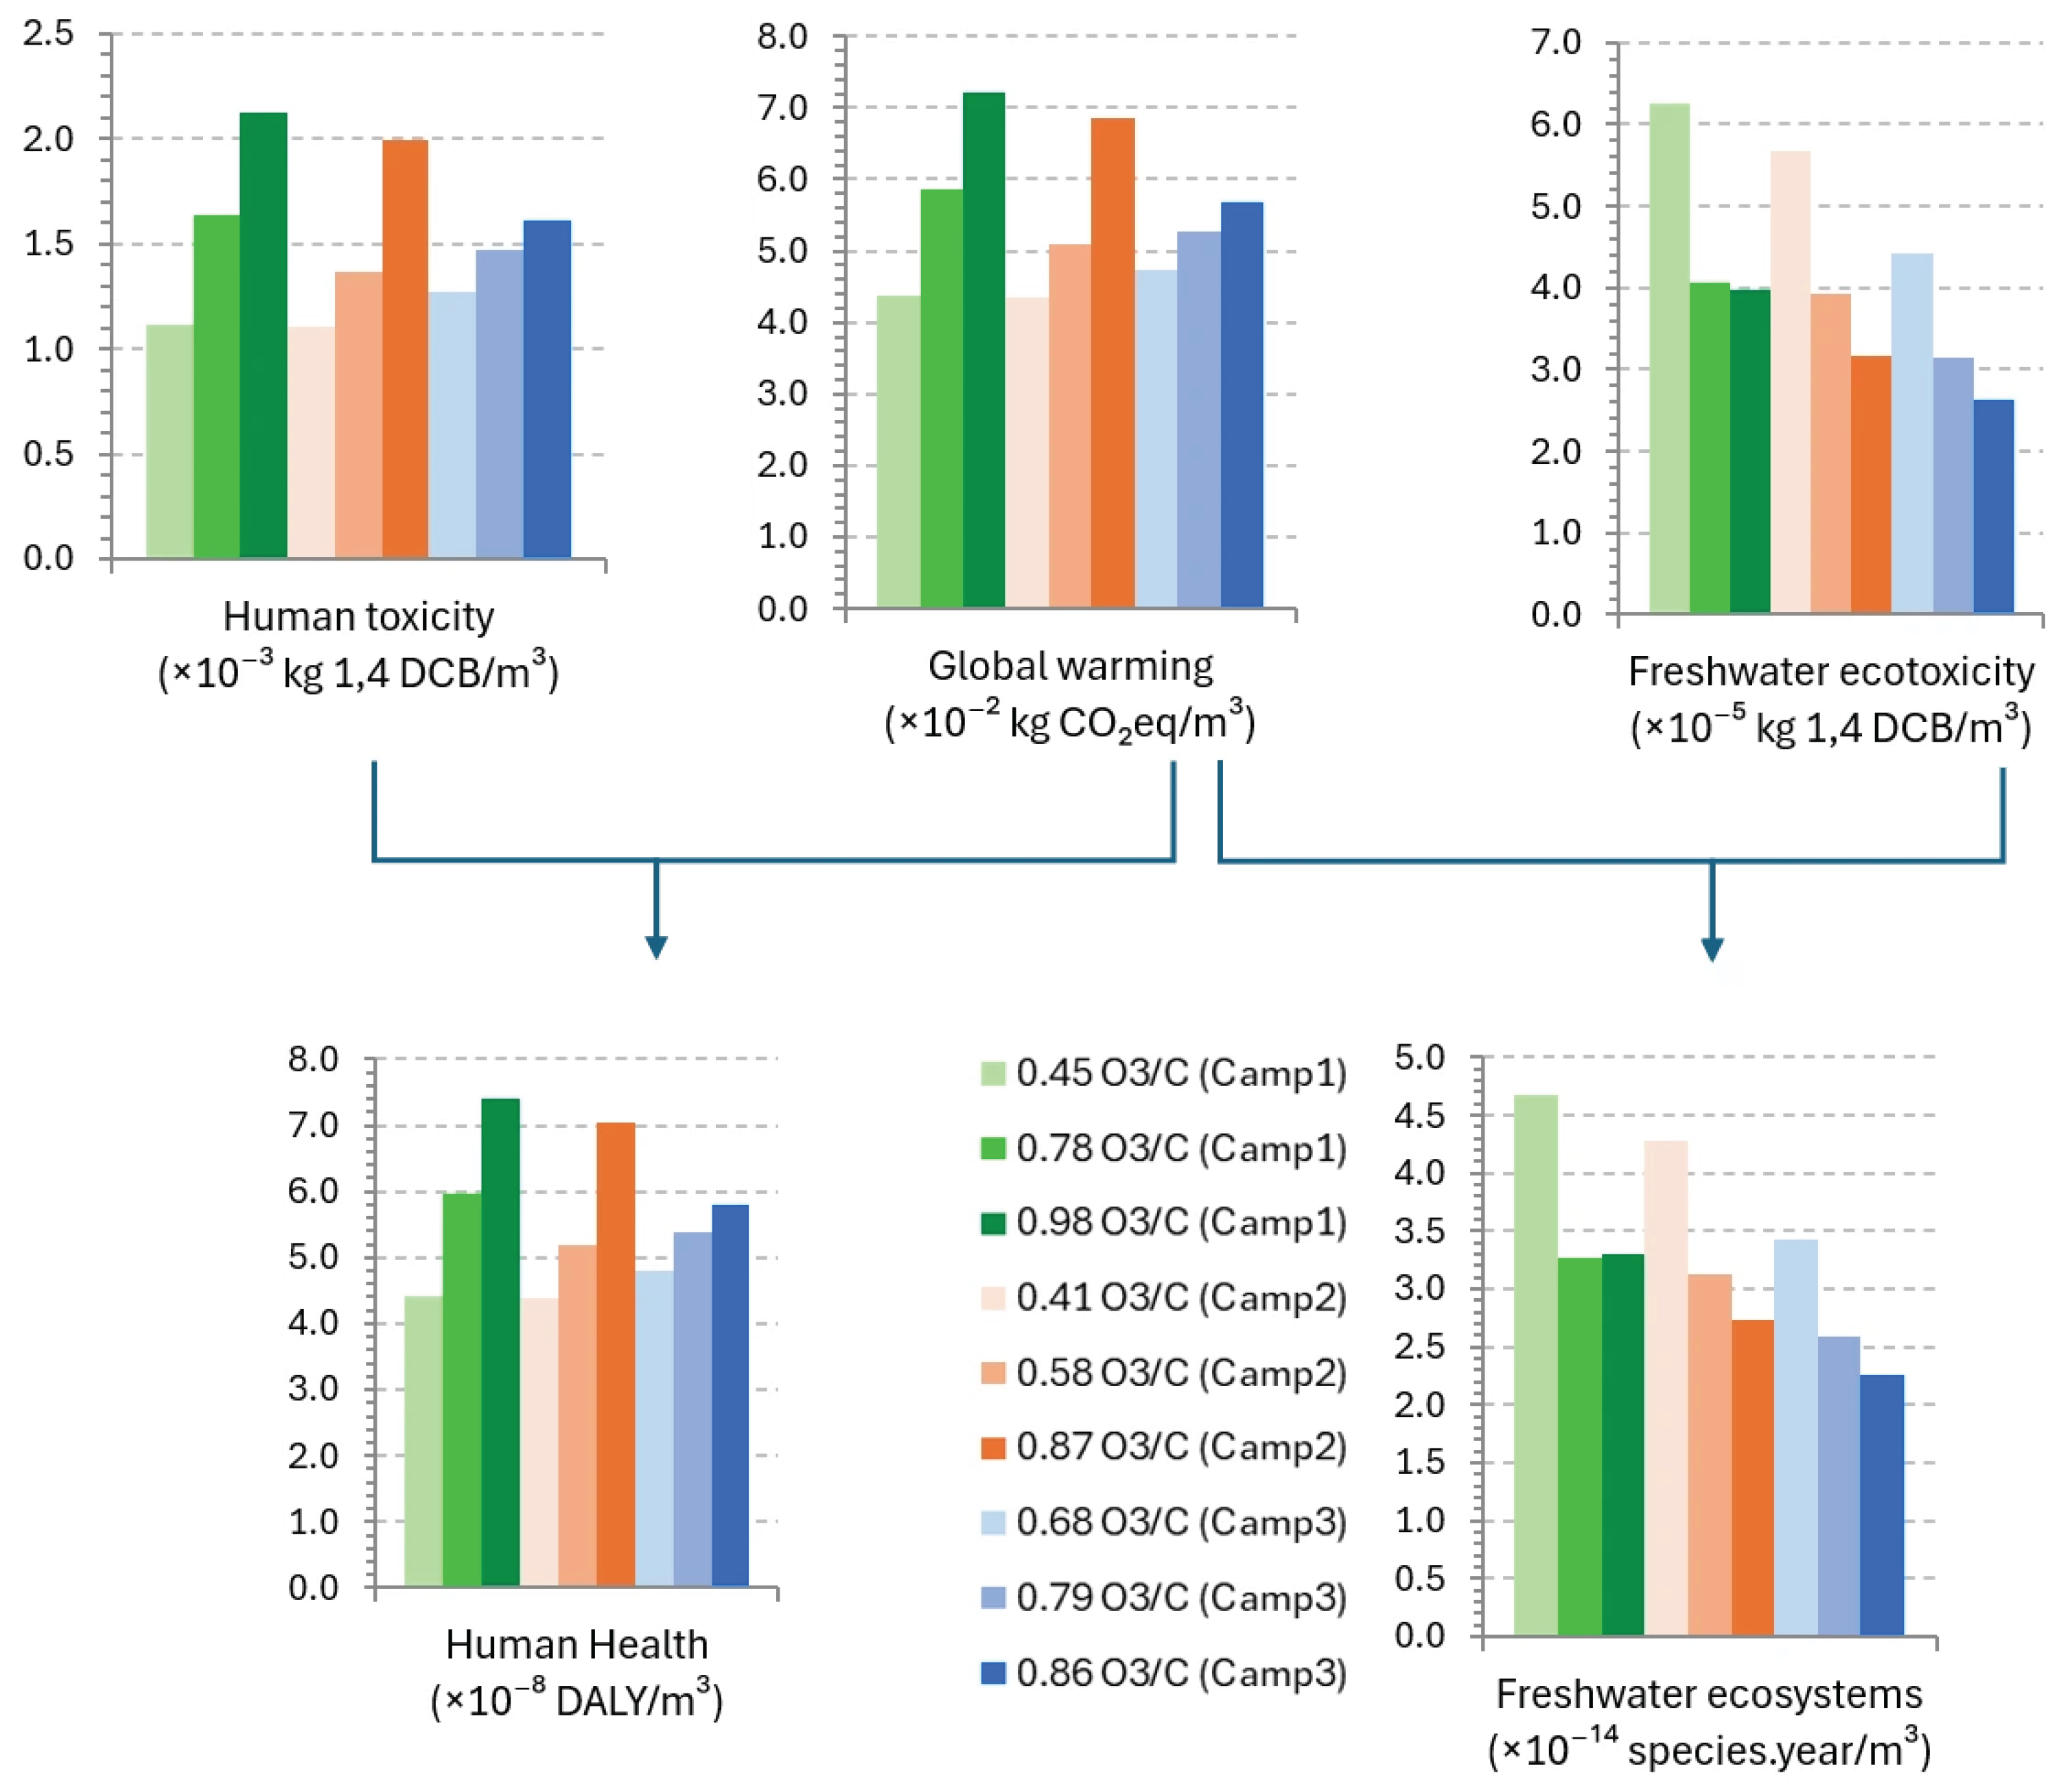
As illustrated in Figure 10, higher ozone doses consistently show the highest impact on human toxicity and global warming, whereas lower ozone doses show the highest impact on freshwater ecotoxicity. The translation from midpoint to endpoint indicators reveals the cumulative burden of pollution and emissions, as reflected by a higher impact on human health at higher doses, which correspond to the stronger midpoint impacts on human toxicity and global warming. In contrast, the highest impact on freshwater ecosystems is observed at the lowest doses.
Figure 10.
LCA results of midpoint and endpoint impact categories for the nine organic-carbon-normalized ozone doses tested in the three LOR ozonation campaigns (0.41–0.98 mgO3/mgC). Complete inventory and water-quality data are provided in Table S3.
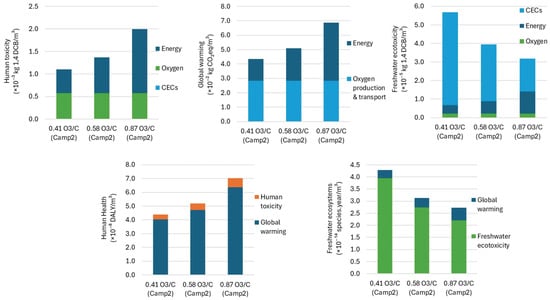
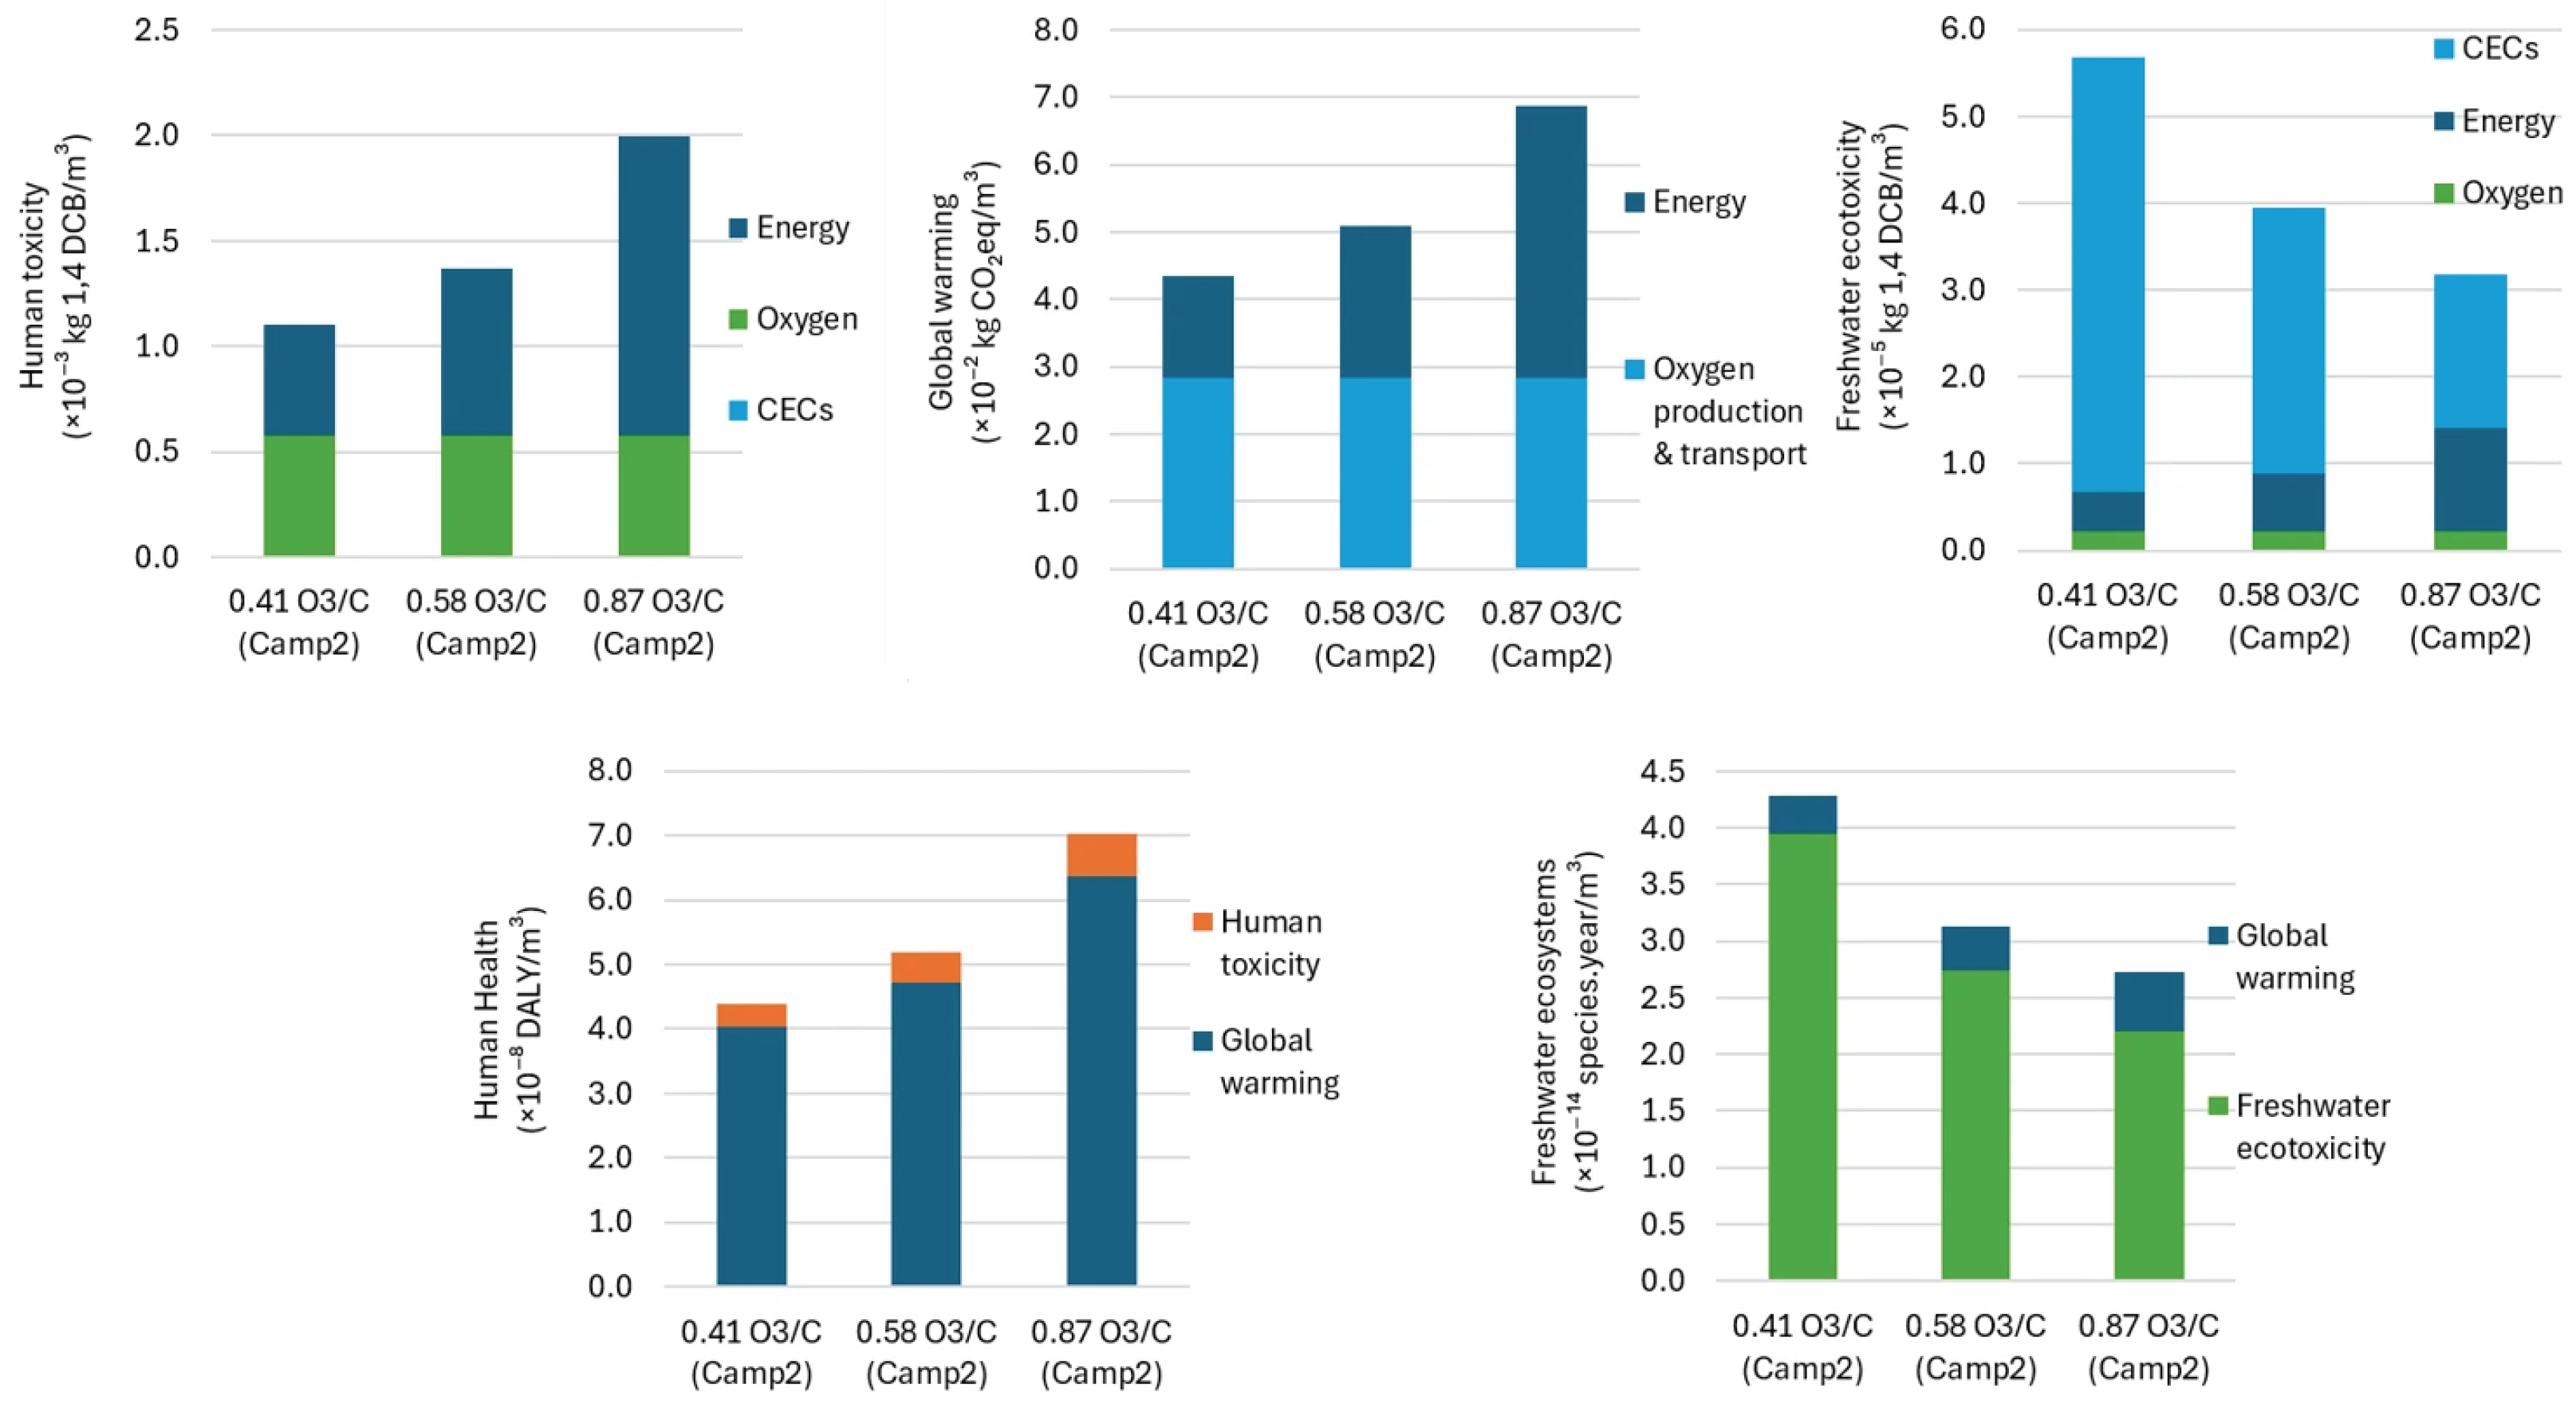
Figure 11 illustrates the contribution of the different inputs and outputs to each impact category at the midpoint and endpoint levels for three ozone doses in one campaign. The midpoint categories are as follows:
Figure 11.
Contribution of the different inputs and outputs to each impact category of human health and freshwater ecosystems, illustrated for the three ozone doses tested in LOR WWTP (0.41, 0.58 and 0.87 mgO3/mgC; Campaign 2). Complete operating and water-quality conditions are provided in Table S3.
- Human toxicity: Increases progressively with the ozone dose, mainly due to energy consumption. Oxygen consumption has constant impact that is lower than energy. CEC emission has a negligible impact.
- Global warming: Increases with increasing ozone dose due to increasing energy consumption. Oxygen production and transport have constant impacts higher than energy consumption for lower ozone doses.
- Freshwater ecotoxicity: The primary contributor is CEC emission, particularly at the lower dose, which presents lower CEC removal. Energy consumption leads to lower impacts for lower doses and higher impacts for higher doses, while the impact of oxygen consumption is constant.
Analyzing the endpoint categories:
- Human health: The impact is mainly driven by global warming, from energy consumption and oxygen production and transport.
- Freshwater ecosystems: The dominant contributor is freshwater ecotoxicity. Thus, in this category, the impact is mainly due to CEC removal.
4.4. AS Treatment and Ozonation
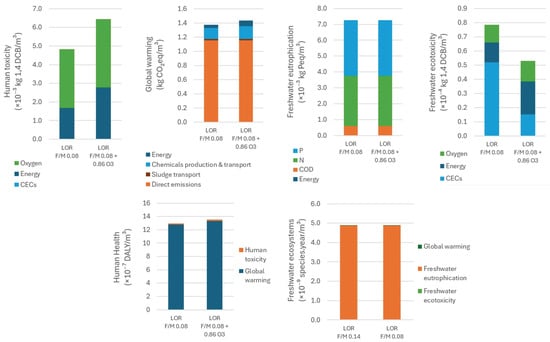
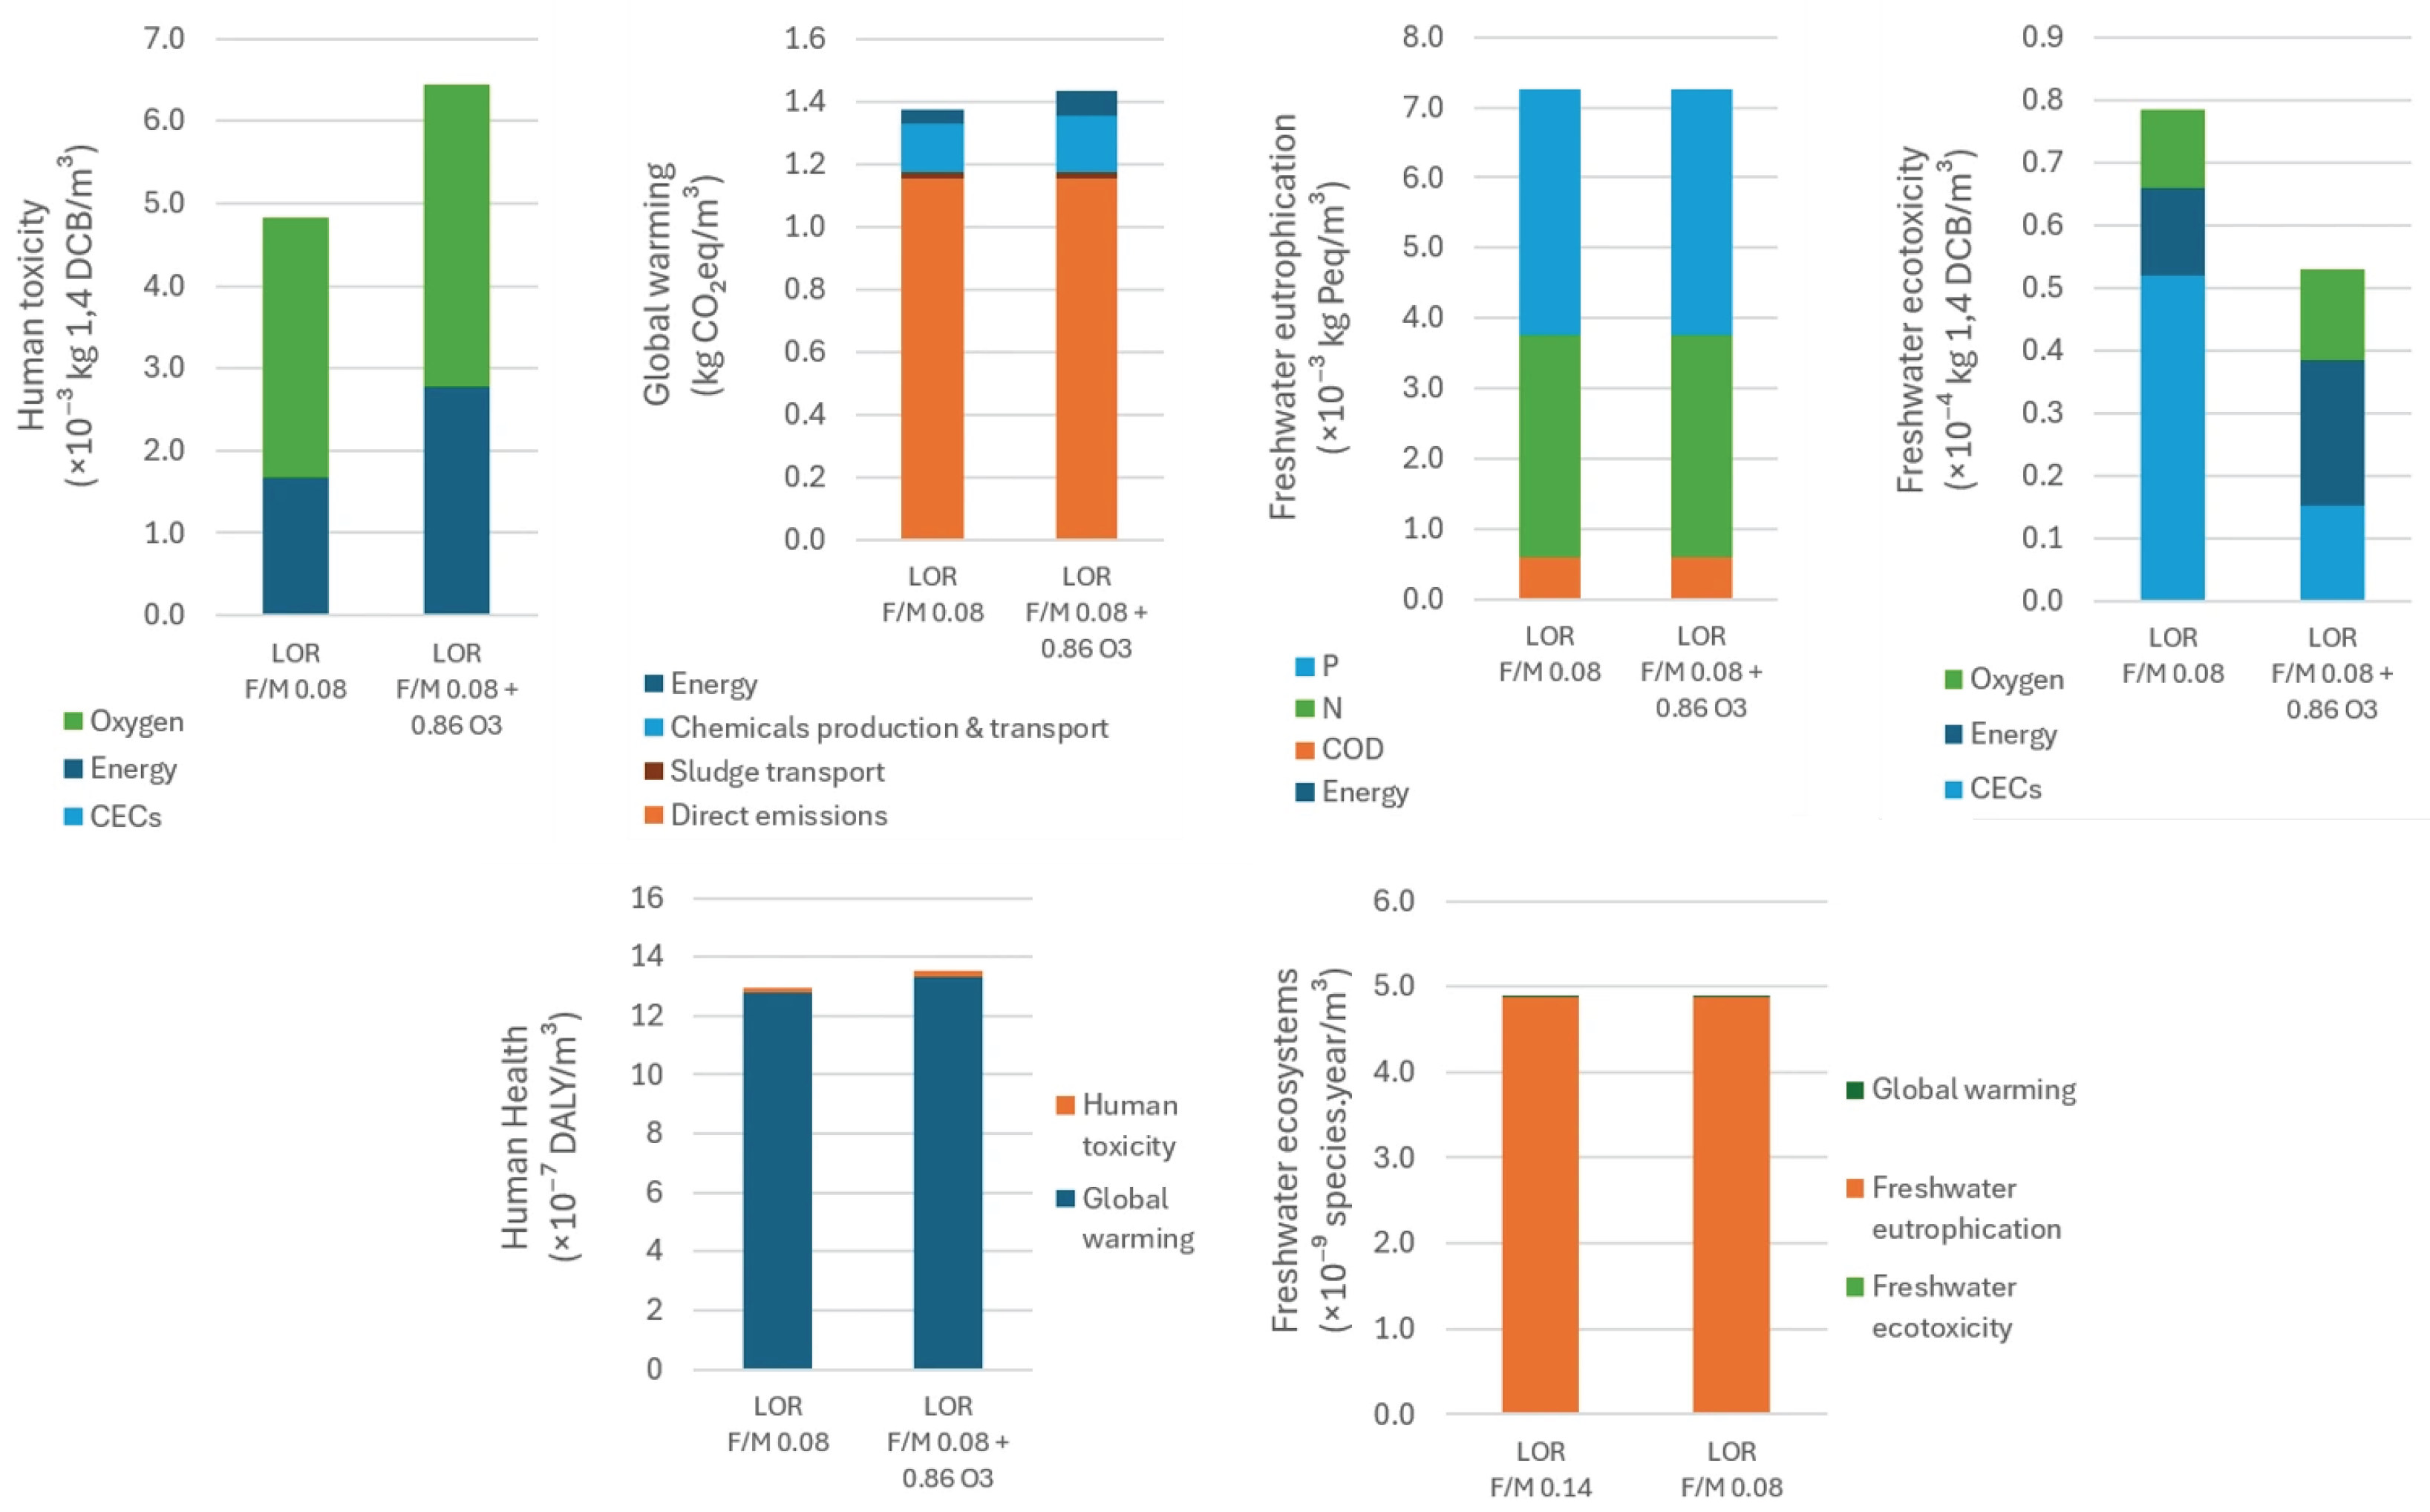
Figure 12 shows the impact of ozonation in Lordelo WWTP, which integrates two barriers: AS treatment and ozonation. The results of the third ozonation campaign were used, which correspond to a 0.08 d−1 of F/M and a normalized dose of 0.86 mgO3/mgC. As expected, ozonation increases the impact on human toxicity and slightly increases the impact on global warming due to higher energy and ozone consumption. It has no impact on freshwater eutrophication. In turn, ozonation decreases freshwater ecotoxicity due to the higher removal of CECs, despite the higher energy consumption. Consequently, while ozonation has a slight impact on human health, it has no impact on freshwater ecosystems due to the higher weight of freshwater eutrophication in this category.
Figure 12.
Contribution of the different inputs and outputs to each impact category of human health and freshwater ecosystems for LOR AS (F/M of 0.08 d−1) alone and with ozonation (0.86 mg O3/mg C). Complete operating and water-quality conditions are provided in Tables S1 and S3.
4.5. Comparative Cost Analysis
4.5.1. AS Treatment
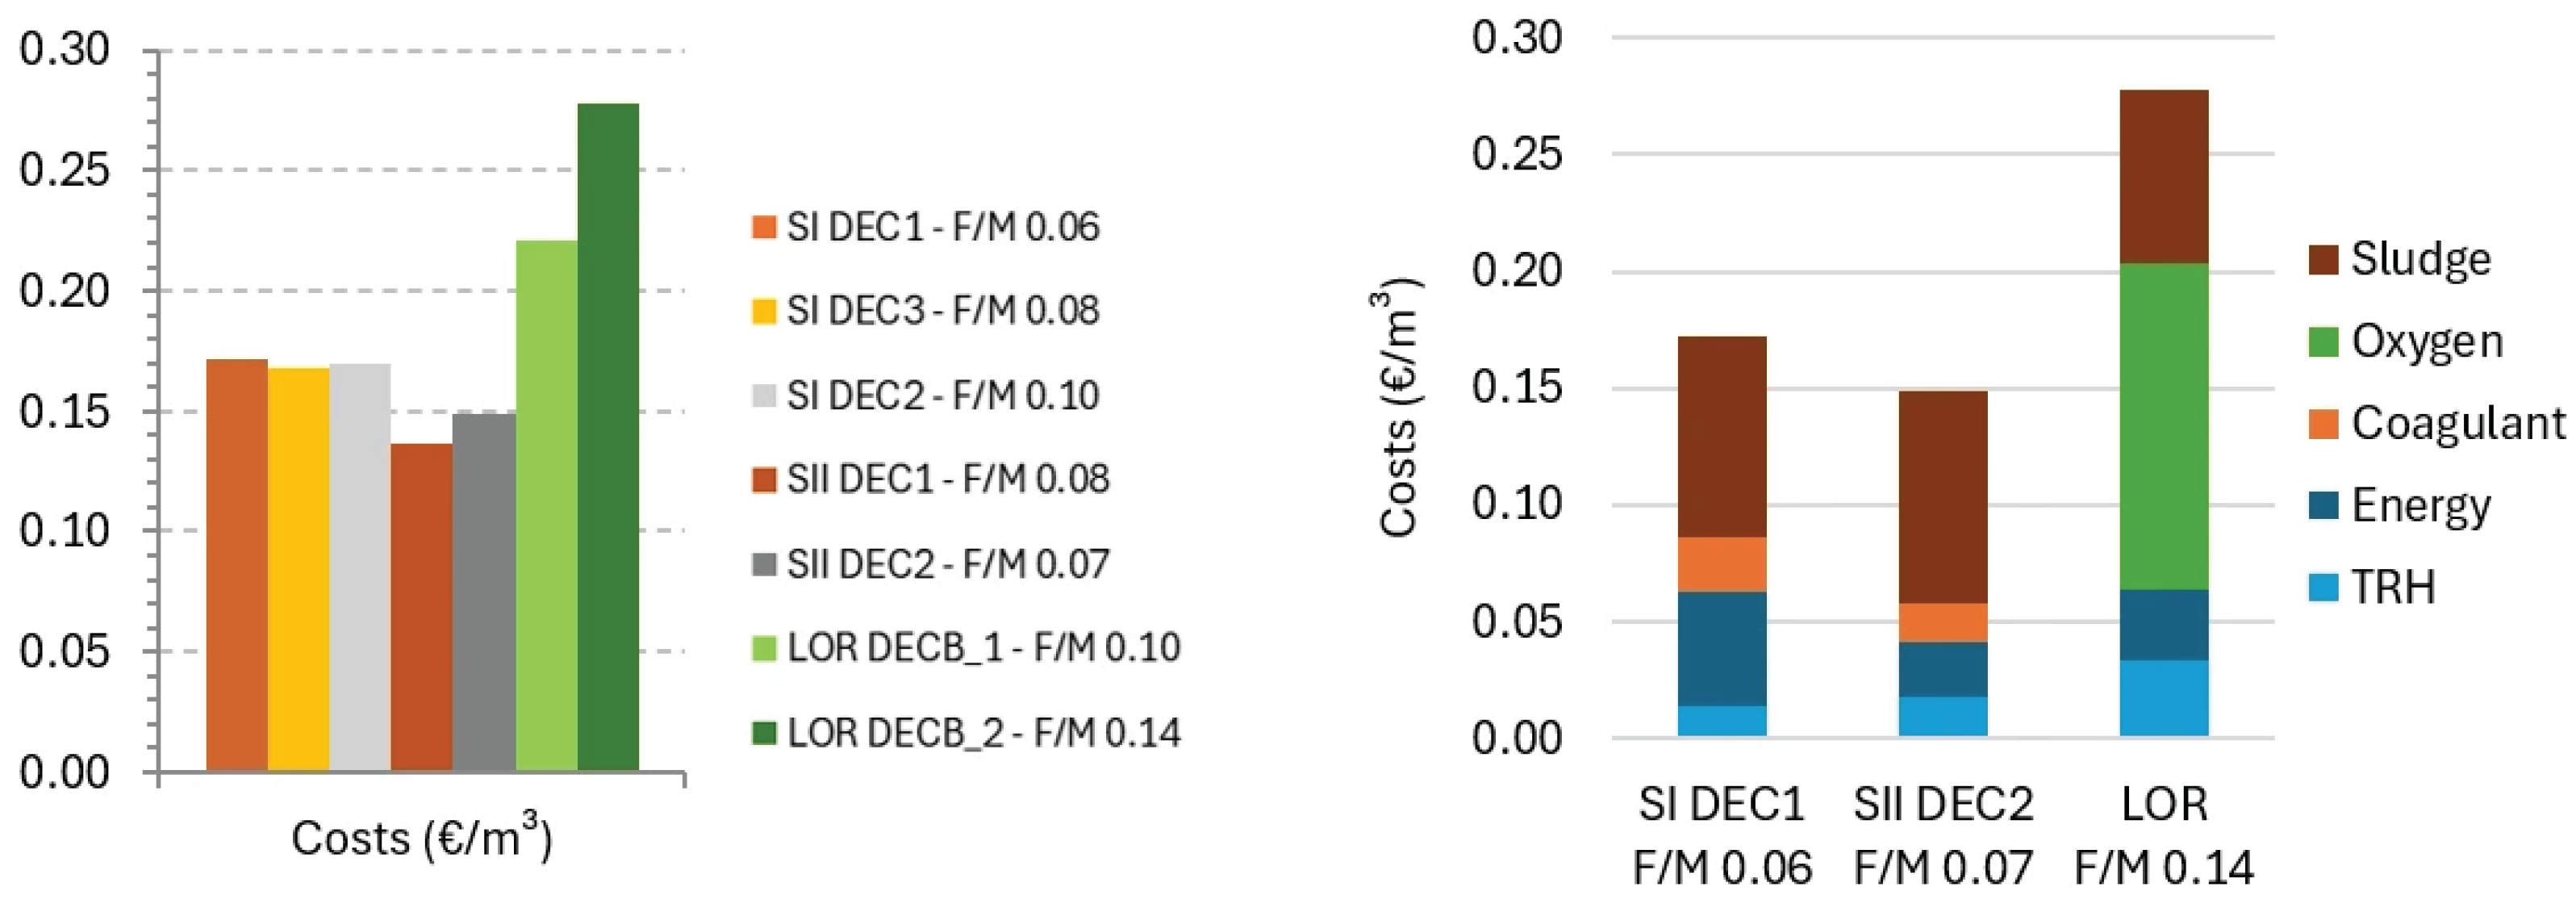
The OPEX of each treatment line in the F/M campaigns and their breakdown by expenditure category are illustrated in Figure 13 (left and right, respectively). The results show lower OPEX in SII (0.14–0.15 €/m3) than in SI (0.17 €/m3), given the lower costs with energy, whereas LOR presents the higher OPEX (0.22–0.28 €/m3) due to the use of oxygen (Figure 13, left). In SI and SII, the main share of OPEX is associated with sludge disposal (50% and 61%, respectively), followed by energy consumption (29% and 16%, respectively), whereas coagulant and discharge fee costs (TRH) have lower shares. In LOR, OPEX is mainly (50%) due to oxygen dosing, followed by sludge disposal (27%), and energy and discharge fee costs show similar shares (Figure 13, right). In LOR, higher F/M (0.14 vs. 0.10 d−1) was associated with higher OPEX due to higher oxygen and sludge costs, while in SI, the F/M ratio in the tested range (0.06–0.10 d−1) showed no clear effect on OPEX (Figure 13, left).
Figure 13.
OPEX for the F/M conditions tested in SI (0.06–0.10 d−1), SII (0.07–0.08 d−1), and LOR (0.10–0.14 d−1) (left), and breakdown by expenditure category illustrated for one F/M condition in each WWTP (right). Complete operating and inventory data are provided in Table S1.
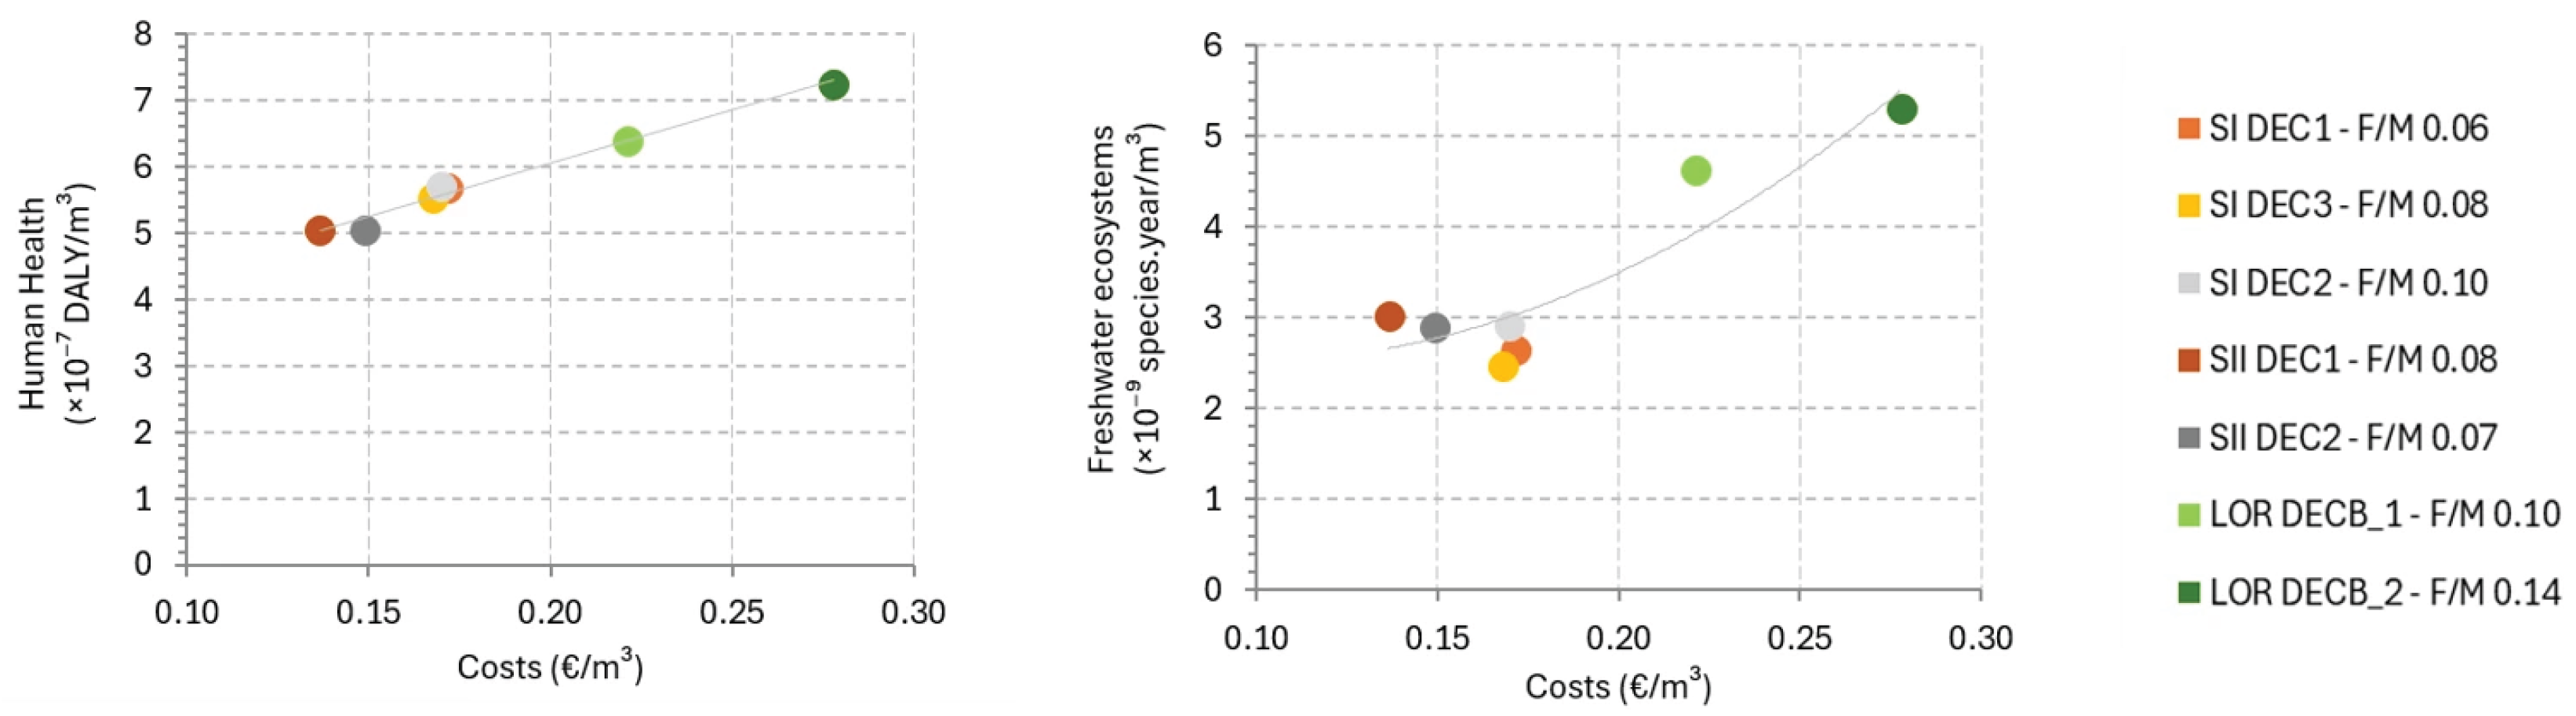
Figure 14 represents the impacts on human health and freshwater ecosystems from each AS treatment line in F/M campaigns as a function of the corresponding OPEX. The results show that the impact on human health increases with OPEX, following the trend SII < SI < LOR. The impact on freshwater ecosystems is higher for LOR WWTP, which also has the highest OPEX, whereas in Serzedelo, WWTPs SI has higher OPEX but a lower impact on freshwater ecosystems than SII. Across the treatment lines assessed, lower environmental impacts were not systematically associated with higher OPEX.
Figure 14.
Impacts on human health (left) and freshwater ecosystems (right) from each AS treatment line in F/M campaigns in SI (0.06–0.10 d−1), SII (0.07–0.08 d−1), and LOR (0.10–0.14 d−1) as a function of their OPEX per treated volume. Complete operating and inventory data are provided in Table S1.
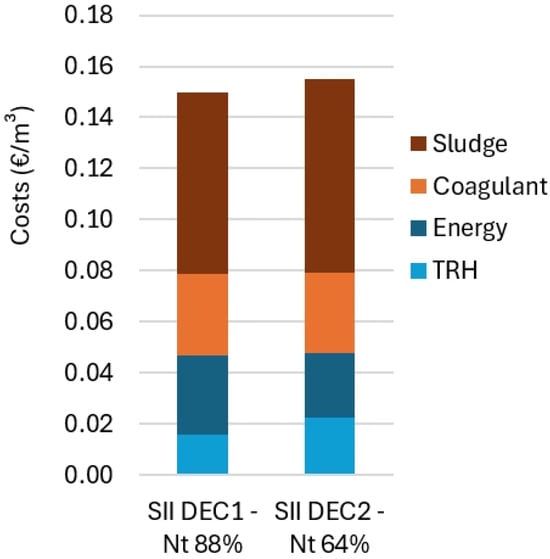
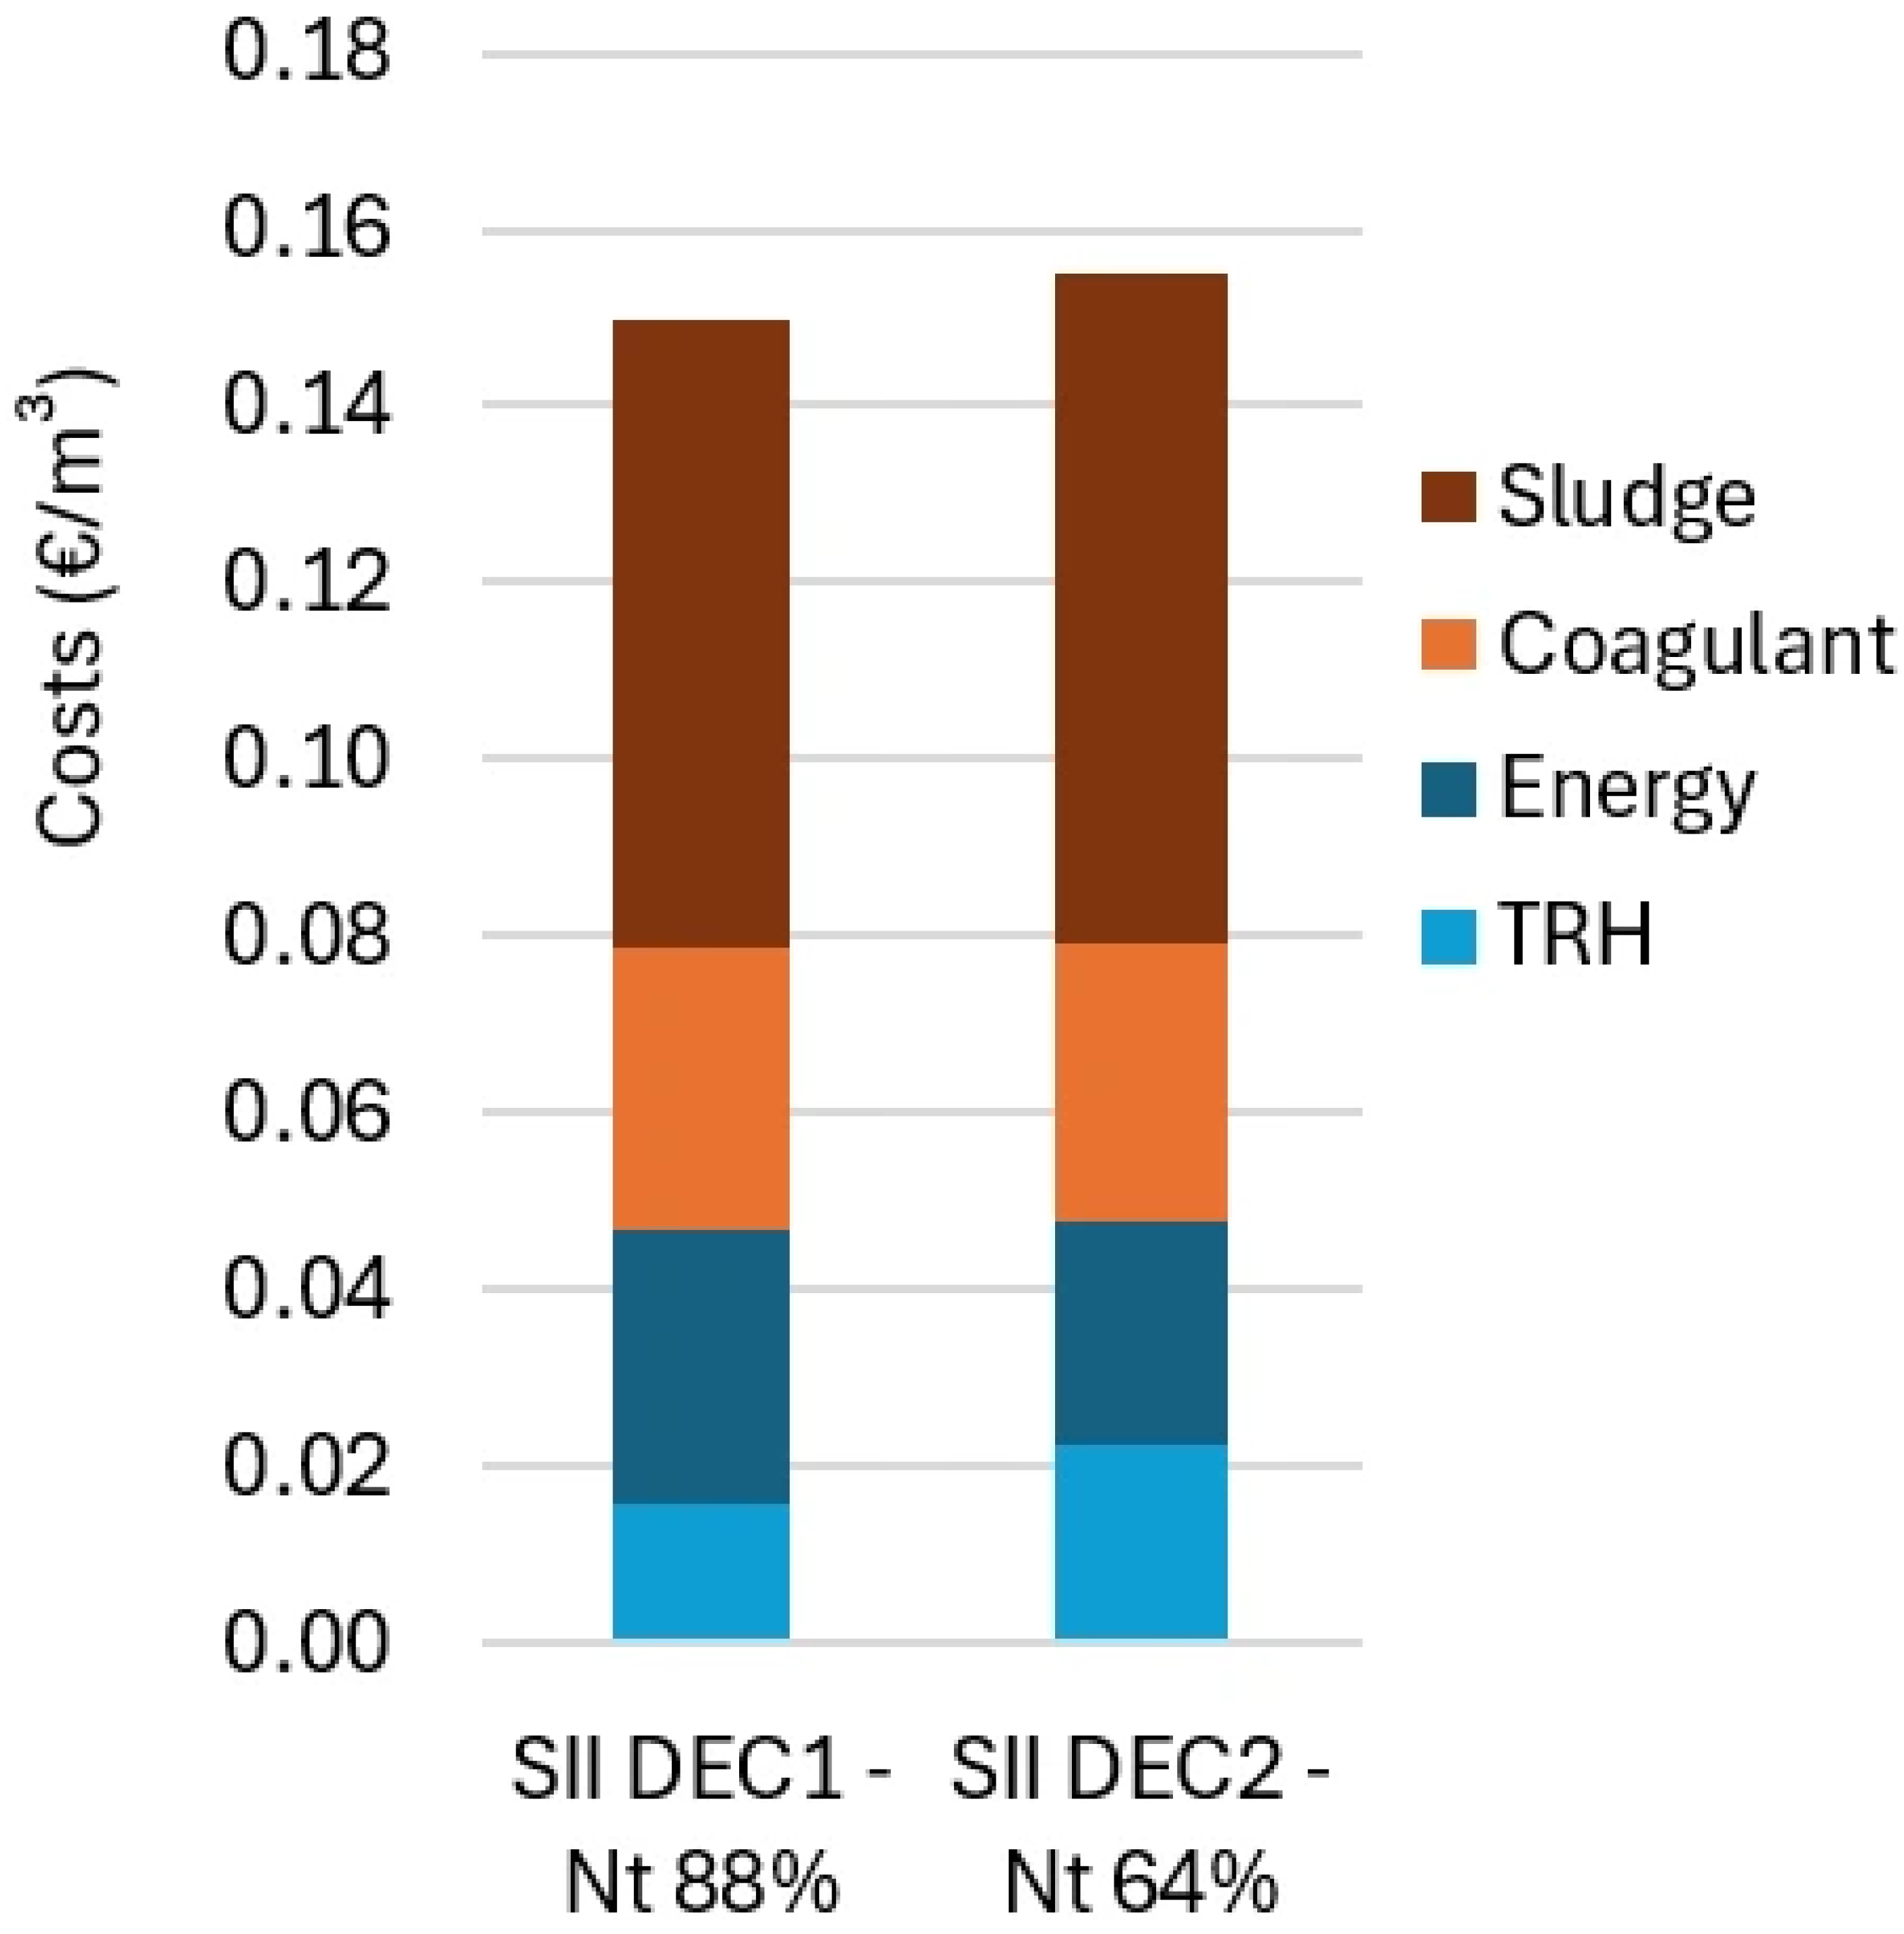
Figure 15 illustrates the OPEX values and breakdown by expenditure category (TRH, energy, coagulant, oxygen, sludge) in each treatment line in the nitrification campaigns. The results show that OPEX amounts to 0.150–0.155 €/m3 and is not impacted by Nt removal in the 64–88% range, i.e., the higher energy costs for higher nitrification are balanced by lower sludge and TRH costs. The main operation cost is due to sludge disposal (ca. 50%), followed by coagulant, energy, and TRH costs.
Figure 15.
OPEX values and breakdown by expenditure category for the two nitrification conditions tested in SII: 83% NH4+ and 88% Nt removal (line 1), and 50% NH4+ and 64% Nt removal (line 2). Complete operating and inventory data are provided in Table S2.
4.5.2. Ozonation
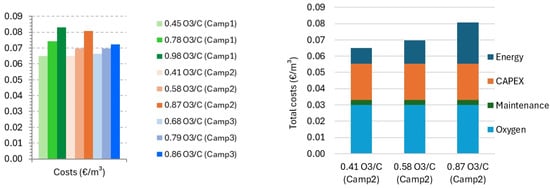
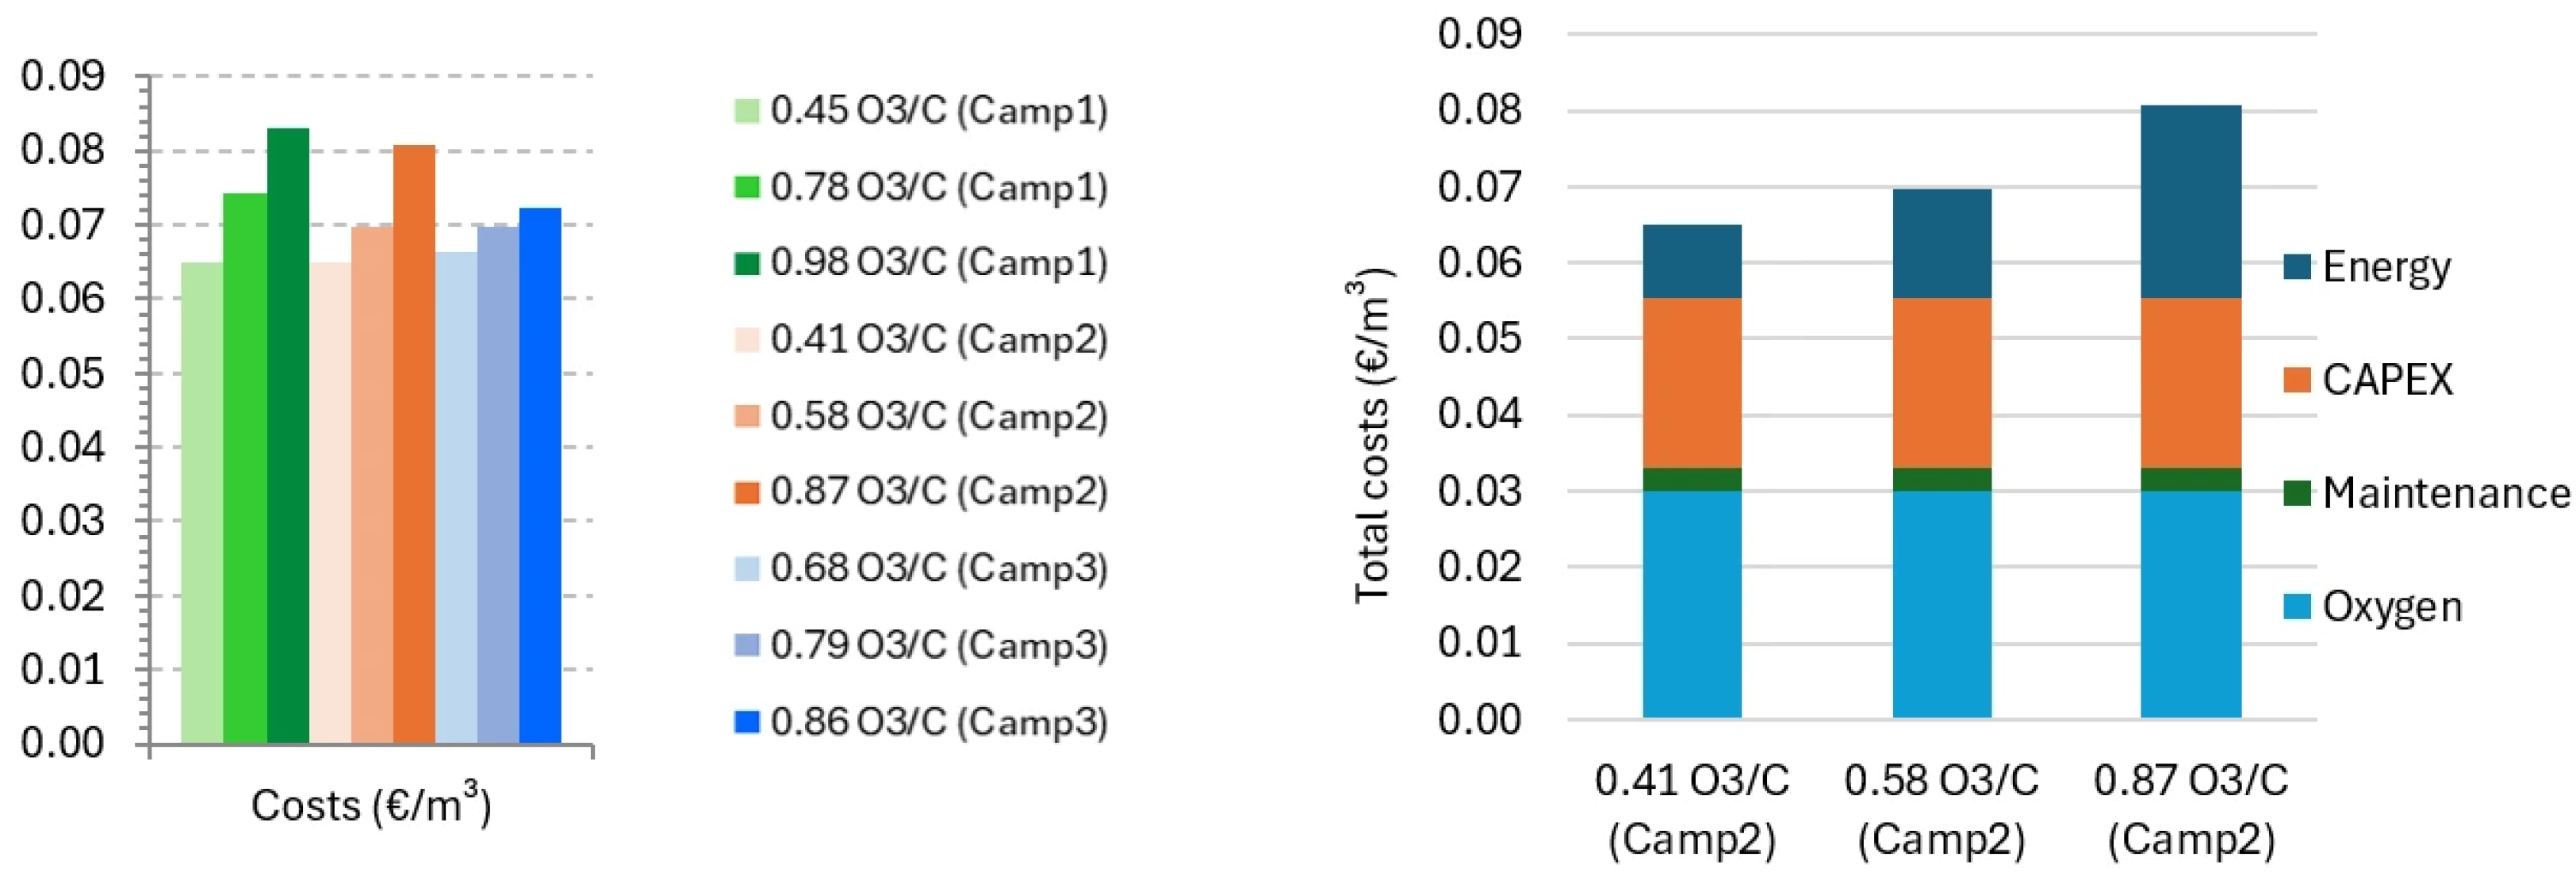
The total costs (annualized CAPEX and OPEX) of the nine ozone doses in the three ozonation campaigns and the breakdown by expenditure category (oxygen, energy, maintenance, and CAPEX) are illustrated in Figure 16. The results show that the total costs lie in the range 0.065–0.083 €/m3, in line with reported values [44], slightly increasing with the ozone dose (0.41–0.98 mgO3/mgC, which was changed by adjusting the ozone generation (energy) and keeping the oxygen constant). The oxygen dosing is responsible for 0.03 €/m3, being the major cost contributor (37–46%), followed by CAPEX with 0.02 €/m3, while the energy cost (0.01–0.02 €/m3) is a function of the ozone dose.
Figure 16.
Total costs (annualized CAPEX and OPEX) of the nine organic-carbon-normalized ozone doses tested in the three LOR ozonation campaigns (0.41–0.98 mgO3/mgC) (left) and breakdown by expenditure category (right). Complete operating and inventory data are provided in Table S3.
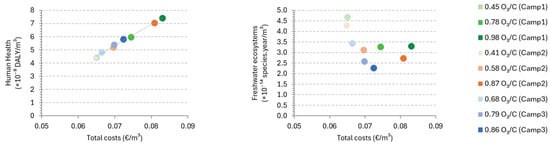
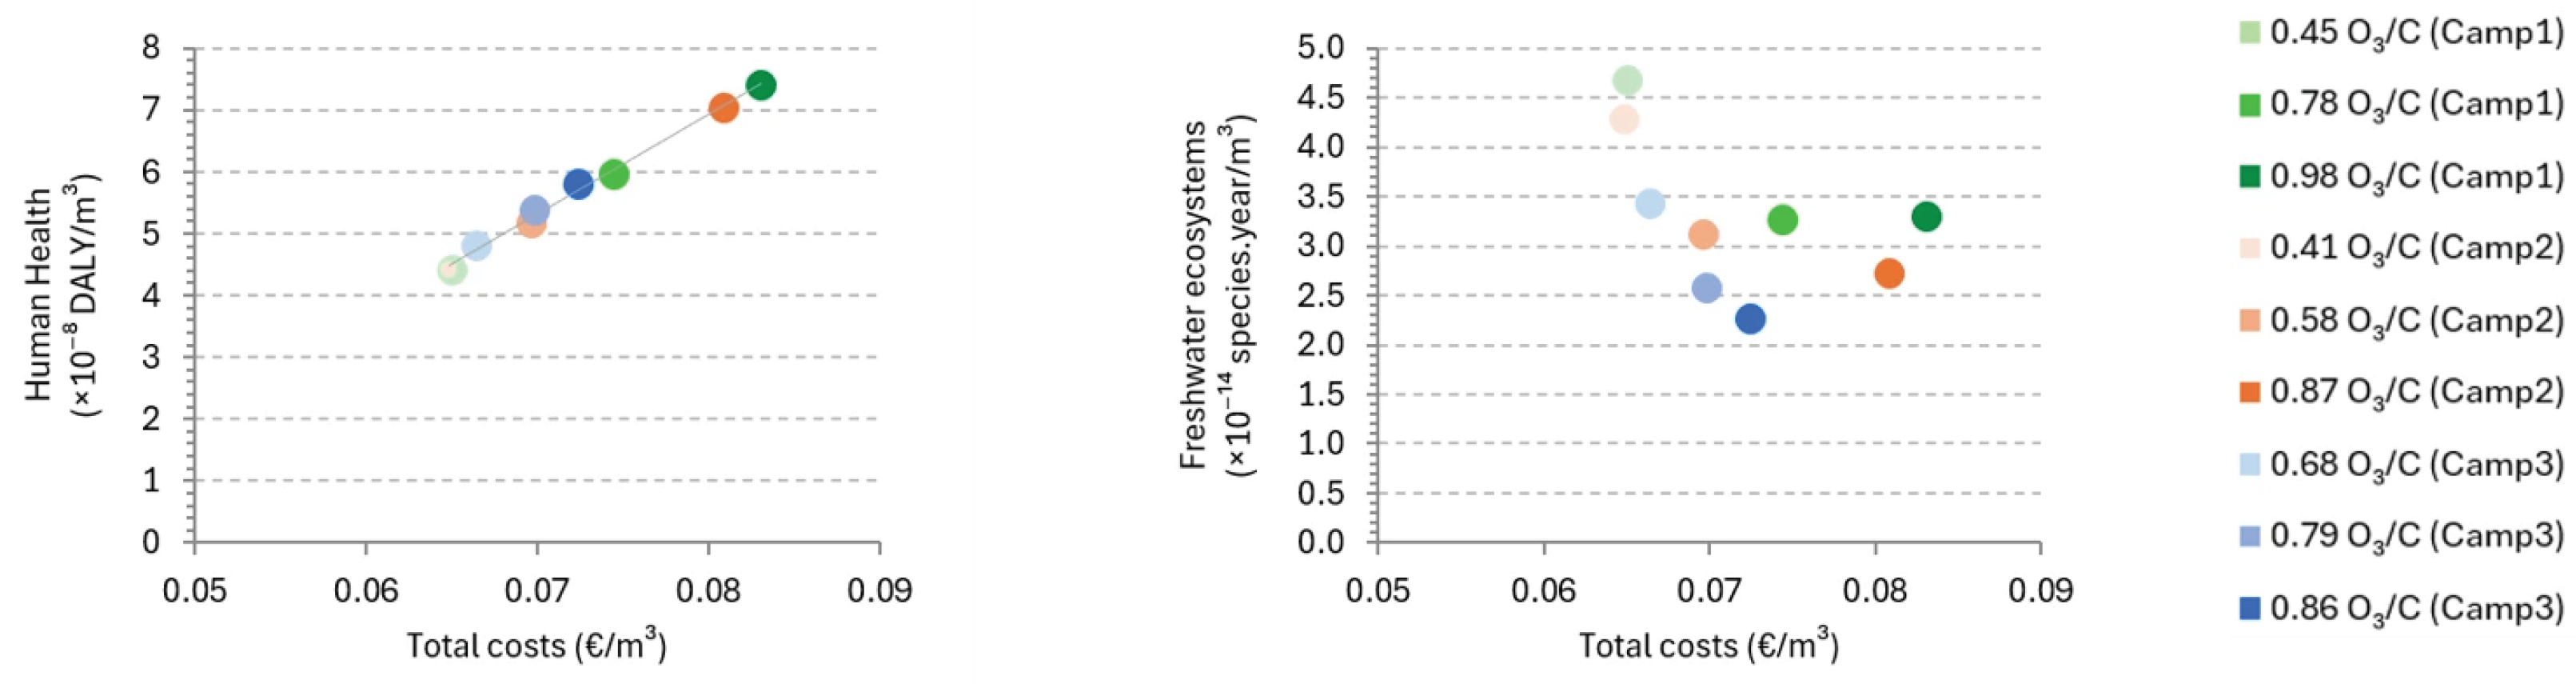
Figure 17 shows the impact on human health and freshwater ecosystems from the nine ozone doses tested in the three ozonation campaigns as a function of the corresponding total costs per treated volume. The results show that the impact on human health linearly increases with the operating costs due to higher energy use. The lower costs, associated with lower ozone doses, present a higher impact on freshwater ecosystems, while there appears to be a minimum impact associated with the cost of 0.07 €/m3, corresponding to an ozone dose of 0.79–0.86 mgO3/mgC.
Figure 17.
Impacts on human health (left) and freshwater ecosystem (right) from the nine organic-carbon-normalized ozone doses tested in the three LOR ozonation campaigns (0.41–0.98 mg O3/mg C) as a function of total costs per treated volume. Complete operating and inventory data are provided in Table S3.
5. Discussion
The results highlight the importance of considering conventional pollutants and CECs simultaneously when assessing strategies for improving urban wastewater treatment. For AS systems, the endpoint of freshwater ecosystems was mainly driven by freshwater eutrophication and therefore by nutrient emissions, whereas the contribution of CEC emissions was primarily reflected in the freshwater ecotoxicity midpoint. This is consistent with previous wastewater LCA studies showing that nutrients and direct emissions can dominate several impact categories [7,17,20], while the inclusion of CEC emissions particularly affects toxicity-related categories [32,39]. Overall, the integration of environmental and economic results indicates that SII provides the most favorable overall balance, combining the lowest OPEX with the lowest impacts on human health and relatively low impacts on freshwater ecosystems. SI shows comparable environmental performance but at slightly higher costs, whereas LOR combines the highest operating costs with the highest impacts on the endpoint. Within LOR, the lower F/M condition (0.10 d−1) is environmentally and economically preferable to 0.14 d−1. Overall, the results suggest that differences among treatment configurations have a greater influence on environmental and economic performance than variations in F/M alone.
The nitrification campaigns further show that improved nitrogen removal can reduce environmental impacts without a corresponding increase in overall OPEX under the conditions assessed, since higher energy costs are compensated by lower sludge disposal and discharge fee costs.
The ozonation results illustrate a different environmental–economic trade-off. Increasing ozone doses enhances CEC removal and reduces freshwater ecotoxicity and the associated impacts on freshwater ecosystems while simultaneously increasing human toxicity, global warming, and costs, mainly due to additional energy and oxygen requirements. Similar trade-offs between the direct environmental benefits of CEC removal (lower CEC emission) and the indirect impacts associated with energy and reagent consumption have been reported for advanced wastewater treatment, including ozonation [24,25,33]. A recent full-scale LCA and life cycle costing study of ozonation for CEC removal similarly identified ozone generation as the main contributor to both environmental impacts and operation costs, with plant construction representing the next most relevant life cycle contribution [45]. The total ozonation costs obtained in the present study (0.065–0.083 €/m3) are consistent with values reported for post-ozonation, namely 0.03–0.10 €/m3 for small plants and 0.04–0.05 €/m3 for larger plants [46]. Within the conditions tested, the lowest impact on freshwater ecosystems occurred at costs around 0.07 €/m3, corresponding to organic-carbon-normalized ozone doses of approximately 0.79–0.86 mgO3/mgC. This should be interpreted as a minimum observed under the tested conditions rather than as a universal optimum for ozone dose.
The integrated AS–ozonation assessment further illustrates the importance of the selected impact level. Ozonation substantially decreased freshwater ecotoxicity through improved CEC removal, but this improvement only had a limited effect on the endpoint of freshwater ecosystems when biological treatment and ozonation were considered together because freshwater eutrophication, associated with nutrient emissions, remained the dominant contribution. Conversely, the additional energy and oxygen requirements of ozonation increased the impacts on human health through global warming. These results reinforce previous observations that improvements in toxicity-related impacts achieved by advanced treatment may be accompanied by increased impacts in other categories [24,25,33,35]. Consequently, the environmental benefit of treatment intensification cannot be assessed from CEC removal performance alone.
Some of the findings are intrinsically site-specific. In particular, the cross-WWTP comparisons reflect the combined influence of F/M conditions and plant-specific characteristics, including reactor configuration, aeration or oxygen supply, influent composition, and plant scale. They therefore should not be interpreted as representing the isolated effect of F/M. Within-plant comparisons provide a more direct basis for assessing the changes associated with F/M, whereas the differences among SI, SII, and LOR illustrate the importance of local operating conditions and treatment configuration. Accordingly, the numerical environmental impacts and costs reported here should not be directly transferred to other WWTPs without considering site-specific characteristics. More generally, however, the results show the value of combining environmental and cost indicators when assessing AS treatment operational optimization and advanced treatment strategies.
The study also has methodological limitations. The environmental LCA was restricted to operational impacts and therefore excluded infrastructure construction and end-of-life. This may underestimate the environmental burden of ozonation, particularly its impact on global warming. Recent full-scale LCA results show that plant construction can represent a relevant contribution after ozone generation [40]. In addition, the inclusion of CECs in the LCA was constrained by the availability of characterization factors, and therefore does not represent a ranking of CECs according to occurrence, persistence, toxicity, or regulatory relevance. Of the 57 CECs monitored [14], only 8 (3 of the 12 micropollutant indicators listed in the UWWTD recast [1]) could be included in the LCA because suitable characterization factors were available. The exclusion of the remaining compounds should not be interpreted as absence of environmental impacts and may lead to an underestimation of the overall CEC-related impact, although the magnitude of this potential bias cannot be quantified currently.
6. Conclusions
An LCA was carried out to assess and compare the potential environmental impacts of each strategy proposed in LIFE Fitting in order to improve the performance of AS systems and ozonation in regard to CEC removal. The major positive impact of CEC removal was observed at the freshwater ecotoxicity midpoint, but its translation to the endpoint of freshwater ecosystems was relatively minor.
In terms of biological treatment, nutrient emissions were the main contributors to freshwater eutrophication and, ultimately, to the endpoint of freshwater ecosystems, whereas direct GHG emissions strongly contributed to global warming and human health. Accordingly, the condition with lower NH4+ and Nt removal consistently showed higher environmental impacts than the condition with higher removal. As far as ozonation is concerned, the higher doses negatively impact the endpoint of human health, mainly due to global warming (from energy consumption and oxygen production and transport), but positively impact the endpoint of freshwater ecosystems, mainly due to CEC removal.
A comparative cost analysis clarified the main cost drivers across the evaluated AS operation and advanced treatment options. In the F/M control campaigns, OPEX ranged from 0.14 to 0.15 €/m3 (SII) to 0.17 €/m3 (SI) and 0.22–0.28 €/m3 (LOR), driven mainly by sludge disposal in SI and SII (50–61%) and by oxygen in LOR (50%). Cross-WWTP differences should, however, be interpreted in the context of the distinct plant configurations and operating conditions, rather than as isolated F/M effects. In the nitrification campaigns, OPEX remained stable (0.150–0.155 €/m3) across 50–83% N-NH4+ removal (64–88% Nt removal), with sludge disposal being the major contributor. As an additional treatment step, ozonation showed total unit costs (annualized CAPEX + OPEX) of 0.065–0.083 €/m3, dominated by oxygen (0.03 €/m3) and CAPEX (0.02 €/m3), while energy cost is a function of the ozone dose. Globally, impacts on human health were higher for more costly options, whereas freshwater ecosystem responses were non-monotonic. Under the conditions tested, the smallest impacts on freshwater ecosystems were observed at costs around 0.07 €/m3, corresponding to organic-carbon-normalized ozone doses of approximately 0.79–0.86 mg O3/mg C.
LCA is a valuable method for evaluating environmental impacts, particularly when conducted with real full-scale data (as was done in this case), which decreases its uncertainty. However, assessing CEC removal remains limited due to the lack of characterization factors for many emerging contaminants. Excluding CECs without established characterization factors may lead to underestimating CEC-related impacts, although the magnitude of this potential bias remains uncertain. Integrating LCA and cost analysis results is essential to evaluate the environmental and economic implications of wastewater treatment upgrades, as improvements in some impact categories may lead to increased burdens in others.
From a policy and management perspective, the results support prioritizing the optimization of existing biological treatment where feasible and, when additional CEC removal is required, selecting ozonation conditions through site-specific assessments that jointly consider CEC removal, conventional pollutant emissions, environmental impacts, and costs. Broader use of LCA to support wastewater treatment investment and regulatory decisions would also benefit from the development of robust characterization factors for a wider range of CECs.
Supplementary Materials
The following supporting information can be downloaded at https://www.mdpi.com/article/10.3390/w18192382/s1. Table S1: Data of each treatment line (per cubic meter of water) regarding the F/M campaigns (3 parallel F/M in SI: 0.06 d−1, 0.10 d−1, and 0.08 d−1; 2 parallel F/M in SII: 0.08 d−1 and 0.07 d−1; 2 sequential F/M in LOR: 0.10 d−1 and 0.14 d−1); Table S2: Data of each treatment line regarding the Nitrification campaigns (different ammonia setpoints in two parallel lines of SII, which resulted in 83% NH4+ removal in line 1 vs. 50% in line 2); Table S3: Data of each treatment line regarding the Ozonation campaigns (3 ozonation campaigns, each testing 3 organic carbon-normalized ozone doses between 0.4–1.0 mgO3/mgC); Table S4: Characterization factors for midpoint categories; Table S5: IPCC factors for midpoint categories; Table S6: Characterization factors for endpoint categories.
Author Contributions
Conceptualization, C.S. and M.J.R.; methodology, C.S. and R.M.C.V.; software, C.S. and R.M.C.V.; validation, R.M.C.V.; formal analysis, C.S., R.M.C.V. and M.J.R.; investigation, G.F.; resources, G.F.; data curation, C.S.; writing—original draft preparation, C.S., R.M.C.V. and M.J.R.; writing—review and editing, C.S., R.M.C.V. and M.J.R.; visualization, C.S. and M.J.R.; supervision, C.C. and M.J.R.; project administration, C.S., C.C. and M.J.R.; funding acquisition, C.S., C.C. and M.J.R. All authors have read and agreed to the published version of the manuscript.
Funding
This work was supported by the European Union LIFE Programme under Grant Agreement 101114188-LIFE22-ENV-PT-LIFE Fitting (https://lifefitting.lnec.pt/). The publication reflects only the authors’ views, and the European Union is not liable for any use that may be made of the information contained herein.
Data Availability Statement
Data will be made available on request. This manuscript forms part of the LIFE Fitting project. The monitoring campaigns, WWTP operational data, and CEC occurrence/removal dataset used in this study derive from the same experimental programme reported in manuscript: Forecasting the removal of micropollutants and chemical contaminants of emerging concern in activated sludge treatment—A practical model supporting the implementation of the new EU Directive on urban wastewater treatment (Under processing). The present manuscript addresses a different research objective, namely the Life Cycle Assessment and comparative cost analysis of wastewater treatment strategies, whereas the other manuscript focuses on the development and validation of a practical model for forecasting CEC removal in activated sludge treatment.
Conflicts of Interest
Authors Gabriela Faria and Claudio Costa were employed by TRATAVE. The remaining authors declare that the research was conducted in the absence of any commercial or financial relationships that could be construed as potential conflicts of interest.
Abbreviations
The following abbreviations are used in this manuscript:
| AS | Activated Sludge |
| BOD5 | Five-day Biochemical Oxygen Demand |
| CAPEX | Capital Expenditures |
| CEC | Contaminant of Emerging Concern |
| COD | Chemical Oxygen Demand |
| DALY | Disability-Adjusted Life Year |
| EA-PFR | Extended Aeration Plug Flow Reactor |
| ELCD | European reference Life Cycle Database |
| F/M | Food/Microorganisms |
| GHG | GreenHouse Gas |
| IPCC | Intergovernmental Panel on Climate Change |
| LCA | Life Cycle Assessment |
| LCI | Life Cycle Inventory |
| LIFE | EU Program for the Environment and Climate Action |
| LOR | Lordelo WWTP |
| Nt | Total nitrogen |
| OD | Oxidation Ditch |
| OPEX | Operational Expenditures |
| Pt | Total phosphorus |
| TRH | Water resources Fee (Taxa de Recursos Hídricos) |
| WWTP | WasteWater Treatment Plant |
References
- European Parliament and Council. Directive (EU) 2024/3019 of the European Parliament and of the Council on Urban Wastewater Treatment (Recast). Official Journal of the European Union, 12 December 2024.
- European Commission—Joint Research Centre—Institute for Environment and Sustainability. International Reference Life Cycle Data System (ILCD) Handbook—General Guide for Life Cycle Assessment—Detailed Guidance, 1st ed.; EUR 24708 EN; Publications Office of the European Union: Luxembourg, 2010. [Google Scholar]
- ISO 14040:2006; Environmental Management—Life Cycle Assessment—Principles and Framework. International Organization for Standardization: Geneva, Switzerland, 2006.
- ISO 14044:2006; Environmental Management—Life Cycle Assessment—Requirements and Guidelines. International Organization for Standardization: Geneva, Switzerland, 2006.
- De Feo, G.; Ferrara, C. Investigation of the environmental impacts of municipal wastewater treatment plants through a Life Cycle Assessment software tool. Environ. Technol. 2017, 38, 1943–1948. [Google Scholar] [CrossRef] [Scilit] [PubMed]
- Corominas, L.; Byrne, D.M.; Guest, J.S.; Hospido, A.; Roux, P.; Shaw, A.; Short, M.D. The application of life cycle assessment (LCA) to wastewater treatment: A best practice guide and critical review. Water Res. 2020, 184, 116058. [Google Scholar] [CrossRef] [Scilit] [PubMed]
- Li, Y.; Xu, Y.; Fu, Z.; Li, W.; Zheng, L.; Li, M. Assessment of energy use and environmental impacts of wastewater treatment plants in the entire life cycle: A system meta-analysis. Environ. Res. 2021, 198, 110458. [Google Scholar] [CrossRef] [Scilit] [PubMed]
- Wu, L.; Ning, D.; Zhang, B.; Li, Y.; Zhang, P.; Shan, X.; Zhang, Q.; Brown, M.; Li, Z.; Van Nostrand, J.; et al. Global diversity and biogeography of bacterial communities in wastewater treatment plants. Nat. Microbiol. 2019, 4, 1183–1195, Corrected in Nat. Microbiol. 2019, 4, 2579. [Google Scholar] [CrossRef] [Scilit] [PubMed]
- Silva, C.; Almeida, C.M.M.; Rodrigues, J.A.; Silva, S.; Coelho, M.R.; Martins, A.; Lourinho, R.; Cardoso, E.; Cardoso, V.V.; Benoliel, M.J.; et al. Improving the control of pharmaceutical compounds in activated sludge wastewater treatment plants: Key operating conditions and monitoring parameters. J. Water Process Eng. 2023, 54, 103985. [Google Scholar] [CrossRef] [Scilit]
- Lee, S.; Heo, S.; Lee, J.; Son, H.; Wang, J.; Kim, Y.M. Aerobic biodegradation of micropollutants by nitrifiers and heterotrophs: Changes in biodegradation rate constant depending on levels of growth substrates and microbial activities. Bioresour. Technol. 2025, 425, 132332. [Google Scholar] [CrossRef] [Scilit] [PubMed]
- von Gunten, U. Ozonation of drinking water: Part, I. Oxidation kinetics and product formation. Water Res. 2003, 37, 1443–1467. [Google Scholar] [CrossRef] [Scilit] [PubMed]
- Viegas, R.M.C.; Silva, C.; Campinas, M.; Paíga, P.; Delerue-Matos, C.; Costa, C.; Rosa, M.J. A novel phenomenological model for streamlined prediction and online monitoring of organic micropollutant removal in full-scale wastewater ozonation. Desalination 2026, 628, 120060. [Google Scholar] [CrossRef] [Scilit]
- Campinas, M.; Vaz-Moreira, I.; Viegas, R.M.C.; Mesquita, E.; Ribeiro, D.; Ruivo, A.; Soares, J.; Paíga, P.; Delerue-Matos, C.; Faria, G.; et al. Full-scale multipurpose ozonation in urban wastewater with strong textile input: Removal of colour, micropollutants, pathogens and antimicrobial resistance indicators. Desalination 2026, 639, 120539. [Google Scholar] [CrossRef] [Scilit]
- Silva, C.; Viegas, R.M.C.; Faria, G.; Campinas, M.; Araújo, R.; Costa, C.; Rosa, M.J. Forecasting the Removal of Micropollutants and Chemical Contaminants of Emerging Concern in Activated Sludge Treatment—A Practical Model Supporting the Implementation of the New EU Directive on Urban Wastewater Treatment. Preprints; p. 2026081085. 2026. Available online: https://www.preprints.org/manuscript/202608.1085 (accessed on 16 September 2026).
- Hospido, A.; Moreira, M.T.; Feijoo, G. A comparison of municipal wastewater treatment plants for big centres of population in Galicia (Spain). Int. J. Life Cycle Assess. 2007, 13, 57–64. [Google Scholar] [CrossRef] [Scilit]
- Lorenzo-Toja, Y.; Vázquez-Rowe, I.; Chenel, S.; Marin-Navarro, D.; Moreira, T.M.; Feijoo, G. Eco-efficiency analysis of Spanish WWTPs using the LCA + DEA method. Water Res. 2015, 68, 651–666. [Google Scholar] [CrossRef] [Scilit] [PubMed]
- Tsangas, M.; Papamichael, I.; Banti, D.; Samaras, P.; Zorpas, A.A. LCA of municipal wastewater treatment. Chemosphere 2023, 341, 139952. [Google Scholar] [CrossRef] [Scilit] [PubMed]
- Rodriguez-Garcia, G.; Molinos-Senante, M.; Hospido, A.; Hernández-Sancho, F.; Moreira, M.T.; Feijoo, G. Environmental and economic profile of six typologies of wastewater treatment plants. Water Res. 2011, 45, 5997–6010. [Google Scholar] [CrossRef] [Scilit] [PubMed]
- Gallego-Schmid, A.; Tarpani, R.R.Z. Life cycle assessment of wastewater treatment in developing countries: A review. Water Res. 2019, 153, 63–79. [Google Scholar] [CrossRef] [Scilit] [PubMed]
- Pasciucco, F.; Pecorini, I.; Iannelli, R. A comparative LCA of three WWTPs in a tourist area: Effects of seasonal loading rate variations. Sci. Total Environ. 2023, 863, 160841. [Google Scholar] [CrossRef] [Scilit] [PubMed]
- Yilmaz, M.; Guven, H.; Ozgun, H.; Ersahin, M.E.; Koyuncu, I. The application of Life Cycle Assessment (LCA) to anaerobic technologies for the treatment of municipal wastewater: A review. Process Saf. Environ. Prot. 2024, 182, 357–370. [Google Scholar] [CrossRef] [Scilit]
- Rashid, S.S.; Liu, Y.-Q. Assessing environmental impacts of large centralized wastewater treatment plants with combined or separate sewer systems in dry/wet seasons by using LCA. Environ. Sci. Pollut. Res. 2020, 27, 15674–15690. [Google Scholar] [CrossRef] [Scilit] [PubMed]
- Núñez-Tafalla, P.; Salmerón, I.; Pérez Rodríguez, J.; Rodríguez-Chueca, J.; Venditti, S.; Hansen, J. Environmental impacts and economic assessment of a large-scale pilot plant for micropollutants removal: Granular activated carbon vs. coupled advanced oxidation process-granular activated carbon treatments. J. Environ. Chem. Eng. 2026, 14, 120644. [Google Scholar] [CrossRef] [Scilit]
- Li, Y.; Zhang, S.; Zhang, W.; Xiong, W.; Ye, Q.; Hou, X.; Wang, P. Life cycle assessment of advanced wastewater treatment processes: Involving 126 pharmaceuticals and personal care products in life cycle inventory. J. Environ. Manag. 2019, 238, 442–450. [Google Scholar] [CrossRef] [Scilit] [PubMed]
- Igos, E.; Mailler, R.; Guillossou, R.; Rocher, V.; Gasperi, J. Life cycle assessment of powder and micro-grain activated carbons for wastewater treatment and their comparison with ozonation. J. Clean. Prod. 2021, 287, 125067. [Google Scholar] [CrossRef] [Scilit]
- Razman, K.K.; Hanafiah, M.M.; Mohammad, A.W. An overview of LCA applied to various membrane technologies: Progress, challenges, and harmonization. Environ. Technol. Innov. 2022, 27, 102803. [Google Scholar] [CrossRef] [Scilit]
- Pelayo, D.; Hernández-Pellón, A.; Santos, G.; Rumayor, M.; Ortiz, I.; Rivero, M.J. Performance of high-efficiency UV-C LEDs in water disinfection: Experimental, life cycle assessment, and economic analysis of different operational scenarios. J. Environ. Manag. 2024, 364, 121442. [Google Scholar] [CrossRef] [Scilit] [PubMed]
- López-Timoner, R.; Santos-Juanes, L.; Amat, A.M.; Arfelli, F.; Cespi, D.; Passarini, F.; Polo, M.I.; Zuriaga, E.; Arques, A. Life cycle assessment of UVC-based advanced oxidation processes as quaternary treatments: Clostridium spp. inactivation and comparison with CECs removal. Sci. Total Environ. 2025, 972, 179029. [Google Scholar] [CrossRef] [Scilit] [PubMed]
- Feijoo, H.; Estévez, S.; González-García, S.; Moreira, M.T. Insights into the environmental performance of nature-based wastewater technologies towards water and carbon neutrality. J. Environ. Manag. 2026, 399, 128657. [Google Scholar] [CrossRef] [Scilit] [PubMed]
- Szulc, P.; Kasprzak, J.; Dymaczewski, Z.; Kurczewski, P. Life Cycle Assessment of Municipal Wastewater Treatment Processes Regarding Energy Production from the Sludge Line. Energies 2021, 14, 356. [Google Scholar] [CrossRef] [Scilit]
- Abdolrezayi, A.; Puricelli, S.; Dolci, G.; Turolla, A.; Canziani, R.; Rigamonti, L. Phosphorus recovery from sewage sludge ash: Life cycle inventory and critical review of LCA case studies. J. Environ. Manag. 2025, 389, 125620. [Google Scholar] [CrossRef] [Scilit] [PubMed]
- Muñoz, I.; Gómez, M.J.; Molina-Díaz, A.; Huijbregts, M.A.J.; Fernández-Alba, A.R.; García-Calvo, E. Ranking potential impacts of priority and emerging pollutants in urban wastewater through life cycle impact assessment. Chemosphere 2008, 74, 37–44. [Google Scholar] [CrossRef] [Scilit] [PubMed]
- Pesqueira, J.; Pereira, M.; Silva, A. Environmental impact assessment of advanced urban wastewater treatment technologies for the removal of priority substances and contaminants of emerging concern: A review. J. Clean. Prod. 2020, 261, 121078. [Google Scholar] [CrossRef] [Scilit]
- Servien, R.; Bonnot, K.; Latrille, E.; Hélias, A.; Patureau, D. Consideration of unmeasured micropollutants released from WWTP for potential impact estimations. Sci. Total Environ. 2023, 904, 166313. [Google Scholar] [CrossRef] [Scilit] [PubMed]
- Laouane, H.; El Joumri, L.; Halhaly, A.; Arid, Y.; Labjar, N.; El Hajjaji, S. Life-Cycle Assessment of Wastewater Treatment: Enhancing Sustainability Through Process Optimization. Sustainability 2026, 18, 605. [Google Scholar] [CrossRef] [Scilit]
- Alfonsin, C.; Hospido, A.; Omil, F.; Moreira, M.T.; Feijoo, G. PPCPs in wastewater—Update and calculation of characterization factors for their inclusion in LCA studies. J. Clean. Prod. 2014, 83, 245–255. [Google Scholar] [CrossRef] [Scilit]
- Aemig, Q.; Hélias, A.; Patureau, D. Impact assessment of a large panel of organic and inorganic micropollutants released by wastewater treatment plants at the scale of France. Water Res. 2021, 188, 116524. [Google Scholar] [CrossRef] [Scilit] [PubMed]
- Servien, R.; Leenknecht, C.; Bonnot, K.; Rossard, V.; Latrille, E.; Mamy, L.; Benoit, P.; Hélias, A.; Patureau, D. Improved impact assessment of micropollutants release from WWTPs. Case Stud. Chem. Environ. Eng. 2022, 5, 100172. [Google Scholar] [CrossRef] [Scilit]
- Rashid, S.S.; Liu, Y.-Q. Comparison of life cycle toxicity assessment methods for municipal wastewater treatment with the inclusion of direct emissions of metals, PPCPs and EDCs. Sci. Total Environ. 2021, 756, 143849. [Google Scholar] [CrossRef] [Scilit] [PubMed]
- IPCC. Wastewater Treatment and Discharge. Intergovernmental Panel on Climate Change. In 2019 Refinement to the 2006 IPCC Guidelines for National Greenhouse Gas Inventories; IPCC: Geneva, Switzerland, 2019; Volume 5, Chapter 6. [Google Scholar]
- Huijbregts, M.A.J.; Steinmann, Z.J.N.; Elshout, P.M.F.; Stam, G.; Verones, F.; Vieira, M.D.M.; Hollander, A.; van Zelm, R.; van der Meent, D. ReCiPe2016: A Harmonised Life Cycle Impact Assessment Method at Midpoint and Endpoint Level. Report I: Characterisation; RIVM Report 2016–0104; National Institute for Public Health and the Environment (RIVM): Bilthoven, The Netherlands, 2016; Available online: https://www.rivm.nl/bibliotheek/rapporten/2016-0104.pdf (accessed on 16 September 2026).
- van Oers, L. CML-IA Database, Characterisation and Normalisation Factors for Midpoint Impact Category Indicators. Version 4.5. 2015. Available online: http://www.cml.leiden.edu/software/data-cmlia.html (accessed on 23 June 2026).
- Baresel, C.; Magnér, J.; Magnusson, K.; Olshammar, M. Tekniska Lösningar för Avancerad Rening av Avloppsvatten; IVL Svenska Miljöinstitutet AB: Stockholm, Sweden, 2017. [Google Scholar]
- Rizzo, L.; Malato, S.; Antakyali, D.; Beretsou, V.G.; Dolic, M.B.; Gernjak, W.; Heath, E.; Ivancev-Tumbas, I.; Karaolia, P.; Ribeiro, A.R.L. Consolidated vs new advanced treatment methods for the removal of contaminants of emerging concern from urban wastewater. Sci. Total Environ. 2019, 655, 986–1008. [Google Scholar] [CrossRef] [Scilit] [PubMed]
- Amaya-Santos, G.; Boelee, N.; Paulillo, A.; Lettieri, P. Life cycle assessment and life cycle costing of full-scale ozonation for micropollutants removal from wastewater. Case study in the Netherlands. Sci. Total Environ. 2025, 961, 178259. [Google Scholar] [CrossRef] [Scilit] [PubMed]
- Campinas, M.; Viegas, R.M.C.; Almeida, C.M.M.; Martins, A.; Silva, C.; Mesquita, E.; Coelho, M.R.; Silva, S.; Cardoso, V.V.; Rosa, M.J. Powdered activated carbon full-scale addition to the activated sludge reactor of a municipal wastewater treatment plant: Pharmaceutical compounds control and overall impact on the process. Journal of Water Process Engineering 2022, 49, 102975. [Google Scholar]
Disclaimer/Publisher’s Note: The statements, opinions and data contained in all publications are solely those of the individual author(s) and contributor(s) and not of MDPI and/or the editor(s). MDPI and/or the editor(s) disclaim responsibility for any injury to people or property resulting from any ideas, methods, instructions or products referred to in the content. |
© 2026 by the authors. Licensee MDPI, Basel, Switzerland. This article is an open access article distributed under the terms and conditions of the Creative Commons Attribution (CC BY) license.