


Abstract
In this study, a silica-based adsorbent was synthesized via a two-step sol–gel route. A branch of ora-pro-nobis (Pereskia aculeata Miller) was used as a porogenic template. The biomass was incorporated into the silica matrix and subsequently removed by calcination. The resulting material was characterized by nitrogen adsorption–desorption analysis, scanning electron microscopy (SEM), Fourier-transform infrared spectroscopy (FTIR), X-ray diffraction (XRD), and differential scanning calorimetry (DSC), and its performance for erythrosine red adsorption from aqueous solution was evaluated. The incorporation of the biotemplate modified the pore structure of the silica, decreasing the BET specific surface area from 297.33 to 249.10 m2 g−1 while increasing the average BJH pore diameter from 2.26 to 3.66 nm. Adsorption was favored at pH 6 and rapidly approached equilibrium within approximately 5–7 min. The equilibrium data were satisfactorily described by the Langmuir model, with a maximum adsorption capacity of 108.81 mg g−1 at 25 °C. Adsorption capacity decreased with increasing temperature, and thermodynamic analysis indicated a spontaneous and exothermic process (ΔH° = −8.07 kJ mol−1). Overall, ora-pro-nóbis biomass acted as a renewable porogenic biotemplate, modifying the pore architecture of silica. The resulting TSOPN material exhibited competitive adsorption performance for erythrosine removal.
1. Introduction
Synthetic dyes are among the most problematic contaminants found in industrial effluents because of their extensive use, chemical stability, and resistance to biodegradation. Their persistence often limits the efficiency of conventional wastewater treatment processes, resulting in the release of residual dyes into aquatic environments [1]. Once discharged, these compounds reduce light penetration, inhibiting photosynthetic activity and disturbing the ecological balance of aquatic systems [2,3]. In addition, the visible coloration of contaminated water attracts greater public attention than many colorless pollutants, making dye contamination one of the most evident forms of water pollution [3].
Among synthetic dyes of environmental concern, erythrosine is an anionic and water-soluble xanthene dye widely used as a colorant in the food, pharmaceutical, cosmetic, and textile industries. It has been associated with several adverse health effects, including allergic reactions, thyroid dysfunction, genotoxicity, neurotoxicity, endocrine disruption, and potential carcinogenicity [4]. Moreover, the removal of erythrosine from wastewater remains challenging because photochemical and biochemical degradation may generate transformation products with toxicity comparable to or greater than that of the parent compound. Consequently, the discharge of erythrosine-containing effluents poses significant risks to both human health and aquatic ecosystems [5].
Different technologies have been employed to remove dyes from aqueous effluents, including coagulation, ozonation, ion exchange, and advanced oxidation processes [6,7,8,9]. Among these alternatives, adsorption stands out as an attractive treatment technique due to its simplicity, high efficiency, and operational convenience [10,11,12]. Despite its effectiveness, adsorption has some limitations, including adsorbent saturation, regeneration costs, loss of adsorption capacity after reuse, and the generation of spent adsorbents that may require appropriate disposal. Moreover, competition among contaminants in complex effluents can reduce adsorption efficiency [13,14]. Specifically for erythrosine, low-cost alternative adsorbents have been evaluated, including poultry feathers [3], bottom ash and de-oiled soya [4], de-oiled activated mustard cake [15], pumpkin seed hulls [1], and fungal biomass [5], exhibiting highly variable adsorption capacities. For instance, pumpkin seed hulls show an adsorption capacity of 16.4 mg g−1 for erythrosine B [1], highlighting the ongoing need to develop more efficient and economically viable adsorbents.
In this scenario, silica-based materials are among the most widely explored adsorbents due to their high surface area, structural versatility, and chemical stability [16]. They can be readily synthesized via sol–gel processes using acid, base, two-step, or non-hydrolytic catalysis. However, tailoring the pore structure and surface properties generally requires the incorporation of sacrificial templates, traditionally synthetic polymers or surfactants, which are removed after gel formation [17]. To reduce the environmental drawbacks associated with these conventional templating agents, renewable biomass has recently emerged as a sustainable alternative for directing pore formation while simultaneously promoting the valorization of agricultural resources [16,18].
Biotemplating has emerged as an effective strategy for tailoring the structural and physicochemical properties of functional materials by employing biological resources as structure-directing agents [19,20]. Plant-derived templates exhibit intrinsic hierarchical architectures and diverse chemical compositions that can be transferred to inorganic matrices, enabling control over morphology, pore architecture, surface chemistry, and textural properties. Consequently, biotemplate-assisted synthesis has been successfully applied to silica, metal oxides, carbons, ceramics, and hybrid materials, leading to enhanced performance in applications such as adsorption, catalysis, energy storage, and environmental remediation [21,22].
In this context, ora-pro-nóbis (Pereskia aculeata Miller) is a non-conventional food plant native to Brazil, whose leaves are valued for their nutritional composition and bioactive compounds [23]. In contrast, the stems represent a less exploited fraction of the plant, making their valorization an attractive approach for the development of value-added materials. In this study, this biomass was explored as a renewable biotemplate for the synthesis of porous silica. Plant-derived biotemplates have been successfully employed to generate porous inorganic structures, demonstrating the potential of biological precursors to direct pore formation during material synthesis [24,25]. During the sol–gel process, the biomass can be incorporated into the inorganic matrix and subsequently removed by calcination, contributing to the development of porosity. Similar effects may be achieved using other biomass-derived templates, and the characteristics of the resulting porous structure can be influenced by the nature of the biological precursor [17]. To the best of our knowledge, the use of ora-pro-nóbis biomass as a biotemplate for the synthesis of silica adsorbents has not yet been reported. Accordingly, this study aimed to synthesize and characterize silica-based adsorbents biotemplated with ora-pro-nóbis and evaluate their performance for erythrosine adsorption from aqueous solutions via a simple, sustainable, and low-cost pathway, thereby contributing to the valorization of an underutilized plant resource.
2. Materials and Methods
2.1. Materials
Erythrosine red dye (Duas Rodas, Jaraguá do Sul, Brazil, >98%) was used as the adsorbate in all adsorption experiments. Ora-pro-nóbis (Pereskia aculeata Mill.) biomass was employed as a porogenic template and directly incorporated into the sol–gel synthesis without prior pretreatment, producing the biotemplated silica precursor before calcination. Silica adsorbents were synthesized using tetraethyl orthosilicate (TEOS, Si(OCH2CH3)4, Merck, Darmstadt, Germany, >98%) as the silica precursor, hydrochloric acid (HCl, Nuclear, Diadema, Brazil, 38%) as the acid catalyst, and ammonium hydroxide (NH4OH, Nuclear, Diadema, Brazil, 29%) as the base catalyst.
2.2. Adsorbent Synthesis
The adsorbent was synthesized via the sol–gel method. First, 20 mL of TEOS and 10 mL of 0.2 M HCl were mixed under magnetic stirring (150 rpm) for 40 min. Subsequently, 2 g of Pereskia aculeata Miller biomass (previously dried, ground, and sieved to 210 µm) was added, and the suspension was stirred for 1 h. Gelation was induced by the addition of 10 mL of 0.2 M NH4OH, occurring rapidly (~2 min). The obtained gel was oven-dried (105 °C, 24 h), cooled in a desiccator, and ground. Finally, the material was calcined in a muffle furnace at 450 °C for 1 h to remove the organic template, resulting in the final adsorbent with a mass yield of 50%.
2.3. Adsorbent Characterizations
The synthesized silica samples were characterized by differential scanning calorimetry (DSC, DSC-60, Shimadzu, Kyoto, Japan), Fourier-transform infrared spectroscopy (FTIR), nitrogen adsorption–desorption analysis (BET), X-ray diffraction analysis (XRD) and scanning electron microscopy coupled with energy-dispersive X-ray spectroscopy (SEM/EDS). DSC measurements were carried out from 20 to 600 °C at a heating rate of 10 °C min−1 to evaluate the thermal behavior of the samples. FTIR spectra were acquired using a Shimadzu AIRsight (Shimadzu, Japan) spectrometer with a spectral resolution of 4 cm−1 and 64 accumulated scans. XRD analysis was performed in a Miniflex® 300 (Rigaku, Tokyo, Japan). The textural properties, including specific surface area, pore volume, and pore size distribution, were determined from nitrogen adsorption–desorption isotherms using a Gemini VII 2390A (Micromeritics, Norcross, GA, USA) analyzer. The morphology and elemental composition of the samples were investigated using scanning electron microscopy (SEM) and energy-dispersive X-ray spectroscopy (EDS) on a JEOL JSM-6610LV (JEOL, Tokyo, Japan) equipped with an EDS microprobe. A Denton Vacuum Desk V sputterer (Denton Vacuum, Moorestown, NJ, USA) was used to metalize samples with Au.
2.4. Adsorption Assays
2.4.1. pH Effect
A solution containing 100 mg L−1 of Erythrosine Red was prepared, and aliquots of 100 mL were buffered at pH 4, 6, and 8. Adsorbent was added to these solutions at a concentration of 2.5 g L−1. Samples were agitated at 100 rpm for 24 h in a thermostatically controlled shaker (Fanem 315 SE, Guarulhos, Brazil). The final dye concentration was determined by UV-Vis spectrophotometry at λ = 526 nm. All experiments were performed in triplicate, and adsorption capacity (qf) was calculated by Equation (1).
where C0 is the Erythrosine Red initial concentration (mg L−1), Cf is the final dye concentration (mg L−1), m is the amount of adsorbent (g), and V is the volume of solution (L).
2.4.2. Adsorption Kinetics
A kinetic study was conducted by constructing adsorption capacity–time curves, and experiments were conducted at pH 6. Studies were assayed using solutions with concentrations of 100 mg L−1 and 300 mg L−1. Mixtures were agitated at 200 rpm in a jar test (Nova Ética, model 218 MBD, Vargem Grande Paulista, Brazil), maintained at room temperature (25 ± 1 °C). Adsorbent concentration was 1 g L−1, and the study duration was 20 min. Adsorption capacity at each time point was calculated using Equation (2), and the Pseudo-first-order, Pseudo-second-order, and Elovich kinetic models, given by Equations (3)–(5), were used to fit the experimental behavior [26,27,28,29].
where qt is the adsorption capacity at time t (mg g−1); k1 and k2 are the rate constants of pseudo-first (min−1) and pseudo-second orders (g mg−1 min−1) models, respectively; and q1 and q2 are the theoretical values for the adsorption capacity (mg g−1). For the Elovich model, a is the initial sorption rate dq/dt with qt = 0 (mg g−1 min−1), and b is the desorption constant (g mg−1).
2.4.3. Adsorption Isotherms
Isotherms were constructed at 25 °C, 45 °C, and 55 °C. Initial dye concentrations were 50, 100, 200, 300, and 400 mg L−1. Adsorption concentration was 1.0 g L−1 in a total volume of 100 mL of solution for each test. The mixtures were placed in 100 mL Erlenmeyer flasks, with the pH adjusted to 6, and the systems were agitated in a thermostatic bath at 100 rpm for 24 h. Final Erythrosine Red concentration was determined by UV-Vis spectrophotometry (526 nm). Equilibrium adsorption capacity (qe) was calculated by Equation (6) [30].
Langmuir (Equation (7)) and Freundlich (Equation (8)) isotherms were used to represent experimental behavior. The Langmuir model assumes that the adsorbent has a homogeneous surface; thus, the interaction energy between the adsorbent and adsorbate is equal, and a monolayer of adsorbate is formed [26,31].
where qe is equilibrium adsorption capacity (mg g−1), Ce is equilibrium concentration in liquid phase (mg L−1), qm is the Langmuir maximum adsorption capacity (mg g−1), and kL is the Langmuir equilibrium constant (L mg−1).
The Freundlich model (Equation (8)) assumes that the adsorbent has a heterogeneous surface and thus the interaction energy between the adsorbent and adsorbate varies [26,32,33]. In this Equation kF is the Freundlich constant ((mg g−1)(L mg−1)−1/n) and 1/n is the heterogeneity factor.
2.4.4. Thermodynamic Analysis
Adsorption Gibbs free energy change (ΔG°) can be calculated using Equation (9) and can be obtained from Equation (10).
where kD is the thermodynamic equilibrium constant. Variations in adsorption enthalpy (ΔH°) and entropy (ΔS°) can be determined using Equation (11), which expresses the Van’t Hoff relationship [26,34].
2.4.5. Data Analysis
The experimental data was analyzed using TIBCO Statistica (version 14) and OriginPro 2024. Statistical analyses and graphical representations were performed using these software packages. The quality of the fitted models was evaluated based on the coefficient of determination (R2) and the average relative error (ARE).
3. Results and Discussion
3.1. Sample Characterization
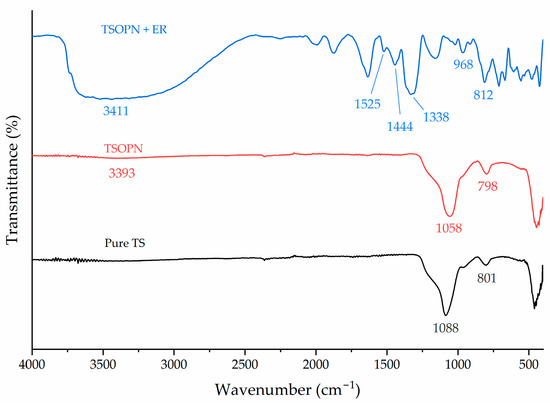
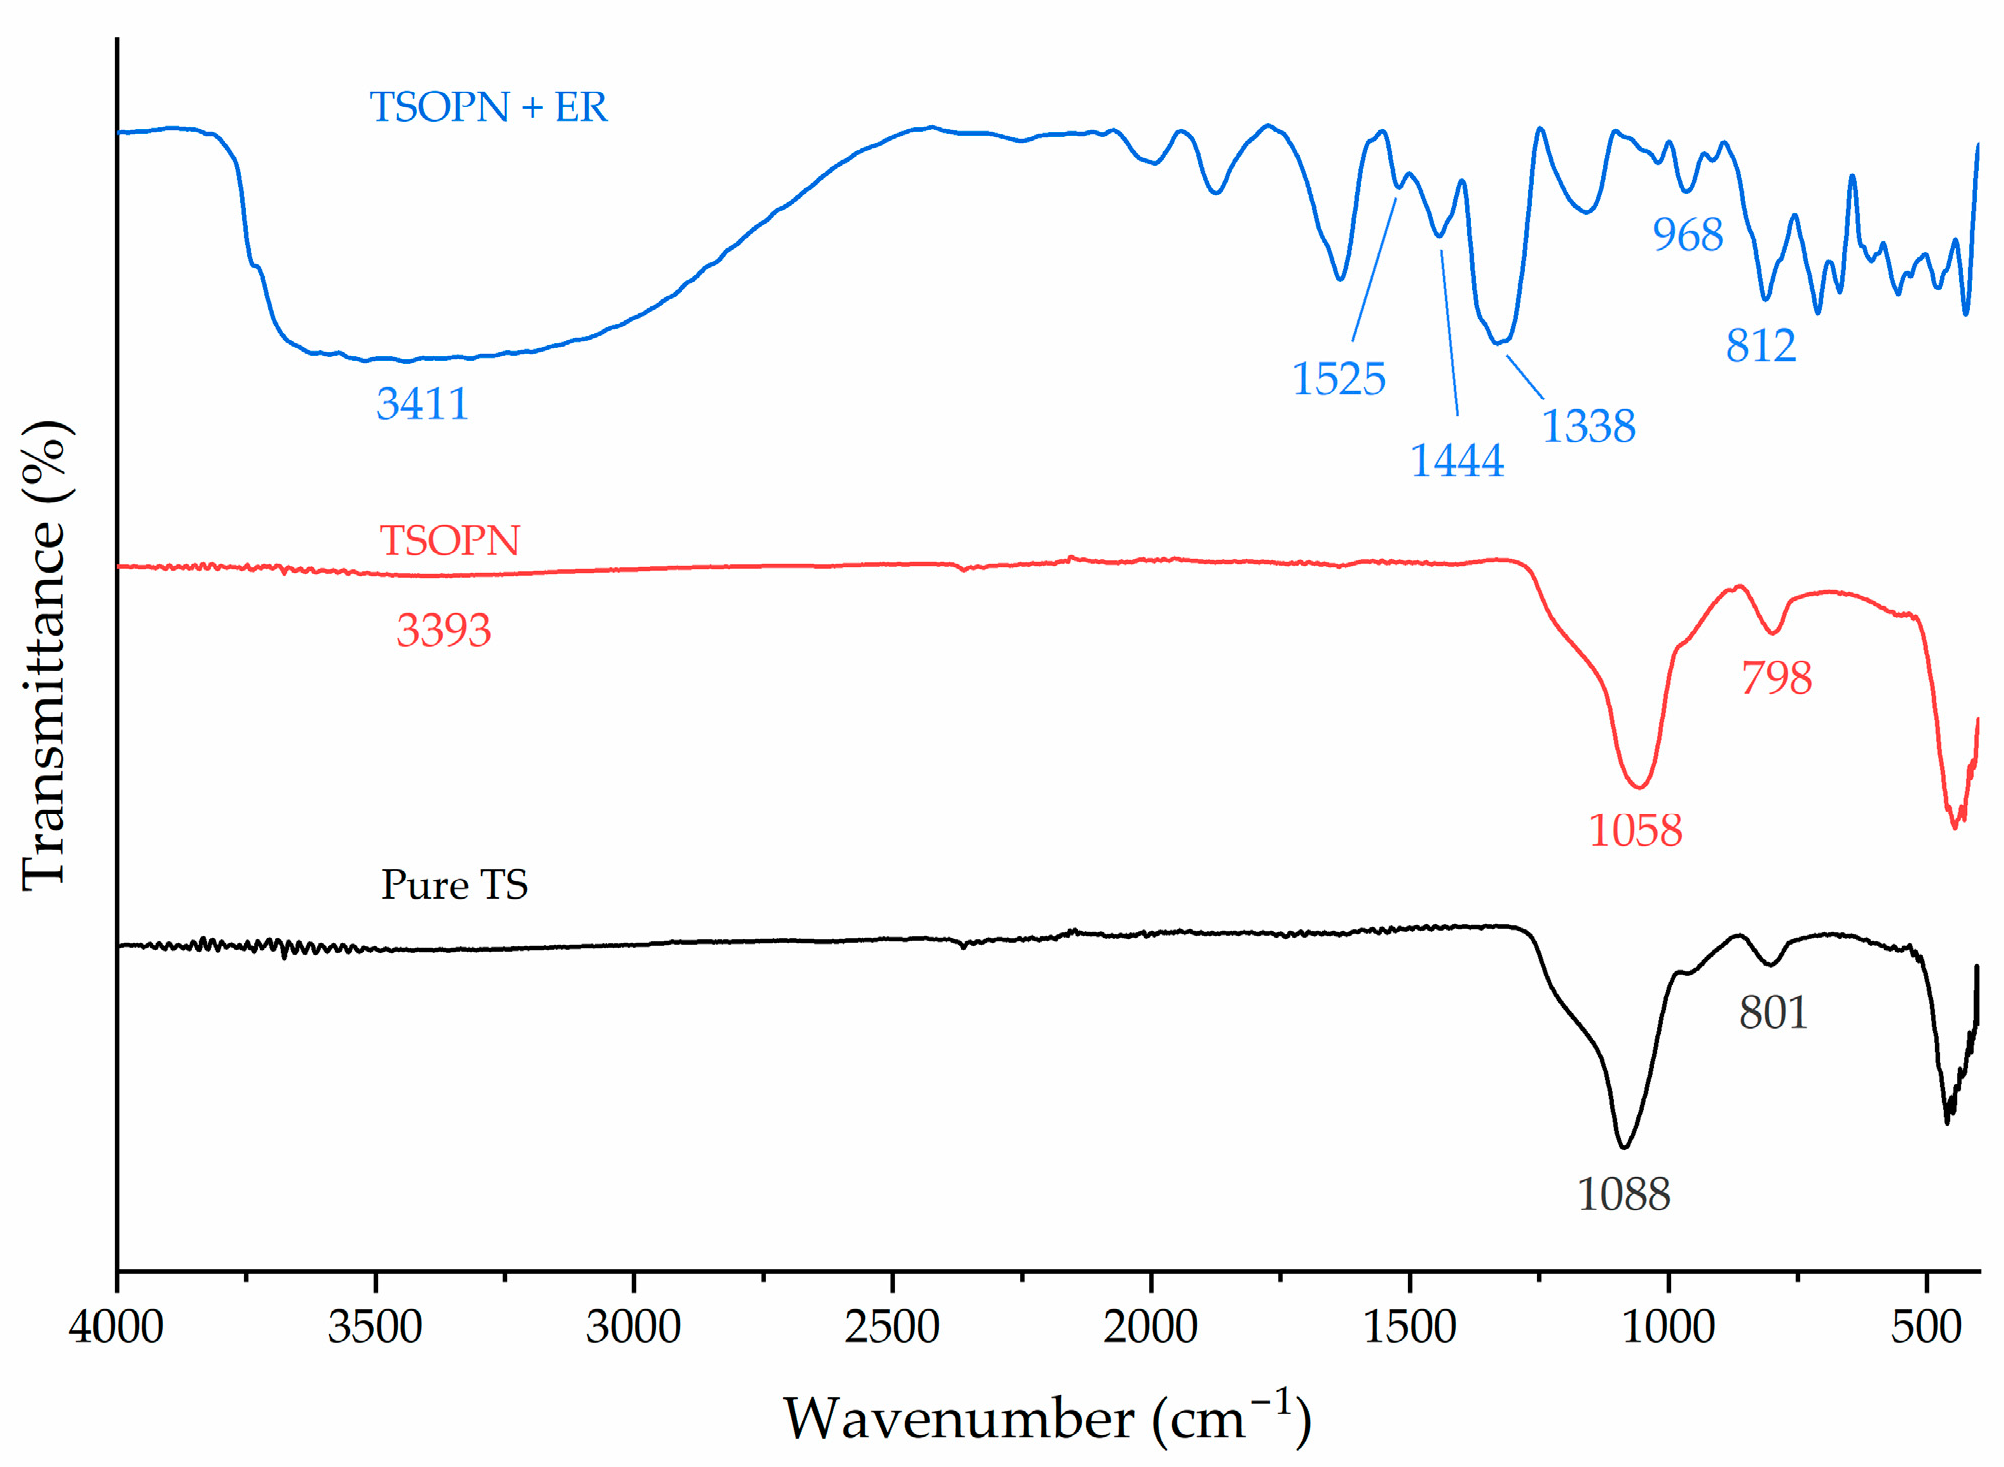
Fourier-transform infrared (FTIR) spectroscopy was performed to investigate the chemical structure of the synthesized silica materials (Figure 1). Both samples exhibited the characteristic absorption bands of amorphous silica, with the intense band centered at 1088 cm−1 for TS and shifted to 1058 cm−1 for TSOPN, corresponding to the asymmetric stretching vibration of Si–O–Si bonds [35]. The displacement of this band toward lower wavenumbers in the TSOPN suggests modifications in the siloxane network, which have been associated with an increased concentration of surface silanol groups, a lower degree of network condensation, and greater structural disorder in sol–gel-derived silica [35,36]. The absorption band observed at approximately 800 cm−1, assigned to the symmetric stretching vibration of Si–O–Si, remained essentially unchanged in both samples, indicating that the fundamental silica framework was preserved after incorporation and subsequent removal of the porogenic agent. Moreover, TSOPN exhibited a broader and more intense absorption band centered at approximately 3393 cm−1, attributed to the O–H stretching vibration of surface silanol groups and adsorbed water [36]. This increased intensity consists of a higher density of surface hydroxyl groups and enhanced moisture adsorption, commonly observed in porous silica materials. Finally, the absence of absorption bands corresponding to C–H, C=O, or other organic functional groups confirms the effective removal of the ora-pro-nóbis-derived porogenic template during calcination, indicating that the organic additive acted as a sacrificial template without remaining chemically bonded to the silica matrix. Compared with other similar samples, the FTIR spectra are also similar. Silica synthesized using a similar two-step sol–gel method but employing maize stalks (Zea mays) as the porogenic agent instead of ora-pro-nóbis, which exhibited absorption bands in the same spectral regions as those observed for the samples in the present study [17]. Following adsorption, the spectrum undergoes significant modifications due to the presence of Erythrosine Red. The emergence of bands at 1525, 1444, and 1338 cm−1 is characteristic of the dye, corresponding to benzene ring stretching, symmetric carboxylic group stretching, and xanthene ring deformation, respectively [37,38]. Furthermore, the initially pronounced peaks of the pure silica and TSOPN matrices exhibit diminished intensity and slight spectral shifts, confirming an interaction between the adsorbate and the adsorbent surface.
Figure 1.
FTIR spectra for pure two-step synthesized silica (Pure TS), two-step synthesized silica with ora-pro-nóbis (TSOPN) and TSOPN after erythrosine red adsorption (TSOPN + ER).
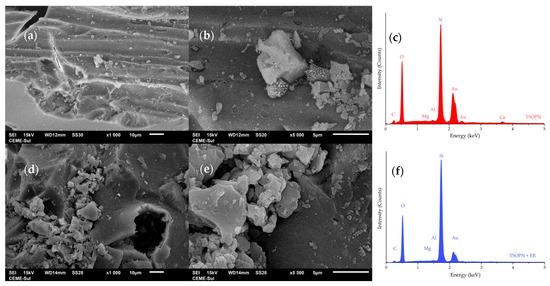
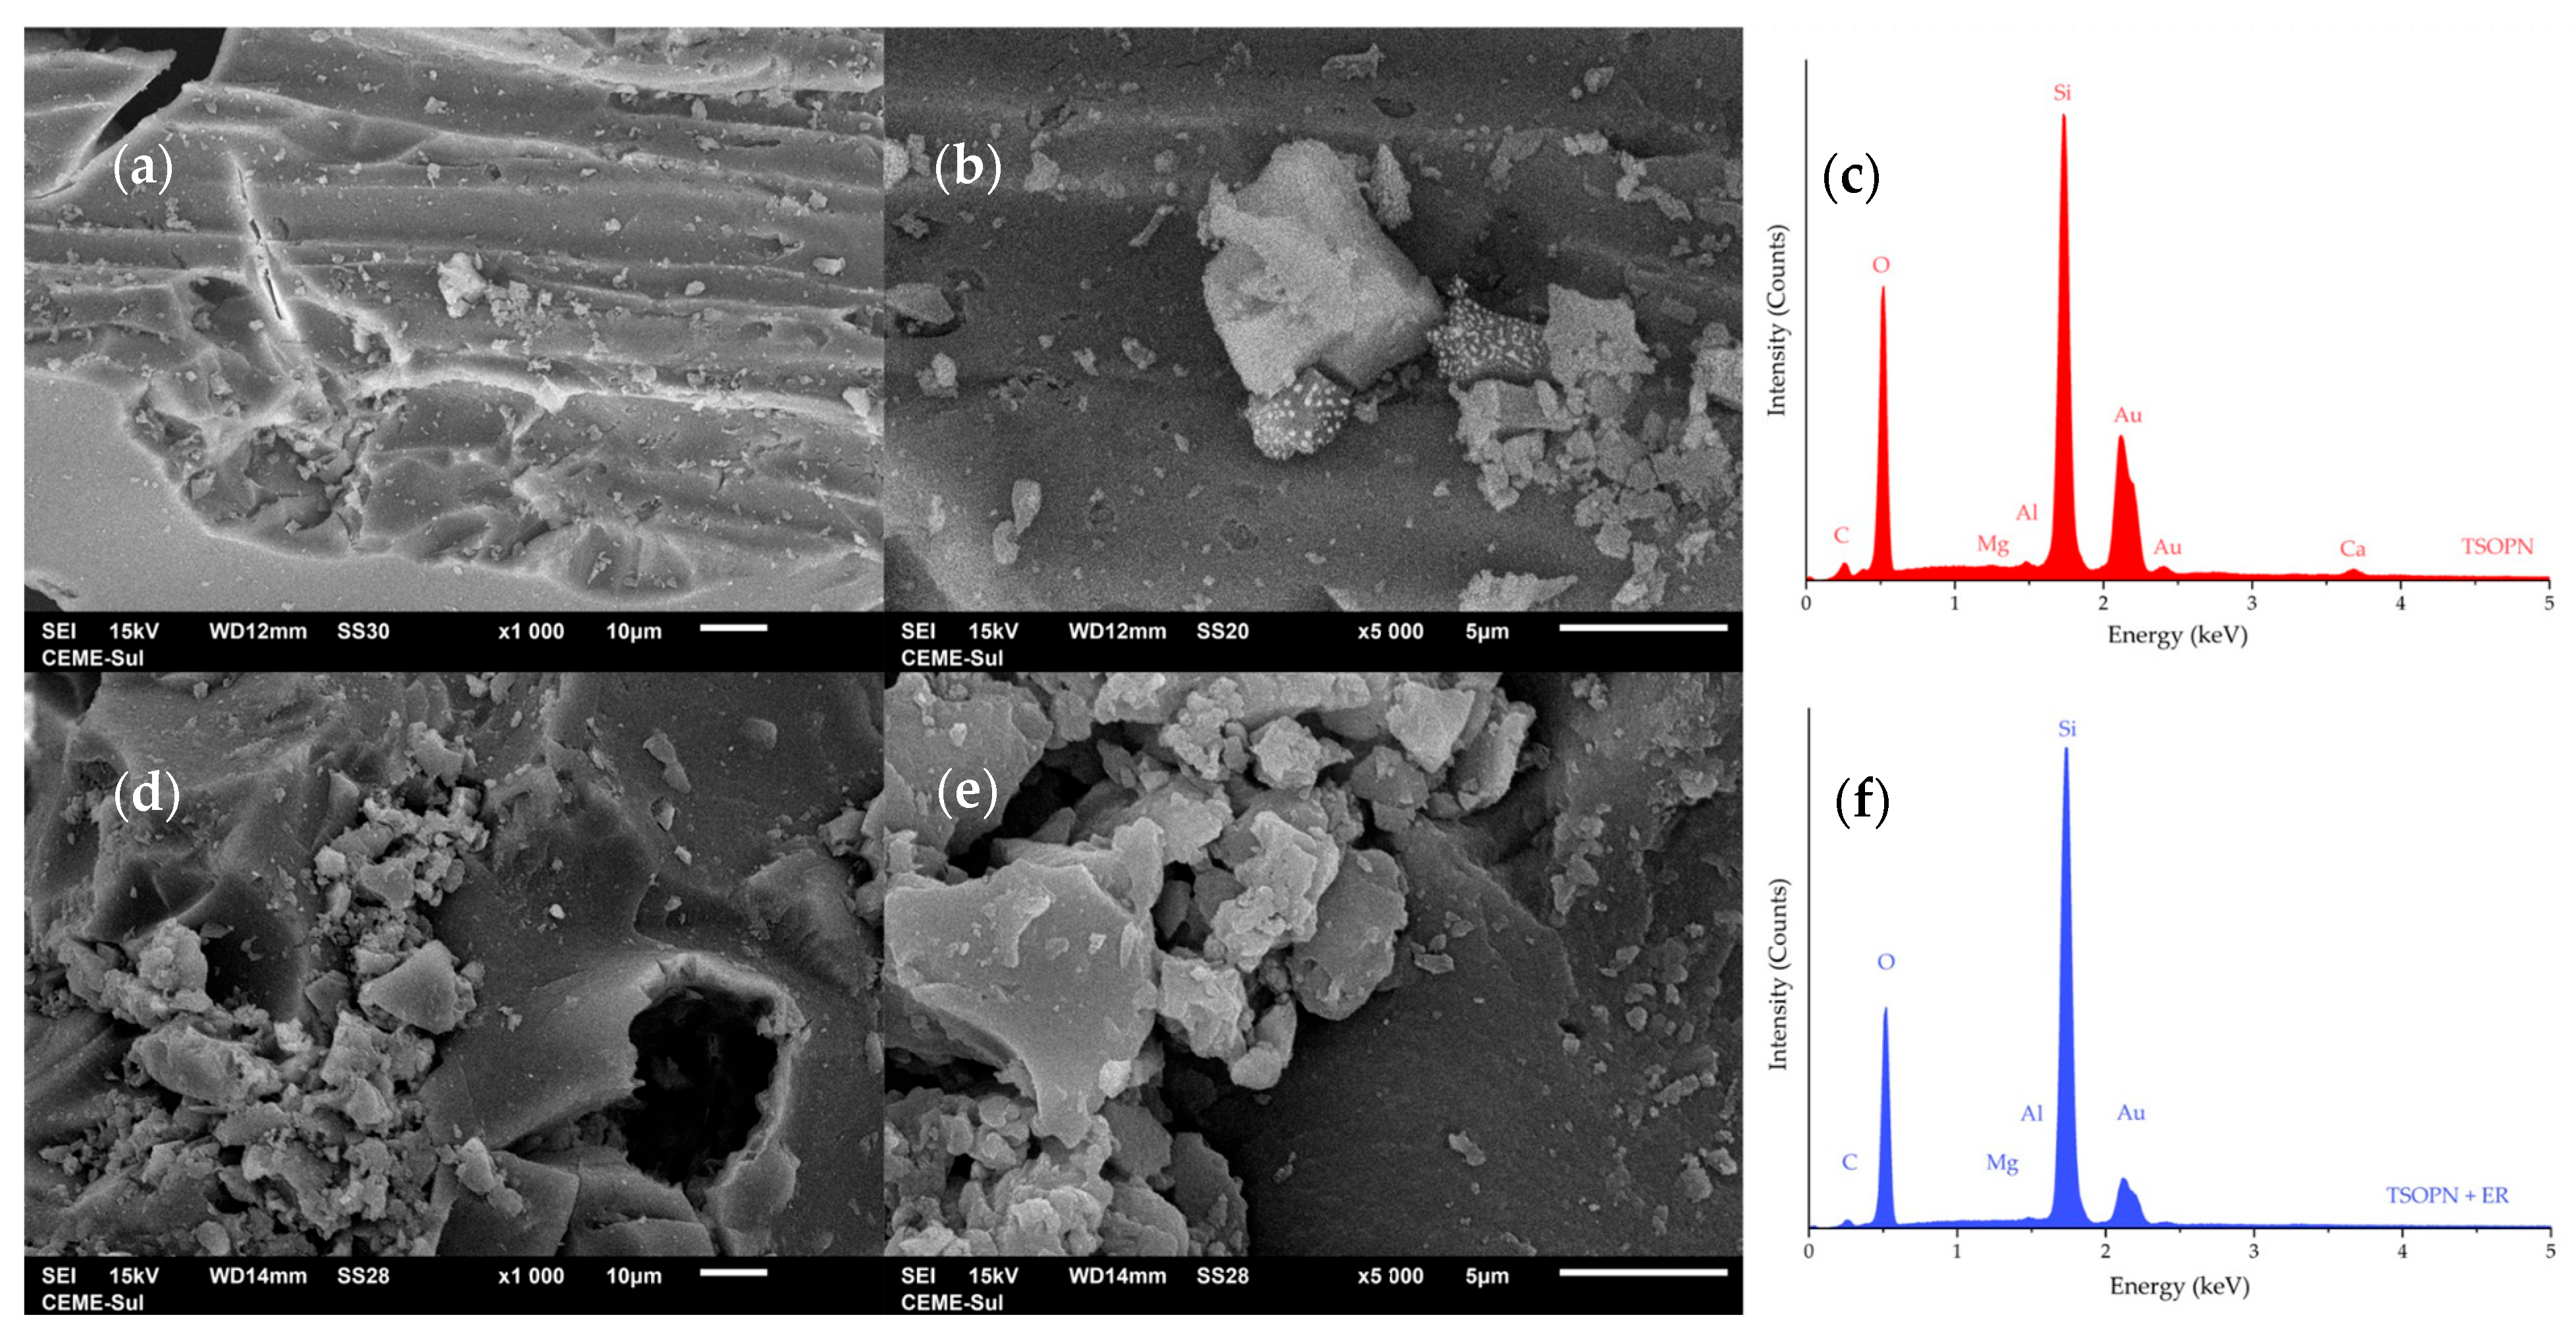
The morphological features and surface topography of the calcined TSOPN sample were investigated via SEM, alongside EDS analysis (Figure 2). As depicted in the micrographs, the material is predominantly composed of a bulky, amorphous silica matrix. Concurrently, the surface exhibits highly irregular roughness with elongated microcavities and channels, which can be attributed to the thermal decomposition and gas release of the Pereskia aculeata Miller template during calcination. The obtained silica exhibits small protuberances and pores, which may provide accessible surface features for adsorbate interaction. After adsorption, no significant changes were observed in the micrographs. EDS analysis was also performed, indicating a predominance of Si and oxygen. Carbon was also identified during data acquisition, which was consistent with organic residues of ora-pro-nóbis that may have been trapped in the silica matrix. Other elements, such as Mg, Ca, and Al, can be attributed to the Pereskia aculeata Miller matrix once they are not removed during the calcination process. As for samples after adsorption, EDS showed a very similar profile. The main difference is the absence of calcium in the spectrum, which is not identified during the analysis. Since EDS provides a localized and semi-quantitative elemental analysis, this result does not necessarily indicate the complete removal of calcium from the material.
Figure 2.
SEM micrographs of the two-step synthesized silica biotemplated with ora-pro-nóbis (TSOPN) and EDS are presented in the top row, (a) ×1000, (b) ×5000, and EDS (c). Bottom row represents TSOPN after ER adsorption, (d) ×1000, (e) ×5000, and EDS (f).
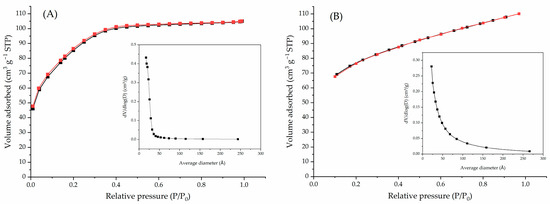
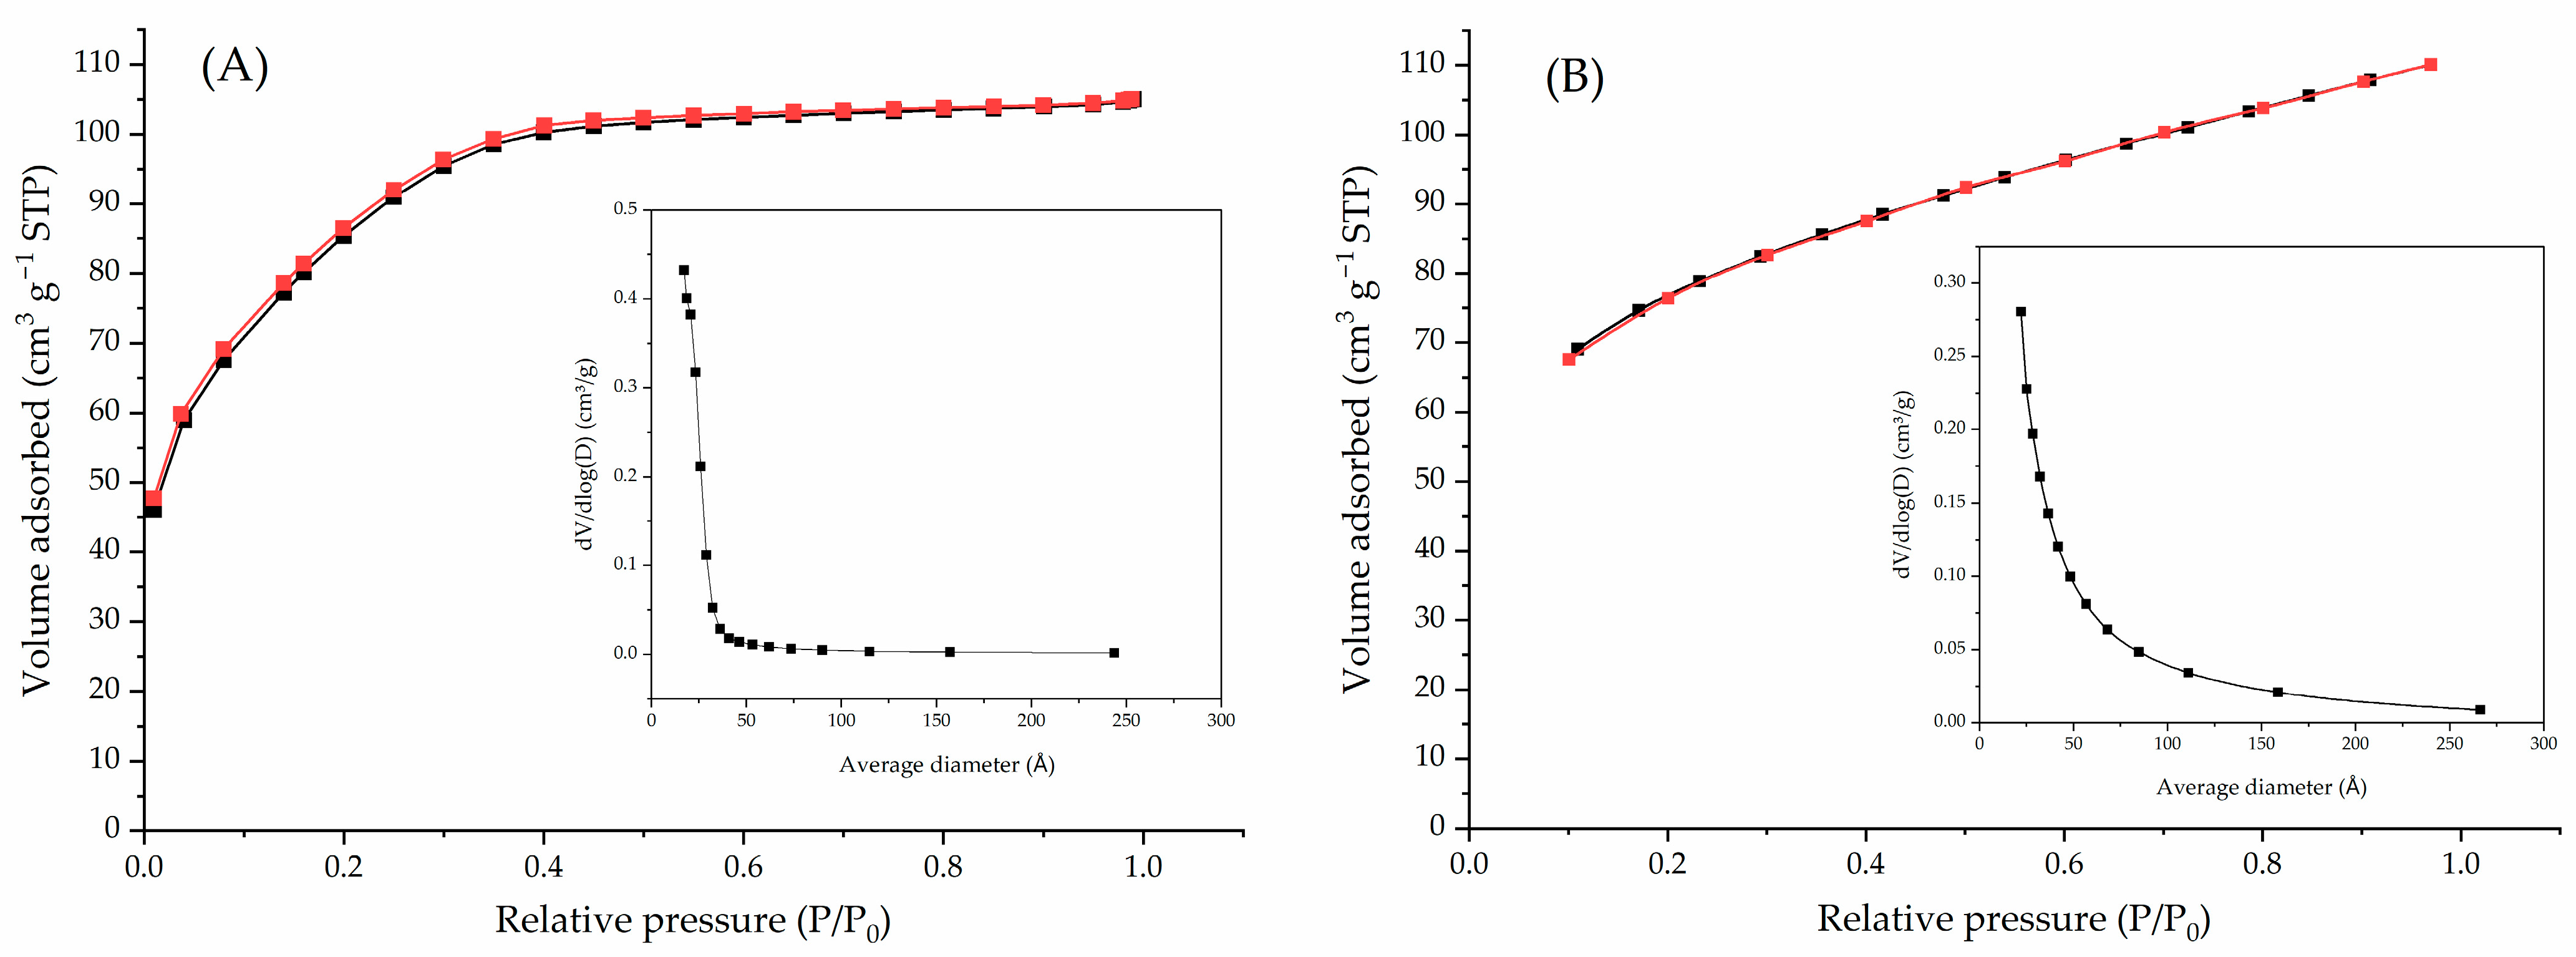
Nitrogen adsorption–desorption analysis was performed to evaluate the textural properties of pure silica (TS) and silica synthesized using Pereskia aculeata branches as a biotemplate (TSOPN), and the corresponding isotherms are presented in Figure 3. Pure TS exhibited a BET specific surface area of 297.33 m2 g−1 and an average BJH adsorption pore diameter of 2.26 nm. In comparison, TSOPN exhibited a BET specific surface area of 249.10 m2 g−1, a total pore volume of 0.170 cm3 g−1, and an average pore diameter of 2.73 nm by BET and 3.66 nm by BJH adsorption. Thus, incorporation of the biotemplate resulted in a 16.22% decrease in BET surface area accompanied by a 62.07% increase in the average BJH pore diameter. The obtained BET surface areas are within the lower range reported for silica gels and green-synthesized silica materials (approximately 240–400 m2 g−1) [39], although it is lower than that of highly ordered mesoporous silicas such as SBA-15 and MCM-41, which typically exhibit surface areas above 500 m2 g−1 [40,41]. Likewise, the total pore volume is lower than the values generally reported for ordered mesoporous silica (0.5–1.0 cm3 g−1) [39,40,41], reflecting the absence of highly organized pore-directing agents during synthesis. The average pore diameter obtained for both samples falls within the mesoporous range (2–50 nm), suggesting the presence of mesopores in the synthesized silica.
Figure 3.
Nitrogen adsorption–desorption isotherms of the (A) pure two-step silica (Pure TS) and the (B) two-step silica biotemplated with ora-pro-nóbis (TSOPN), showing the adsorption (black) and desorption (red) branches, alongside the pore distribution plot.
The adsorption–desorption isotherm of both samples exhibited the characteristics of a Type I(b) isotherm according to the IUPAC classification [42], indicating the presence of wide micropores together with narrow mesopores. This interpretation is supported by the t-plot analysis, which revealed a micropore surface area of 146.7 m2 g−1, corresponding to approximately 59% of the total BET surface area, while the external surface area was 102.4 m2 g−1. Furthermore, the BJH pore size distribution showed that the mesopores were predominantly distributed between 2 and 4 nm. Collectively, these results demonstrate that the synthesized silica possesses a hierarchical micro–mesoporous structure, combining microporosity with mesoporous pathways that may facilitate molecular accessibility and diffusion.
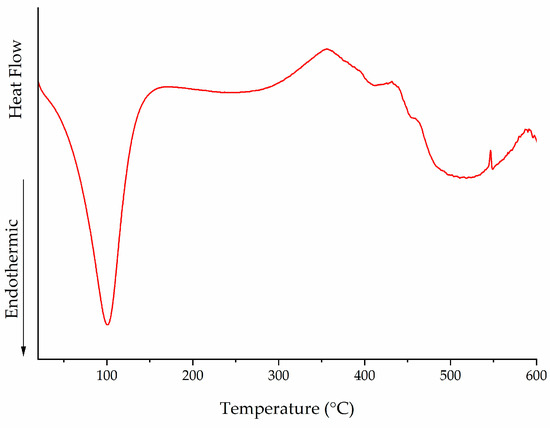
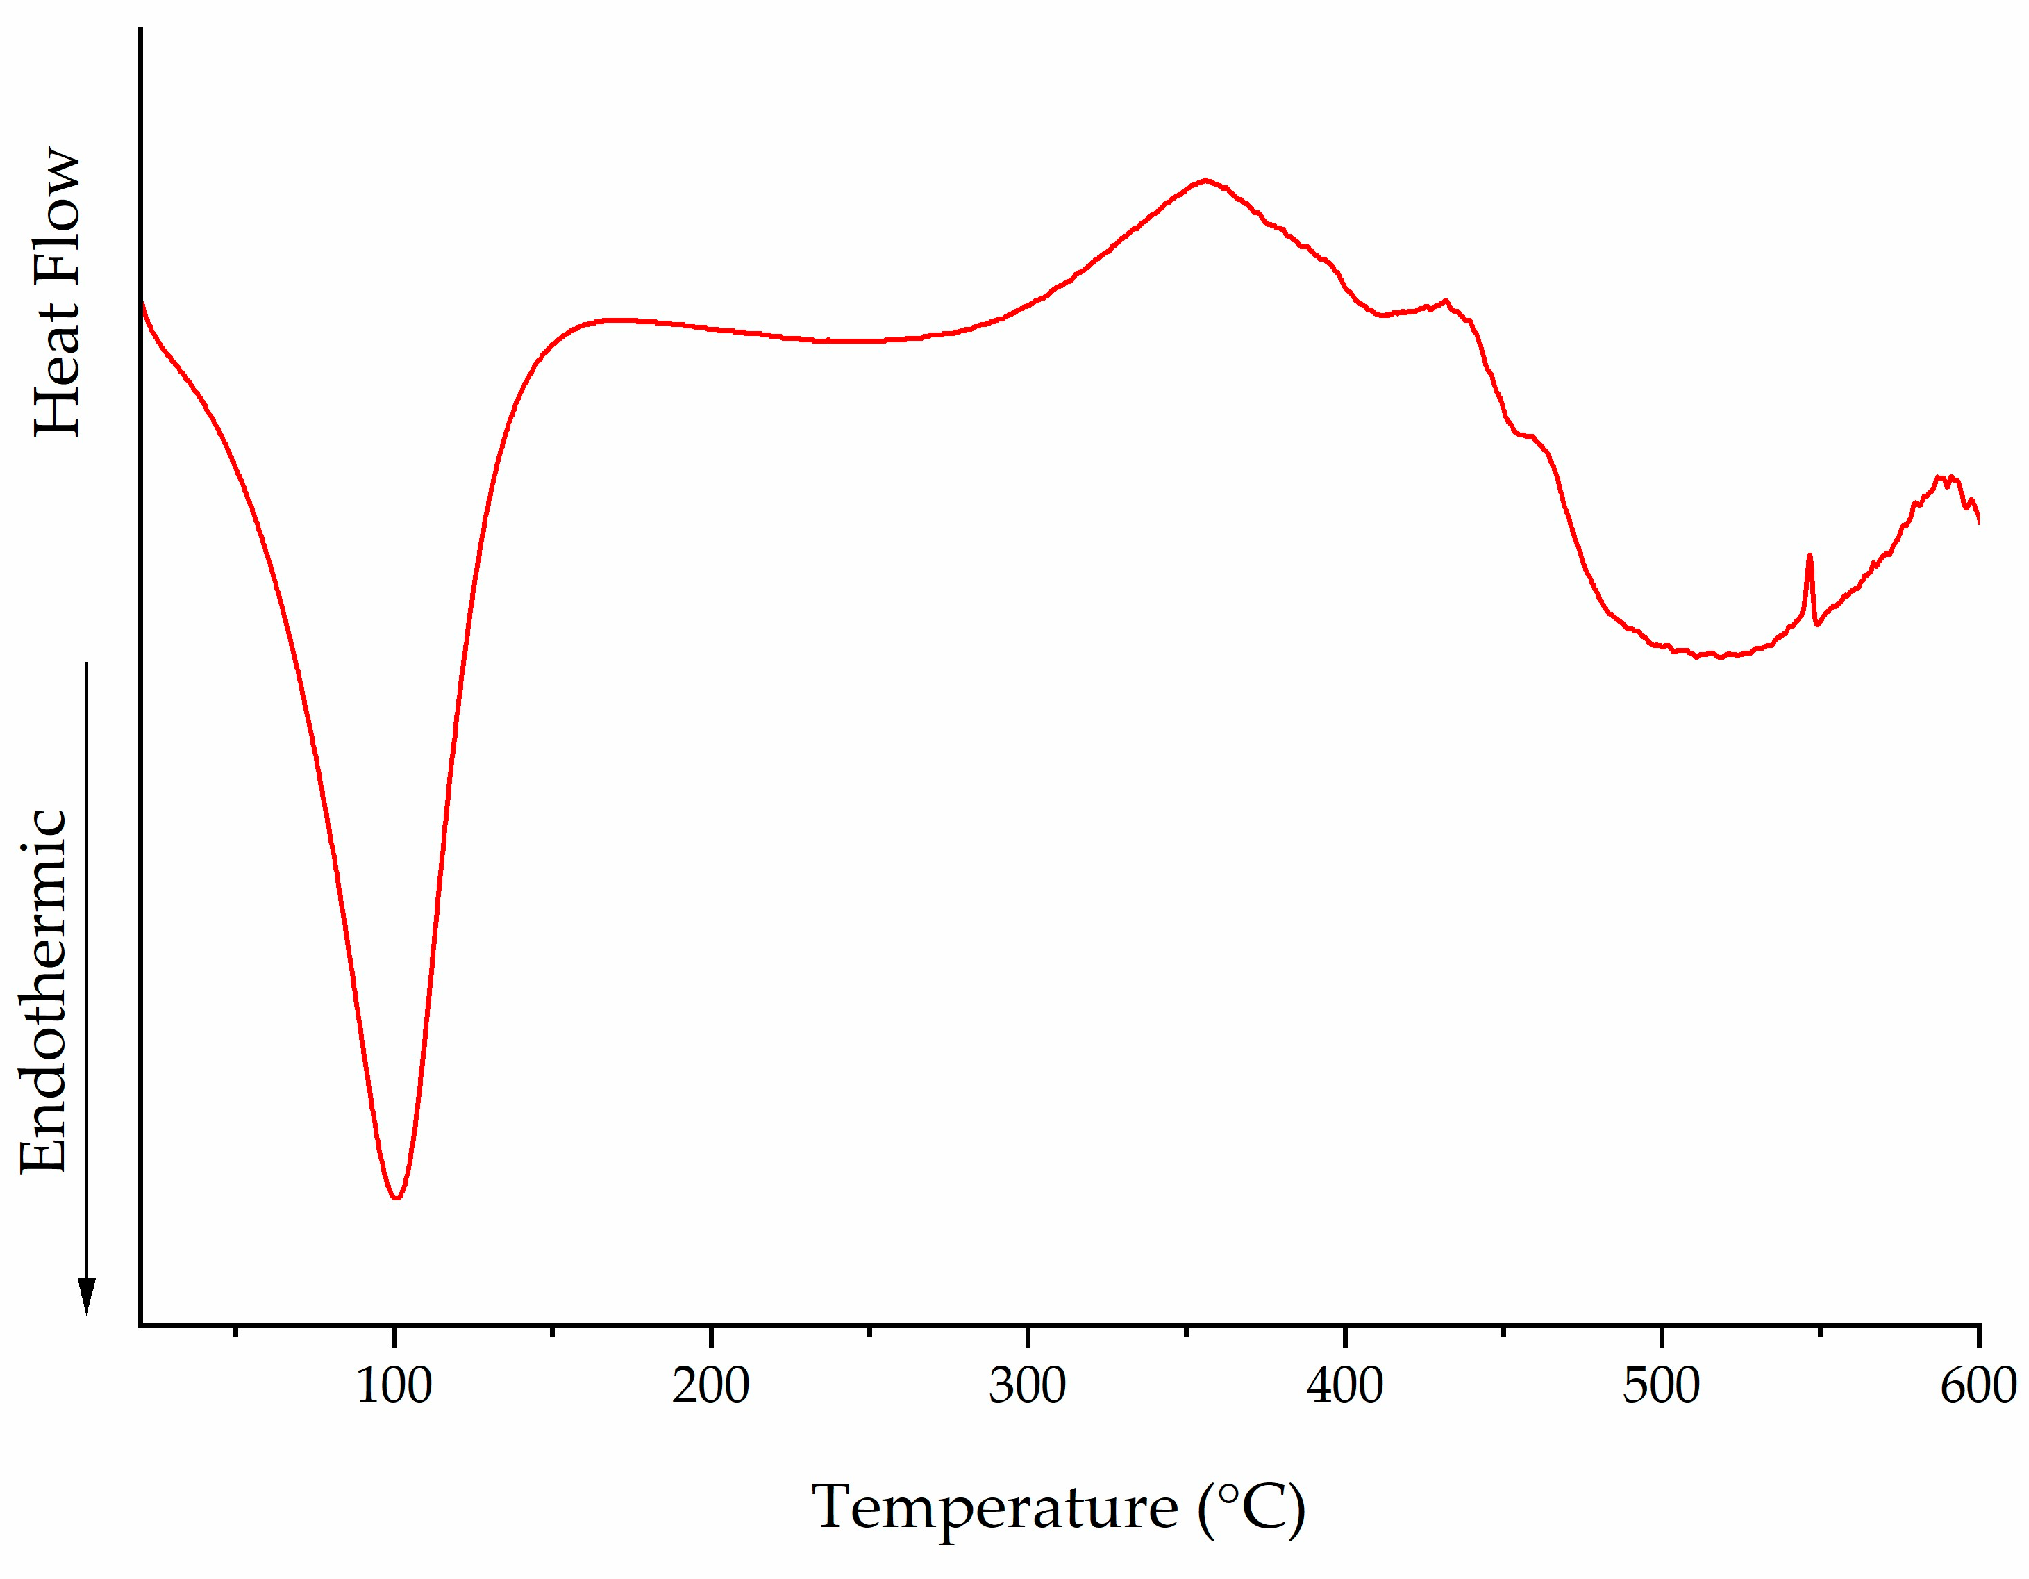
The DSC thermogram of the calcined silica (Figure 4) exhibited a pronounced endothermic peak at approximately 100 °C, attributed to the release of physically adsorbed water and hydrogen-bonded moisture retained within the porous silica network. Despite the calcination treatment, the large specific surface area and the high density of surface silanol groups promote water adsorption under ambient conditions, making this transition characteristic of sol–gel-derived amorphous silica. A broad thermal event extending from approximately 250 to 400 °C, with a maximum near 350 °C, is assigned mainly to the progressive condensation of neighboring silanol groups into siloxane (Si–O–Si) bridges accompanied by structural dehydroxylation. This silanol condensation is a progressive process, and the required temperature is directly influenced by the types of silanol present in the sample, thus necessitating temperatures above 800 °C for isolated -OH groups [43,44]. Further transformations are not observed due to the need for higher temperatures; quartz and cristobalite formation is seen only above 1000 °C [45].
Figure 4.
Differential scanning calorimetry (DSC) thermogram of the two-step silica biotemplated with ora-pro-nóbis (TSOPN).
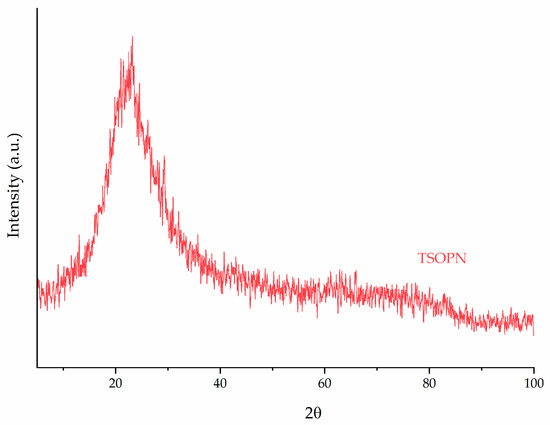
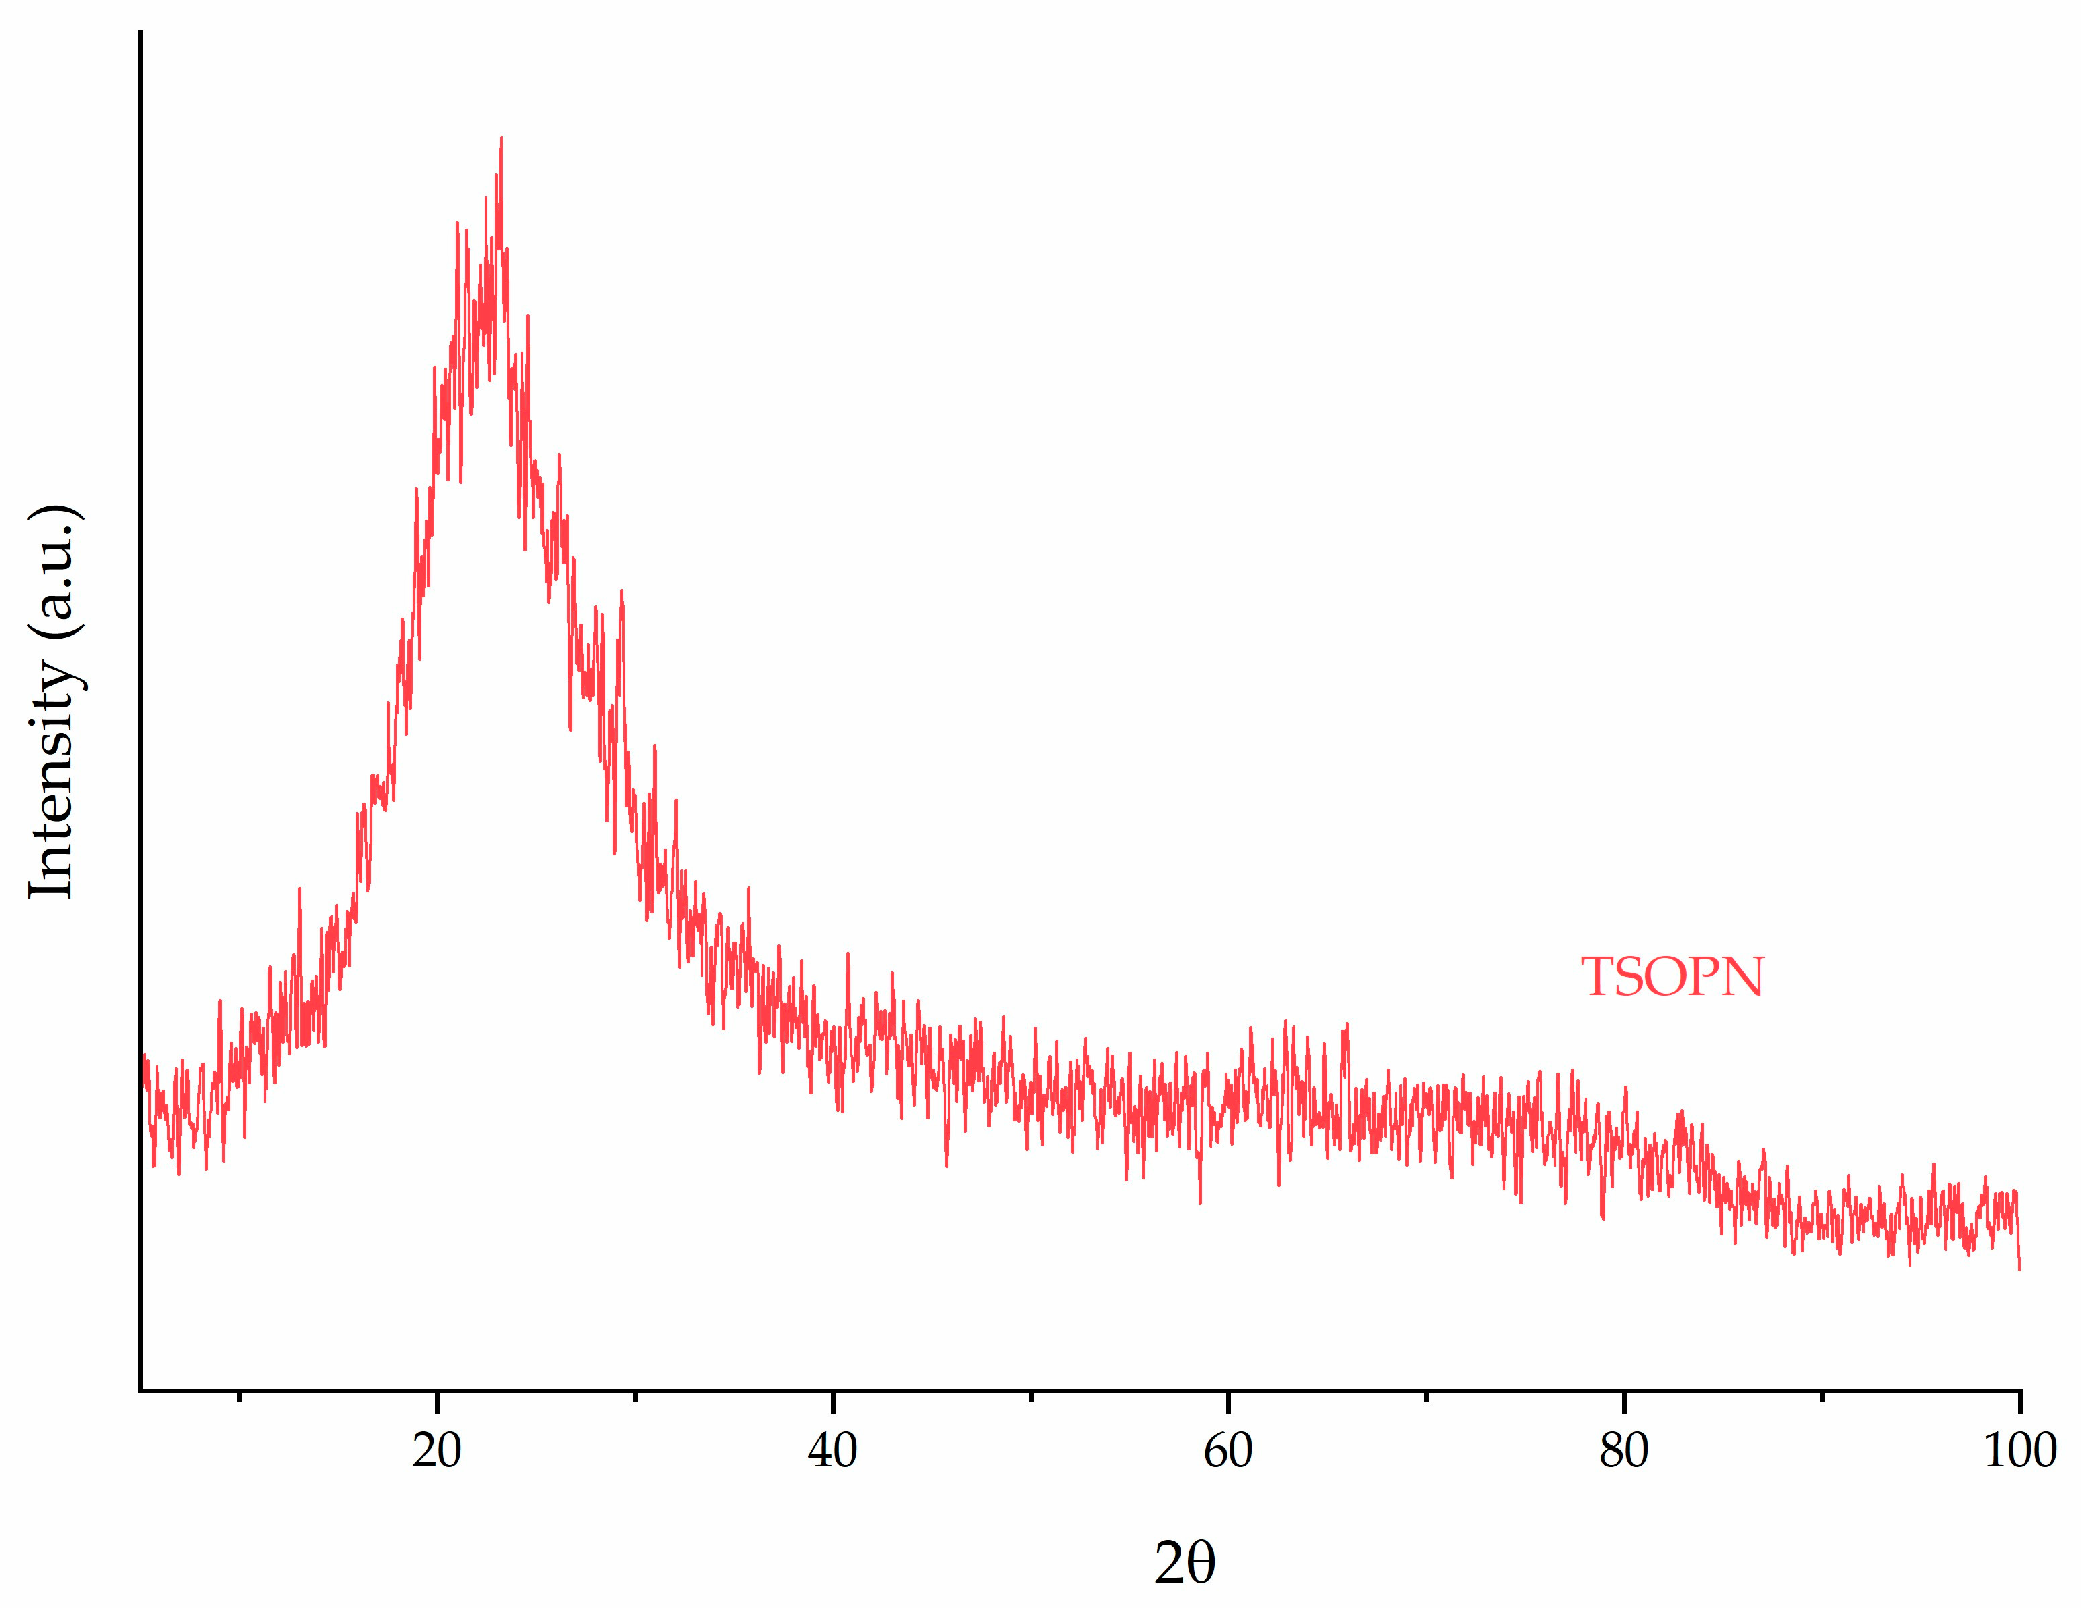
The XRD pattern of TSOPN is presented in Figure 5. The X-ray diffraction (XRD) pattern of the TSOPN sample confirms the highly amorphous nature of the synthesized silica matrix. The diffractogram exhibits a characteristic broad diffraction halo centered at , which is classically assigned to the short-range order of the siloxane (Si–O–Si) network in non-crystalline materials [46]. The complete absence of sharp, high-intensity diffraction peaks indicates a lack of long-range atomic order, confirming that the synthesis and biotemplating processes did not induce the formation of crystalline silica phases, such as quartz or cristobalite.
Figure 5.
X-ray diffraction (XRD) pattern of the two-step silica biotemplated with ora-pro-nóbis (TSOPN).
Collectively, the characterization results confirm that the incorporation of ora-pro-nóbis biomass acted as a porogenic template, modifying the pore diameter, surface hydroxyl characteristics, and morphology of the resulting silica while preserving its amorphous, mesoporous framework. Based on these structural characteristics, the adsorption performance of TSOPN toward erythrosine red was subsequently evaluated, as presented in the following section.
3.2. Adsorption Assays Results
3.2.1. pH Effect on Erythrosine Red Adsorption
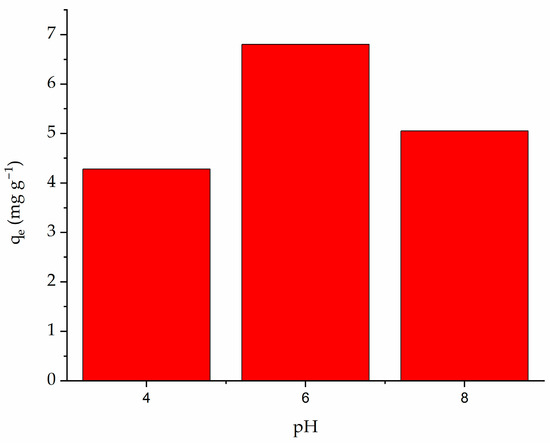
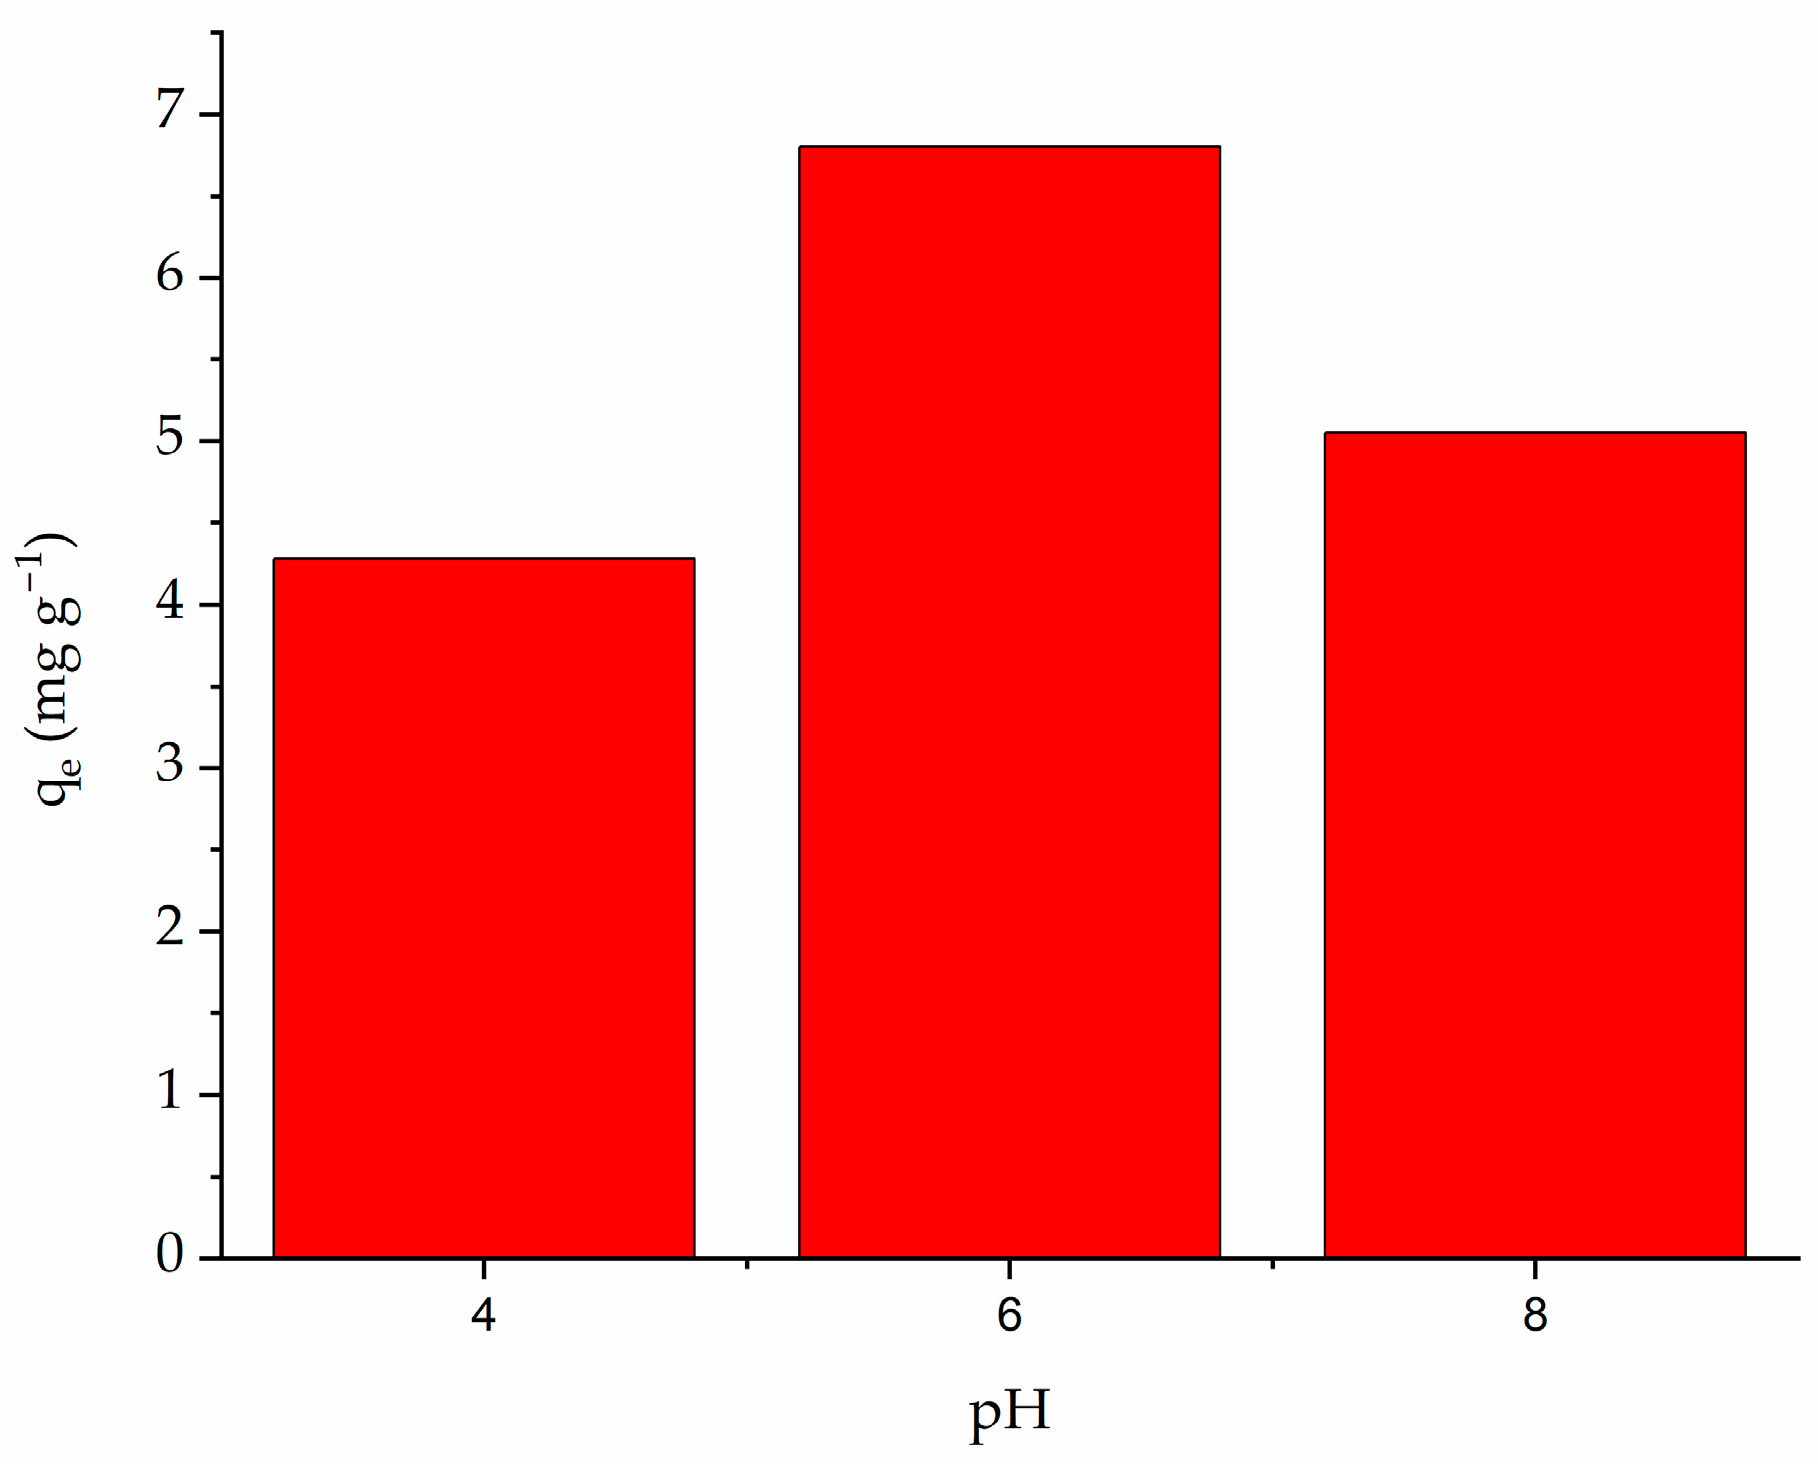
The effect of solution pH on the adsorption of erythrosine using the modified silica adsorbent was evaluated at pH 4, 6, and 8. Solution pH is a key parameter in adsorption processes because it influences both the ionization state of the dye and the surface chemistry of the adsorbent, thereby affecting the interactions between them. As shown in Figure 6, the highest adsorption capacity was obtained at pH 6, whereas lower adsorption capacities were observed at pH 4 and 8, in agreement with the results reported by Eser et al. [47]. Erythrosine Red exhibits two pKa values: a lower one at 3.6 and a higher one around 5.5. Thus, above this pH, the dye is fully ionized. Consequently, the fact that adsorption capacity is higher at near-neutral pH is likely related to the effect of the medium on the adsorbent material.
Figure 6.
Effect of solution pH on the adsorption capacity of erythrosine by the two-step silica biotemplated with ora-pro-nóbis (TSOPN). Experimental conditions: initial erythrosine concentration = 100 mg L−1; adsorbent dose = 2.5 g L−1; contact time = 24 h; agitation rate = 100 rpm; temperature = 25 °C.
3.2.2. Adsorption Kinetics
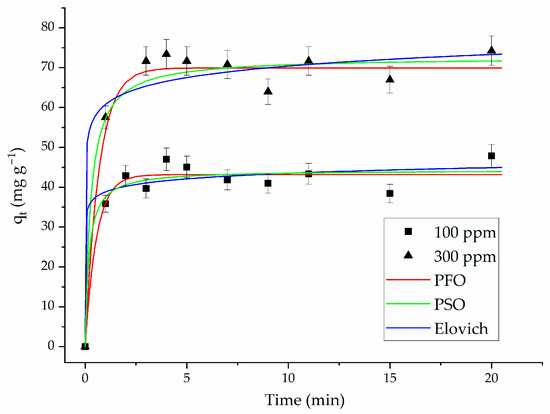
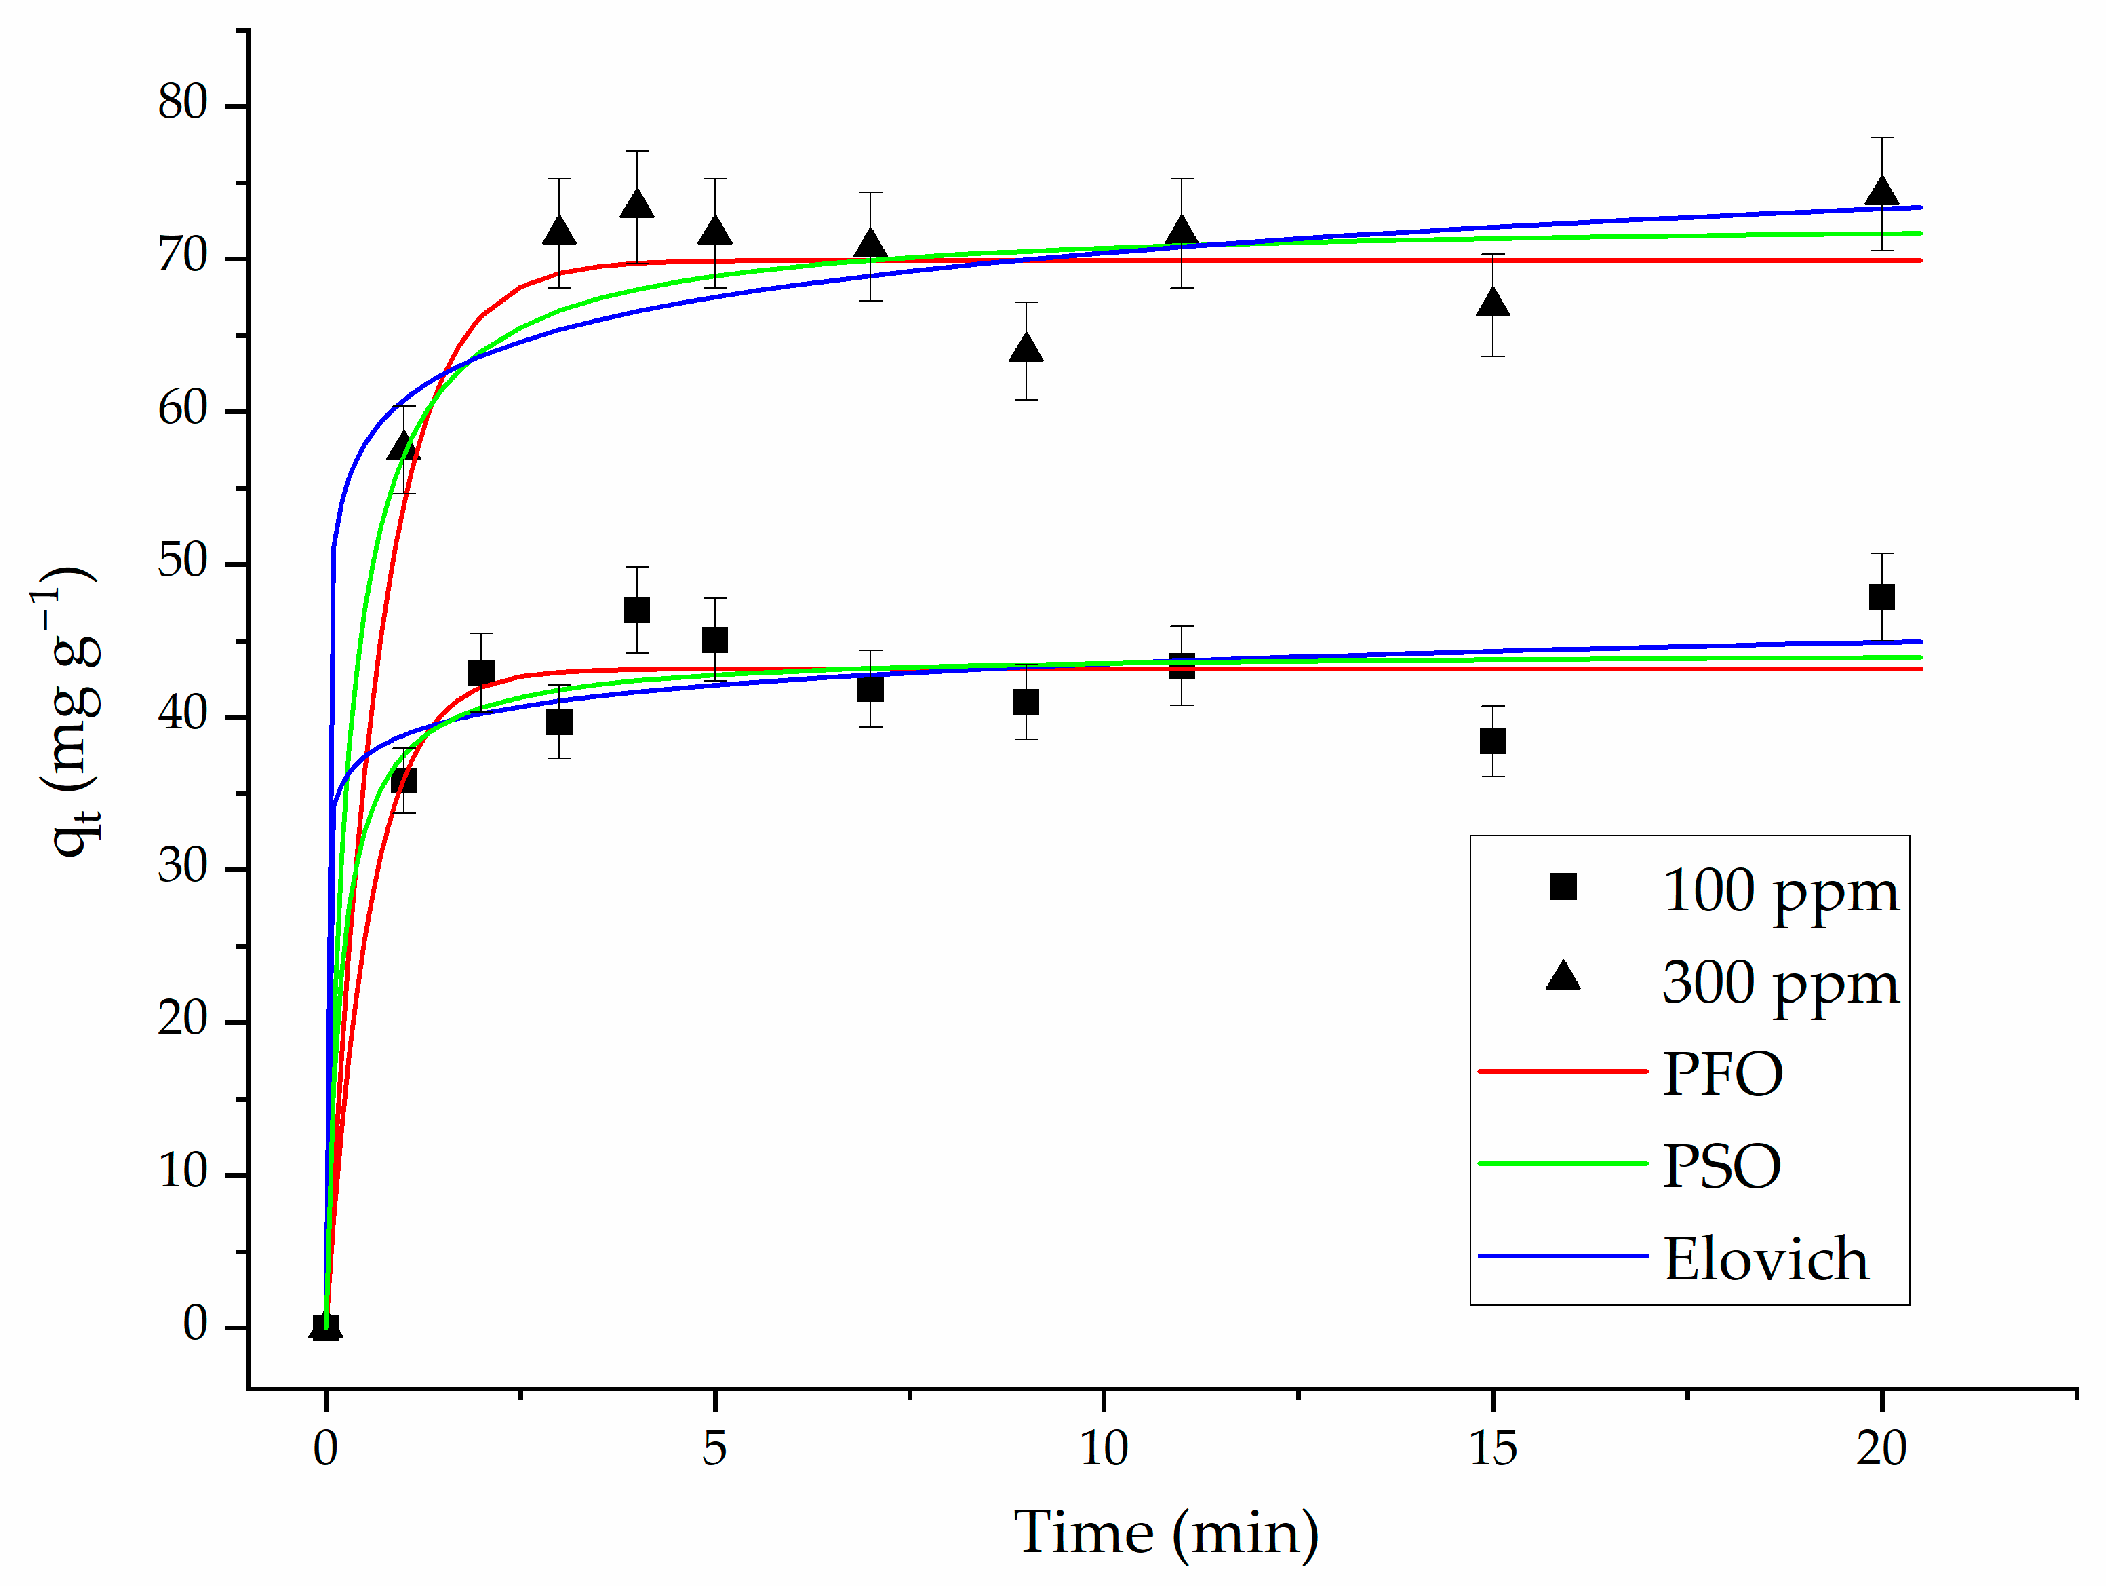
The adsorption kinetics were investigated by plotting adsorption capacity as a function of contact time. The experimental data were fitted using the pseudo-first-order (PFO), pseudo-second-order (PSO), and Elovich kinetic models to evaluate the adsorption behavior and possible rate-controlling mechanisms. The estimated model parameters and corresponding goodness-of-fit indicators are presented in Table 1. The experimental equilibrium adsorption capacities (qexp) showed good agreement with the values predicted by both the PFO and PSO models, with the PFO estimates being closer to the experimental values. Considering this agreement together with the R2 and ARE values, the PFO model provided the best overall description of the experimental kinetic data. The better agreement with the PFO model suggests that the adsorption rate is mainly associated with the availability of adsorption sites on the adsorbent surface and that the adsorption process rapidly approaches equilibrium. The results indicate that surface interactions, including electrostatic attractions and other intermolecular forces, may contribute to erythrosine adsorption. Similar kinetic behavior has been reported for dye adsorption systems using carbon-based adsorbents, where the PFO model adequately described the adsorption process [21,22].
Table 1.
Kinetic parameters for erythrosine red adsorption onto TSOPN (modified silica-based material).
Figure 7 shows the experimental kinetic behavior of the adsorption systems studied. As observed, the adsorption process reached equilibrium rapidly, within approximately 5–7 min of contact time. This fast adsorption rate may be attributed to the high availability of accessible active sites on the adsorbent surface and the low resistance to mass transfer between the adsorbate and adsorbent phases. The rapid equilibrium observed in this study differs significantly from the behavior reported by Carmen Apostol et al. [1], who investigated the adsorption of the same contaminant using pumpkin seed hulls derived from agricultural waste. In their study, significant changes in adsorbate concentration were observed even after 5 h of contact time, indicating slower adsorption kinetics. This difference may be related to the distinct physicochemical characteristics of the adsorbents, including surface chemistry, pore structure, and accessibility of active adsorption sites.
Figure 7.
Experimental kinetic curves and fitted pseudo-first-order (PFO), pseudo-second-order (PSO), and Elovich kinetic models for erythrosine red adsorption onto TSOPN. Experimental conditions: initial erythrosine concentrations = 100 and 300 mg L−1; adsorbent dose = 1.0 g L−1; pH = 6; agitation rate = 200 rpm; temperature = 25 ± 1 °C; contact time = 20 min.
3.2.3. Adsorption Isotherms
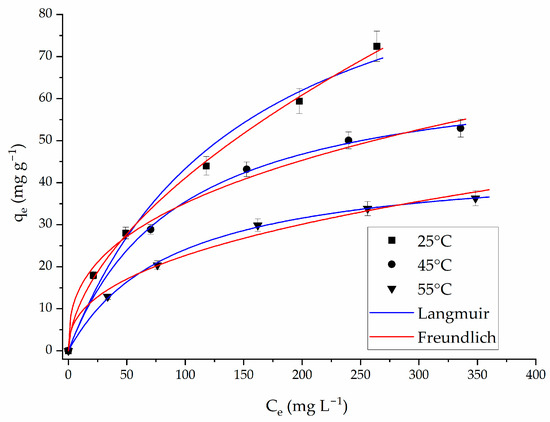
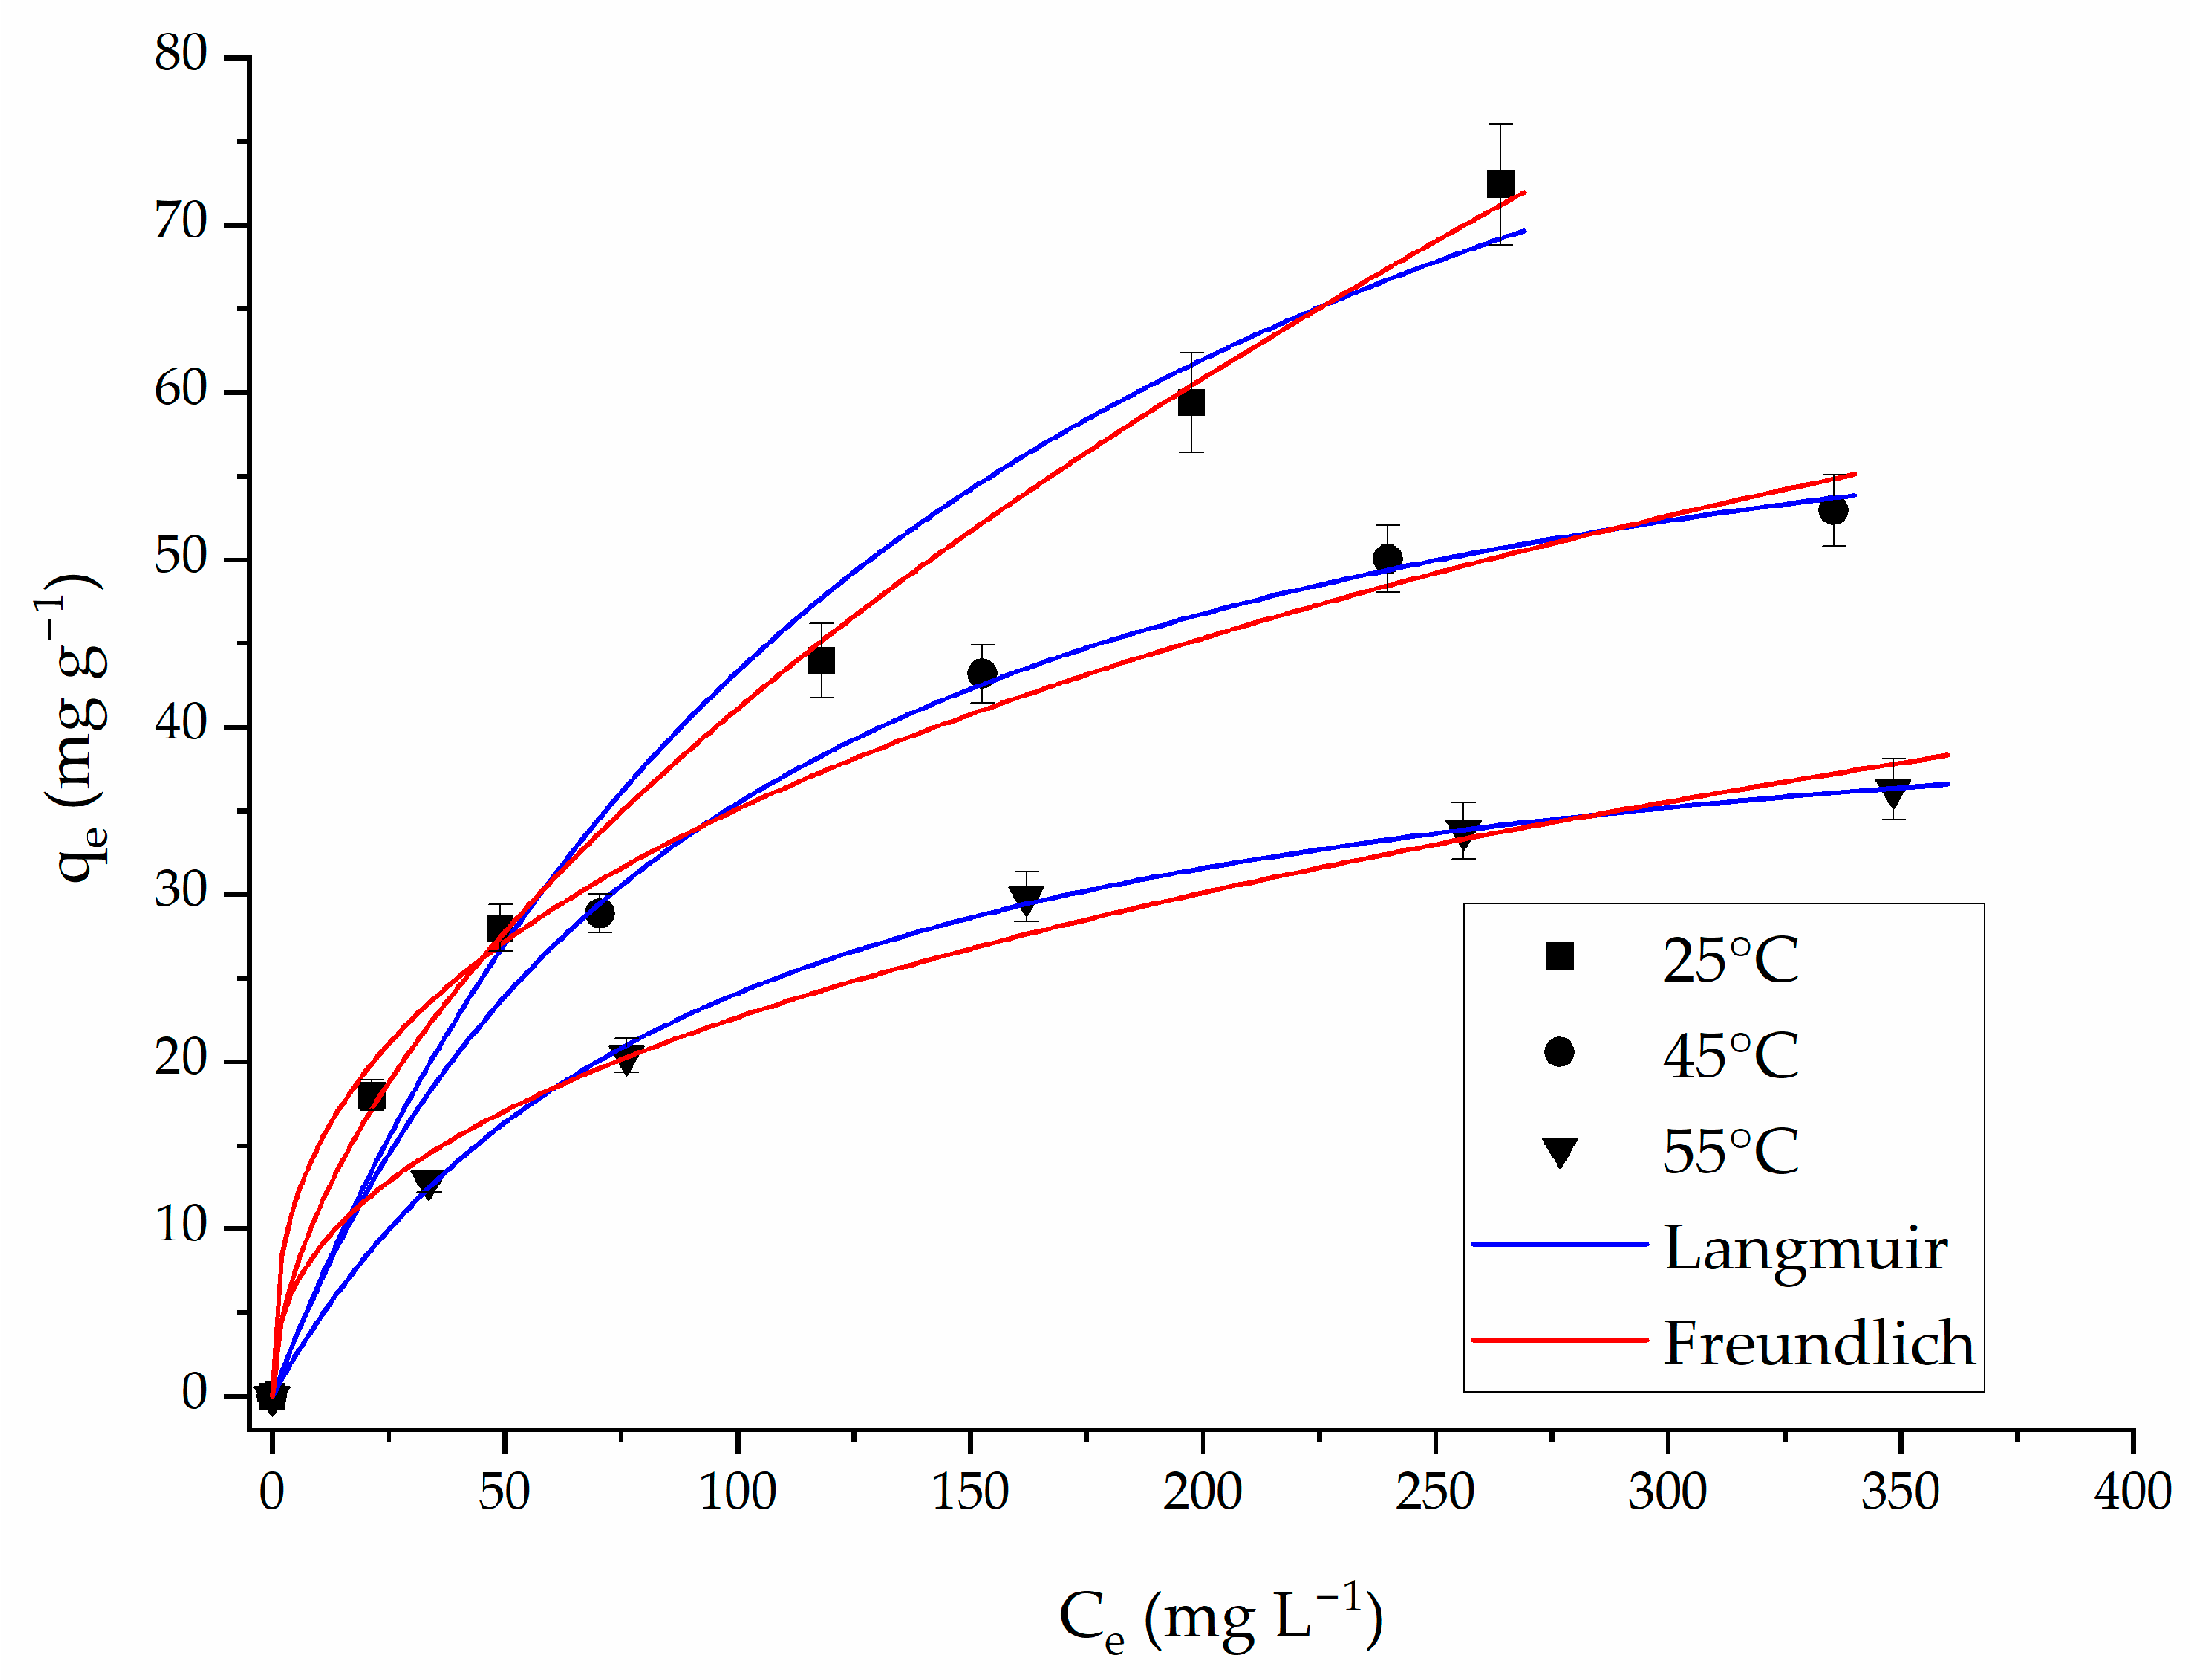
Adsorption isotherms were determined to investigate the equilibrium behavior of erythrosine red adsorption onto the modified silica-based material from aqueous solution. The experimental equilibrium data were analyzed using the Langmuir and Freundlich isotherm models. Figure 8 shows the adsorption equilibrium isotherms obtained at the investigated temperatures. As observed, the adsorption capacity decreased with increasing temperature, indicating that higher temperatures negatively affected the adsorption process. The maximum adsorption capacity exceeded 70 mg·g−1 at 25 °C, while values below 40 mg·g−1 were obtained at 55 °C. This behavior suggests that the adsorption process is favored at lower temperatures, which may be associated with the exothermic nature of erythrosine adsorption onto the modified silica-based material. The decrease in adsorption capacity at elevated temperatures may result from the weakening of adsorbate–adsorbent interactions and/or increased mobility of erythrosine molecules in solution, leading to a lower affinity for the active adsorption sites.
Figure 8.
Adsorption equilibrium curves of erythrosine red onto the TSOPN (modified silica-based material) at different temperatures. Experimental conditions: initial erythrosine concentrations = 50–400 mg L−1; adsorbent dose = 1.0 g L−1; pH = 6; contact time = 24 h; agitation rate = 100 rpm; temperatures = 25, 45, and 55 °C.
As shown in Table 2, both Langmuir and Freundlich models provided satisfactory descriptions of the erythrosine red adsorption equilibrium onto TSOPN, presenting high correlation coefficients (R2 ≥ 0.98) and low average relative errors (ARE < 8%). The Langmuir model showed a good agreement with the experimental data at all investigated temperatures, suggesting that adsorption may occur through the formation of a monolayer on a finite number of homogeneous adsorption sites. The maximum adsorption capacity (qm) estimated by the Langmuir model decreased from 108.81 mg·g−1 at 25 °C to 45.73 mg·g−1 at 55 °C, confirming that lower temperatures favor erythrosine red adsorption onto TSOPN.
Table 2.
Isotherm parameters for erythrosine red adsorption onto TSOPN (modified silica-based material).
The Freundlich model also showed an adequate fit, indicating the possible contribution of heterogeneous adsorption sites with different affinities toward erythrosine red molecules. The values of the Freundlich parameter n were higher than 1 (1.76–2.63), suggesting favorable adsorption over the investigated temperature range. The decrease in adsorption capacity with increasing temperature observed for both models indicates that the adsorption process is less favorable at elevated temperatures, which may be related to the weakening of adsorbate–adsorbent interactions. Overall, the equilibrium results suggest that TSOPN provides a favorable surface for erythrosine red removal, with the highest adsorption capacity achieved at 25 °C.
The adsorption performance of TSOPN was compared with that of other adsorbents previously reported for erythrosine removal (Table 3). Activated carbon, one of the most widely used adsorbents for contaminant removal, has also been investigated for erythrosine adsorption, with a reported maximum adsorption capacity of 89.3 mg g−1. Among the adsorbents included in the comparison, montmorillonite exhibited the highest reported adsorption capacity, followed by Prosopis spicigera wood carbon–iron oxide composite and Rhizopus arrhizus biomass. Although these materials exhibited higher adsorption capacities than TSOPN, the synthesized silica showed a competitive performance and a higher adsorption capacity than the activated carbon included in the comparison.
Table 3.
Comparison of the maximum adsorption capacity of different adsorbents for erythrosine removal.
3.2.4. Adsorption Thermodynamics
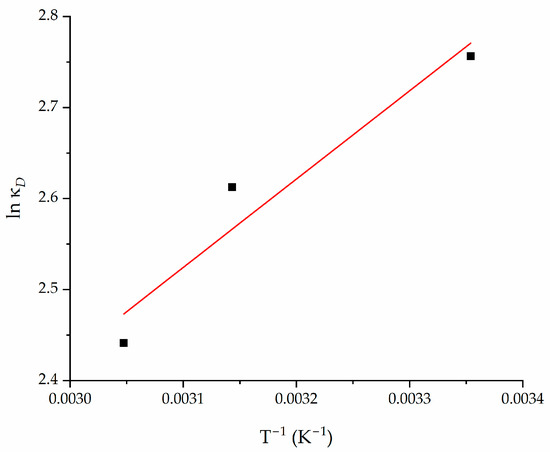
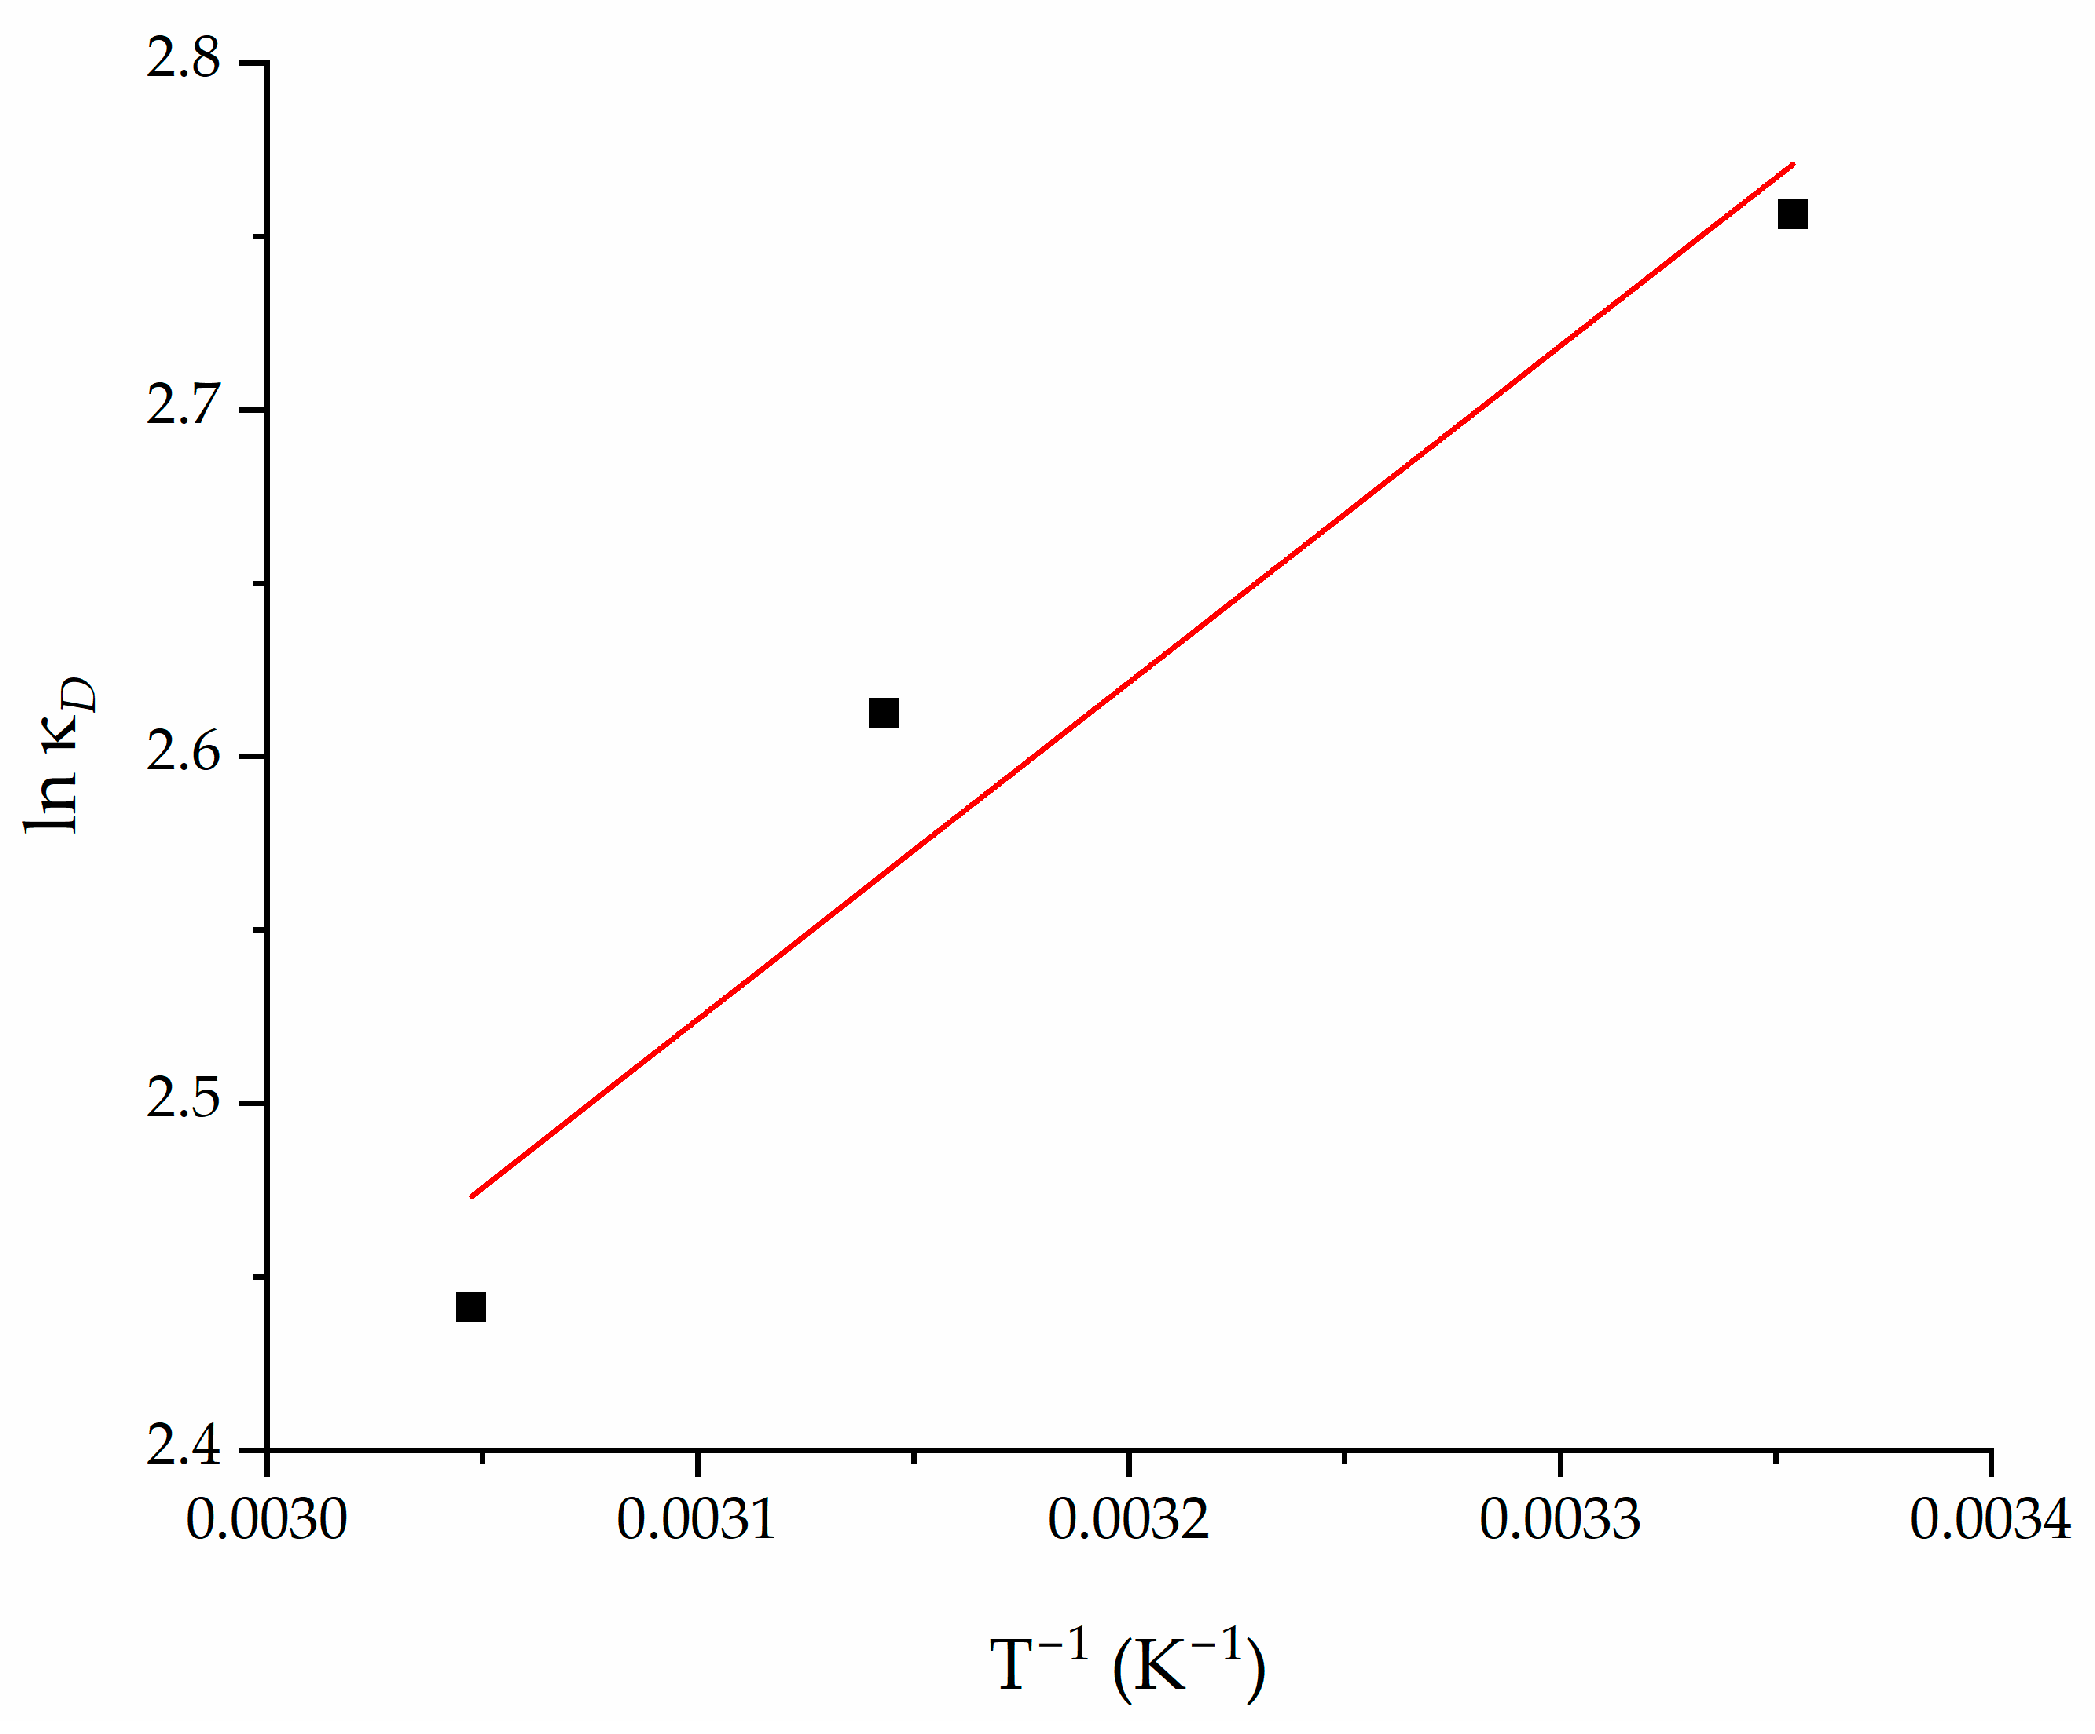
Figure 9 presents the Van’t Hoff plot for erythrosine red adsorption onto TSOPN. The linear relationship between ln(KD) and 1/T confirms the applicability of the Van’t Hoff equation and allows the determination of the thermodynamic parameters associated with the adsorption process (R2 = 0.9319).
Figure 9.
Van’t Hoff plot for erythrosine red adsorption onto TSOPN, showing the temperature effect on the adsorption thermodynamic behavior. The red line represents the linear regression model obtained.
The equilibrium constant values used for the Van’t Hoff analysis are presented in Table 4. From these values, the thermodynamic parameters, including Gibbs free energy change (ΔG°), enthalpy change (ΔH°), and entropy change (ΔS°), were calculated. The negative values of ΔG° obtained at all investigated temperatures indicate that erythrosine red adsorption onto TSOPN occurred spontaneously and was thermodynamically favorable. The similar ΔG°; values observed over the temperature range studied (−6.66 to −6.91 kJ mol−1) suggest that the adsorption process remained favorable despite temperature variations. The negative ΔH° value (−8.07 kJ mol−1) confirms the exothermic nature of the adsorption process, which is consistent with the decrease in adsorption capacity observed at higher temperatures. The low magnitude of ΔH° suggests that the adsorption process is mainly associated with weak interactions between erythrosine red molecules and the TSOPN surface. Therefore, physical interactions, such as electrostatic attractions and intermolecular forces, may play an important role in the adsorption mechanism. The negative ΔS° value (−4.04 J mol−1 K−1) indicates a decrease in randomness at the solid–liquid interface during adsorption, suggesting a more ordered arrangement of erythrosine red molecules after their interaction with the TSOPN surface. Furthermore, the thermodynamic parameters indicate that the adsorption process is primarily enthalpy-driven, as the favorable enthalpic contribution overcomes the unfavorable entropy effect, resulting in negative ΔG° values throughout the investigated temperature range.
Table 4.
Thermodynamic parameters for erythrosine red adsorption onto TSOPN.
4. Conclusions
A porous silica adsorbent was successfully synthesized by a two-step sol–gel process using Pereskia aculeata Miller (ora-pro-nóbis) as a natural porogenic biotemplate. The characterization results confirmed that the incorporation and subsequent calcination of the biotemplate modified the pore architecture of the resulting amorphous silica while preserving the characteristic Si–O–Si framework. Compared with non-biotemplated silica, TSOPN exhibited a larger average BJH pore diameter, despite a decrease in BET specific surface area, demonstrating the porogenic effect of the biomass. The resulting material presented a significant contribution of microporosity associated with small mesopores and a rough and irregular surface morphology. FTIR analysis further indicated modifications in the silica network and surface hydroxyl groups associated with the biotemplating process.
The synthesized material proved to be an efficient adsorbent for the removal of Erythrosine Red from aqueous solutions. The adsorption process was strongly influenced by the solution pH, with maximum performance observed at pH 6. Equilibrium was reached quickly, indicating rapid adsorption kinetics under the investigated conditions. Equilibrium data were satisfactorily described by the Langmuir model, indicating predominantly monolayer adsorption on energetically similar sites, with a maximum adsorption capacity of 108.81 mg g−1 at 25 °C. Thermodynamic analysis revealed that adsorption was spontaneous, exothermic, and predominantly physisorption-driven, with enthalpy as the primary driving force.
Overall, the results highlight the potential of ora-pro-nóbis biomass as a renewable porogenic biotemplate for tailoring the pore architecture of sol–gel-derived silica, while contributing to the valorization of an underutilized biomass resource. This approach represents a promising route for the development of porous silica materials for environmental applications. Further studies directly comparing biotemplated and non-biotemplated silica would provide additional insight into the relationship between the structural modifications induced by the biotemplate and adsorption performance.
Author Contributions
Conceptualization: J.H.Z.S., G.R.R. and T.R.S.C.J.; methodology: J.H.Z.S., G.R.R., B.S. and T.R.S.C.J.; formal analysis: M.Z.F.A., D.P.J., L.A.A.P., T.R.S.C.J. and N.d.S.J.; investigation: B.G.B., C.S.F., C.R., B.S., M.C.S., C.d.S., L.H.H. and M.Z.F.A.; data curation: D.P.J., T.R.S.C.J. and N.d.S.J.; writing—original draft preparation: B.G.B. and C.S.F.; writing—review and editing: M.Z.F.A., D.P.J., L.A.A.P., T.R.S.C.J. and N.d.S.J.; supervision: G.R.R., J.H.Z.S., T.R.S.C.J. and N.d.S.J.; funding acquisition: J.H.Z.S., G.R.R., L.A.A.P. and T.R.S.C.J. All authors have read and agreed to the published version of the manuscript.
Funding
This work was supported by Coordenação de Aperfeiçoamento de Pessoal de Nível Superior (CAPES), Conselho Nacional de Desenvolvimento Científico e Tecnológico (CNPq) and Fundação de Amparo à Pesquisa do Estado do Rio Grande do Sul (FAPERGS).
Data Availability Statement
The raw data supporting the conclusions of this article will be made available by the authors on request.
Acknowledgments
The authors acknowledge the technical support and the use of facilities provided by the Integrated Analysis Center (CIA) and the Center for Electron Microscopy of the South (CEME-SUL) at the Federal University of Rio Grande (FURG). All individuals included in the Acknowledgements section have consented to being acknowledged.
Conflicts of Interest
The authors declare no conflicts of interest.
References
- Carmen Apostol, L.; Ghinea, C.; Alves, M.; Gavrilescu, M. Removal of Erythrosine B Dye from Water Effluents Using Crop Waste Pumpkin Seed Hulls as Adsorbent. Desalin. Water Treat. 2016, 57, 22585–22608. [Google Scholar] [CrossRef] [Scilit]
- Gupta, N.; Kushwaha, A.K.; Chattopadhyaya, M.C. Adsorption Studies of Cationic Dyes onto Ashoka (Saraca asoca) Leaf Powder. J. Taiwan Inst. Chem. Eng. 2012, 43, 604–613. [Google Scholar] [CrossRef] [Scilit]
- Gupta, V.K.; Mittal, A.; Kurup, L.; Mittal, J. Adsorption of a Hazardous Dye, Erythrosine, over Hen Feathers. J. Colloid Interface Sci. 2006, 304, 52–57. [Google Scholar] [CrossRef] [Scilit] [PubMed]
- Mittal, A.; Mittal, J.; Kurup, L.; Singh, A.K. Process Development for the Removal and Recovery of Hazardous Dye Erythrosine from Wastewater by Waste Materials—Bottom Ash and De-Oiled Soya as Adsorbents. J. Hazard. Mater. 2006, 138, 95–105. [Google Scholar] [CrossRef] [Scilit] [PubMed]
- Salvi, N.A. Decolorization of Erythrosine B by Rhizopus arrhizus Biomass. Appl. Water Sci. 2018, 8, 205. [Google Scholar] [CrossRef] [Scilit]
- Gao, Y.; Wu, W.; Shen, L.; Qu, J.; Li, Y.; Sun, D.; Dong, Z.; Ding, L. Adsorption Behavior and Mechanism Insight of Organoarsenic Compounds on Magnetic Ion Exchange Resin Based on the Combined Method of DFT Calculation and Characterization. J. Water Process Eng. 2025, 70, 107029. [Google Scholar] [CrossRef] [Scilit]
- Pivokonsky, M.; Novotna, K.; Petricek, R.; Cermakova, L.; Prokopova, M.; Naceradska, J. Fundamental Chemical Aspects of Coagulation in Drinking Water Treatment—Back to Basics. J. Water Process Eng. 2024, 57, 104660. [Google Scholar] [CrossRef] [Scilit]
- Zaharia, C.; Musteret, C.P.; Afrasinei, M.A. The Use of Coagulation–Flocculation for Industrial Colored Wastewater Treatment—(I) The Application of Hybrid Materials. Appl. Sci. 2024, 14, 2184. [Google Scholar] [CrossRef] [Scilit]
- Qin, J.; Chen, Y.; Zhang, R.; Orooji, Y. Late-Miocene Red Clay as a Natural Fe-Oxide Heterojunction Photocatalyst for Visible-Light Remediation of Hazardous Synthetic Dyes. Environ. Technol. Innov. 2026, 43, 105029. [Google Scholar] [CrossRef] [Scilit]
- Panneerselvam, A.; Velayutham, J.; Ramasamy, S. Green Synthesis of TiO2 Nanoparticles Prepared from Phyllanthus Niruri Leaf Extract for Dye Adsorption and Their Isotherm and Kinetic Studies. IET Nanobiotechnol. 2021, 15, 164–172. [Google Scholar] [CrossRef] [Scilit] [PubMed]
- Dotto, G.L.; Gonçalves, J.O.; Cadaval, T.R.S.; Pinto, L.A.A. Biosorption of Phenol onto Bionanoparticles from Spirulina sp. LEB 18. J. Colloid Interface Sci. 2013, 407, 450–456. [Google Scholar] [CrossRef] [Scilit] [PubMed]
- Santana Cadaval, T.R.; Camara, A.S.; Dotto, G.L.; Pinto, L.A.d.A. Adsorption of Cr (VI) by Chitosan with Different Deacetylation Degrees. Desalin. Water Treat. 2013, 51, 7690–7699. [Google Scholar] [CrossRef] [Scilit]
- Rial, J.B.; Ferreira, M.L. Potential Applications of Spent Adsorbents and Catalysts: Re-Valorization of Waste. Sci. Total Environ. 2022, 823, 153370. [Google Scholar] [CrossRef] [Scilit] [PubMed]
- Sithole, T. A Review on Regeneration of Adsorbent and Recovery of Metals: Adsorbent Disposal and Regeneration Mechanism. S. Afr. J. Chem. Eng. 2024, 50, 39–50. [Google Scholar] [CrossRef] [Scilit]
- Jain, R.; Sikarwar, S. Adsorptive Removal of Erythrosine Dye onto Activated Low Cost De-Oiled Mustard. J. Hazard. Mater. 2009, 164, 627–633. [Google Scholar] [CrossRef] [Scilit] [PubMed]
- Barman, M.K. Recent Advancements of Silica Supported Hybrid Composite Materials and Its Application for Heavy and Toxic Metal Ion Removal: A Review. Geomicrobiol. J. 2026, 43, 387–409. [Google Scholar] [CrossRef] [Scilit]
- Rosa, C.H.; Rosa, G.R.; Lopes, T.J.; dos Santos, J.H.Z. Synthesis and Characterization of Silica-Based Adsorbents Employing Maize Stalks as Porogenic Agents and Their Application in Phenol Removal. Water Air Soil Pollut. 2024, 235, 227. [Google Scholar] [CrossRef] [Scilit]
- Sapawe, N.; Surayah Osman, N.; Zulkhairi Zakaria, M.; Amirul Shahab Syed Mohamad Fikry, S.; Amir Mat Aris, M. Synthesis of Green Silica from Agricultural Waste by Sol-Gel Method. Mater. Today Proc. 2018, 5, 21861–21866. [Google Scholar] [CrossRef] [Scilit]
- Ma, X.; Bai, X.; Chen, X.; Zhang, C.; Leng, J.; Zhang, A.; Chen, D.; Wang, J. Biotemplated Heterostructure Materials: Opportunities for the Elaboration of New Photocatalysts and Selective-Oxidation Catalysts. Catal. Sci. Technol. 2024, 14, 10–25. [Google Scholar] [CrossRef] [Scilit]
- Sakthivel, A. Algae and Microalgae Biotemplates for Catalyst Preparation. In Biotemplated Catalysts; Elsevier: Oxford, UK, 2026; pp. 133–154. [Google Scholar]
- Al-Amrani, W.A.; Hanafiah, M.A.K.M.; Mohammed, A.H.A. A Comprehensive Review of Anionic Azo Dyes Adsorption on Surface-Functionalised Silicas. Environ. Sci. Pollut. Res. 2022, 29, 76565–76610. [Google Scholar] [CrossRef] [Scilit] [PubMed]
- Cashin, V.B.; Eldridge, D.S.; Yu, A.; Zhao, D. Surface Functionalization and Manipulation of Mesoporous Silica Adsorbents for Improved Removal of Pollutants: A Review. Environ. Sci. 2018, 4, 110–128. [Google Scholar] [CrossRef] [Scilit]
- Maciel, V.B.V.; Bezerra, R.Q.; das Chagas, E.G.L.; Yoshida, C.M.P.; Carvalho, R.A. de Ora-pro-Nobis (Pereskia aculeata Miller): A Potential Alternative for Iron Supplementation and Phytochemical Compounds. Braz. J. Food Technol. 2021, 24, e2020180. [Google Scholar] [CrossRef] [Scilit]
- Sun, M.; He, X.; Wang, B.; Liang, J.; Yi, H.; Zhang, T. Preparation of Bionic Porous Al2O3 from Green Leaf of Epipremnum Aureum as a Biotemplate. Ceram. Int. 2022, 48, 7309–7315. [Google Scholar] [CrossRef] [Scilit]
- Yan, Z.; He, J.; Guo, L.; Li, Y.; Duan, D.; Chen, Y.; Li, J.; Yuan, F.; Wang, J. Biotemplated Mesoporous TiO2/SiO2 Composite Derived from Aquatic Plant Leaves for Efficient Dye Degradation. Catalysts 2017, 7, 82. [Google Scholar] [CrossRef] [Scilit]
- Ruthven, D.M. Principles of Adsorption and Adsorption Processes, 1st ed.; John Wiley & Sons: New York, NY, USA, 1984. [Google Scholar]
- Ho, Y.S.; McKay, G. Sorption of Dye from Aqueous Solution by Peat. Chem. Eng. J. 1998, 70, 115–124. [Google Scholar] [CrossRef]
- Zeldowitsch, J. Über Den Mechanismus Der Katalytischen Oxydation von CO an MnO2. Acta Physicochem. URSS 1934, 1, 364–449. [Google Scholar]
- Lagergren, S. About the Theory of So-Called Adsorption of Soluble Substances. K. Sven. Vetenskapsakademiens Handl. 1898, 24, 1–39. [Google Scholar]
- Geankoplis, C.J. Transport Processes and Unit Operations, 3rd ed.; Prentice-Hall, Inc.: Englewood Cliffs, NJ, USA, 1993. [Google Scholar]
- Langmuir, I. The adsorption of gases on plane surfaces of glass, mica and platinum. J. Am. Chem. Soc. 1918, 40, 1361–1403. [Google Scholar] [CrossRef] [Scilit]
- Freundlich, H. Über Die Adsorption in Lösungen. Z. Für Phys. Chem. 1907, 57U, 385–470. [Google Scholar] [CrossRef] [Scilit]
- Zhang, K.; Xu, J.; Wang, K.Y.; Cheng, L.; Wang, J.; Liu, B. Preparation and Characterization of Chitosan Nanocomposites with Vermiculite of Different Modification. Polym. Degrad. Stab. 2009, 94, 2121–2127. [Google Scholar] [CrossRef] [Scilit]
- Milonjic, S. A Consideration of the Correct Calculation of Thermodynamic Parameters of Adsorption. J. Serbian Chem. Soc. 2007, 72, 1363–1367. [Google Scholar] [CrossRef] [Scilit]
- Innocenzi, P. Infrared Spectroscopy of Sol–Gel Derived Silica-Based Films: A Spectra-Microstructure Overview. J. Non-Cryst. Solids 2003, 316, 309–319. [Google Scholar] [CrossRef] [Scilit]
- Zhuravlev, L.T. The Surface Chemistry of Amorphous Silica. Zhuravlev Model. Colloids Surf. A Physicochem. Eng. Asp. 2000, 173, 1–38. [Google Scholar] [CrossRef] [Scilit]
- Kaur, M.; Datta, M. Adsorption Equilibrium and Kinetics of Toxic Dye-Erythrosine B Adsorption onto Montmorillonite. Sep. Sci. Technol. 2013, 48, 1370–1381. [Google Scholar] [CrossRef] [Scilit]
- de Almeida, F.B.; de Souza, D.C.M.; Neubhaher, G.; Gusmão, L.A.; de Paula, G.A.; dos Santos, A.M.; Rodriguez Gini, A.L.; Souza Tada da Cunha, P.; Scarim, C.B.; Chorilli, M.; et al. Erythrosine-Loaded Nanoemulsion Prepared by Low-Energy Method: Advanced Characterization, In Vitro Release, and HET-CAM Ex Vivo Evaluation. J. Drug Deliv. Sci. Technol. 2026, 119, 108164. [Google Scholar] [CrossRef] [Scilit]
- Hessien, M.; Prouzet, E. Synthesis of Hierarchical Porous Silica by Sol-Gel of Sodium Silicate and Nanoemulsion Templating: Effective Combination Conditions. ChemistrySelect 2021, 6, 1440–1447. [Google Scholar] [CrossRef] [Scilit]
- Ju, T.; Han, S.; Meng, F.; Lin, L.; Li, J.; Chen, K.; Jiang, J. Porous Silica Synthesis out of Coal Fly Ash with No Residue Generation and Complete Silicon Separation. Front. Environ. Sci. Eng. 2023, 17, 112. [Google Scholar] [CrossRef] [Scilit]
- Khoj, M.A. Fabrication of Silica/Calcium Alginate Nanocomposite Based on Rice Husk Ash for Efficient Adsorption of Phenol from Water. RSC Adv. 2024, 14, 24322–24334. [Google Scholar] [CrossRef] [Scilit] [PubMed]
- Thommes, M.; Kaneko, K.; Neimark, A.V.; Olivier, J.P.; Rodriguez-Reinoso, F.; Rouquerol, J.; Sing, K.S.W. Physisorption of Gases, with Special Reference to the Evaluation of Surface Area and Pore Size Distribution (IUPAC Technical Report). Pure Appl. Chem. 2015, 87, 1051–1069. [Google Scholar] [CrossRef] [Scilit]
- Kleitz, F.; Schmidt, W.; Schüth, F. Calcination Behavior of Different Surfactant-Templated Mesostructured Silica Materials. Microporous Mesoporous Mater. 2003, 65, 1–29. [Google Scholar] [CrossRef] [Scilit]
- Candela-Noguera, V.; Amorós, P.; Aznar, E.; Marcos, M.D.; Martínez-Máñez, R. Systematic Study of the Implications of Calcination and Solvent Extraction of the Surfactant in MCM-41-Type Mesoporous Silica Nanoparticles. Microporous Mesoporous Mater. 2024, 373, 113119. [Google Scholar] [CrossRef] [Scilit]
- Chaklader, A.C.D.; Roberts, A.L. Transformation of Quartz to Cristobalite. J. Am. Ceram. Soc. 1961, 44, 35–41. [Google Scholar] [CrossRef] [Scilit]
- Musić, S.; Filipović-Vinceković, N.; Sekovanić, L. Precipitation of Amorphous SiO2 Particles and Their Properties. Braz. J. Chem. Eng. 2011, 28, 89–94. [Google Scholar] [CrossRef] [Scilit]
- Eser, A.; Aydemir, T.; Becerik, S.; Dinçer, A. Removal of Erythrosine Dye from Aqueous Solutions Using Magnetic Chitosan with Erythrosine as Imprinted Molecules. Desalin. Water Treat. 2016, 57, 17002–17010. [Google Scholar] [CrossRef] [Scilit]
- Ramalakshmi, R.D.; Murugan, M.; Jeyabal, V. Removal of Erythrosine B Using Prosopisspicigera L. Wood Carbon-Iron Oxide Composite. Indian J. Chem. Technol. 2022, 29, 251–260. [Google Scholar] [CrossRef] [Scilit]
- Mohd Nasir, F.A.; Mohd Ariff, N.R.A.; Mohd Kamal, Z.; Iqbal, M.A.; Khalid, M.; Jamil, F.; Perumal, V.; Selvarajoo, P.D.; Balan, T.; Fatinathan, S. Enhanced Removal of Erythrosine B Dye Using Chemically Modified Chitosan Beads: A Comparative Evaluation. Molecules 2026, 31, 1765. [Google Scholar] [CrossRef] [Scilit] [PubMed]
- Al-Degs, Y.S.; Abu-El-Halawa, R.; Abu-Alrub, S.S. Analyzing Adsorption Data of Erythrosine Dye Using Principal Component Analysis. Chem. Eng. J. 2012, 191, 185–194. [Google Scholar] [CrossRef] [Scilit]

Disclaimer/Publisher’s Note: The statements, opinions and data contained in all publications are solely those of the individual author(s) and contributor(s) and not of MDPI and/or the editor(s). MDPI and/or the editor(s) disclaim responsibility for any injury to people or property resulting from any ideas, methods, instructions or products referred to in the content. |
© 2026 by the authors. Licensee MDPI, Basel, Switzerland. This article is an open access article distributed under the terms and conditions of the Creative Commons Attribution (CC BY) license.