


Abstract
Surface cracks are critical indicators of deterioration in flood-control infrastructure, yet automated detection from inspection imagery remains challenging due to complex backgrounds, elongated geometries, and variations in apparent scale. This study aims to develop a lightweight detector for accurate dike crack detection while maintaining computational efficiency. A hybrid CNN–Transformer detector, termed YOLO-Defender, was built on YOLOv8n. The proposed framework incorporates a C2F-FTB block in the backbone for local–global feature representation, a BiFF-PAN neck for enhanced multi-scale feature fusion, and coordinate attention for improved spatial feature localization. The model was evaluated on an in-house dike crack dataset containing 1217 images collected from flood-defense structures and related crack imaging scenarios using a unified training and testing protocol. YOLO-Defender achieved 89.6% mAP@0.5 and 69.2% mAP@0.5:0.95, improving YOLOv8n by 3.0 and 5.1 percentage points, respectively. Compared with YOLOv8n, the proposed model reduced parameters and GFLOPs by 41.2% and 18.5%, respectively, while achieving an inference speed of 153 FPS on a desktop GPU. The results indicate that task-oriented architectural design can improve crack detection accuracy and localization performance while preserving lightweight characteristics. These findings support efficient screening of hydraulic infrastructure inspection imagery.
1. Introduction
Dikes are critical components of flood-control systems, and surface cracks represent important visible manifestations of structural deterioration. These cracks often originate from internal stress redistribution, material degradation, or differential settlement [1]. Progressive crack growth can provide pathways for moisture ingress and seepage, which may lead to localized instability and increased risk of piping and breach during flood events [2,3]. Therefore, early identification of surface defects is essential for condition-based maintenance and risk mitigation in hydraulic engineering. In recent years, UAV-based inspection platforms and physics-informed seepage assessment models have been increasingly incorporated into intelligent monitoring frameworks for embankment and dam safety management [4,5].
The crack inspection and documentation of embankments, dikes, and associated hydraulic structures has relied primarily on manual visual inspection. Although widely adopted, such inspections are labor-intensive, difficult to standardize, and highly dependent on inspector experience [6]. Moreover, they are insufficient for the large-scale and high-frequency monitoring requirements of modern water-infrastructure operation and maintenance (O&M), particularly during intensive inspection periods such as pre-flood-season patrols. With the rapid development of unmanned aerial vehicles (UAVs) and automated inspection platforms, image-based structural health monitoring (SHM) has increasingly adopted automated inspection platforms and image-based damage assessment approaches for hydraulic structures [5,7]. However, converting large volumes of inspection imagery into reliable crack information requires robust automated detection algorithms.
Existing crack detection approaches can be broadly divided into traditional image-processing methods and deep learning-based detectors. Conventional approaches based on thresholding, filtering, and edge operators rely heavily on handcrafted features and preprocessing strategies, limiting their robustness under complex field conditions such as illumination variation, vegetation interference, soil-texture background, and shadow contamination [8,9]. In contrast, deep learning methods automatically learn hierarchical representations from data and have achieved improved performance in visual inspection tasks for civil infrastructure [10,11].
Among deep learning detectors, the You Only Look Once (YOLO) family has attracted considerable attention due to its single-stage architecture, which enables efficient joint optimization of object localization and classification while maintaining competitive accuracy [12]. Although two-stage detectors such as Faster R-CNN [13] can achieve strong detection performance, their computational complexity limits deployment in resource-constrained inspection scenarios. YOLOv8 has therefore become a widely adopted baseline for lightweight detection applications [14], and recent advances have further incorporated attention mechanisms and Transformer-based components to enhance feature representation [15].
For hydraulic infrastructure inspection, recent studies have explored advanced visual recognition frameworks for crack and damage assessment. Vision Transformer (ViT)-based approaches have been investigated for dam crack segmentation by exploiting long-range dependency modeling, but their computational complexity may limit lightweight deployment scenarios [16]. Meanwhile, attention-enhanced detectors, optimized YOLO architectures, and automated inspection frameworks have been investigated for hydraulic structures, including dam cracks, embankment slopes, and related damage scenarios [17,18,19,20]. However, quantitative comparison among these studies remains challenging because they involve different computer vision tasks, such as pixel-level segmentation and bounding-box-based object detection, as well as different image acquisition conditions and evaluation protocols. In particular, many reported results rely primarily on mAP@0.5, while stricter localization criteria such as mAP@0.5:0.95 are less frequently considered.
For large-scale screening of UAV and patrol inspection imagery, lightweight one-stage detectors remain a practical solution. Nevertheless, many existing CNN–Transformer hybrids and mobile vision Transformers are developed for general visual recognition or generic defect detection rather than specifically tailored to slender dike cracks, while dike cracks present domain-specific challenges, including elongated morphologies, extreme aspect ratios, and low-contrast boundaries that hinder robust feature representation [21,22]. Coordinate attention provides position-aware feature recalibration [23]. Optimized YOLO variants have further improved the accuracy–efficiency trade-off for structural crack detection [24]. Although morphology-adaptive YOLO variants have been explored for crack detection in hydraulic structures [25], few studies have systematically investigated the integrated design of backbone, neck, and attention modules within a lightweight YOLOv8n framework tailored to slender dike cracks and evaluated under stricter IoU thresholds.
For dike crack detection, three major technical challenges remain. First, conventional CNN-based backbones primarily rely on local receptive fields, which limits their ability to model globally continuous crack trajectories and may result in fragmented predictions. Second, crack instances exhibit variations in apparent scale and shape, ranging from narrow early-stage defects to larger visible fissures. Conventional feature pyramid network (FPN) and path aggregation network (PANet) structures based on fixed multi-scale fusion may insufficiently preserve fine spatial details or semantic consistency during feature aggregation [26,27]. Third, practical deployment in UAV and robotic inspection scenarios requires lightweight models that maintain accurate localization of high-aspect-ratio cracks under stringent IoU thresholds [24].
Lightweight one-stage detectors have likewise been adapted for UAV-based real-time crack screening on civil infrastructure [28]. To address these challenges, this study proposes YOLO-Defender, a lightweight YOLOv8n-based detector in which the backbone, neck, and attention modules are jointly tuned to slender crack morphology and strict localization requirements. Specifically, the architecture incorporates (i) C2F-FTB, which replaces the deepest C2f block with a CNN–Transformer hybrid module through parallel CNN–Transformer feature modeling to capture local textures and long-range crack continuity; (ii) BiFF-PAN, a bidirectional feature fusion neck incorporating selective feature fusion (SFF) to enhance multi-scale representation; and (iii) coordinate attention (CA), which improves spatial awareness for elongated crack structures. An in-house multi-source dataset developed for dike crack detection is used to systematically evaluate the proposed detector under realistic field variability.
2. Materials and Methods
2.1. Overview of YOLO-Defender
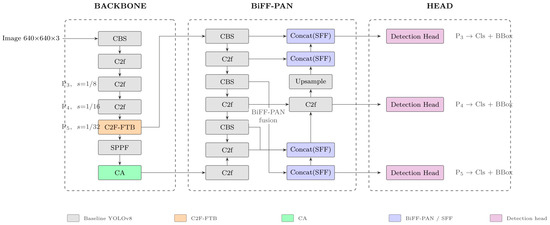
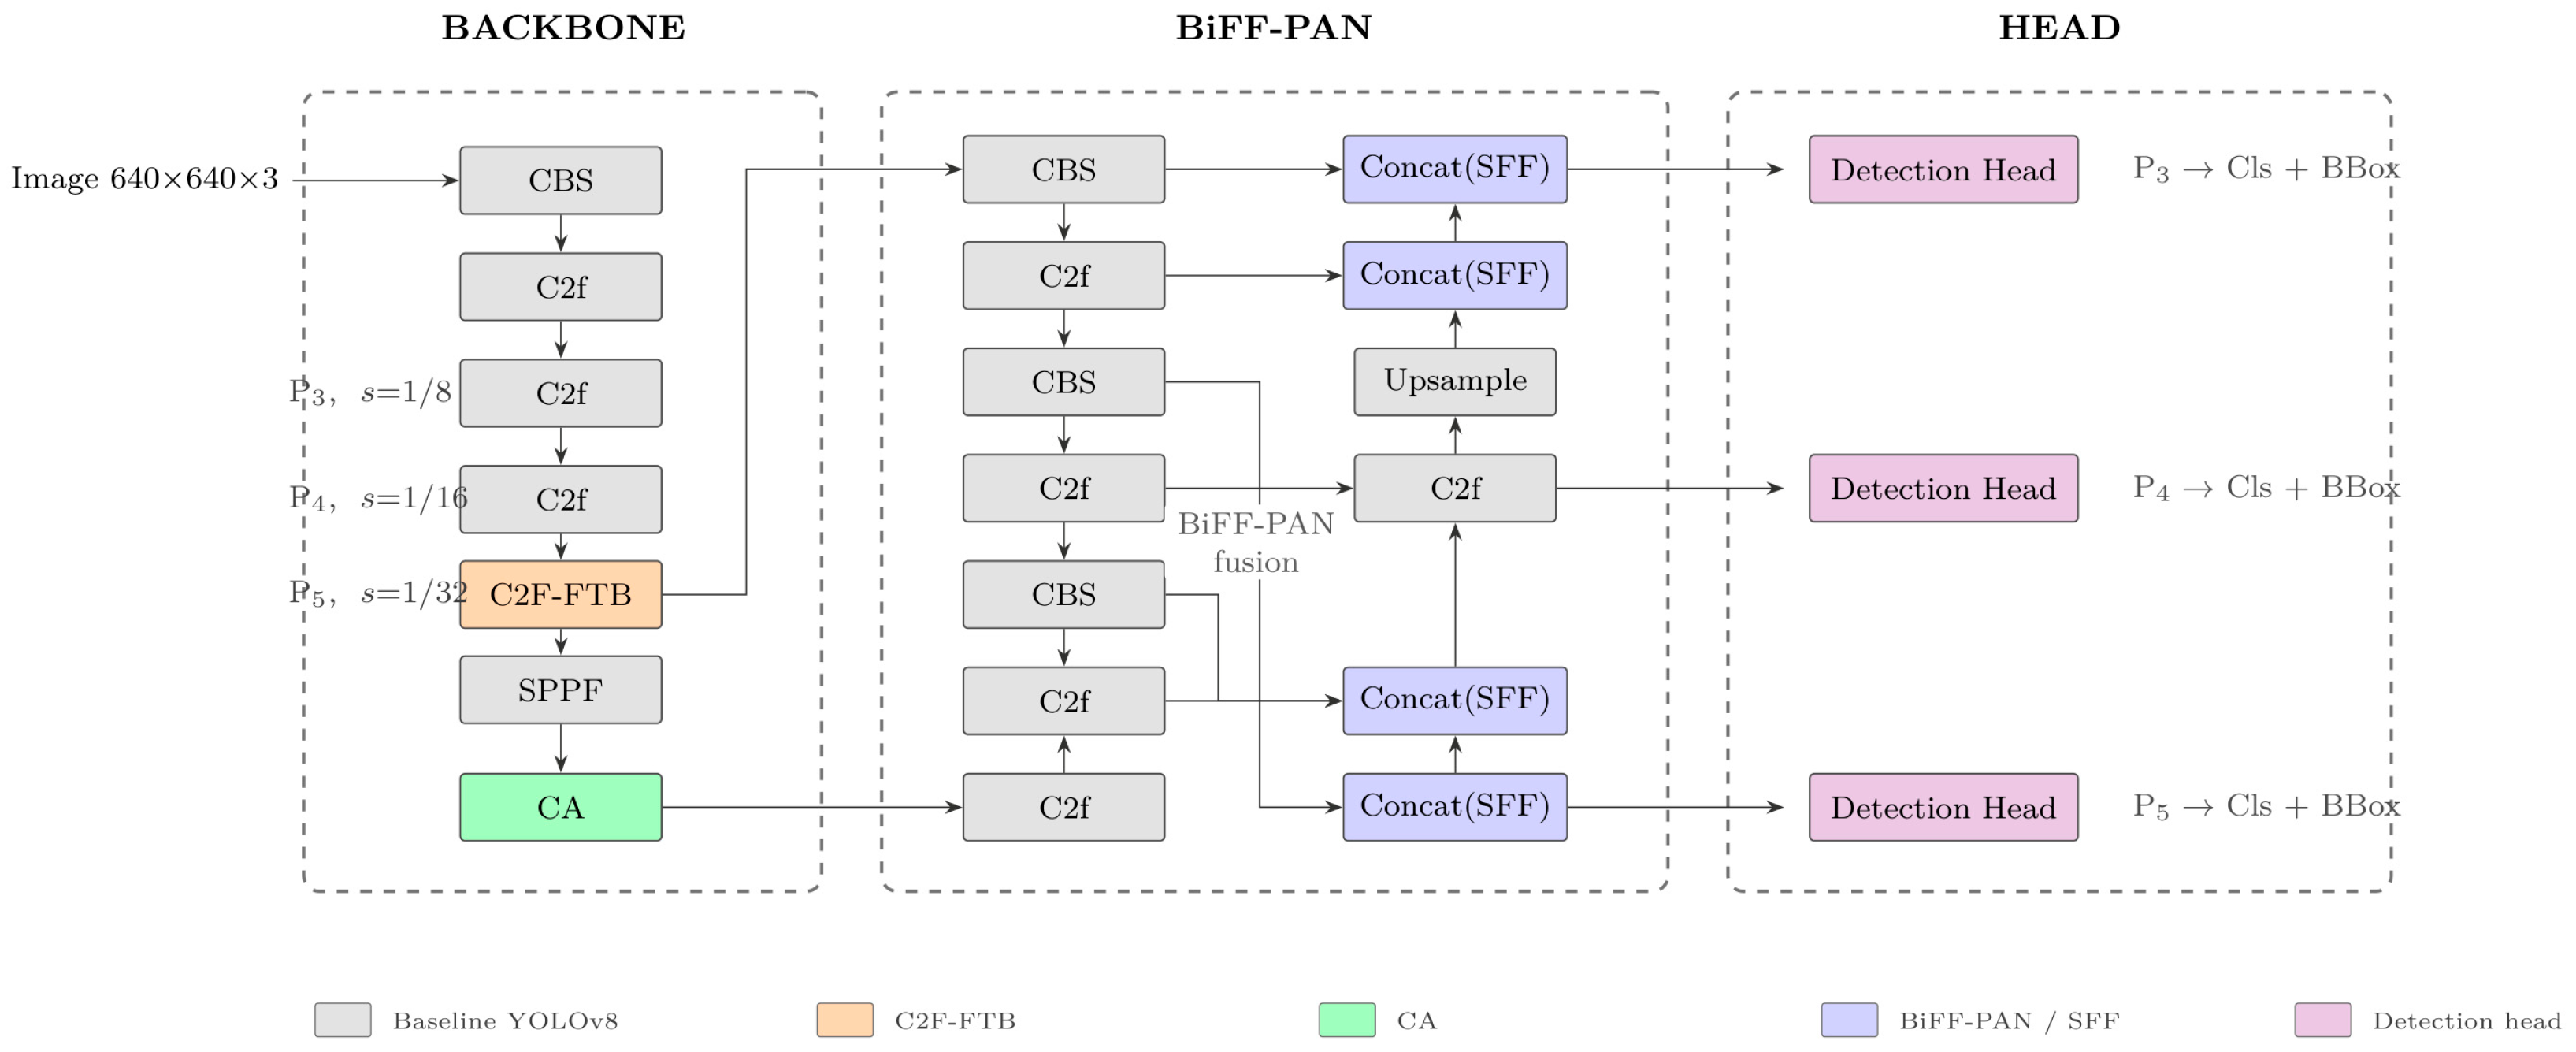
YOLO-Defender retains the standard YOLOv8 single-stage detection paradigm consisting of a backbone, neck, and detection head (Figure 1). Architectural modifications are introduced mainly in the feature extraction and feature fusion stages to improve representation capability for elongated, high-aspect-ratio, and scale-varying crack patterns, while the original YOLOv8 detection head is preserved for classification and bounding-box regression [24,29].
Figure 1.
Overall architecture of YOLO-Defender.
The major architectural components are configured as follows:
- (i)
- Backbone modification. The final C2f block of YOLOv8n is replaced with C2F-FTB to jointly model local texture details and long-range contextual dependencies.
- (ii)
- Attention enhancement. A coordinate attention (CA) block is inserted after the spatial pyramid pooling-fast (SPPF) module to enhance position-aware feature representation of crack features before multi-scale feature fusion.
- (iii)
- Neck redesign. The original YOLOv8 neck structure is replaced with BiFF-PAN, which introduces bidirectional feature propagation pathways and selective feature fusion (SFF) units for improved cross-scale representation.
- (iv)
- Detection head preservation. The original YOLOv8 detection head remains unchanged to maintain the efficiency and compatibility of the one-stage detection framework.
The default YOLOv8 loss functions and label assignment strategies are retained. Therefore, the observed performance improvements can be mainly attributed to the proposed architectural modifications rather than changes in optimization objectives.
Beyond retaining the default loss and assignment, module choices are guided by dike-crack morphology under a fixed YOLOv8n budget, with explicit contrasts to plausible lightweight alternatives rather than isolated add-ons. Relative to deepening a purely local CNN stack or relying only on Ghost-style cheap operators, C2F-FTB is restricted to the deepest C2f stage so that convolutional bottlenecks keep fine textures while MHSA supplies long-range continuity. Relative to retaining the stock YOLOv8 neck, BiFF-PAN with SFF is used to gate multi-scale fusion for extreme aspect ratios and scales revealed by the crack-instance statistics (Section 2.5). Relative to SE-style channel squeeze (and other attentions compared in Section 3.2), coordinate attention is placed after SPPF to preserve horizontal/vertical positional cues needed for slender cracks. Module internals are detailed in Section 2.2, Section 2.3 and Section 2.4 and quantified in Section 3.
2.2. C2F-FTB Hybrid Block
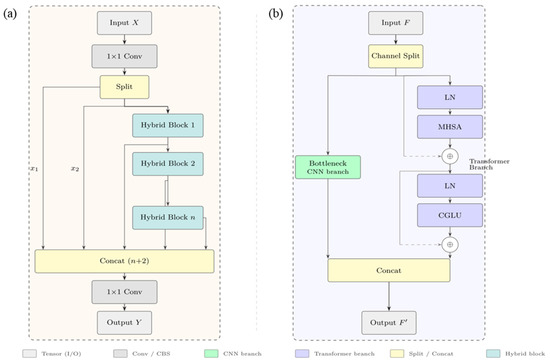
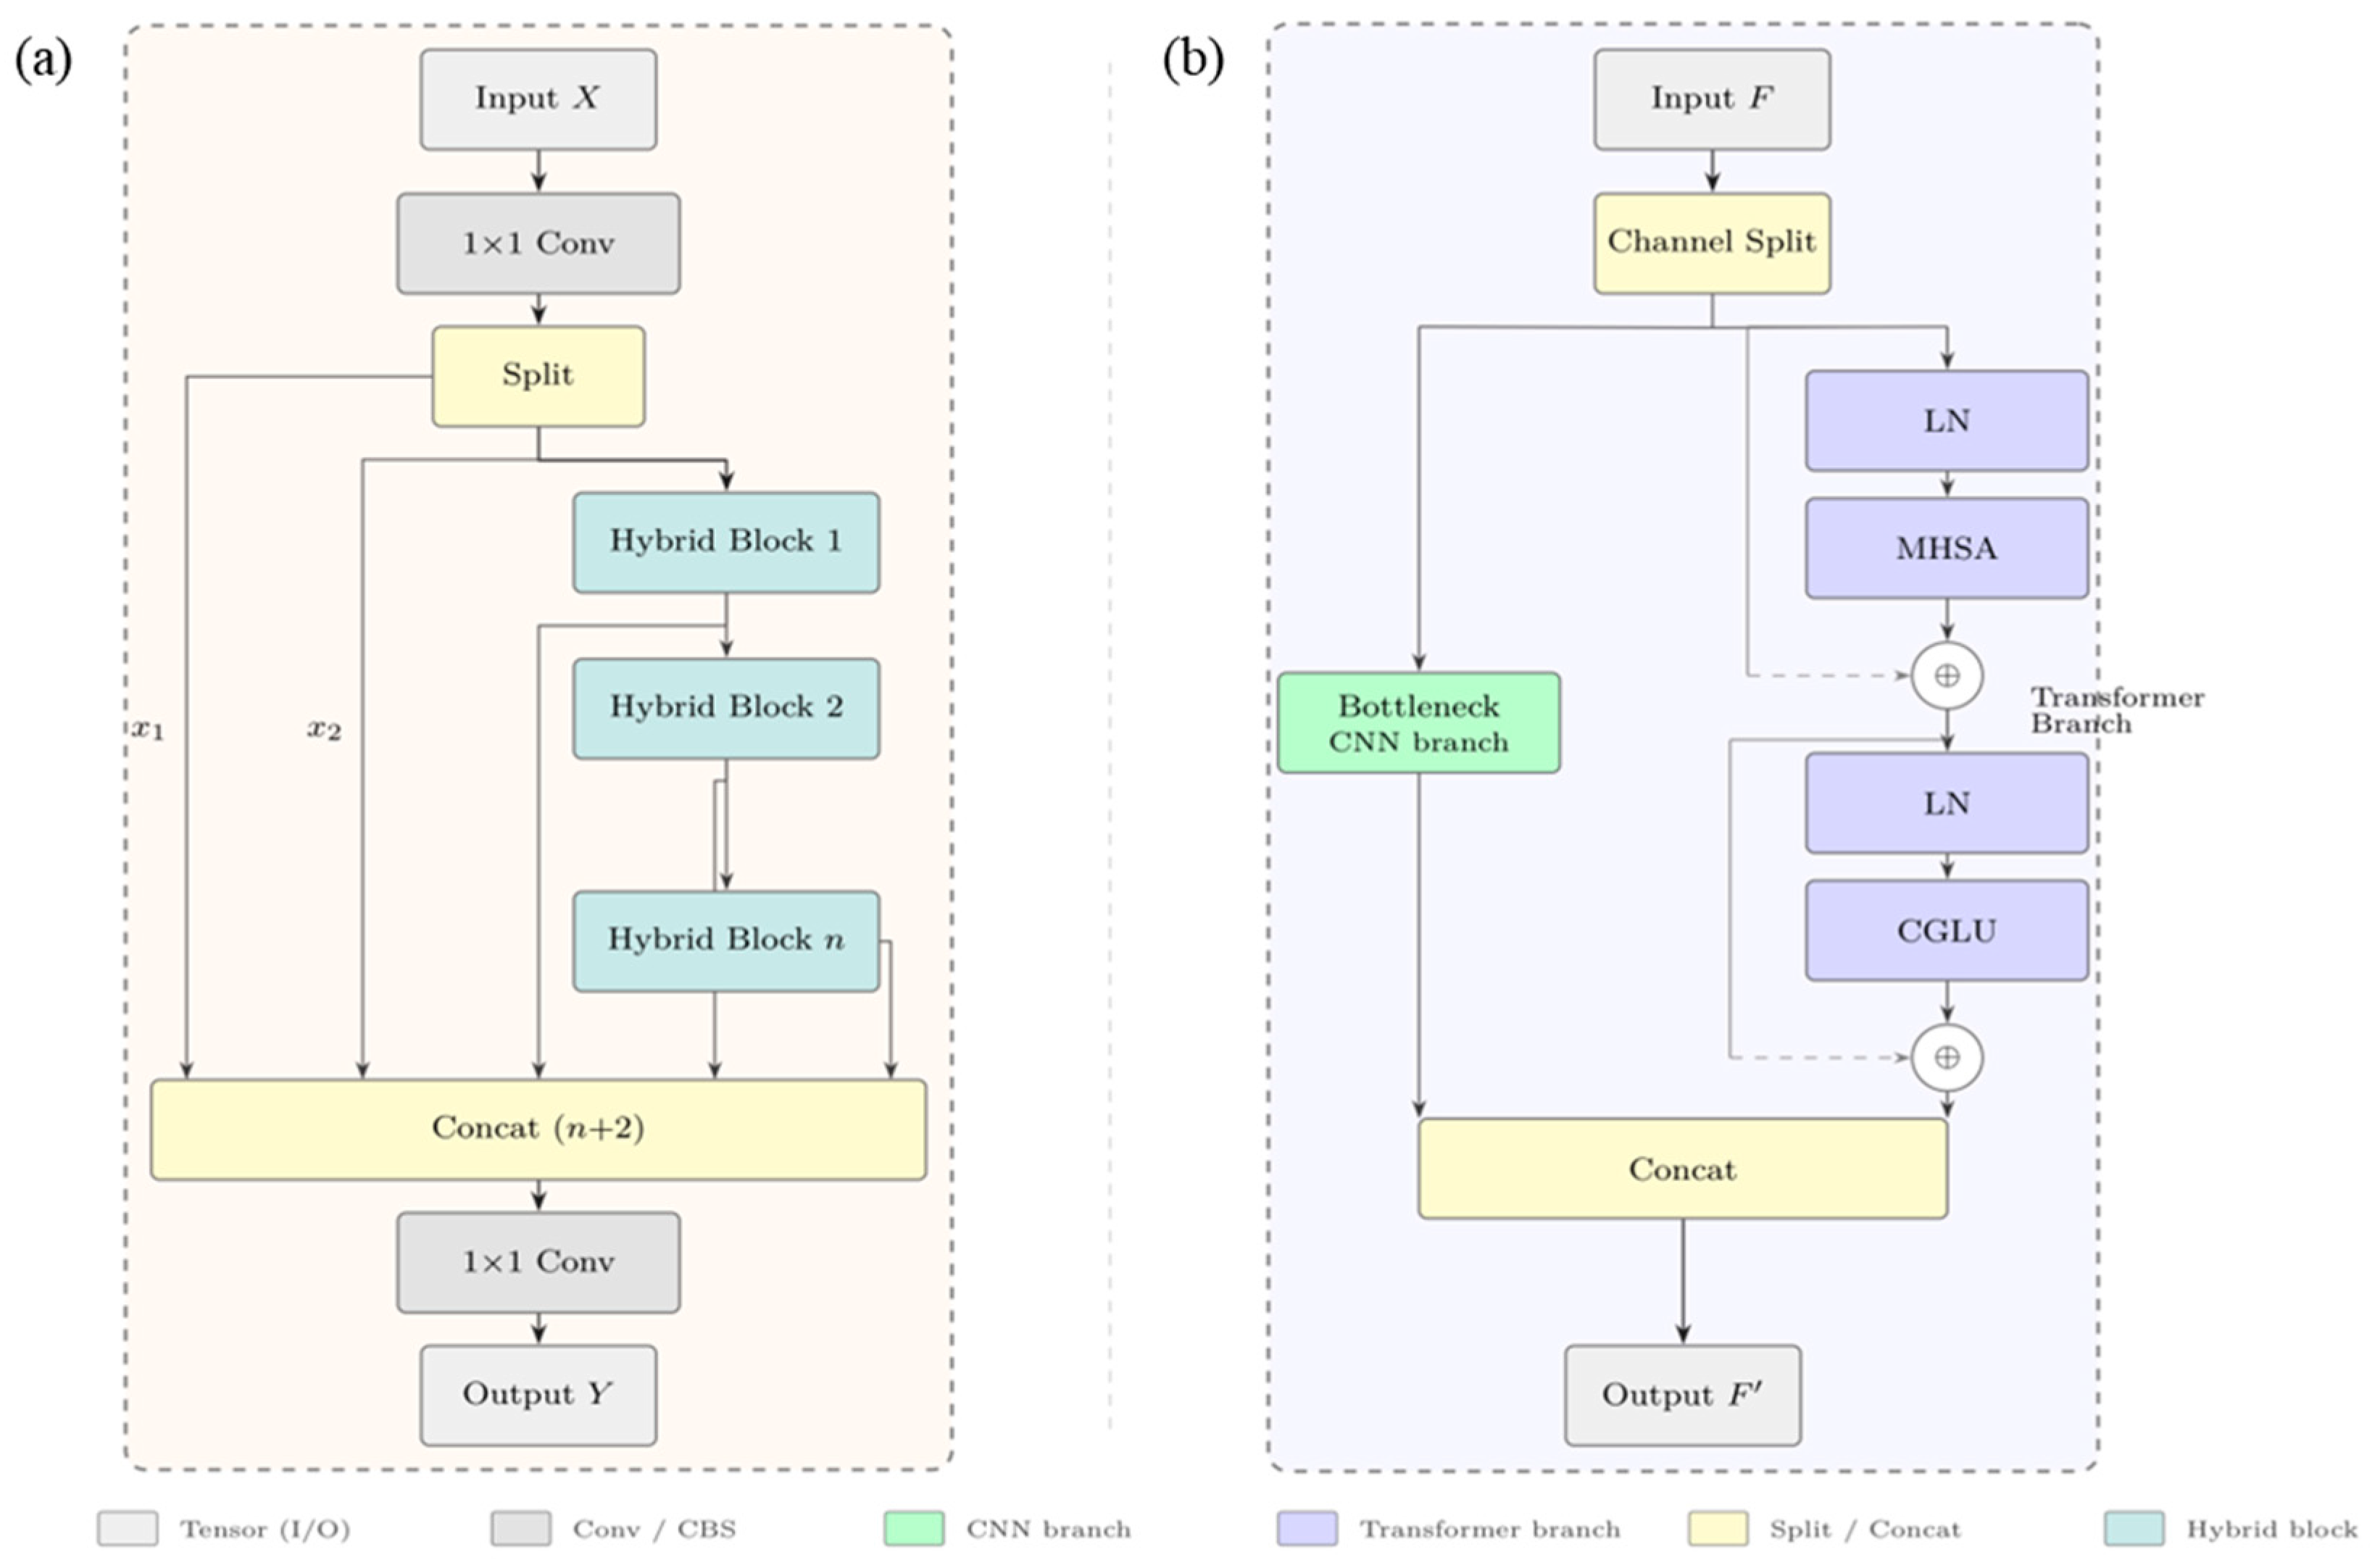
Although CNNs are effective at extracting fine-grained crack textures, their local receptive fields are less effective in capturing globally continuous crack trajectories, which may result in fragmented detections. To address this limitation, C2F-FTB extends the original C2f structure by introducing two parallel feature extraction branches, as shown in Figure 2.
Figure 2.
Internal structure of C2F-FTB: (a) C2F-FTB overview; (b) Hybrid block detail.
The CNN branch retains stacked Bottleneck blocks to preserve high-resolution local representations required for detecting narrow crack structures. In parallel, the Transformer branch employs multi-head self-attention (MHSA) [30] to capture long-range dependencies, followed by a convolutional gated linear unit (CGLU) for feature transformation. The outputs of the two branches are subsequently concatenated along the channel dimension, generating a fused representation that jointly captures fine-grained local details and global crack continuity.
Given an input feature tensor X, the output of the i-th attention head is computed as:
where , and denote learnable projection matrices.
The scaled dot-product attention [30] is defined as:
where is the head dimension. Multi-head outputs are concatenated and linearly projected to obtain the global contextual feature map.
2.3. BiFF-PAN Neck with Selective Feature Fusion
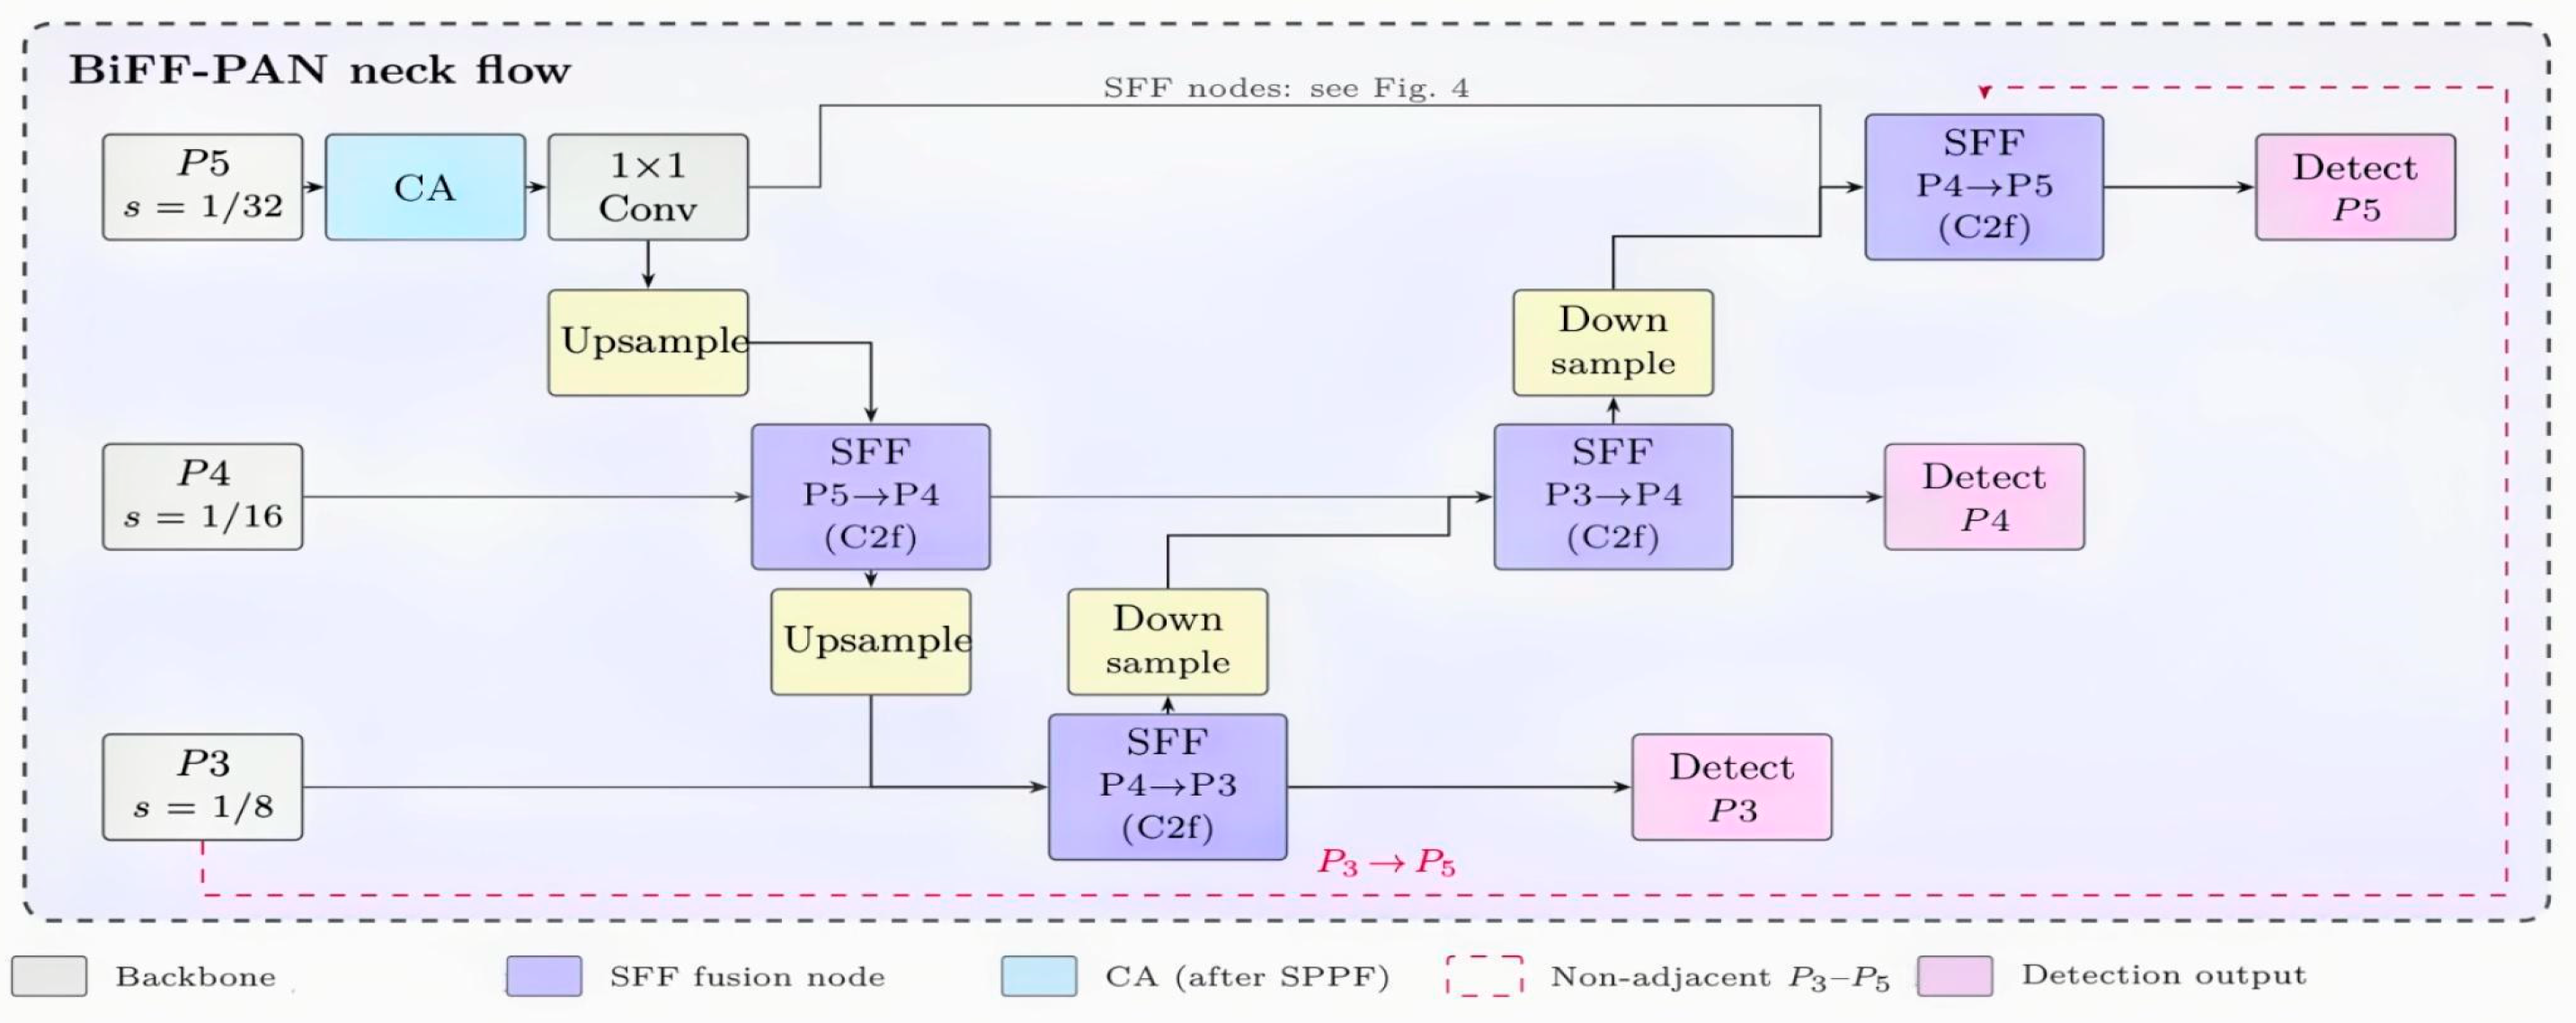
Crack appearance varies substantially across inspection scenes, with defect patterns ranging from fine narrow crack patterns to large structural fissures. In conventional feature pyramid-based neck architectures [26,27], predefined feature aggregation strategies may fail to optimally balance semantic abstraction and spatial precision during multi-scale fusion, resulting in insufficient representation of cracks with diverse geometric characteristics. BiFF-PAN (Bidirectional Feature Fusion Path Aggregation Network) addresses this issue by introducing an enhanced bidirectional feature pyramid with selective feature fusion (SFF) nodes, enabling adaptive cross-scale feature aggregation.
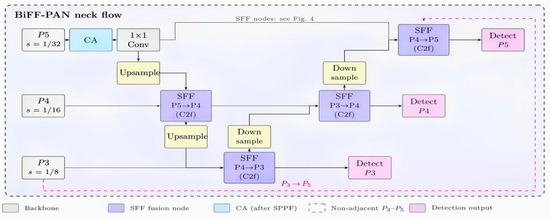
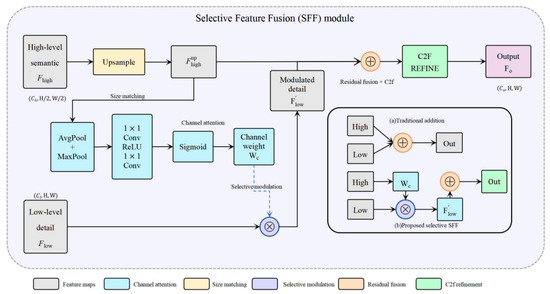
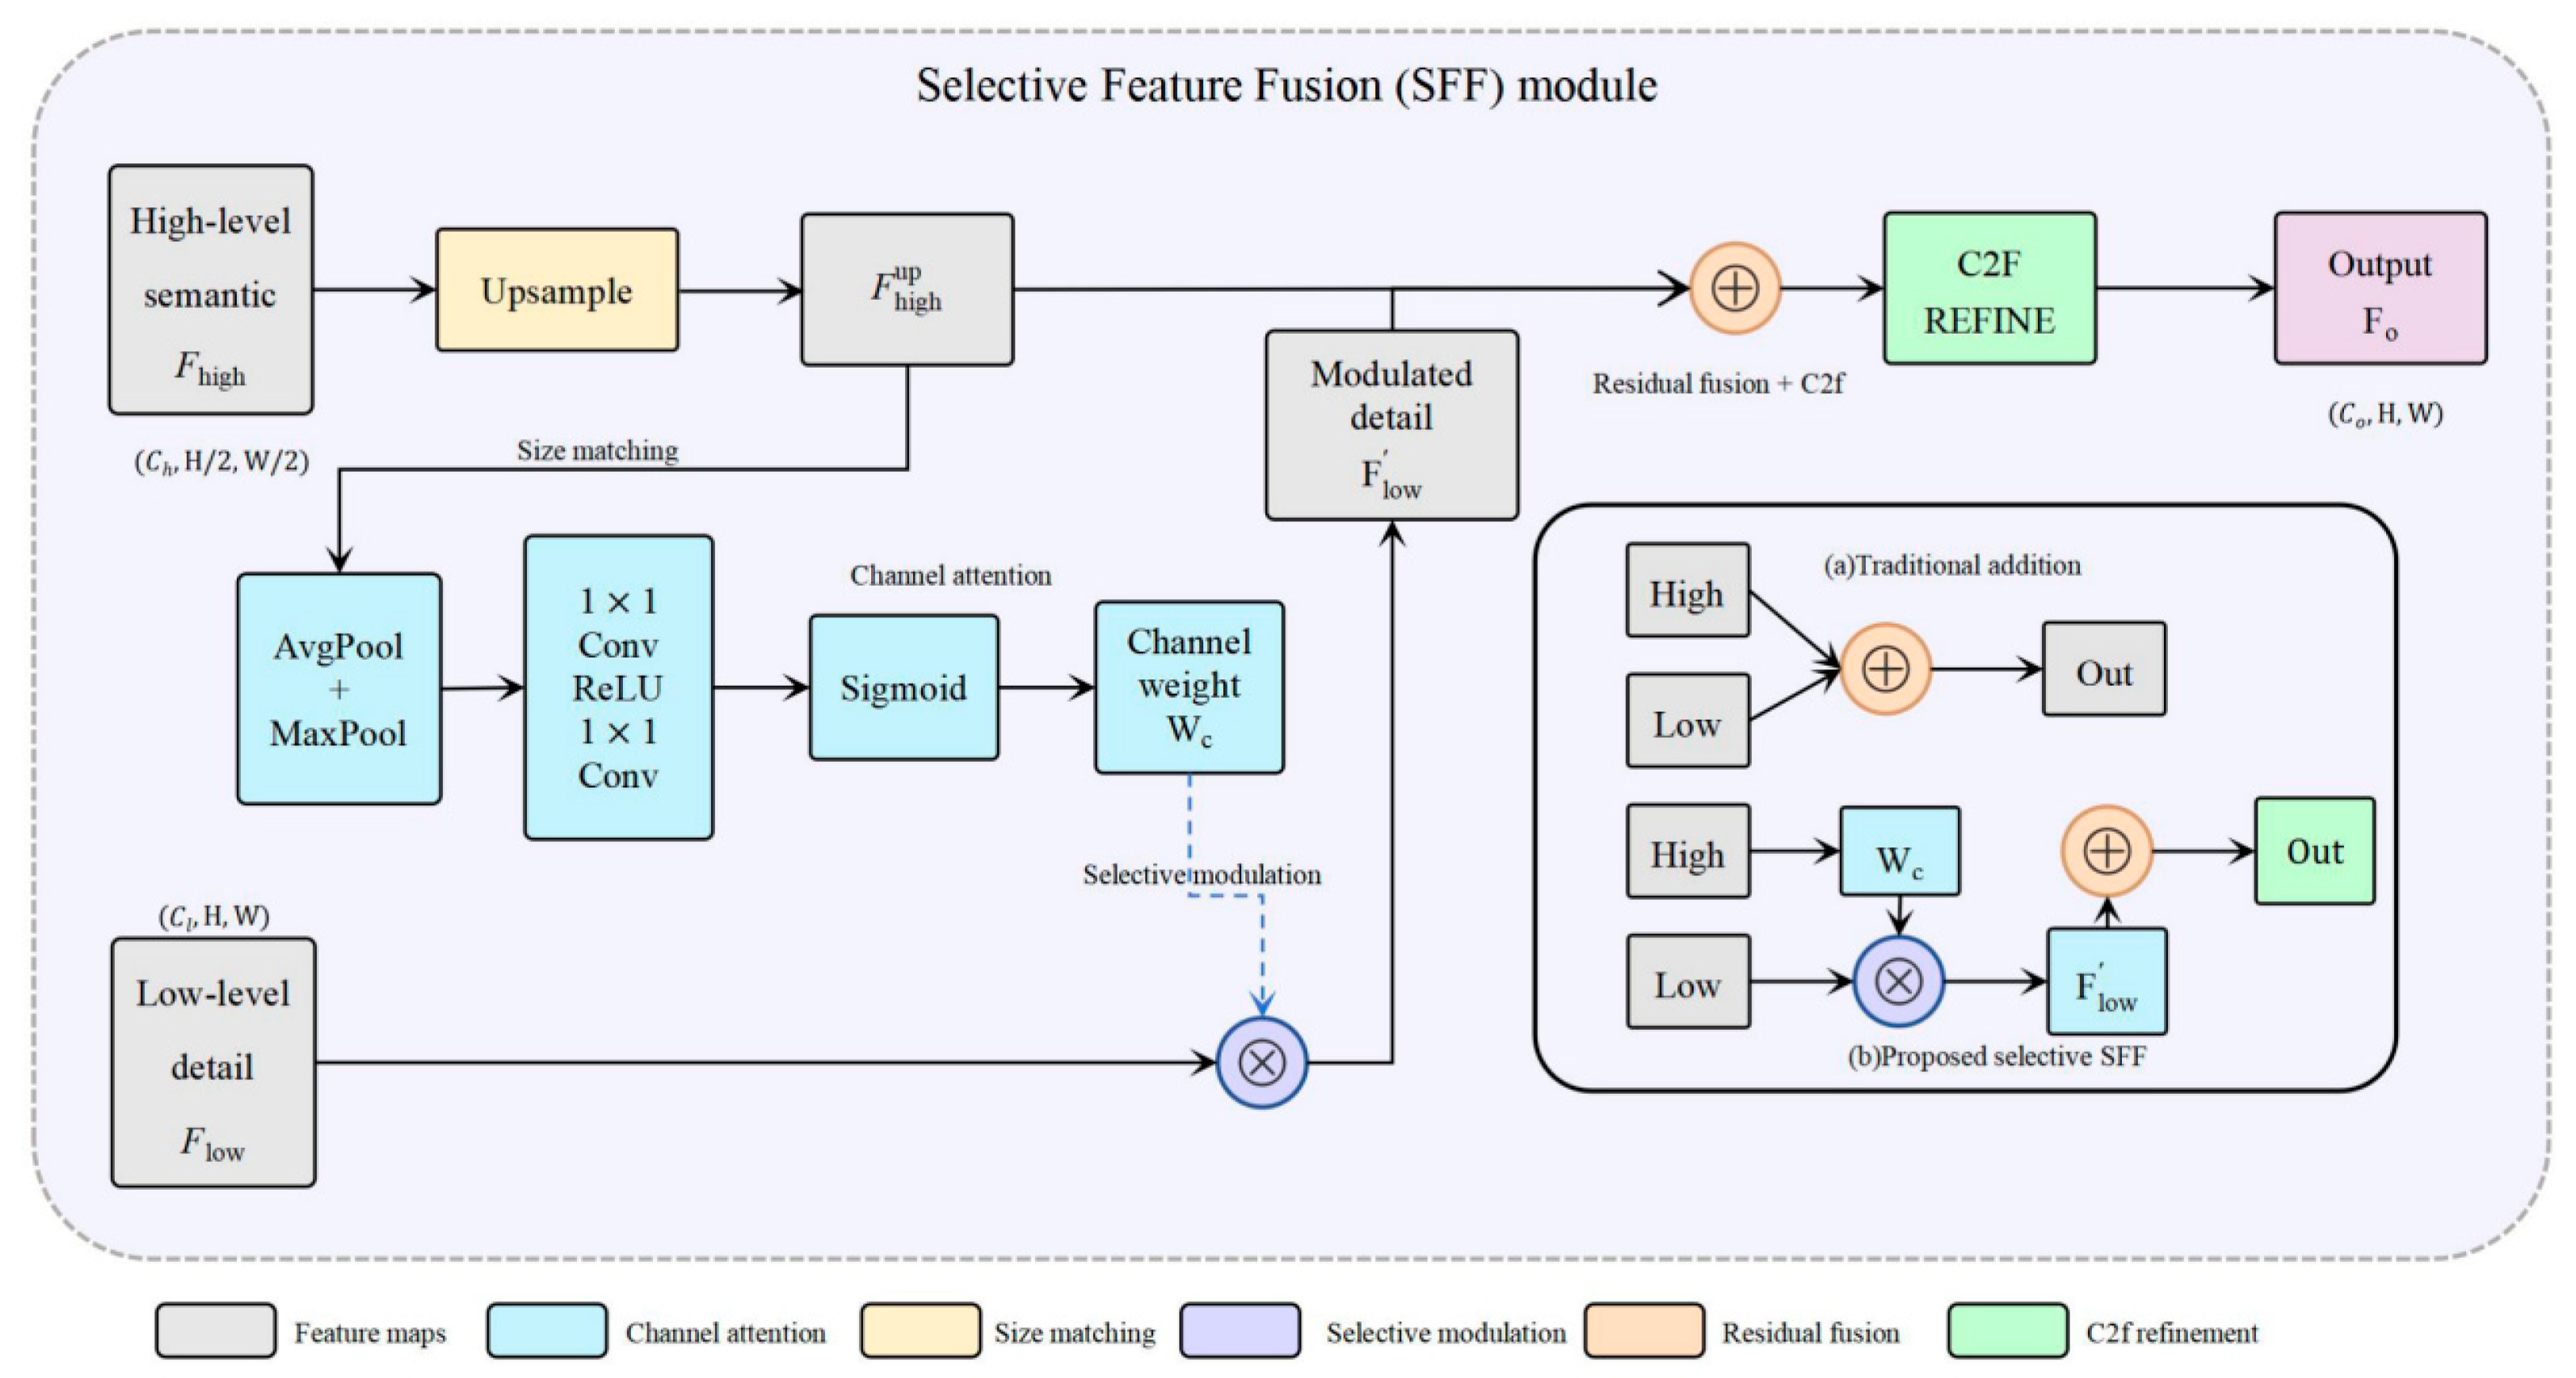
Figure 3 shows bidirectional exchange among P3–P5, including a non-adjacent shortcut (dashed). Each fusion junction uses an SFF node (Figure 4) followed by C2f refinement before the detection head. Figure 4 details one SFF node: is upsampled to ; channel weights are predicted from via parallel pooling and convolutions; is modulated by and added to , then passed through C2f. The inset contrasts this selective fusion with direct addition.
where denotes element-wise multiplication and is the channel-wise weight map generated by a lightweight attention branch that selectively modulates low-level features before fusion, following a channel-wise gating rationale.
Figure 3.
Detailed architecture of the BiFF-PAN neck.
Figure 4.
Internal architecture of a single SFF node.
2.4. Coordinate Attention
High-aspect-ratio cracks require precise spatial localization and preservation of positional information. Channel attention mechanisms such as squeeze-and-excitation (SE) aggregate spatial features into global channel descriptors, which may lose explicit spatial information required for accurately delineating crack endpoints and propagation directions [31]. Coordinate attention (CA) [23] addresses this limitation by decomposing channel attention into two one-dimensional directional encodings along the horizontal and vertical spatial axes.
For channel c of the input tensor , directional pooling is defined as:
The pooled descriptors are subsequently fused, transformed by shared convolution layers, and activated to obtain weights and The recalibrated output is:
By decomposing attention along horizontal and vertical coordinates, CA enables YOLO-Defender to enhance crack-specific feature responses while emphasizing position-sensitive crack responses.
2.5. Dataset Construction
Publicly available crack datasets specifically collected from real dikes remain limited, which restricts the development and generalization evaluation of automated inspection models [32]. Similar limitations regarding annotated samples have also been reported in dam crack imaging studies [33]. To support method development and controlled evaluation for flood-control and reservoir-related hydraulic structures, we constructed an in-house multi-source dataset Images were obtained from two complementary sources: (i) publicly accessible crack-related images collected from open sources; and (ii) field photographs acquired from selected dikes and reservoir-related hydraulic structures in Fuzhou, Fujian Province, China. Within the publicly sourced images, morphology-based concrete-surface crack samples were separately identified as proxy samples for subsequent dataset analysis. During data acquisition, images in which crack regions were severely obscured or could not be reliably annotated were excluded to ensure annotation consistency and reliability.
Because authentic dike crack cases in the investigated region are relatively limited, additional concrete-surface crack images with similar geometric characteristics were incorporated as proxy samples based solely on morphology similarity. Specifically, these samples contain elongated fissures on rigid surfaces that resemble dike crack patterns in shape and scale, but they do not represent identical hydraulic loading, seepage, or environmental conditions. After removing blurred, duplicated, and irrelevant images, the final dataset contains 1217 images, including 917 crack-positive images and 300 crack-free negative images without bounding-box annotations. Positive samples may contain one or multiple crack instances, whereas negative samples are included to improve robustness against false detections on non-cracked surfaces. Because field photographs are regionally concentrated and proxies are morphology-based only, generalization beyond the present acquisition setting remains limited; absolute metrics are therefore best read as performance under the current data mix rather than as fully domain-transferable guarantees.
All crack instances were manually annotated using LabelImg (version 1.8.6) and exported in the YOLO annotation format. Only one object category, namely crack, was defined. Each crack instance was represented by normalized bounding-box parameters consisting of center coordinates and box width and height (x,y,w,h); images containing multiple cracks therefore have multiple label entries. Negative images were stored with empty label files to enable the detector to learn rejection of background-only scenes during training. Before training, all images were resized to 640 × 640 pixels using the default letterboxing strategy of the Ultralytics YOLO implementation, where aspect ratios were preserved and padding was automatically applied when required.
The dataset was randomly divided into training, validation, and test subsets at an approximate ratio of 60:20:20, resulting in 730, 243, and 244 original images, respectively. The split was performed once and fixed throughout all experiments to ensure consistent comparison among models. Offline augmentation was applied only to the training subset, while the validation and test subsets remained unchanged. To improve robustness against illumination and viewpoint variations, the training set was expanded offline by generating seven additional augmented variants for each original training image, including horizontal flip, vertical flip, rotation, ±30% brightness variation, Gaussian noise, and fog simulation, following common limited-data augmentation strategies [34]. This process increased the number of training images from 730 to 5840, while the validation and test sets remained unchanged. Additional online augmentation during Ultralytics training is described in Section 2.6. All experiments in Section 3 use this fixed split unless otherwise specified.
Together with the online augmentation used in training, these sampling and offline-augmentation measures are intended to curb overfitting under the present corpus size. Consistent gains in the subsequent ablation and subgroup analyses (Section 3) further indicate that the improvements are not confined to a single memorized partition. The 1217-image scale is best interpreted as supporting controlled in-domain evaluation rather than unrestricted geographic transfer.
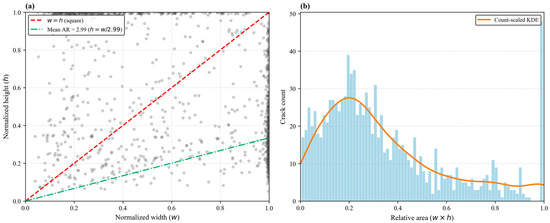
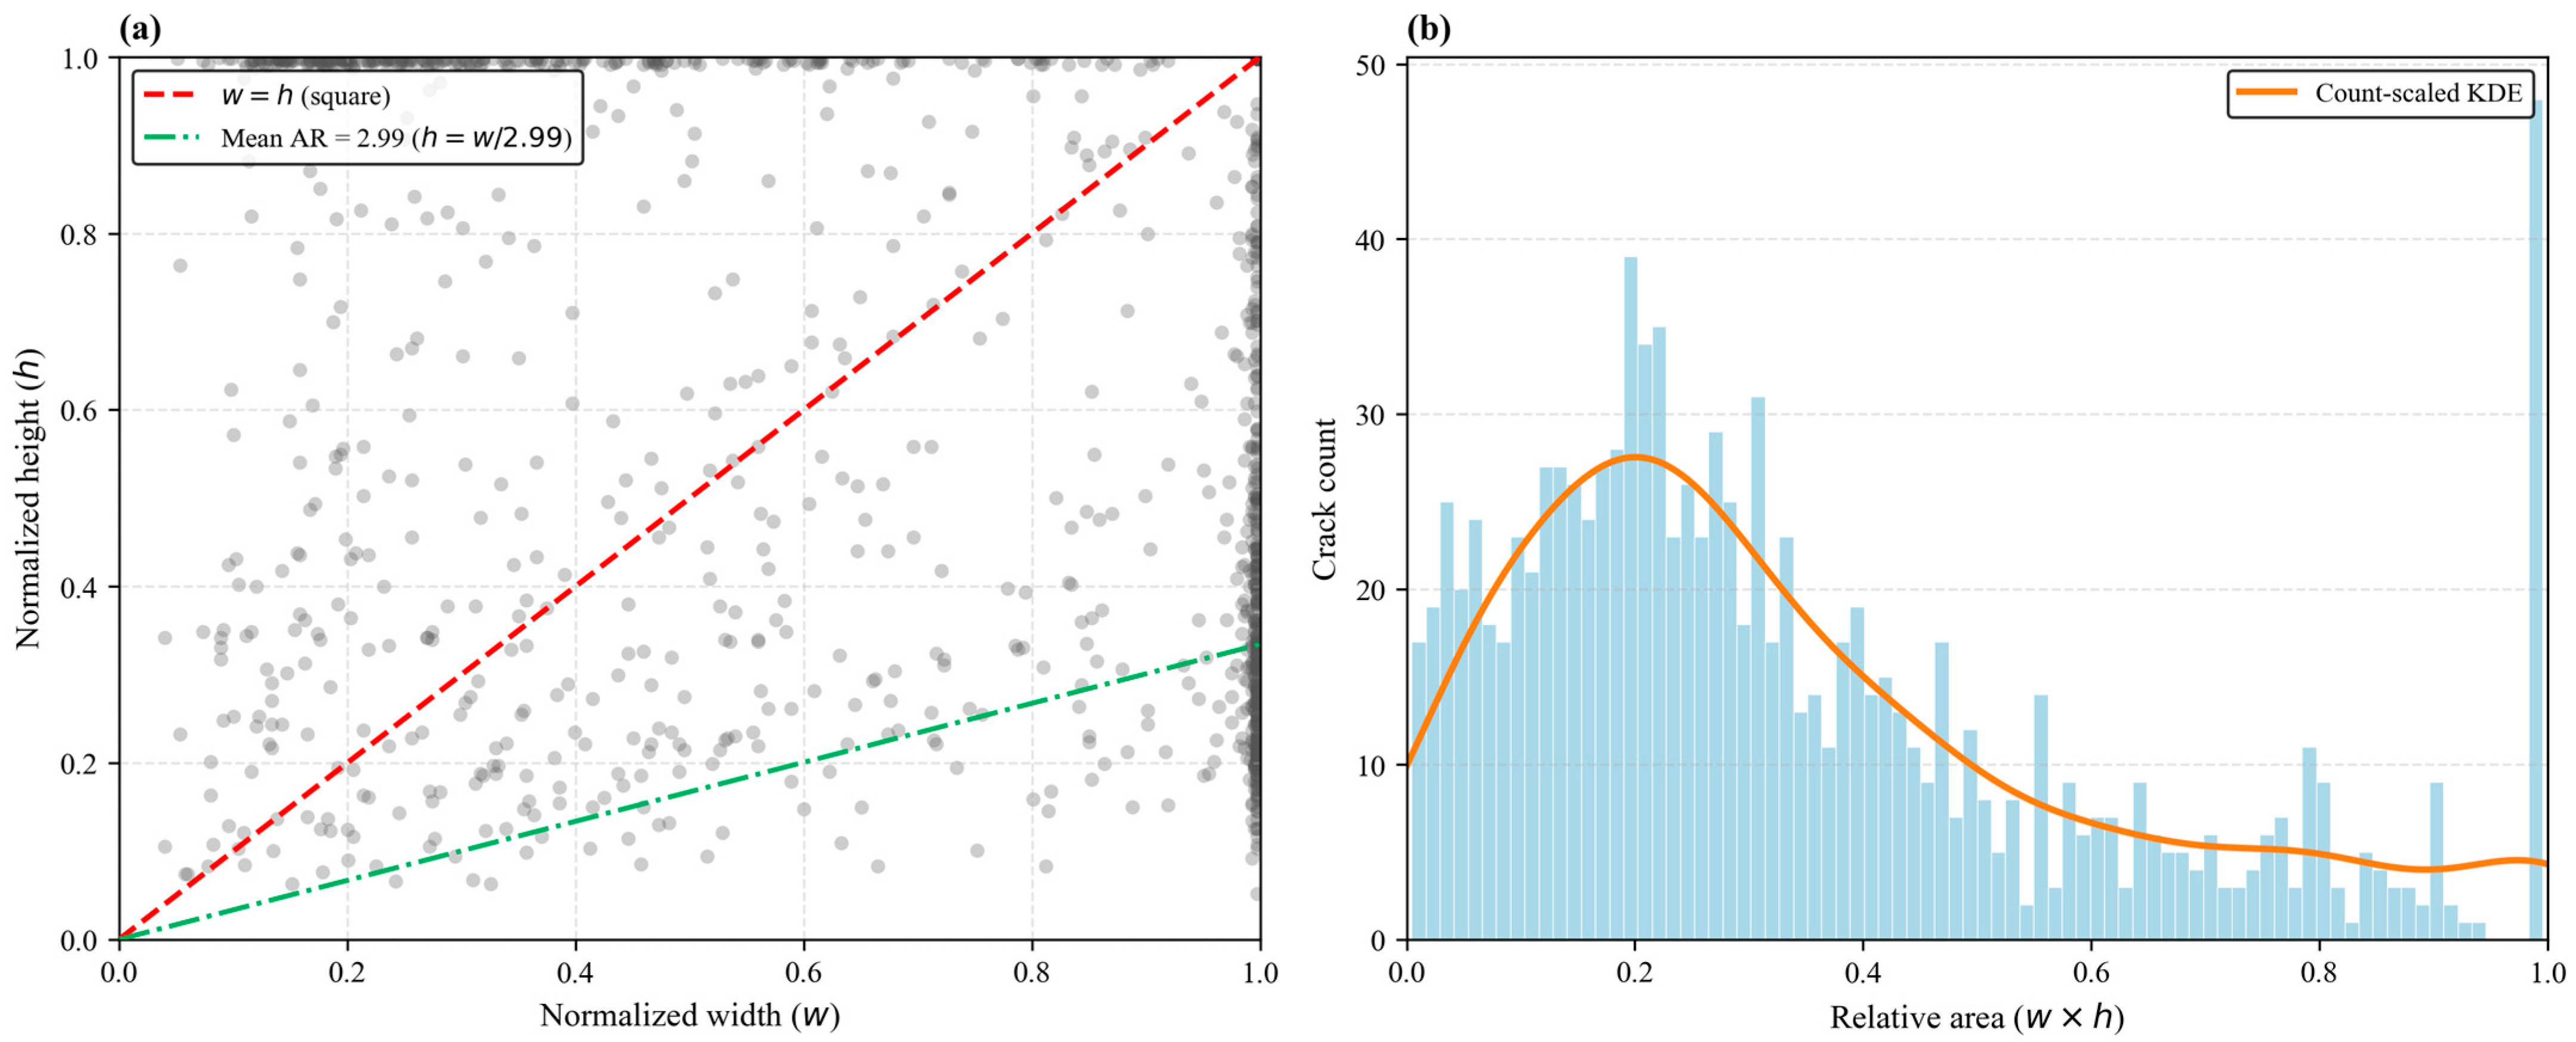
Before augmentation, 1073 annotated crack instances from 917 positive images were statistically analyzed (Figure 5), while empty labels and negative samples were excluded. The crack targets exhibited pronounced elongation, with the aspect ratio defined as max(w/h, h/w), yielding a mean value of 2.99 and a maximum value of 19.43.
Figure 5.
Crack scale distribution for 1073 annotated boxes from 917 crack-positive images: (a) Normalized width w versus height h; (b) Relative area w × h with count-scaled KDE.
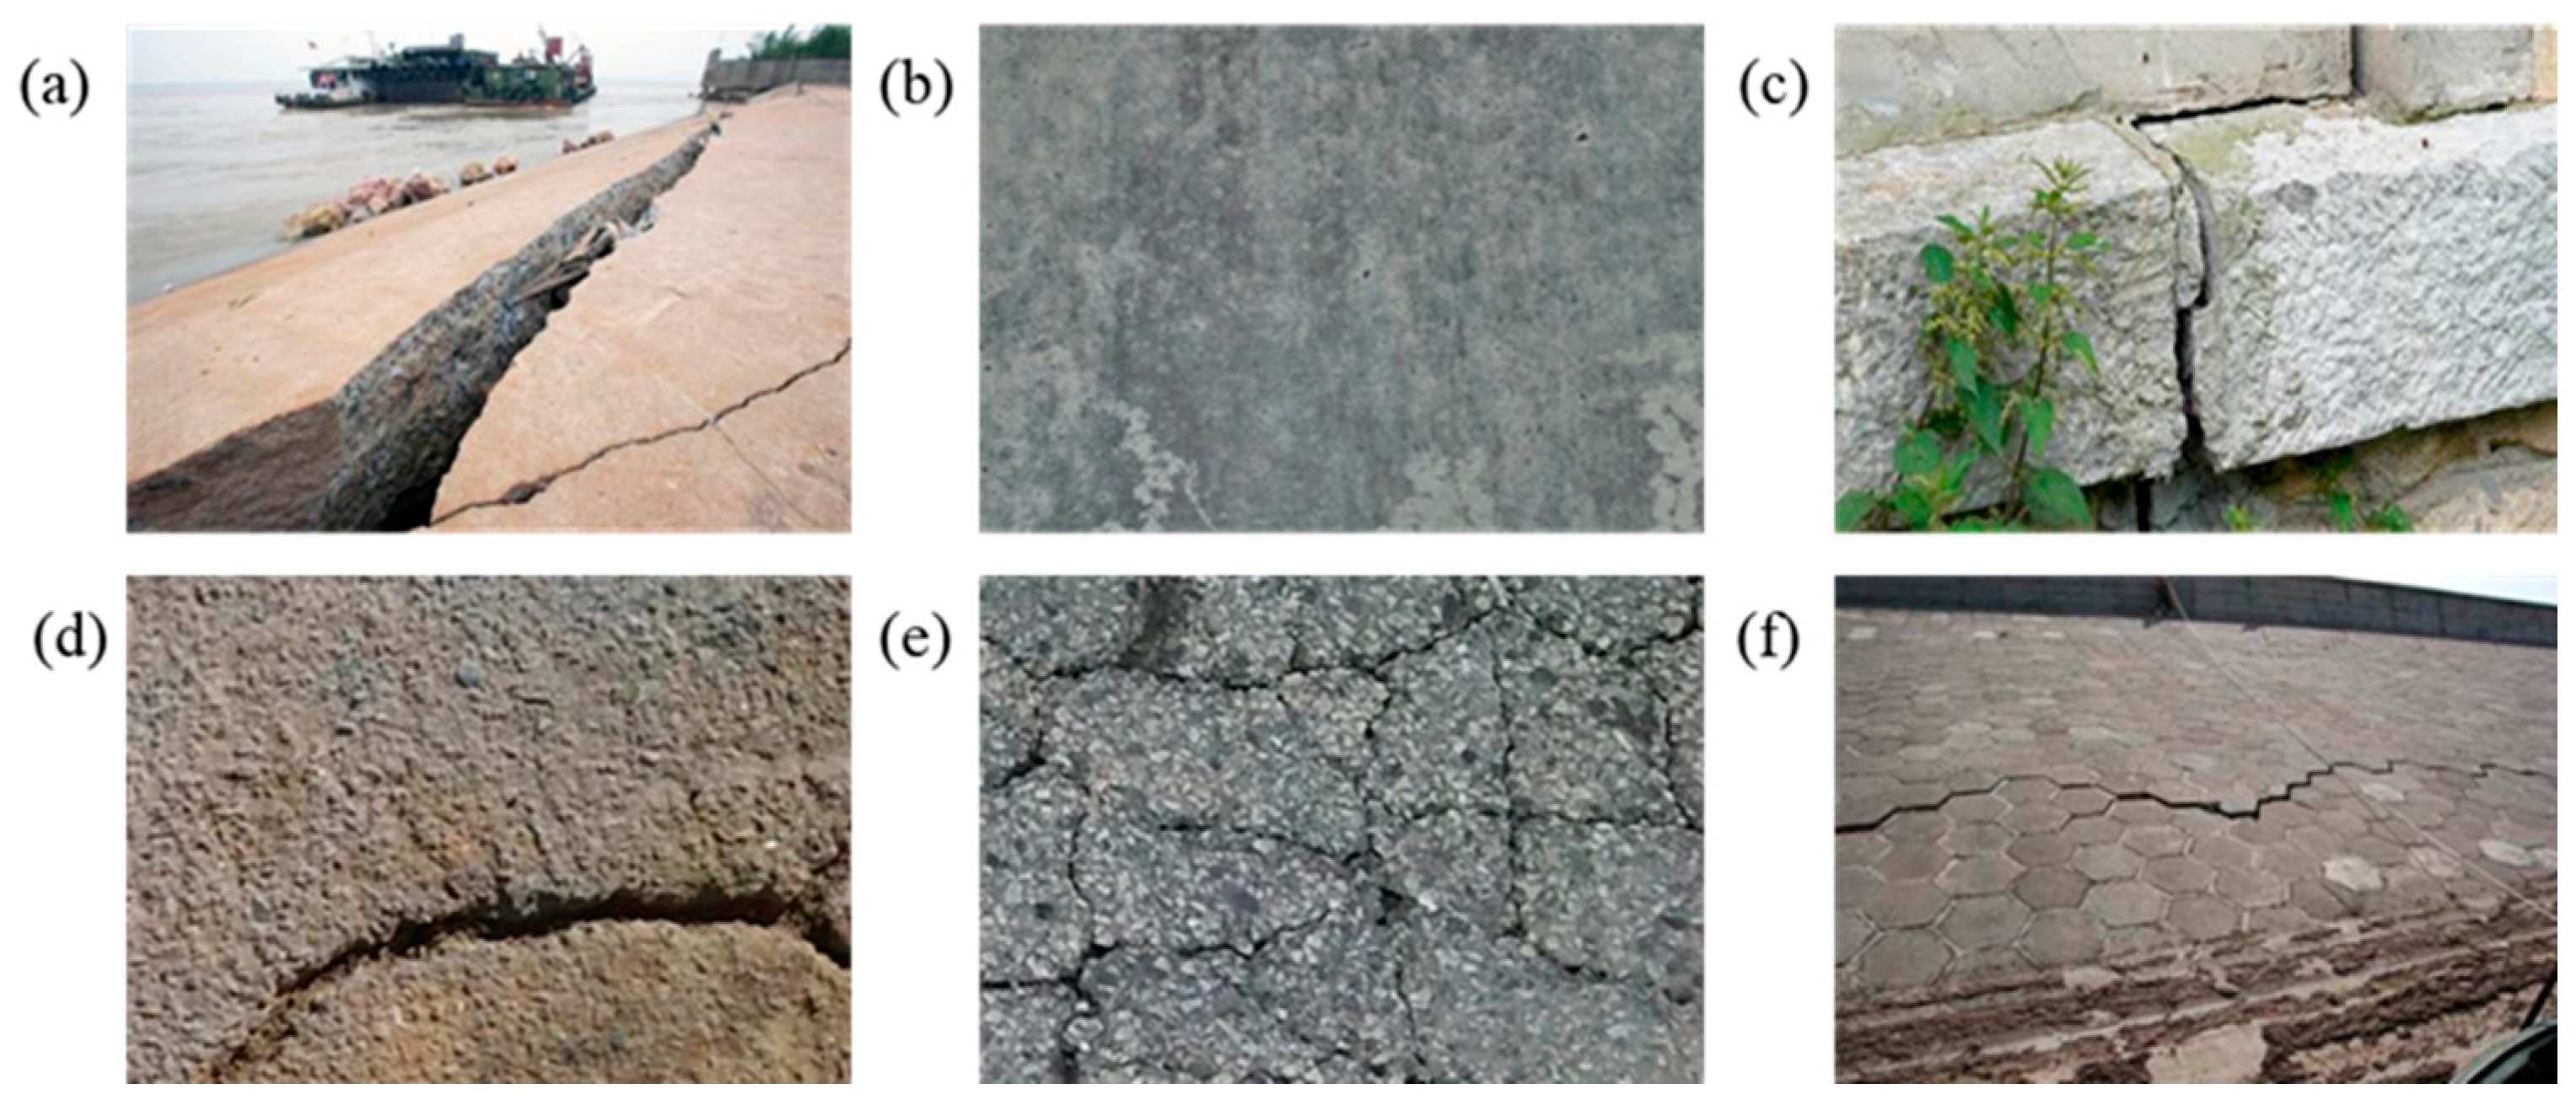
In addition, 48 near-field close-up images contained cracks occupying most of the image region, resulting in normalized bounding-box areas approaching the full image size (w × h ≥ 0.95). These samples were considered valid according to the task definition and contributed to the right tail of the scale distribution. Although 93.29% of crack instances had normalized bounding-box areas greater than 5% of the image area, their narrow widths and elongated geometries still posed challenges for accurate localization, highlighting the necessity of both scale-aware and context-aware feature modeling. Representative positive and negative examples are presented in Figure 6 to illustrate morphological diversity and challenging backgrounds.
Figure 6.
Representative samples from the multi-source crack dataset: (a) Typical dike crack and background overview; (b) Macroscopic crack on a dike surface; (c) Sample captured under complex interference; (d) Typical elongated crack on a concrete surface; (e) Mesh-like crack on a concrete surface; (f) Crack-free background negative sample.
2.6. Evaluation Protocol and Implementation Details
Detection performance is evaluated using precision (P), recall (R), mean average precision at IoU = 0.5 (mAP@0.5), and mean average precision averaged over IoU thresholds from 0.5 to 0.95 with a step size of 0.05 (mAP@0.5:0.95), following the COCO-style detection metric convention [35]. The latter metric provides a stricter assessment of localization quality. Model complexity is characterized by the number of parameters and GFLOPs, whereas inference efficiency is reported in frames per second (FPS) on a desktop workstation. For all models, FPS was measured on the test split using the same RTX 3060 GPU, 640 × 640 input size and a shared inference script; timing used PyTorch CUDA 2.4.0 synchronization after warmup and excludes image loading and post-processing. Reported FPS values refer to desktop-GPU throughput under the protocol above; embedded edge latency was not measured. GFLOPs for YOLOv8n, YOLO-Defender, and YOLOv8n-Ghost were measured experimentally at 640 × 640 input, whereas YOLOv10n [36] and YOLOv11n [37] values follow architecture profiling at the same input size; cross-family GFLOPs entries should therefore be read as indicative complexity estimates. Accordingly, the cross-model comparisons emphasize parameter counts and the same-device FPS protocol above; GFLOPs remain informative within the YOLOv8-family models, whereas cross-family entries provide only order-of-magnitude context.
All experiments were conducted on a workstation equipped with an Intel Core i5-12600KF CPU, an NVIDIA GeForce RTX 3060 GPU (12 GB memory), and the PyTorch 2.4.0 framework under Windows 10. Detection models were implemented with the Ultralytics YOLO API (version 8.2.50 for YOLOv8n, YOLO-Defender, YOLOv8n-Ghost, YOLOv10n, and ablations; Ultralytics 11 for YOLOv11n). All compared models were trained from random initialization under the same protocol (pretrained weights were not used), input size 640 × 640, batch size 16, 150 epochs, optimizer SGD with initial learning rate lr0 = 0.01, final-factor lrf = 0.01, momentum 0.937, weight decay 0.0005, three warmup epochs, linear learning-rate decay (cos_lr = false), random seed 0, deterministic = true, mixed-precision training enabled, and close_mosaic = 0. Validation-based early stopping used patience 100; all reported mAP values use each run’s validation-best checkpoint. P, R, and mAP in Section 3 are obtained on the fixed test split with each run’s validation-best checkpoint using the default Ultralytics validation routine.
During training, Ultralytics default online augmentation was applied on top of the offline-augmented training set, including mosaic augmentation (probability = 1.0), mixup (probability = 0), horizontal flipping (probability = 0.5), default HSV augmentation (Δh = 0.015, Δs = 0.7, Δv = 0.4), translation (0.1), and scaling (0.5). YOLOv8n, YOLO-Defender, YOLOv8n-Ghost, YOLOv10n, and all ablation variants reported in Section 3 were trained under the same data split, input size, optimization schedule, and online augmentation protocol. Each model retained its architecture- and implementation-specific components, including the detection head, loss formulation, and label-assignment strategy where applicable. YOLOv11n was retrained with the Ultralytics YOLO11 implementation using the identical dataset split, the same online augmentation settings listed above, and the same nominal training schedule (150 epochs, batch size 16, SGD, initial learning rate 0.01, and 640 × 640 input). YOLOv8n-Ghost refers to the Ultralytics YOLOv8-Ghost architecture incorporating C3Ghost modules derived from GhostNet [38], which was retrained under the proposed experimental protocol as a task-oriented comparison baseline rather than an exact reproduction of the original implementation.
2.7. Grad-CAM Visualization Protocol
For the qualitative analysis in Section 3, gradient-weighted class activation mapping (Grad-CAM) [39] was implemented in PyTorch using forward hooks on the target layer. The validation-best checkpoints described in Section 3.3 were loaded in evaluation mode, with gradient computation enabled for feature attribution. The same backbone SPPF layer was selected as the target layer for both models to ensure a consistent visualization basis. The backward target was defined as the average score of the top-k (k = 20) crack-class (class 0) detections obtained from the raw detection outputs after confidence ranking.
All input images were letterboxed to 640 × 640 pixels following the same preprocessing used in Ultralytics inference. For Grad-CAM computation, inputs pixel values were scaled to the unit interval without ImageNet mean–std normalization. Test-time augmentation smoothing and eigen smoothing were enabled during CAM generation. No bounding-box-restricted renormalization was performed; instead, activation maps were min--max normalized over the entire image domain and visualized using the jet colormap with an opacity factor of 0.5. A global Low/Medium/High color scale was used for interpretation. For direct comparison between models on the same image, both CAM maps were normalized using a shared scale derived from their raw activation ranges.
One sample was selected from the fixed test split for qualitative visualization of the CAM responses and detection behavior of YOLOv8n and YOLO-Defender. The visualization is intended to complement the quantitative evaluation reported in Section 3 and is presented as an illustrative qualitative comparison.
3. Results and Discussion
3.1. Ablation Study
To quantify the contribution of each component, a component-wise ablation study was conducted using YOLOv8n as the baseline (Table 1). The baseline achieves 86.6% mAP@0.5 with 3.01 M parameters and 8.1 GFLOPs. Replacing the deepest C2f block with C2F-FTB (Exp. 2) increases mAP@0.5 to 88.3% while reducing the parameter count to 2.69 M, demonstrating that enhanced local–global feature modeling can be achieved while maintaining a compact architecture. Introducing BiFF-PAN alone (Exp. 3) improves mAP@0.5 to 88.0% relative to the baseline and decreases parameters to 2.08 M, highlighting the effectiveness of improved multi-scale feature aggregation. In contrast, CA alone (Exp. 4) maintains the same mAP@0.5 but improves mAP@0.5:0.95 from 64.1% to 65.7%, indicating enhanced localization precision under stricter IoU thresholds.
Table 1.
Component-wise ablation on the fixed held-out test split.
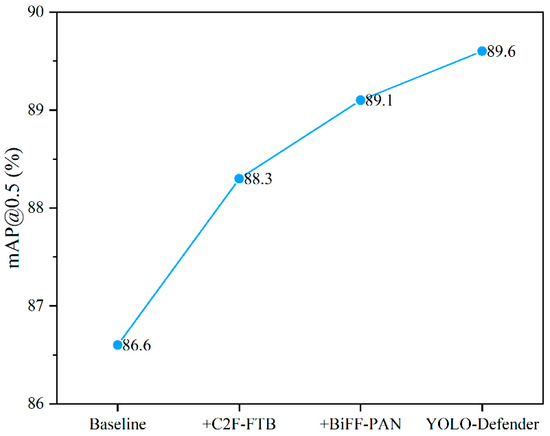
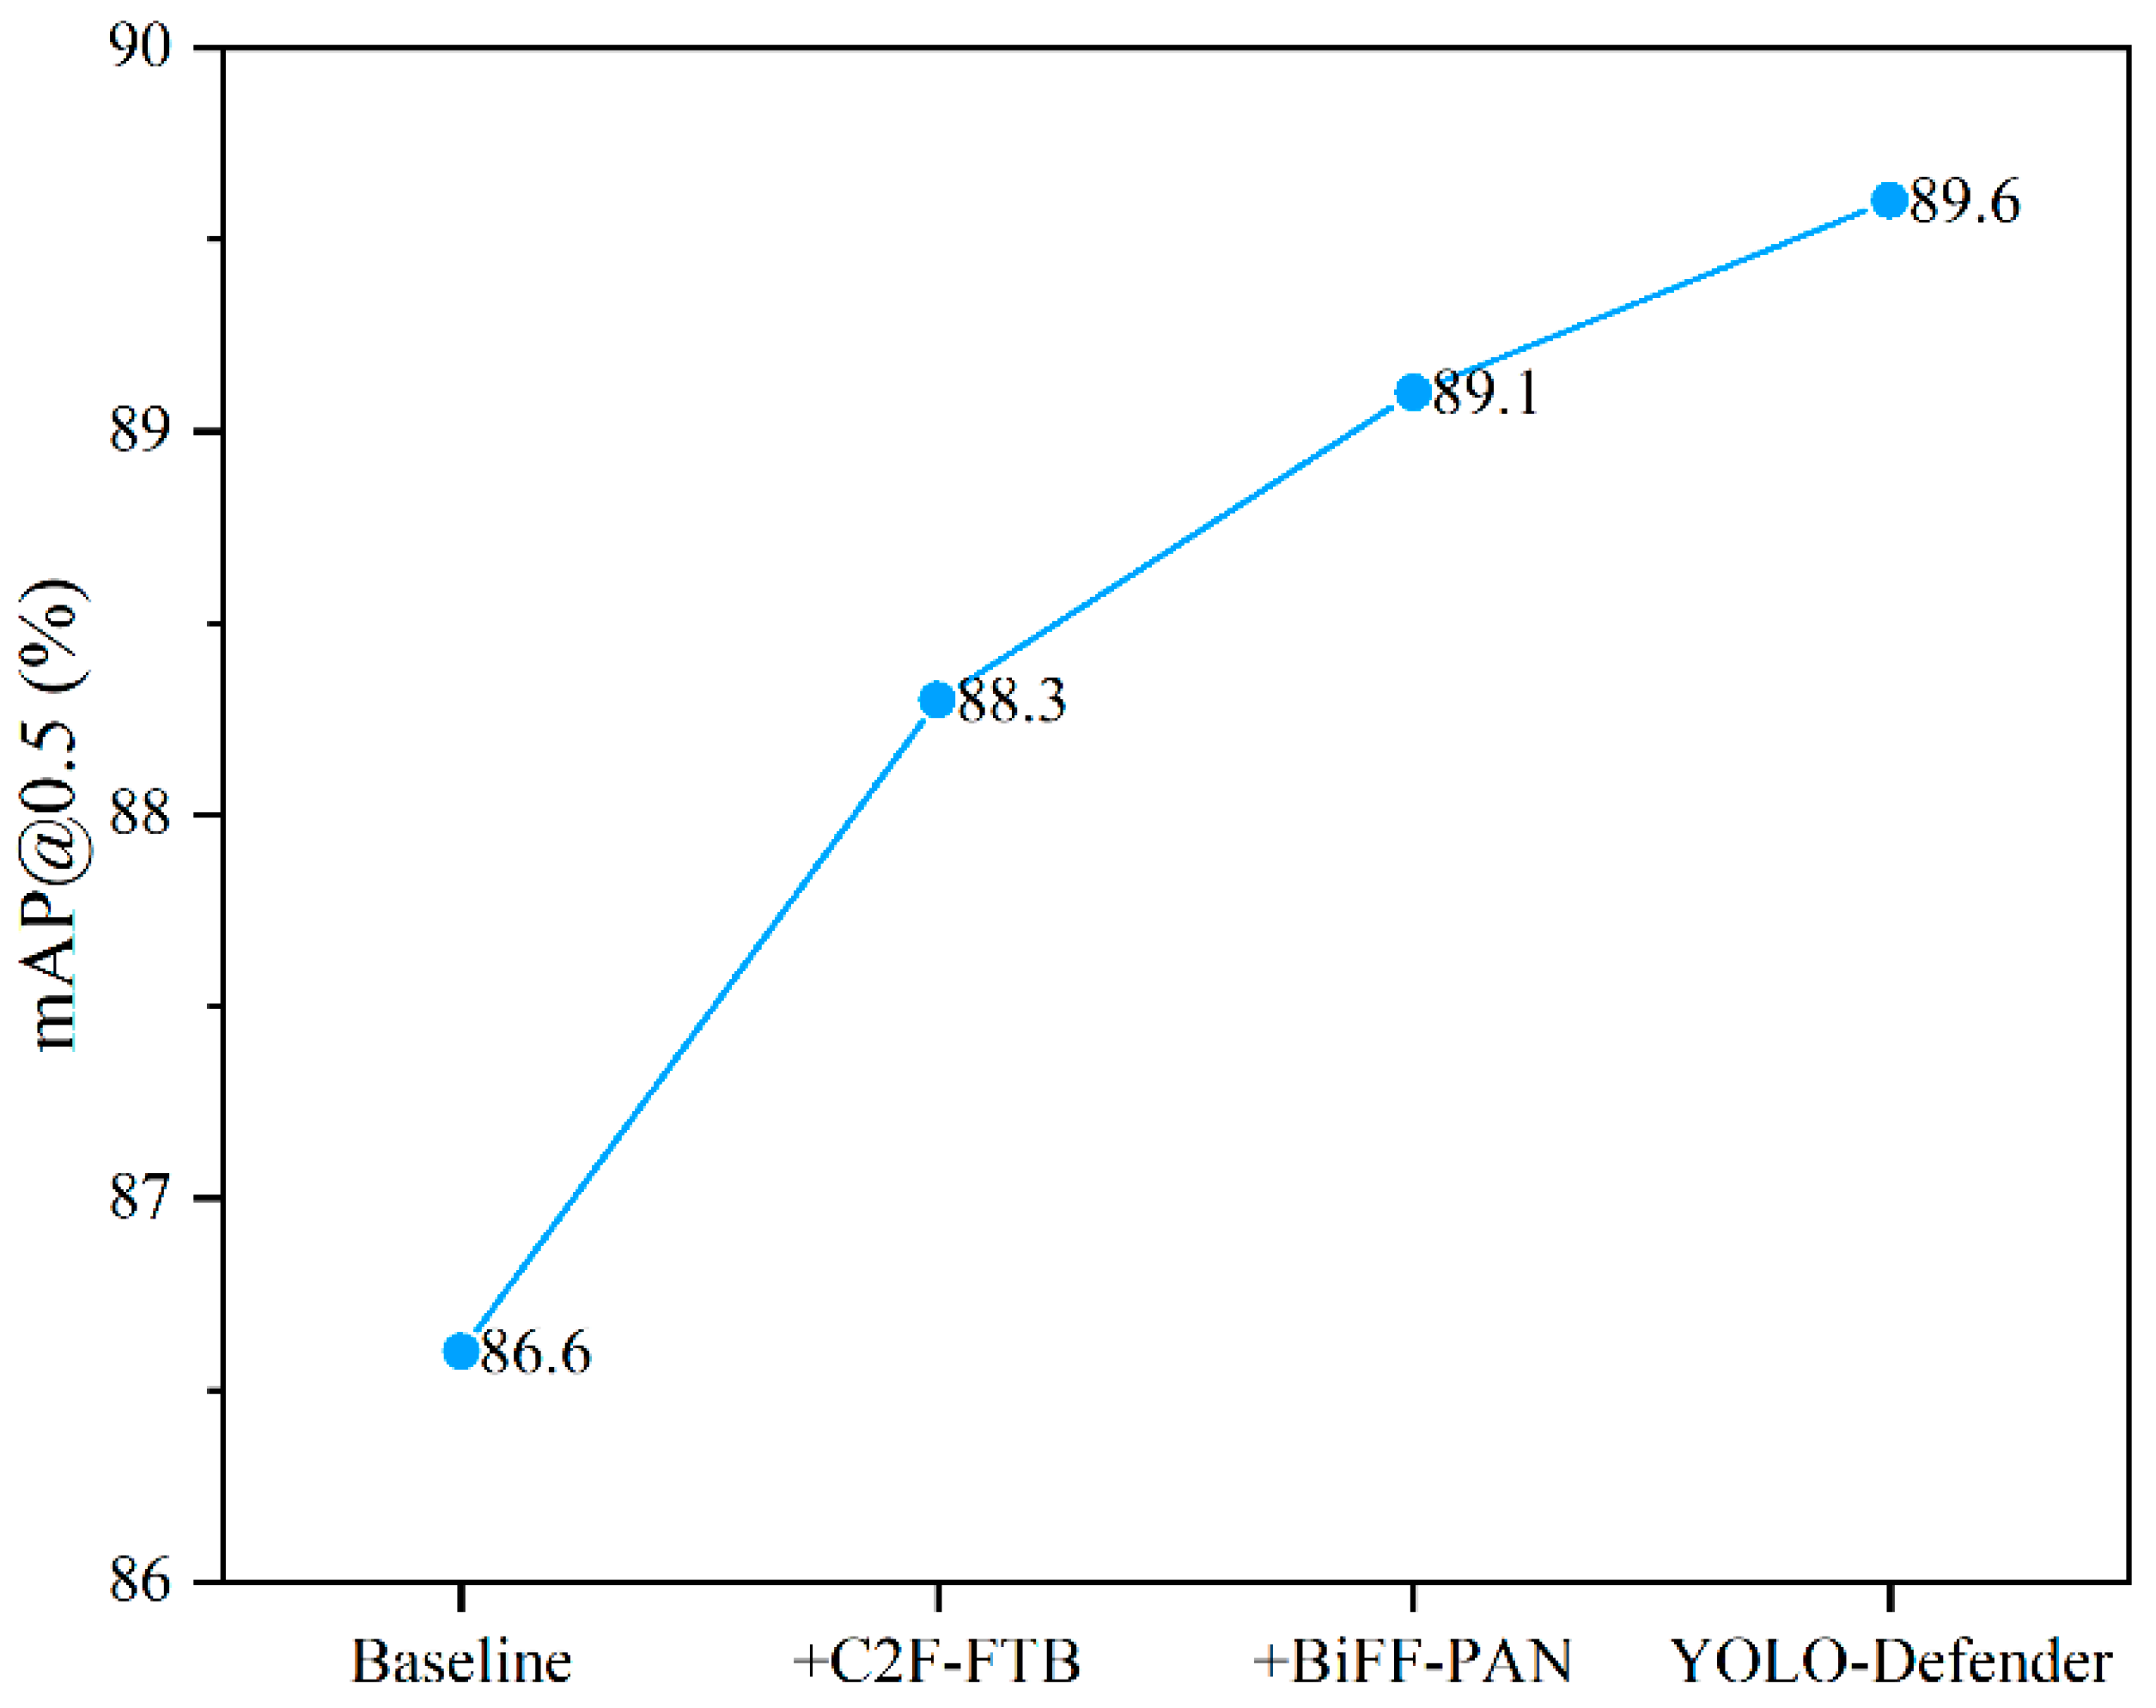
Combining C2F-FTB and BiFF-PAN (Exp. 5) achieves 89.1% mAP@0.5 with only 1.77 M parameters and 6.6 GFLOPs, demonstrating their complementary benefits in feature extraction and multi-scale fusion. After further incorporating CA (Exp. 6), YOLO-Defender reaches 89.6% mAP@0.5 and 69.2% mAP@0.5:0.95, corresponding to absolute improvements of 3.0 and 5.1 percentage points over the baseline, while maintaining the same computational cost as Exp. 5. Figure 7 summarizes the mAP@0.5 progression along the sequential integration path from the baseline to C2F-FTB, C2F-FTB combined with BiFF-PAN, and the complete YOLO-Defender model. From Exp. 5 to Exp. 6, mAP@0.5 increases by 0.5 percentage points, whereas mAP@0.5:0.95 increases from 65.7% to 69.2% (+3.5 percentage points). This larger improvement under stricter IoU thresholds indicates that CA has a stronger effect on localization-sensitive performance and motivates the attention-mechanism comparison presented below.
Figure 7.
Incremental mAP@0.5 gains from module integration.
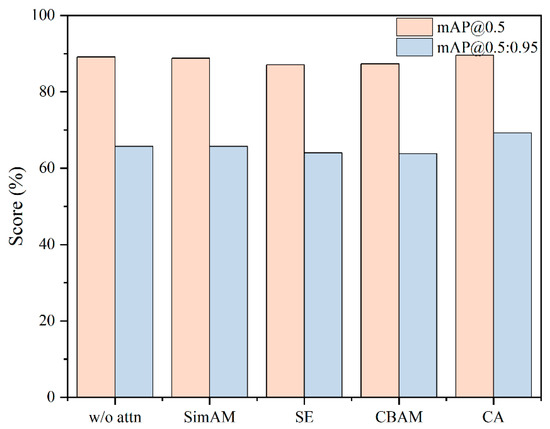
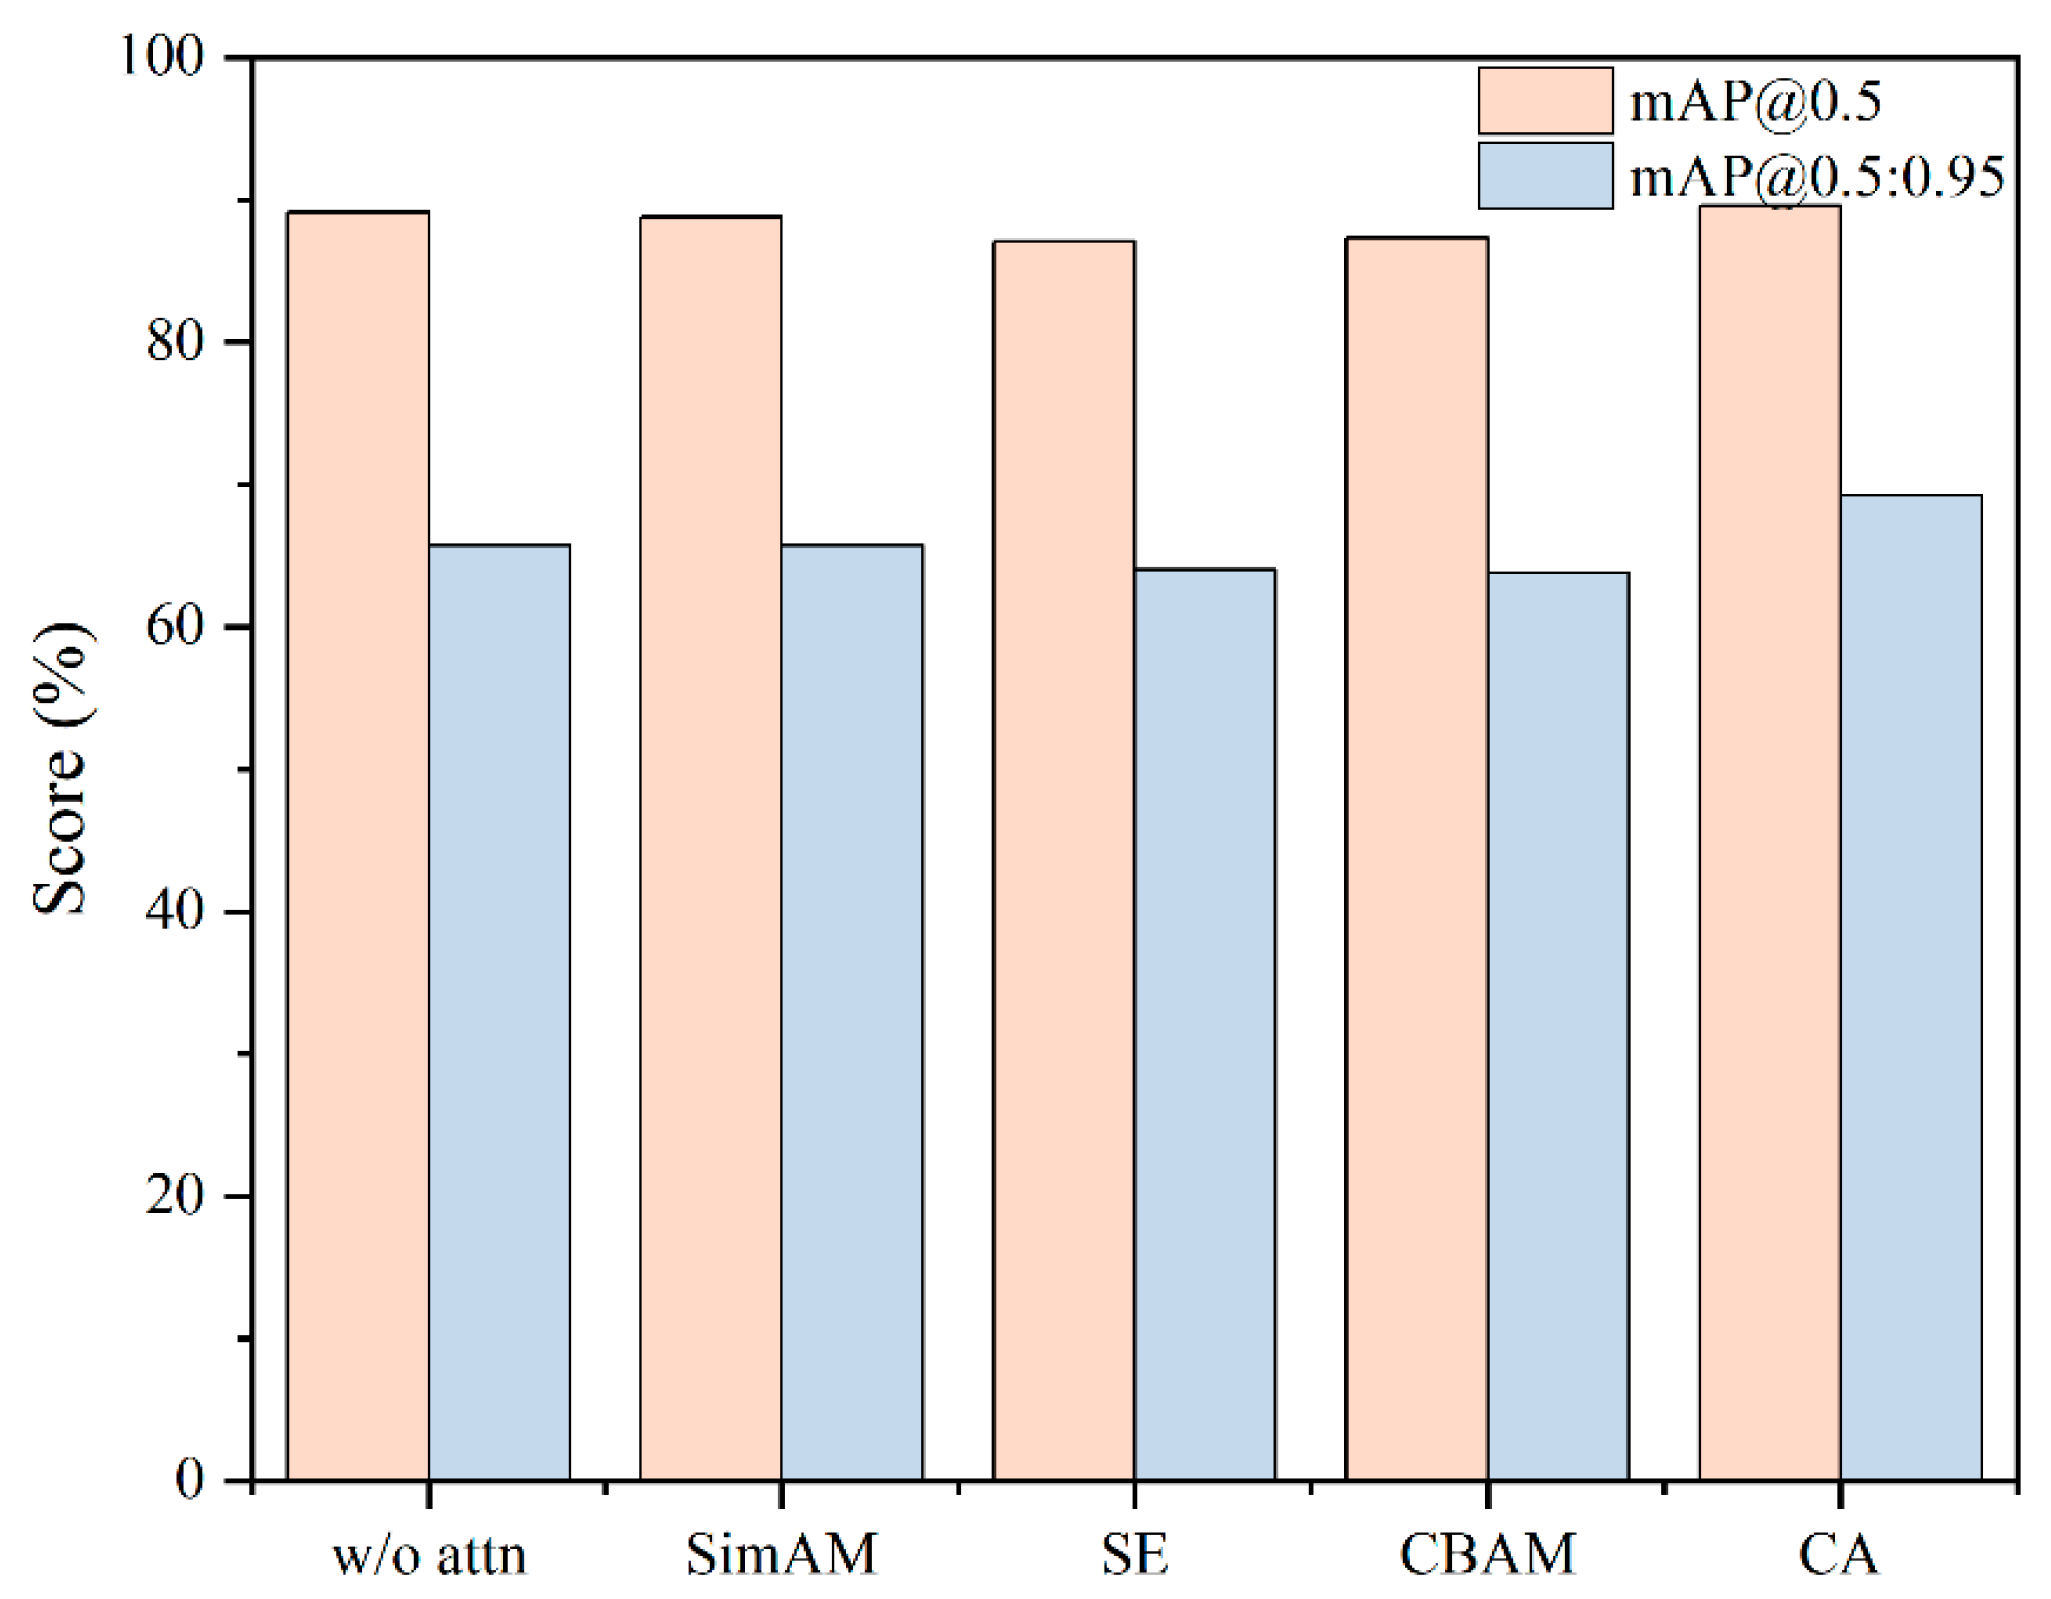
The contribution of CA is further investigated by replacing it with alternative attention mechanisms under the Exp. 5 configuration (Model A in Table 2). Although SE achieves the highest precision (89.5%), its recall decreases substantially to 78.7%, leading to lower overall mAP performance. This behavior is consistent with the limited spatial awareness of global channel attention, as discussed in Section 2. SimAM [40] and CBAM [41] improve precision relative to Model A but do not yield an overall mAP improvement. SimAM slightly decreases mAP@0.5 from 89.1% to 88.8% while leaving mAP@0.5:0.95 unchanged at 65.7%, whereas CBAM reduces both metrics to 87.3% and 63.8%, respectively. In contrast, CA achieves the highest mAP@0.5 and mAP@0.5:0.95 among the evaluated attention variants, demonstrating its effectiveness in improving localization accuracy for slender crack targets under strict IoU thresholds.
Table 2.
Attention mechanism comparison under the Exp. 5 Model A setup.
These results suggest complementary contributions among the three architectural modifications. C2F-FTB and BiFF-PAN jointly improve detection accuracy while reducing model complexity, whereas CA produces a larger gain in mAP@0.5:0.95 without increasing the reported parameter count, indicating a stronger contribution to localization-sensitive performance under stricter IoU thresholds. This CA-specific advantage is further illustrated in Figure 8, which compares alternative attention variants under the Exp. 5 Model A setup.
Figure 8.
Attention variant comparison for Model A under Exp. 5.
3.2. Comparison with Lightweight Detectors
YOLO-Defender was benchmarked against representative lightweight one-stage detectors, including YOLOv8n (baseline), YOLOv10n, and YOLOv11n, together with a retrained YOLOv8n-Ghost baseline, as summarized in Table 3. The models were evaluated using the same fixed dataset split, input resolution, and nominal training protocol while retaining their model-specific implementations. Direct numerical comparison with previously published hydraulic-structure crack detectors was not performed because existing studies differ substantially in task formulation, dataset composition, image acquisition conditions, and evaluation protocols. The selected models therefore provide internally controlled lightweight baselines for evaluating the proposed architecture.
Table 3.
Quantitative comparison of YOLO-Defender versus lightweight YOLO baselines.
The retrained YOLOv8n-Ghost baseline achieves the same mAP@0.5 as YOLOv8n (86.6%) while improving mAP@0.5:0.95 to 67.0% with fewer parameters (1.71 M) and lower computational cost (5.0 GFLOPs). However, its recall decreases to 80.1% compared with 85.3% for YOLOv8n, suggesting that lightweight backbone optimization alone does not fully resolve missed-detection challenges in elongated crack detection.
YOLOv10n achieves 85.7% mAP@0.5 but only 59.7% mAP@0.5:0.95, the lowest value under the stricter metric among the compared models, while operating at 131 FPS. This result indicates that its detection performance decreases more markedly as the IoU requirement becomes stricter on the present crack dataset. YOLOv11n achieves 87.4% mAP@0.5 and 66.7% mAP@0.5:0.95; however, its performance remains lower than that of YOLO-Defender.
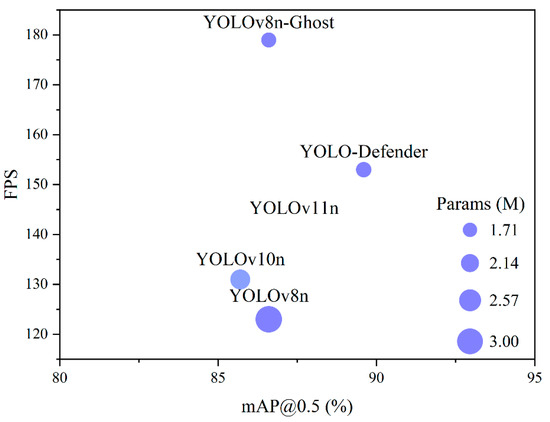
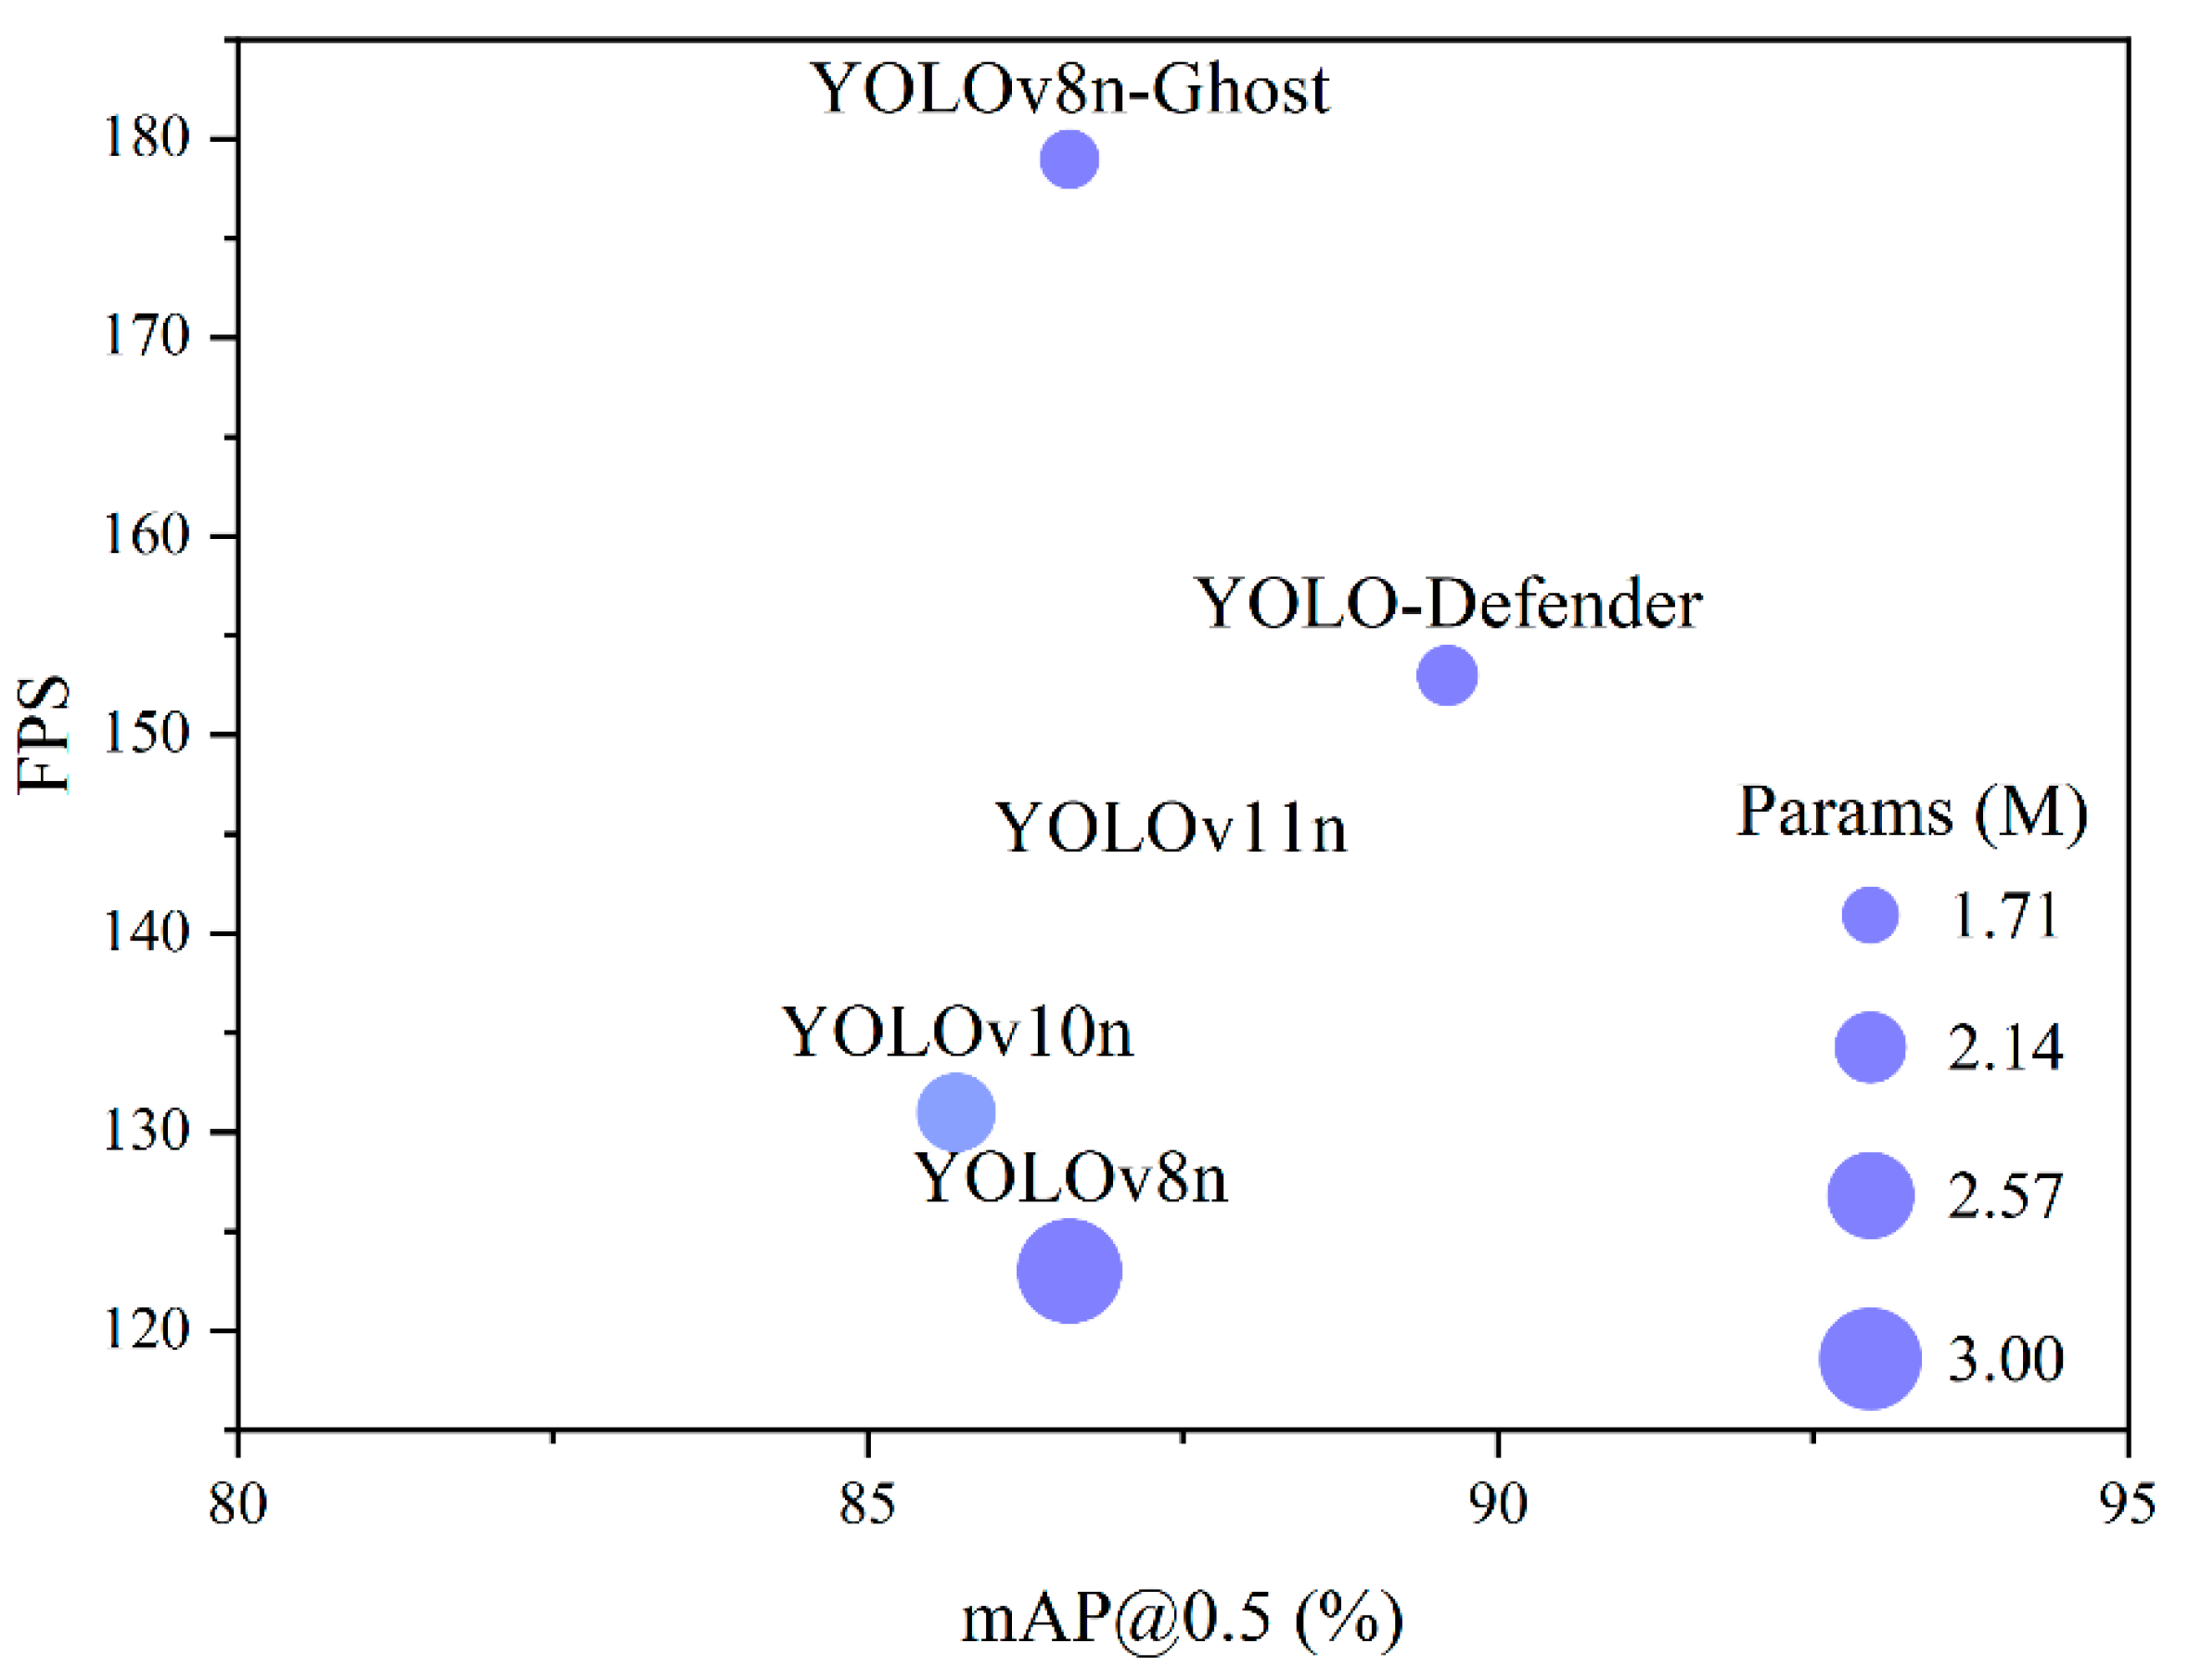
YOLO-Defender achieves the best mAP-based detection performance among all compared models, reaching 89.6% mAP@0.5 and 69.2% mAP@0.5:0.95. Compared with YOLOv8n-Ghost, it improves mAP@0.5 and mAP@0.5:0.95 by 3.0 and 2.2 percentage points, respectively, while maintaining a favorable accuracy-efficiency balance with 1.77 M parameters, 6.6 GFLOPs, and 153 FPS. On the same test split, YOLO-Defender obtains the highest recall (85.8%) together with a precision of 85.6%. Although YOLOv11n achieves higher precision than YOLO-Defender (88.5% versus 85.6%), it has lower recall (84.2% versus 85.8%) and lower mAP@0.5:0.95 (66.7% versus 69.2%). These results indicate that YOLO-Defender provides a more favorable balance between detection completeness and localization-sensitive performance under stricter IoU thresholds. These comparisons also clarify the accuracy–complexity balance. YOLOv8n-Ghost is more compact and faster under the desktop protocol, whereas YOLO-Defender attains higher mAP@0.5, mAP@0.5:0.95, and recall at a modest increase in parameters and GFLOPs. Relative to YOLOv8n, YOLO-Defender improves both mAP metrics while reducing parameters and GFLOPs. Figure 9 summarizes the accuracy–speed trade-off on the test split.
Figure 9.
Accuracy-speed trade-off on the test split.
Beyond the seed-0 comparison reported in Table 3, YOLOv8n and YOLO-Defender were additionally trained with seeds 1 and 2 under the same protocol. Over seeds 0–2 on the fixed test split, YOLO-Defender achieved higher mean mAP@0.5 and mAP@0.5:0.95 than YOLOv8n (90.2 ± 1.0% versus 86.9 ± 0.2%; 69.4 ± 0.1% versus 64.2 ± 0.3%). The seed-0 point estimates in Table 3 remain the primary results for cross-model comparison, indicating that the observed gains are not attributable to a single initialization.
3.3. Qualitative Analysis
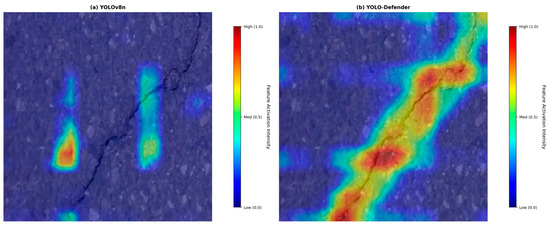
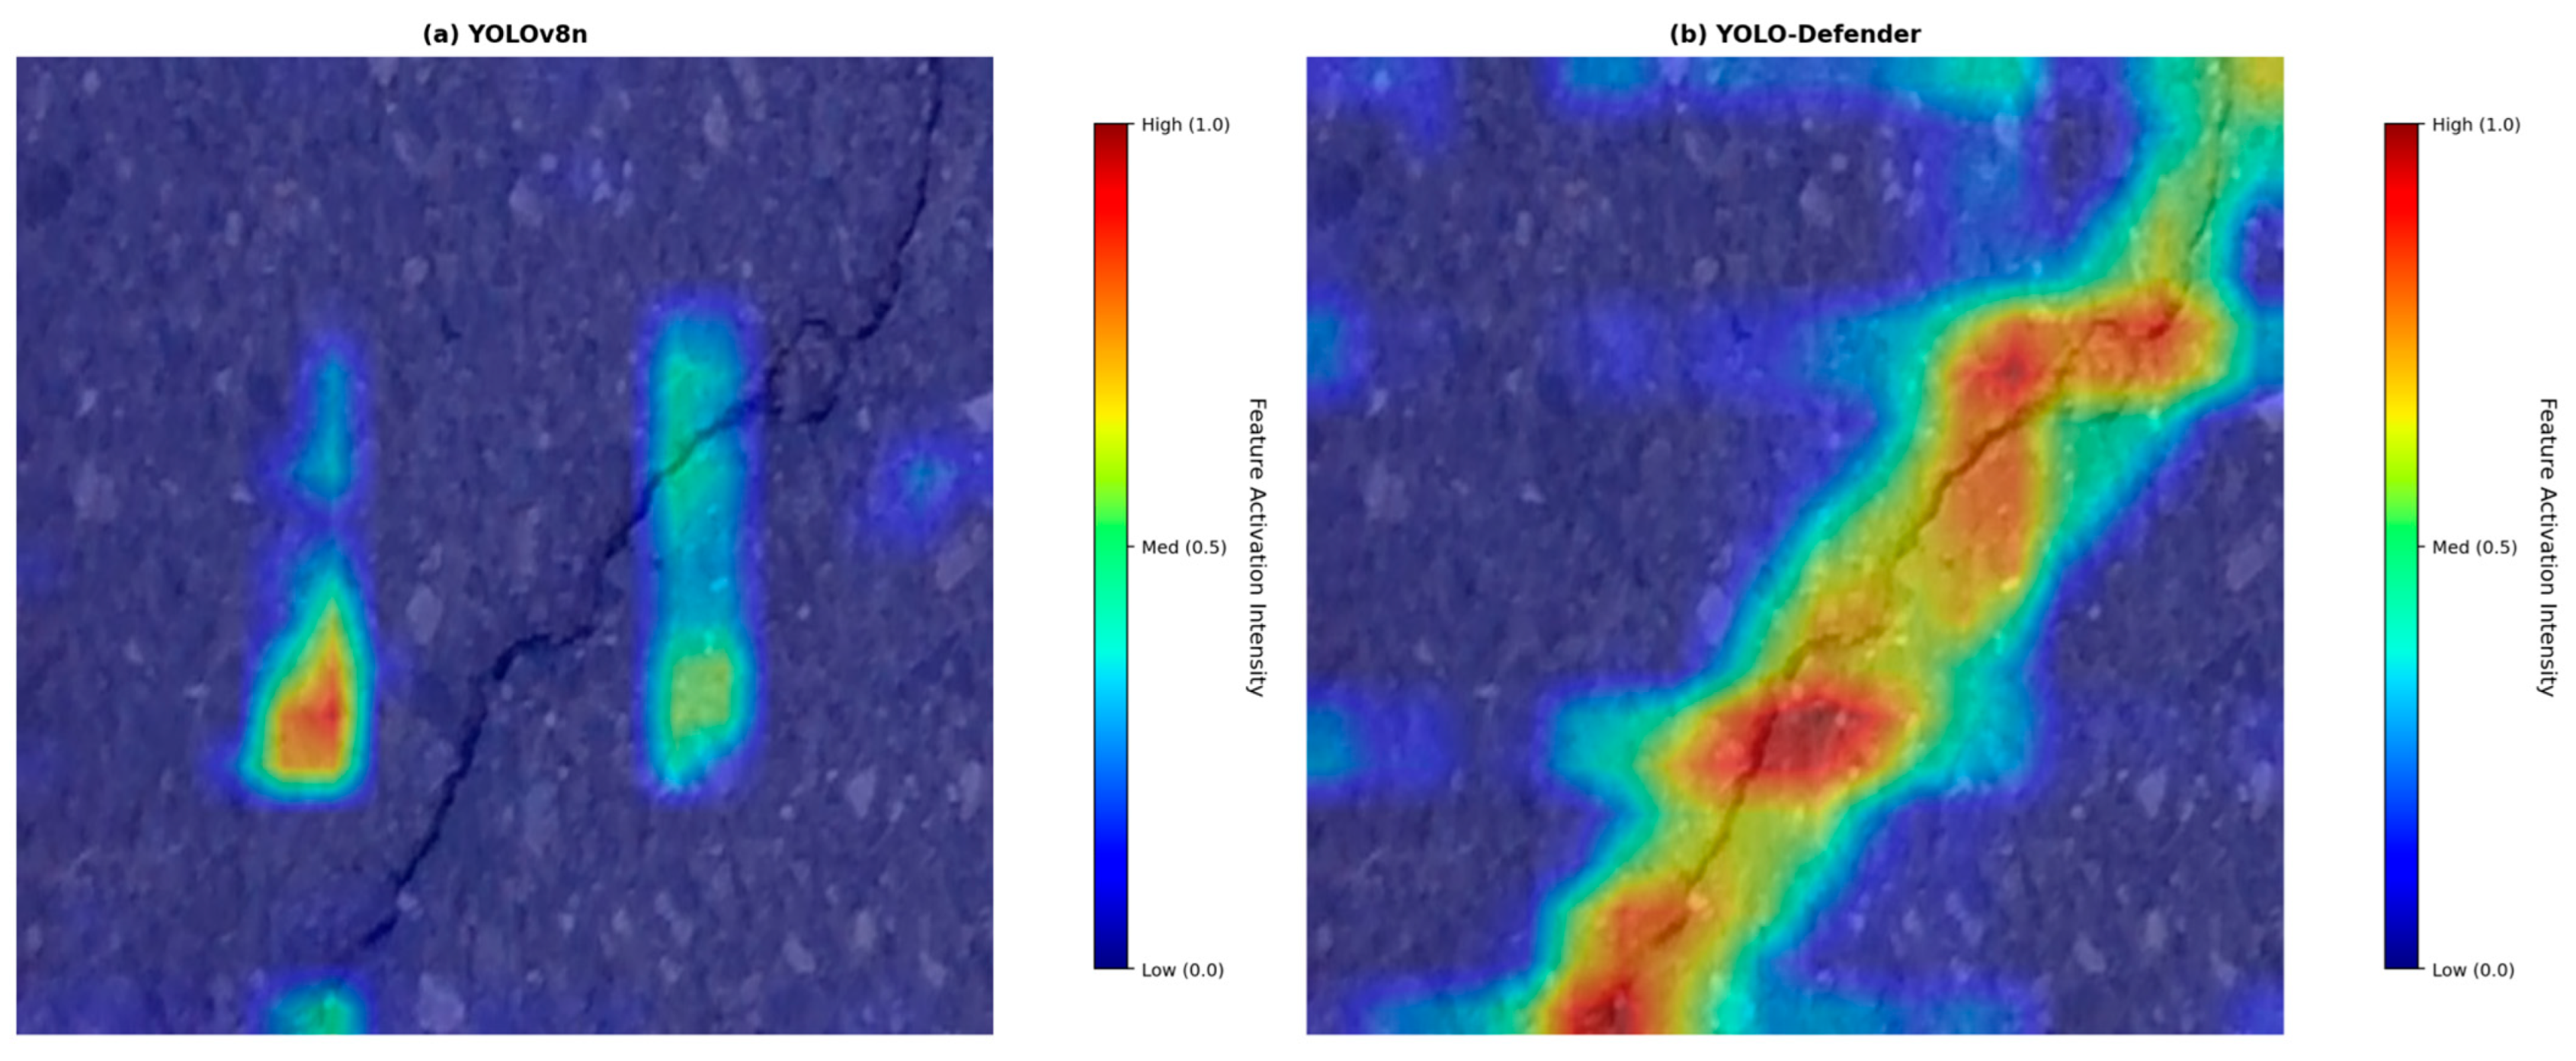
To further interpret the quantitative improvements reported in Table 3, gradient-weighted class activation mapping (Grad-CAM) was applied to YOLOv8n and YOLO-Defender using a representative test image selected according to the protocol described in Section 2.7. Figure 10 presents the visualization results under identical conditions, including the same input image, colormap, and shared min--max activation scale. For YOLOv8n, activation responses are relatively dispersed and partially overlap with visually similar background textures, indicating less discriminative feature localization in cluttered scenes. In contrast, YOLO-Defender produces more concentrated responses along the crack regions in the illustrated example, while showing weaker responses to visually similar background textures. This qualitative observation is consistent with the higher mAP@0.5:0.95 reported in Table 3 and complements the quantitative evidence of improved localization-sensitive detection performance.
Figure 10.
Grad-CAM comparison on a representative test image.
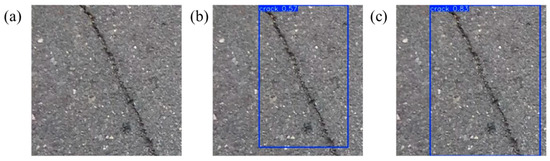
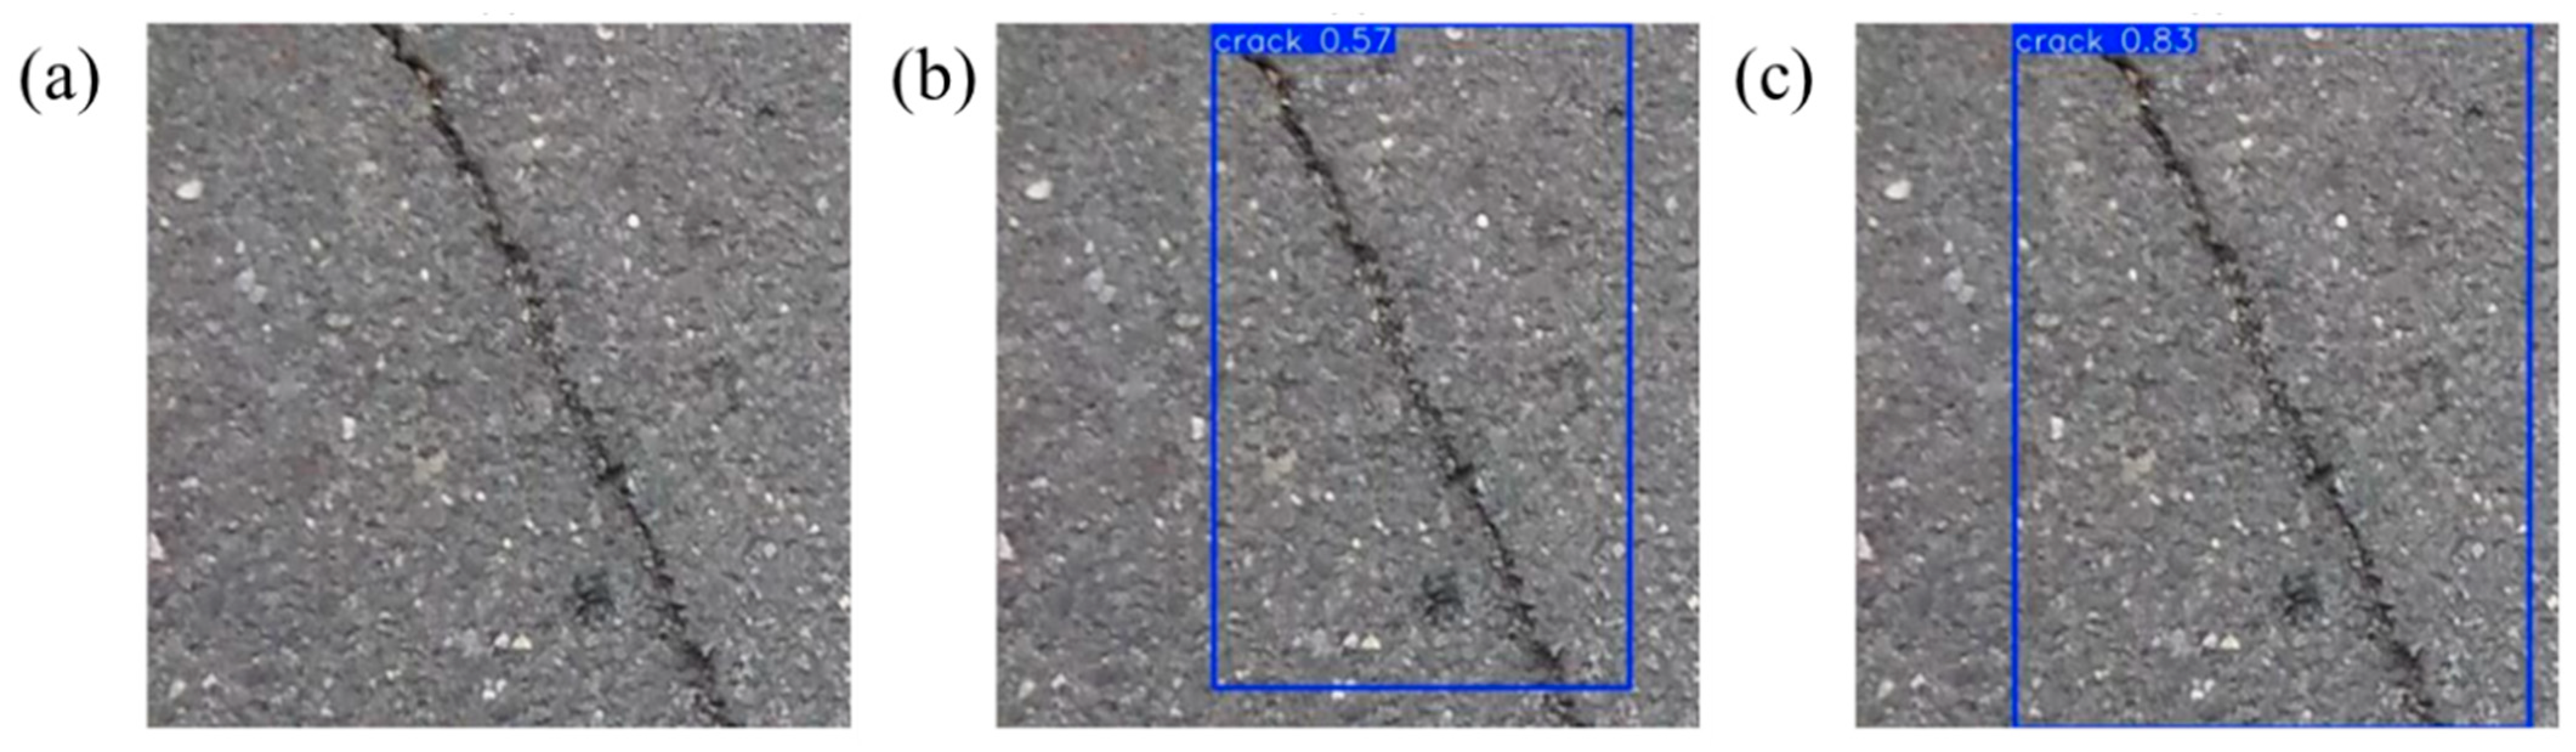
Figure 11 further compares bounding-box predictions on another representative test sample. Under the same input image and evaluation setting, YOLOv8n produces a lower-confidence detection with relatively looser localization on the diagonal crack, whereas YOLO-Defender generates a higher-confidence prediction with tighter bounding-box alignment around the same target. This qualitative observation is consistent with the higher mAP@0.5:0.95 of YOLO-Defender reported in Table 3.
Figure 11.
Detection comparison on a representative test image. (a) Input; (b) YOLOv8n; (c) YOLO-Defender.
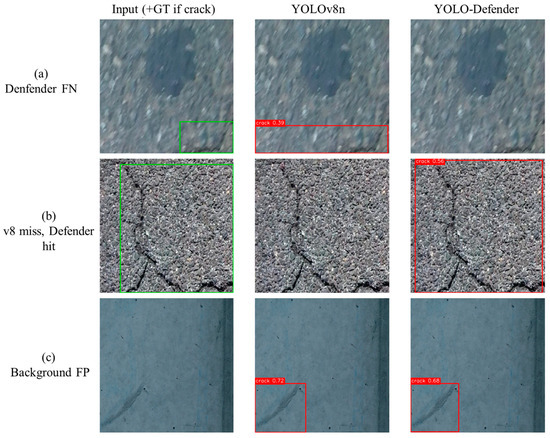
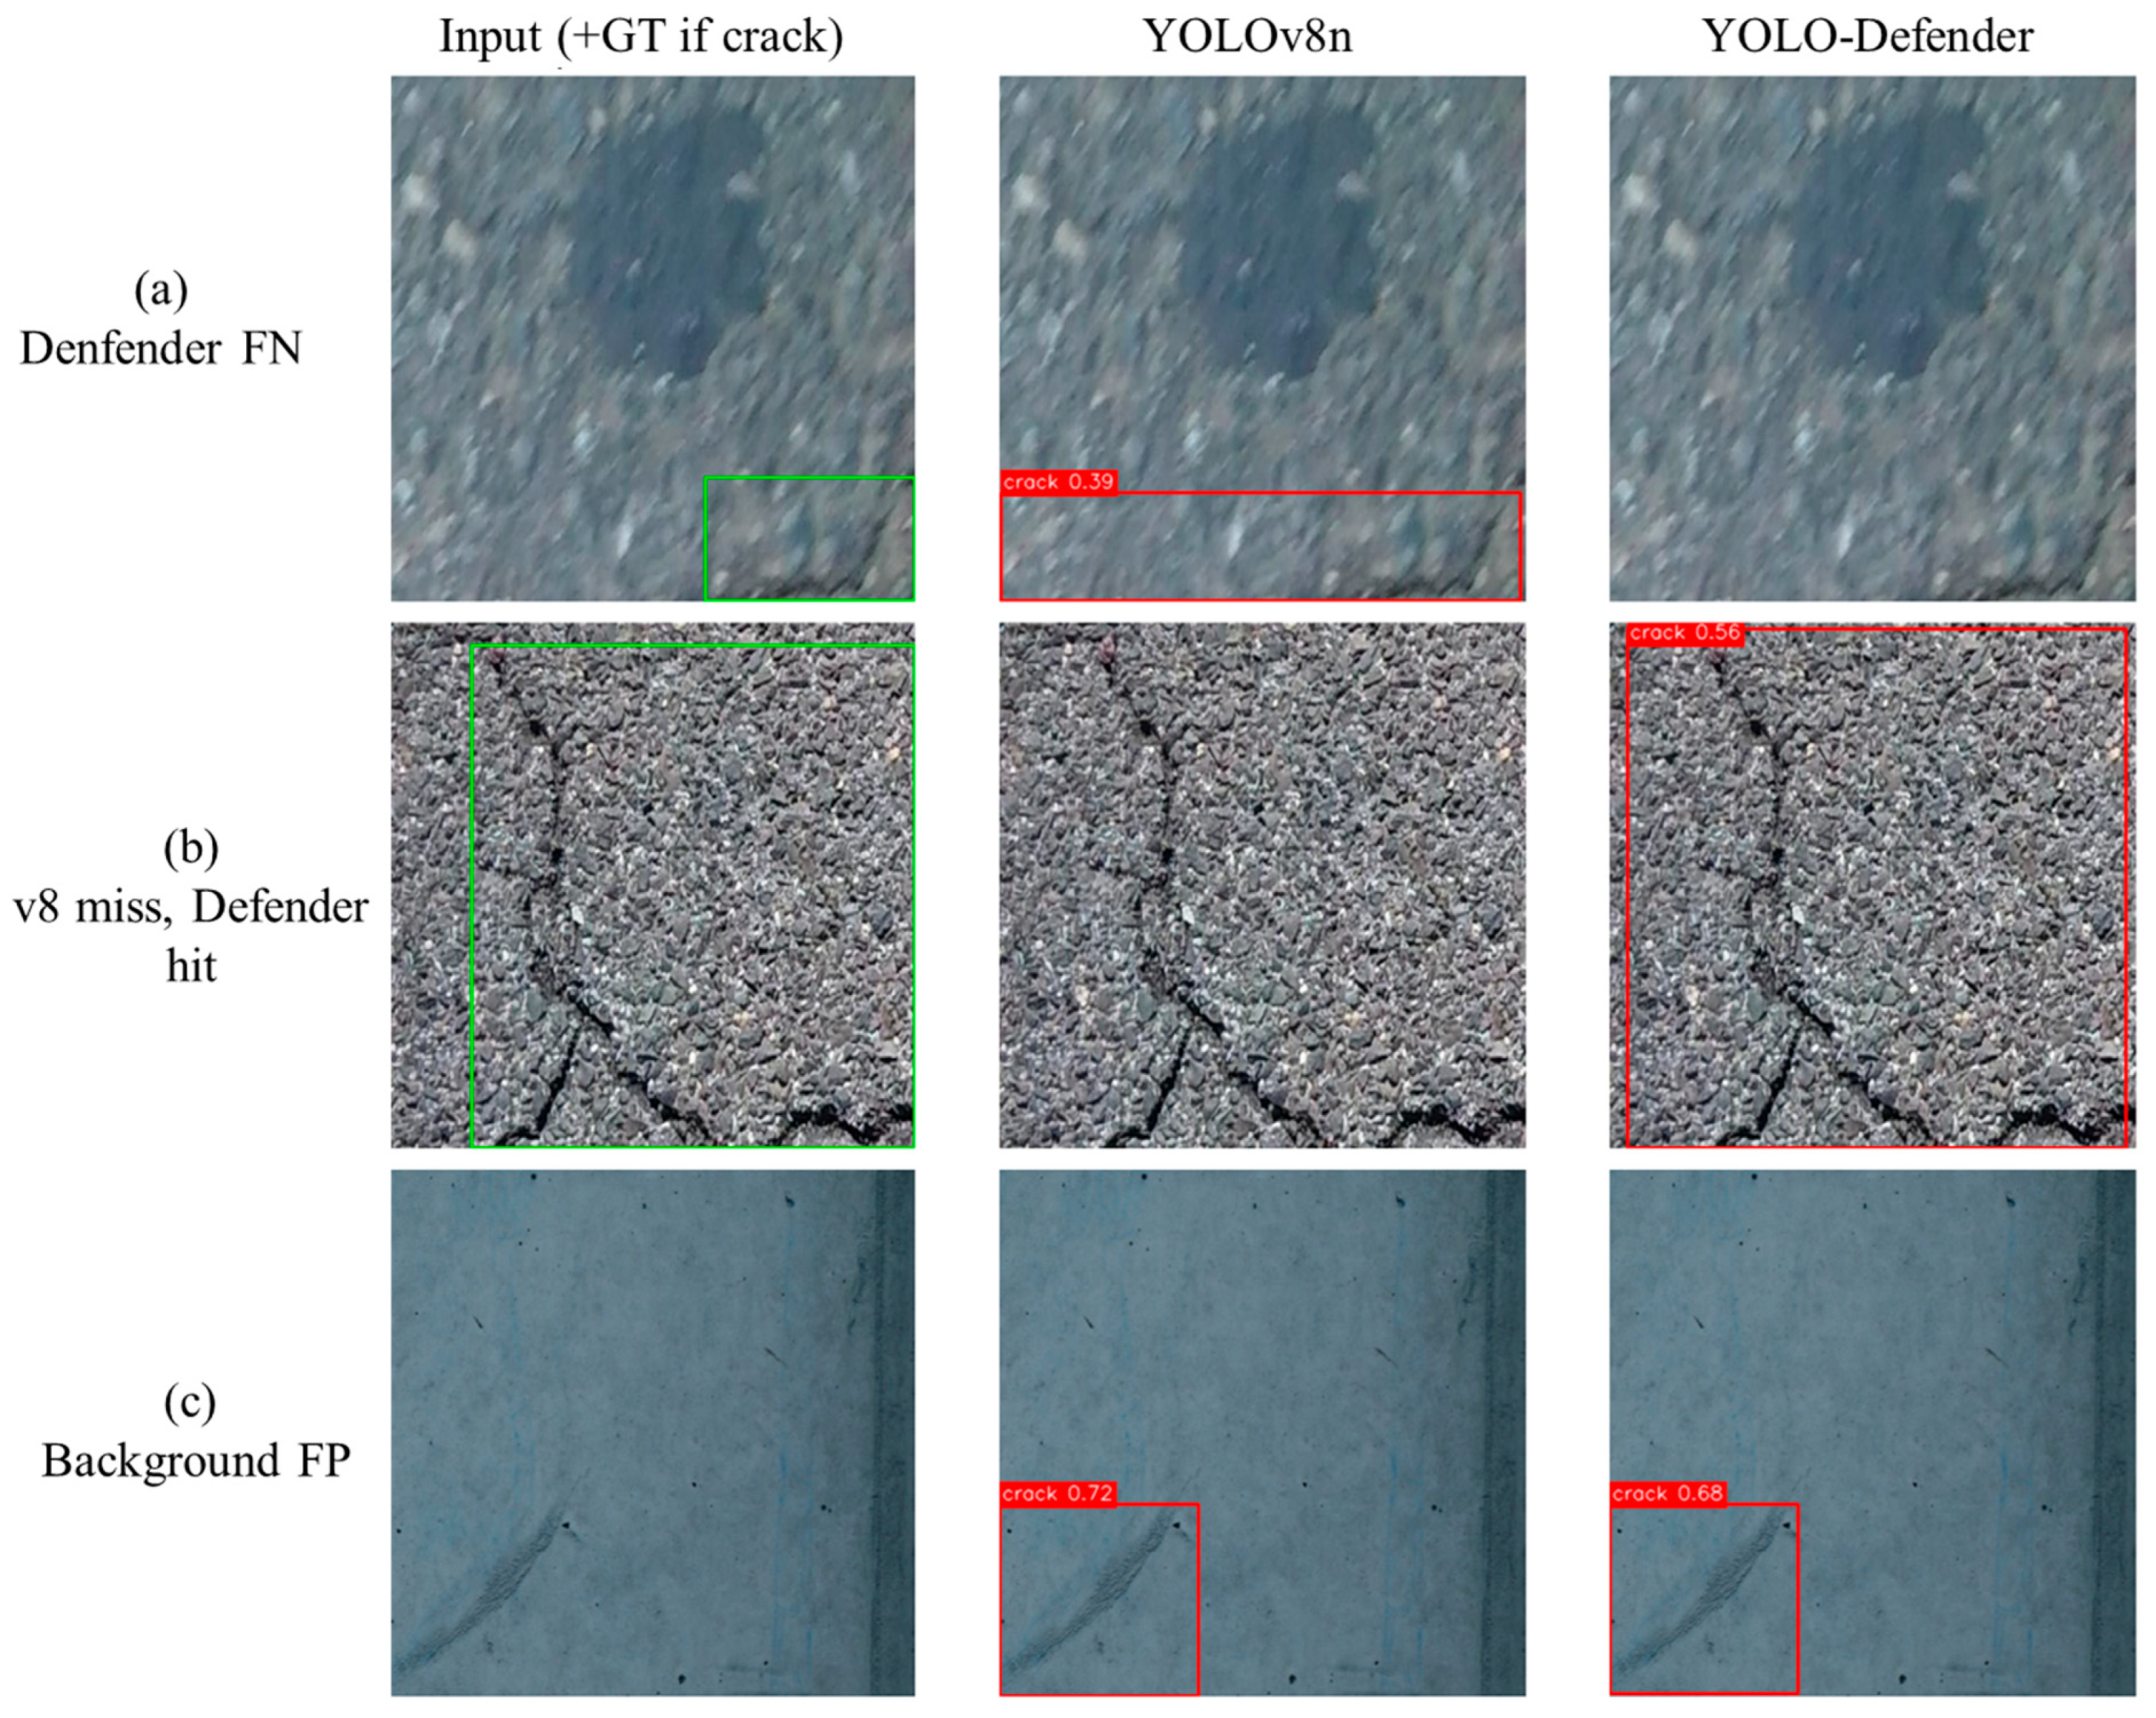
Beyond the successful examples presented above, Figure 12 illustrates three representative error patterns observed on the fixed test split using the same checkpoints as Table 3 and a confidence threshold of 0.25 for visualization (640 × 640 input). A complete automated error taxonomy was not performed; therefore, the examples in Figure 12 are presented as illustrative qualitative cases rather than a comprehensive error analysis. Green boxes indicate manually annotated ground-truth bounding boxes.
Figure 12.
Representative failure modes on the fixed test split (conf = 0.25; 640 × 640).
- (i)
- Persistent false negatives. In challenging crack-positive images, YOLO-Defender may still fail to detect annotated targets, particularly for low-contrast fissures with weak visual boundaries. Such cases represent residual missed detections under challenging visual conditions, such as low contrast and weak crack boundaries.
- (ii)
- Baseline miss with Defender recovery. In a representative example, YOLOv8n fails to produce a valid detection above the visualization threshold, whereas YOLO-Defender successfully localizes the crack region. This example illustrates a miss-to-recovery case relative to YOLOv8n at the visualization confidence threshold of 0.25. The overall quantitative differences between the two models are reported separately in Table 3.
- (iii)
- On the 60 crack-free test images, false positives above the visualization threshold remain rare but nonzero for both models (see Section 3.4), typically when joints, stains, or shadows form crack-like lineaments.
From a water-infrastructure operation and maintenance (O&M) perspective, the improvement in mAP@0.5:0.95 is particularly meaningful because stricter IoU thresholds emphasize localization accuracy, which is critical for identifying slender cracks on embankment surfaces. The stronger localization-sensitive performance under stricter IoU thresholds, the highest recall among the compared models, and the achieved inference speed may support pre-flood-season screening workflows in which inspectors must review large volumes of inspection imagery under time constraints. In this scenario, automated detection serves as a decision-support tool that highlights potential defects for subsequent human verification rather than replacing engineering judgment [42]. The achieved inference speed further suggests the practical feasibility of YOLO-Defender for batch screening of collected inspection imagery on desktop workstations.
3.4. Stratified Evaluation of Dike-Field and Non-Field Test Images
Because the in-house dataset combines Fujian field imagery with supplementary non-field images, the overall results in Table 3 do not show whether the observed performance gains are retained across these broad image groups. Therefore, the 184 crack-positive images in the fixed test split were retrospectively divided into two subsets: a dike-field subset comprising images collected during field inspections in Fujian (n = 103) and a pooled non-field subset (n = 81), which included morphology-based concrete-proxy images (n = 55) and publicly sourced images (n = 26). Using the same checkpoints and evaluation protocol as in Table 3, YOLOv8n and YOLO-Defender were evaluated separately on the two subsets. This stratified analysis evaluates whether the performance gains remain consistent between the dike-field and pooled non-field subsets within the present mixed-source training and evaluation setting, rather than assessing generalization to an unseen source domain.
On the dike-field subset, YOLO-Defender improves mAP@0.5 from 87.4% to 91.6% and mAP@0.5:0.95 from 64.3% to 69.5%, corresponding to a 5.2 percentage-point improvement under the stricter metric. On the non-field subset, mAP@0.5 increases from 86.7% to 88.2%, while mAP@0.5:0.95 increases from 65.0% to 70.0% (+5.0 percentage points). For the 184 crack-positive images in the test split, YOLO-Defender achieves 89.7% mAP@0.5 and 69.4% mAP@0.5:0.95. These values differ by only 0.1 and 0.2 percentage points, respectively, from the corresponding results obtained on the complete test split in Table 3. The comparable improvements under the stricter metric (+5.2 and +5.0 percentage points) suggest that the gain is observed in both subsets. Table 4 summarizes the two-subset comparison and the pooled crack-positive results.
Table 4.
Crack detection metrics on the dike-field and pooled non-field test subsets.
On the 60 crack-free background images in the test split, both models produced spurious detections above the visualization confidence threshold on only one image each (1.7%), consistent with the representative false-positive pattern shown in Figure 12c.
These subgroup results should be interpreted in the context of the dataset composition described in Section 2.5. The pooled non-field group combines morphology-based concrete-proxy samples and publicly sourced images with different acquisition characteristics. The concrete-proxy samples were included based on morphological similarity to supplement the limited field imagery, although they may not fully capture the visual variability of authentic dike cracks. Accordingly, the pooled non-field results are interpreted as an aggregate assessment across supplementary image sources. The dike-field subset remains the largest crack-positive test group (n = 103 of 184) and therefore provides the most direct estimate of model performance on Fujian field imagery within the present mixed-source training and evaluation setting. However, both strata still belong to the same curated data domain, so Table 4 does not replace evaluation under distribution shift. Environmental factors such as surface weathering, moisture-induced specularities, and strong shadows can alter local contrast and generate crack-like lineaments (see Figure 12), and may reduce recall for low-contrast fissures. Cross-dataset validation on public dam-crack and DeepCrack-style crack benchmarks, using zero-shot transfer and limited fine-tuning, will be pursued to quantify this gap.
Beyond the source-stratified checks above, a brief complementary stress test was conducted on adverse image appearance. As a preliminary check, the seed-0 checkpoints were re-evaluated on the fixed test set after global low-light scaling and light synthetic fog blending (simulated proxies, not physical rain/fog). YOLO-Defender reached 89.8%/88.8% mAP@0.5 under these two settings (YOLOv8n: 85.4%/85.7%), remaining higher than YOLOv8n; shadow-induced false positives and low-contrast misses are illustrated in Figure 12. Evaluation on real rainy, foggy, and night-time embankment imagery is left for future work.
4. Conclusions
Manual visual inspection of flood-defense and hydraulic structures remains labor-intensive, difficult to standardize, and challenging for large-scale and high-frequency monitoring requirements. This study proposed YOLO-Defender, a lightweight detector for automated dike crack inspection in hydraulic infrastructure monitoring scenarios. The proposed framework integrates a local–global feature block in the backbone (C2F-FTB), selective multi-scale feature fusion (BiFF-PAN), and coordinate attention to improve the detection of elongated and scale-varying cracks, while reducing the parameter count and GFLOPs relative to YOLOv8n. Evaluations on an in-house multi-source crack dataset showed that YOLO-Defender achieved the highest mAP-based detection performance among the compared lightweight YOLO baselines while retaining a compact architecture and high inference speed. Although YOLOv8n-Ghost remained lighter and faster, YOLO-Defender provided higher mAP@0.5 and mAP@0.5:0.95, indicating a more favorable accuracy–complexity trade-off for the present crack detection task. These results suggest potential for batch screening of hydraulic-infrastructure inspection imagery on desktop GPUs under the current experimental setting.
The reported results should be interpreted within the scope of the current dataset and experimental setting. The evaluation was conducted on a multi-source in-house corpus, and the source-stratified analysis assessed performance consistency within the present mixed-source setting. Generalization to unseen acquisition domains and independent external datasets remains to be evaluated. Moreover, the current framework focuses on bounding-box-based crack localization for rapid triage of inspection imagery and does not provide pixel-level geometry quantification, such as crack width and length, or long-term deterioration assessment for structural health monitoring. Future work will explore integrating a lightweight mask or segmentation head, or applying constrained segmentation within detected boxes, to enable crack masks to support morphological measurements and subsequent temporal condition monitoring.
Future research will investigate broader external validation on independent public crack benchmarks, resource-efficient deployment on embedded edge platforms using a fixed protocol of 640 × 640 input, batch size 1, and GPU warmup, and integration of complementary sensing information for three-dimensional assessment and long-term infrastructure monitoring.
Author Contributions
Conceptualization, X.X. (Xiudong Xie) and C.W.; Methodology, C.W. and H.H.; Writing—original draft, C.W.; Resources, X.X. (Xiangdong Xia). and H.H.; Writing—review & editing, X.X. (Xiudong Xie) and H.H.; Funding acquisition, X.X. (Xiudong Xie); Visualization, C.W. and X.X. (Xiangdong Xia); Supervision, X.X. (Xiudong Xie) All authors have read and agreed to the published version of the manuscript.
Funding
This research was funded by the Key Science and Technology Project of China’s Ministry of Water Resources, grant number: SKS-2022151.
Data Availability Statement
The original contributions presented in the study are included in the article, further inquiries can be directed to the corresponding author.
Conflicts of Interest
The authors declare no conflicts of interest.
References
- Wang, S.; Yang, B.; Chen, H.; Fang, W.; Yu, T. LSTM-Based Deformation Prediction Model of the Embankment Dam of the Danjiangkou Hydropower Station. Water 2022, 14, 2464. [Google Scholar] [CrossRef] [Scilit]
- Jiang, H.; Li, R.; Wang, X.; Liang, J.; Jiang, C. Exploration of Dike Piping Hazard Detection and Positioning Technology Based on UAV Inspection. Water Resour. Dev. Res. 2025, 11, 151–156. (In Chinese) [Google Scholar] [CrossRef]
- Zhou, R.; Wang, B.; Han, S.; Wang, D.; Zhang, F. Mechanisms of Crack Development and Strength Deterioration in Compacted Expansive Soils under Controlled Wetting-Drying Conditions. Eng. Fail. Anal. 2024, 159, 108133. [Google Scholar] [CrossRef] [Scilit]
- Tu, J.; Yi, J.; Xiao, L.; Gao, Q.; Zhang, T. A Physics-Informed Deep Learning Approach Using Different Free Surface Approximation Strategies for Steady Seepage in Dams. Water 2026, 18, 1016. [Google Scholar] [CrossRef] [Scilit]
- Xu, L.; Zhang, B.; Yang, H. Research and design of a rapid patrol system for embankment hazards and hidden dangers. Jiangsu Water Resour. 2023, 55–58, 72. [Google Scholar]
- Mohsan, S.A.H.; Othman, N.Q.H.; Li, Y.; Alsharif, M.H.; Khan, M.A. Unmanned Aerial Vehicles (UAVs): Practical Aspects, Applications, Open Challenges, Security Issues, and Future Trends. Intell. Serv. Robot. 2023, 16, 109–137. [Google Scholar] [CrossRef] [Scilit]
- A, K.; Narasimhan, G.; Subburaj, M.; Rajesh Sivaraman, A.; Kumar Sivaraman, A.; Velayutham, K. Automated Dam Crack Detection Using YOLOv10 and UAV Imagery for Structural Health Monitoring. J. Phys. Conf. Ser. 2026, 3191, 012103. [Google Scholar] [CrossRef] [Scilit]
- Nishikawa, T.; Yoshida, J.; Sugiyama, T.; Fujino, Y. Concrete Crack Detection by Multiple Sequential Image Filtering. Comput. Aided Civ. Infrastruct. Eng. 2012, 27, 29–47. [Google Scholar] [CrossRef] [Scilit]
- Rimkus, A.; Gribniak, V.; Gogis, D.; Podviezko, A.; Balevičius, R.; Tamulēnas, V. Processing Digital Images for Crack Localization in Reinforced Concrete Members. Procedia Eng. 2015, 122, 159–166. [Google Scholar] [CrossRef] [Scilit]
- Cha, Y.-J.; Choi, W.; Büyüköztürk, O. Deep Learning-Based Crack Damage Detection Using Convolutional Neural Networks. Comput. Aided Civ. Infrastruct. Eng. 2017, 32, 361–378. [Google Scholar] [CrossRef] [Scilit]
- Zhang, L.; Yang, F.; Zhang, Y.; Zhu, Y. Road Crack Detection Using Deep Convolutional Neural Network. In Proceedings of the 2016 IEEE International Conference on Image Processing (ICIP), Phoenix, AZ, USA, 25–28 September 2016; pp. 3708–3712. [Google Scholar]
- Redmon, J.; Divvala, S.; Girshick, R.; Farhadi, A. You Only Look Once: Unified, Real-Time Object Detection. In Proceedings of the 2016 IEEE Conference on Computer Vision and Pattern Recognition (CVPR), Las Vegas, NV, USA, 27–30 June 2016; pp. 779–788. [Google Scholar]
- Ren, S.; He, K.; Girshick, R.; Sun, J. Faster R-CNN: Towards Real-Time Object Detection with Region Proposal Networks. IEEE Trans. Pattern Anal. Mach. Intell. 2017, 39, 1137–1149. [Google Scholar] [CrossRef] [Scilit] [PubMed]
- Varghese, R.; M., S. YOLOv8: A Novel Object Detection Algorithm with Enhanced Performance and Robustness. In Proceedings of the 2024 International Conference on Advances in Data Engineering and Intelligent Computing Systems (ADICS), Chennai, India, 18–19 April 2024; pp. 1–6. [Google Scholar]
- Wang, Z.; Chen, Y.; Gu, Y.; Liu, J.; Zhu, X.; He, M. The Evolution of Object Detection from CNNs to Transformers and Multi-Modal Fusion. Sci. Rep. 2026, 16, 7517. [Google Scholar] [CrossRef] [Scilit]
- Zhou, J.; Zhao, G.; Li, Y. Vison Transformer-Based Automatic Crack Detection on Dam Surface. Water 2024, 16, 1348. [Google Scholar] [CrossRef] [Scilit]
- Nogara, C.; Bolzon, G. AI Contribution to the Monitoring and Safety Assessment of Dams: Review and Perspectives. Prog. Eng. Sci. 2026, 3, 100308. [Google Scholar] [CrossRef] [Scilit]
- Ma, C.; Yang, J.; Cheng, L. New Methods and Technologies of Hydraulic Engineering Safety Assessment. Water 2025, 17, 1773. [Google Scholar] [CrossRef] [Scilit]
- Xu, G.; Han, X.; Zhang, Y.; Wu, C. Dam Crack Image Detection Model on Feature Enhancement and Attention Mechanism. Water 2023, 15, 64. [Google Scholar] [CrossRef] [Scilit]
- Cai, M.; Wang, H.; Lv, X.; Liu, Z.; Chen, Y. Deep Learning-Based Defect Identification in Hydraulic Structures: A Comprehensive Review. KSCE J. Civ. Eng. 2026, 30, 100410. [Google Scholar] [CrossRef] [Scilit]
- Onteddu, A.R.; Reddy Bandhela, R.; Reddy Kundavaram, R.; Jagannaveen, V. A CNN-Transformer Hybrid for Precise Object Detection in UAV Aerial Imagery. In Proceedings of the 2025 IEEE 3rd Global Conference on Wireless Computing and Networking (GCWCN), Lonavala, India, 22–23 November 2025; pp. 1–7. [Google Scholar]
- Mehta, S.; Rastegari, M. MobileViT: Light-Weight, General-Purpose, and Mobile-Friendly Vision Transformer. In Proceedings of the International Conference on Learning Representations (ICLR); OpenReview: Virtual Event, 2022. [Google Scholar]
- Hou, Q.; Zhou, D.; Feng, J. Coordinate Attention for Efficient Mobile Network Design. In Proceedings of the 2021 IEEE/CVF Conference on Computer Vision and Pattern Recognition (CVPR); IEEE: New York, NY, USA, 2021; pp. 13708–13717. [Google Scholar]
- Zhang, J.; Beliaeva, Z.V.; Huang, Y. Accuracy–Efficiency Trade-Off: Optimizing YOLOv8 for Structural Crack Detection. Sensors 2025, 25, 3873. [Google Scholar] [CrossRef] [Scilit]
- Chen, Z.; Zhou, C.; Guo, J.; Yin, G. Morphology-Adaptive YOLO for Underwater Crack Detection in Hydraulic Structures. Water 2026, 18, 1241. [Google Scholar] [CrossRef] [Scilit]
- Liu, S.; Qi, L.; Qin, H.; Shi, J.; Jia, J. Path Aggregation Network for Instance Segmentation. In Proceedings of the 2018 IEEE/CVF Conference on Computer Vision and Pattern Recognition, Salt Lake City, UT, USA, 18–22 June 2018; pp. 8759–8768. [Google Scholar]
- Lin, T.-Y.; Dollár, P.; Girshick, R.; He, K.; Hariharan, B.; Belongie, S. Feature Pyramid Networks for Object Detection. In the Proceedings of the IEEE Conference on Computer Vision and Pattern Recognition (CVPR), Honolulu, HI, USA, 21–26 July 2017; pp. 2117–2125. [Google Scholar]
- Yin, X.; Wang, C.; Chen, W.; Zeng, Z.; Quan, Y.; Huang, Z. A UAV-Deployable Lightweight Framework for Real-Time Bridge Crack Detection via YOLO-LY Algorithm. Eng. Struct. 2026, 358, 122629. [Google Scholar] [CrossRef] [Scilit]
- Jocher, G.; Chaurasia, A.; Qiu, J. Ultralytics YOLOv8, Version 8.2.50. 2023. Available online: https://github.com/ultralytics/ultralytics (accessed on 25 May 2026).
- Vaswani, A.; Shazeer, N.; Parmar, N.; Uszkoreit, J.; Jones, L.; Gomez, A.N.; Kaiser, L.; Polosukhin, I. Attention Is All You Need. Available online: http://arxiv.org/abs/1706.03762 (accessed on 16 July 2026).
- Hu, J.; Shen, L.; Sun, G. Squeeze-and-Excitation Networks. IEEE Trans. Pattern Anal. Mach. Intell. 2020, 48, 2011–2023. [Google Scholar] [CrossRef] [Scilit]
- Gharehbaghi, V.; Bennett, C.; Lequesne, R.D.; Li, J. DamCrack: A Drone and Smartphone Image Dataset for 2D and 3D Damage Assessment in Concrete Dams. Data Brief 2026, 66, 112737. [Google Scholar] [CrossRef] [Scilit]
- Huang, W.; Pang, R.; Zhou, Y.; Zhong, F.; Chen, J.; Kang, F. Multi-Condition Dam Crack Segmentation Based on a Novel Lightweight CEE-YOLO Model. Adv. Eng. Inform. 2025, 68, 103697. [Google Scholar] [CrossRef] [Scilit]
- Shorten, C.; Khoshgoftaar, T.M. A Survey on Image Data Augmentation for Deep Learning. J. Big Data 2019, 6, 60. [Google Scholar] [CrossRef] [Scilit]
- Lin, T.-Y.; Maire, M.; Belongie, S.; Hays, J.; Perona, P.; Ramanan, D.; Dollár, P.; Zitnick, C.L. Microsoft COCO: Common Objects in Context. In Proceedings of the Computer Vision—ECCV 2014; Springer: Zurich, Switzerland, 2014; pp. 740–755. [Google Scholar]
- Wang, A.; Chen, H.; Liu, L.; Chen, K.; Lin, Z.; Han, J.; Ding, G. YOLOv10: Real-Time End-to-End Object Detection. In Proceedings of the Advances in Neural Information Processing Systems 37 (NeurIPS 2024); Neural Information Processing Systems Foundation: Vancouver, BC, Canada, 2024; pp. 107984–108011. [Google Scholar]
- Jocher, G.; Qiu, J. Ultralytics YOLO11, Version 11.0.0. 2024. Available online: https://github.com/ultralytics/ultralytics (accessed on 25 May 2026).
- Han, K.; Wang, Y.; Tian, Q.; Guo, J.; Xu, C.; Xu, C. GhostNet: More Features from Cheap Operations. In Proceedings of the 2020 IEEE/CVF Conference on Computer Vision and Pattern Recognition (CVPR), Seattle, WA, USA, 13–19 June 2020; pp. 1580–1589. [Google Scholar]
- Selvaraju, R.R.; Cogswell, M.; Das, A.; Vedantam, R.; Parikh, D.; Batra, D. Grad-CAM: Visual Explanations from Deep Networks via Gradient-Based Localization. Int. J. Comput. Vis. 2020, 128, 336–359. [Google Scholar] [CrossRef] [Scilit]
- Yang, L.; Zhang, R.-Y.; Li, L.; Xie, X. SimAM: A Simple, Parameter-Free Attention Module for Convolutional Neural Networks. In Proceedings of the 38th International Conference on Machine Learning (ICML); PMLR: Virtual Event, 2021; pp. 11863–11874. [Google Scholar]
- Woo, S.; Park, J.; Lee, J.-Y.; Kweon, I.S. CBAM: Convolutional Block Attention Module. Available online: http://arxiv.org/abs/1807.06521 (accessed on 16 July 2026).
- Munawar, H.S.; Hammad, A.W.A.; Waller, S.T.; Islam, M.R. Modern Crack Detection for Bridge Infrastructure Maintenance Using Machine Learning. Hum. Centric Intell. Syst. 2022, 2, 95–112. [Google Scholar] [CrossRef] [Scilit]

Disclaimer/Publisher’s Note: The statements, opinions and data contained in all publications are solely those of the individual author(s) and contributor(s) and not of MDPI and/or the editor(s). MDPI and/or the editor(s) disclaim responsibility for any injury to people or property resulting from any ideas, methods, instructions or products referred to in the content. |
© 2026 by the authors. Licensee MDPI, Basel, Switzerland. This article is an open access article distributed under the terms and conditions of the Creative Commons Attribution (CC BY) license.