


Abstract
Reverse osmosis (RO) desalination is an energy-intensive process, with centrifugal pumps and their electric drives constituting a significant portion of total system power consumption. Accurate estimation of this energy demand during the design phase is critical for optimizing plant efficiency and operational costs. Existing models often overlook or simplify the contribution of electric drive losses, leading to less precise power consumption projections. This study presents a comprehensive Simulink-based model designed to estimate the total power consumption and efficiency of a centrifugal pump system within an RO desalination plant. The model integrates several key components, including an electric drive loss estimation module, a centrifugal pump, a pipeline network, a pressure regulation valve, a fluid reservoir, and the RO system, within a unified simulation environment. A defining feature of this work is the explicit inclusion of electric drive losses, which enables a more holistic and accurate calculation of overall system efficiency and power demand compared to models focused solely on hydraulic power. Simulation results show agreement with manufacturer data, with deviations of less than 5% for pump performance and brake power at nominal speed. Drive losses were found to represent approximately 18–20% of brake power at nominal speed near the best efficiency point, underscoring their non-negligible contribution to overall energy consumption. Total efficiency of the centrifugal pumping system ranges from 36.5% at 2.5 m3/h to 33% at 4.5 m3/h with a maximum of 39.5% at 3.6 m3/h. By simulating system performance, the model demonstrates its utility as a predictive tool. This allows us to optimize pump selection and control strategies at the early design stage, potentially leading to more energy-efficient and cost-effective RO desalination systems.
1. Introduction
Global freshwater availability has experienced a marked decline in recent decades, driven primarily by rapid population growth, accelerating industrialization, and the increasing frequency and intensity of prolonged drought events [1]. Although water covers approximately 71% of the Earth’s surface, only a mere 3% constitutes freshwater, with the vast majority (over 97%) existing as saline water in oceans and seas [2]. This scarcity is not merely a statistical abstraction; according to the World Health Organization (WHO), nearly one-fifth of the global population currently resides in regions characterized by physical water scarcity, a figure projected to rise under climate change scenarios [3]. Consequently, the exploration and deployment of alternative, non-conventional water sources have become imperative for ensuring long-term water security [4].
Among the available alternatives, desalination stands out as the most technologically mature and scalable solution for augmenting freshwater supplies. Desalination encompasses a range of processes designed to remove dissolved salts and minerals from brackish groundwater or seawater, rendering it suitable for human consumption, agricultural irrigation, and industrial applications [5,6]. Seawater and brackish water desalination have thus emerged as indispensable strategies for mitigating water stress, particularly in arid and semi-arid regions. The Mediterranean basin, for instance, ranks among the most water-scarce areas globally and has increasingly relied on desalination to meet municipal and agricultural demands.
Within the desalination landscape, reverse osmosis (RO) has established itself as the dominant and most energy-efficient membrane-based technology for both seawater and brackish water treatment [7,8,9]. The widespread adoption of RO over thermal processes such as multi-stage flash (MSF) or multi-effect distillation (MED) is attributable to its lower specific energy consumption, modular design, and continuous improvements in membrane permeability and fouling resistance [10]. Nevertheless, RO remains an inherently energy-intensive process. The high-pressure feed pumps that drive the feed water through the membrane arrays constitute the single largest energy-consuming components in any RO facility, accounting for up to 70–80% of the total plant electricity demand [11]. These pumping systems therefore exert a direct and substantial influence on the levelized cost of water (LCOW) and the overall carbon footprint of desalination operations.
Recognizing this criticality, a substantial body of research has been devoted to optimizing the energy performance of RO systems. Prior investigations have explored a wide spectrum of optimization strategies, ranging from membrane module configuration and staging arrangements [12] to the integration of energy recovery devices (ERDs) such as pressure exchangers and Pelton turbines, which can significantly reduce net specific energy consumption [13]. Concurrently, advanced control methodologies, including model predictive control (MPC) and adaptive feedback control, have been proposed to maintain optimal operating conditions in the face of fluctuating feedwater temperature, salinity, and membrane fouling [14,15,16]. Furthermore, mathematical models have been developed to characterize the complex physico-chemical phenomena within RO processes, incorporating parameters such as membrane permeability, concentration polarization, and osmotic pressure gradients [17]. More recent contributions have investigated innovative hydraulic configurations, including semi-batch and full-batch RO systems, which promise further reductions in energy consumption by avoiding the need for high-pressure recirculation [18].
Despite the significance and depth of these contributions, a notable and persistent gap remains in the literature. The majority of existing modeling efforts have concentrated on isolated subsystems, the membrane unit, the hydraulic network, or the control algorithm, without providing an integrated framework that captures the complete electromechanical power train. Specifically, few studies have systematically addressed the impact of variable frequency drives (VFDs) on the total power consumption of RO feed pumping systems. VFDs are a specific type of variable speed drive (VSD) that achieves speed regulation by varying the frequency of the electrical supply to the motor, have become the industry standard for regulating pump speed in response to changing operational demands, offering significant energy savings compared to conventional throttling control, which dissipates excess hydraulic energy across control valves. By enabling pump operation across a range of performance curves, VFDs eliminate throttling losses, provide soft-start capabilities, and reduce mechanical stress on rotating equipment [19,20,21]. However, the adoption of VFDs introduces a new layer of complexity in power estimation, as the drive itself incurs non-negligible losses, such as switching losses, conduction losses, and harmonic losses, that are highly dependent on operating speed and load torque [22]. These drive losses, when aggregated over the lifespan of a plant, can represent a non-trivial fraction of the total energy bill, yet they are routinely neglected or oversimplified in conventional RO system models.
Recent case studies in water purification plants have empirically demonstrated the energy-saving potential of VFD-controlled induction motors under variable-speed operation [23]. However, the integration of detailed drive loss models with comprehensive pump hydraulic models and pipeline network simulations remains conspicuously absent in the RO literature. This deficiency limits the ability of plant designers, operators, and researchers to accurately predict total energy consumption during the early design phase, potentially leading to suboptimal pump selection, oversizing of electrical infrastructure, and overestimation of energy savings. Moreover, the absence of such models precludes a nuanced comparison between throttling-based and speed-based control strategies in terms of overall system efficiency.
This paper directly addresses the aforementioned gap by presenting a comprehensive Simulink-based modeling framework for estimating the total efficiency of centrifugal pump systems in RO desalination applications, with an explicit and detailed representation of VFD losses. Building upon foundational work in RO process modeling and control, the proposed model holistically integrates multiple subsystems: a variable-speed electric drive with an associated loss estimation module, a centrifugal pump with manufacturer-defined characteristic curves, a pipeline network with pressure drop calculations, a pressure regulation valve, a feed fluid reservoir, and the RO membrane system itself, complete with pressure and flow metering equipment. Unlike previous models that focus exclusively on hydraulic power, the distinctive contribution of this work lies in its ability to simulate drive losses, thereby offering a more accurate and complete accounting of total system power demand. The model also provides the necessary framework for comparative evaluations between throttling and variable-speed control strategies, which can be explored in future studies. The present study advances the state of the art by incorporating detailed VFD loss characterization using lookup tables derived from ABB Drive Size, integrating comprehensive pipeline network and valve characteristics, coupling the pump model with an RO membrane unit, and providing quantitative efficiency analysis across the complete electromechanical power train. The model is validated against representative operational scenarios and is intended to serve as a practical, user-friendly tool for engineers and researchers to optimize pump selection, control strategies, and system sizing at the design stage.
The remainder of this paper is organized as follows: Section 2 provides a detailed description of the fundamental structure and operational characteristics of centrifugal pumps as applied to RO feed systems. Section 3 presents the overall model topology of each subsystem, including the drive loss module, the hydraulic network, and the RO unit. Section 4 reports the simulation results. Finally, Section 5 offers concluding remarks and outlines directions for future research.
2. Mathematical Models
Reverse osmosis operates on the principle of applying hydraulic pressure to a saline feed stream, forcing water molecules to traverse a semi-permeable membrane while dissolved salts and contaminants are retained on the pressurized side. This pressure-driven separation mechanism requires that the applied feed pressure surpasses the osmotic pressure of the solution, thereby inducing solvent flow in the reverse direction relative to natural diffusion tendencies. The effectiveness of contaminant removal is governed by multiple interrelated factors, including membrane selectivity characteristics, feed solution composition, operating pressure magnitude, and thermal conditions.
A standard RO desalination facility is organized around three sequential processing phases: feed water conditioning, membrane-based separation, and product water finishing. The conditioning phase involves the removal of suspended particulates, colloidal matter, and scale-forming compounds that could otherwise compromise membrane integrity and reduce operational longevity. Following pre-treatment, the clarified feed water is pressurized by a high-capacity pumping system and directed into membrane pressure vessels containing spiral-wound or hollow-fiber elements. Within these membrane modules, the incoming feed stream undergoes separation into two distinct fractions: a purified permeate stream that has traversed the membrane barrier and a concentrated brine stream that carries the rejected solutes. The proportion of feed water recovered as permeate, termed the recovery ratio, constitutes a pivotal design variable that must be optimized against competing considerations of energy expenditure, membrane fouling propensity, and concentrate management requirements.
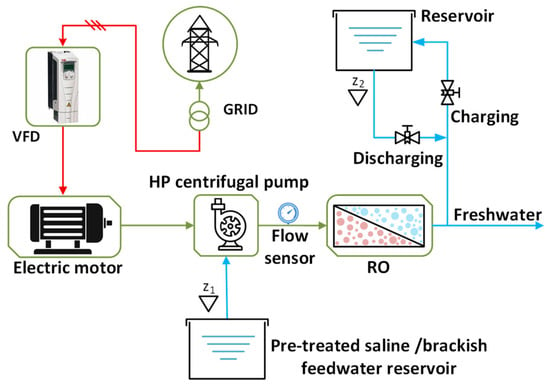
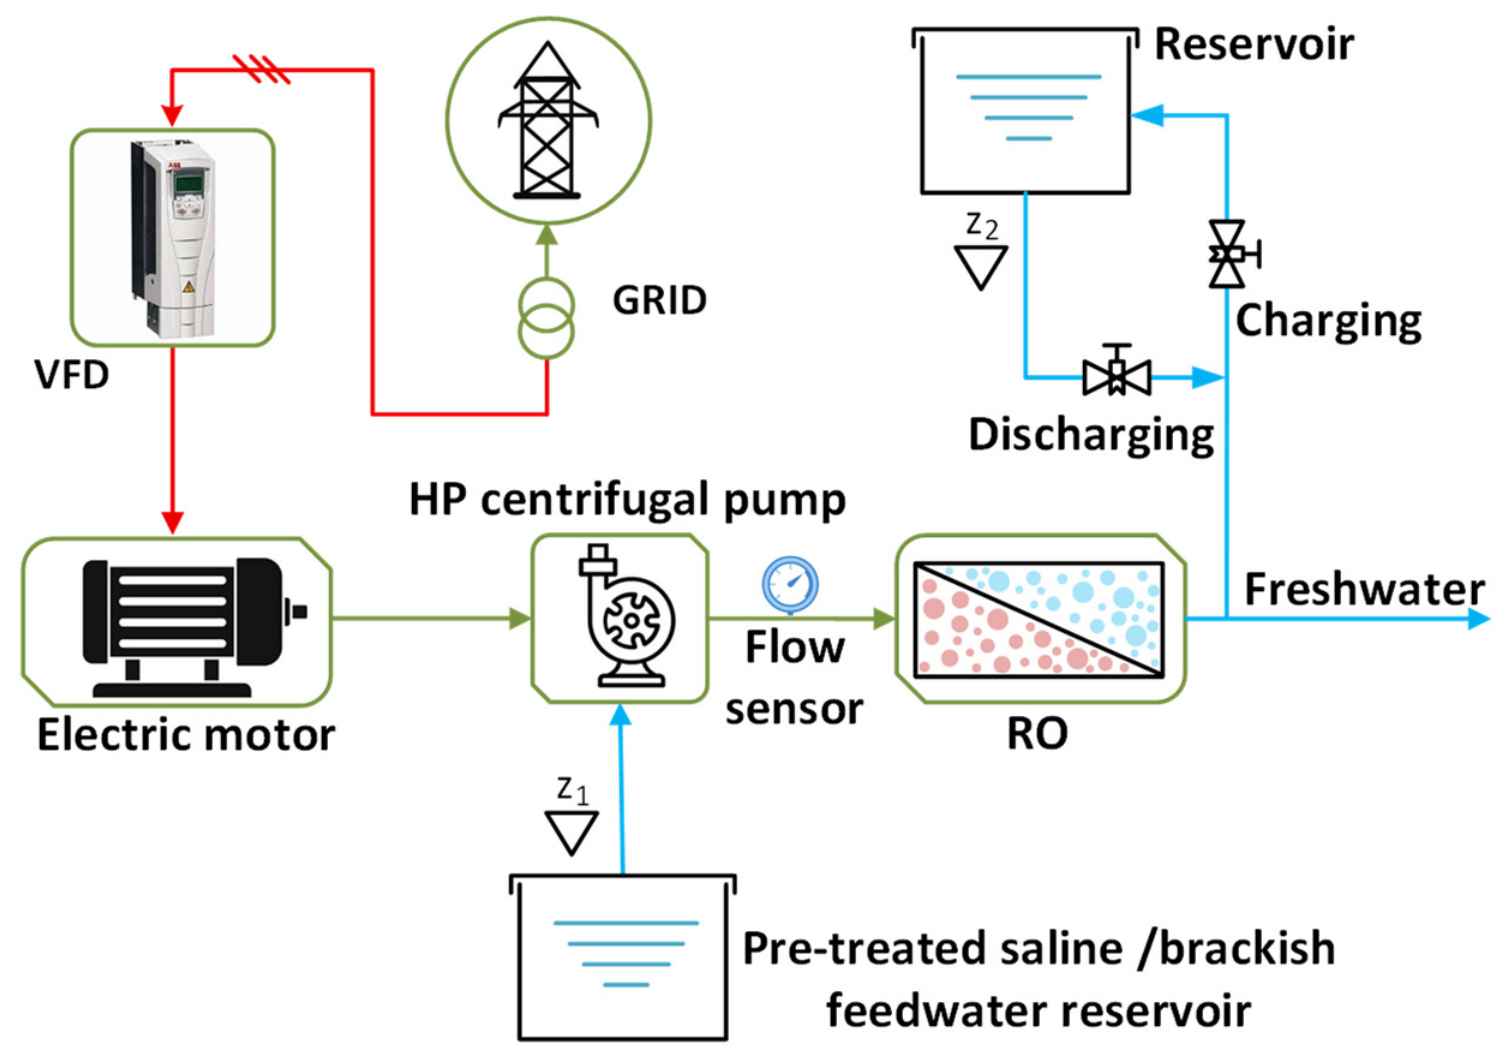
Achieving sustained membrane performance demands careful regulation of several critical operating parameters. The applied feed pressure exerts a primary influence on permeate production rate and salt passage, with elevated pressures generally enhancing water throughput while incurring proportional energy penalties. Thermal conditions similarly affect system behavior, as elevated temperatures reduce feed water viscosity and enhance membrane permeability, thereby lowering pumping energy requirements, though excessive temperatures may accelerate membrane degradation. Feed water salinity directly determines the osmotic back-pressure that must be overcome, and temporal variations in feed chemistry necessitate responsive control actions to sustain stable operation. Modern RO facilities increasingly incorporate variable frequency drives as an enabling technology for adaptive pressure and flow management, allowing the pumping infrastructure to accommodate fluctuations in feed conditions, membrane aging, and production targets while minimizing wasteful energy dissipation. The functional architecture of a representative RO desalination plant with its associated pumping configuration is shown in Figure 1.
Figure 1.
Reverse osmosis-based desalination system with high-pressure centrifugal pump.
2.1. Centrifugal Pump System Modeling
Variable-speed centrifugal pumping systems offer superior energy performance for flow and pressure regulation in desalination applications relative to conventional control alternatives such as throttling valves, recirculation loops, or discrete on-off operation [24]. Throttling-based control achieves flow reduction by introducing localized flow resistance, effectively dissipating surplus hydraulic energy as thermal losses across the valve, a strategy that becomes increasingly inefficient as the required pressure reduction grows [25]. Speed-based control, in contrast, adjusts the pump’s rotational velocity to precisely match the instantaneous system demand, thereby eliminating the dissipative losses inherent in throttling and achieving marked energy reductions, particularly during partial-load operation [26]. A complete RO feed pumping installation encompasses multiple interacting elements: the centrifugal pump itself, a VFD-equipped electric drive train, instrumentation comprising flow and pressure sensors, the interconnecting piping network with associated fittings and valves, the RO membrane assembly, and a feed supply reservoir. The operational sequence involves fluid extraction from the feed reservoir, passage through the suction piping, pressurization by the pump, and delivery to the membrane system. The supervisory control system continuously evaluates the discrepancy between the desired setpoint and the measured process variables, issuing appropriate speed references to the VFD to maintain the target conditions.
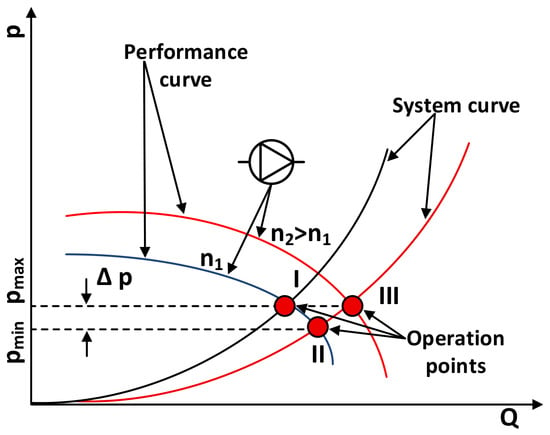
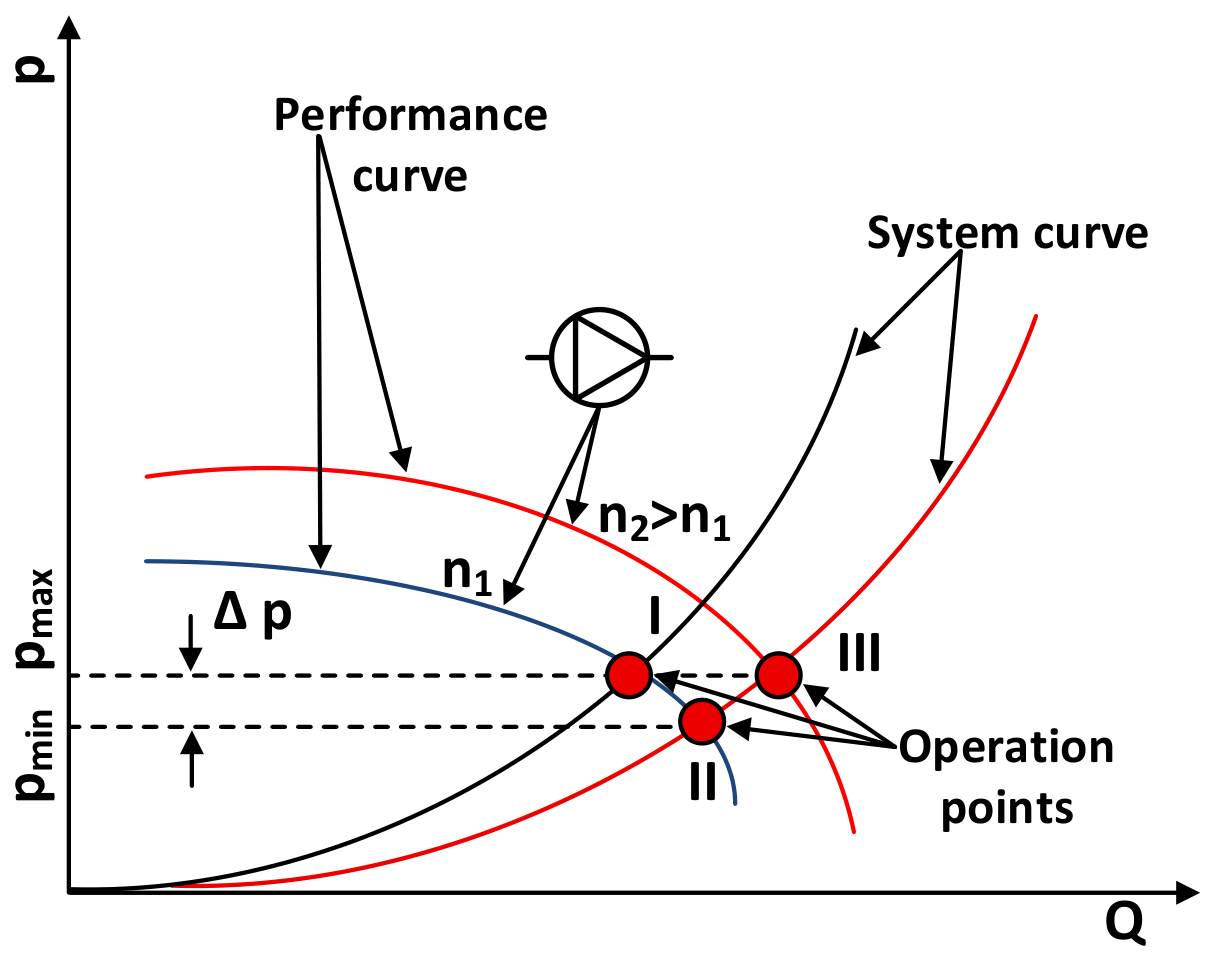
The principal hydraulic characteristics of the centrifugal pumping system are commonly represented by two fundamental curves: the pump performance curve and the system resistance curve. These curves collectively define the operating behavior of the pumping system across a range of flow conditions. The pump performance curve describes the relationship between the hydraulic head generated by the pump and the flow rate at a given rotational speed, typically exhibiting a descending characteristic where head decreases as flow increases. Conversely, the system resistance curve describes the relationship between the required system head and the flow rate, accounting for both static head components and dynamic friction losses within the pipeline network. The intersection of these two curves determines the steady-state operating point of the system, as shown in Figure 2.
Figure 2.
Performance and system resistance characteristics of a variable-speed centrifugal pump.
Figure 2 presents the pump performance curves for two distinct rotational speeds (n1 and n2), overlaid with system resistance curves corresponding to different flow conditions. The intersection points, denoted by red circles, represent the current operating points of the pumping system. These operating points determine the complete set of system parameters, including volumetric flow rate Q, pressure p, shaft power P, pump efficiency η, and associated performance metrics.
When the system operating point migrates from point I to point II along a pump performance curve, a shift that may result from increased hydraulic resistance due to membrane fouling or valve adjustment, the corresponding system pressure changes by Δp. To restore the original pressure condition while accommodating the altered system resistance, the pump rotational speed must be adjusted to generate a new performance curve that enables the operating point to traverse the system curve from point II to point III. This operational adjustment exemplifies the principal advantage of variable-speed control: the pump can dynamically respond to evolving system conditions while preserving the required delivery pressure [27]. Consequently, speed regulation constitutes an efficient and responsive methodology for controlling RO system feed pressure, particularly valuable under conditions of fluctuating feed water characteristics, temperature variations, and progressive membrane fouling [28].
Manufacturers typically supply pump performance data in graphical form, representing behavior at the nominal rated speed. For variable-speed applications, however, comprehensive characterization requires determination of pump performance across the entire operational speed envelope. Because manufacturer-supplied data represents generalized characteristics, site-specific calibration is generally necessary to adapt the pump curve to actual installation conditions. The pump hydraulic characteristics can be approximated through a second-order polynomial expression [29]:
where Hstat denotes the static head component, the pressure necessary to overcome elevation differences and maintain minimum system pressure independent of flow, Q represents the volumetric flow rate at rated speed, and kfr is the friction coefficient derived from second-order polynomial regression of the pump curve. This coefficient encapsulates the dynamic head losses attributable to pipe friction and must be established through in-situ measurement and calibration, as it depends strongly on the specific piping layout, diameter, surface roughness, and the presence of fittings and valves.
The affinity laws provide a set of proportional relationships that enable calculation of pump hydraulic and power characteristics at varying speeds [30]:
where P denotes the shaft brake power, the mechanical power transmitted from the motor to the pump impeller. Quantities with subscript ‘nom’ correspond to nominal speed values, while those with subscript ‘act’ represent actual values at the operating speed. These relationships, derived from dimensional analysis principles, assume approximately constant pump efficiency across the speed range, an assumption that remains valid for moderate speed variations but may introduce inaccuracies at very low speeds where internal leakage and recirculation effects become more pronounced. Application of these equations permits construction of a comprehensive family of performance curves spanning the entire speed range of interest.
2.2. Pipeline Network Modeling
Accurate representation of the piping network is essential for determining flow distributions and associated head losses. Under turbulent flow conditions, which prevail in typical RO feed systems, head losses are calculated using the Darcy–Weisbach formulation [31]:
where λ represents the Darcy friction factor, a dimensionless coefficient dependent on Reynolds number and pipe wall roughness, d is the internal pipe diameter, g is gravitational acceleration, and L is the pipe segment length. This expression accounts for distributed friction losses along straight pipe runs; additional minor losses attributable to fittings, bends, valves, and other components must be separately evaluated and incorporated into the total system head. Accurate determination of Hloss is fundamental to constructing the system resistance curve and identifying the correct operating point for any pump speed.
The hydraulic behavior of a ball valve utilized in the model’s pipeline system is characterized by its flow coefficient, which relates the volumetric flow rate to the pressure drop across the valve. The most common parameterization employs the flow coefficient Cv. The relation between flow coefficient and water flow is following [32]:
where ΔP is the pressure differential, and SG is the fluid specific gravity. This formulation enables accurate prediction of valve behavior across the entire operating range for integration into a comprehensive RO system model.
2.3. Reverse Osmosis Membrane Unit Modeling
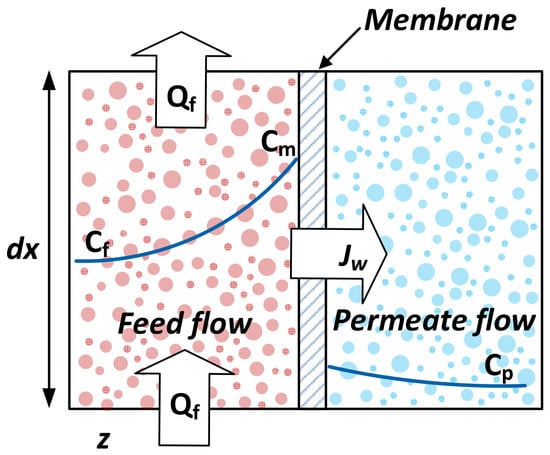
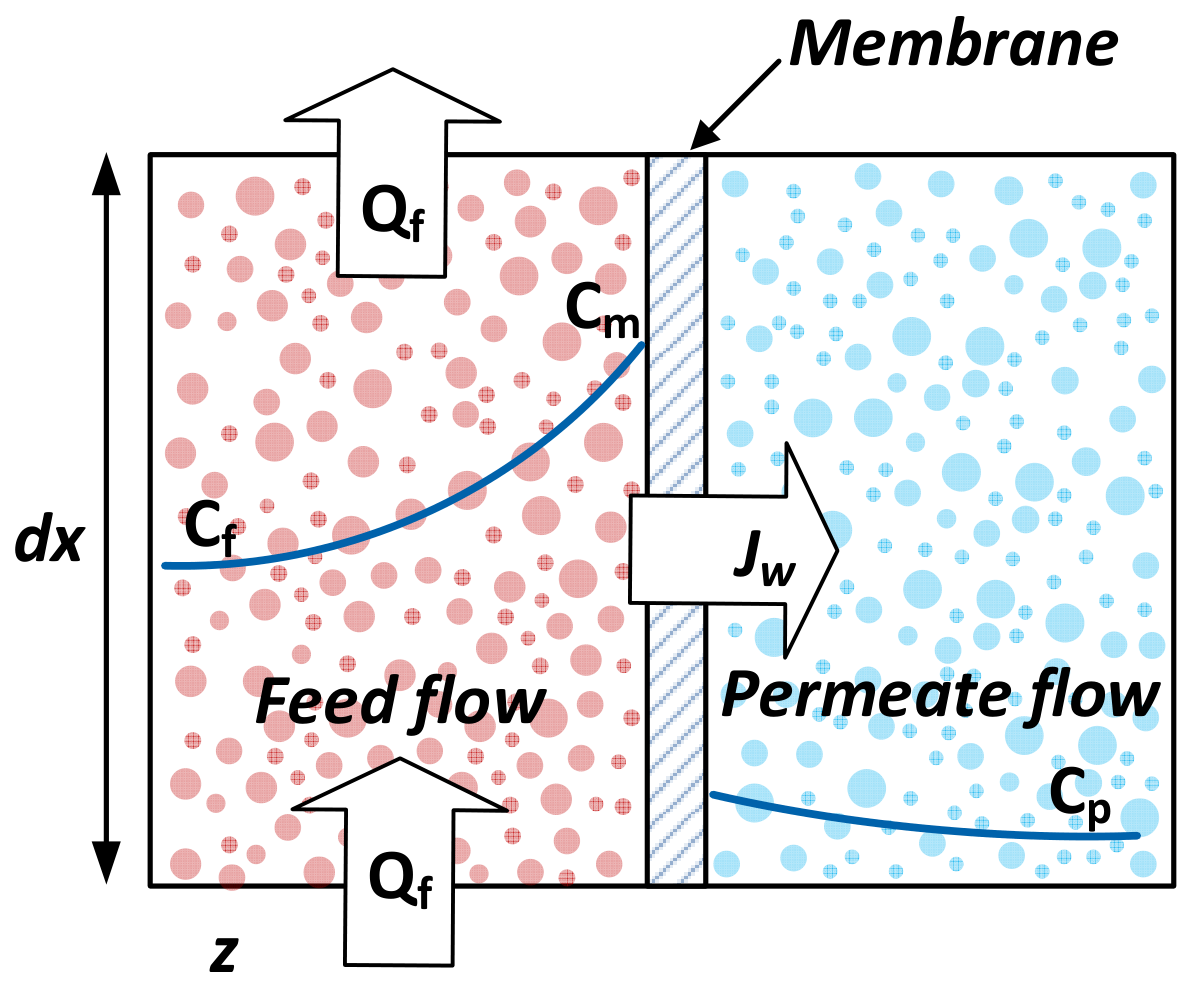
The RO membrane unit is simulated through a set of equations founded on solution-diffusion theory and membrane transport phenomena shown, Figure 3. In the shown configuration, the feed stream flows vertically from the bottom to the top of the diagram, while the permeate stream traverses the membrane horizontally from the left to the right boundary.
Figure 3.
Two-dimensional representation of a discrete RO membrane unit element. The blue line shows the distribution of salt concentration.
The key transport phenomena occurring within this elemental volume are indicated by several parameters. The permeate flux, denoted as Jw represents the volumetric flow rate of water passing through the membrane per unit area. The feed flow rate entering the element is designated as Qf. The spatial distribution of dissolved salts is depicted by the blue profile, which traces the concentration gradient developing across the boundary layer adjacent to the membrane surface. Three distinct concentration values are identified: Cf corresponds to the salt concentration in the bulk feed stream, Cm denotes the concentration at the membrane surface, and Cp represents the salt concentration in the bulk permeate stream.
The transport of salt species occurs via convective flow with the permeate stream toward the membrane interface. However, the majority of dissolved ions are rejected by the selective membrane barrier, resulting in their accumulation in the vicinity of the membrane surface. This localized buildup gives rise to a concentration boundary layer in which the salt concentration at the membrane surface Cm exceeds that of the bulk feed Cf. This phenomenon, commonly referred to as “concentration polarization,” constitutes a critical factor in RO system performance, as it elevates the osmotic pressure at the membrane surface and thereby reduces the net driving force for permeation. The severity of concentration polarization is quantified by the polarization modulus Φ, which is defined as the ratio of the membrane surface concentration to the bulk concentration [33]:
This dimensionless parameter provides a measure of the extent of concentration buildup and serves as an important indicator of membrane fouling propensity and the effectiveness of hydrodynamic conditions in the feed channel. Higher polarization modulus values indicate more severe concentration polarization, which can lead to increased osmotic pressure, reduced permeate flux, and accelerated scaling or fouling. Effective mitigation strategies typically involve enhancing cross-flow velocity, incorporating feed spacers to promote mixing, or employing pulsed or oscillatory flow regimes to disrupt the boundary layer.
The permeate flux and osmotic pressure are calculated as follows [34]:
where the parameter Aw denotes the membrane water permeability, while σ represents the reflection coefficient, a measure of salt rejection efficiency, typically approaching the value of 1 for high-performance membranes. The terms ΔP and Δπ correspond to the hydraulic pressure difference and the osmotic pressure difference across the membrane, respectively. A pre-exponential factor A0 represents the theoretical value of water permeability Aw at an infinitely high temperature; C, R, and T are salt concentration, the ideal gas constant, and absolute temperature, respectively.
The membrane parameters employed in this study are representative of typical brackish water RO membrane elements found in commercial applications. While a comprehensive sensitivity analysis is beyond the scope of this study, the values employed are consistent with literature-reported data and provide a reasonable basis for the design-stage comparative analysis presented herein.
2.4. Variable Frequency Drive Power Modeling
The variable speed drive coupled to the centrifugal pump warrants careful consideration, as the drive system contributes measurably to total energy consumption. Because the VFD is directly connected to the pump shaft, determination of total input power Ptotal requires accounting for both the mechanical power delivered to the pump and the losses ΔPloss incurred within the drive system. Losses originate from multiple mechanisms within the power electronics: switching losses in semiconductor devices, conduction losses in diodes and IGBTs, and harmonic losses resulting from the non-sinusoidal output waveform. The electric motor contributes additional losses, including stator and rotor copper losses, core losses, and mechanical friction and windage losses. The total system input power is accordingly expressed as:
where Pshaft represents the mechanical shaft power delivered to the pump impeller, obtained from the affinity laws, and ΔPloss represents the aggregate electrical and mechanical losses. A detailed characterization of these loss components is essential for accurate power consumption prediction, particularly at reduced speeds where losses may constitute a larger fraction of total input power. Incorporation of these losses into the model enables the possibility of calculating the efficiency of a high-pressure centrifugal pump more accurately.
3. Simulation Model
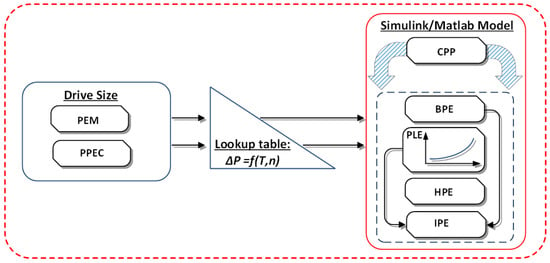
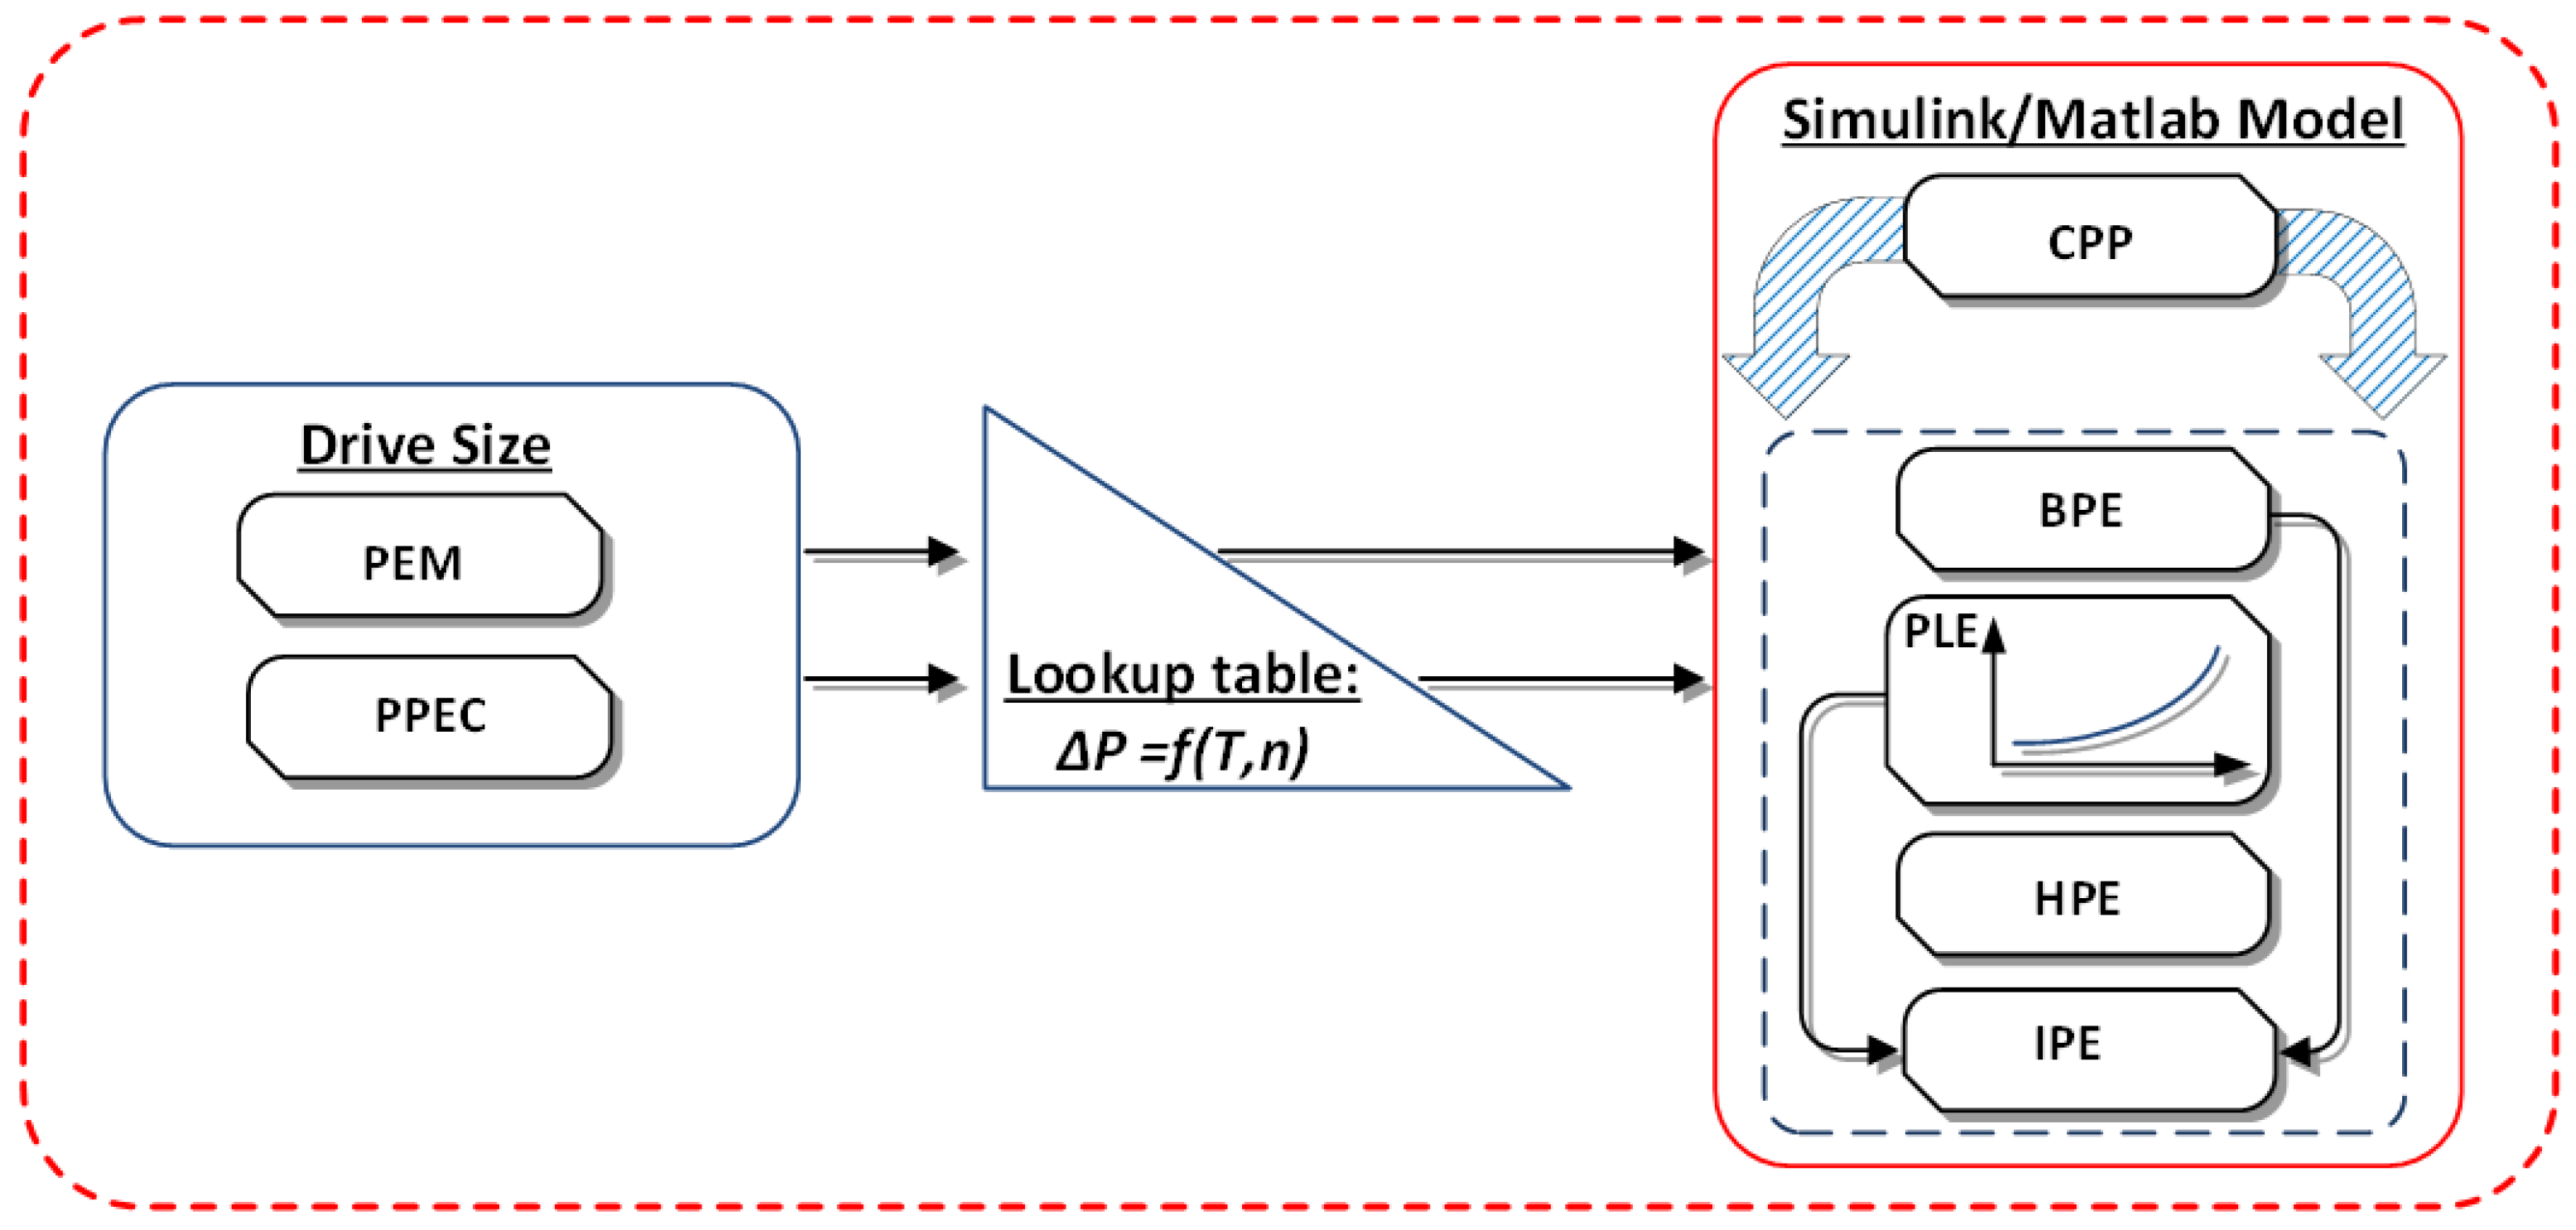
The simulation framework developed in this study combines two distinct modeling environments to achieve comprehensive system representation. The centrifugal pumping plant (CPP) subsystem, comprising the centrifugal pump, hydraulic sensors, pipeline network, control valve, and water reservoir, was implemented within the MATLAB/Simulink (version 2025a) environment. Concurrently, the variable frequency drive model, which encapsulates motor characteristics and power electronic converter parameters, was developed using the ABB Drive Size simulation tool [35]. The integration of these complementary models was accomplished within the Simulink environment, enabling seamless data exchange between the hydraulic and electrical domains. Figure 4 presents the block diagram of the overall simulation architecture, illustrating the principal subsystems and their interconnections.
Figure 4.
Layout of the integration of simulation environments.
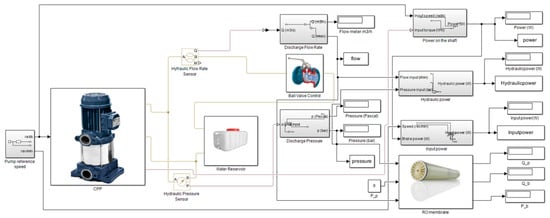
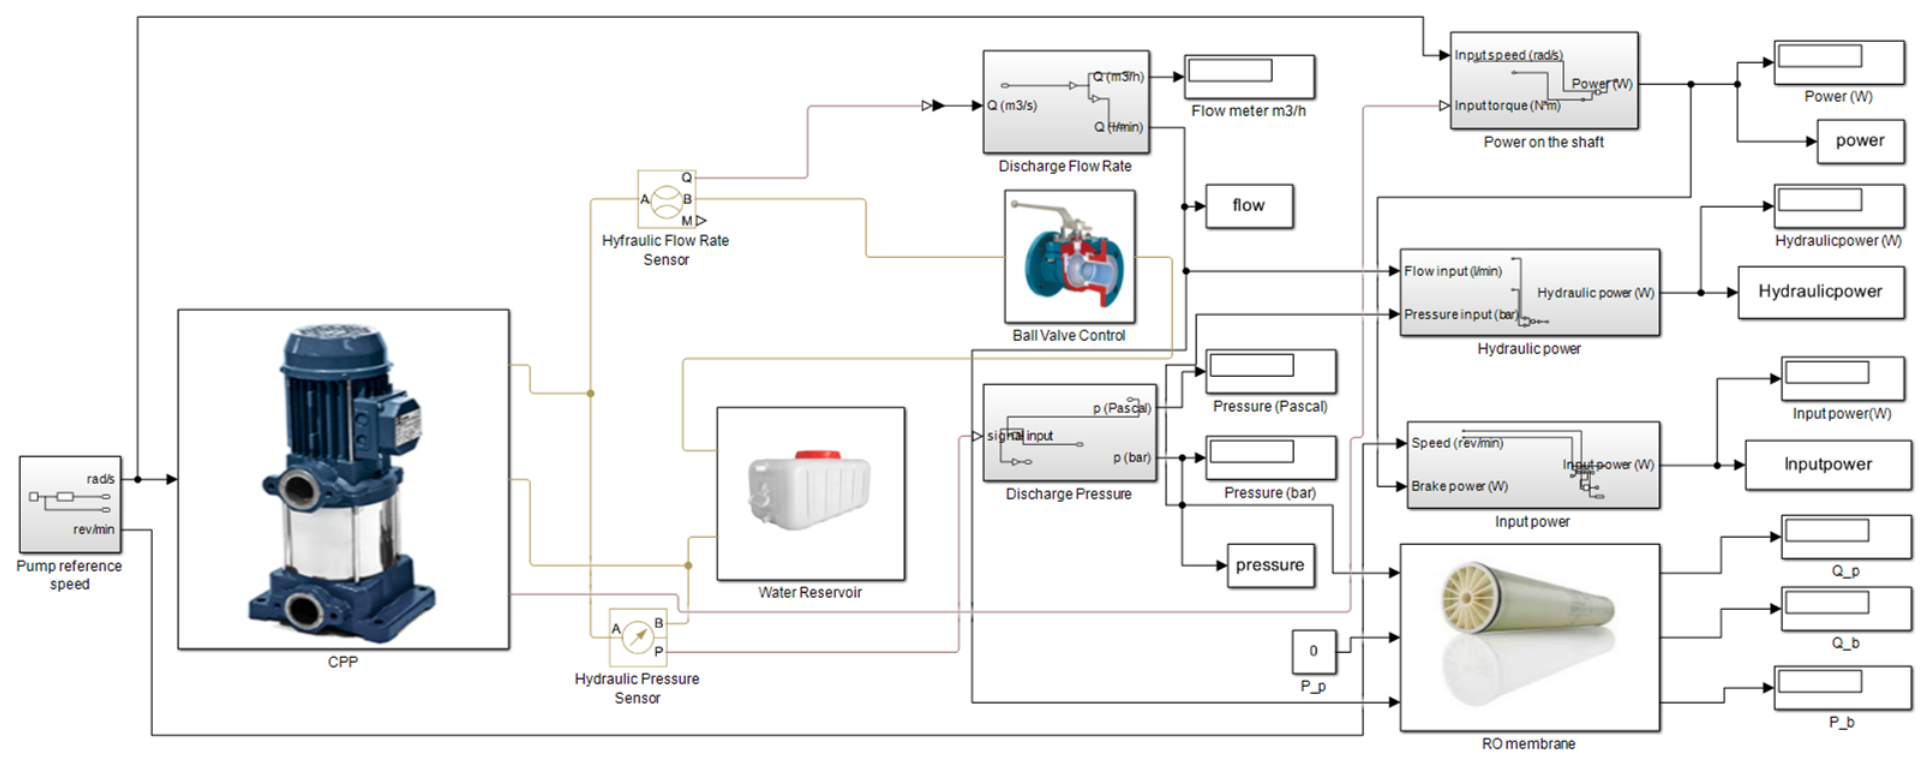
The CPP and VFD models were integrated within a unified Simulink framework. A critical aspect of this integration involved the transfer of electric drive loss data from the ABB Drive Size tool into the MATLAB/Simulink environment via lookup tables. These tables capture the efficiency characteristics and loss mechanisms of the motor and frequency converter, enabling accurate power loss estimation. The loss lookup tables are generated using ABB DriveSize, a dimensioning tool that performs thermal loss and efficiency calculations based on the specific motor and frequency converter combination. The tool derives losses from a combination of catalog data and physical models, accounting for motor copper, iron, and mechanical losses, as well as converter switching and conduction losses. Loss data are provided at standardized operating points as functions of motor speed and shaft torque. The resulting lookup tables were imported into MATLAB/Simulink for integration with the hydraulic system model. The resulting simulation architecture is illustrated in Figure 5.
Figure 5.
Simulink model of reverse osmosis system for CPP efficiency estimation.
The pump reference speed is established through a mechanical rotational reference subsystem incorporating an angular velocity source. This component generates a speed reference signal that is directly proportional to the input command, providing the setpoint for the VFD control loop. Measurement acquisition is facilitated by dedicated converter blocks that transform numerical simulation values into corresponding physical quantities and store them in memory for subsequent graphical plotting and analysis.
While the model is implemented in a time-domain environment and is capable of simulating transient events such as pump startup, speed ramping, and feed pressure variations, the present study focuses on steady-state operation. This focus is consistent with the design-stage application of the model, where steady-state power consumption and comparative analysis are the primary objectives.
The simulation study employed an RO system incorporating the high-pressure centrifugal pump manufactured by Ebara [36]. The pump is driven by an ABB M2BAX 90 SA 2 three-phase squirrel-cage induction motor, coupled to an ABB ACS580 general-purpose variable frequency drive. The motor selected features a cast-iron frame with IP55 enclosure protection, class F insulation, and an IE2 efficiency rating, making it suitable for pump and fan applications in water treatment environments. The drive system is configured to provide precise speed control across the pump operating range, enabling efficient regulation of feeding pressure in response to varying RO system demands. Main technical characteristics are presented in Table 1 and Table 2.
Table 1.
Motor-drive specifications.
Table 2.
Reverse osmosis system specifications.
The hydraulic and mechanical brake power of the pumping system are obtained according to fundamental thermodynamic relationships. The hydraulic power delivered to the fluid, representing the useful energy transferred to the permeate stream, is calculated using the relationship between pressure, flow rate, and fluid properties [37]:
where ρ is the fluid density, g is gravitational acceleration, H is the total dynamic head, and Q is the volumetric flow rate. This expression quantifies the power imparted to the fluid by the pump impeller, representing the portion of input energy that performs useful work in overcoming system resistance and elevating the feeding water to the required pressure. The total head H in Equation (12) represents the total system resistance, including static head, friction losses, and minor losses. The pump discharge pressure is determined from the pump performance curve, and the pressure at the RO membrane inlet is obtained by subtracting the pipeline pressure drop from the pump discharge pressure.
The mechanical brake power delivered to the pump shaft is determined from rotational speed and torque according to [38]:
where ω is the angular rotational speed, T is the shaft torque, and n is the rotational speed. This represents the mechanical power input to the pump from the motor, accounting for the power transmitted through the shaft coupling. The difference between Pshaft and Phyd corresponds to the hydraulic losses within the pump itself, arising from friction, recirculation, and leakage.
The overall efficiency of the pumping system is characterized by efficiency, which relates the hydraulic power delivered to the fluid to the total power supplied to the shaft:
4. Simulation Results
The primary objective of the simulation study was to assess the efficiency of a high-pressure centrifugal pumping plant across distinct operating zones of the RO pumping system and to quantitatively demonstrate the impact of variable frequency drive integration on overall system efficiency. For each simulation run, the pump was configured to operate at a specific rotational speed corresponding to the test case under investigation, encompassing both nominal and reduced speed conditions. The reference pump speed served as the primary input to the VFD model, with lookup tables generated from manufacturer characteristic graphs providing the necessary interpolation of drive performance data. These lookup tables enabled the determination of current-dependent losses as functions of pump speed and shaft torque for every test condition, facilitating accurate characterization of the electrical drive behavior across the entire operating envelope.
The simulation was designed to address three principal research questions: first, to validate the fidelity of the integrated Simulink-ABB Drive Size model against manufacturer-supplied performance data; second, to characterize the mechanical, hydraulic, and electrical loss distributions within the pumping system; and third, to quantify the efficiency of the CPP. To this end, a systematic series of simulations was performed, with the pump operating at nominal speed (3000 rpm) and two reduced speeds (2700 rpm and 2400 rpm), representing typical operating conditions encountered in RO feed systems under varying production demands or feed water conditions.
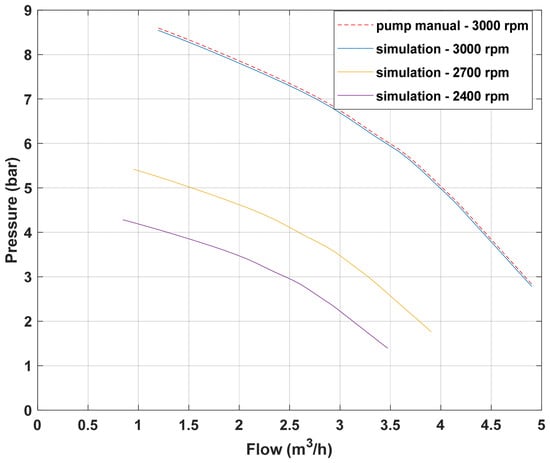
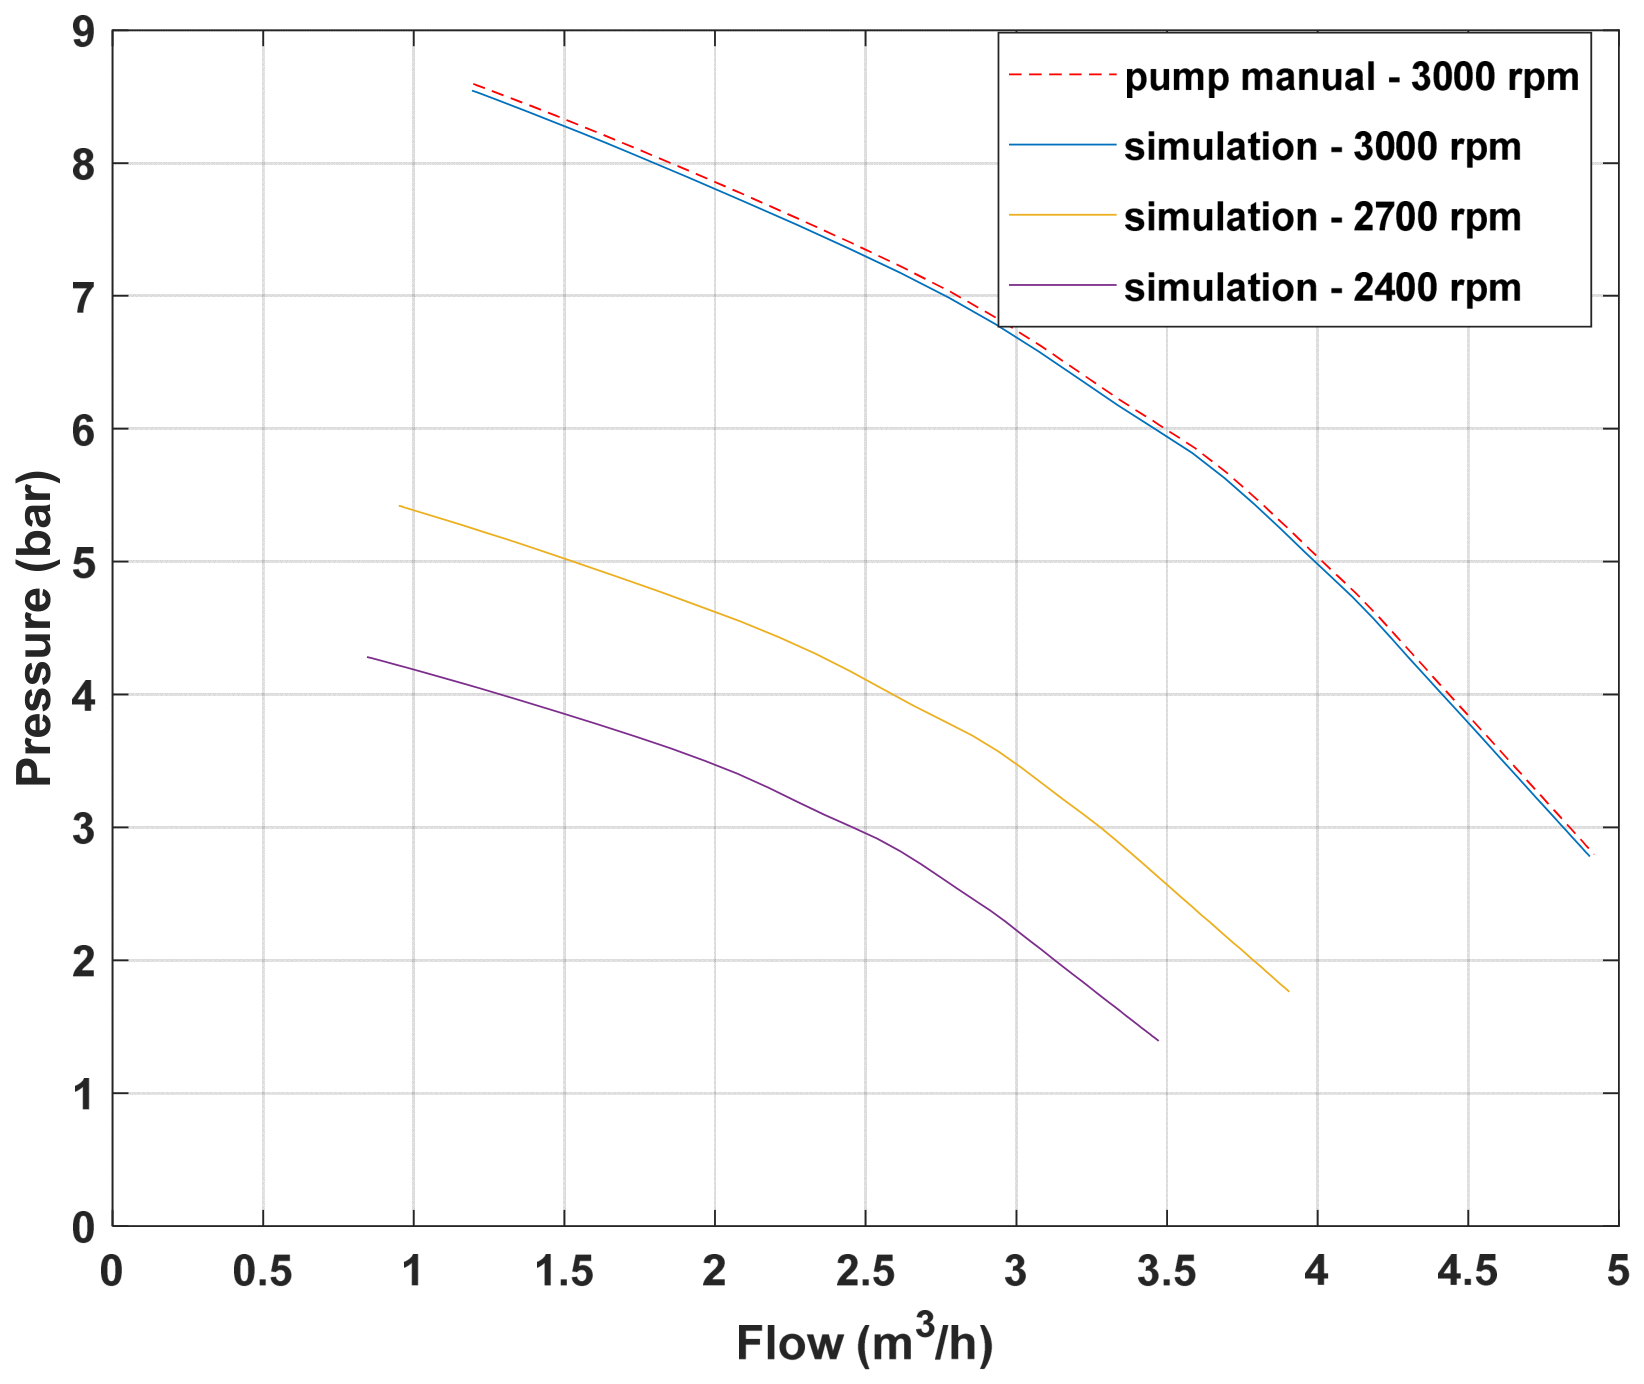
To verify model accuracy, simulation results were first compared against the manufacturer’s published pump performance curves at nominal speed. This validation step was essential to establish confidence in the model’s hydraulic representation before proceeding with variable speed investigations. The model behavior was explored through simulations performed at three distinct pump speeds: 3000, 2700, and 2400 rpm, enabling characterization of the pump’s hydraulic and power characteristics across a representative range of operating conditions. A family of obtained pump performance curves is shown in Figure 6, depicting the relationship between volumetric flow rate and developed head at each speed.
Figure 6.
CPP’s performance curves at nominal rotational speed and simulated at reduced rotational speeds.
The comparison between simulated and manufacturer’s data at nominal speed demonstrates good agreement across the flow range, with the simulated curve closely tracking the published characteristics. Small deviations observed at low flow rates can be attributed to the polynomial curve-fitting methodology employed to represent the pump characteristics, which may introduce minor discrepancies at the extremes of the operating range. The family of reduced-speed curves, generated using the affinity laws described in Section 2.1, exhibits the expected downward shift in pressure as speed decreases, confirming the correct implementation of the scaling relationships.
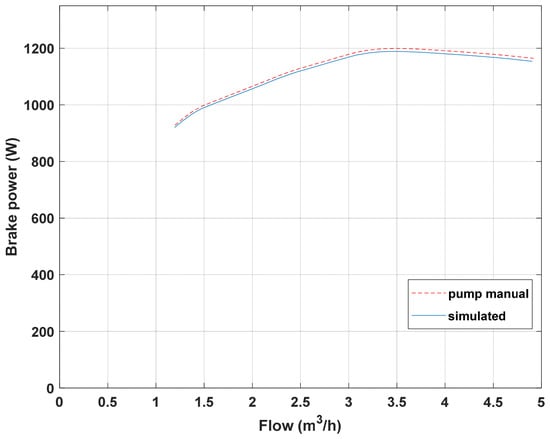
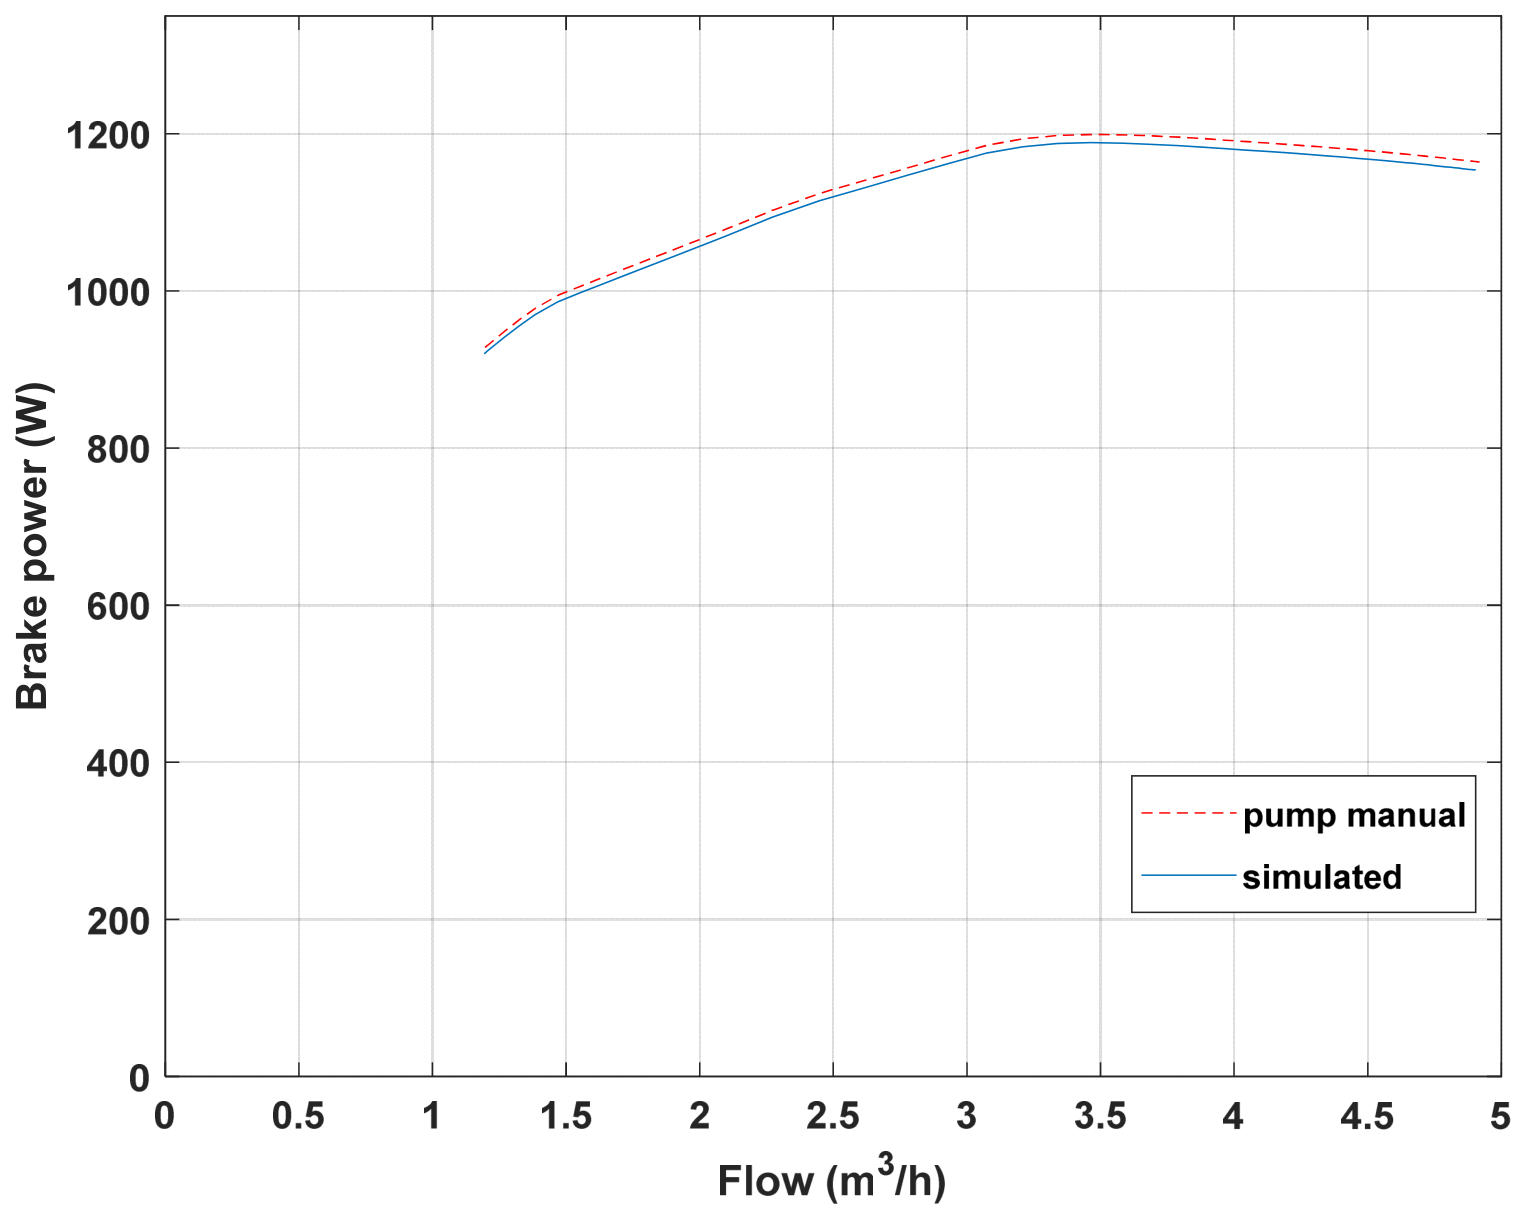
Subsequently, model validation was extended to the mechanical brake power characteristics. Figure 7 presents the comparison between the simulated mechanical brake power and the manufacturer’s published brake power curve at nominal speed, demonstrating the model’s ability to accurately predict the shaft power required at each operating point.
Figure 7.
CPP’s power on the shaft curves, simulated vs. datasheet at nominal rotational speed.
The close correspondence between simulated and published brake power values validates the torque-speed relationships implemented within the mechanical subsystem. The brake power curve exhibits the characteristic increase with flow rate, reflecting the greater hydraulic energy imparted to the fluid at higher flow conditions. This validation step confirms that the mechanical power estimation subsystem accurately captures the pump’s energy conversion behavior, providing a solid foundation for subsequent loss characterization and efficiency analysis.
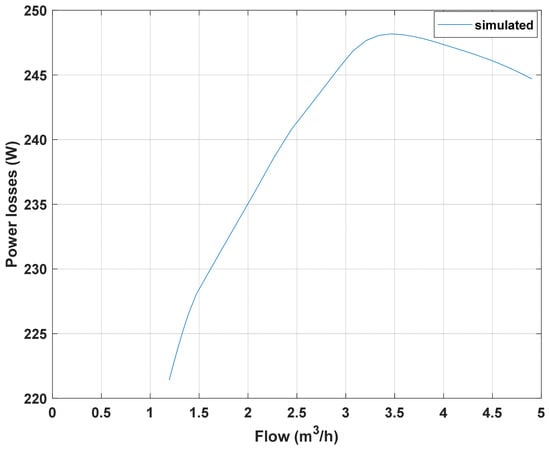
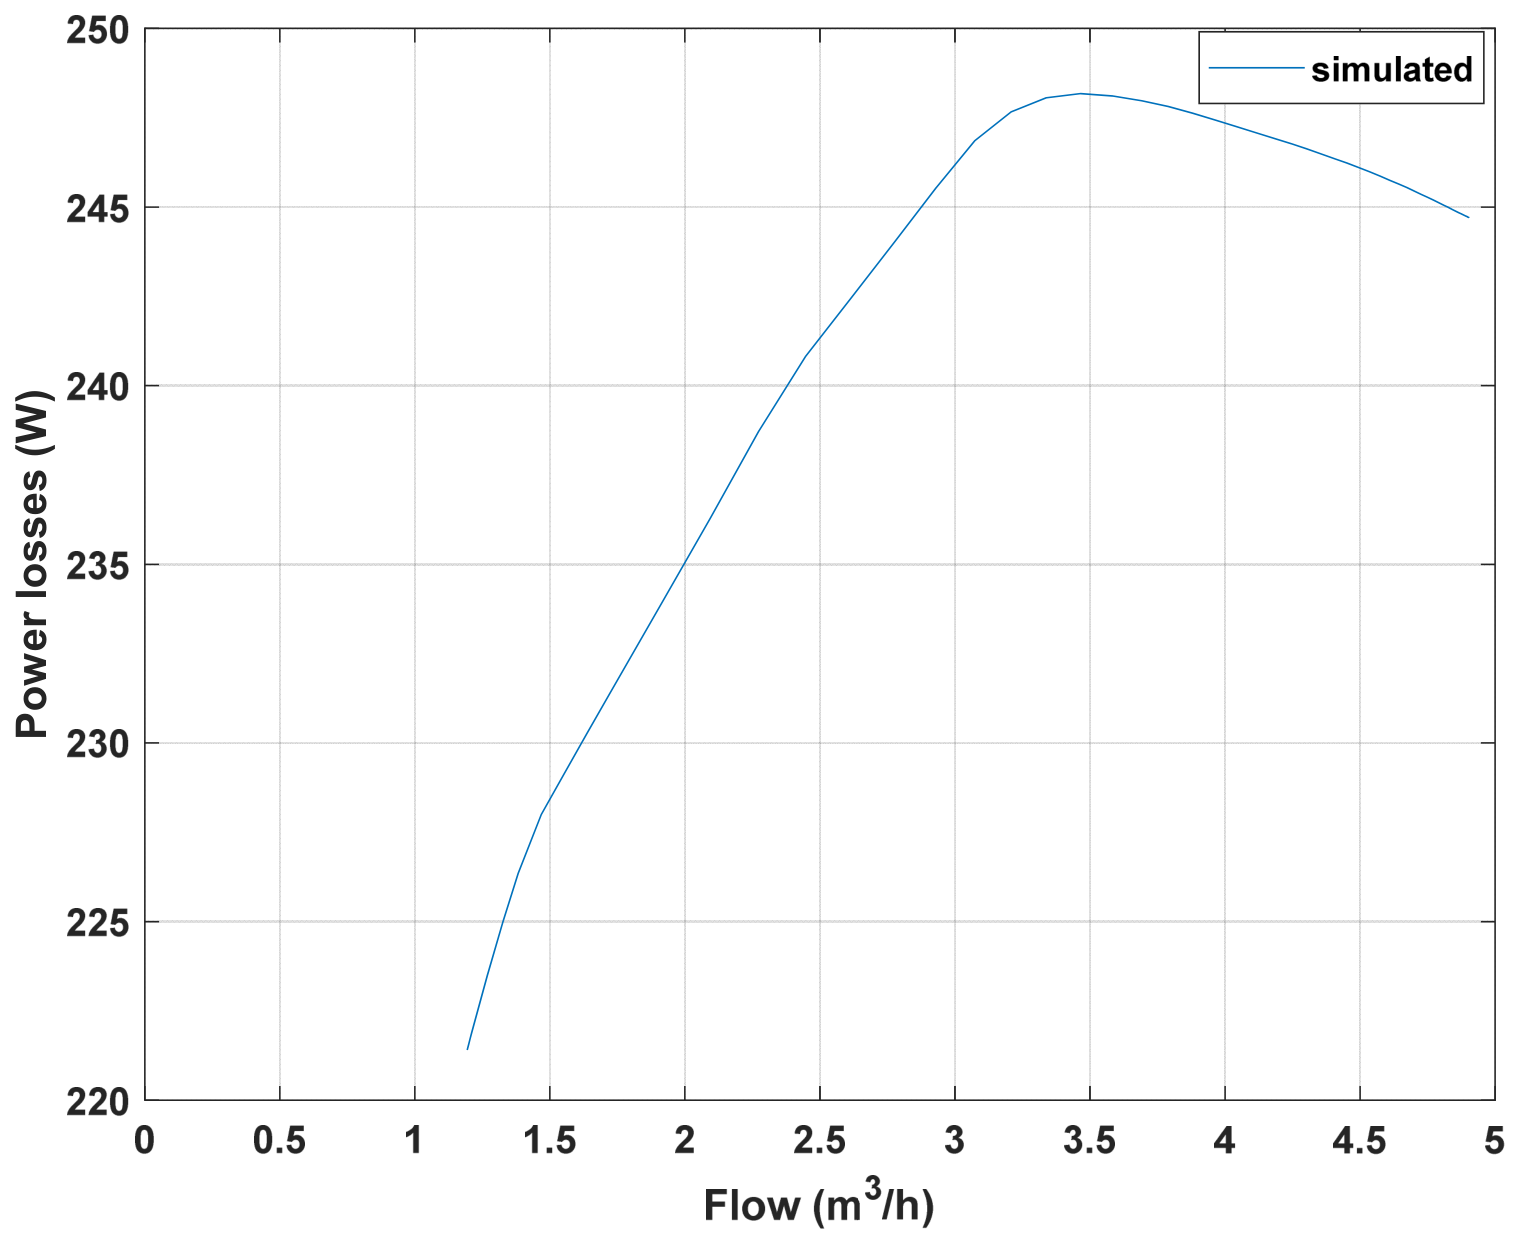
With the hydraulic and mechanical subsystems validated, attention was directed toward characterization of the electrical drive losses and hydraulic power distribution. Figure 8 presents the simulated drive losses, comprising the aggregate losses in the VFD and the electric motor, plotted as a function of flow rate at nominal speed.
Figure 8.
CPP’s electric drive losses at nominal rotational speed.
The drive loss profile exhibits a non-linear dependence on both speed and torque, with losses increasing as the operating point moves toward higher flow rates and correspondingly higher shaft power demands. At nominal speed, the drive losses represent a measurable fraction of the total input power, underscoring the importance of including these losses in comprehensive power estimation. While Figure 8 presents drive losses at nominal speed (3000 rpm), the model also computes losses at reduced speeds (2700 and 2400 rpm). At reduced speeds, absolute drive losses decrease due to lower currents and reduced iron losses. However, the drive efficiency decreases slightly, due to reduced cooling and increased relative losses. This behavior is captured by the DriveSize lookup tables and is consistent with typical motor and VFD characteristics.
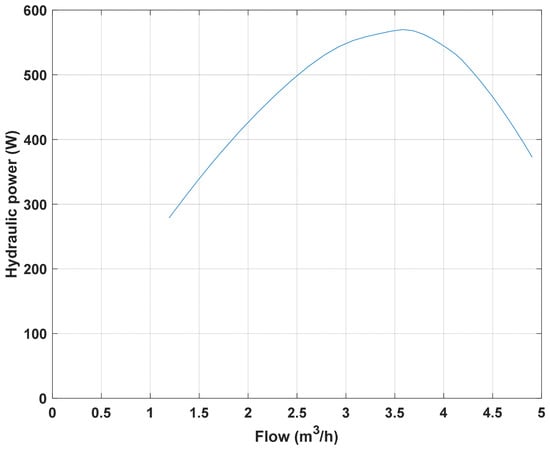
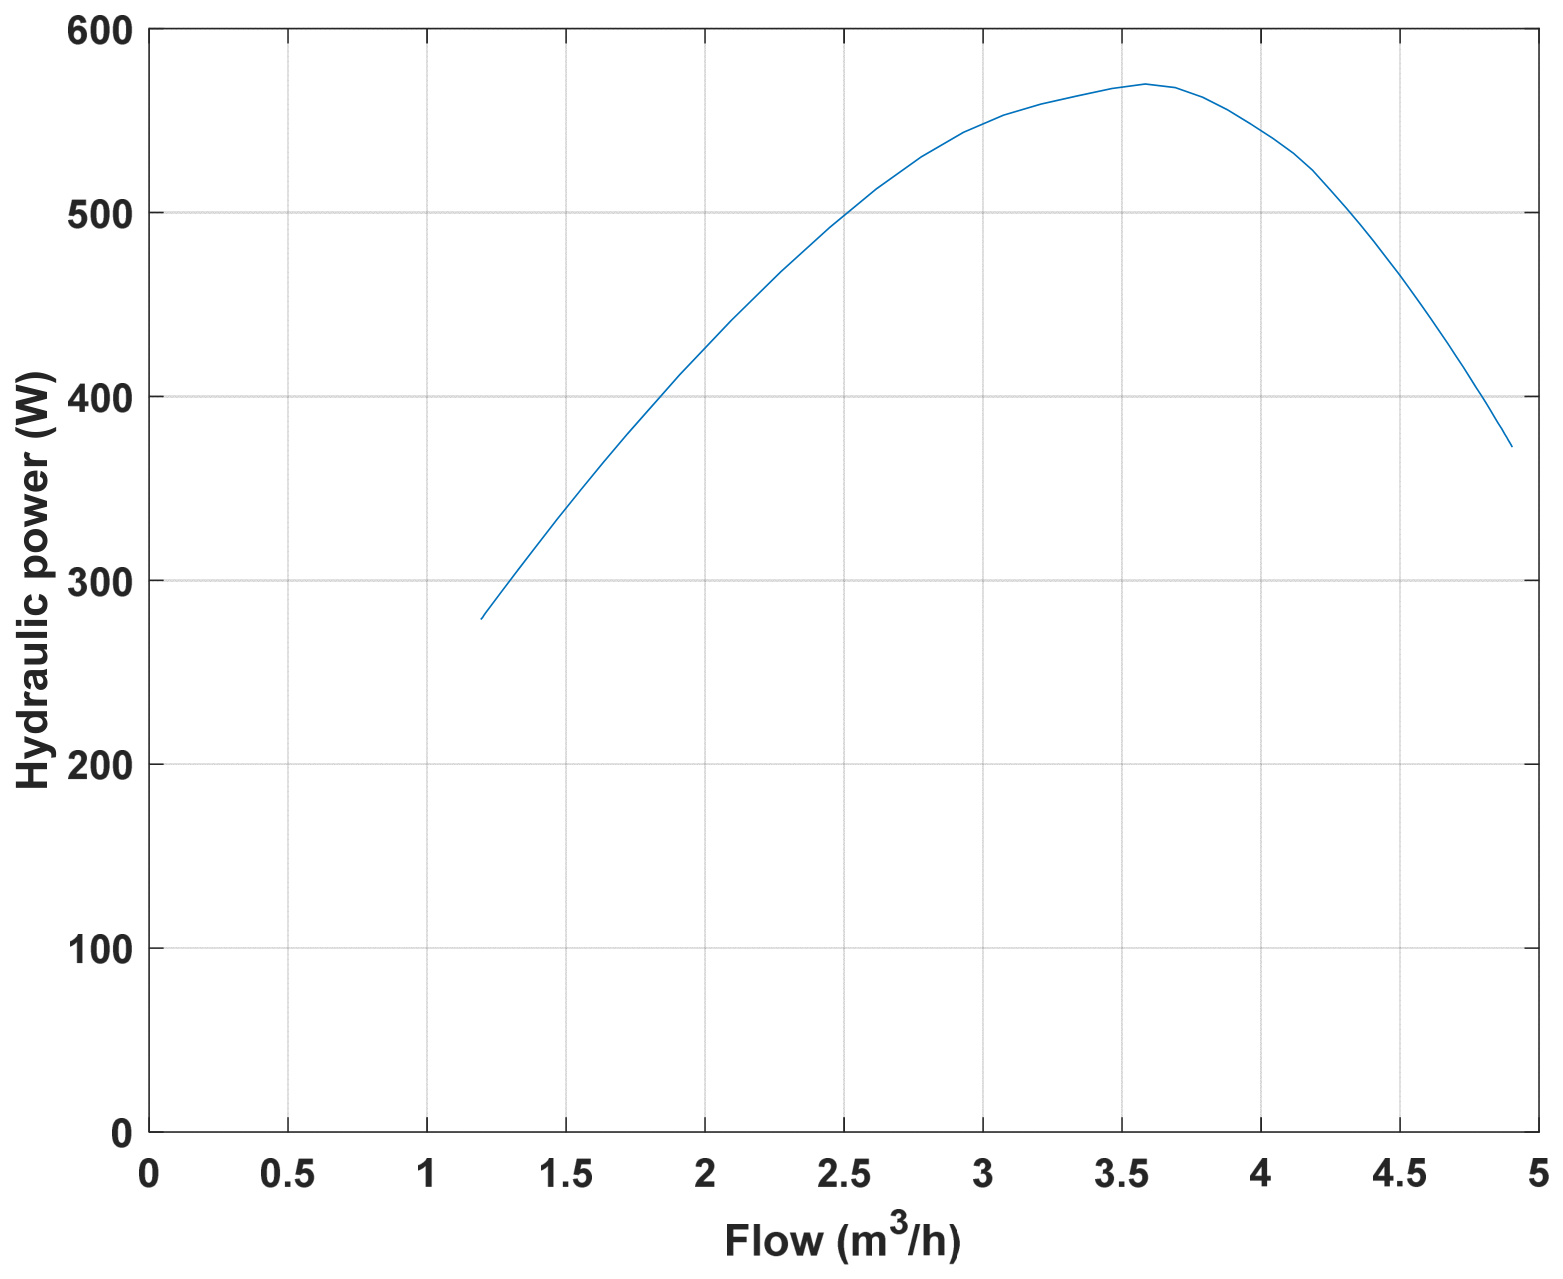
Figure 9 presents the simulated hydraulic power, the useful power delivered to the fluid, as a function of flow rate at nominal speed.
Figure 9.
CPP’s hydraulic power vs. flow rate.
It is worth noting that the observed reduction in input power and shaft power with decreasing speed is consistent with the well-established cubic relationship between power and speed described by the affinity laws (Equation (2)). This relationship underscores the substantial energy-saving potential of variable-speed operation compared to conventional throttling control, where excess hydraulic energy would otherwise be dissipated across a control valve. While a detailed quantitative comparison between the two control strategies is beyond the scope of the present study, the developed model provides the necessary framework for such analyses in future work.
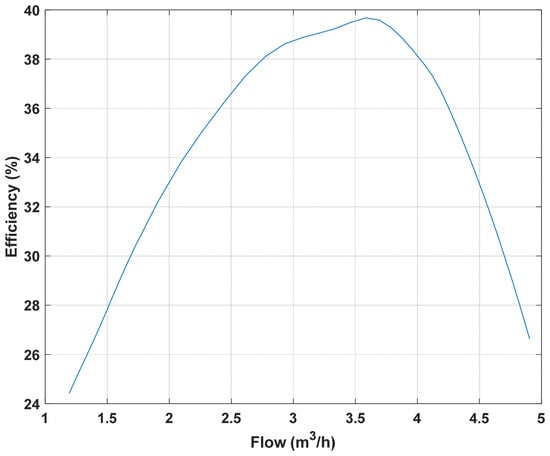
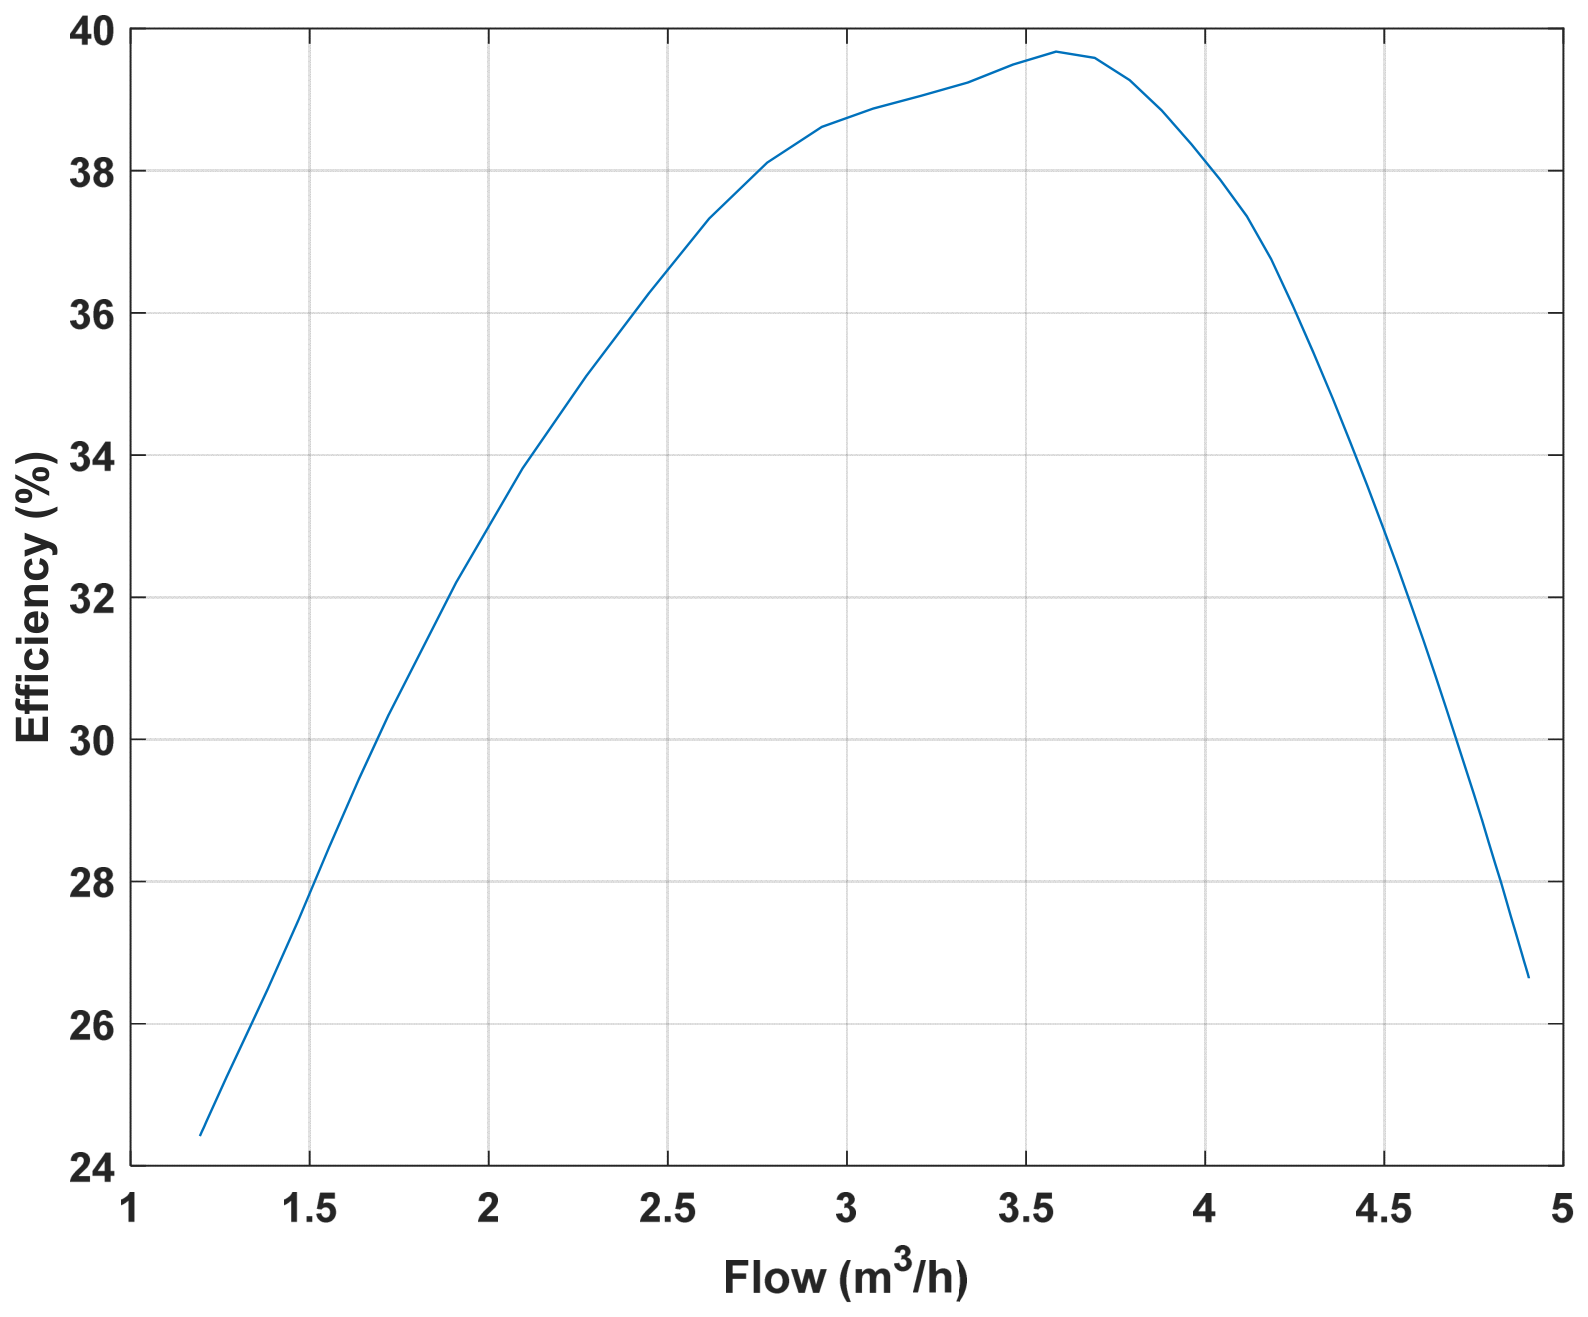
Based on Equation (11), the efficiency was calculated. Figure 10 presents the simulated efficiency, as a function of flow rate at nominal speed.
Figure 10.
CPP’s efficiency vs. flow rate.
5. Conclusions
A novel simulation-based framework for estimating centrifugal pump efficiency in RO desalination systems has been presented, with particular emphasis on the explicit incorporation of variable frequency drive losses. The model successfully integrates pump hydraulic and RO characteristics, pipeline network dynamics, and VFD parameters within a unified Simulink environment, enabling accurate efficiency estimation under variable speed operation.
Simulation results demonstrate close agreement with manufacturer-supplied performance data, validating the model’s fidelity in predicting pump hydraulic and mechanical characteristics. The findings confirm that VFD losses constitute a non-negligible component of total power consumption, a factor often overlooked in conventional RO system analyses, with losses exhibiting non-linear dependence on both speed and torque.
It should be acknowledged that the affinity laws employed in this study assume constant pump efficiency across the speed range. While this assumption is acceptable for the moderate speed reductions investigated, future studies will incorporate efficiency correction factors to enhance accuracy at more significant speed deviations.
Future work will focus on experimental validation of the simulation results using a laboratory-scale RO test rig equipped with comprehensive instrumentation for measuring electrical input power, shaft torque, flow rate, and pressure at multiple points throughout the system. Such validation would provide direct verification of the model’s predictive capabilities across a range of operating conditions, enabling refinement of the loss estimation modules and calibration of the pump characteristic curves. Experimental data would also allow assessment of the model’s accuracy under transient conditions, including pump startup, speed ramping, and flow variations, thereby extending its applicability to dynamic operational scenarios. Future work will also include a sensitivity analysis to assess the influence of membrane parameter variations on overall system efficiency and power consumption predictions.
Furthermore, the developed model provides the necessary framework for a systematic quantitative comparison between throttling control and variable-speed control at identical system demand points, which will be explored in future studies to quantify valve losses, pump shaft power, motor/VFD losses, grid input power, and overall efficiency, and to determine the percentage of energy savings achievable with VFD adoption.
Funding
This research was funded by the European Union, grant number 101216330. Views and opinions expressed are however those of the author(s) only and do not necessarily reflect those of the European Union or the European Research Executive Agency (REA). Neither the European Union nor the granting authority can be held responsible for them.
Data Availability Statement
The data presented in this study are available on reasonable request from the corresponding author. The centrifugal pump characteristics used in this study were obtained from publicly available sources. The MATLAB code and Simulink model used for simulations are available from the corresponding author upon reasonable request.
Acknowledgments
During the preparation of this manuscript/study, the author used Grammarly (v.1.2.281.1928) for the purposes of grammar improvement. The author has reviewed and edited the output and takes full responsibility for the content of this publication.
Conflicts of Interest
The author declares no conflicts of interest.
Abbreviations
The following abbreviations are used in this manuscript:
| BPE | Brake Power Estimator |
| CPP | Centrifugal Pump System |
| ERD | Energy Recovery Device |
| HP | High Pressure |
| HPE | Hydraulic Power Estimator |
| IPE | Input Power Estimator |
| LCOW | Levelized Cost of Water |
| MED | Multi-Effect Distillation |
| MSF | Multi-Stage Flash |
| PEM | Parameters of the Electric Motor |
| PLE | Power Losses Estimator |
| PPEC | Parameters of the Power Electronics Converter |
| RO | Reverse Osmosis |
| VFD | Variable Frequency Drive |
| VSD | Variable Speed Drive |
References
- Jones, E.; Qadir, M.; van Vliet, M.T.H.; Smakhtin, V.; Kang, S. The State of Desalination and Brine Production: A Global Outlook. Sci. Total Environ. 2019, 657, 1343–1356. [Google Scholar] [CrossRef] [Scilit] [PubMed]
- National Ocean Service. Where is All of the Earth’s Water? Available online: https://oceanservice.noaa.gov/facts/wherewater.html (accessed on 20 June 2026).
- WHO. Drinking-Water Fact Sheet; World Health Organization: Geneva, Switzerland, 2023; Available online: https://www.who.int/news-room/fact-sheets/detail/drinking-water (accessed on 20 June 2026).
- Elimelech, M.; Phillip, W.A. The Future of Seawater Desalination: Energy, Technology, and the Environment. Science 2011, 333, 712–717. [Google Scholar] [CrossRef] [Scilit] [PubMed]
- Fritzmann, C.; Löwenberg, J.; Wintgens, T.; Melin, T. State-of-the-Art of Reverse Osmosis Desalination. Desalination 2007, 216, 1–76. [Google Scholar] [CrossRef] [Scilit]
- Gevorkov, L.; Saebnoori, E.; Domínguez-García, J.L.; Trilla, L. Renewable Energy-Driven Pumping Systems and Application for Desalination: A Review of Technologies and Future Directions. Appl. Sci. 2026, 16, 862. [Google Scholar] [CrossRef] [Scilit]
- Wilf, M.; Klinko, K. Optimization of Seawater RO Systems Design. Desalination 2005, 173, 1–16. [Google Scholar] [CrossRef] [Scilit]
- Aboulkacem, C.; Sigue, S.; Lachheb, A.; Samrane, K.; Abushaban, A.; Necibi, M.C. Seawater desalination and water reuse using FO-RO hybrid system: Short review. Desalin. Water Treat. 2025, 324, 101487. [Google Scholar] [CrossRef] [Scilit]
- Qudah, Z.; Almerbati, A.; Mokheimer, E.M.A. RO desalination powered by renewable energy sources: Optimized sizing with pumped storage hydropower system. J. Energy Storage 2024, 97, 112854. [Google Scholar] [CrossRef] [Scilit]
- Khoshgoftar Manesh, M.H.; Kabiri, S.; Yazdi, M. Integration of MED-RO and MSF-RO desalination with a combined cycle power plant. Desalin. Water Treat. 2020, 179, 106–129. [Google Scholar] [CrossRef] [Scilit]
- Gevorkov, L.; Vodovozov, V. Study of the centrifugal pump efficiency at throttling and speed control. In Proceedings of the 2016 15th Biennial Baltic Electronics Conference (BEC), Tallinn, Estonia, 3–5 October 2016; pp. 199–202. [Google Scholar]
- Shin, M.G.; Park, S.-H.; Kwon, S.J.; Kwon, H.-E.; Park, J.B.; Lee, J.-H. Facile performance enhancement of reverse osmosis membranes via solvent activation with benzyl alcohol. J. Membr. Sci. 2019, 578, 220–229. [Google Scholar] [CrossRef] [Scilit]
- Das, T.K.; Frost, C.; Folley, M.; Brewster, P. Application of an energy recovery device with RO membrane for wave powered desalination. Desalination 2024, 592, 118064. [Google Scholar] [CrossRef] [Scilit]
- Gevorkov, L.; Šmídl, V.; Sirový, M. Model of Hybrid Speed and Throttle Control for Centrifugal Pump System Enhancement. In Proceedings of the 2019 IEEE 28th International Symposium on Industrial Electronics (ISIE), Vancouver, BC, Canada, 12–14 June 2019; pp. 563–568. [Google Scholar] [CrossRef] [Scilit]
- Vodovozov, V.; Lehtla, T.; Bakman, I.; Raud, Z.; Gevorkov, L. Energy-efficient predictive control of centrifugal multi-pump stations. In Proceedings of the 2016 Electric Power Quality and Supply Reliability (PQ), Tallinn, Estonia, 29–31 August 2016; pp. 233–238. [Google Scholar] [CrossRef] [Scilit]
- Bakman, I.; Gevorkov, L. Speed control strategy selection for multi-pump systems. In Proceedings of the 2015 56th International Scientific Conference on Power and Electrical Engineering of Riga Technical University (RTUCON), Riga, Latvia, 14 October 2015; pp. 1–4. [Google Scholar] [CrossRef] [Scilit]
- Sobana, S.; Panda, R.C. Modeling and control of reverse osmosis desalination process using centralized and decentralized techniques. Desalination 2014, 344, 243–251. [Google Scholar] [CrossRef] [Scilit]
- Warsinger, D.M.; Tow, E.W.; Nayar, K.G.; Maswadeh, L.A.; Lienhard, J.H. Energy Efficiency of Batch and Semi-Batch (CCRO) Reverse Osmosis Desalination. Water Res. 2016, 106, 272–282. [Google Scholar] [CrossRef] [Scilit] [PubMed]
- Jahmeerbacus, M.I. A Model-Based Approach for Minimizing Specific Energy Consumption in Variable Speed Driven Pumping Systems. In Proceedings of the 2024 3rd International Conference on Power Systems and Electrical Technology (PSET), Tokyo, Japan, 4–7 August 2024; pp. 382–387. [Google Scholar] [CrossRef] [Scilit]
- Tamminen, J.; Ahonen, T.; Kosonen, A.; Ahola, J.; Tolvanen, J. Variable speed drive-based pressure optimization of a pumping system comprising individual branch flow control elements. In Proceedings of the 2014 16th European Conference on Power Electronics and Applications, Lappeenranta, Finland, 26–28 August 2014; pp. 1–11. [Google Scholar] [CrossRef] [Scilit]
- Bontemps, P.; Hugo, N.; Dujic, D. Flexibility Enhancements in Pumped Hydro Storage Power Plants through Variable Speed Drives. In Proceedings of the IECON 2020: The 46th Annual Conference of the IEEE Industrial Electronics Society, Singapore, 18–21 October 2020; pp. 1820–1825. [Google Scholar] [CrossRef] [Scilit]
- Solangi, H. Variable-speed drives in reverse osmosis desalination: Inverter technologies, energy efficiency, and renewable integration. Desalination 2026, 622, 119770. [Google Scholar] [CrossRef] [Scilit]
- Tabsissi, K.; Elqars, E.; Laaziz, M.; Semmar, A.; EL Ansari, L.; Rabbah, N.; Medromi, H.; Machkour, N. Impact of energy optimization of a PMSM-driven high-pressure pump on commercial TFC membrane performance in reverse osmosis desalination. Results Eng. 2026, 32, 111781. [Google Scholar] [CrossRef] [Scilit]
- Xiao, M.; Li, Y.; Wang, H.; Yuan, J.; You, F.; Cao, M. Key technologies for the system design of high-speed centrifugal pumps: A review and future trends. Flow Meas. Instrum. 2026, 112, 103475. [Google Scholar] [CrossRef] [Scilit]
- Georgescu, A.-M.; Georgescu, S.-C.; Cosoiu, C.I.; Hasegan, L.; Anton, A.; Bucur, D.M. EPANET Simulation of Control Methods for Centrifugal Pumps Operating under Variable System Demand. Procedia Eng. 2015, 119, 1012–1019. [Google Scholar] [CrossRef] [Scilit]
- Yao, Y.; Zhou, Y.; He, J.; Yang, J. Control and Optimization of Centrifugal Pump Based on Smith Control Algorith. In Proceedings of the 2024 6th International Academic Exchange Conference on Science and Technology Innovation (IAECST), Guangzhou, China, 6–8 December 2024; pp. 2004–2007. [Google Scholar] [CrossRef] [Scilit]
- Pannatier, Y.; Kawkabani, B.; Nicolet, C.; Simond, J.-J.; Schwery, A.; Allenbach, P. Investigation of control strategies for variable-speed pump-turbine units by using a simplified model of the converters. IEEE Trans. Ind. Electron. 2010, 57, 3039–3049. [Google Scholar] [CrossRef] [Scilit]
- Almetwally, E.M.; Elazab, M.A.; Kabeel, A.E.; Yasser, Y.; Elgebaly, A. Solar powered reverse osmosis desalination: A systematic review of technologies, integration strategies and challenges. Desalination 2025, 615, 119228. [Google Scholar] [CrossRef] [Scilit]
- Karassik, I.J.; McGuire, T. Centrifugal Pumps, 2nd ed.; Chapman & Hall: New York, NY, USA, 1998; pp. 464–469. [Google Scholar]
- Simpson, J.; Binesh, N.; Rivera, M.; Monroy, C. Energy Efficiency Using a VSD in a Mining Installation, Analysis, and Measured Results. In Proceedings of the 2023 IEEE IAS Petroleum and Chemical Industry Technical Conference (PCIC), New Orleans, LA, USA, 9–13 September 2023; pp. 489–499. [Google Scholar] [CrossRef] [Scilit]
- Hogarth, W.L.; Parlange, J.-Y.; Rose, C.W.; Fuentes, C.; Haverkamp, R.; Walter, M.T. Interpolation between Darcy–Weisbach and Darcy for laminar and turbulent flows. Adv. Water Resour. 2005, 28, 1028–1031. [Google Scholar] [CrossRef] [Scilit]
- Zhao, Y.; Wang, Y.; Zhang, M.; Li, M.; Zhao, Z.; Liu, L. Failure analysis of the outlet pipeline and ball valve of the circulating pump in the desulfurization liquid concentration tower. Eng. Fail. Anal. 2024, 161, 108338. [Google Scholar] [CrossRef] [Scilit]
- Liang, Y.Y. Low-salt-rejection reverse osmosis for high-salinity brine treatment: Current status, challenges, and emerging directions. J. Environ. Chem. Eng. 2026, 14, 122542. [Google Scholar] [CrossRef] [Scilit]
- Khraisheh, M.; Dawas, N.; Nasser, M.S.; Al-Marri, M.J.; Hussien, M.A.; Adham, S.; McKay, G. Osmotic pressure estimation using the Pitzer equation for forward osmosis modelling. Environ. Technol. 2020, 41, 2533–2545. [Google Scholar] [CrossRef] [Scilit] [PubMed]
- ABB. DriveSize. Available online: https://www.drivesize.abb-drives.com/ (accessed on 24 June 2026).
- EBARA. CVM—Vertical Multistage Centrifugal Pump. Available online: https://www.ebaraeurope.com/product/cvm/ (accessed on 24 June 2026).
- Pellegrini, C.C.; Silva, M.L.F.; Pedrera-Yanes, J.; Llanes-Santiago, O.; Vilalta-Alonso, G. An energy-based framework for selecting centrifugal pumps under slow transient operation. Energy Convers. Manag. 2026, 365, 121807. [Google Scholar] [CrossRef] [Scilit]
- Ifidon, O.; Pandey, D.S.; Ahmad, K.; Jaworski, A.J.; Asfand, F. A review of industrial pumps for viscous and non-Newtonian slurry transport. Int. J. Thermofluids 2025, 30, 101450. [Google Scholar] [CrossRef] [Scilit]

Disclaimer/Publisher’s Note: The statements, opinions and data contained in all publications are solely those of the individual author(s) and contributor(s) and not of MDPI and/or the editor(s). MDPI and/or the editor(s) disclaim responsibility for any injury to people or property resulting from any ideas, methods, instructions or products referred to in the content. |
© 2026 by the author. Licensee MDPI, Basel, Switzerland. This article is an open access article distributed under the terms and conditions of the Creative Commons Attribution (CC BY) license.