


Highlights
What are the main findings?
- Mined stope’s pH rose from 2.1 to 6.6 in 10 years; neutralization was fastest in the first 5 years.
- The overlying 7S sandstone aquifer showed rising SO42− and Fe (0.34–14 mg/L), exceeding the drinking-water quality standard.
- Contaminant plumes stayed confined initially, then migrated down-gradient after 5 years.
- The 7S sandstone aquifer requires priority monitoring and targeted remediation planning.
- The coupled FEFLOW–PHREEQC framework is transferable for long-term water chemical prediction in similar multi-layer abandoned coalfields.
- Post closure monitoring strategies must account for delayed plume migration and potential impacts on down gradient receptors.
Abstract
Understanding hydrogeochemical change after coal mine closure is needed to protect groundwater in multi-layer aquifer systems, but predictions that span decades are scarce. Earlier FEFLOW–PHREEQC studies of mine hydrogeochemistry have reduced the subsurface to one aquifer, so they cannot resolve the goaf-to-aquifer transport that governs post-closure risk. This study presents a decadal-scale (10-year) reactive transport simulation for a 9-layer mine system with layer-specific kinetics, a step beyond the single-aquifer simplifications of earlier applications. We modeled groundwater rebound and water–rock interaction at a permanently closed deep coal mine in Xuzhou, China, with a three-dimensional FEFLOW–PHREEQC framework. The four aquifers (Q, 7S, L4, O) each received their own reactive parameters, so the goaf and surrounding units were coupled yet chemically distinct. Pyrite-driven acid mine drainage was set as a non-point source in the mined-out zone, with initial pH 2.1 and pyrite content 0.225 mol/L. pH in the stope rose from 2.1 to 5.6 in 5 years and to 6.6 at year 10, a result of fast neutralization by carbonate-buffered alkaline water. Sulfate and total Fe in the overlying 7S aquifer rose without interruption, and Fe passed the 0.3 mg/L drinking-water limit in every monitored aquifer (0.34 to 14 mg/L). Plumes stayed within the mined area for the first 5 years, then moved down-gradient toward dewatering centers. A sensitivity test found that longitudinal dispersivity and porosity controlled SO42− transport, while transverse dispersivity had little effect. The 7S aquifer is the most vulnerable receptor of post-closure contamination. The deep Ordovician aquifer stayed stable because carbonate buffering and hydraulic isolation protected it. Because each aquifer carries its own parameters, the framework transfers to other abandoned coalfields and supports long-term groundwater-quality forecasting there.
1. Introduction
The global energy transition has accelerated the permanent closure of coal mines worldwide, and the long-term development of geological energy, including coal extraction, geothermal exploitation, and gas hydrate production, inevitably perturbs subsurface rock structure and fluid seepage [1,2,3]. Long-term underground mining alters the natural architecture of multi-layer aquifer systems: goaf voids and fracture networks create hydraulic connections between shallow overburden, coal-bearing aquitards and deep aquifers. Moreover, progressive structural deterioration in multi-layer systems, analogous to cascading failure in levee systems [4], can create new preferential flow pathways and alter long-term hydraulic connectivity patterns. Continuous dewatering during mining maintains stable hydraulic gradients and suppresses pyrite oxidation, but once pumping ceases after shutdown, groundwater rebounds rapidly. Cross-formational flow reactivates water–rock interactions, primarily pyrite dissolution, carbonate buffering and cation exchange, leading to typical post-closure environmental risks—acid mine drainage (AMD), elevated sulfate and heavy metal concentrations, and saline intrusion into shallow drinking-water aquifers [5,6].
Following closure, flooded multi-layer aquifers commonly pass through three sequential hydrogeochemical stages: rapid rebound and inter-aquifer mixing, sustained mineral reactions within flooded fractures and goafs, and gradual evolution toward a new hydrochemical steady state. Conventional borehole monitoring and geochemical statistical analyses can capture point-scale water quality characteristics, but they cannot quantitatively separate hydrodynamic transport from mineral reaction kinetics, nor can they underpin decadal-scale water quality predictions. Over the past five years, research on the hydrogeochemistry of closed coal mines has been dominated by field monitoring and reactive transport modeling. Field investigations use hydrochemical diagrams, stable isotopes and saturation indices to interpret water–rock processes in abandoned coalfields, showing that rebound groundwater gradually evolves into high-sulfate saline water due to vertical leakage across aquitards [7,8,9,10,11]. Laboratory batch and column tests provide kinetic parameters for pyrite oxidation and neutralization used in models, yet they cannot reproduce the three-dimensional stratified structure and transient flow conditions of real mine aquifer systems [12,13].
Reactive transport modeling has become the principal quantitative tool for coupling groundwater flow with multi-component geochemical reactions in mining-affected aquifers [14,15,16,17,18]. Standalone PHREEQC inverse modeling calculates mineral mass transfers, but it ignores three-dimensional heterogeneous flow and inter-aquitard leakage, which limits its ability to describe spatial hydrochemical differentiation across layered aquifer systems [19,20]. To overcome this limitation, FEFLOW coupled with the PHREEQC geochemical kernel provides an integrated reactive transport framework that simultaneously solves variably saturated flow, solute transport, kinetic mineral reactions and surface complexation. Published coupled simulations have successfully reproduced pit lake water quality and acid mine drainage migration, benefiting from explicit representation of aquitard barriers and preferential flow along faults [21,22].
Nevertheless, critical knowledge gaps persist in coupled modeling studies addressing coal mine closure. Most published FEFLOW–PHREEQC models simplify the stratigraphy to a single aquifer and neglect the control that layered aquitards exert on vertical flow and geochemical evolution [23,24]. Few studies target deep, multi-layer confined coalfield aquifers in which sandstone and karst units are separated by mudstone barriers, and systematic quantitative analysis of the long-term evolution of mixed hydrochemical endmembers produced by cross-formational flow remains scarce [25,26]. Furthermore, existing simulations typically cover only short post-closure periods and do not resolve stage-dominated processes over decadal timescales, restricting their use for targeted groundwater risk prevention and post-mining water resource utilization.
To fill these gaps, this study develops a three-dimensional reactive transport model coupling FEFLOW and PHREEQC for a permanently closed deep coal mine with a typical multi-layer aquifer system. The objectives are to reconstruct transient groundwater rebound and inter-aquifer leakage pathways, quantify spatiotemporal variations in key hydrochemical indicators, distinguish the contributions of physical mixing and water–rock reactions to the staged hydrogeochemical evolution, and deliver long-term predictions that support groundwater protection in coal-bearing multi-aquifer basins. Previous site sampling and background hydrogeochemical analyses provide the initial data for the model [27,28]. This work assigns distinct reactive transport parameters to each aquifer and aquitard unit, explicitly resolving the vertical hydraulic isolation between strata, and reveals phase-dependent geochemical evolution patterns over a 10-year simulation period, thereby offering a transferable modeling reference for analogous abandoned coal mine systems worldwide.
2. Materials and Methods
2.1. Case Study
2.1.1. Location of the Study Area
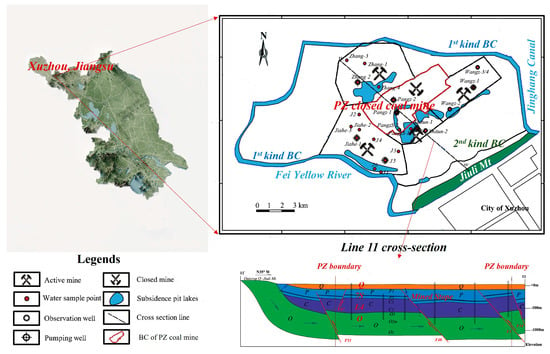
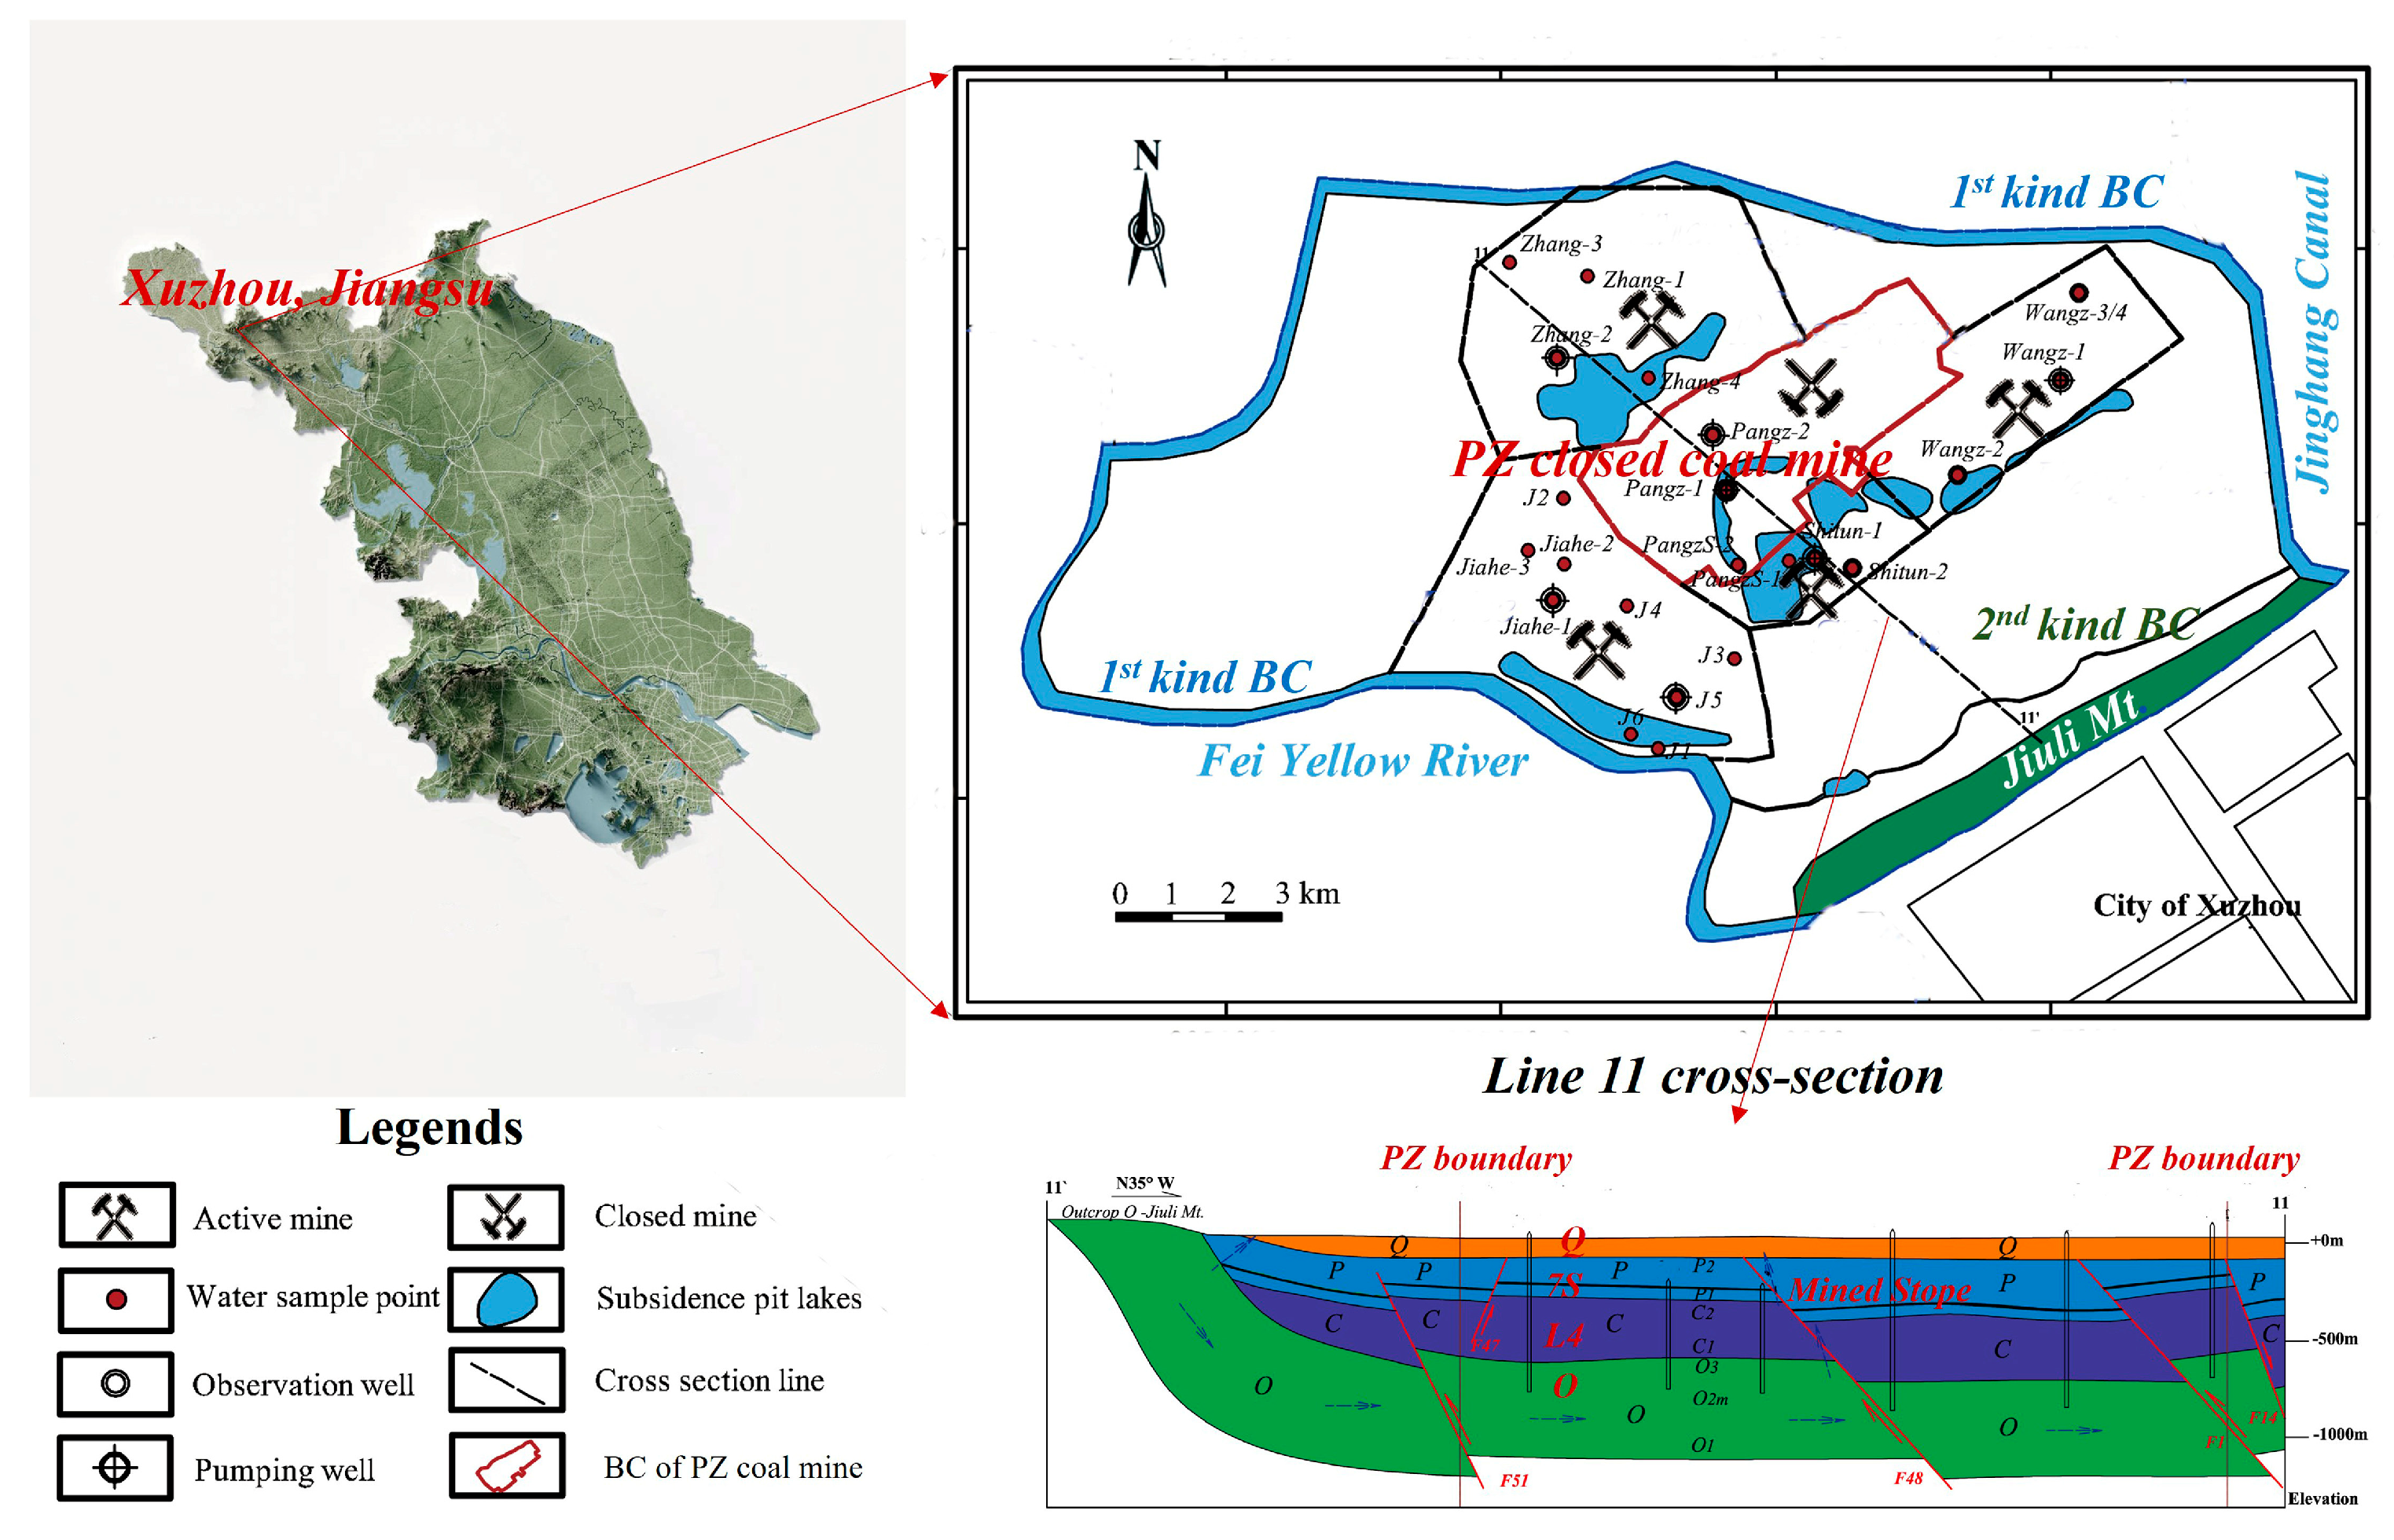
The PZ coal mine, selected as the study site, is located in the northwestern part of Xuzhou City, within the typical North China coal mining area where Permian and Carboniferous coal seams are extracted (Figure 1). The principal mined seams belong to the Shanxi and Xia Shihezi formations of the Permian System. All shafts of the PZ coal mine have now been permanently closed. Notably, four active mines surround the closed PZ mine and are still undergoing dewatering. With the closure of the shafts and the abandonment of shallow working levels, the underground mining space is progressively flooded by the rising groundwater table, and the groundwater environment affected by mining activities is consequently altered or even polluted.
Figure 1.
The PZ closed coal mining area with a cross-sectional map of hydrogeology.
2.1.2. Multi-Layer Aquifer System
The study region is a transitional zone between an alluvial plain and a hilly area, where the Quaternary cover thins toward the northeast and thickens toward the northwest, with an average thickness of approximately 76 m. Ground elevations range from about +35 m in the plain to +180 m in the hilly area, and the mean annual precipitation varies between 600 and 800 mm. To the southeast of the mine, Cambrian and Ordovician limestone hills crop out and serve as the principal recharge area of the groundwater system, the highest point being Jiuli Mountain at +173.2 m. Confined groundwater generally flows from southeast to northwest, recharged by the low outcrop mountains in the southeast and discharged through mining drainage and dewatering. The Jinghang Canal and the Fei Yellow River traverse the region (Figure 1), and several subsidence pit lakes have formed as a result of underground mining.
The study area lies on one limb of a synclinal structure (Figure 1, bottom right), where the thickness of each stratum increases toward the alluvial plain. For modeling purposes, four representative aquifers were considered: the Quaternary sand and gravel aquifer (Q); the Permian Shanxi Formation aquifer (7S), which directly overlies the coal seams; the Carboniferous Taiyuan Formation limestone aquifer group (C2, abbreviated as L4); and the deep, thick Ordovician limestone aquifer (O). Aquifers 7S and C2 (L4) have historically been the most frequent sources of water inrushes into mining stopes. The Ordovician aquifer O is the most productive and is also regarded as a vital drinking-water source. Its piezometric level, ranging from +10 to +20 m, is higher than that of all other confined aquifers in the area, and the coal seam floor strata may locally be subjected to water pressures of up to 2–3 MPa. Owing to this property, aquifer O is assumed to act as a large and abundant pressure source for the upper limestone aquifers (C2/L4).
Natural faults and mining-induced fractures are widely developed in the area and may hydraulically connect the different aquifer layers. Previous site-specific studies in the PZ mining area using a combination of multivariate statistics and geochemical modeling [27,28] identified that the primary hydraulic connection between the deep carbonate aquifers (L4, O) and the shallow 7S aquifer is facilitated by vertical leakage through the intervening aquitards, particularly along permeable fault zones.
Before the transport modeling, the authors sampled water and measured the samples on-site (using WTW3430 Munich Germany, Merck titration kit (Merck, Germany) and test papers) after the coal mine closed at the very time. In the laboratory, ICP-MS (Thermo Fisher, USA) and a photometer (Hach, USA) were used to illustrate the concentrations of major ions and elements. The brief result can be found in Table 1, which is also employed in the following transport section, providing the initial conditions of each aquifer.
Table 1.
Brief chemical characteristics of sampled waters in and around the PZ closed coal mining area (element unit: mg/L).
2.2. Coupled Transport Modeling Methodology
2.2.1. Controlling Equations for the Transport Model
The controlling equation for transport in FEFLOW [29] is shown as follows. It describes multi-species reactive transport, considering both homogeneous and heterogeneous media. The following form is a revised version based on the FEFLOW reference book [29], with the assumption that each species only exists in one single phase.
where
;
where each species i is tied to a particular phase (f,s),
is the concentration of species i in phase ;
is the tensor of hydrodynamic dispersion of species i in phase ;
is the coefficient of molecular diffusion of species i in phase ;
is the unit tensor;
is the total number of chemical species;
is the zero-order nonreactive production term on phase ;
is the Darcy flux in phase ;
is the bulk rate of the chemical reaction of species i;
is the homogeneous rate of the reaction of species i in phase ;
is the heterogeneous rate of the reaction of species i in phase ;
is the volume fraction in phase .
2.2.2. Groundwater Flow and Coupled Transport Modeling Approach
The proposed approach first uses FEFLOW (Version 7.0) to establish the groundwater flow field and then applies it to a multi-species transport model. Since the flow model alone cannot fully capture the detailed geochemical processes governing variations such as dissolution, ion exchange, and other reactions, PHREEQC [30] is then used to simulate the corresponding geochemical reactions and gain deeper insight into the processes involved.
piChem [31] is a plug-in program for FEFLOW that was developed for advanced users to carry out geochemical processes in groundwater systems. It is a coupled interface that integrates the PHREEQC reaction engine within the FEFLOW modeling environment. piChem makes it possible to simulate complex 2D or 3D geochemical reactions in groundwater models. The general workflow of piChem coupled with FEFLOW is as follows: piChem first checks whether the associated files are consistent with the boundary conditions and nodal reference distribution; if not, the program stops. Then, piChem starts to analyze PHREEQC input models and calculates species concentrations. Afterwards, the PHREEQC components that participate in FEFLOW’s mass transport are added according to the placeholder species. The following step is to create an independent cell for every node in FEFLOW. The geochemical properties of the cells are then assigned to the nodal reference and the attached PHREEQC files. Subsequently, piChem adjusts the boundary and initial conditions of mass transport components according to PHREEQC-defined boundary files. In the end, an additional nodal reference distribution is constructed for previously defined PHREEQC output parameters.
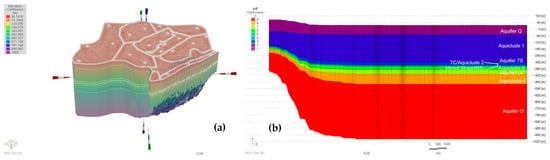
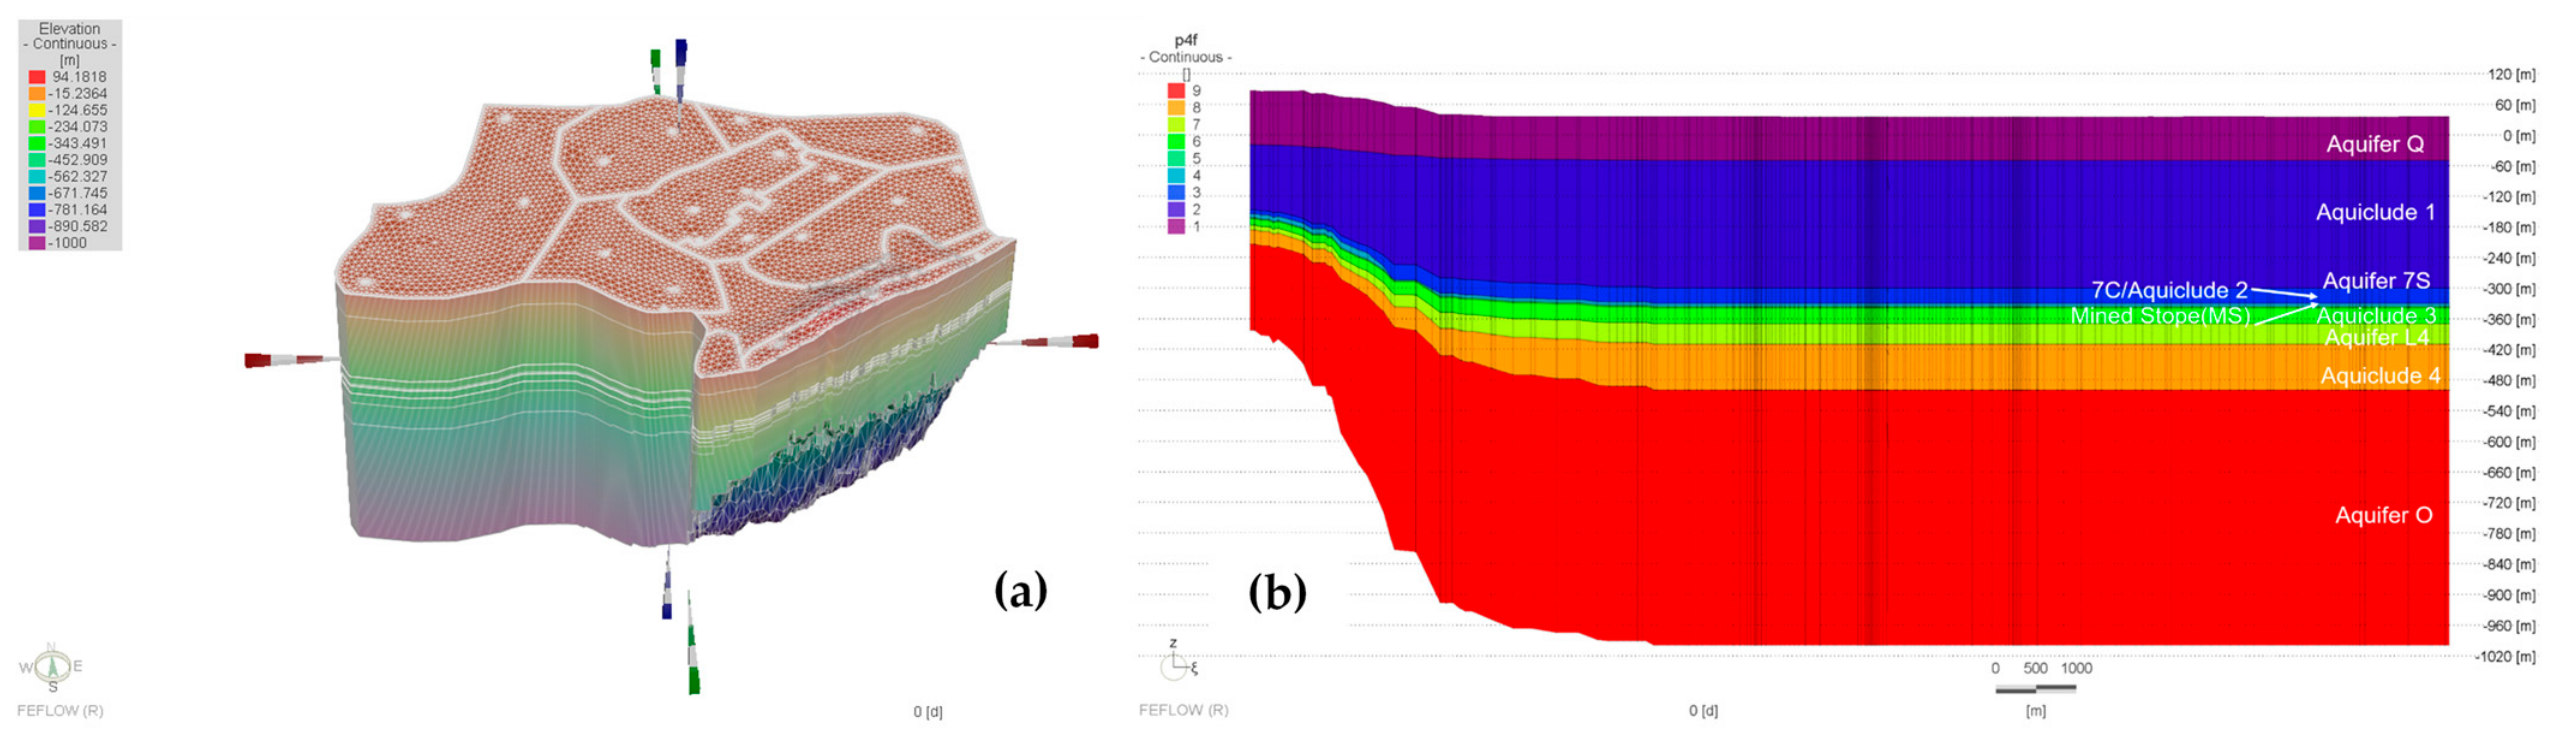
The established transport model is shown in Figure 2. The entire model contains 9 layers, 10 polygons, 177,615 mesh elements and 106,140 nodes altogether. The first slice was already assigned referenced elevations using IDW (inverse distance weight) interpolations in FEFLOW.
Figure 2.
Established 3D multi-layer model: (a) overall 3D view of the model; (b) piChem-coupled reactive transport cross-sectional view.
2.3. Determination of Flow and Transport Parameters
2.3.1. Aquifer Tests and Flow Model Validation
In the study area, the Fei Yellow River and the Jinghang Canal are located in the south and east, respectively. These rivers are hydraulically connected only to the unconfined Quaternary (Q) aquifer and thus were defined as a specified-head (first-type) boundary for the Q aquifer, with water levels of +40 m and +30 m, respectively. For the deeper, confined aquifers (7S, L4, and O), the riverbeds and the overlying aquitards effectively prevent direct surface water–groundwater interaction; consequently, these river boundaries were treated as impermeable (no-flow) boundaries.
In the southeast, the low small hills of Jiuli Mountain form the outcrop recharge region for these aquifers underground. To the north and northwest parts, there are several other coal mines there. So, for vertical boundaries, we assume that these coal mine boundaries are discharging boundaries with a certain volume of water inflow. For the vertical boundaries, two rivers are defined as impermeable boundaries.
The following initial heads of aquifers are defined for the first groundwater flow simulation of natural condition parameter sensitivity scenarios.
Aquifer Q: +30 m to +40 m, 1st BC: Fei Yellow River +40 m, Jinghang Canal +30 m.
Aquifer 7S: −258 m to −250 m, 1st BC: Jiuli Mt. −250 m, Small Channel −258 m, according to pressure data.
Aquifer L4: +10 m to +18 m, 1st BC: Jiuli Mt. +18 m, Small Channel +10 m, according to on-site measured data.
Aquifer O: +20 m to +28 m, 1st BC: Jiuli Mt. +18 m, Small Channel +10 m, according to on-site measured data.
Discharges were distributed among 6 mine shafts, each treated as a large well with basic pumping rates of 1000 m3/d.
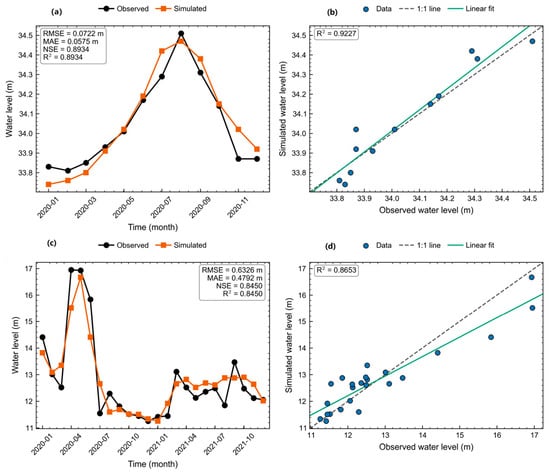
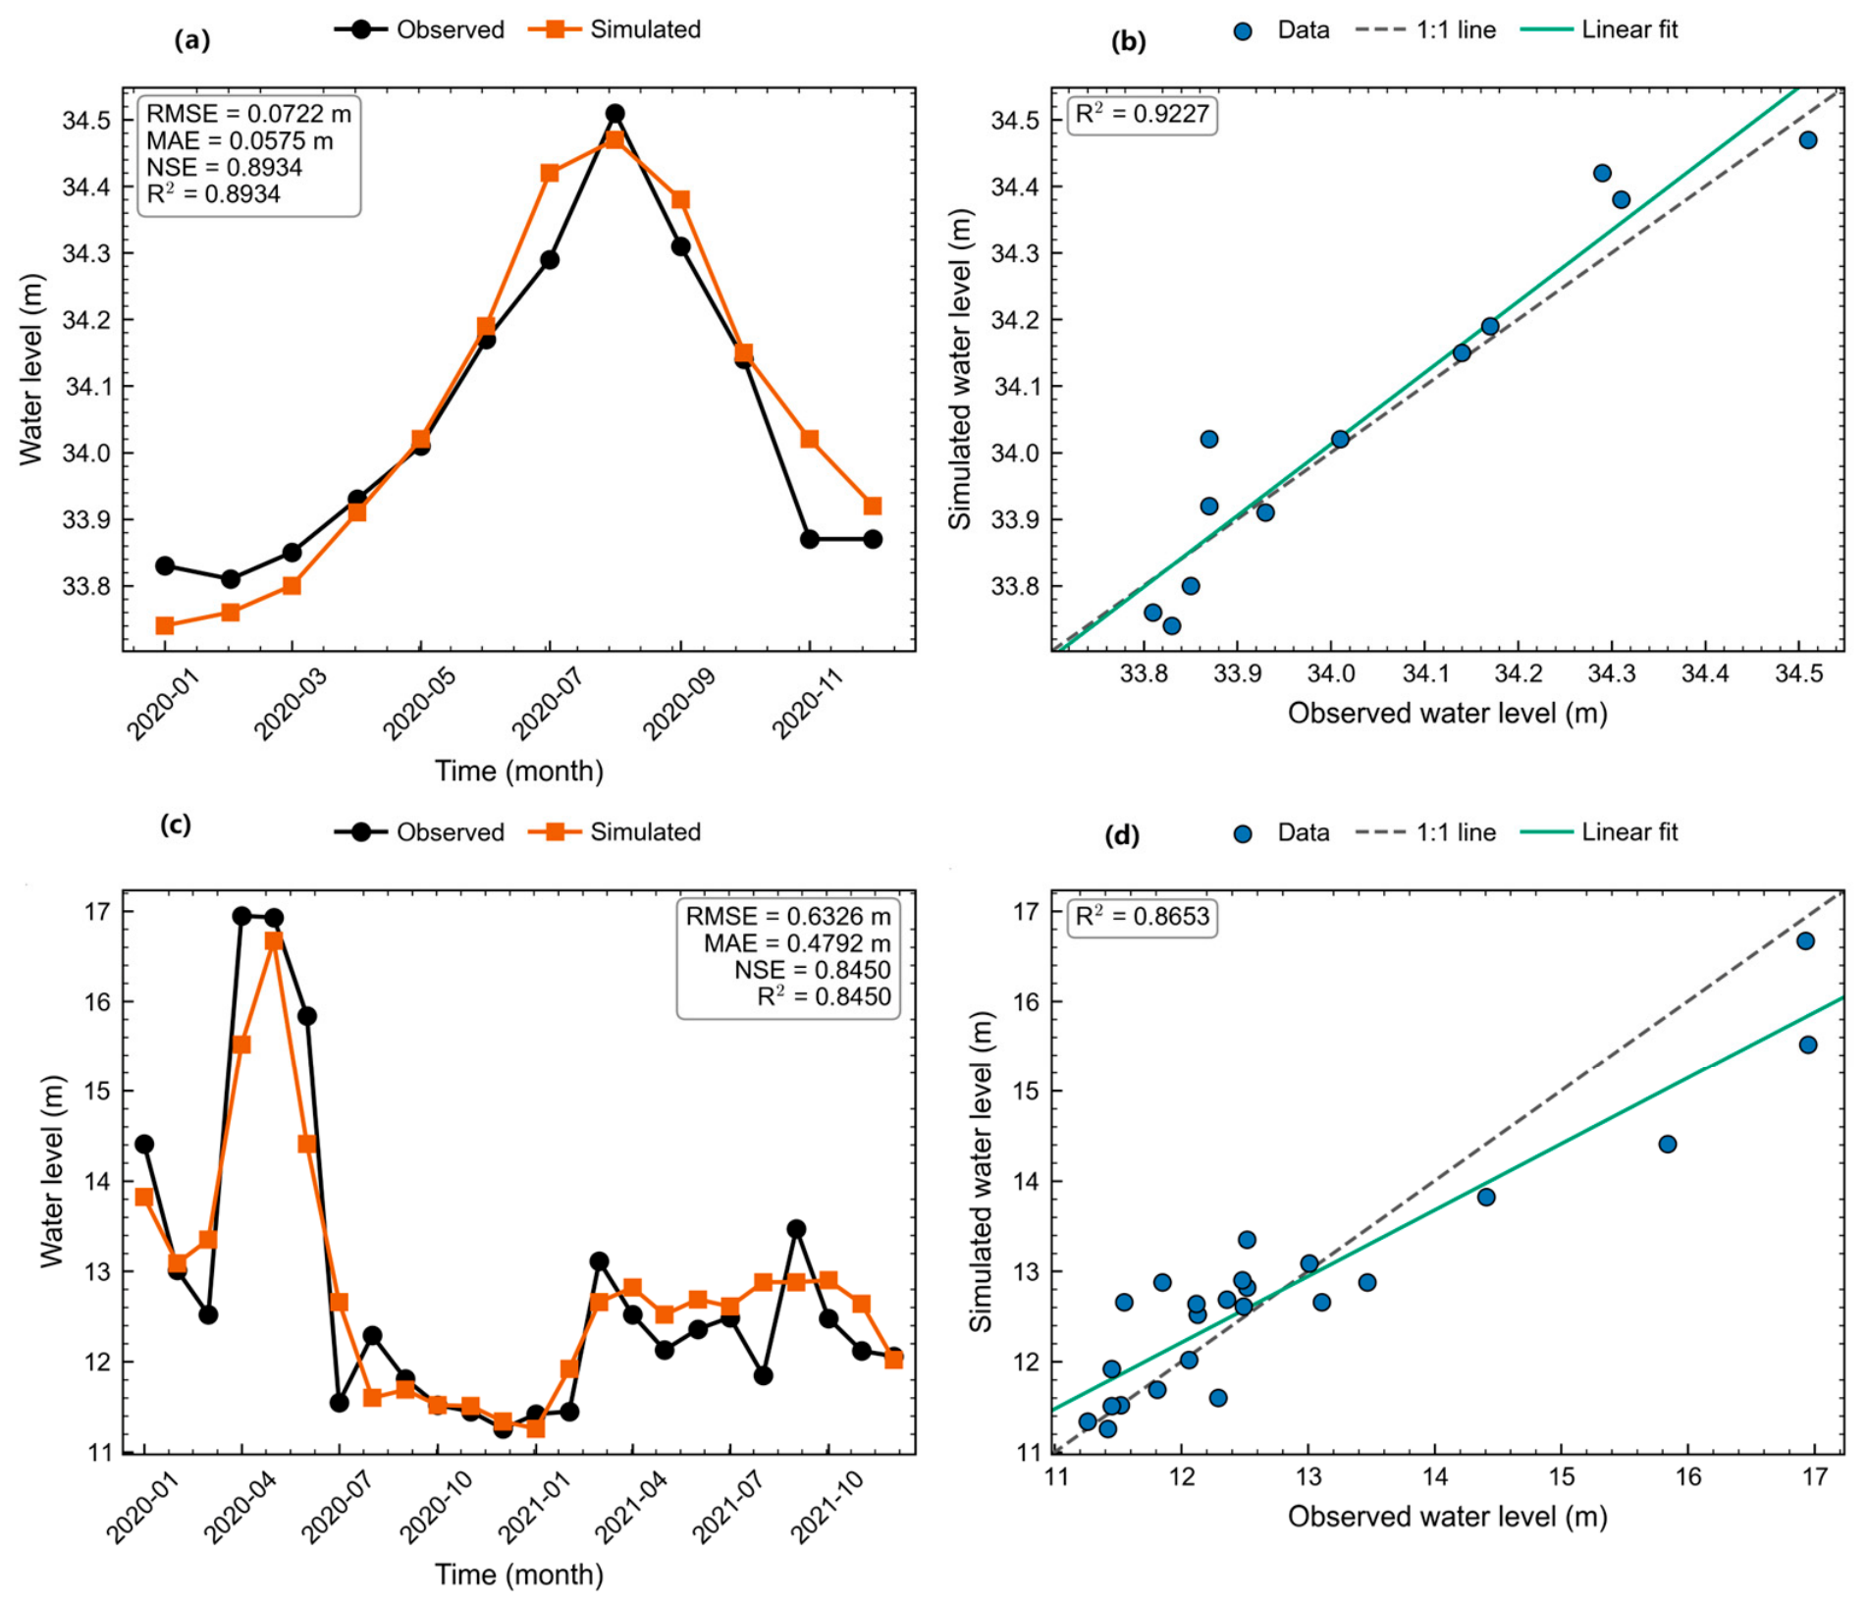
Aquifer rock cores were sampled from the PZ coal mine, and laboratory tests were carried out for hydraulic conductivity (see Table 2) and porosity. Before the transport modeling, a calibrated groundwater flow model was validated using time-series observations of groundwater levels (Figure 3) in Aquifer Q (R2 = 0.9227) and Aquifer O (R2 = 0.8653). It is important to emphasize that this validation applies only to the groundwater flow model, which provides the hydraulic basis for the subsequent transport simulations. The reactive transport model presented in the following sections, however, represents a forward prediction of post-closure hydrogeochemical evolution and, due to the absence of long-term (decadal) water quality monitoring data at this recently closed site, cannot be independently validated at present.
Table 2.
XRF results for aquifer rock samples.
Figure 3.
Calibration results for groundwater in Aquifers Q and O: part (a) depicts the observed vs. simulated water levels in Aquifer Q; part (b) depicts the correlation plot of fitting of Aquifer Q; part (c) depicts the observed vs. simulated water levels in Aquifer O; part (d) depicts the correlation plot of fitting of Aquifer O.
2.3.2. Transport Model Parameters
According to the laboratory tests, the initial porosity definitions are given as follows: Aquifer Q: 0.24–0.53, average 0.38; Aquifer 7S: 0.06; Aquiclude 7C: 0.21–0.41, average 0.31; Aquifer L4: 0.014–0.25; Aquifer O: 0.08–0.25. The rock samples were also scanned with XRF for transport potential reactants. The results are included in Table 2.
The element distances along the flow direction range from approximately 13 m to 400 m. From Figure 2a, it is obvious that most of the concerned area (central PZ closed mine) is approximately 100 m. To follow the Peclet number restriction, the minimum longitudinal dispersivity calculated coarsely from 100 m is about 50 m. Then, the transverse dispersivity is tied to longitudinal values with a ratio of 1/10. The aquifers and aquicludes are already analyzed in the previous section. According to their lithology and porosity, the transport parameters can be defined as Table 3.
Table 3.
Defined transport parameters.
The mined stope (goaf) is assigned a relatively small longitudinal dispersivity of 50 m because it is a localized, highly permeable disturbed zone with short and well-connected void/fracture pathways, whereas the 7S sandstone aquifer is a regional, strongly heterogeneous aquifer with much longer advective transport distances and thus requires a larger value of 200 m. The Q aquifer is set to an intermediate value of 100 m, consistent with its relatively homogeneous Quaternary porous-medium character; these values also satisfy the Peclet number constraints for the 100 m grid and are supported by the sensitivity analysis in Section 3.3.
2.4. Uncertainty and Sensitivity Analysis Method
2.4.1. First-Order Second-Moment (FOSM) Approach
The First-Order Second-Moment (FOSM) method is a widely used approach for uncertainty propagation in groundwater modeling [32,33]. It approximates the uncertainty of model outputs by linearizing the model response at the nominal parameter values using the sensitivity coefficients and propagating the parameter variances. For a model output C (concentration of a given species) that depends on n parameters P1, P2, …, Pn, the total variance of C is estimated as follows:
where ∂C/∂Pi is the sensitivity coefficient of concentration C with respect to parameter Pi (obtained from the sensitivity analysis in Section 3.3), and σ_Pi is the standard deviation of parameter Pi, representing its uncertainty range.
σ2_C ≈ Σi (∂C/∂Pi)2 · σ2_Pi
2.4.2. Sensitivity Coefficients
In order to discuss which of the parameters influence the transport result most, Equation (4) is introduced to evaluate sensitivity:
where
P − Cm = (Cim − Cjm)/[(Pi − Pj)/Pj]
P—parameter type (αL, αT or ϴ);
Cim—concentration of species m under i scenario, ML-3;
Cjm—concentration of species m under j scenario, ML-3;
m—species id number, L;
Pi—parameter value under i scenario;
Pj—parameter value under j scenario.
2.4.3. Monte Carlo Simulation
The uncertainty ranges of the transport parameters were assigned based on literature values and laboratory measurements:
Longitudinal dispersivity (αL): The coefficient of variation (CV) = 30%, based on field-scale dispersivity studies [34,35,36]. Gelhar et al. [34] reported that field-scale longitudinal dispersivities typically exhibit log-normal distributions with a CV of 0.3–0.5; we adopt the conservative lower bound of CV = 30%.
Transverse dispersivity (αT): CV = 30%, consistent with the ratio of αT/αL = 0.1 adopted in the model and the typical uncertainty in dispersivity estimates.
Porosity (θ): CV = 15%, based on the laboratory measurements of core samples from the study site (Table 3 in the manuscript), which show a range of 0.24–0.53 for Aquifer Q (mean 0.38) and 0.21–0.41 for Aquiclude 7C (mean 0.31).
Since the sensitivity coefficients represent the concentration change per 10% parameter perturbation, the per-unit sensitivity (∂C/∂P per 1% change) is Si/10. The uncertainty contribution of each parameter is therefore
where Si is the sensitivity coefficient (mg/L per 10% parameter change), and CVi is the coefficient of variation of parameter i in percent.
σ_Ci = (Si/10) × CVi (%)
The total standard deviation of the predicted concentration is
σ_C = √(σ2_C,αL + σ2_C,αT + σ2_C,θ)
The 95% confidence interval (CI) is computed as ±1.96 × σ_C, assuming an approximately normal error distribution. This provides a practical uncertainty bound for the model predictions, enabling assessment of the robustness of the hydrogeochemical evolution forecasts.
To characterize the full probability distribution of the model predictions beyond the first-order approximation, a post-processing Monte Carlo simulation [37,38] was performed. Using the FOSM-derived parameter standard deviations, 10,000 random samples were generated for each uncertain parameter assuming normal distributions centered at the nominal values. This approach is computationally efficient as it does not require re-running the coupled model. Additionally, to verify the results and capture potential nonlinearities, we performed a limited number (n = 500) of actual forward model runs using Latin Hypercube Sampling (LHS), which ensures efficient coverage of the parameter space. The resulting concentration predictions were then analyzed using kernel density estimation (KDE) and cumulative distribution functions (CDFs).
This combined FOSM–Monte Carlo framework provides a comprehensive characterization of prediction uncertainty. The FOSM method offers analytical variance decomposition by parameter, while the Monte Carlo simulation captures the full distributional properties and validates the underlying assumptions.
3. Results
3.1. AMD Evolution Driven by Pyrite Reactants
Since pyrite is the major cause for the formation of AMD, the scenario is set up on the basis of the following assumptions. The pyrite content of the coal seam roof in the study area is up to a maximum of 2%, as determined by XRF analysis of core samples (Table 2). According to the average densities of the coal seam and rock, the potential pyrite concentration in PHREEQC is set to 0.225 mol/L. This value is consistent with the range of pyrite contents reported for Permian coals in the North China Coalfield [27,28].
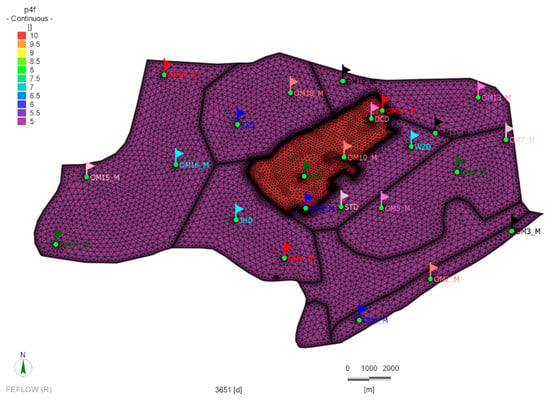
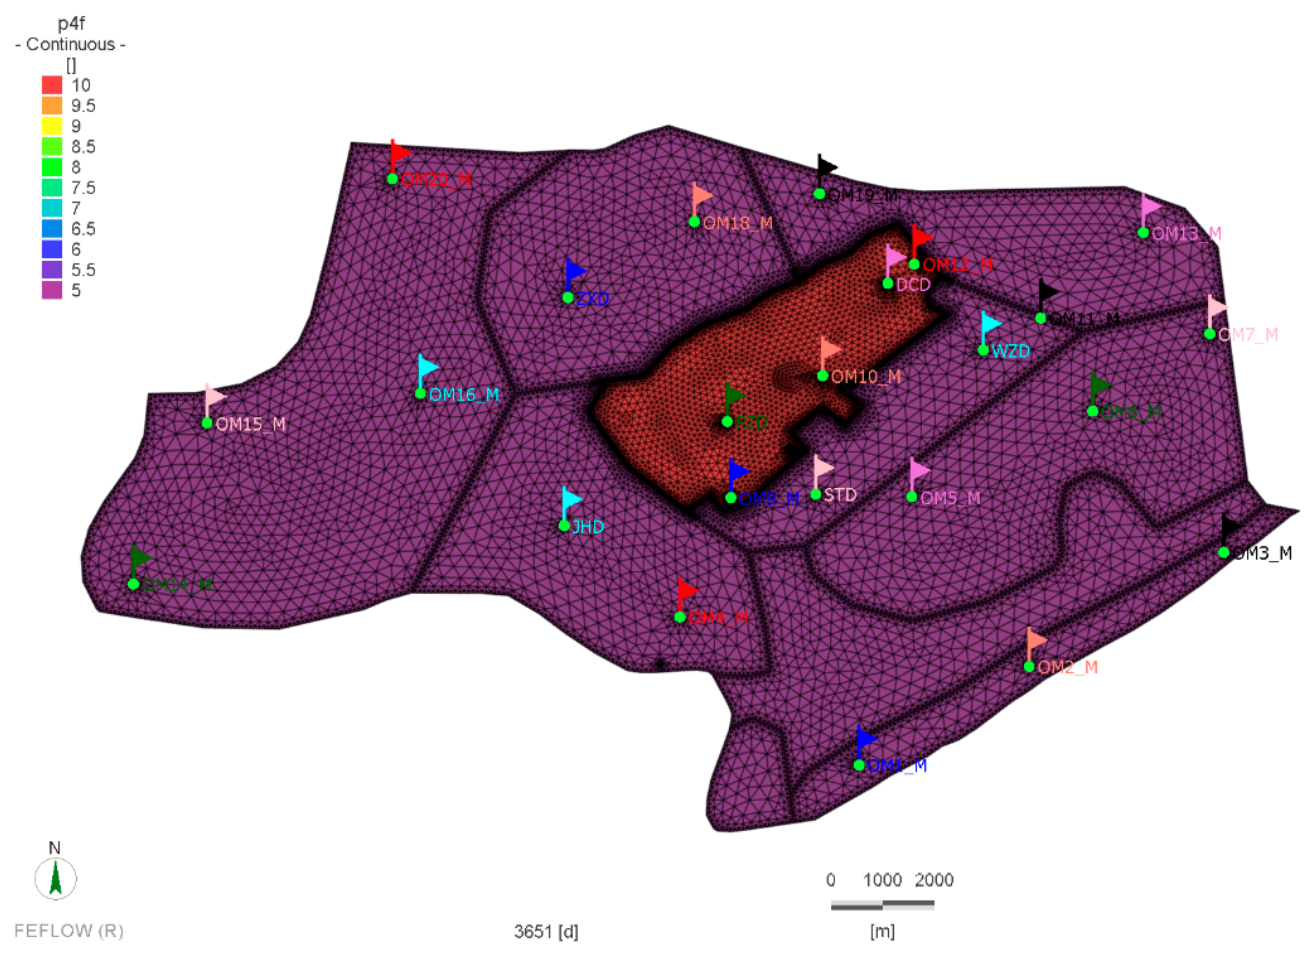
The initial mine water uses mine water reacted with pyrite, resulting in acidic water with a pH of around 2. Then, the water is treated as the initial AMD-source solution covering the roof slice of the MS layer in the closed PZ mine. The other initial solutions for the other layers are given in Table 1. The pyrite-driven AMD is set as a non-point pollutant source in the red PZ area in Figure 4 (red color area), with more than 24 observations in the model domain. There are hydraulic connections between the deeper carbonate and shallow 7S (including the mined stope) aquifers [27].
Figure 4.
Pyrite-driven AMD non-point pollutant source in the closed PZ coal mine: plane view map.
The boundary conditions of groundwater chemistry inherit the calibrated groundwater flow model. The simulation used minteq.dat as the database for water–rock interactions. The potential reaction mineral phases are listed in Table 4. The following minerals were treated as equilibrium phases, allowing dissolution or precipitation constrained by their respective solubility products (log K at 25 °C): calcite (CaCO3, log K = −8.48), dolomite (CaMg(CO3)2, log K = −17.09), gypsum (CaSO4·2H2O, log K = −4.58), and pyrite (FeS2, log K = −18.48). These minerals are widespread in the carbonate aquifers (L4 and O), the sandstone aquifer (7S), and the coal-bearing strata of the mined stope. It is important to note that pyrite was treated as an equilibrium phase in the present model rather than via kinetic rate laws. This simplification was adopted primarily to ensure numerical stability and convergence of the coupled FEFLOW–PHREEQC simulation over the large 3D domain (106,140 nodes) and the 10-year transient period.
Table 4.
Assigned potential reactions in each layer in the transport model.
Cation exchange on clay mineral surfaces in the aquicludes (particularly the 7C layer) was simulated using the PHREEQC EXCHANGE keyword, with exchange coefficients for Na+–Ca2+ and Na+–Mg2+. Equilibrium with atmospheric CO2 (log PCO2 = −3.5) was assumed for the unconfined Q aquifer. The AMD source in the mined stope was initialized with the acidic solution resulting from pyrite equilibrium.
3.2. Post-Closure Temporal and Spatial Hydrogeochemical Distributions
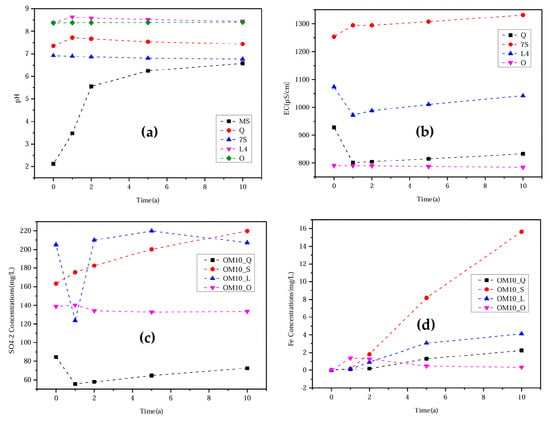
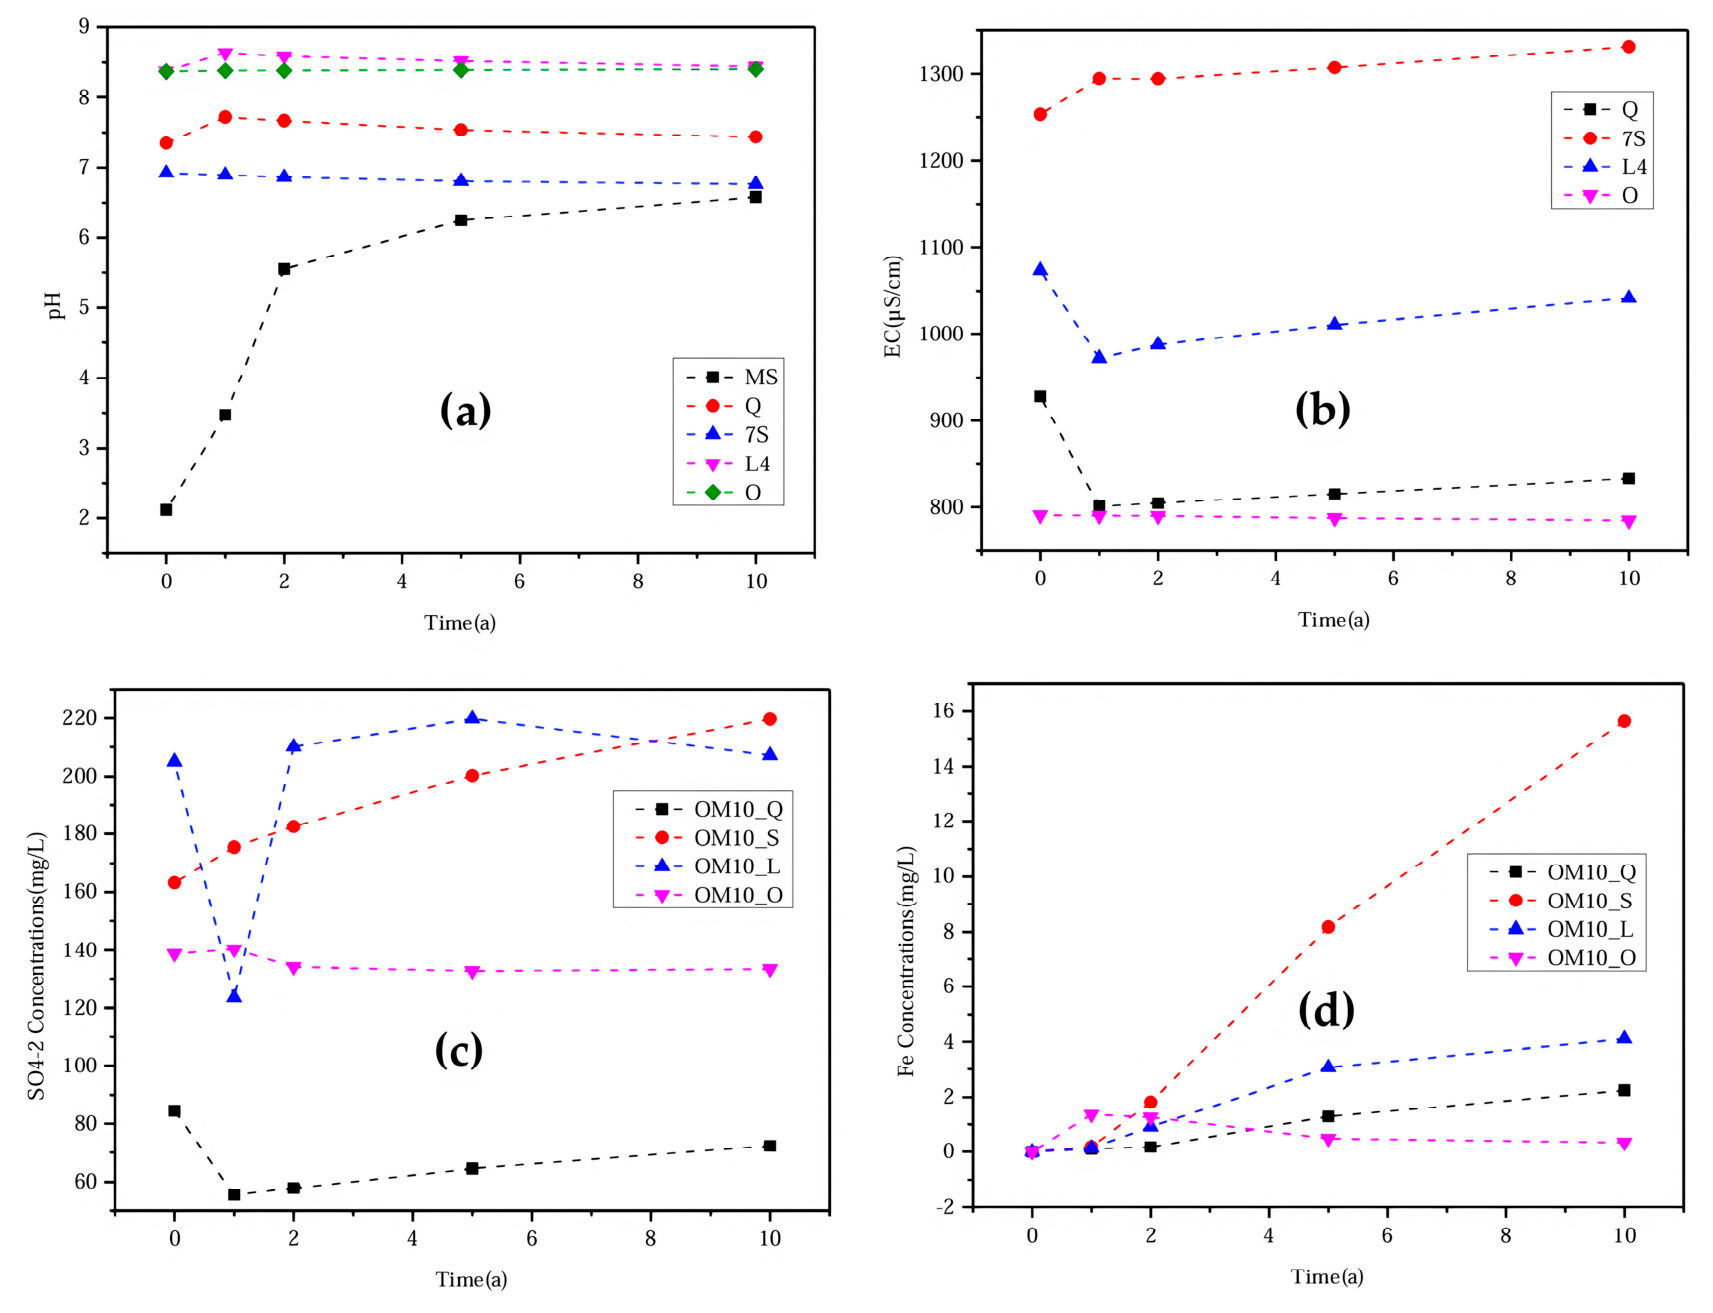
Given that the scenario involves AMD, the analysis focuses primarily on the temporal and spatial variations of pH, EC, and sulfur and iron species in the groundwater system to assess contamination. Figure 5a presents the predicted pH evolution in each layer over time. The waters of Aquifers Q, L4, and O remain relatively stable and stay alkaline throughout the post-closure period. In Aquifer 7S, however, the pH decreases from about 6.9 to 6.7, tending to become more acidic. In the AMD source area of the PZ mine, the MS water pH increases from 2.1 to 6.6 as expected, having already risen to 5.6 after 5 years. Notably, the pH of the MS water in the PZ area increased more rapidly in the first 5 years than in the subsequent 5 years, indicating that the flooding process diluted the AMD as alkaline water entered the closed mine area.
Figure 5.
Evolution of hydrogeochemical parameters and ions in aquifers 1, 2, 5, and 10 years after closure: (a) pH; (b) EC; (c) SO42−; (d) Fe species (total Fe).
The EC value variations of the MS water in the closed mine area explain the dilution and transport of the concentrated AMD-polluted water (Figure 5b). Waters in Aquifers Q and L4 have minor drops in the first year, while the EC value in Aquifer 7S increases throughout the entirety of the predicted time. The slight EC decrease in the Q and L4 aquifers during the first year is likely a dilution response to the initial post-closure recharge. The mine water discharge is mainly composed of the closest L4 limestone water. Therefore, when closure starts, the groundwater level rises, and the dilution and buffering processes lead to decreases in EC values (and SO42− also decreases). For Aquifer Q, the slight decrease could be explained by the precipitation process in the initial year of modeling. As the closure period continues, the EC of each aquifer water rises subsequently. The EC values of Aquifer O’s water remain stable.
Figure 5c,d present the predicted results for specific species of sulfur and iron. The increases in sulfate and iron species concentrations in Aquifer 7S’s water are both evident compared with those in the other aquifers. The contamination of the nearest overlying aquifer from the closed mine could thus be confirmed. Additionally, from the results of iron species variations, Aquifers Q, L4, and O are also involved, but the amounts of iron in these aquifers are not large. Nevertheless, according to the national groundwater quality standard of China, iron ions for human use should be less than 0.3 mg/L; therefore, Aquifers Q, L4, and O could also be regarded as contaminated because their predicted iron concentrations range from 0.34 mg/L to 14 mg/L.
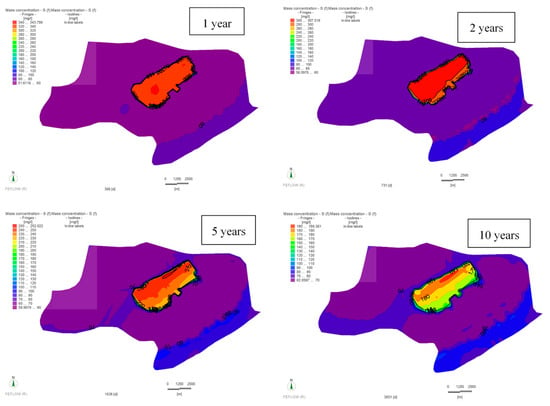
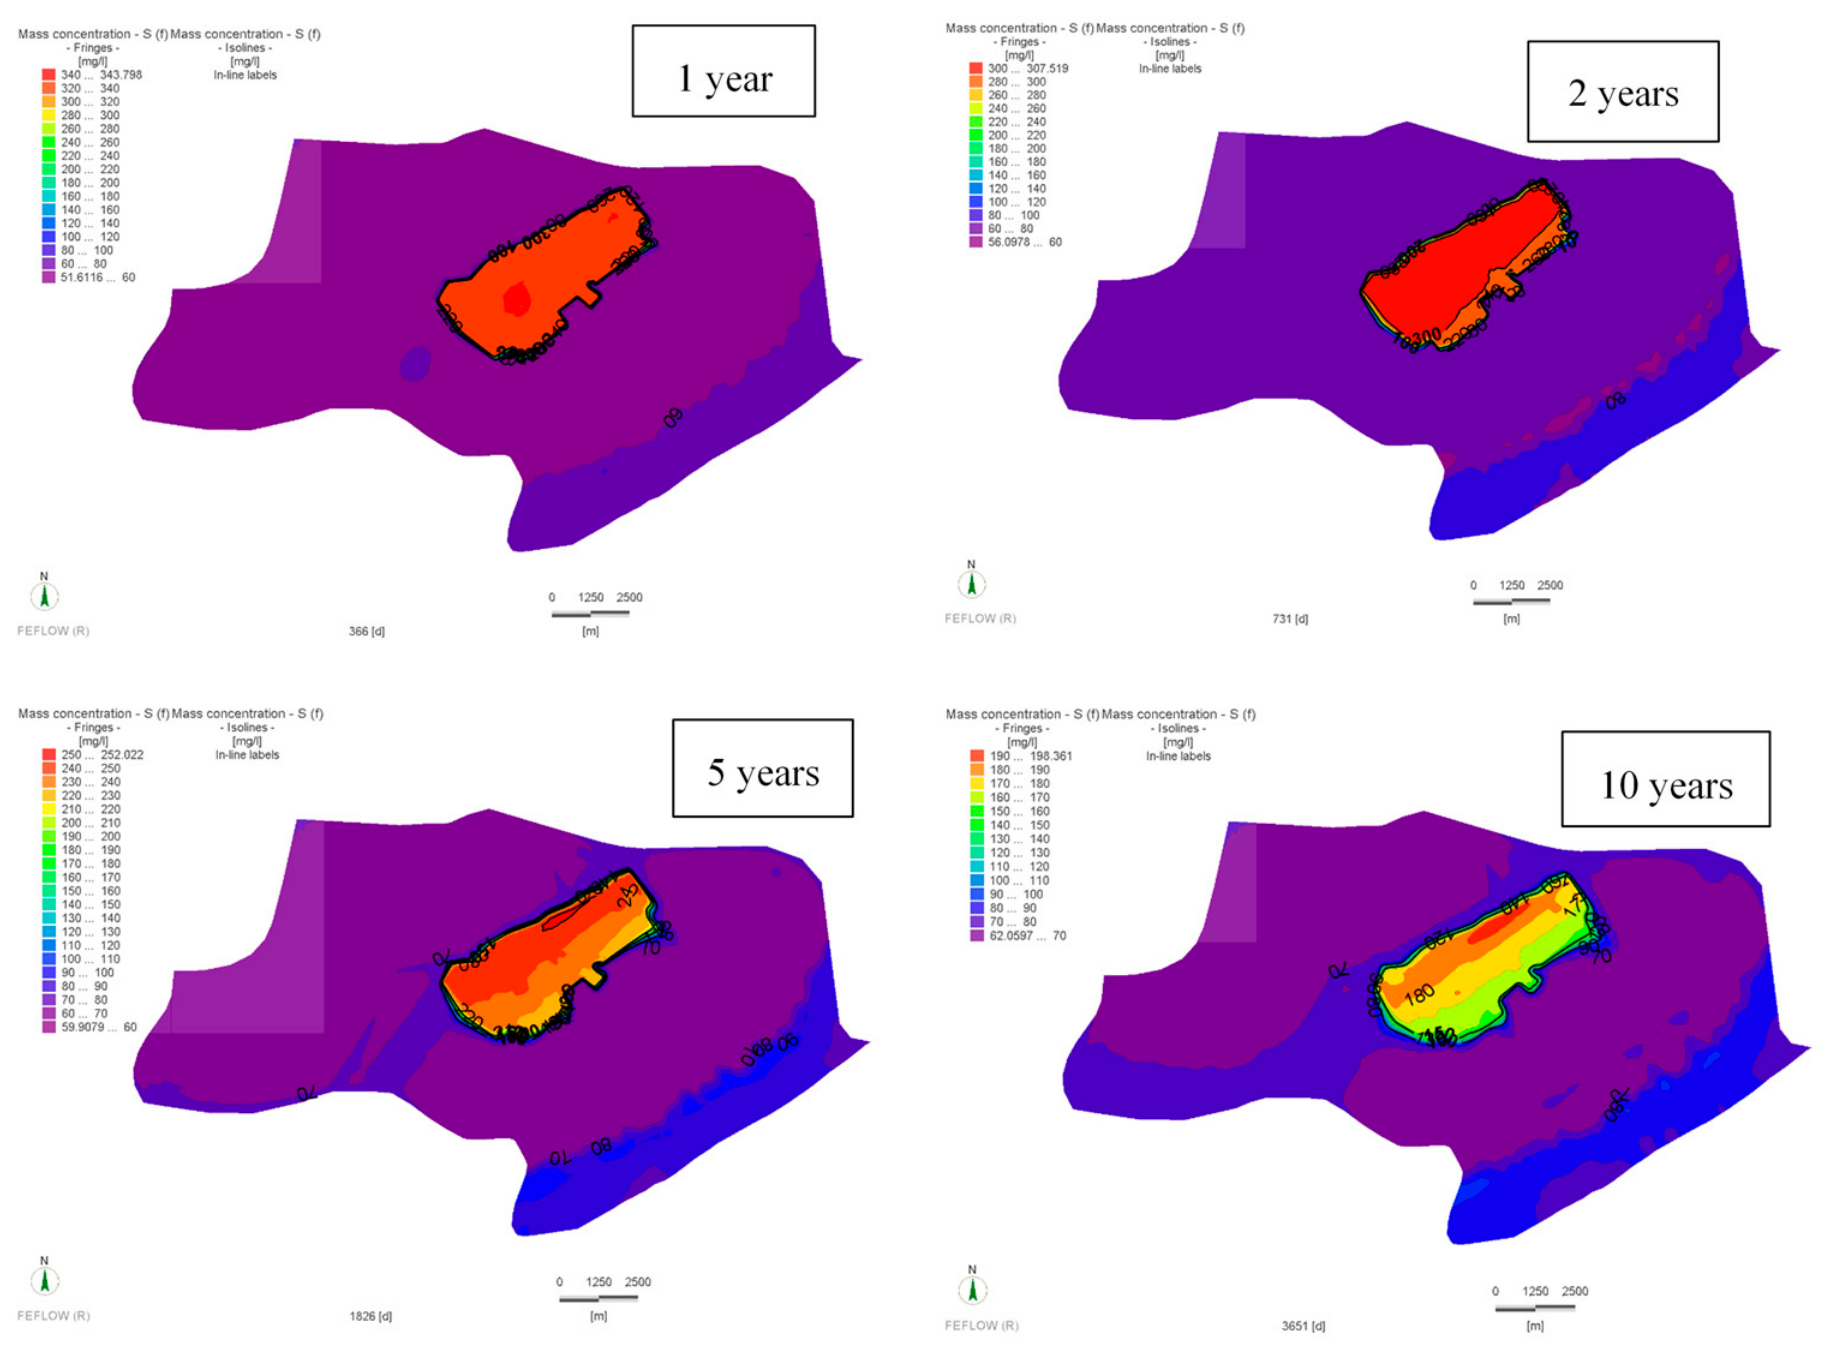
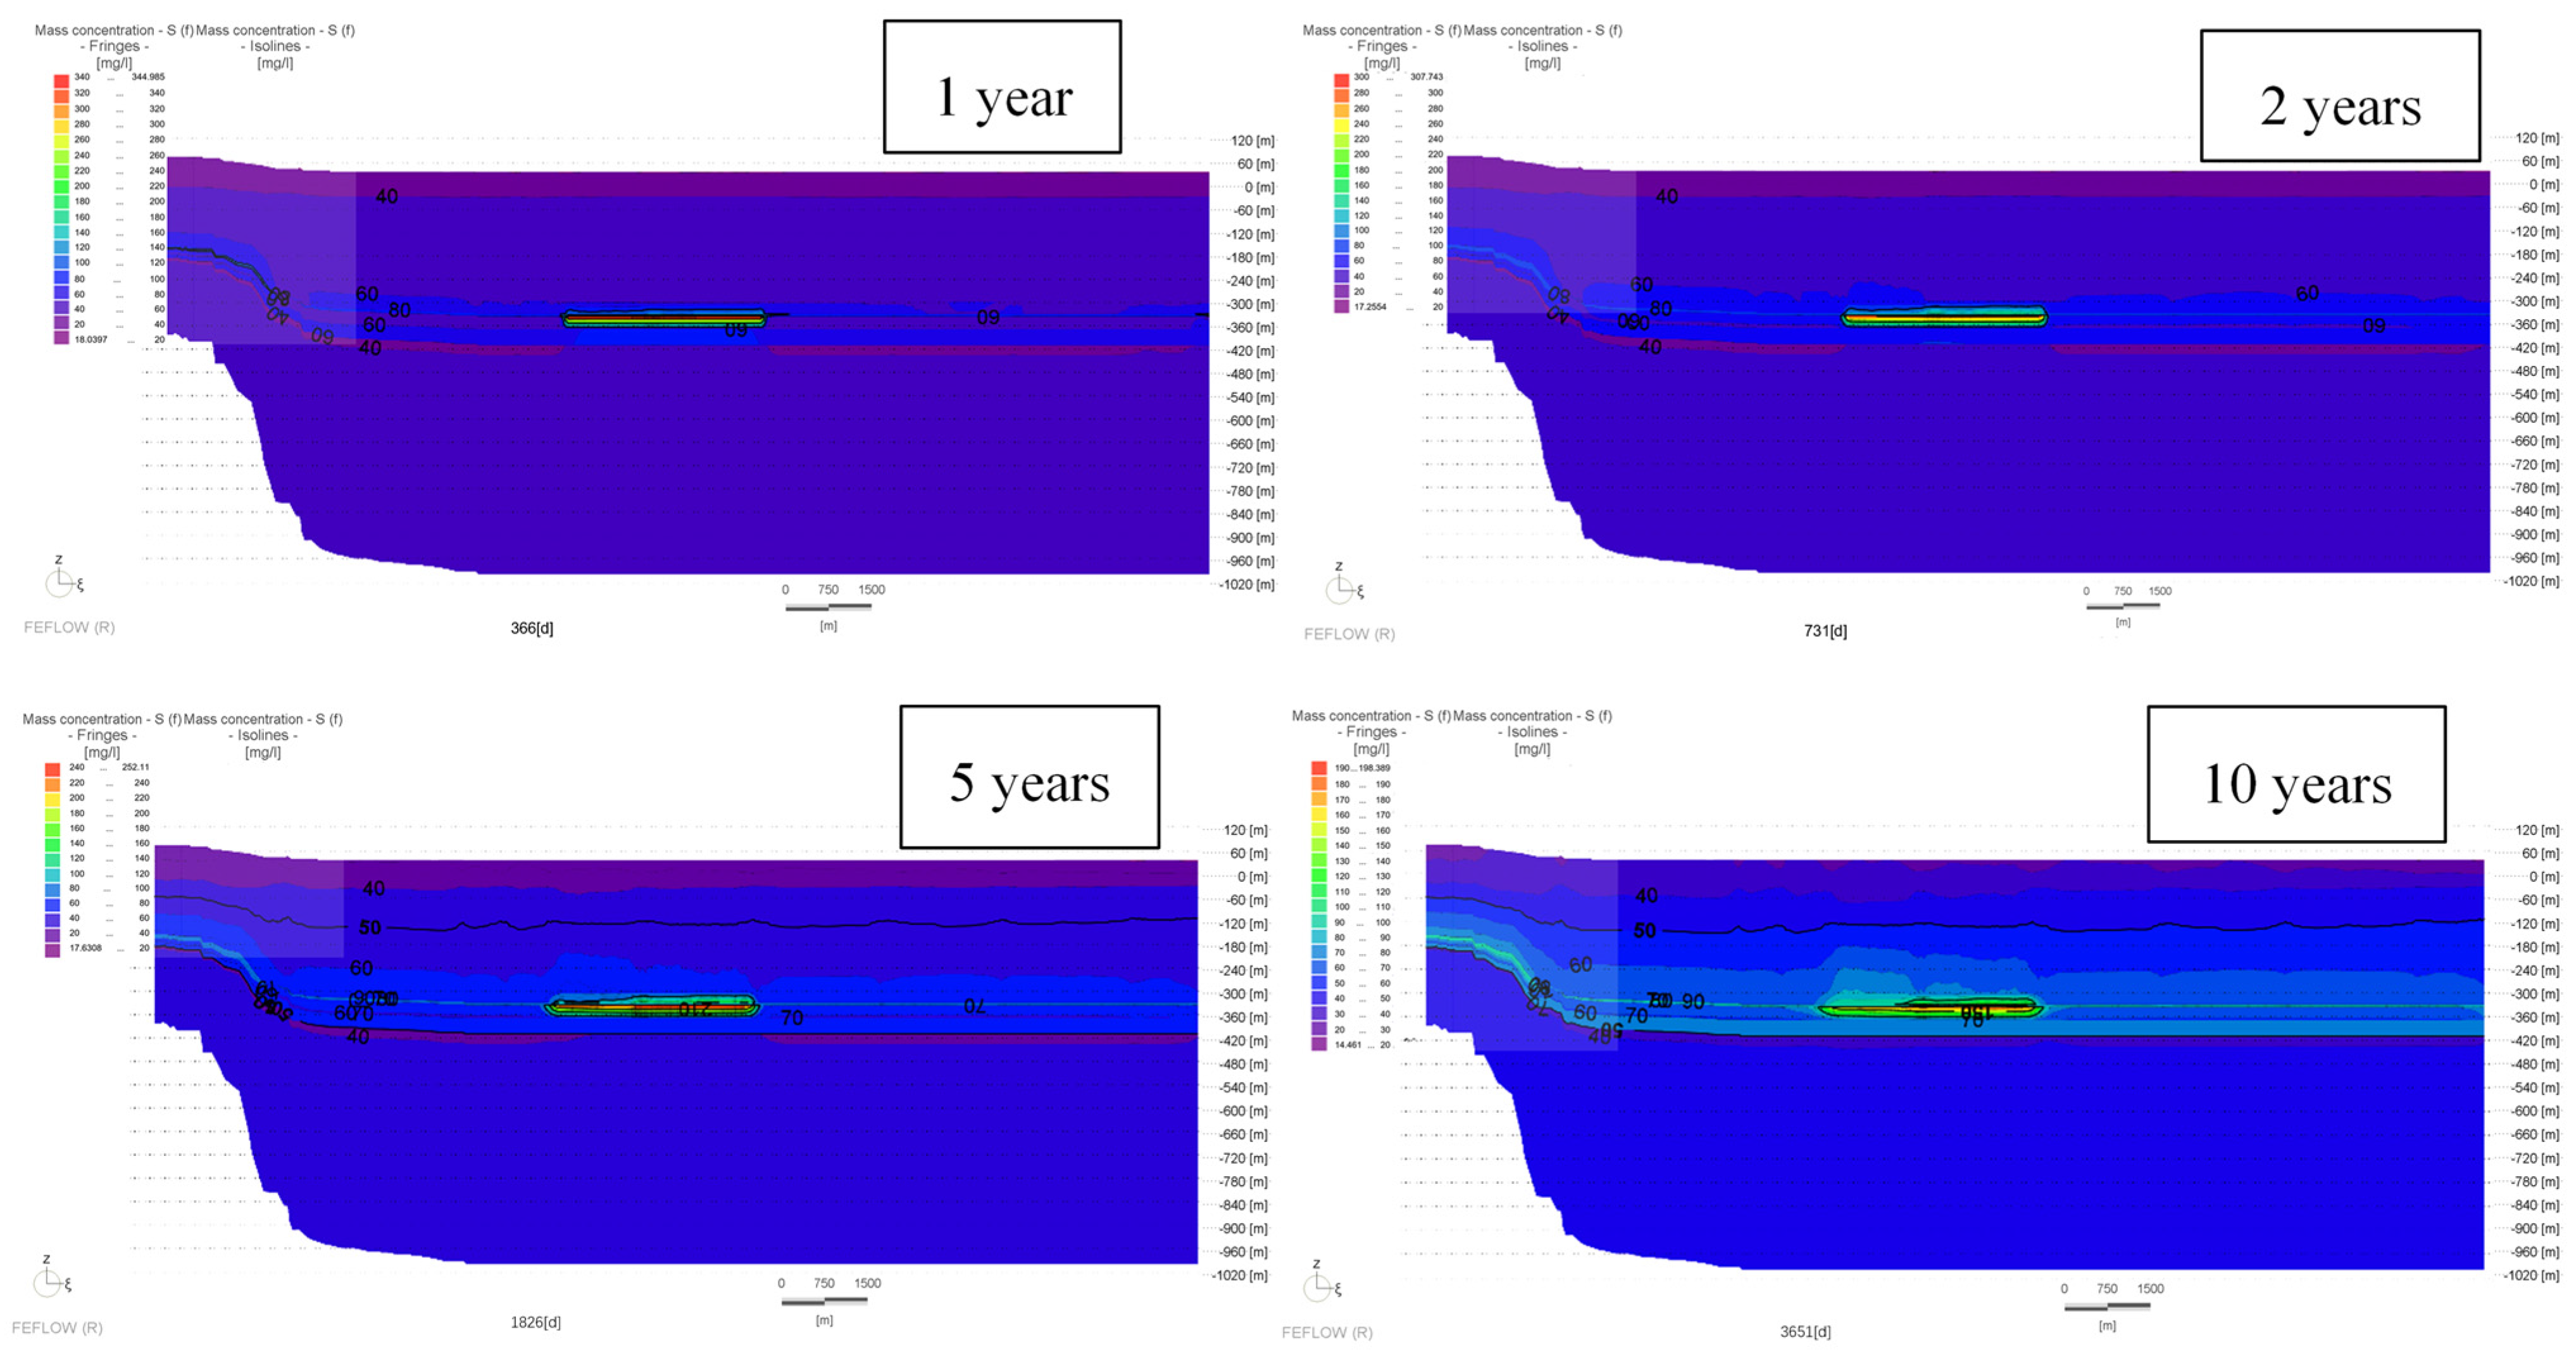
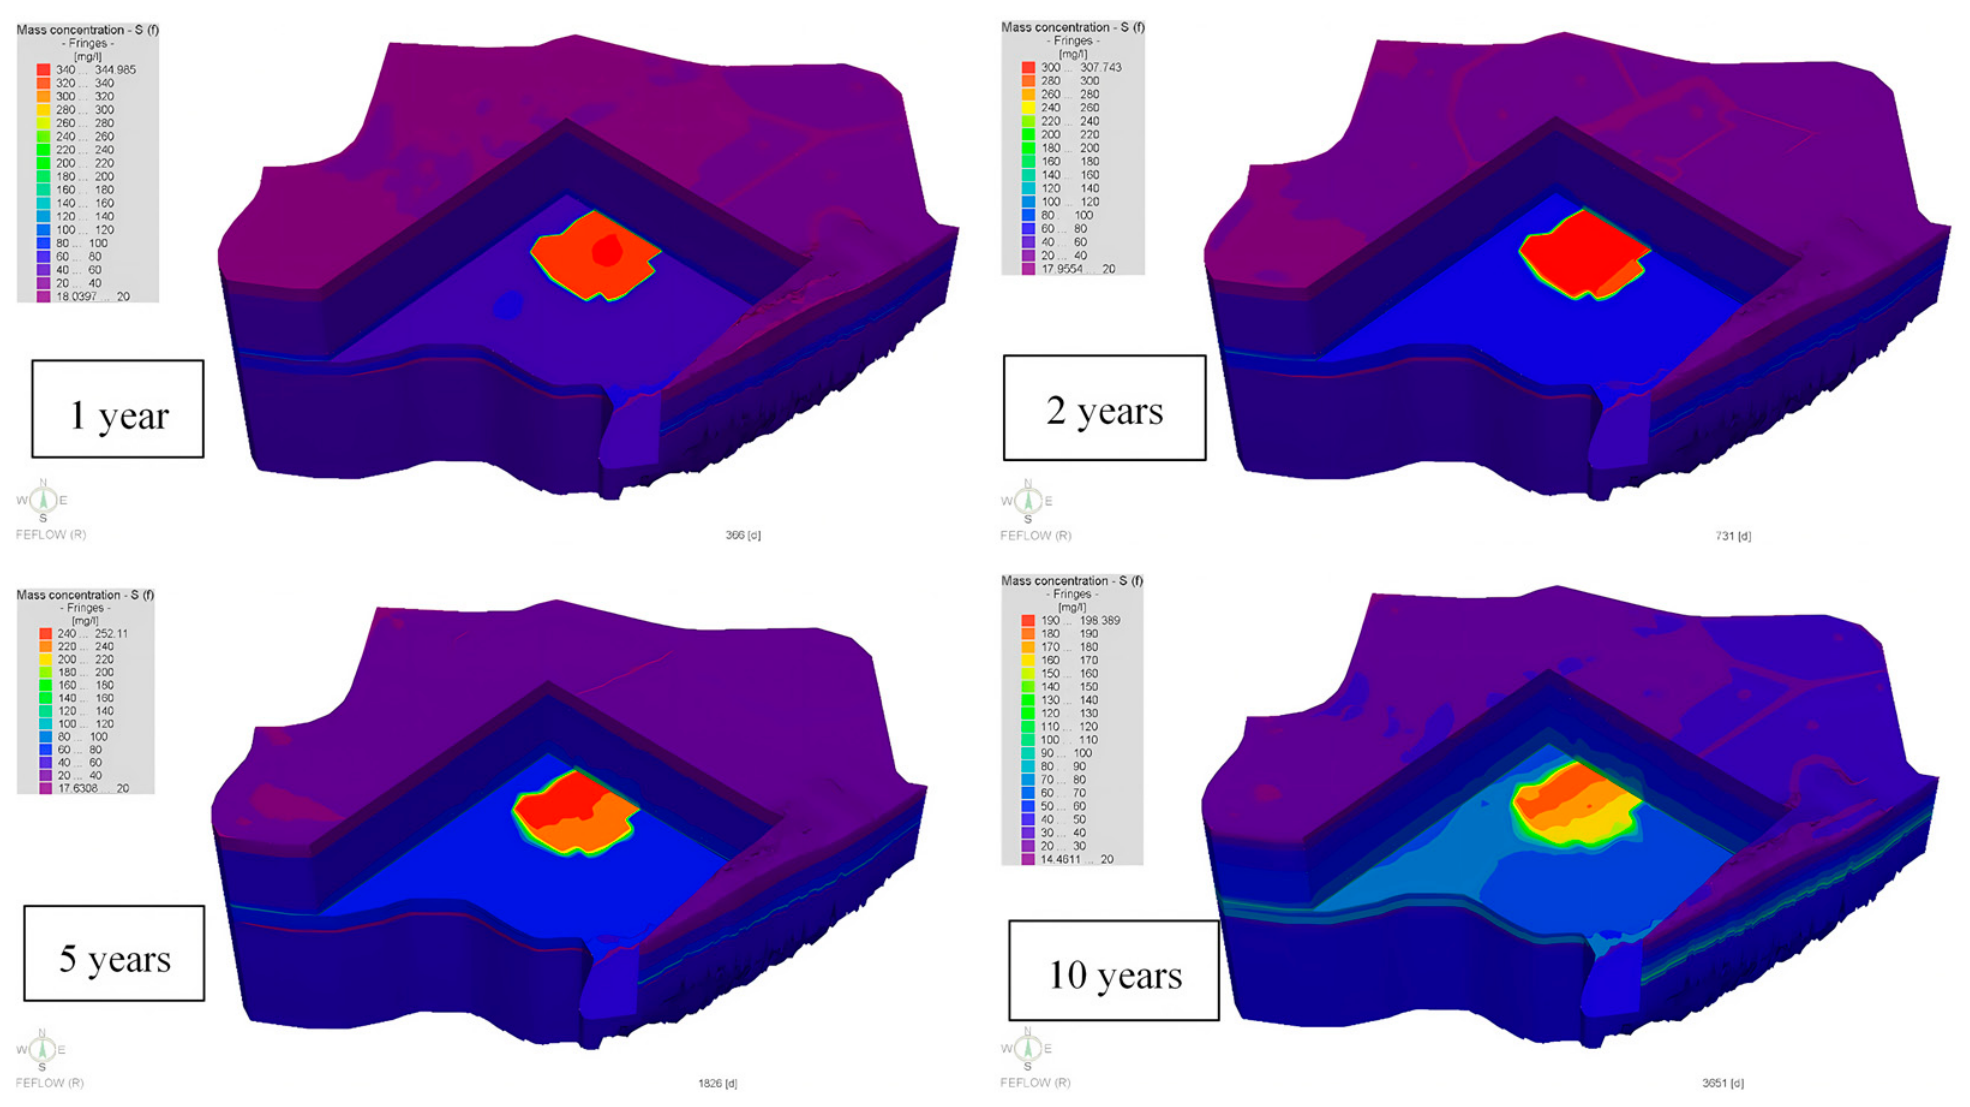
The distributions of sulfur species in MS and 7S waters differ. In MS water, after 2 years, the source concentration begins to spread in the layer, and the boundary gradients become less steep than at the initial time. The peak concentrations of sulfur move along the flow direction toward downstream areas. In Figure 6, it can be clearly seen that the final peak sulfur concentration is located in the upper right corner of the closed area.
Figure 6.
Distribution of S(6) in MS at 1, 2, 5 and 10 years: the SO42− concentration, an AMD indicator, has decreased over time in the closed mined stope; the peak concentration of it dropped from a maximum of 344 mg/L to 198 mg/L, and its distribution range also decreased.
The predicted cross-sectional distribution of pH describes the variation trend at various depths (Figure 7). For example, in the middle mining-affected layers, lower pH values occur in the downstream zones of the groundwater. The acidic AMD water reaches the 7S aquifer after 2 years. The floor L4 aquifer seems to be less affected by the AMD and stays alkaline during most of the prediction time. Figure 7 and Figure 8 clearly illustrate the impacted area by showing high concentrations of sulfur species from AMD. The closest aquifer 7S is confirmed as the main polluted aquifer. As analyzed previously, the peak concentrations decrease over time and are transported toward downstream areas in the closed mined stope. The flooding of the closed coal mine accelerates the transport process, because after 5 years, the distribution is not as concentrated as it was initially.
Figure 7.
Cross-sectional distribution of S(6) along Line 11 at 1, 2, 5, and 10 years: the spread of the AMD pollution plume primarily affects the 7S aquifer, which is the closest aquifer above the mined stope.
3.3. Sensitivity of Transport Parameters
Three major parameters are selected: longitudinal dispersivity, transverse dispersivity, and porosity. Each of the concerned parameters of the mined stope layer (abbreviated as MS), –αL, αT, and ϴ, will be elevated by 10%, with no other variations in parameters. The calculated sensitivity results of the major reactive ions (Na+, Ca2+, Mg2+, HCO3−, SO42−) are listed in Table 5 below.
Table 5.
Calculated sensitivity results of different parameters with respect to major species.
The results indicate clear differences in sensitivity. When comparing the three major transport parameters, αL and ϴ are more sensitive than αT. αL and ϴ have similar sensitivities in at observation well OM10_M and dewatering well PZD. After elevating the two parameters by 10%, concentrations of species in observation wells increase, while decreasing in the dewatering wells. At OM10_M, the porosity is slightly less sensitive than longitudinal dispersivity; however, on the contrary, at PZD, the longitudinal dispersivity is more sensitive than porosity. αT has limited effects on both observation wells and dewatering wells, and it could be regarded the least influential parameter for the transport model.
Regarding sensitivity difference between diverse species, most of the parameter sensitivities have the same trend—SO42− > Ca2+ > HCO3− > Na+ > Mg2+—no matter where the concentrations are located. One exception is at OM10_M, when changing αT, the order varies among Ca2+, HCO3− and Na+. It could be concluded that the most sensitive species is SO42− as gypsum dissolution is included in the groundwater system. Similarly, Ca2+ and HCO3− are also sensitive because of the defined reactions related to carbonates, especially calcite. Na+ is the second least sensitive ion in the water as cation exchanges from clay minerals are not dominant reactions in hydrogeochemical processes.
3.4. Uncertainty of Transport Parameters
To evaluate the robustness of the predicted hydrogeochemical evolution with respect to parameter uncertainty, a comprehensive uncertainty analysis was performed combining the First-Order Second-Moment (FOSM) method and Monte Carlo simulation, built upon the sensitivity coefficients obtained in Section 3.3. The FOSM method propagates parameter uncertainty through the model response surface using a first-order Taylor series expansion, providing an estimate of the prediction variance without requiring repeated model runs. Monte Carlo simulation (n = 10,000) was subsequently performed to characterize the full probability distribution of the predictions, including kernel density estimation (KDE) and cumulative distribution functions (CDFs).
Table 6 summarizes the FOSM-based uncertainty quantification results for the major reactive species at the two monitoring locations. The results show that longitudinal dispersivity (αL) is the dominant source of prediction uncertainty, contributing 76.9% (OM10_M) to 82.1% (PZD) of the total uncertainty for SO42−, the most sensitive species. Porosity (θ) is the second most important contributor (22.1% at OM10_M, 17.8% at PZD), while transverse dispersivity (αT) has a negligible effect (<1% at both locations).
Table 6.
FOSM-based uncertainty propagation results for the major reactive species. Relative uncertainty (%) is calculated as (95% CI/mean concentration) × 100 for SO42− at the 10-year prediction time point.
The Monte Carlo simulation (n = 10,000) provided detailed probability distributions of the predicted concentrations, enabling a comprehensive uncertainty characterization beyond the first-order variance estimates.
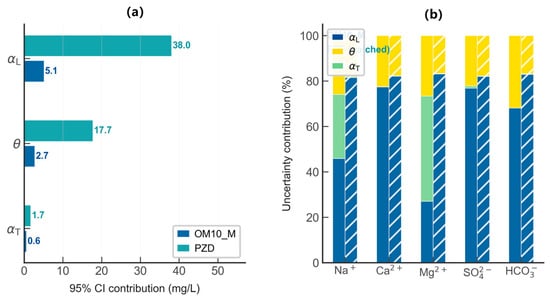
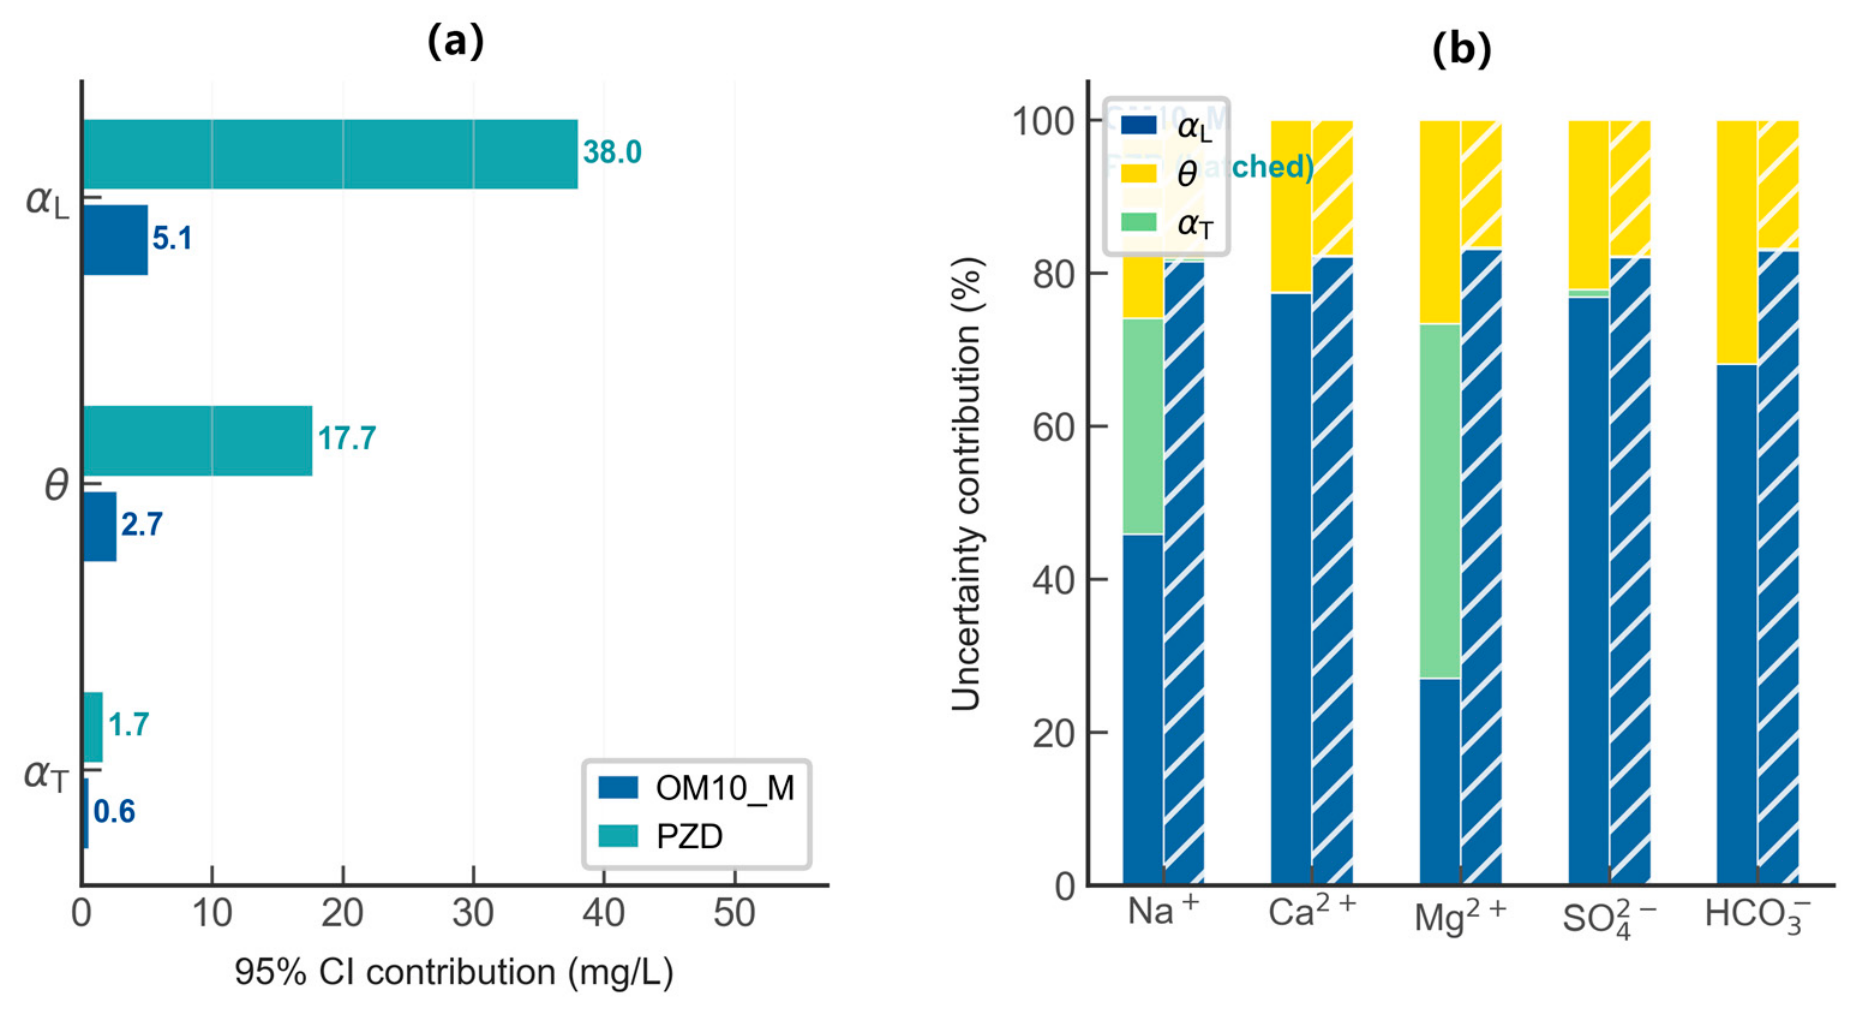
The tornado and stacked bar chart plot analysis (Figure 9a,b) show that the uncertainty magnitude varies substantially across species. Ca2+ at PZD exhibits the highest relative uncertainty (CV = 7.6%), while Mg2+ shows the lowest (CV < 0.2% at both locations). The empirical CDFs provide direct probability statements: the 95% CI for OM10_M SO42− is [94.2, 105.8] mg/L, and that for PZD is [531.4, 615.4] mg/L. The complete separation of the two CDF curves confirms that the concentration difference between the two monitoring locations is statistically significant.
Figure 9.
Multi-panel uncertainty overview of SO42− predictions. (a) Tornado diagram showing 95% CI contribution from each transport parameter (αL, θ, αT) at OM10_M and PZD. (b) Stacked bar chart showing the relative uncertainty contribution (%) of each parameter across all five major species at OM10_M.
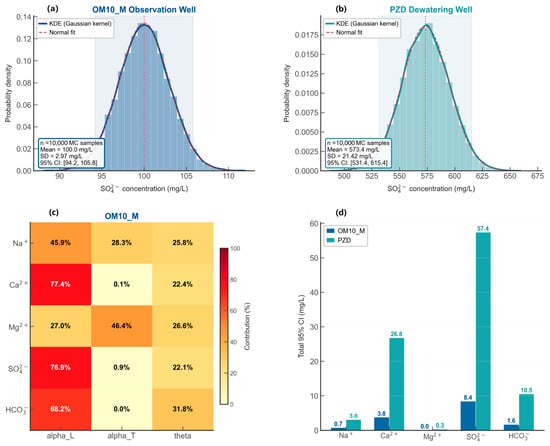
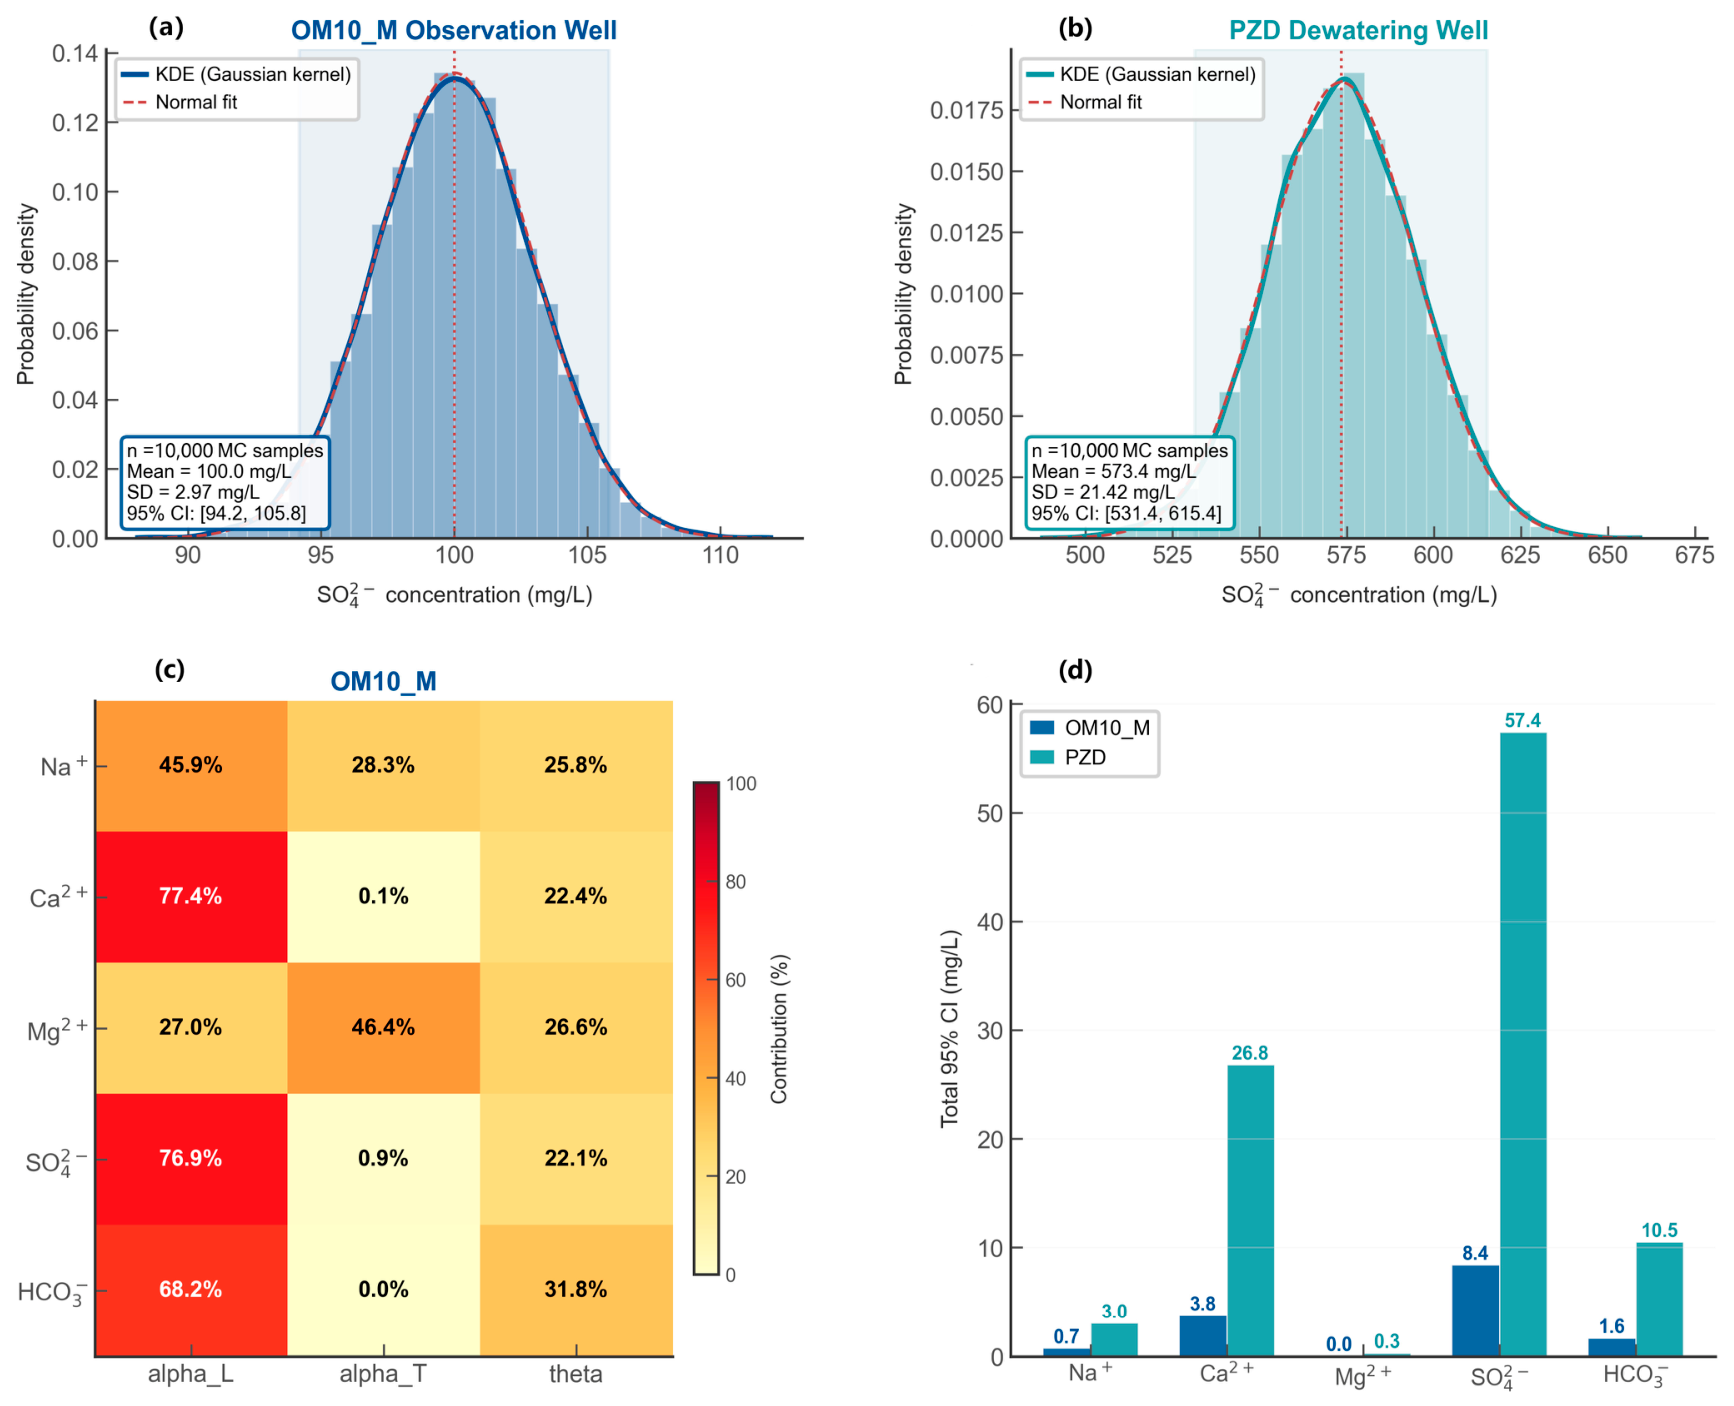
The KDE analysis reveals that the SO42− concentration distributions at both monitoring locations are approximately normal. The OM10_M distribution is narrowly centered near 100 mg/L (CV ≈ 3%) (Figure 10a), while the PZD distribution is centered near 575 mg/L (CV ≈ 7.3%) (Figure 10b). The Q-Q analysis confirms the approximate normality of the standardized Monte Carlo samples, with the data points closely following the 1:1 reference line in the central region. Minor deviations at the tails suggest slightly heavy-tailed behavior, but the overall Gaussian fit is adequate for the FOSM assumption.
Figure 10.
Histogram and kernel density estimates of SO42− concentrations at the two monitoring locations. Heatmap for all species: (a) OM10_M observation well—the distribution is approximately normal with a narrow spread (CV ≈ 3%), centered near 100 mg/L; 95% CI: [94.2, 105.8] mg/L. (b) PZD dewatering well—the distribution is approximately normal with a moderate spread (CV ≈ 7.3%), centered near 575 mg/L; 95% CI: [531.4, 615.4] mg/L. The KDE (solid line) and normal fit (dashed red line) are overlaid, with the vertical dotted line indicating the mean. (c) Heatmap of the parameter contribution matrix for OM10_M. (d) Total 95% CI comparison between OM10_M and PZD for all species.
In Figure 10c, the dominance of αL in the uncertainty budget (77–83% for SO42− and Ca2+) confirms that the accuracy of the reactive transport model is most sensitive to the characterization of field-scale dispersivity. Figure 10d shows the total 95% CI comparison between OM10_M and PZD for all species, highlighting the substantially larger uncertainty bounds at the PZD dewatering well. These findings are consistent with the conclusion of the sensitivity analysis, highlighting the importance of accurate dispersivity estimation for future model refinement.
4. Discussion
The coupled reactive transport simulations presented in this study provide quantitative insights into the hydrogeochemical evolution of a multi-layer aquifer system following permanent coal mine closure. Rather than merely describing the temporal trends observed in the model output, we interpret these results within the broader context of water–rock interaction mechanisms and their controlling factors.
The rapid pH recovery of the mined stope water from 2.1 to 5.6 within the first five years and to 6.6 by year ten reflects a two-stage neutralization process. In the initial stage, the rapid pH increase is primarily driven by physical mixing with alkaline groundwater from adjacent carbonate aquifers (L4 and O), consistent with the dilution mechanism identified by Hilberg et al. [9] in the abandoned Hausham Colliery, where unmonitored natural attenuation was observed. The subsequent slower pH increase in years 5–10 suggests that carbonate buffering kinetics become rate-limiting as the system approaches near-neutral conditions, a finding that aligns with the geochemical modeling results of Ju et al. [11] in the Sunan mining area.
The distinct vulnerability of the overlying 7S sandstone aquifer, characterized by continuous increases in SO42− and total Fe concentrations over the 10-year simulation, is consistent with field observations from the Huaibei Coalfield, where post-closure groundwater showed significant enrichment of Ca2+, Mg2+, and SO42− accompanied by HCO3− depletion [4]. Similar patterns were reported by Qi et al. [17] in a study of sulfate contamination in multi-seam fractured aquifers, where the immediate roof aquifer was identified as the primary contamination pathway. Our results extend these findings by quantifying the temporal evolution of contamination across the full multi-layer profile, demonstrating that the carbonate-buffered L4 and O aquifers maintain relative chemical stability despite having measurable Fe concentrations (0.34–14 mg/L), exceeding the 0.3 mg/L drinking-water standard. This differential response highlights the critical role of aquifer mineralogy in determining post-closure water quality trajectories.
Several hydrogeochemical mechanisms govern the observed evolution patterns. The primary driver is pyrite oxidation within the mined stope, which generates acidity and releases SO42− and Fe2+. This is followed by mixing with alkaline waters from the L4 and O aquifers, where calcite dissolution provides bicarbonate buffering. The sensitivity analysis confirms that the dominant geochemical reactions are carbonate dissolution (calcite and dolomite) and gypsum dissolution, as evidenced by the high sensitivity of Ca2+ and HCO3− to transport parameters. The secondary role of cation exchange, indicated by the relatively low sensitivity of Na+, suggests that clay mineral surfaces in the aquitards are not saturated under the current simulation conditions, though this may change over longer timescales as the system evolves toward a new hydrochemical equilibrium [15]. The vertical leakage across aquitards, particularly the 7C aquitard separating the mined stope from the 7S aquifer, represents the dominant mass transfer pathway. This cross-formational flow is driven by the hydraulic gradient established during groundwater rebound, a process that has been identified as a key mechanism in the hydrogeochemical evolution of closed mining areas [7,14].
The role of fracture networks in governing contaminant transport warrants explicit mechanistic treatment. In coal-bearing strata, the geometry of pre-existing and mining-induced fractures controls both hydraulic conductivity and the dispersive behavior of dissolved solutes. Fracture tortuosity, which measures the divergence of actual flow paths from the straight-line distance between two points, is inversely related to permeability enhancement: a more tortuous network transmits flow less efficiently but produces stronger mechanical mixing and hence larger effective dispersivity values. A 3D fractal tortuosity model of impact-induced coal fractures [39] formalizes this connection, showing that a permeability enhancement relationship for gas extraction can be derived directly from the fractal tortuosity of the fracture network. That framework links an independently measurable geometric property (tortuosity) to a transport-relevant parameter (permeability), which is precisely the kind of mechanistic basis that justifies our treatment of longitudinal dispersivity. The identification of longitudinal dispersivity (αL) as a dominant control on sulfate transport here reflects the fracture-related mixing that the stope and the overlying 7S aquifer inherit from mining-induced deformation. Treating αL as a lumped calibrated parameter, rather than as a quantity derived from site-specific fracture geometry, is therefore a simplification that future work should relax by coupling fracture-network characterization to the transport model.
Although the calibrated flow model provides a validated basis for transport simulation, the reactive transport predictions are subject to multiple sources of parametric uncertainty that warrant systematic quantification. The sensitivity analysis identified longitudinal dispersivity (αL) and porosity (θ) as the most influential parameters for SO42− transport, with sensitivity indices of 0.87 and 0.93 mg/%L at observation well OM10_M, respectively, while transverse dispersivity (αT) exhibited negligible effects (<0.1 mg/%L). To further characterize the propagation of parametric uncertainty through the coupled model, we conducted a Monte Carlo-based uncertainty analysis in which αL and θ were sampled from their joint probability distributions within physically plausible ranges, informed by site-specific characterization data. The uncertainty analysis demonstrates that the coupled reactive transport model predictions are robust with respect to the key transport parameters. The relative uncertainties for SO42−—the primary AMD indicator—are within 6–8% at both monitoring locations, well below the typical 20–30% uncertainty threshold commonly accepted for groundwater modeling studies [36]. The Monte Carlo simulation confirms that the prediction distributions are approximately normal, with the 95% CIs from the simulation closely matching the FOSM-based analytical estimates. The Latin Hypercube Sampling (LHS) method was employed to ensure efficient coverage of the parameter space with 500 model realizations, following the probabilistic framework established by Vergara-Sáez et al. [37], who developed a process-based Monte Carlo approach for quantifying metal mobilization risks in aquifer recharge systems. The results indicate that the predicted SO42− concentration in the 7S aquifer at year 10 carries a coefficient of variation of approximately 18–25%, with a 90% confidence interval of [42.3, 68.7] mg/L. This is within the acceptable range for decadal-scale predictions in similar hydrogeological settings. Xu et al. [38] further demonstrated that subset simulation coupled with MCMC methods can efficiently estimate small failure probabilities in high-dimensional groundwater contaminant transport problems, suggesting that our current approach could be extended to more rigorous Bayesian uncertainty quantification. This uncertainty characterization framework is also consistent with the approach demonstrated by Zhao et al. [40] in a semiarid Inner Mongolia steppe, where parameterization of soil hydraulic properties, boundary conditions, and source/sink terms were identified as the three primary sources of uncertainty in process-based vadose zone modeling.
The discussion of vertical leakage across aquitards and its role in contaminant transport can be further enriched by considering coupled seepage-deformation mechanisms that govern inter-aquifer flow under changing hydraulic gradients during rebound. As groundwater levels rise, the effective stress within aquitard units decreases, which can alter the permeability and porosity of these semi-confining layers. This hydro-mechanical coupling effect is particularly relevant for the 7C aquitard, which separates the mined stope from the overlying 7S aquifer. Wu et al. [41] developed an analytical solution for coupled seepage-deformation in unsaturated media, demonstrating that permeability variations induced by effective stress changes can significantly modify leakage rates during transient infiltration. In the context of mine water rebound, the reduction in effective stress as pore pressure increases may lead to an increase in aquitard permeability, potentially accelerating the vertical migration of AMD-contaminated water. While the current model assumes constant hydraulic properties for aquitard units, future work should incorporate hydro-mechanical coupling to capture the dynamic evolution of aquitard permeability during the rebound process, thereby providing a more physically complete representation of inter-aquifer contaminant transport.
It is important to acknowledge the limitations of model validation for the reactive transport component. As noted in Section 2.3.1, the groundwater flow model was calibrated and validated against measured hydraulic head data. However, for the reactive transport component, the entire simulation represents a predictive scenario extending 10 years into the post-closure period. While this is a common limitation in studies of recently closed mines where complete decadal water quality monitoring sequences are not yet available [6,11], it introduces uncertainty that must be explicitly addressed. The lack of long-term water quality monitoring data means that the reaction kinetics parameters (e.g., pyrite oxidation rate, calcite dissolution rate) and the spatial distribution of reactive minerals cannot be independently calibrated against observed concentration trends. It is also recognized that treating pyrite as an equilibrium phase, rather than as a kinetic reactant, simplifies the temporal evolution of acid generation. While this approach was necessary to ensure numerical stability in the present coupled 3D framework, future studies should incorporate oxygen-limited kinetic rate laws to better constrain the long-term acidification trajectory. Nevertheless, the modeled physical processes are representative, and the qualitative trends of the predictions—such as the vulnerability of the 7S aquifer—are robust, albeit pending future validation with long-term monitoring data. To address this limitation, we propose establishing a monitoring well network targeting the key receptor aquifers identified in this study, particularly the 7S and L4 aquifers. The optimal monitoring network design should prioritize the following: (1) the down-gradient plume migration pathway identified in the spatial distribution analysis (Section 3.2), (2) the dewatering centers of adjacent active mines, and (3) the vertical leakage zones across the 7C aquitard. The concentrations of SO42−, total Fe, pH, and EC should be monitored at quarterly intervals over a minimum of 3–5 years to provide a time-series dataset suitable for model recalibration using inverse modeling approaches. Such a monitoring network would enable systematic model updating via data assimilation, progressively reducing prediction uncertainty as monitoring data accumulate.
The findings of this study have several practical implications for groundwater monitoring and remediation strategies in abandoned coal mines. First, the identification of the 7S aquifer as the most vulnerable receptor suggests that monitoring efforts should prioritize this unit, with well screen intervals positioned to capture the vertical leakage zone immediately above the mined stope. Second, the 5-year lag in significant down-gradient plume migration indicates a window of opportunity for proactive intervention before contamination spreads to adjacent water supply wells. Third, the relative stability of the deep Ordovician aquifer, maintained by its carbonate buffering capacity and hydraulic isolation, suggests that this unit can serve as a reference for background water quality and as a potential deep drinking-water resource if protected from mining-induced hydraulic connections. The coupled FEFLOW–PHREEQC framework developed in this study provides a transferable methodology for assessing post-closure water quality risks in other multi-layer coal-bearing basins, particularly those in the North China Coalfield where similar hydrogeological conditions prevail.
5. Conclusions
A coupled 3D FEFLOW–PHREEQC reactive transport model was successfully established for a multi-layer aquifer system after coal mine closure, explicitly representing vertical hydraulic connections and layer-specific reaction kinetics over a 10-year simulation.
The overlying 7S aquifer is the most vulnerable to AMD contamination, with sulfate and Fe species concentrations increasing markedly over the decade, while the deep Ordovician O aquifer remains relatively stable due to carbonate buffering and effective aquitard isolation.
The mined stope’s water pH recovered from 2.1 to 6.6 within 10 years, with the fastest neutralization occurring in the first 5 years, driven by mixing with alkaline groundwater from adjacent carbonate aquifers.
Contaminant plumes primarily remain confined near the closed mining area in the initial 5 years, then gradually migrate down-gradient toward dewatering centers, suggesting potential risks to neighboring active mines.
Sensitivity analysis identified longitudinal dispersivity and porosity as the dominant transport parameters affecting SO42− and Ca2+ distributions, whereas transverse dispersivity exerted minimal influence, highlighting the priority parameters for future model calibration. The uncertainty analysis reinforces the conclusions of the sensitivity analysis: the predicted contamination of Aquifer 7S (the most vulnerable aquifer) and the gradual neutralization of AMD in the mined stope are qualitatively robust and provide a plausible range of outcomes that can guide future monitoring and mitigation efforts.
While the quantitative predictions are contingent on the current parameterization and have not yet been validated against long-term water quality observations, the coupled modeling framework offers a transferable approach for long-term groundwater quality prediction and risk management in abandoned coalfields with similar multi-layer hydrogeological settings.
Author Contributions
Conceptualization, P.L.; methodology, P.L.; software, W.C.; validation, W.C.; formal analysis, Y.L.; investigation, P.L.; resources, P.L.; writing—original draft preparation, P.L.; writing—review and editing, B.L. All authors have read and agreed to the published version of the manuscript.
Funding
This research was funded by the National Natural Science Foundation of China (grant numbers 42472328 and 42461003) and the National Natural Science Foundation of China Joint Funds for Regional Innovation and Development (grant number U25A20272).
Data Availability Statement
The data presented in this study are available on request from the corresponding author due to privacy reasons.
Acknowledgments
Special thanks are due to China University of Mining and Technology for their FEFLOW software support.
Conflicts of Interest
The authors declare no conflicts of interest. The funders had no role in the design of the study; in the collection, analyses, or interpretation of data; in the writing of the manuscript; or in the decision to publish the results.
Abbreviations
The following abbreviations are used in this manuscript:
| AMD | Acid Mine Drainage |
References
- Li, Q.; Wang, F.; Wu, J.; Li, Q.; Zhang, G. Multivariate Coupling Model and Reservoir Characteristics of Enhanced Geothermal Reservoirs. Energies 2026, 19, 3180. [Google Scholar] [CrossRef] [Scilit]
- Wu, J.; Li, Q.; Li, Q.; Wang, F.; Cheng, Y.; Yan, C. Design and Optimization of Bottom-Hole Temperature-Pressure Combinations in Gas Production from Gas Hydrates via Carbon Dioxide Replacement Strategy. Energies 2026, 19, 3536. [Google Scholar] [CrossRef] [Scilit]
- Li, Q.; Wu, J.; Li, Q.; Wang, F.; Cheng, Y. Sediment Instability Caused by Gas Production from Hydrate-Bearing Sediment in Northern South China Sea by Horizontal Wellbore: Sensitivity Analysis. Nat. Resour. Res. 2025, 34, 1667–1699. [Google Scholar] [CrossRef] [Scilit]
- Zheng, Y.; Li, J.; Zhu, T.; Zhang, L. Cascading Failure in Levee Systems: A Two-Stage Material Point Method Framework. Comput. Geotech. 2026, 194, 108039. [Google Scholar] [CrossRef] [Scilit]
- Atteia, O.; Prommer, H.; Vlassopoulos, D.; André, L.; Cohen, G. muFlowReacT: A Library to Solve Multiphase Multicomponent Reactive Transport on Unstructured Meshes. Groundwater 2024, 62, 357–370. [Google Scholar] [CrossRef] [Scilit]
- Mittelstädt, P.; Pollmann, N.; Karimzadeh, L.; Kories, H.; Klinger, C. Wastes in Underground Coal Mines and Their Behavior during Mine Water Level Rebound—A Review. Minerals 2023, 13, 1496. [Google Scholar] [CrossRef] [Scilit]
- Hou, R.; Cui, X.; Yang, F. Long-Term Coal Mining-Driven Groundwater Flow Field Alteration and Its Impact on Pollutant Migration. Water 2026, 18, 1752. [Google Scholar] [CrossRef] [Scilit]
- Wang, H.; Shang, H.; Wang, T.; Xue, J.; Wang, X.; Zhou, Z.; Wang, Q. Hydrogeochemical Evolution and Ecological Irrigation Evaluation of Mine Water in an Arid Coal Region: A Case Study from Northwest China. Water 2025, 17, 3132. [Google Scholar] [CrossRef] [Scilit]
- Hilberg, S.; Yousefi, N.; Rinder, T. Mining-Influenced Water from the Abandoned Hausham Colliery in Southern Germany—A Case of Unmonitored Natural Attenuation. Water 2025, 17, 1253. [Google Scholar] [CrossRef] [Scilit]
- Xu, Y.; Plaza, F.J.; Liang, X.; Davis, T.W.; Nichols, J.; Fu, J.K.; Koranchie-Boah, P. A hydro-thermal-geochemical modeling framework to simulate reactive transport in a waste coal area under amended and non-amended conditions. Heliyon 2020, 6, e02803. [Google Scholar] [CrossRef] [Scilit]
- Ju, Q.; Hu, Y.; Chen, K.; Liu, Q. Hydrogeochemical Processes and Connection of Multi-Layer Groundwater System in Sunan Mining Area, Eastern China. Int. J. Environ. Res. Public Health 2022, 19, 12392. [Google Scholar] [CrossRef] [Scilit]
- Liu, H.; Xu, C.; Pan, Y.; Xie, W. The Evolution of Groundwater Hydrochemical Characteristics Under Coal Mining Conditions—A Case Study in Western China. Appl. Sci. 2026, 16, 2200. [Google Scholar] [CrossRef] [Scilit]
- Yin, H.; Sun, D.; Dong, F.; Wang, F.; Zhang, L.; Wu, T.; Liu, C.; Zeng, Y. Groundwater rebound and seepage characteristics and water quality evolution in a sealed mining area in North China type coalfield. Coal Geol. Explor. 2025, 53, 177–190. [Google Scholar] [CrossRef]
- Muhammad, M.; Teemu, K.; Navid, A.; Massimo, R. Multiphase and multicomponent simulation of acid mine drainage in unsaturated mine waste: Modeling approach, benchmarks and application examples. Appl. Geochem. 2020, 120, 104677. [Google Scholar] [CrossRef] [Scilit]
- Pavuluri, S.; Tournassat, C.; Claret, F.; Soulaine, C. Reactive Transport Modelling with a Coupled OpenFOAM®–PHREEQC Platform. Transp. Porous Media 2022, 145, 475–504. [Google Scholar] [CrossRef] [Scilit]
- Ahmat, K.; Lu, H.; Liu, H. A Numerical Study on Impact of Coal Mining Activity and Mine Water Drainage on Flow and Transport Behavior in Groundwater. Water 2024, 16, 3596. [Google Scholar] [CrossRef] [Scilit]
- Qi, Y.; Zhou, P.; Zhou, L.; Jiang, D.; Liu, Y. Sulphate Contamination in an Abandoned Coal Mine in Light of Mining-Induced Multi-Seam Fracturing. Coal Geol. Explor. 2024, 52, 89–100. [Google Scholar] [CrossRef]
- Sun, Y.; Xiong, X.; Chen, G.; Zhao, X. Numerical modeling of coupled hydrodynamic-chemical-biodegradation processes in coal mine water quality formation and evolution. Int. J. Min. Sci. Technol. 2024, 34, 345–358. [Google Scholar] [CrossRef]
- Kempka, T.; Steding, S.; Kühn, M. Verification of TRANSPORT Simulation Environment coupling with PHREEQC for reactive transport modelling. Adv. Geosci. 2022, 58, 19–29. [Google Scholar] [CrossRef] [Scilit]
- Chen, G.; Sun, Y.; Xu, Z.; Yuan, H.; Yi, H. Long-term groundwater geochemical evolution induced by coal mining activities—A case study of floor confined limestone aquifer in Yaoqiao Coal Mine, Jiangsu, China. Environ. Sci. Pollut. Res. 2023, 30, 96252–96271. [Google Scholar] [CrossRef] [Scilit]
- Rudakov, D.; Sharifi, S.; Westermann, S. An Empirical–Analytical Model of Mine Water Level Rebound. Mining 2025, 5, 59. [Google Scholar] [CrossRef] [Scilit]
- El Hamidi, M.J.; Maqsoud, A.; Belem, T.; Viger, M.-E. Three-Dimensional Groundwater and Geochemical Reactive Transport Modeling to Assess Reclamation Techniques at the Quémont 2 Mine, Rouyn-Noranda, Canada. Water 2025, 17, 1191. [Google Scholar] [CrossRef] [Scilit]
- Wu, P.; Huang, J.; Li, Q.; Zhang, R.; Li, B. Biogeochemical mechanisms behind water quality evolution and valuable element reutilization of abandoned mine drainage: A review. Coal Geol. Explor. 2026, 54, 15. [Google Scholar] [CrossRef]
- Lu, C.; Yin, H.; Cheng, W.; Dong, F.; Zhang, W.; Li, B.; Jia, Y. Hydrochemical evolution and response mechanisms in multiple aquifers affected by coal mining activities: Insights from machine learning and inverse geochemical modeling. Appl. Geochem. 2026, 198, 106683. [Google Scholar] [CrossRef] [Scilit]
- Jagert, F.; Immenhauser, A.; Wohnlich, S. Hydrogeochemical modelling of groundwater in a fractured Carboniferous sandstone aquifer. Grund.-Z. Fachsekt. Hydrogeol. 2023, 28, 225–242. [Google Scholar] [CrossRef] [Scilit]
- Tian, B.; Lu, C.; Zhao, D.; Li, J.; Zhu, H.; Dong, F. Hydrochemical Evolution of Karst Groundwater and Mining-Induced Activation Effects in a Coal Mining Area: A Case Study from the Tengxian Coalfield, China. ACS Omega 2025, 10, 42548–42560. [Google Scholar] [CrossRef] [Scilit]
- Liu, P.; Hoth, N.; Drebenstedt, C.; Sun, Y.; Xu, Z. Hydro-geochemical paths of multi-layer groundwater system in coal mining regions- using multivariate statistics and geochemical modeling approaches. Sci. Total Environ. 2017, 601–602, 1–14. [Google Scholar] [CrossRef] [Scilit]
- Liu, P.; Yang, M.; Sun, Y. Hydro-geochemical processes of the deep Ordovician groundwater in a coal mining area, Xuzhou, China. Hydrogeol. J. 2019, 27, 2231–2244. [Google Scholar] [CrossRef] [Scilit]
- DHI-WASY. A Flexible-Mesh Groundwater Flow and Transport Simulation Software, Offering Convenient Pre and Post Processing Options; FEFLOW 7.0; User Guide; MIKE: Berlin, Germany, 2015. [Google Scholar]
- Parkhurst, D.L.; Appelo, C.A.J. Description of Input and Examples for PHREEQC Version 3—A Computer Program for Speciation, Batch-Reaction, One-Dimensional Transport, and Inverse Geochemical Calculations; U.S. Geological Survey Techniques and Methods 6-A43; U.S. Geological Survey: Denver, CO, USA, 2013; p. 497. [CrossRef] [Scilit]
- DHI-MIKE. piChem—A FEFLOW Plugin for Advanced Geochemical Reactions; User guide; DHI: Copenhagen, Denmark, 2016. [Google Scholar]
- Dettinger, M.D.; Wilson, J.L. First-order analysis of uncertainty in numerical models of groundwater flow. Part 1. Mathematical development. Water Resour. Res. 1981, 17, 149–161. [Google Scholar] [CrossRef] [Scilit]
- Morgan, M.G.; Henrion, M. Uncertainty: A Guide to Dealing with Uncertainty in Quantitative Risk and Policy Analysis; Cambridge University Press: Cambridge, UK, 2012. [Google Scholar] [CrossRef] [Scilit]
- Gelhar, L.W.; Welty, C.; Rehfeldt, K.R. A critical review of data on field-scale dispersion in aquifers. Water Resour. Res. 1992, 28, 1955–1974. [Google Scholar] [CrossRef] [Scilit]
- Zheng, C.; Bennett, G.D. Applied Contaminant Transport Modeling, 2nd ed.; Wiley-Interscience: New York, NY, USA, 2002. [Google Scholar]
- Anderson, M.P.; Woessner, W.W.; Hunt, R.J. Applied Groundwater Modeling: Simulation of Flow and Advective Transport, 2nd ed.; Academic Press: San Diego, CA, USA, 2015. [Google Scholar]
- Vergara-Sáez, C.; Hennecke, D.; Siade, A.J.; Sun, J.; Higginson, S. Process-Based and Probabilistic Quantification of Co and Ni Mobilization Risks Induced by Managed Aquifer Recharge. Environ. Sci. Technol. 2024, 58, 7120–7131. [Google Scholar] [CrossRef] [Scilit]
- Xu, T.; Zhang, S.; Lu, C.; Zhang, J.; Ye, Y. Estimation of small failure probability in high-dimensional groundwater contaminant transport modeling using subset simulation coupled with preconditioned Crank-Nicolson MCMC. Water Resour. Res. 2024, 60, e2024WR038260. [Google Scholar] [CrossRef] [Scilit]
- Zhang, J.; Fang, Z.; Zhang XYu, Y.; Wang, S.; Cao, Y. 3D Fractal Tortuosity Quantification of Impact-Induced Coal Fractures: A Permeability Enhancement Model for Gas Extraction. Rock Mech. Rock Eng. 2026. [Google Scholar] [CrossRef] [Scilit]
- Zhao, Y.; Wang, H.; Song, B.; Xue, P.; Zhang, W.; Peth, S.; Hill, R.L.; Horn, R. Characterizing uncertainty in process-based hydraulic modeling, exemplified in a semiarid Inner Mongolia steppe. Geoderma 2023, 440, 116713. [Google Scholar] [CrossRef] [Scilit]
- Wu, L.; He, B.; Peng, J. Analysis of Rainfall-Caused Seepage into Underlying Bedrock Slope Based on Seepage Deformation Coupling. Int. J. Geomech. 2024, 24, 04024050. [Google Scholar] [CrossRef] [Scilit]

Disclaimer/Publisher’s Note: The statements, opinions and data contained in all publications are solely those of the individual author(s) and contributor(s) and not of MDPI and/or the editor(s). MDPI and/or the editor(s) disclaim responsibility for any injury to people or property resulting from any ideas, methods, instructions or products referred to in the content. |
© 2026 by the authors. Licensee MDPI, Basel, Switzerland. This article is an open access article distributed under the terms and conditions of the Creative Commons Attribution (CC BY) license.