


Abstract
Improving the understanding of hydrological drought mechanisms is paramount for drought resistance and early warning in a changing environment. The Upper Yellow River Basin (UYRB), the primary water-producing region of the Yellow River Basin, experiences hydrological droughts that are jointly influenced by climate variability and human activities. This study systematically investigated the spatiotemporal evolution of hydrological droughts in the UYRB and elucidated their underlying mechanisms from the perspectives of sub-basin contributions, reservoir regulation, and large-scale climate drivers. We found an increasing trend in yearly drought severity from 1956 to 2010 under the natural scenario, but large reservoirs significantly reduced the severity. The headwater region, Tao River Basin, and interval region 2 were identified as the key areas in drought formation of the whole UYRB. Reservoirs generally increased monthly drought intensity in summer and autumn but decreased drought intensity in spring and winter. For drought events lasting for a longer time, reservoirs interrupted their continuity, which reduced the average severity and duration but exaggerated peak intensity, especially for extreme events. The impacts of different reservoirs on drought variations showed distinct differences due to different operation regulations. Cascade reservoir regulation weakened and altered the relationships between hydrological drought and climate indices, including PDO, AMO, NAO, and ENSO, at the 8–16 and 32–64 month timescales. This finding indicates that the effects of large-reservoir regulation should be removed using naturalized streamflow when identifying teleconnection drivers of hydrological drought and conducting drought early warning. These findings provide new insights into the mechanisms governing hydrological drought under the combined influences of climate change and reservoir regulation and offer a scientific basis for drought early warning, reservoir operation, and integrated water resources management.
1. Introduction
Under the combined influences of global warming and intensified human activities, drought has become one of the most widespread natural hazards, exerting profound impacts on agricultural production, socioeconomic development, and ecosystem sustainability [1,2]. According to the water deficiency of different hydro-meteorological variables, drought is generally categorized into four major types: meteorological, agricultural, hydrological, and socio-economic drought [3]. Hydrological drought is characterized by abnormally low streamflow, river stage, or water availability relative to long-term normal conditions, posing serious challenges to agricultural, industrial, and domestic water supply [4,5]. Therefore, the variations and mechanisms of hydrological drought are always the focus of researchers.
Located in northwestern and northern China, the Yellow River Basin (YRB) plays an indispensable role in the water supply [6]. The upper Yellow River Basin (UYRB), as the main water yield region, contributes more than 50% of the annual runoff for the whole basin [7]. Therefore, hydrological drought in the UYRB will severely threaten the water supply in the lower-reach areas, especially for the most dominant water users (i.e., Hetao and Qingtongxia large irrigation districts) [8]. Recent studies suggested that the streamflow in the UYRB showed a decreasing trend in recent years [9,10], adding urgency to the understanding of hydrological drought mechanisms. Previous studies investigated spatio-temporal variations in hydrological drought using the Standardized Runoff Index (SRI) and Standardized Streamflow Index (SSI), and explored the duration, severity, and return period of drought utilizing run theory and copula function [11,12,13]. Nevertheless, the driving mechanisms of hydrological drought remain to be further clarified [14].
Precipitation and evapotranspiration anomalies are highly associated with drought evolution [15]. To date, mounting studies have suggested that meteorological drought is the primary factor in hydrological drought and explored their relationships, which focused a lens on the propagation process of water deficit from precipitation to streamflow [16,17,18]. Hydrological drought also has regional characteristics due to the spatial heterogeneity of meteorological factors, which causes different contributions from diverse regions to drought intensity to the outlet of a watershed. In terms of the whole basin, the hydrological drought conditions at the outlet reflect the integrated contributions of drought from different water yield regions in upstream areas. For managers of water resources systems, clarifying the origin of hydrological drought is important for following management plans. However, few studies have focused on the drought severity relationships between the whole basin and different sub-basins.
Moreover, dams have become one of the most important interferences in streamflow evolution since their increase in total storage capacity [19,20]. Thus, understanding the regulating influences of dams on hydrological drought variations is important. Recently, scholars dedicated efforts to identifying reservoir impacts on hydrological drought utilizing different approaches. These methods compared the drought characteristics obtained from different sources, such as those from natural streamflow reconstructed by hydrological models and observed streamflow series [21], the periods before and after dam construction [22], the upstream and downstream of dam locations [23], the natural reference watershed and human-affected watershed [24,25], and the SRI series under stationary and nonstationary assumptions [26]. Nonetheless, since the uncertainties resulted from hydrological simulation, paired catchments selection, climate change impacts, and the nonlinear hydrological processes relationship between the upstream and downstream gauges, these methods are limited to understanding dam impacts on hydrological drought. Meanwhile, with the increasing number of cascade reservoirs, the mechanisms of hydrological drought variations become more complicated under complex operating rules. Several studies applied the reservoir index calculated by runoff and reservoir capacity to indirectly depict the effect of cascade reservoirs on hydrological drought, assuming a positive correlation between the influences and reservoir capacity [27,28]. As the reservoirs for power generation with daily or weekly regulation ability have a limited impact on hydrological drought over a monthly or longer time scale, sometimes the assumption may not hold. In summary, the effects of reservoirs on hydrological drought may depend on their operational functions and do not necessarily exhibit uniform patterns [29]. Wu et al. [30] applied inflow and outflow information of reservoirs to address this problem, which did not introduce additional uncertainty. However, the approach is yet to be used on a wide scale due to a lack of data availability. Since the 1960s, many large reservoirs, such as Longyangxia, Lijiaxia, and Liujiaxia, have been constructed for flood control, water supply, power generation, etc., which significantly disturbed the streamflow variations in the UYRB [31]. To our knowledge, research that reveals the influences of these reservoirs on hydrological drought in the UYRB is still scant.
Climate circulation patterns, such as the North Atlantic Oscillation (NAO) and El Niño Southern Oscillation (ENSO), have been indicated as capable of explaining the variability of hydrological drought severity [32]. As a result, revealing the relationship between hydrological drought and large climate indices is beneficial for further improving the science of water resources management. Notably, teleconnection patterns exert geographically heterogeneous effects on regional hydroclimate because their influences depend on the spatial domains of atmospheric circulation anomalies, moisture transport pathways, and local land–atmosphere conditions. For instance, 65% of precipitation variability in Spain can be explained solely by the NAO [33]. In contrast, this influence is substantially weaker in the Euphrates–Tigris Basin in Türkiye [34]. In China, several studies explored the linkages between drought and climate indices in various basins in China, e.g., Xijiang Basin, Weihe River Basin, and Poyang Lake Basin [14,35,36,37]. It was also investigated that ENSO, the Pacific Decadal Oscillation (PDO), and sunspots were closely associated with drought evolution in the Yellow River Basin [37]. Notably, hydrological processes in these basins were highly disrupted by frequent human activities, but these studies ignored the impacts of human activities on the correlations between drought and climate indices. In the UYRB, reservoirs with yearly and multi-yearly regulation ability significantly changed the streamflow characteristics. Consequently, the reliability of the relationship between hydrological drought and climate indices ignoring the impacts of reservoirs remains debatable.
In light of these issues, this study aims to explore the variations and mechanisms of hydrological drought in the UYRB. In detail, this study aims to (1) reveal the hydrological drought variations and quantify the contribution of different sub-watersheds to the outlet, (2) systematically uncover the influence of the reservoirs on the hydrological drought characteristics, and (3) explore whether the relationships between large-scale climate indices and hydrological drought have changed or not under large reservoir regulation. The results provide new insights into the mechanisms of hydrological drought in the UYRB and offer valuable guidance for drought mitigation and adaptive water resources management.
2. Materials and Methods
2.1. Study Area
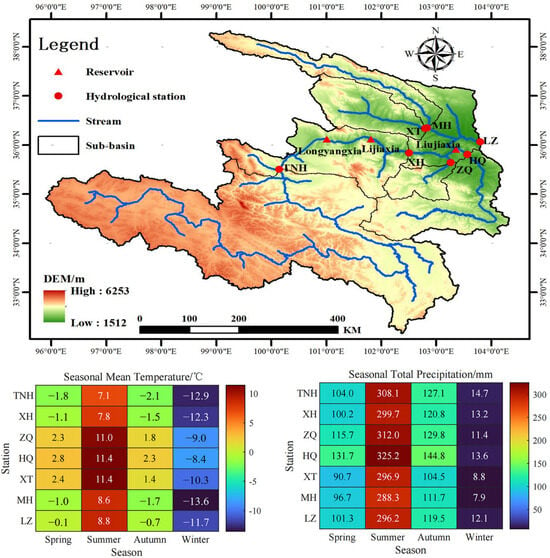
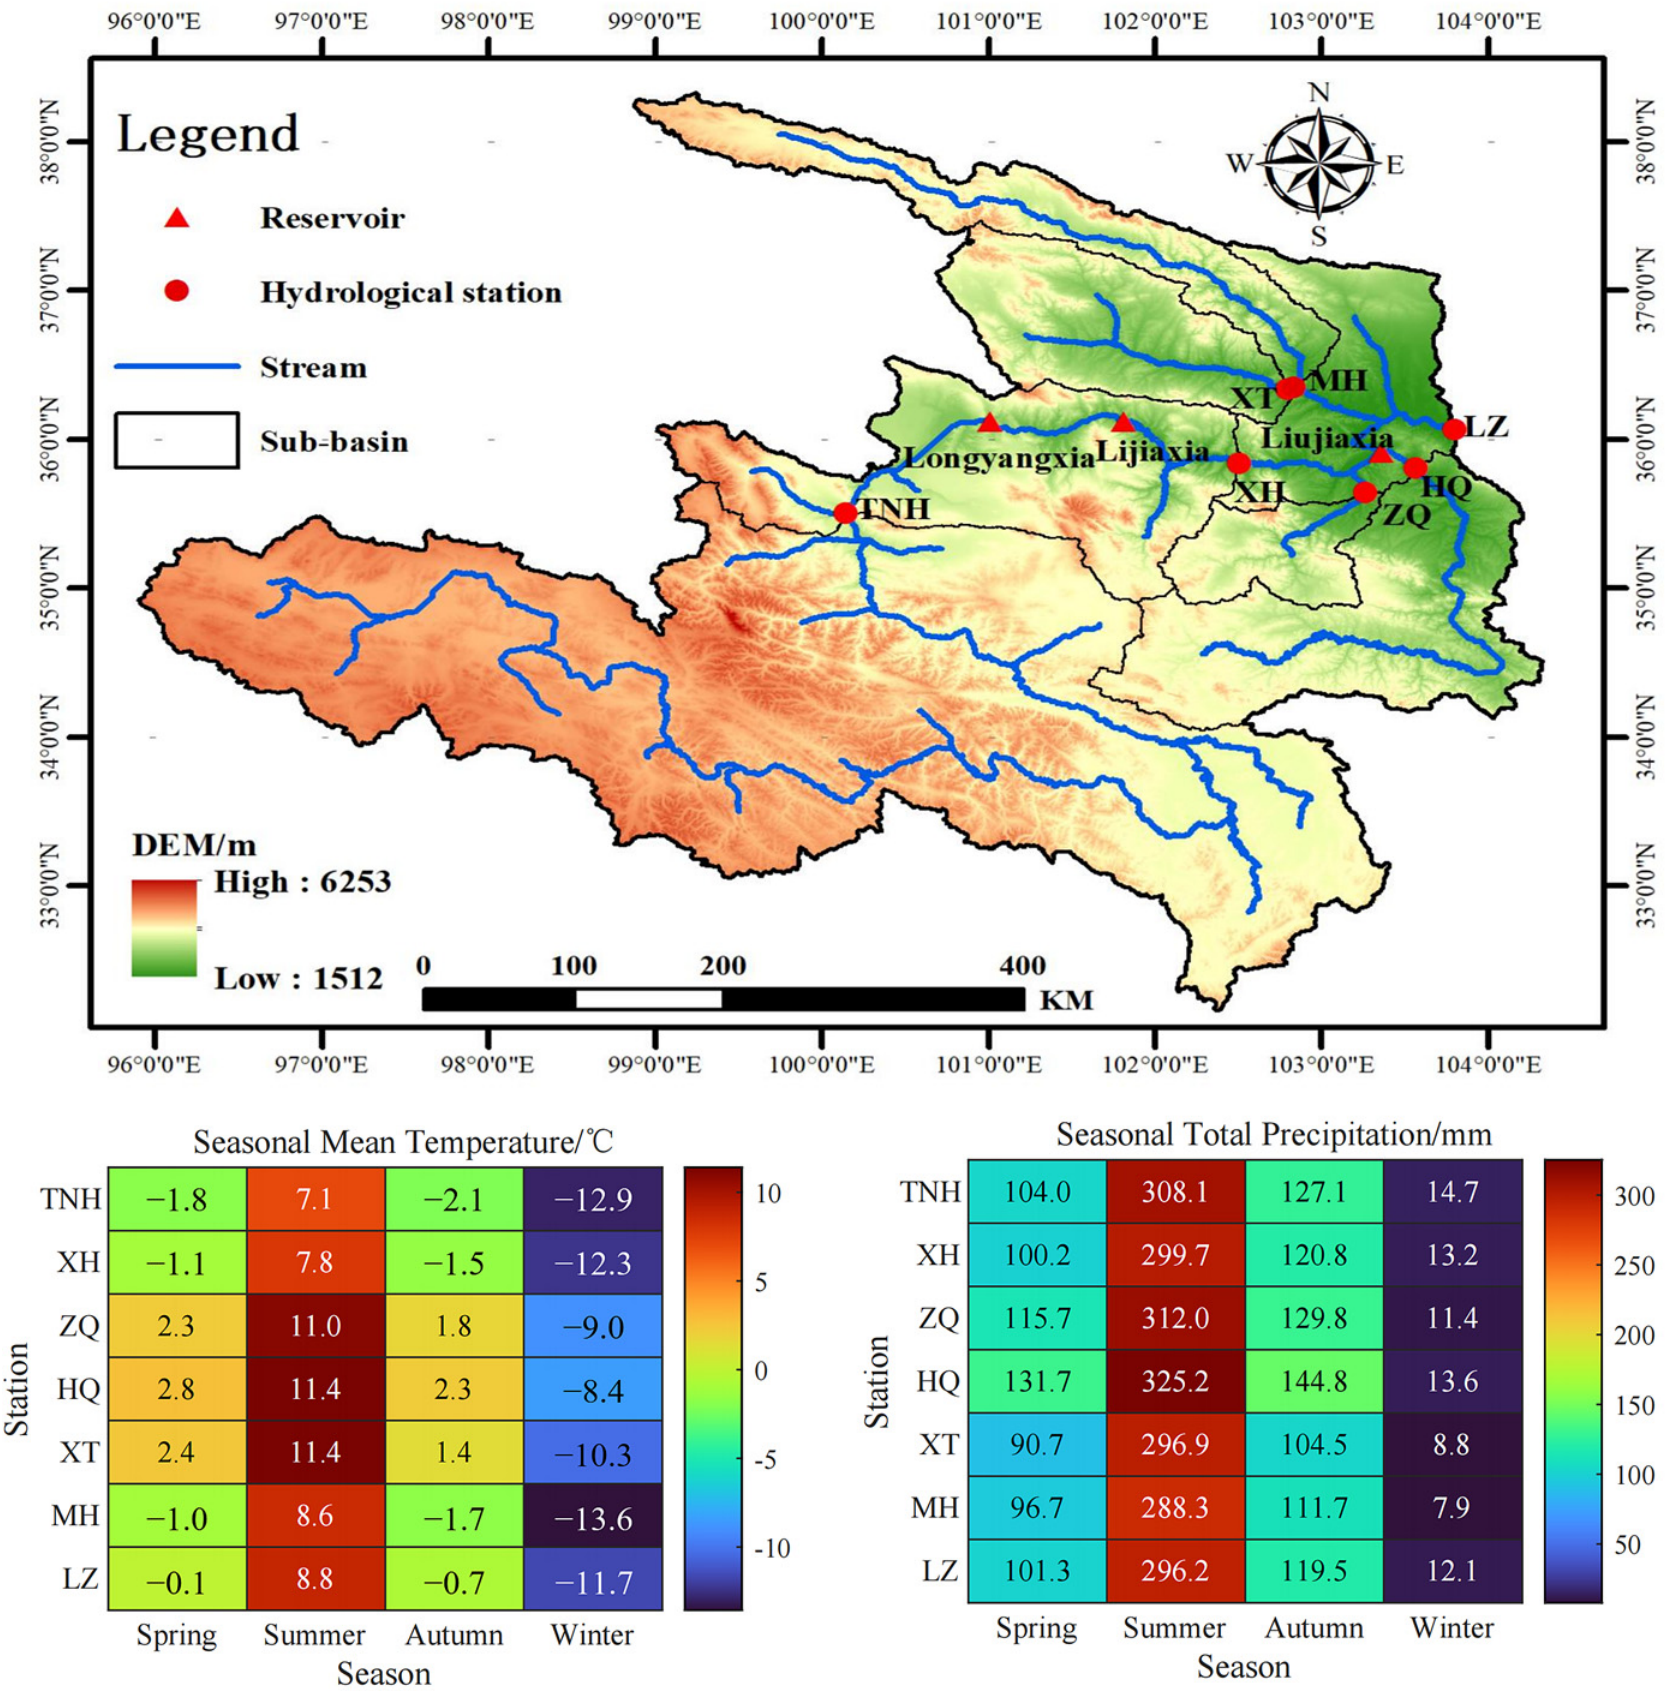
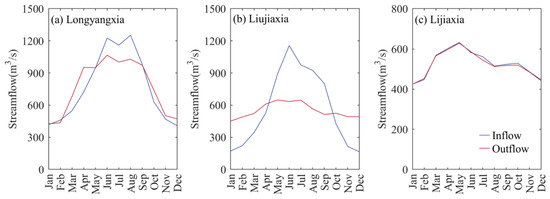
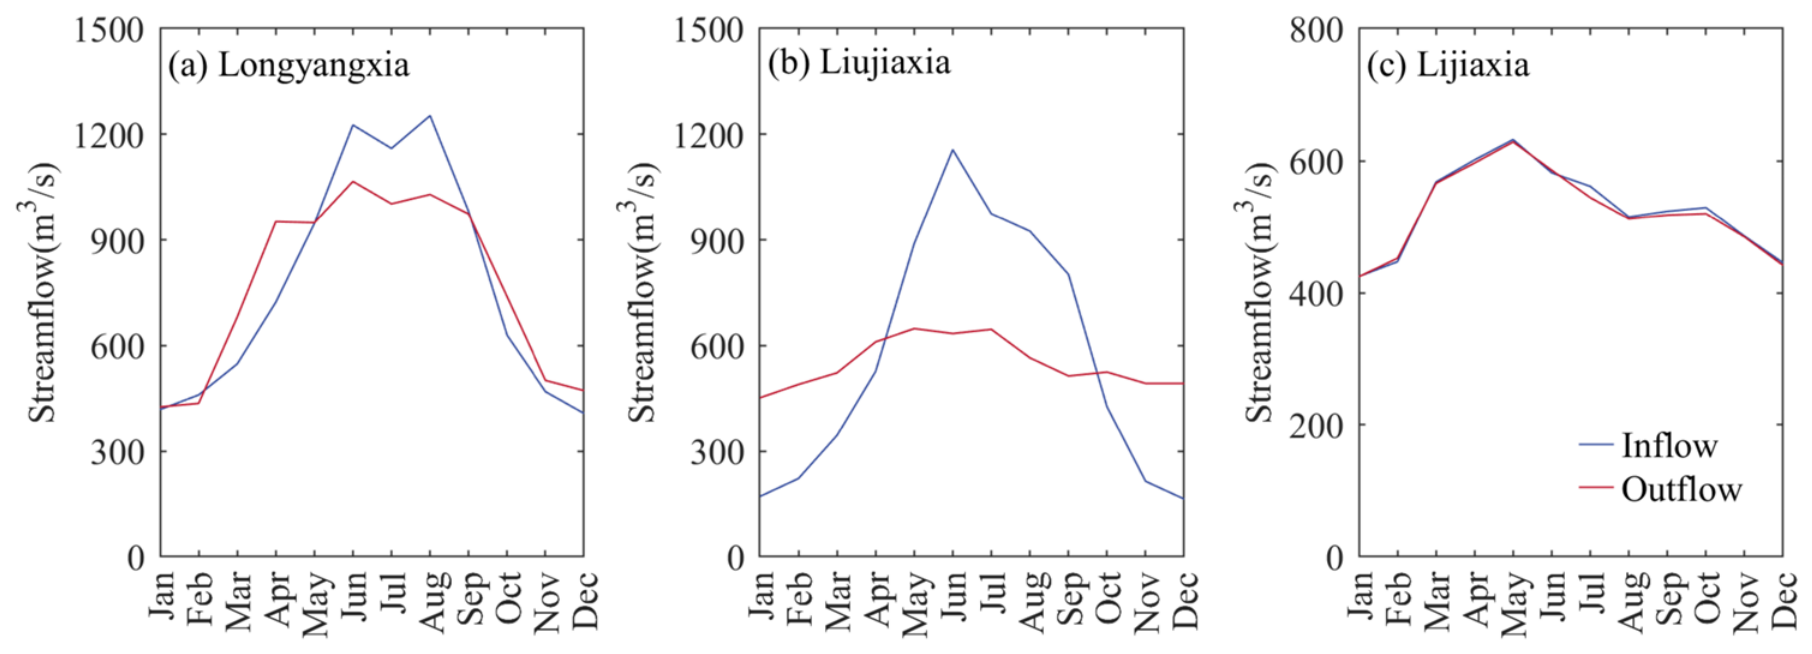
Located in northwest China, the upper Yellow River Basin (UYRB) is the main water yield region of the Yellow River Basin, contributing more than 50% of the whole basin runoff. The UYRB covers an area of 222,551 km2, controlled by the stream gauging station named Lanzhou (LZ) (Figure 1). The elevation of the study area ranges from 1512 to 6253 m. The UYRB has a mean annual precipitation of 529 mm and a mean annual air temperature of −0.89 °C. The precipitation is predominantly concentrated in summer. The runoff of the LZ station primarily originates from the main stream and four tributaries (i.e., Daxia River, Tao River, Huangshui River, and Datong River), accounting for 68.4% and 31.6%, respectively [7]. Since the 1960s, three large reservoirs (i.e., Liujiaxia, Longyangxia, and Lijiaxia), each with a total storage capacity exceeding 1 × 10⁹ m3, have been successively constructed within the basin, substantially altering the natural streamflow regime. The monthly mean inflow and outflow of these reservoirs are presented in Figure 2.
Figure 1.
Location of the study area and the seasonal temperatures and precipitation.
Figure 2.
The monthly average inflow and outflow of the large reservoirs named Longyangxia (a), Liujiaxia (b), and Lijiaxia (c), respectively.
2.2. Data
Monthly streamflow observations from seven hydrological stations (Figure 1) for 1956–2010 were obtained from the Hydrological Yearbook of the Yellow River Basin. Table 1 lists the information of hydrological stations and the corresponding catchments. The region above the TNH station is the source area of the UYRB. Reservoir operation records, including monthly inflow and outflow during 1969–2010 for Longyangxia, Lijiaxia, and Liujiaxia, were provided by Huanghe Hydropower Development Co., Ltd. [31]. To explore the relationship between hydrological drought and global climate oscillations, four large-scale climate indices, including the Southern Oscillation Index (SOI), Atlantic Multidecadal Oscillation Index (AMOI), North Atlantic Oscillation Index (NAOI), and Pacific Decadal Oscillation Index (PDOI), were obtained from the US National Oceanic and Atmospheric Administration (NOAA) Earth System Research Laboratory at http://www.cpc.ncep.noaa.gov/data/ (accessed on 4 July 2025). These four factors have been shown to be associated with the evolution of drought in the Yellow River Basin [28,34].
Table 1.
Hydrological stations used in the current study.
2.3. Methods
2.3.1. Natural Streamflow Reconstruction
According to the water balance principle, the natural streamflow (i.e., the streamflow without of reservoir’s influence) can be calculated as follows:
Here, QNat and QObs refer to the natural (unregulated) and observed streamflow, respectively, where-as Qin and Qout represent reservoir inflow and outflow. In this study, natural streamflow denotes the series reconstructed after removing reservoir effects. Since three reservoirs were considered in the current study, four reconstructed series representing the streamflow at LZ station could be obtained, which excluded the single impacts of three reservoirs and the synergistic impacts of cascade reservoirs, respectively.
2.3.2. Hydrological Drought Identification
The SSI was used to characterize hydrological drought severity. Owing to its straightforward computation and adaptability, the SSI has been widely applied in hydrological assessments [38]. The streamflow series were first described with an appropriate cumulative distribution function, after which the corresponding cumulative probabilities were transformed to obtain normalized SSI values. Here, a log-normal distribution was selected because previous research has demonstrated its suitability for streamflow fitting in this region [39]. An SSI value below −0.5 indicates the occurrence of hydrological drought. To further separate reservoir effects on hydrological drought, we applied the parameter transplantation approach of Jiang et al. [4] to derive two SSI series representing drought conditions with and without reservoir regulation. The uninfluenced SSI (SSINat) was calculated from natural streamflow using the conventional procedure, whereas the influenced SSI (SSIRes) was obtained from observed streamflow while retaining the distribution parameters estimated from the natural streamflow series. According to the relationship between these two SSI series, reservoir impacts on hydrological drought were grouped into four types: perishing drought, alleviating drought, aggravating drought, and inducing drought. Their meanings and classification rules are summarized in Table 2.
Table 2.
The implications and classification criteria of reservoir impacts on hydrological drought.
Run theory, originally proposed by Yevjevich [40], was also employed to extract drought-event attributes, including duration, severity, and peak intensity. A threshold of −0.5 was adopted to determine the onset and termination of each drought event. Events lasting only 1 month with severity below 1.5 were omitted. When two events were separated by a single month, they were merged, and the total duration was defined as the sum of the two sub-event durations plus the intervening month.
2.3.3. Estimation of Contributions for Different Regions
The SSI only represents the deviation of streamflow from the normal level, which can not reveal the quantified relationship of drought severity between the outlet and different regions because of the different statistical characteristics (e.g., average value and variance) of streamflow at various gauges. Here, we adopted the concept of the variable threshold level (VTL) method [4] and assumed a linear superposition relationship of streamflow deficits (D) among various gauges at a monthly scale, shown as the following equation:
Then, the contributions of different regions to drought severity at the outlet can be estimated in the following steps:
Step 1: Determining the thresholds of streamflow for hydrological drought identification. Generally, the thresholds were adopted as 70th or 80th percentile of monthly streamflow. Differently, we adopted the streamflow values corresponding to the SSI values equaling −0.5 as the thresholds to keep consistent with other results based on SSI.
Step 2: Calculation of streamflow deficit of different regions. For tributaries, the deficit can be estimated by subtracting the corresponding thresholds from the streamflow series. For interval regions between TNH and XH (Int1) and XH and LZ (Int2), we assumed a linear relationship of streamflow between hydrological stations in upstream and downstream and interval regions. The monthly deficit can be estimated as
Step 3: Estimation of the contribution of different regions to drought severity at the outlet. According to the identified start and termination times of a drought event at the outlet, the relative contribution rate can be computed as
where i and j represent the ith drought event and jth regions, respectively; ds and dt are the start and termination times of one drought event at LZ, respectively; and R is the relative contribution rate. An R value of less than zero represents corresponding areas that produce surplus runoff during the drought period. Conversely, a value of greater than zero represents a positive contribution to drought formation.
Step 4: Finally, we applied the Mann–Kendall trend analysis to examine temporal trends in the absolute deficits and relative contribution rates of different tributaries. The detailed methodology can be found in the study by Yıldız et al. [41].
2.3.4. Cross Wavelet Transform Method
The cross wavelet transform (CWT), as a new multi-signal and multi-scale analysis technique, can reveal the time-frequency correlation between two time series, which has been widely applied in hydrological research. The CWT for two time series xn and yn can be expressed as follows:
where and represent the continuous wavelet transformation of two series, and the * is the complex conjugate. |Wxy| is the power spectrum of CWT, reflecting the time-frequency-amplitude information. A greater value represents a higher correlation between the two time series. The related codes can be downloaded from Grinsted et al. [42] at http://www.pol.ac.uk/home/research/waveletcoherence/ (accessed on 23 July 2025). In this study, the relationships between hydrological drought and large-scale climate indices were explored by using the CWT.
3. Results
3.1. Natural Hydrological Drought Evolution and Contribution of the Tributaries
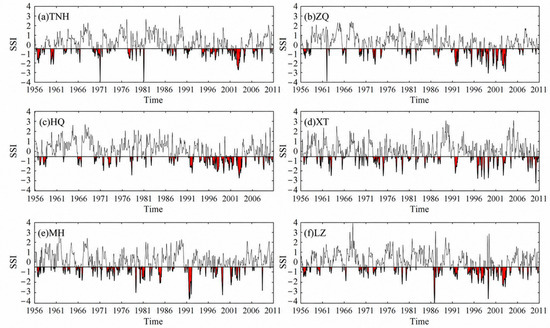
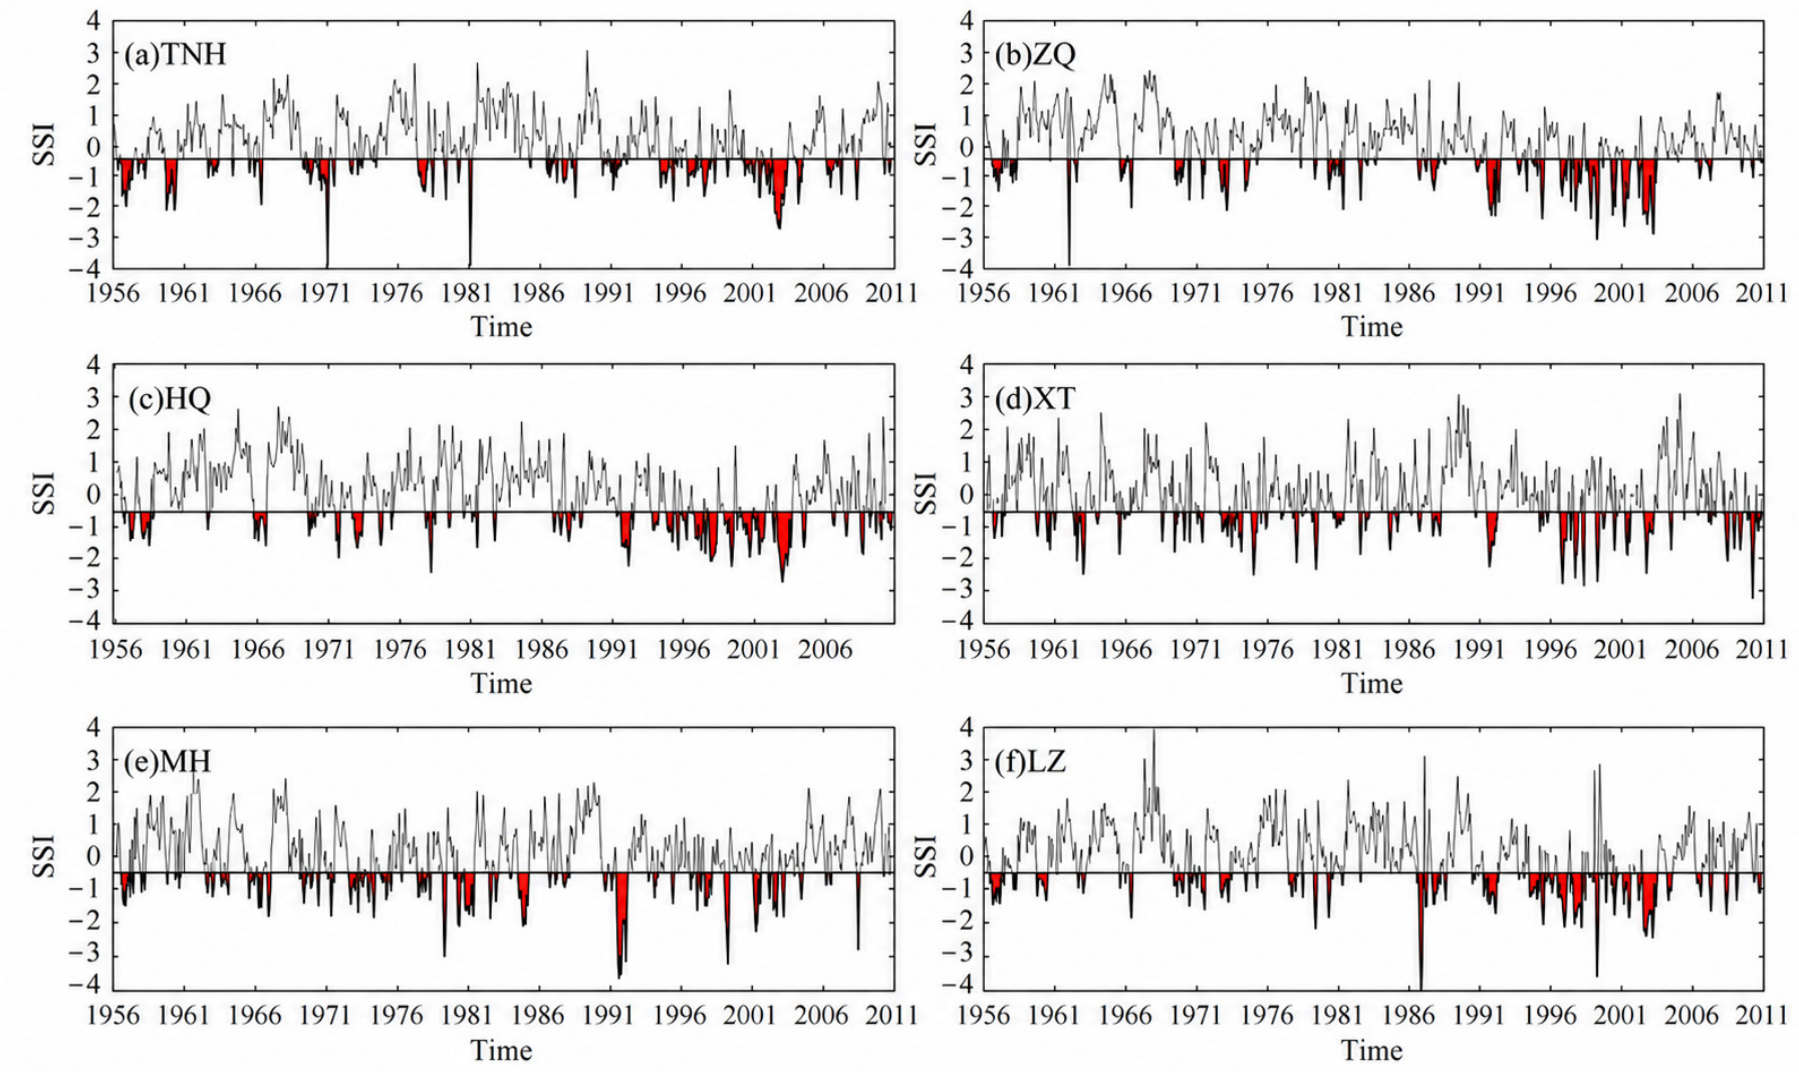
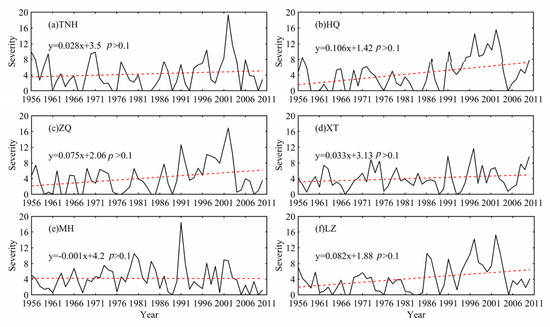
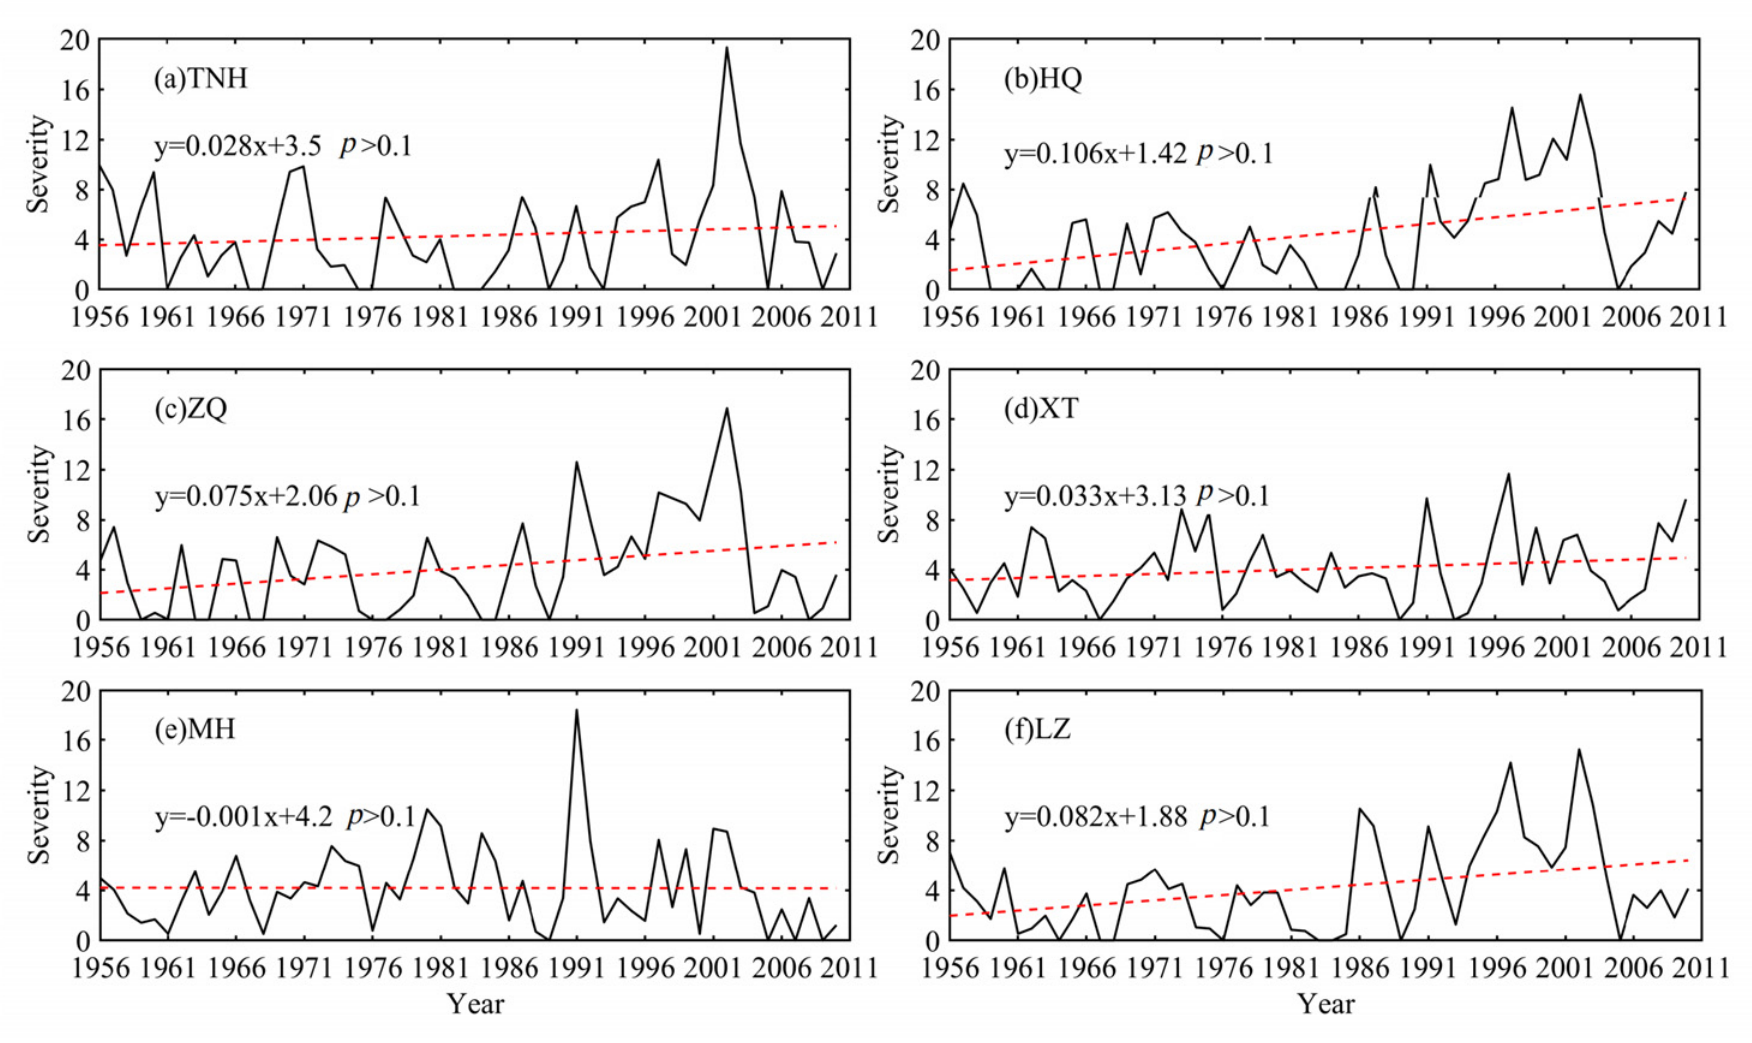
We assessed the hydrological drought evolution of both the main stream (TNH and LZ stations) and four tributaries, as shown in Figure 3. Notably, the SSI variations of LZ (Figure 3f) exclude the influences of reservoirs. Generally, hydrological drought in the UYRB occurred frequently from 1956 to 2010, especially from 1991 to 2005. Serious hydrological drought events were reported in 1991, 1997, and 2003, which was consistent with the historical records, indicating that the SSI was effective for hydrological drought evaluation in the study area. For a better understanding of the drought variations, the severity at yearly scale was computed by the sum of SSI values that were less than −0.5 in a given year, as shown in Figure 4. Hydrological drought severity of these gauges showed four severe drought years, i.e., 1991, 1997, 2002, and 2003. Among these, the most severe drought year for TNH, HQ, ZQ, and LZ stations was 2002, and those for the XT and HQ stations were 1997 and 1991, respectively. Additionally, the drought severity for the TNH, HQ, ZQ, XT, and LZ stations showed an increasing trend, with change rates of 0.28/10a, 1.06/10a, 0.75/10a, 0.33/10a, and 0.82/10a, respectively, while a decreasing trend was shown for MH with a change rate of −0.01/10a. These results suggest that the overall hydrological drought in the UYRB became more dramatic during 1956–2010. Notably, based on the Mann–Kendall trend test, none of these trends was statistically significant (p > 0.1).
Figure 3.
Variations of SSI series for the six stream gauging stations in the UYRB from 1956 to 2010. The black line denotes the SSI index, and the red area represents the duration of hydrological drought.
Figure 4.
Drought severity variations at the yearly scale for the six stream gauging stations in the UYRB from 1956 to 2010. Black lines represent drought severity, and the red dashed lines denote their trend line.
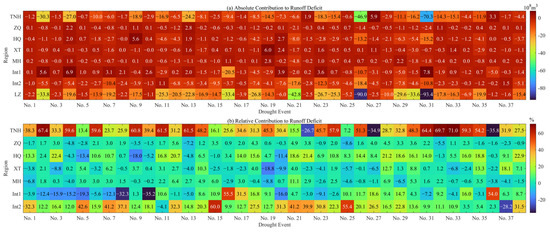
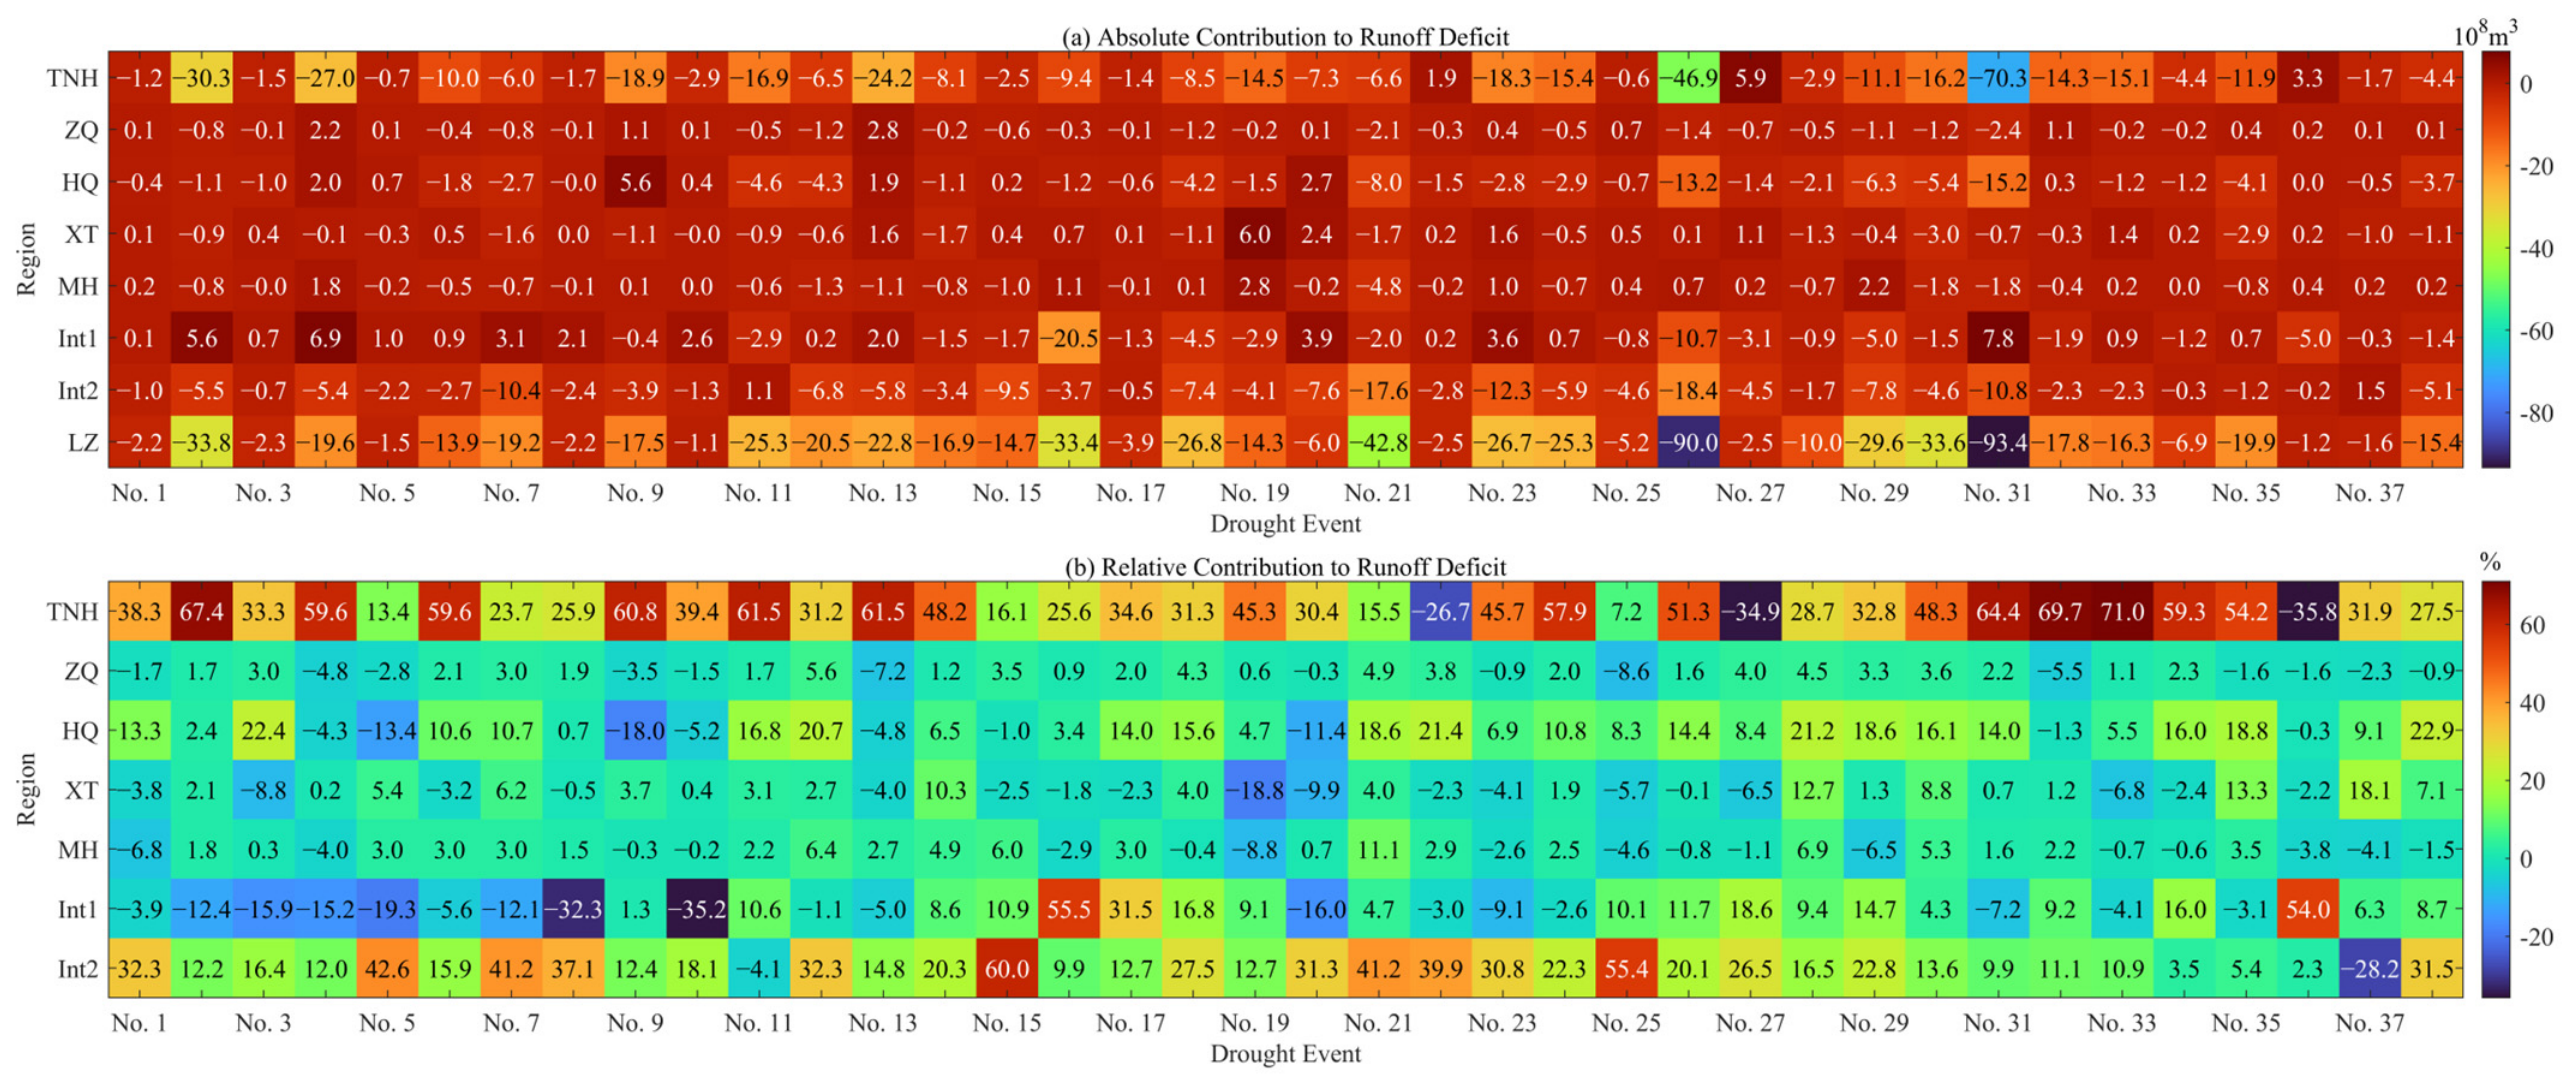
Since the timing and intensity of droughts at different stations were not always consistent, in this section, the contributions of hydrological drought from different regions to the LZ station were quantified (Figure 5 and Table 3). Here, 38 drought events were identified by using the run theory from 1956 to 2010. It can be observed that the runoff deficit of different regions and their contribution to the LZ have obvious gaps over these drought events. For the average absolute contributions, the TNH contributed the largest runoff deficit, followed by Int2, HQ, ZQ, MH, Int1, and XT. And, their average relative contributions were 36.2%, 20.9%, 8.2%, 0.6%, 0.7%, 2.9%, and 0.6%, respectively. For severe drought events, such as Nos. 31 and 26, the runoff deficit at TNH was predominantly larger than the sum of other tributaries, suggesting that the drought intensity at TNH played a decisive role in the formation of severe drought events in the UYRB. For those events with lighter severity, their formations were correlated with different tributaries.
Figure 5.
The absolute (a) and relative (b) contributions of runoff deficits from tributaries to hydrological drought at the LZ stream gauging station. The positive values in panels (a) and negative values in panels (b) indicate that no drought occurred in these regions.
Table 3.
The averages and trends of absolute and relative contributions of runoff deficits from the tributaries to hydrological drought at LZ. n is the number of drought events. The * indicates statistical significance (p < 0.05).
The absolute and relative contributions of different tributaries to drought severity in the UYRB showed different trends over time (Table 3). The positive trends of the absolute contribution reflect a smaller deficit for a region in the formation of drought events in the total basin over time, such as at MH. In contrast, the negative trends reflect a larger deficit over time, such as in the other six regions. Among these regions, only the trend of Int1 was statistically significant, as confirmed by the Mann–Kendall test (p < 0.05). For the relative contribution, TNH, MH, and Int2 showed a negative trend, indicating a gradually smaller effect of these regions on drought formation in the UYRB. And, the other regions showed a gradually larger effect, especially for Int1, with a change rate of 0.732%/n. Notably, only the relative contributions of Int1 and Int2 passed the Mann–Kendall test (p < 0.05). For TNH and Int2, the absolute contribution increased, while the relative contribution exhibited a decreasing trend, indicating that drought in the UYRB became more severe.
3.2. The Effects of Reservoirs on Hydrological Drought
3.2.1. Effects on Drought Severity at Yearly Scale
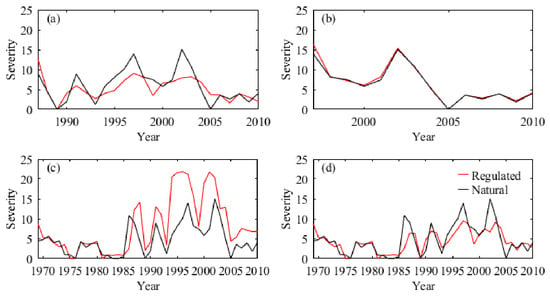
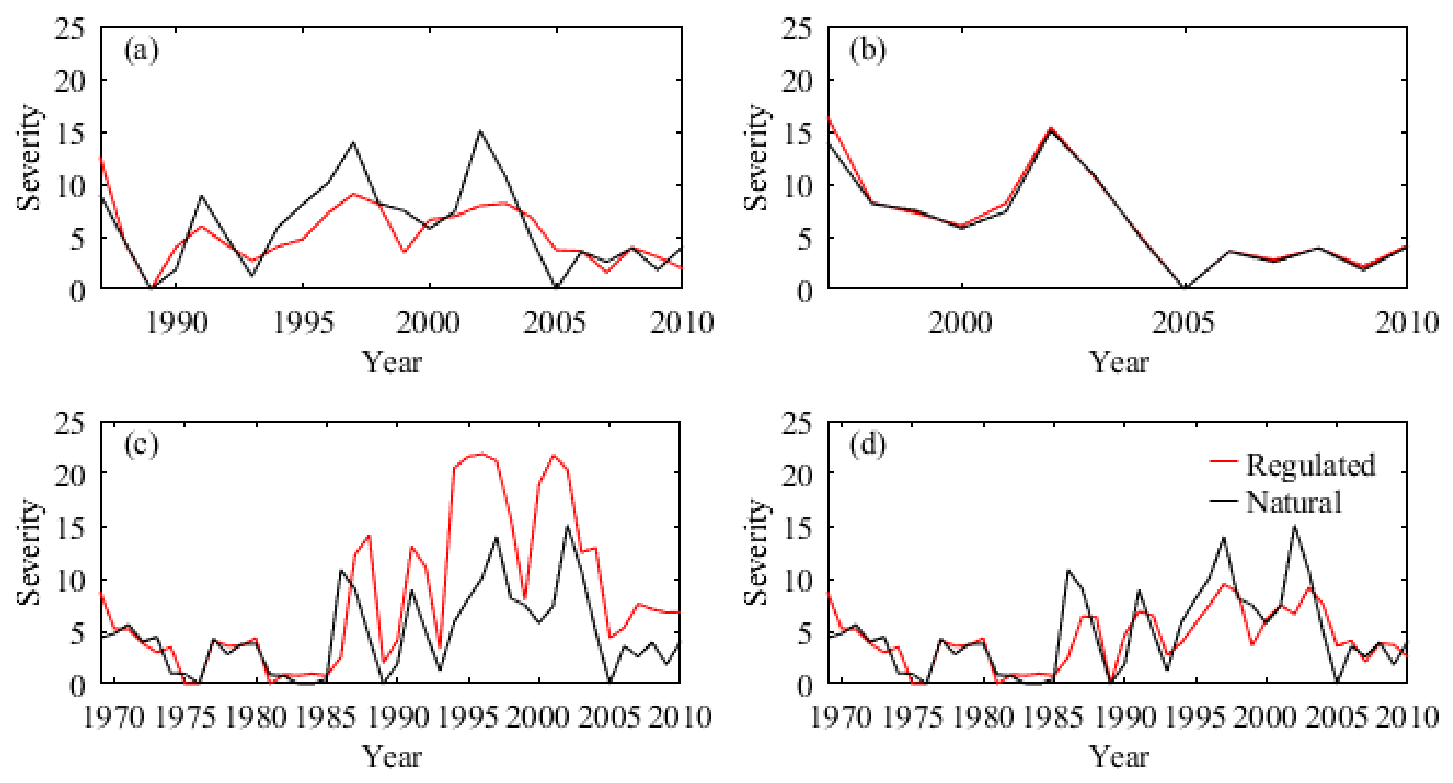
Figure 6 exhibits the drought severity at a yearly scale under natural scenario and reservoir regulations. The comparison between the two series of drought severity indicated that the impacts of the three large reservoirs on hydrological drought were different. Intuitively, the Liujiaxia and Longyangxia reservoirs generally aggravated and mitigated the drought severity, respectively, while the Lijiaxia reservoir had a limited influence. The cascade reservoirs significantly reduced the severity of severe drought years such as 1986, 1997, and 2002; among these, the decrease in 1986 was attributed to the Liujiaxia reservoir. After the construction of Longyangxia, the role of the Liujiaxia reservoir changed, which promoted drought formation at LZ. For those years with lower drought severity under natural conditions, the cascade reservoirs increased the drought severity, such as in 1993, 2005, and 2009.
Figure 6.
The annual variation in hydrological drought severity under the natural scenario and reservoir-regulated scenarios of Longyangxia (a), Lijiaxia (b), Liujiaxia (c), and cascade reservoirs (d) at stream gauging station LZ.
3.2.2. Effects on Drought Severity at Monthly Scale
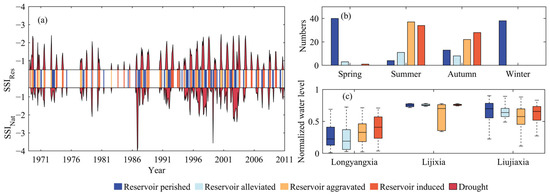
Figure 7a illustrates the drought severity variations under the natural scenario and cascade reservoir regulation at a monthly scale and the corresponding types of reservoir impact. Intuitively, the cascade reservoirs effectively mitigated the extreme drought conditions, but hydrological droughts were still frequent. The number of months that the SSI value was less than −0.5 totaled 176 and 144 from 1969 to 2010 under the natural scenario and cascade reservoir influences, respectively. The numbers of monthly droughts that perished or were alleviated, aggravated, or induced by cascade reservoirs were 95, 22, 59, and 63, respectively, reflecting both the positive and negative influences of the reservoirs on drought formation.
Figure 7.
The impacts of cascade reservoirs on hydrological drought variations (a) and their linkages with seasons (b) and normalized water levels of a single reservoir (c). The red segments represent drought events, whereas the other colors indicate different effects of reservoir regulation on drought.
Moreover, Figure 7b shows the number of different impacts of reservoirs during various seasons. We found that the aggravating and inducing effects mainly occurred in summer and autumn, while the perishing effect could be observed in all seasons, especially in spring and winter. For the alleviating effect, it occurred most frequently in the summer, followed by autumn and spring. The boxplot of normalized water levels (i.e., the results normalized by dead level and dam top elevation) of three reservoirs corresponding to four reservoir effects is shown in Figure 7c. The water levels of Lijiaxia had poor linkage with the effect types, while those of Liujiaixia and Longyangxia were closely associated. In general, the cascade reservoir showed aggravating and inducing effects when Longyangxia had higher water levels but exhibited perishing and alleviating effects at relatively low water levels. For the Liujiaxia reservoir, an inverse pattern to that of Longyangxia could be observed.
3.2.3. Effects on Drought Events
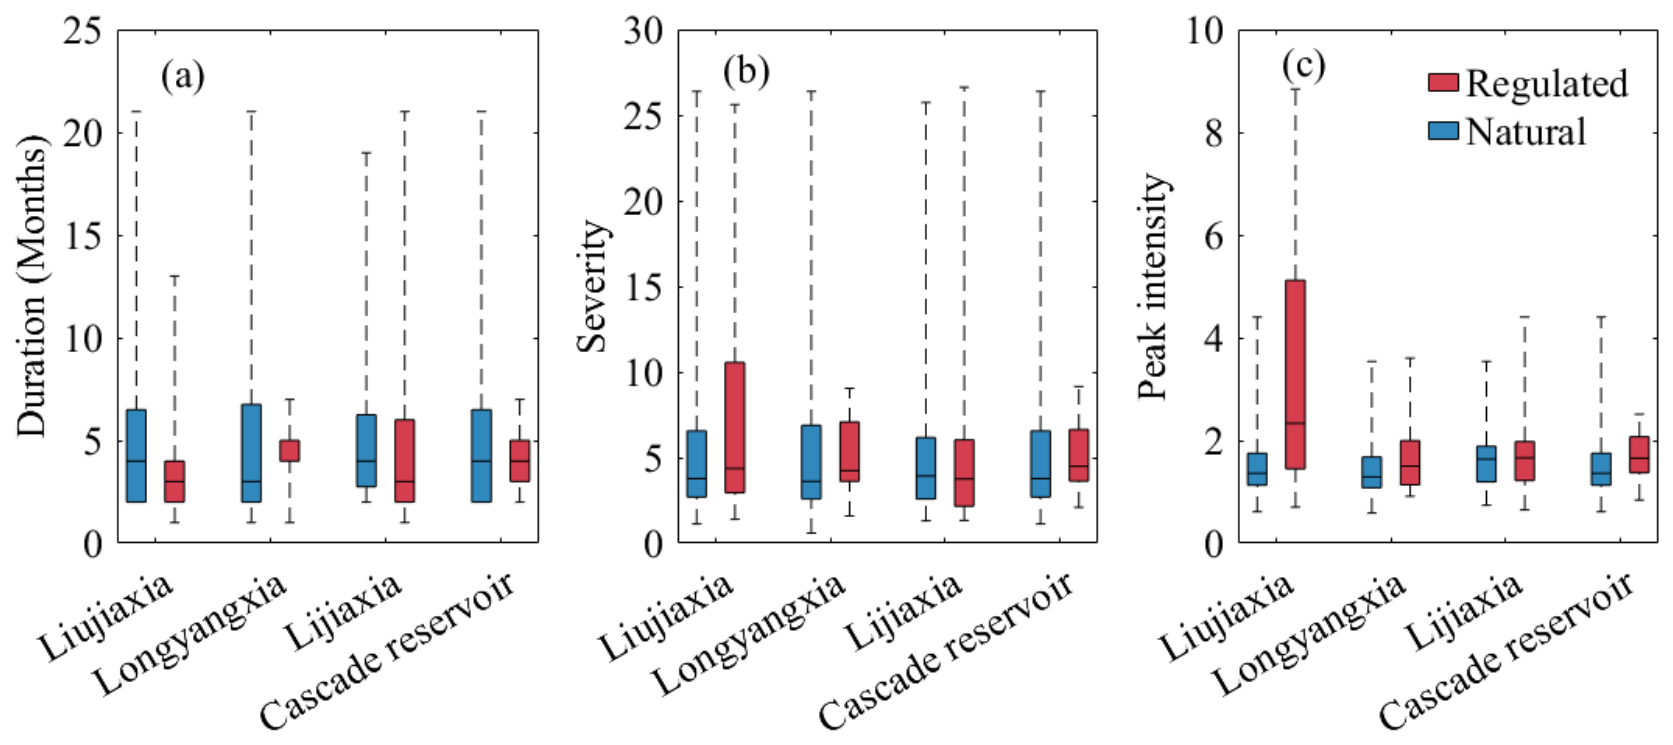
Using the run theory, 32, 23, and 13 drought events under the natural scenario were identified during the periods of 1969–2010, 1987–2010, and 1997–2010, respectively. Meanwhile, for the regulated scenario, 45, 24, 14, and 34 drought events were obtained under the influences of Liujiaxia, Longyangxia, Lijiaxia, and cascade reservoirs, respectively. Figure 8 presents the characteristics of drought events under natural and regulated conditions. The mean drought durations influenced by Liujiaixia, Longyangxia, Lijiaxia, and cascade reservoirs were 4.1, 4.4, 5.5, and 4.1 months, respectively, while the corresponding natural durations were 5.4 5.6, 5.8, and 5.4 months, respectively, showing that reservoirs reduced the average drought durations. Mean drought severity increased from 5.8 to 7.3 under the impact of Liujiaxia but decreased from 6, 6.6, and 5.8 to 5.2, 6.6, and 5.2 under the influences of Longyangxia, Lijiaxia, and cascade reservoirs, respectively. The average peak intensity was generally enlarged under the regulations of both single and cascade reservoirs. Additionally, for the characteristics of extreme drought events, the Liujiaixa, Longyangxia, and cascade reservoirs mitigated the duration and severity, while these were intensified by the Lijiaxia. The maximum peak intensity increased from a range between 3.5 and 4.4 to a range between 3.6 and 8.8 due to single reservoir regulation but decreased from 4.4 to 2.5 under cascade reservoir regulation.
Figure 8.
Differences in duration (a), severity (b), and peak intensity (c) of drought events between the natural and regulated scenarios. Whiskers indicate the minimum and maximum values.
Also, given the reported different influences of reservoirs on different drought events [21], Table 4 lists the characteristics of drought events with short and long durations. Here, the classification criteria were determined by the mean duration of natural and regulated events. Generally, the increased numbers of drought events were related to the separation from one event to several sub-events under the reservoir impacts, and the reservoirs always exacerbated the peak intensity. For the events with shorter duration, both mean duration and severity increased due to the impacts of Liujiaixa, Longyangxia, and cascade reservoirs. For longer droughts, both duration and severity were reduced because of the regulation of Longyangxia and cascade reservoirs, while Liujiaxia only shortened the duration but exaggerated the severity. As for Lijiaxia, it mitigated the shorter droughts and intensified longer droughts, but its impacts were much smaller than those of the other two reservoirs. These results suggested that the cascade reservoirs effectively mitigated drought by interrupting the continuity of events with long duration. Moreover, the influences of the three reservoirs were different; of these, the Longyangxia had the most dramatic effect on drought mitigation.
Table 4.
The numbers and average duration, severity, and peak intensity of natural and regulated drought events for two scenarios.
Table 5 lists the frequency, severity, and duration of natural and different regulated scenarios during different periods. The Liujiaxia, Longyangxia, and Lijiaxia reservoirs commenced operation in 1969, 1987, and 1997, respectively. Drought frequency showed pronounced decadal variability under both natural and reservoir-regulated conditions. The highest frequencies occurred during 1991–2000, reaching 54.2% under the influence of the Liujiaxia reservoir, compared with 38.3% under natural conditions. Drought severity during 1991–2000 was the most serve. In particular, drought severity under the Liujiaxia scenario reached 155.3, which was substantially higher than that under natural conditions (61.0) and the other reservoir-regulated scenarios. Although drought severity decreased during 2001–2010, the Liujiaxia scenario still showed a markedly higher value (105.4) than the natural scenario (50.6), indicating its pronounced influence on drought severity during the later periods. Drought duration also showed pronounced decadal variability, with the longest events generally occurring during 1991–2000. The mean drought duration increased from 4.6 months under natural conditions to 6.5 months under the influence of the Liujiaxia reservoir, while the Longyangxia scenario showed only a slight increase (4.7 months). Although drought duration decreased during 2001–2010, it remained longer under the reservoir-regulated scenarios, particularly under the Liujiaxia scenario (5.1 months), than under natural conditions (3.9 months). The Longyangxia reservoir alleviated drought through supplemental water releases, whereas the Liujiaxia and Lijiaxia reservoirs exacerbated drought conditions. Specifically, cascade reservoirs operate by storing water during the flood season and releasing water during the dry season, thereby increasing drought frequency while reducing drought severity.
Table 5.
The frequency, severity, and duration of natural and different regulated scenarios during different periods.
3.3. Relationships Between Climate Indices and Hydrological Drought
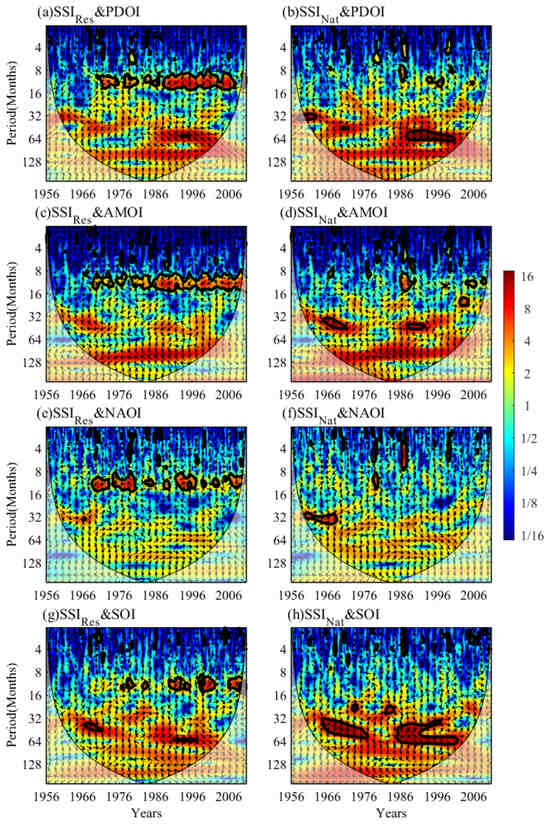
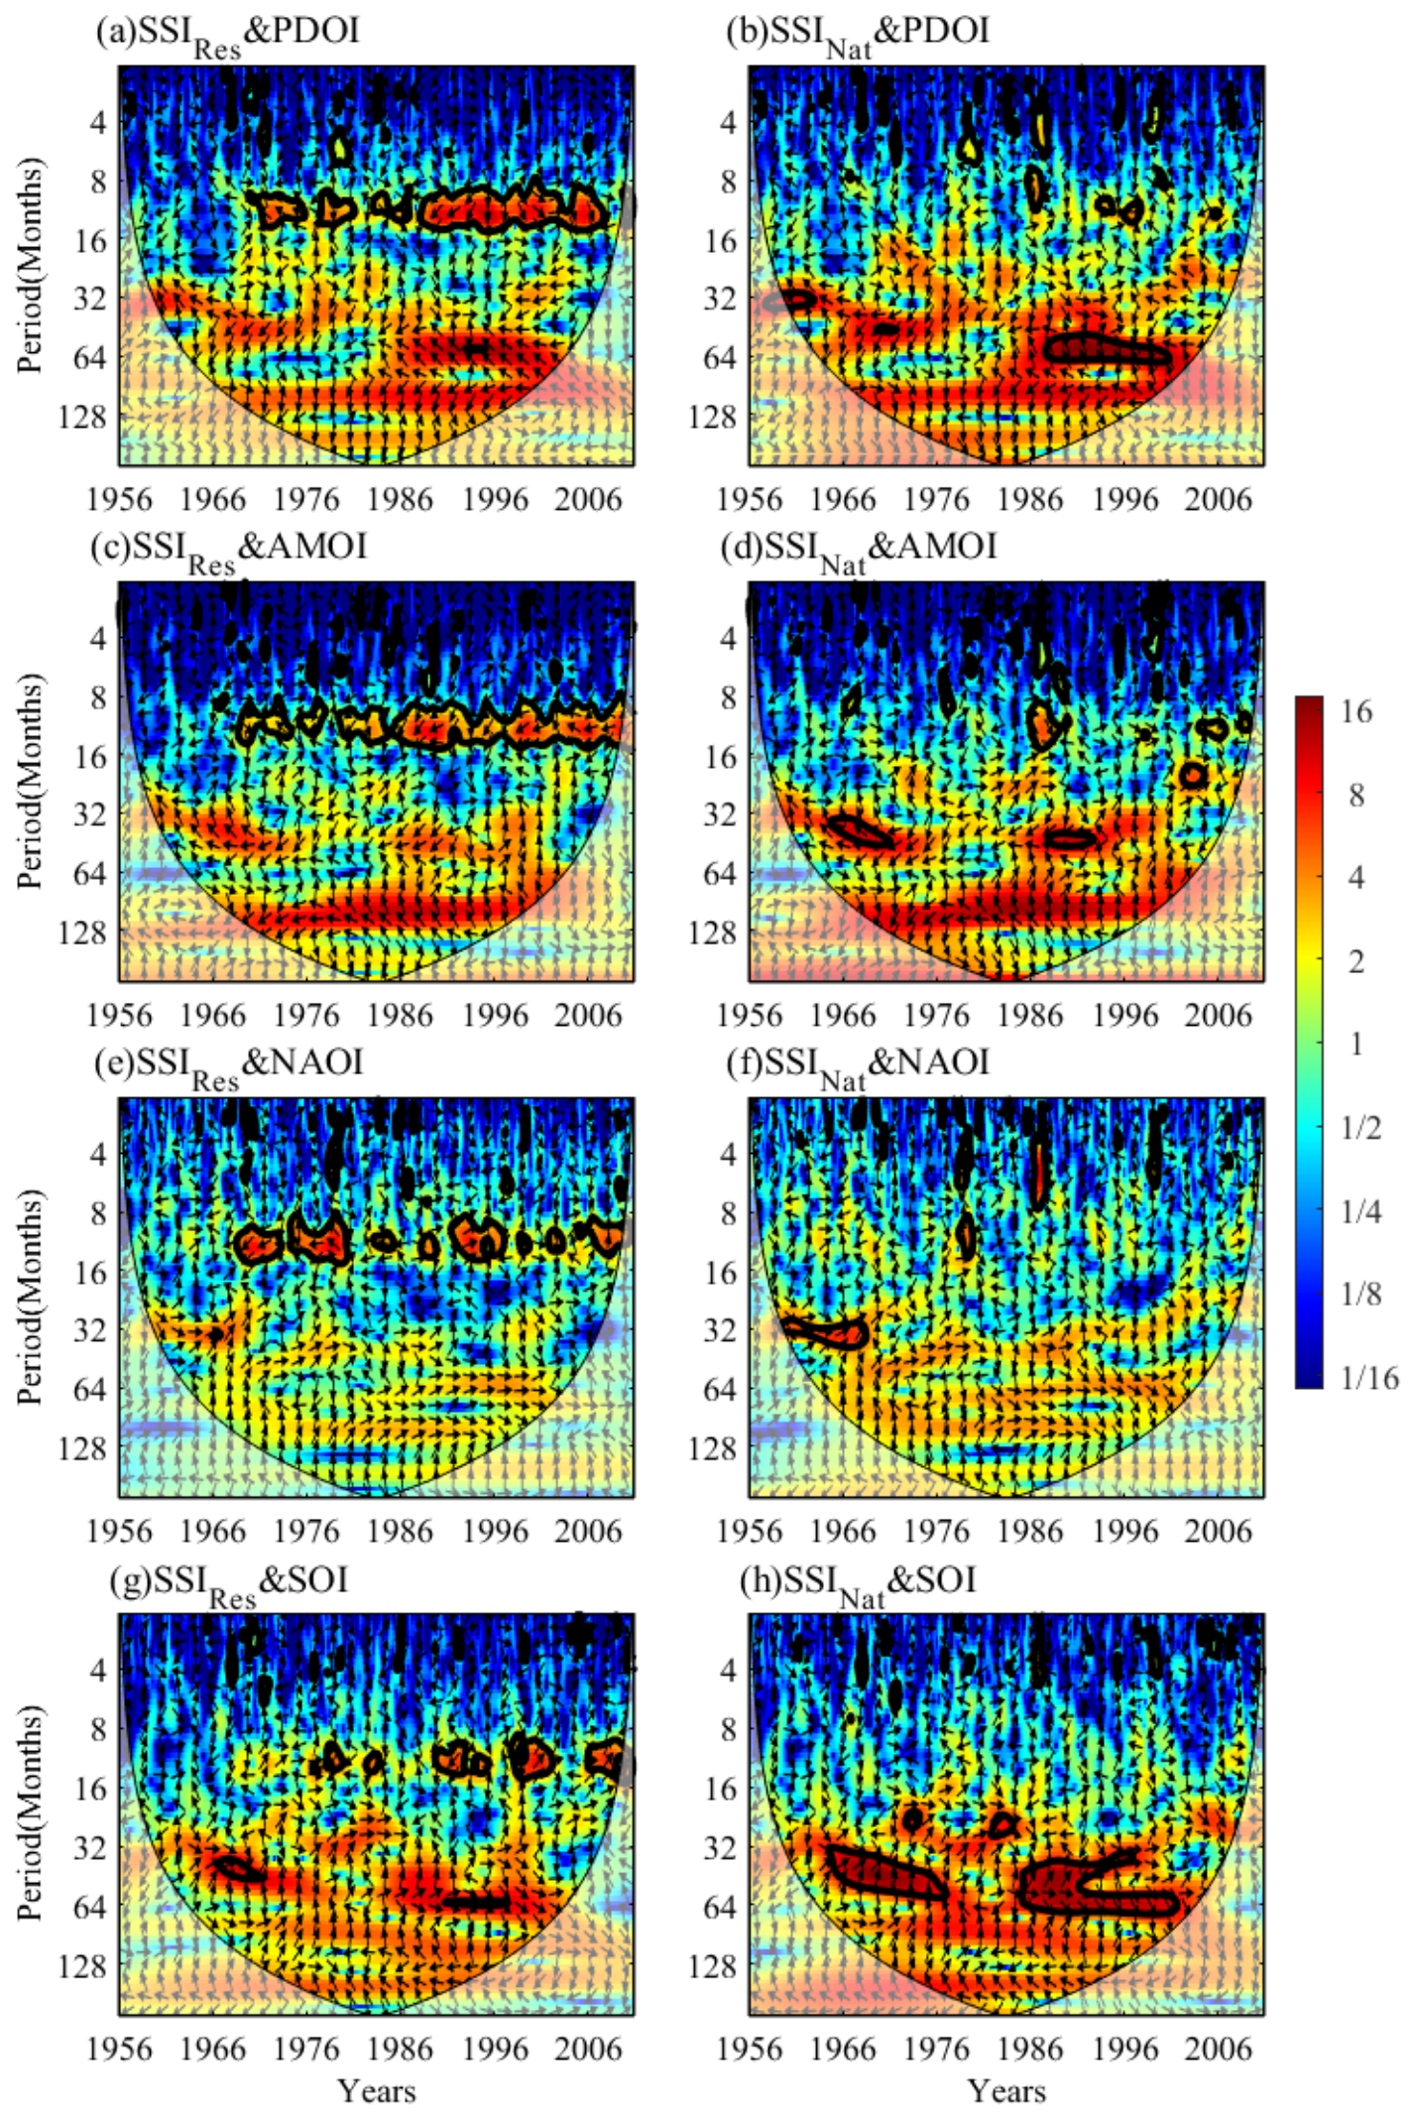
As shown in Figure 9, the linkages between climate indices and hydrological drought have been widely recognized; however, the correlation may be influenced by the large reservoirs. Accordingly, the relationships between the four major climate indices (i.e., PDOI, AMOI, NAOI, and SOI) and two SSI series based on naturalized and observed streamflow at LZ were explored by CWT. From the visualization, in comparison with the regulated SSI, the correlation between climate indices and naturalized SSI was more significant. From the start of reservoir regulation in 1969, the significant influences of PDO, AMO, NAO, and ENSO on hydrological drought have been similar, mainly manifesting on a timescale of 8–16 months. However, the naturalized hydrological drought exhibited various responses to these indices. The PDO had a significant negative correlation with the naturalized SSI series, with a 64-month signal in 1987–2001. The effects of AMO on hydrological drought were mainly reflected on a scale of 32–48 months in 1964–1972 and 1988–1992. NAO had a positive correlation with SSI from 1959 to 1968, with a 32–38-month signal. ENSO had a positive correlation with hydrological drought, with a signal on the scale of 32–64 months during the periods of 1964–1978 and 1984–2002. Moreover, a short-term intermittent resonance period of 1–8 months could be observed from the variations in climate indices and hydrological drought from 1956 to 2010. Based on this, the cascade reservoirs disturbed the linkages between hydrological drought and climate indices in the UYRB, indicating that the results without considering the large reservoir influence may be biased.
Figure 9.
The cross-wavelet transforms between monthly natural SSI (a,c,e,g) and regulated SSI (b,d,f,h) and four major climate indices at LZ station from 1956 to 2010. The arrows pointing left and right represent negative and positive correlations, respectively. The 5% significance level against red noise is exhibited as a thick contour, and the right color bar is the wavelet energy.
4. Discussion
4.1. Main Findings
Revealing hydrological drought variations and mechanisms is a classical open question in drought research. Understanding the mechanisms of hydrological drought is increasingly important under global warming and increasing human activities. Despite substantial research efforts, hydrological drought mechanisms have not been fully interpreted, mainly because of the complex climatic characteristics and anthropic factors. Here, we explored hydrological drought variations in the UYRB, and we analyzed their relationships with tributary contribution, reservoir regulation, and large-scale climate indices. Corresponding to the questions mentioned in the introduction section, our study produced three main findings.
First, we further identified the relationships of drought between the whole basin and various water yield areas using the VTL method. For 38 drought events in the UYRB, the severity depended primarily on that of the regions above TNH, HQ, and Int2, accounting for contribution rates of more than 60% (Figure 5). The regions above TNH and HQ, as the main water yield areas in the UYRB, contribute 64% and 14% of annual runoff at LZ, respectively; thus, their enormous contributions to drought were understandable. As for Int2, located in the downstream area of the UYRB, its contribution was related to low precipitation, human water withdrawals, groundwater recharge, evaporation losses, etc. Previous studies have suggested that meteorological drought is a primary driver of hydrological drought [17,28], and meteorological drought over larger areas generally posed a higher risk to water resources [43]. Differently, according to our findings, we inferred that the impacts of meteorological drought in non-key areas on hydrological drought across the whole basin may be limited. Namely, meteorological drought in key areas is the determining factor for hydrological drought severity. Almost all of the drought severity for different water yield regions in the UYRB showed an increasing trend from 1956 to 2010, mainly relating to decreasing precipitation and increasing temperature [44,45]. Several studies indicated that the temperature in the UYRB would keep increasing over the next few decades [46]. Consequently, we recommend that the relevant departments should focus more on the hydrological situations in the three key regions to cope with potential drought risks with climate warming.
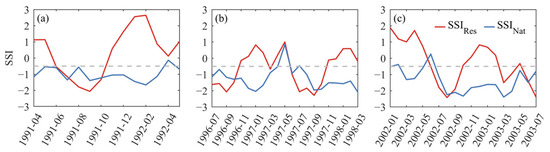
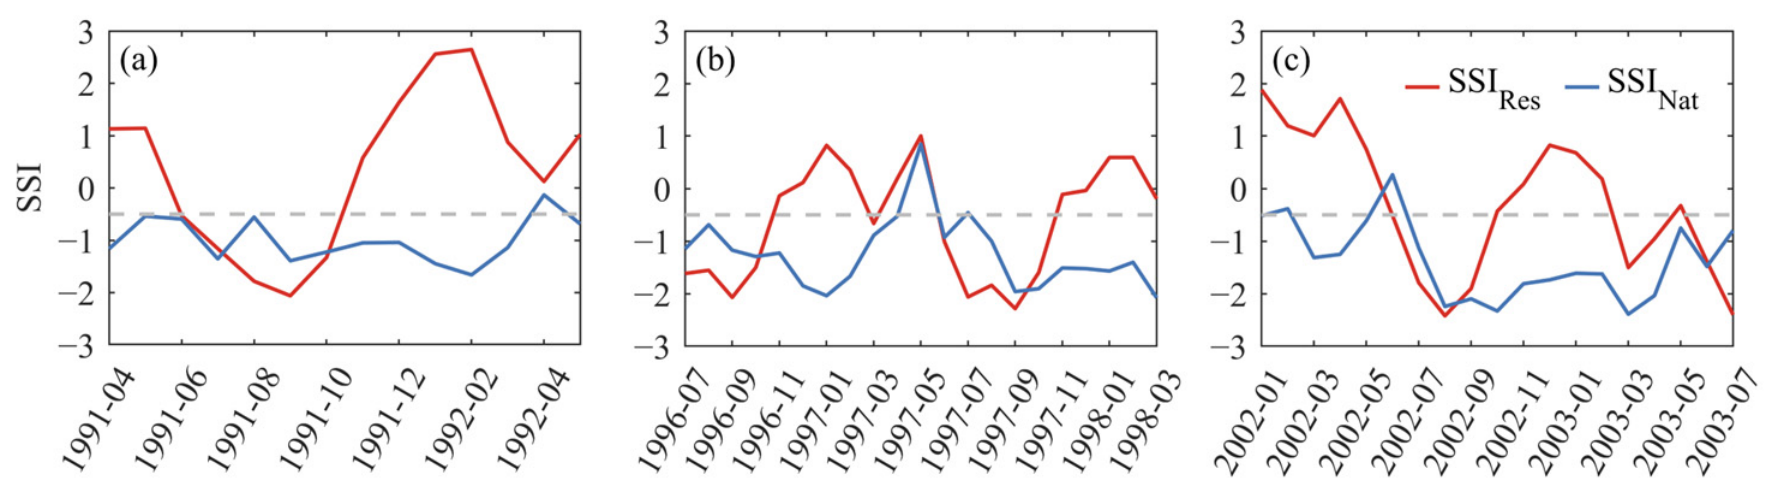
Second, we found that reservoir regulation changed hydrological drought variations at yearly, monthly, and event scales. In the UYRB, reservoirs effectively reduced yearly drought severity (Figure 6). In general, reservoirs with flood-control and water-supply functions tend to store water during the flood season and release water during the dry season. This operation reduces downstream streamflow during the flood season and may increase the frequency of hydrological drought. Conversely, water releases during the dry season make hydrological drought less likely to occur. Following the pattern of storing water during flood season and releasing water in dry season, reservoirs generally mitigated drought in spring and winter but aggravated drought in summer and autumn (Figure 7b). As mentioned by Xing et al. [47], considering different kinds of reservoir regulations is important in drought analysis. The Longyangxia reservoir played a primary role in drought mitigation, while Lijiaxia had a weak influence due to its power generation function. As the leading reservoir on the Yellow River, the Longyangxia reservoir has multi-year regulation capacity and therefore plays the most prominent role in drought mitigation. Following the construction of the Longyangxia reservoir, the operation mode of the Lijiaxia reservoir changed, resulting in a different pattern of influence on hydrological drought. In addition, the Lijiaxia reservoir has only daily regulation capacity; thus, its influence on hydrological drought variations at the monthly scale is limited. In fact, managers of water resources systems tended to a sequence of smaller deficits rather than a potential catastrophic deficit [48]. Figure 10 shows the natural and regulated SSI variations during the periods of the three most severe drought events. Reservoirs broke the continuity of drought events lasting for a long time, which explained the increasing number of drought events. Although the operation rules for the three reservoirs were distinct, their combined regulation effectively reduced the severity and duration, especially under extreme conditions. Ji et al. [29] projected that future hydropower operations would shorten hydrological drought duration while increasing drought frequency. Consistent with this projection, our results show that the historical operations of the three reservoirs had similar effects on hydrological drought. Notably, our results showed relatively few numbers of droughts mitigated by reservoirs in summer and autumn (Figure 7b), relating to the greater streamflow deficit when drought occurred during the period. Once the hydrological drought occurs in flood season, reservoirs may show difficulty in mitigating drought due to limited stored water and inadequate water replenishment, which demands a more scientific operation rule. Lakes and reservoirs can regulate water storage and releases in an orderly manner to secure water supply and mitigate increasingly frequent droughts induced by climate change [49]. For example, the Seyhan Dam in Türkiye has been considered an important tool for climate change adaptation [50]. The method proposed in this study can also be applied to investigate reservoir regulation and hydrological drought under changing climate conditions. In particular, examining how climate change alters reservoir operating rules represents a valuable direction for future research.
Figure 10.
The variations in SSI under the natural and regulated scenarios during the periods of the first (a), second (b) and third (c) most severe hydrological drought events.
Third, it was shown that a pseudo association may exist between climate indices and hydrological drought without excluding the effect of large reservoirs. For example, Huang et al. [51] indicated that human activities did not disturb the basic pattern of these correlations in the Columbia River basin. Differently, reservoirs changed the drought timing and severity in the UYRB (Figure 7), which further altered the linkages with climate indices (Figure 9). Here, we thought that the difference was derived from the extent of human disturbance. As shown in Figure 2a, with multi-year regulation ability, the impacts of the Longyangxia reservoir are sufficient to affect the streamflow variation at yearly and monthly scales. Given the important role of climate indices in the study of drought formation [36], it is necessary to reveal the linkage between hydrological drought and climate indices for drought warnings and forecasting. For those watersheds with strong anthropogenic disturbance, we recommend that the effects of human activity should be appropriately excluded to obtain the right relationships.
Overall, our findings provide useful implications for hydrological drought mitigation. First, we identified the key subregions that exert dominant influences on basin-wide hydrological drought, and these areas should therefore receive greater attention in drought monitoring. Second, the effects of three large reservoirs with distinct regulation capacities on hydrological drought were quantified, providing a scientific basis for further optimizing their operational strategies. Finally, when teleconnection indices are used to provide early warning of hydrological drought, the effects of large-reservoir regulation should be removed to identify the actual predictive signals and improve the reliability of drought forecasting. The methodological framework developed in this study is particularly applicable to basins strongly affected by human activities. Before investigating the teleconnection mechanisms of hydrological drought, streamflow series should be naturalized; otherwise, human activities may substantially confound the identified relationships.
4.2. Uncertainties and Limitations
In this study, we assumed the linear superposition relationship between the monthly streamflows from different regions, ignoring the influence of lag time, which may cause some uncertainties in the results. Therefore, a physical method is needed to precisely identify the contributions of different regions. This study relied entirely on observational records; the results provide direct evidence of how large reservoirs affect hydrological drought. However, because reservoir inflow and outflow data were available only up to 2010, how these reservoirs have affected hydrological drought in recent years remains unclear. Recent research has shown that dense networks of small reservoirs can also markedly prolong hydrological drought duration [52]. The influences of small reservoir networks on hydrological drought evolution need to be further revealed in future research. Moreover, the changes in vegetation cover also closely link with hydrological drought [53], but their relationships in the UYRB are still unclear. With the increasing greening trend in the UYRB [54], clarifying the impacts of vegetation is important for understanding the mechanism of hydrological drought in a changing environment. The results of this study rely on the use of an SSI threshold of −0.5 to identify hydrological drought, which is one of the most widely adopted criteria. It should be noted that alternative thresholds, such as −0.8 or −1.0, may lead to different conclusions. Evaluating the sensitivity of the results to different drought thresholds therefore represents an important direction for future research.
5. Conclusions
In this study, we explored the evolution of hydrological droughts and their linkages with different water yield areas, reservoir regulation, and large-scale climate indices within the UYRB.
Annual drought severity showed an increasing trend in almost all tributary sub-basins from 1956 to 2010, especially in the Tao River Basin. The source region of the UYRB, the Tao River Basin, and interval region 2 were key areas, which contributed 65.3% of the average streamflow deficit to drought formation in the UYRB. Reservoirs significantly reduced yearly drought severity, especially during dry years such as 1986, 1997, and 2002. The resistant effects of reservoirs mainly showed in winter and spring, and sometimes existed in summer and autumn, while the exaggerated effects almost always showed in summer and autumn. Reservoirs broke the continuity of drought events lasting for a long time; thus, the mean duration and severity of drought events were reduced, but the mean peak intensity was increased under the impacts of reservoirs. Specifically, the mitigated effects were mainly reflected in long-lasting drought events. Reservoirs significantly disturbed the linkages between hydrological drought and large-scale climate indices. In the UYRB, hydrological drought had the most significant response to ENSO and PDO at 32–64 months and 64 months, respectively.
Overall, the current study investigated the hydrological drought variations and identified the influences of key areas, reservoir regulation, and large-scale climate indices in drought formation. The results improve the understanding of the hydrological drought mechanisms and can provide useful information for drought warnings and forecasting in the UYRB.
Author Contributions
Conceptualization, Z.R. and X.L.; methodology, T.Z.; validation, X.L. and T.Z.; data curation, T.Z.; writing—original draft preparation, Z.R., X.L. and T.Z.; writing—review and editing, Z.R. and T.Z.; visualization, Z.R. and T.Z.; supervision, Z.R. and T.Z.; funding acquisition, Z.R. and T.Z. All authors have read and agreed to the published version of the manuscript.
Funding
The authors are grateful for funding from the Youth Talent Project of the Science and Technology Research Program of the Department of Education of Hubei Province (Q20251205).
Data Availability Statement
The original contributions presented in this study are included in the article. Further inquiries can be directed to the corresponding authors.
Acknowledgments
Thanks to all the co-authors, the financial support project for this study, the editorial department, and the reviewers for their support and help in this paper.
Conflicts of Interest
Author Zhongwei Ren was employed by the company Y.R. Wanjiazhai Water Multi-Purpose Dam Project Co., Ltd. The remaining authors declare that the research was conducted in the absence of any commercial or financial relationships that could be construed as a potential conflict of interest.
References
- He, X.; Wada, Y.; Wanders, N.; Sheffield, J. Intensification of hydrological drought in California by human water management. Geophys. Res. Lett. 2017, 44, 1777–1785. [Google Scholar] [CrossRef] [Scilit]
- Van Loon, A.F.; Van Lanen, H.A.J. Making the distinction between water scarcity and drought using an observation-modeling framework. Water Resour. Res. 2013, 49, 1483–1502. [Google Scholar] [CrossRef] [Scilit]
- Mishra, A.K.; Singh, V.P. A review of drought concepts. J. Hydrol. 2010, 391, 202–216. [Google Scholar] [CrossRef] [Scilit]
- Jiang, S.; Wang, M.; Ren, L.; Xu, C.Y.; Yuan, F.; Liu, Y.; Lu, Y.; Shen, H. A framework for quantifying the impacts of climate change and human activities on hydrological drought in a semiarid basin of Northern China. Hydrol. Process. 2019, 33, 1075–1088. [Google Scholar] [CrossRef] [Scilit]
- Van Loon, A.F. Hydrological drought explained. Wiley Interdiscip. Rev. Water 2015, 2, 359–392. [Google Scholar] [CrossRef] [Scilit]
- Zhang, Q.; Liu, J.; Singh, V.P.; Shi, P.; Sun, P. Hydrological responses to climatic changes in the Yellow River basin, China: Climatic elasticity and streamflow prediction. J. Hydrol. 2017, 554, 635–645. [Google Scholar] [CrossRef] [Scilit]
- Su, X.; Li, X.; Niu, Z.; Wang, N.; Liang, X. A new complexity-based three-stage method to comprehensively quantify positive/negative contribution rates of climate change and human activities to changes in runoff in the upper Yellow River. J. Clean. Prod. 2021, 287, 125017. [Google Scholar] [CrossRef] [Scilit]
- Xiong, L.; Xu, X.; Engel, B.; Huang, Q.; Huo, Z.; Xiong, Y.; Han, W.; Huang, G. Modeling agro-hydrological processes and analyzing water use in a super-large irrigation district (Hetao) of arid upper Yellow River basin. J. Hydrol. 2021, 603, 127014. [Google Scholar] [CrossRef] [Scilit]
- Jiang, C.; Zhang, L.; Tang, Z. Multi-temporal scale changes of streamflow and sediment discharge in the headwaters of Yellow River and Yangtze River on the Tibetan Plateau, China. Ecol. Eng. 2017, 102, 240–254. [Google Scholar] [CrossRef] [Scilit]
- Wei, Y.; Jiao, J.; Zhao, G.; Zhao, H.; He, Z.; Mu, X. Spatial–temporal variation and periodic change in streamflow and suspended sediment discharge along the mainstream of the Yellow River during 1950–2013. CATENA 2016, 140, 105–115. [Google Scholar] [CrossRef] [Scilit]
- Omer, A.; Zhuguo, M.; Zheng, Z.; Saleem, F. Natural and anthropogenic influences on the recent droughts in Yellow River Basin, China. Sci. Total Environ. 2020, 704, 135428. [Google Scholar] [CrossRef] [Scilit] [PubMed]
- Wang, F.; Wang, Z.; Yang, H.; Di, D.; Zhao, Y.; Liang, Q.; Hussain, Z. Comprehensive evaluation of hydrological drought and its relationships with meteorological drought in the Yellow River basin, China. J. Hydrol. 2020, 584, 124751. [Google Scholar] [CrossRef] [Scilit]
- Yuan, X.; Zhang, M.; Wang, L.; Zhou, T. Understanding and seasonal forecasting of hydrological drought in the Anthropocene. Hydrol. Earth Syst. Sci. 2017, 21, 5477–5492. [Google Scholar] [CrossRef] [Scilit]
- Lin, Q.; Wu, Z.; Singh, V.P.; Sadeghi, S.H.R.; He, H.; Lu, G. Correlation between hydrological drought, climatic factors, reservoir operation, and vegetation cover in the Xijiang Basin, South China. J. Hydrol. 2017, 549, 512–524. [Google Scholar] [CrossRef] [Scilit]
- Wang, Y.; Wang, S.; Zhao, W.; Liu, Y. The increasing contribution of potential evapotranspiration to severe droughts in the Yellow River basin. J. Hydrol. 2022, 605, 127310. [Google Scholar] [CrossRef] [Scilit]
- Barker, L.J.; Hannaford, J.; Chiverton, A.; Svensson, C. From meteorological to hydrological drought using standardised indicators. Hydrol. Earth Syst. Sci. 2016, 20, 2483–2505. [Google Scholar] [CrossRef] [Scilit]
- Huang, S.; Li, P.; Huang, Q.; Leng, G.; Hou, B.; Ma, L. The propagation from meteorological to hydrological drought and its potential influence factors. J. Hydrol. 2017, 547, 184–195. [Google Scholar] [CrossRef] [Scilit]
- Li, Q.; He, P.; He, Y.; Han, X.; Zeng, T.; Lu, G.; Wang, H. Investigation to the relation between meteorological drought and hydrological drought in the upper Shaying River Basin using wavelet analysis. Atmos. Res. 2020, 234, 104743. [Google Scholar] [CrossRef] [Scilit]
- Lian, J.; Chen, H.; Wang, F.; Nie, Y.; Wang, K. Separating the relative contributions of climate change and ecological restoration to runoff change in a mesoscale karst basin. CATENA 2020, 194, 104705. [Google Scholar] [CrossRef] [Scilit]
- Zhang, P.; Cai, Y.; Xie, Y.; Yi, Y.; Yang, W.; Li, Z. Effects of a cascade reservoir system on runoff and sediment yields in a River Basin of southwestern China. Ecol. Eng. 2022, 179, 106616. [Google Scholar] [CrossRef] [Scilit]
- Wu, J.; Chen, X.; Yu, Z.; Yao, H.; Li, W.; Zhang, D. Assessing the impact of human regulations on hydrological drought development and recovery based on a ‘simulated-observed’ comparison of the SWAT model. J. Hydrol. 2019, 577, 123990. [Google Scholar] [CrossRef] [Scilit]
- Liu, Y.; Ren, L.; Zhu, Y.; Yang, X.; Yuan, F.; Jiang, S.; Ma, M. Evolution of Hydrological Drought in Human Disturbed Areas: A Case Study in the Laohahe Catchment, Northern China. Adv. Meteorol. 2016, 2016, 5102568. [Google Scholar] [CrossRef] [Scilit]
- Rangecroft, S.; Van Loon, A.F.; Maureira, H.; Verbist, K.; Hannah, D.M. An observation-based method to quantify the human influence on hydrological drought: Upstream–downstream comparison. Hydrol. Sci. J. 2019, 64, 276–287. [Google Scholar] [CrossRef] [Scilit]
- Li, Q.; Zhou, J.; Zou, W.; Zhao, X.; Huang, P.; Wang, L.; Shi, W.; Ma, X.; Zhao, Y.; Xue, D.; et al. A tributary-comparison method to quantify the human influence on hydrological drought. J. Hydrol. 2021, 595, 125652. [Google Scholar] [CrossRef] [Scilit]
- Van Loon, A.F.; Rangecroft, S.; Coxon, G.; Breña Naranjo, J.A.; Van Ogtrop, F.; Van Lanen, H.A.J. Using paired catchments to quantify the human influence on hydrological droughts. Hydrol. Earth Syst. Sci. 2019, 23, 1725–1739. [Google Scholar] [CrossRef] [Scilit]
- Jehanzaib, M.; Shah, S.A.; Yoo, J.; Kim, T.-W. Investigating the impacts of climate change and human activities on hydrological drought using non-stationary approaches. J. Hydrol. 2020, 588, 125052. [Google Scholar] [CrossRef] [Scilit]
- Kang, L.; Jiang, S. Bivariate Frequency Analysis of Hydrological Drought Using a Nonstationary Standardized Streamflow Index in the Yangtze River. J. Hydrol. Eng. 2019, 24, 05018031. [Google Scholar] [CrossRef] [Scilit]
- Zhang, T.; Su, X.; Feng, K. The development of a novel nonstationary meteorological and hydrological drought index using the climatic and anthropogenic indices as covariates. Sci. Total Environ. 2021, 786, 147385. [Google Scholar] [CrossRef] [Scilit]
- Ji, P.; Yuan, X.; Jiao, Y. Future hydrological drought changes over the upper Yellow River basin: The role of climate change, land cover change and reservoir operation. J. Hydrol. 2023, 617, 129128. [Google Scholar] [CrossRef] [Scilit]
- Wu, J.; Yuan, X.; Yao, H.; Chen, X.; Wang, G. Reservoirs regulate the relationship between hydrological drought recovery water and drought characteristics. J. Hydrol. 2021, 603, 127127. [Google Scholar] [CrossRef] [Scilit]
- Bai, T.; Chang, J.; Chang, F.-J.; Huang, Q.; Wang, Y.; Chen, G. Synergistic gains from the multi-objective optimal operation of cascade reservoirs in the Upper Yellow River basin. J. Hydrol. 2015, 523, 758–767. [Google Scholar] [CrossRef] [Scilit]
- Abdelkader, M.; Yerdelen, C. Hydrological drought variability and its teleconnections with climate indices. J. Hydrol. 2022, 605, 127290. [Google Scholar] [CrossRef] [Scilit]
- Muñoz-Díaz, D.; Rodrigo, F.S. Impacts of the North Atlantic Oscillation on the probability of dry and wet winters in Spain. Clim. Res. 2004, 27, 33–43. [Google Scholar] [CrossRef] [Scilit]
- Bensiz, B.R.; Aksu, H. The effect of remote teleconnection patterns on temperature and precipitation of the Euphrates-Tigris Basin. Turk. J. Agric. Food Sci. Technol. 2023, 11, 758–767. [Google Scholar] [CrossRef] [Scilit]
- Vazifehkhah, S.; Kahya, E. Hydrological and agricultural droughts assessment in a semi-arid basin: Inspecting the teleconnections of climate indices on a catchment scale. Agric. Water Manag. 2019, 217, 413–425. [Google Scholar] [CrossRef] [Scilit]
- Wang, F.; Wang, Z.; Yang, H.; Di, D.; Zhao, Y.; Liang, Q. A new copula-based standardized precipitation evapotranspiration streamflow index for drought monitoring. J. Hydrol. 2020, 585, 124793. [Google Scholar] [CrossRef] [Scilit]
- Xing, Z.; Yu, Z.; Wei, J.; Zhang, X.; Ma, M.; Yi, P.; Ju, Q.; Wang, J.; Laux, P.; Kunstmann, H. Lagged influence of ENSO regimes on droughts over the Poyang Lake basin, China. Atmos. Res. 2022, 275, 106218. [Google Scholar] [CrossRef] [Scilit]
- Vicente-Serrano, S.M.; López-Moreno, J.I.; Beguería, S.; Lorenzo-Lacruz, J.; Azorin-Molina, C.; Morán-Tejeda, E. Accurate Computation of a Streamflow Drought Index. J. Hydrol. Eng. 2012, 17, 318–332. [Google Scholar] [CrossRef] [Scilit]
- Zhang, T.; Su, X.; Zhang, G.; Wu, H.; Liu, Y. Projections of the characteristics and probability of spatially concurrent hydrological drought in a cascade reservoirs area under CMIP6. J. Hydrol. 2022, 613, 128472. [Google Scholar] [CrossRef] [Scilit]
- Yevjevich, V. An Objective Approach to Definitions and Investigations of Continental Hydrologic Droughts. Doctoral Dissertation, Colorado State University, Fort Collins, CO, USA, 1967. [Google Scholar]
- Grinsted, A.; Moore, J.C.; Jevrejeva, S. Application of the cross wavelet transform and wavelet coherence to geophysical time series. Nonlinear Process. Geophys. 2004, 11, 561–566. [Google Scholar] [CrossRef] [Scilit]
- Zhang, T.; Su, X.; Zhang, G.; Wu, H.; Wang, G.; Chu, J. Evaluation of the impacts of human activities on propagation from meteorological drought to hydrological drought in the Weihe River Basin, China. Sci. Total Environ. 2022, 819, 153030. [Google Scholar] [CrossRef] [Scilit] [PubMed]
- Xu, Y.; Zhang, X.; Hao, Z.; Hao, F.; Li, C. Projections of future meteorological droughts in China under CMIP6 from a three-dimensional perspective. Agric. Water Manag. 2021, 252, 106849. [Google Scholar] [CrossRef] [Scilit]
- Liu, W.; Shi, C.; Zhou, Y. Trends and attribution of runoff changes in the upper and middle reaches of the Yellow River in China. J. Hydro-Environ. Res. 2021, 37, 57–66. [Google Scholar] [CrossRef] [Scilit]
- Jin, J.; Wang, G.; Zhang, J.; Yang, Q.; Liu, C.; Liu, Y.; Bao, Z.; He, R. Impacts of climate change on hydrology in the Yellow River source region, China. J. Water Clim. Change 2020, 11, 916–930. [Google Scholar] [CrossRef] [Scilit]
- Ma, M.; Cui, H.; Wang, W.; Huang, X.; Tu, X. Projection of spatiotemporal patterns and possible changes of drought in the Yellow River basin. Theor. Appl. Climatol. 2019, 138, 1971–1989. [Google Scholar] [CrossRef] [Scilit]
- Xing, Z.; Ma, M.; Zhang, X.; Leng, G.; Su, Z.; Lv, J.; Yu, Z.; Yi, P. Altered drought propagation under the influence of reservoir regulation. J. Hydrol. 2021, 603, 127049. [Google Scholar] [CrossRef] [Scilit]
- Beshavard, M.; Adib, A.; Ashrafi, S.M.; Kisi, O. Establishing effective warning storage to derive optimal reservoir operation policy based on the drought condition. Agric. Water Manag. 2022, 274, 107948. [Google Scholar] [CrossRef] [Scilit]
- Williamson, C.E.; Saros, J.E.; Vincent, W.F.; Smol, J.P. Lakes and reservoirs as sentinels, integrators, and regulators of climate change. Limnol. Oceanogr. 2009, 54, 2273–2282. [Google Scholar] [CrossRef] [Scilit]
- Selek, B.; Demirel Yazici, D.; Aksu, H.; Özdemir, A.D. Seyhan Dam, Turkey, and climate change adaptation strategies. In Increasing Resilience to Climate Variability and Change: The Roles of Infrastructure and Governance in the Context of Adaptation; Tortajada, C., Ed.; Springer: Singapore, 2016; pp. 205–231. [Google Scholar]
- Huang, S.; Huang, Q.; Chang, J.; Leng, G. Linkages between hydrological drought, climate indices and human activities: A case study in the Columbia River basin. Int. J. Climatol. 2016, 36, 280–290. [Google Scholar] [CrossRef] [Scilit]
- Ribeiro Neto, G.G.; Melsen, L.A.; Martins, E.S.P.R.; Walker, D.W.; van Oel, P.R. Drought Cycle Analysis to Evaluate the Influence of a Dense Network of Small Reservoirs on Drought Evolution. Water Resour. Res. 2022, 58, e2021WR030799. [Google Scholar] [CrossRef] [Scilit]
- Peña-Angulo, D.; Vicente-Serrano, S.M.; Domínguez-Castro, F.; Noguera, I.; Tomas-Burguera, M.; López-Moreno, J.I.; Lorenzo-Lacruz, J.; El Kenawy, A. Unravelling the role of vegetation on the different trends between climatic and hydrologic drought in headwater catchments of Spain. Anthropocene 2021, 36, 100309. [Google Scholar] [CrossRef] [Scilit]
- Tian, F.; Liu, L.-Z.; Yang, J.-H.; Wu, J.-J. Vegetation greening in more than 94% of the Yellow River Basin (YRB) region in China during the 21st century caused jointly by warming and anthropogenic activities. Ecol. Indic. 2021, 125, 107479. [Google Scholar] [CrossRef] [Scilit]

Disclaimer/Publisher’s Note: The statements, opinions and data contained in all publications are solely those of the individual author(s) and contributor(s) and not of MDPI and/or the editor(s). MDPI and/or the editor(s) disclaim responsibility for any injury to people or property resulting from any ideas, methods, instructions or products referred to in the content. |
© 2026 by the authors. Licensee MDPI, Basel, Switzerland. This article is an open access article distributed under the terms and conditions of the Creative Commons Attribution (CC BY) license.