Article

Groundwater Vulnerability Assessment Using a GIS-Based DRASTIC Model and Independent Validation Against Measured Nitrate in the Islamabad Watershed, Pakistan


1
Faculty of Geology, University of Warsaw, 02-089 Warsaw, Poland
2
Pakistan Council of Research in Water Resources (PCRWR), Islamabad 44000, Pakistan
*
Author to whom correspondence should be addressed.
Water 2026, 18(15), 1827; https://doi.org/10.3390/w18151827
Submission received: 9 June 2026 / Revised: 14 July 2026 / Accepted: 23 July 2026 / Published: 28 July 2026
(This article belongs to the Section Hydrology)

Abstract

The groundwater resources are increasingly stressed in the Islamabad–Rawalpindi metropolitan area of Pakistan due to unplanned urbanization, growth of industries, and inadequate waste management. In this study, the aquifer vulnerability was evaluated in the productive alluvial zone of Islamabad Watershed using a Geographic Information System (GIS)-based DRASTIC model and critically comparing it with independent measured contamination of groundwater, which is a common weakness in many machine-learning-based DRASTIC studies considering the vulnerability index as the model input. The data from 21 boreholes supplied by the Capital Development Authority (CDA) were used to map seven hydrogeological parameters in ArcGIS Pro at a 30 m resolution. The DRASTIC Index values ranged from 69 to 188, with 12.9% of the mapped watershed (209.3 km2) being rated as Very High vulnerability, mainly in the shallow western urban alluvium where water tables are below 5 m. Single-parameter sensitivity analysis showed that the most influential factors of the index were impact of the vadose zone (Si = 1.14) and depth to water table (Si = 1.09). A Random Forest model was trained on independently measured nitrate instead of the DRASTIC Index, but had a poor predictive skill (cross-validated R2 = 0.08), and the SHapley Additive exPlanations (SHAP) analysis suggested that increased vulnerability (shallow water table and high recharge) was correlated with lower nitrate concentrations. The inverse relationship between groundwater intrinsic vulnerability and measured nitrate was statistically significant when compared to 233 groundwater samples collected at the same locations during two different campaigns (2018 and 2024) (pooled Pearson r = −0.27, p < 0.001; Spearman ρ = −0.19, p = 0.007; Kruskal–Wallis H = 14.10, p = 0.003). Levels of nitrate in both Low and Moderate vulnerability zones (6.0 and 7.7 mg/L, respectively) were higher than in Very High zones (3.4 mg/L). The inverse direction was consistent across both campaigns and robustly significant in the 2024 dataset (ρ = −0.33, p < 0.001), which covered a wider contamination gradient; in the 2018 dataset, only the parametric test was significant. Nitrate showed no significant difference between land-use classes (H = 7.23, p = 0.065) and was found as a few individual high concentrations, suggesting that these were not diffuse loading issues or intrinsic susceptibility, but were likely influenced by point sources. These results show that intrinsic DRASTIC vulnerability is useful to identify areas vulnerable to potential future contamination, but does not explain the current distribution of contamination in this aquifer, which is influenced by point-source loading and residence-time effects. To provide effective groundwater protection, intrinsic vulnerability assessment must be complemented with specific monitoring of point sources.

1. Introduction

Groundwater is the primary source of water for drinking, cooking, and domestic use for more than two billion people around the world, particularly those with limited access to surface water or water that is not available during certain months of the year, and accounts for about one-third of the world’s total freshwater reserves [1]. Urbanization in South Asian cities has been high, with increased impervious surfaces reducing the natural recharge, increasing contamination loads, and increasing groundwater depletion rates. Pakistan is one of the top ten users of groundwater in the world, and the primary source of domestic, agricultural, and industrial water in major cities like Islamabad and Rawalpindi is from tube wells [2].
Groundwater vulnerability assessment is a systematic approach to finding the most vulnerable parts of an aquifer to contamination from the surface [3]. Margat [4] first formalized the concept, which has since been followed by many quantification methods. The most commonly used of these models is the DRASTIC model developed by Aller et al. [5] for the United States Environmental Protection Agency because it is simple to use, transferable, and compatible with Geographic Information Systems (GISs). DRASTIC considers seven hydrogeologic parameters: depth to water table (D), net recharge (r), aquifer media (a), soil media (s), topography (t), impact of the vadose zone (i), and hydraulic conductivity (c). A vulnerability index is obtained as a weighted sum of the rated parameters, giving a continuous index [6,7,8].
The DRASTIC model has been used in a variety of climatic and geologic settings [9,10,11], but the weights assigned by experts have been criticized a number of times because they are fixed and do not change with local hydrogeological conditions [12,13]. Single-parameter sensitivity analysis [14] provides a partial solution to this problem by constructing an effective weight for each parameter in comparison to their theoretical weight, but there is no change from the linear weighting framework. More recently, approaches involving machine-learning techniques have been suggested to extract data-driven parameter relationships, and to question which parameters are most critical in a specific study area [15,16,17,18].
Random Forest (RF) is an ensemble decision tree algorithm developed by Breiman [19] that is appropriate for small hydrogeological datasets; it is due to the use of the bootstrap aggregation algorithm, which decreases the variance, and to the use of OOB error, which is an internal cross-validation estimate. The use of RF in groundwater vulnerability and nitrate studies is widespread, and the feature-importance measures can help to identify the most closely associated parameters to contamination [20,21,22,23,24]. SHAP (SHapley Additive exPlanations) [25] also breaks down the predictions of a machine-learning model into the contribution that each parameter makes. One drawback of machine-learning DRASTIC studies is that the model is often trained to predict the DRASTIC Index from the same parameters that are used to define the DRASTIC Index; since the model targets the same parameters that it uses as predictors, this is not an independent test of the model against contamination.
The Islamabad watershed is important yet under-researched. It lies on the Potohar Plateau of northern Pakistan and is the home of over 5 million people who heavily depend on shallow alluvial tube wells for their drinking water [26]. Earlier, higher concentrations of electrical conductivity, total dissolved solids (TDS), nitrate, arsenic, and coliform bacteria have been reported in the groundwater of Islamabad and Rawalpindi [27,28,29]. Shinwari et al. [30] recently applied the DRASTIC model to Islamabad, but did not validate it against independent contamination data. No previous study in this watershed has integrated DRASTIC mapping with non-circular machine-learning analysis and independent multi-campaign water-quality validation.
To achieve these objectives, this study aims at (1) creating a GIS-based DRASTIC groundwater vulnerability map for the productive alluvial zone based on 21 borehole observations from the Capital Development Authority (CDA); (2) characterizing the parameters that control the vulnerability index using single-parameter sensitivity analysis; (3) identifying, in a non-circular way, the DRASTIC parameters associated with observed contamination by training a Random Forest model on independently measured groundwater nitrate, and using SHAP analysis to interpret the direction of these associations; (4) testing the relationship between the intrinsic vulnerability and the measured contaminant nitrate-nitrogen (NO3–N) in 233 independent georeferenced groundwater samples for two campaigns (2018 and 2024) to validate the groundwater vulnerability map; (5) understanding the vulnerability–contamination relationship in the context of land-use, residence time, and contaminant loading, and assessing the implications for groundwater management.

2. Study Area

Islamabad Watershed is part of the Potohar Plateau of northern Pakistan and includes the federal capital city Islamabad and the neighboring city of Rawalpindi (Figure 1). The study area extends from 72.9° E to 73.2° E and 33.6° N to 33.8° N, covering approximately 1732 km2 (WGS 1984 UTM Zone 43N, EPSG:32643). The northern part is the Margalla hills, which are part of the outer ranges of the Himalayas and over 1600 m in elevation, while the southern part around Rawalpindi is a relatively flat alluvial plain at 480–600 m elevation. The watershed is drained by the Korang River and Soan River along with their tributaries, which include Nullah Lai. There is also an additional surface water source, i.e., Rawal Lake, built on the Korang River in 1962. The mean annual rainfall is about 1200 mm, mostly during the monsoon (July–September).
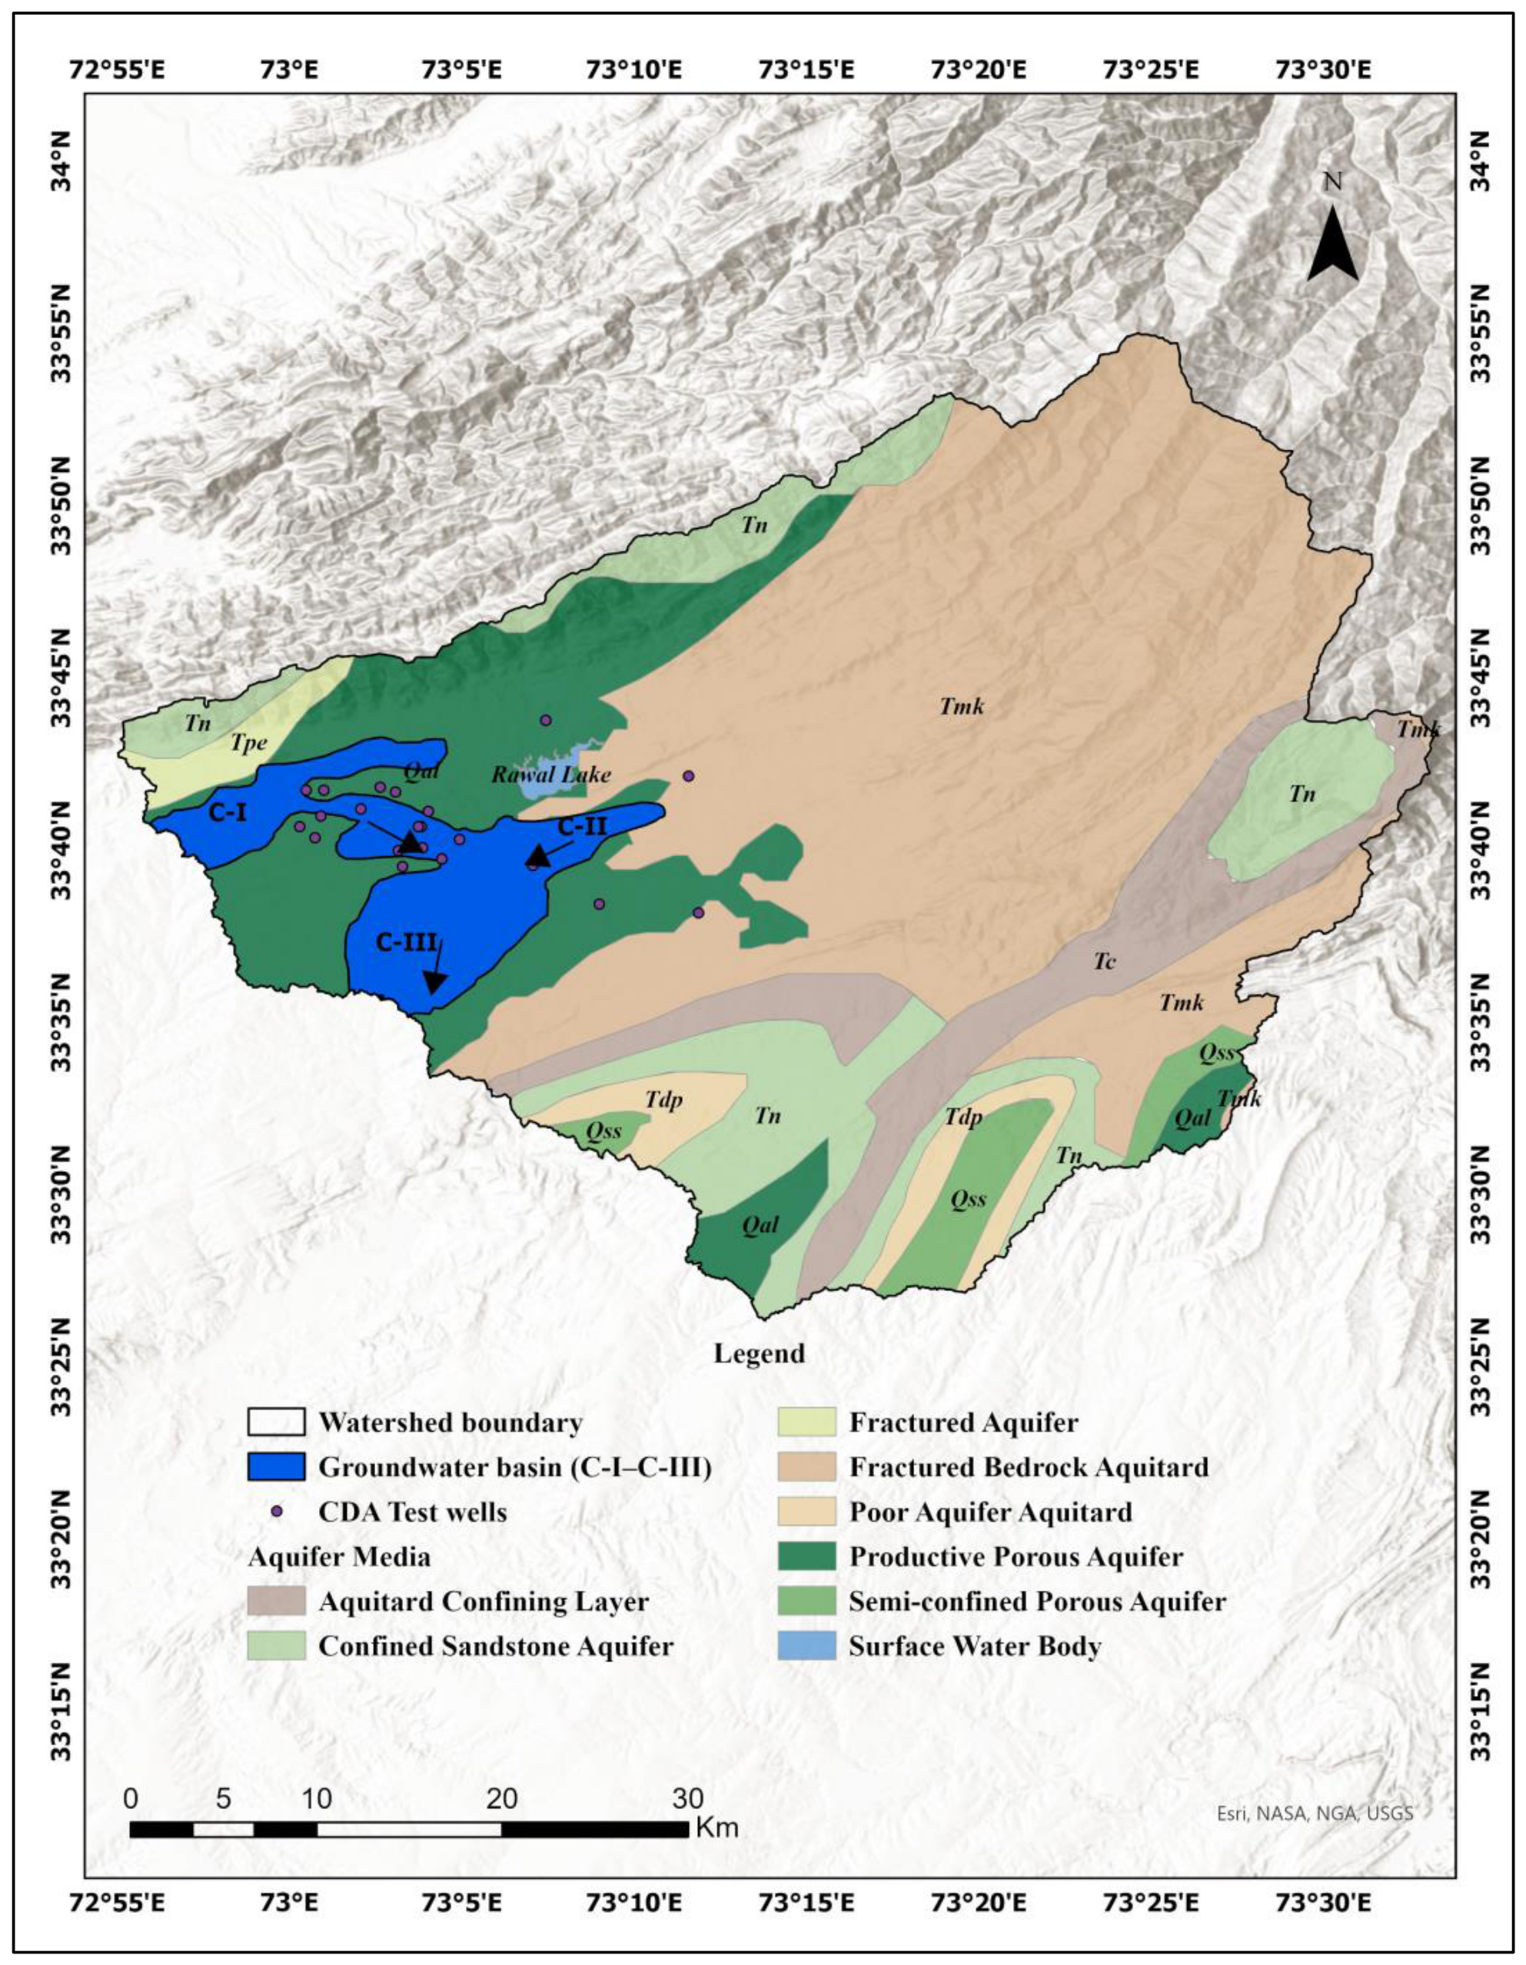
The watershed can be best conceptualized as two separate hydrogeologically different subdomains (Figure 2). The northern domain is made up of the Miocene Murree Formation and the consolidated Tertiary units found here, which are fractured sandstones, mudstones, and limestones of the Margalla and Murree foothills. These are consolidated formations that transmit groundwater only through fractures and yield poorly; water tables are deeper than 25 m, extensive abstraction is negligible, and the terrain is mostly uninhabited, with part lying in the protected Margalla Hills National Park. This northern fractured terrain has low abstraction, population, and contamination risk. The DRASTIC vulnerability index was nonetheless computed across the full watershed for completeness; however, the quantitative validation against measured nitrate was restricted to the productive alluvial zone, where the aquifer, the population, and all monitoring wells coincide. The fractured northern uplands are therefore mapped but excluded from the validation analysis, by hydrogeological design rather than data limitation.
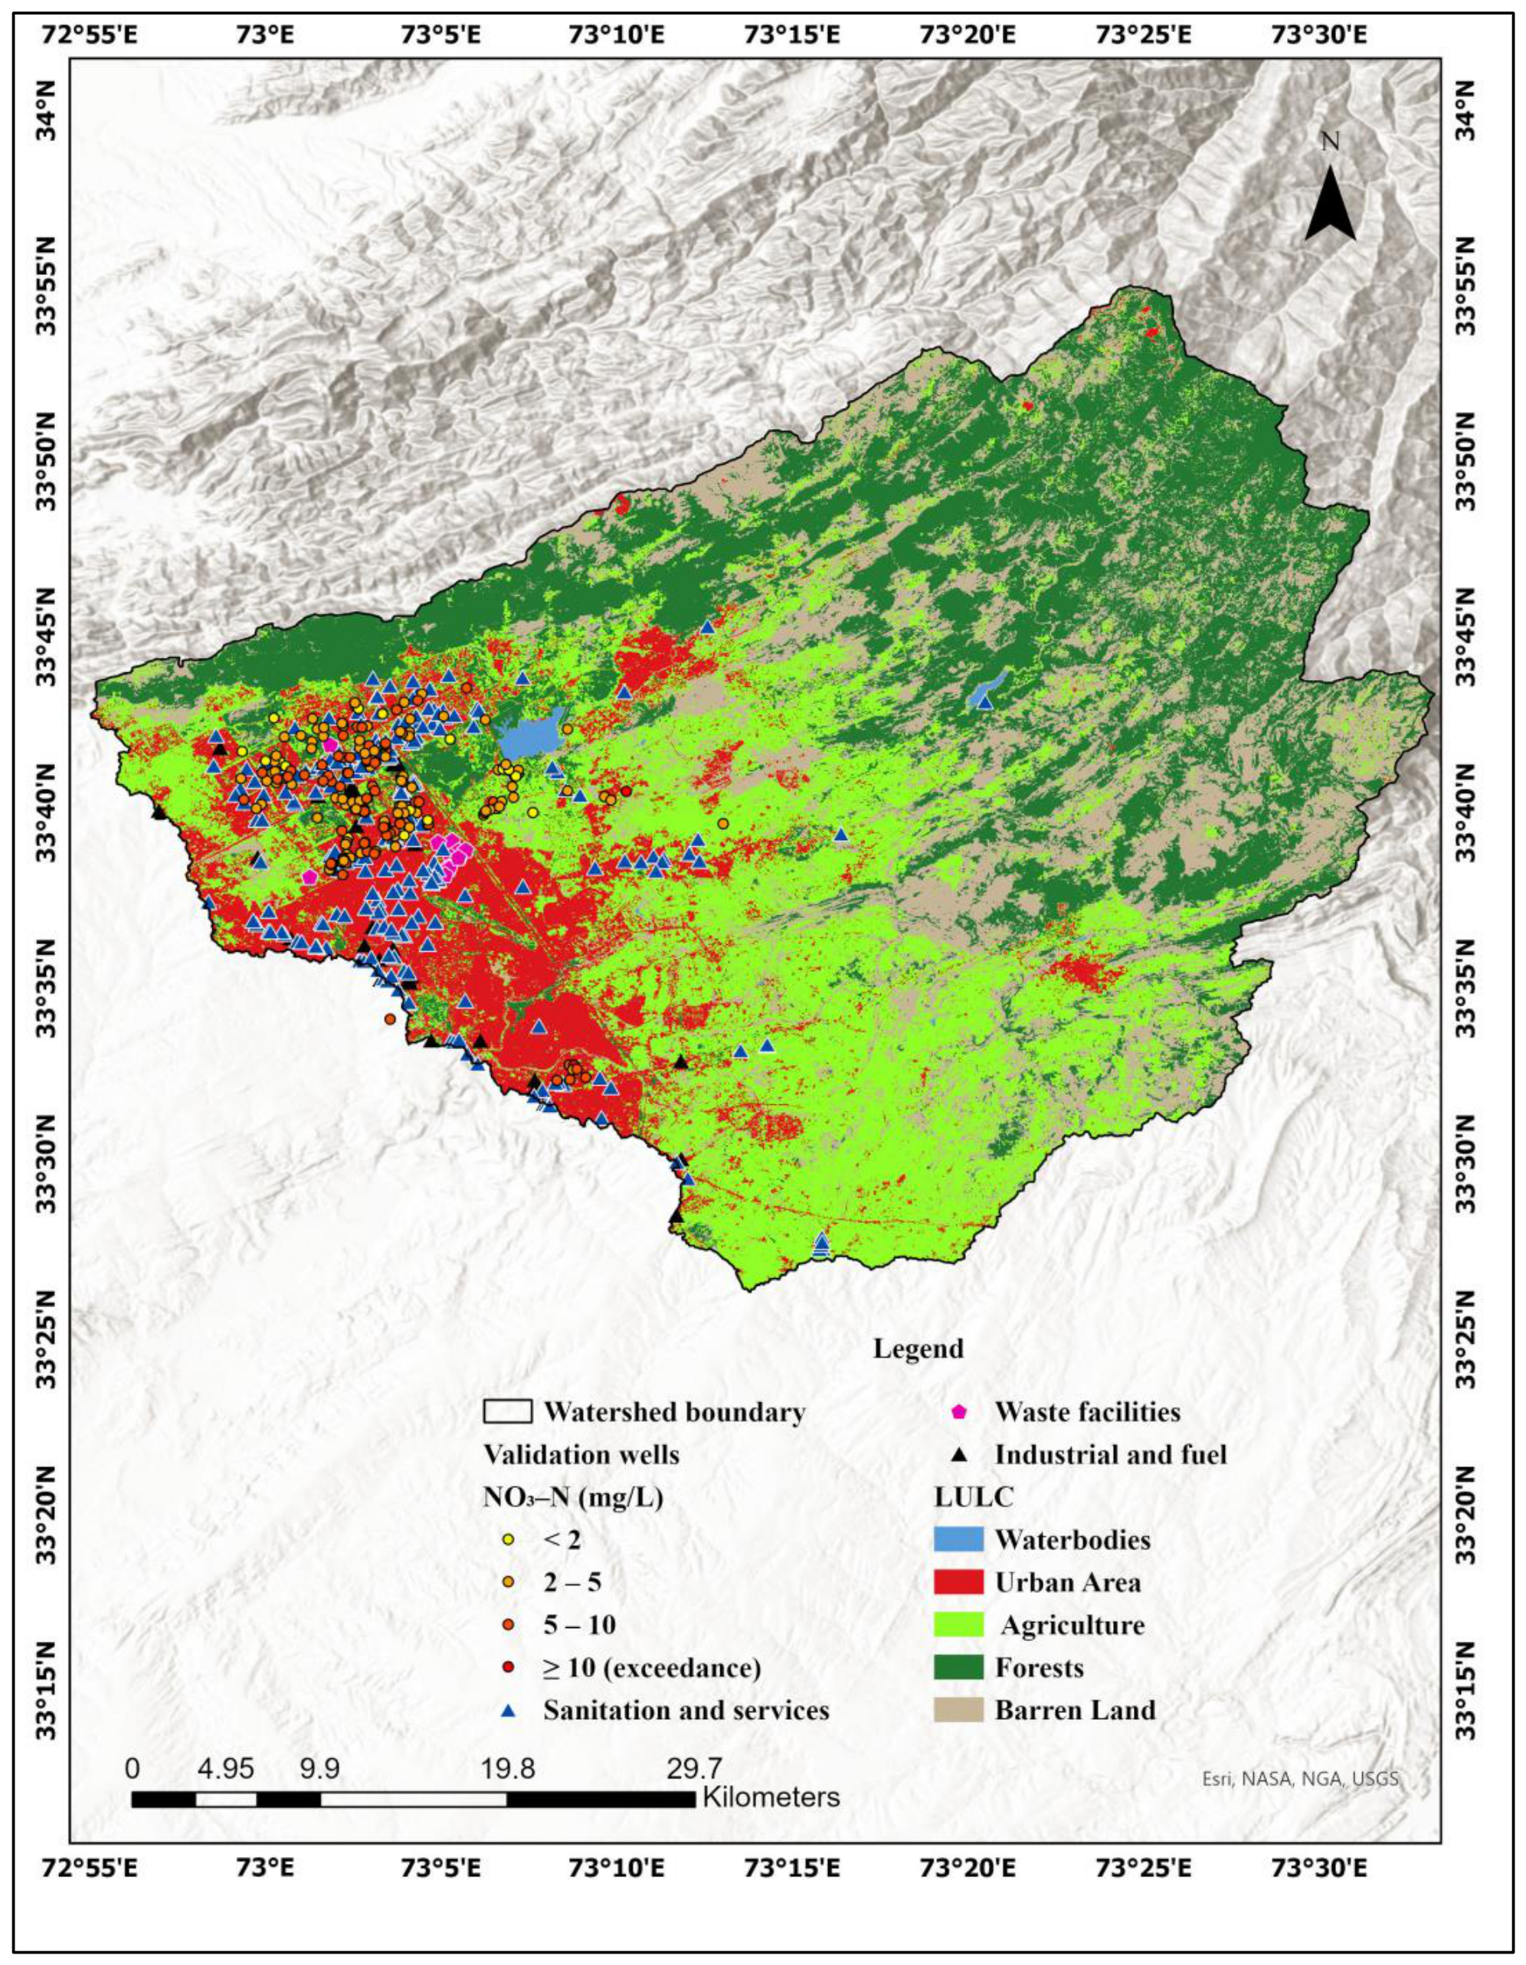
The southwestern domain is made up of the productive Quaternary alluvial units (Qal and Qss) with an area of about 466 km2. The developed aquifer includes these unconfined to semi-confined porous aquifers that have hydraulic conductivities of 10–80 m/day and water-table depths of less than 5 m in the western urban core of the watershed. This alluvial area brings together the active abstraction of groundwater, the high density of inhabitants in Islamabad and Rawalpindi, the dense network of tube-wells, and the anthropogenic contamination pressure (Figure 3). The concentration of wells in this alluvial zone is not a sampling artifact: the 21 CDA construction boreholes and the 233 independent validation wells are all located here because this is where the productive aquifer, the population, and the monitoring infrastructure coincide. The water-table depths of the 21 production boreholes operated by the CDA range from 2.74 m to 19.51 m, and the monitoring density for this productive aquifer is approximately 1 borehole per 22 km2, similar to reported monitoring densities in urban aquifers in South Asia [31,32].
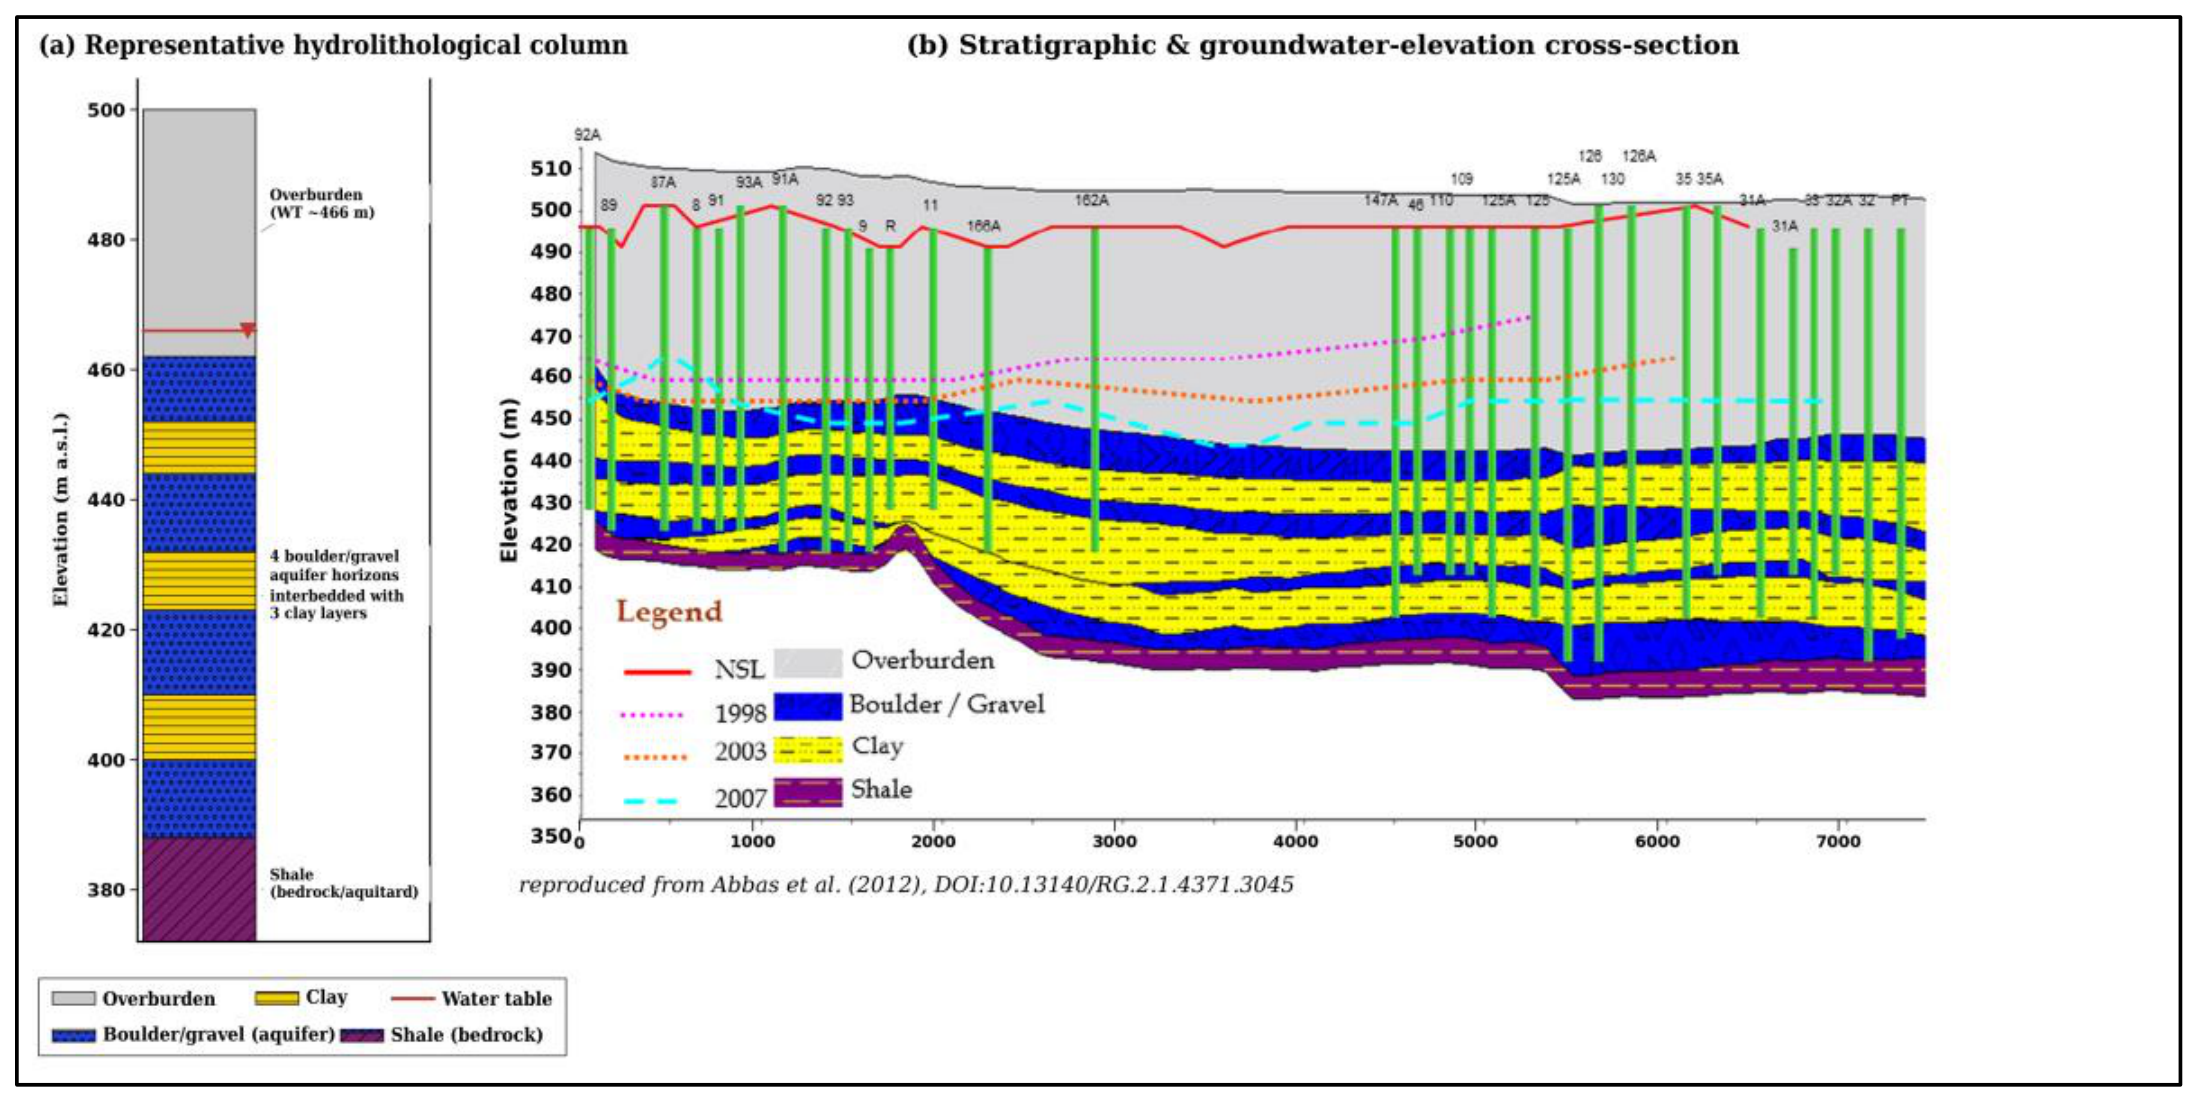
Ahmad et al. [33] have identified that the alluvial domain has a subsurface composed of a multi-layered sequence of gravel and boulder beds (the principal aquifer horizons) interbedded with silt and clay lenses, overlying a low-permeability bedrock aquitard, for the Soan watershed (Figure 4). Here, the overburden refers to the unconsolidated silt- and clay-dominated surface cover overlying the productive gravel/boulder aquifer horizons. The thickness of the gravel beds is generally 1–20 m, thinning to the south and west, and the alluvium is sometimes more than 200 m thick; the aquifer is composed of several permeable horizons with an average thickness of about 137 m [33]. Structural heterogeneity is manifested by the presence of interbedded clay lenses that produce locally confined to semi-confined conditions and preferential flow horizons, which are directly relevant to the interpretation of contaminant transport (Section 5). The groundwater level in the Rawalpindi area has decreased gradually from 1998 to 2007 along the cross-sections through the alluvium [34].

3. Data and Methodology

3.1. Data Sources and Parameter Mapping

Seven hydrogeological parameters needed for the DRASTIC model were compiled for the productive alluvial zone. The water-level data from 21 Capital Development Authority (CDA) production boreholes were used to derive the depth to the water table (D) and were also used to derive stratigraphic profiles and aquifer media descriptions [26,35]. The USGS Soil-Water-Balance (SWB) model was used to estimate net recharge (R). Both aquifer media and the impact of the vadose zone (A and I, respectively) were derived from digitization of 1:50,000 geological mapping [35] and borehole lithological logs. Soil media (S) were taken from the digitized Punjab Soil Survey [36]. The Shuttle Radar Topography Mission (SRTM) Digital Elevation Model (DEM) with a resolution of 30 m was used to compute topography (T, percent slope). The hydraulic conductivity values (C) were assigned based on borehole and published pump-test data of the Islamabad alluvial aquifer [26].
Groundwater quality data for validation were obtained from two campaigns sampled over the productive alluvial zone: a 2018 monitoring campaign (131 tube wells, Metropolitan Corporation Islamabad well network) and a 2024 campaign (102 tube wells, Capital Development Authority supply wells), with both campaigns reporting georeferenced nitrate-nitrogen (NO3–N) concentration, electrical conductivity, and total coliform/E. coli presence. Following the exclusion of sites beyond the area assessed as alluvial, 233 georeferenced wells were left, with 201 wells having numeric nitrate data. Both the 2018 and 2024 groundwater-quality campaigns—sampling and laboratory analysis—were carried out by the Pakistan Council of Research in Water Resources (PCRWR); the sampled tube wells are municipal water-supply wells, and the water-supply information was obtained from the Capital Development Authority (CDA). The datasets were provided to the authors on request and are not publicly available. Sample collection and analysis were performed using standard procedures [37]. Nitrate was determined and reported as nitrate-nitrogen (NO3–N) by the ultraviolet spectrophotometric method (APHA Standard Method 4500-NO3 B), and all nitrate values in this paper are expressed in mg/L as N.

3.2. DRASTIC Vulnerability Model

The DRASTIC Index (DI) was calculated using the method of Aller et al. [5] as the sum of the seven parameter ratings (1–10) multiplied by their standard DRASTIC weights, given in Equation (1). The spatial operations were carried out at 30 m resolution in ArcGIS Pro (version 3.2.0; ESRI, Redlands, CA, USA) [38]. Depth to water table was interpolated between the 21 borehole observations with Inverse Distance Weighting (IDW) with a power of 2 and a variable search radius with the inclusion of the 12 nearest borehole observations, following the established DRASTIC approach [5,31]. We recognize that groundwater levels are influenced by boundary conditions, recharge distribution, and aquifer hydraulic properties more than just by spatial distance, and that the spatial structure of the water table may be oversimplified using a limited observation well network (n = 21), especially in the alluvial–bedrock transition area. Stochastic approaches, like kriging with external drift or probabilistic connectivity methods [39], would better represent the uncertainty of the interpolation, which is recognized as a limitation (Section 5.5), and for which the assessment is bounded to the homogeneous alluvial domain in which a distance-based scheme is most defensible. Hydraulic conductivity (C) ratings were assigned using pumping-test transmissivity and specific-capacity data reported for the alluvial aquifer test holes [33]. The index was classified into four categories—Low (69–100), Moderate (101–130), High (131–160), and Very High (161–188)—consistent with established DRASTIC practice [5,31,40,41].
DI = 5Dr + 4Rr + 3Ar + 2Sr + Tr + 5Ir + 3Cr
where the subscript r denotes the rating (1–10) assigned to each parameter and the coefficients (5, 4, 3, 2, 1, 5, 3) are the standard DRASTIC weights for depth to water (D), net recharge (R), aquifer media (A), soil media (S), topography (T), impact of the vadose zone (I), and hydraulic conductivity (C), respectively.

3.3. Single-Parameter Sensitivity Analysis

The influence of each parameter on the vulnerability index was evaluated using the single-parameter sensitivity analysis of Napolitano and Fabbri [14], in which the index is recomputed seven times, each time excluding one parameter (in turn D, R, A, S, T, I, and C), and the perturbed index is compared with the full index. The sensitivity index (Si) for each parameter is given by Equation (2).
Si = (V/N)/(Vi′/Ni′)
where V is the unperturbed DRASTIC Index computed from all N = 7 parameters, and Vi′ is the index computed with parameter i removed using the remaining Ni′ parameters. The sensitivity index was calculated at all borehole sites and reported as mean ± standard deviation, consistent with the application of this method to DRASTIC by Babiker et al. [42], with reference to sensitivity applications in low-variability settings [43,44]. Global sensitivity analysis methods, which apportion output variance among individual parameters and their interactions [45], provide a more comprehensive characterization of parameter influence in process-based models; however, for a deterministic linear index such as DRASTIC, where the output is an additive weighted sum, the map-removal approach is adequate and conventional.

3.4. Random Forest Analysis of Measured Nitrate

In order to assess, in a non-circular way, which of the seven DRASTIC parameter ratings are correlated with observed contamination, the seven DRASTIC parameter ratings were used as predictors in a Random Forest regression implemented in scikit-learn (version 1.8.0) [46], with measured nitrate concentration as the response variable. This formulation is quite different from training against the DRASTIC Index itself, and the resulting feature-importance and SHAP attributions are empirical associations with contamination, rather than the internal structure of the DRASTIC Index. Five-fold cross-validated R2 and out-of-bag (OOB) R2 were used to evaluate model performance. The model is considered a diagnostic tool for association direction, because there is little contamination gradient at the site and minimal spatial variability in several parameters. Mean Decrease in Impurity was used to obtain feature importance.

3.5. SHAP Explainability Analysis

The Random Forest model trained on the nitrate dataset was used to compute SHAP values using the TreeExplainer implementation (SHAP version 0.51.0) [25,47]. SHAP breaks down each prediction into additive, directional parameter contributions, and reveals the strength and direction of the association of each parameter with the measured nitrate. The importance measure was taken as the mean absolute SHAP values, which provide a globally consistent measure across all predictions.

3.6. Independent Validation Against Measured Groundwater Quality

In order to validate the DRASTIC vulnerability map, three approaches were used in comparison to the independent dataset. For each of the 201 wells, where measured nitrate values are provided, Pearson and Spearman correlation coefficients were calculated between the DRASTIC Index and nitrate. Second, the nitrate level was analyzed by four vulnerability classes using the non-parametric Kruskal–Wallis test [48]. Thirdly, the correlation between the vulnerability and the presence of total coliform and E. coli was measured by point-biserial correlation. A separate analysis was conducted for the 2018 and 2024 campaigns, in order to check for temporal consistency. To assess whether the observed relationship was artefactual due to spatial structure in the locations of wells, a spatial-block cross-validation (whole spatial blocks of wells were held out rather than individual wells) and a spatial autocorrelation test of nitrate using Moran’s I with a permutation test were conducted. The typology was developed by cross-classifying wells into four categories based on their vulnerability (DRASTIC Index above or below 130) and contamination (nitrate-nitrogen concentration above or below the guideline value of 10 mg/L NO3–N; USEPA maximum contaminant level, equivalent to the WHO guideline of 50 mg/L expressed as NO3) to explore the implications of the relationship for management. The land-use class of each well was also retrieved from a land-use/land-cover map of the area showing five land-use classes (urban, agriculture, forest, barren, water) to determine whether observed nitrate levels varied systematically with land-use class. Nitrate exceedance was assessed against the guideline value of 10 mg/L NO3–N (USEPA maximum contaminant level for nitrate-nitrogen; equivalent to the WHO guideline of 50 mg/L expressed as the nitrate ion, NO3 [49]).

4. Results

4.1. DRASTIC Vulnerability Map

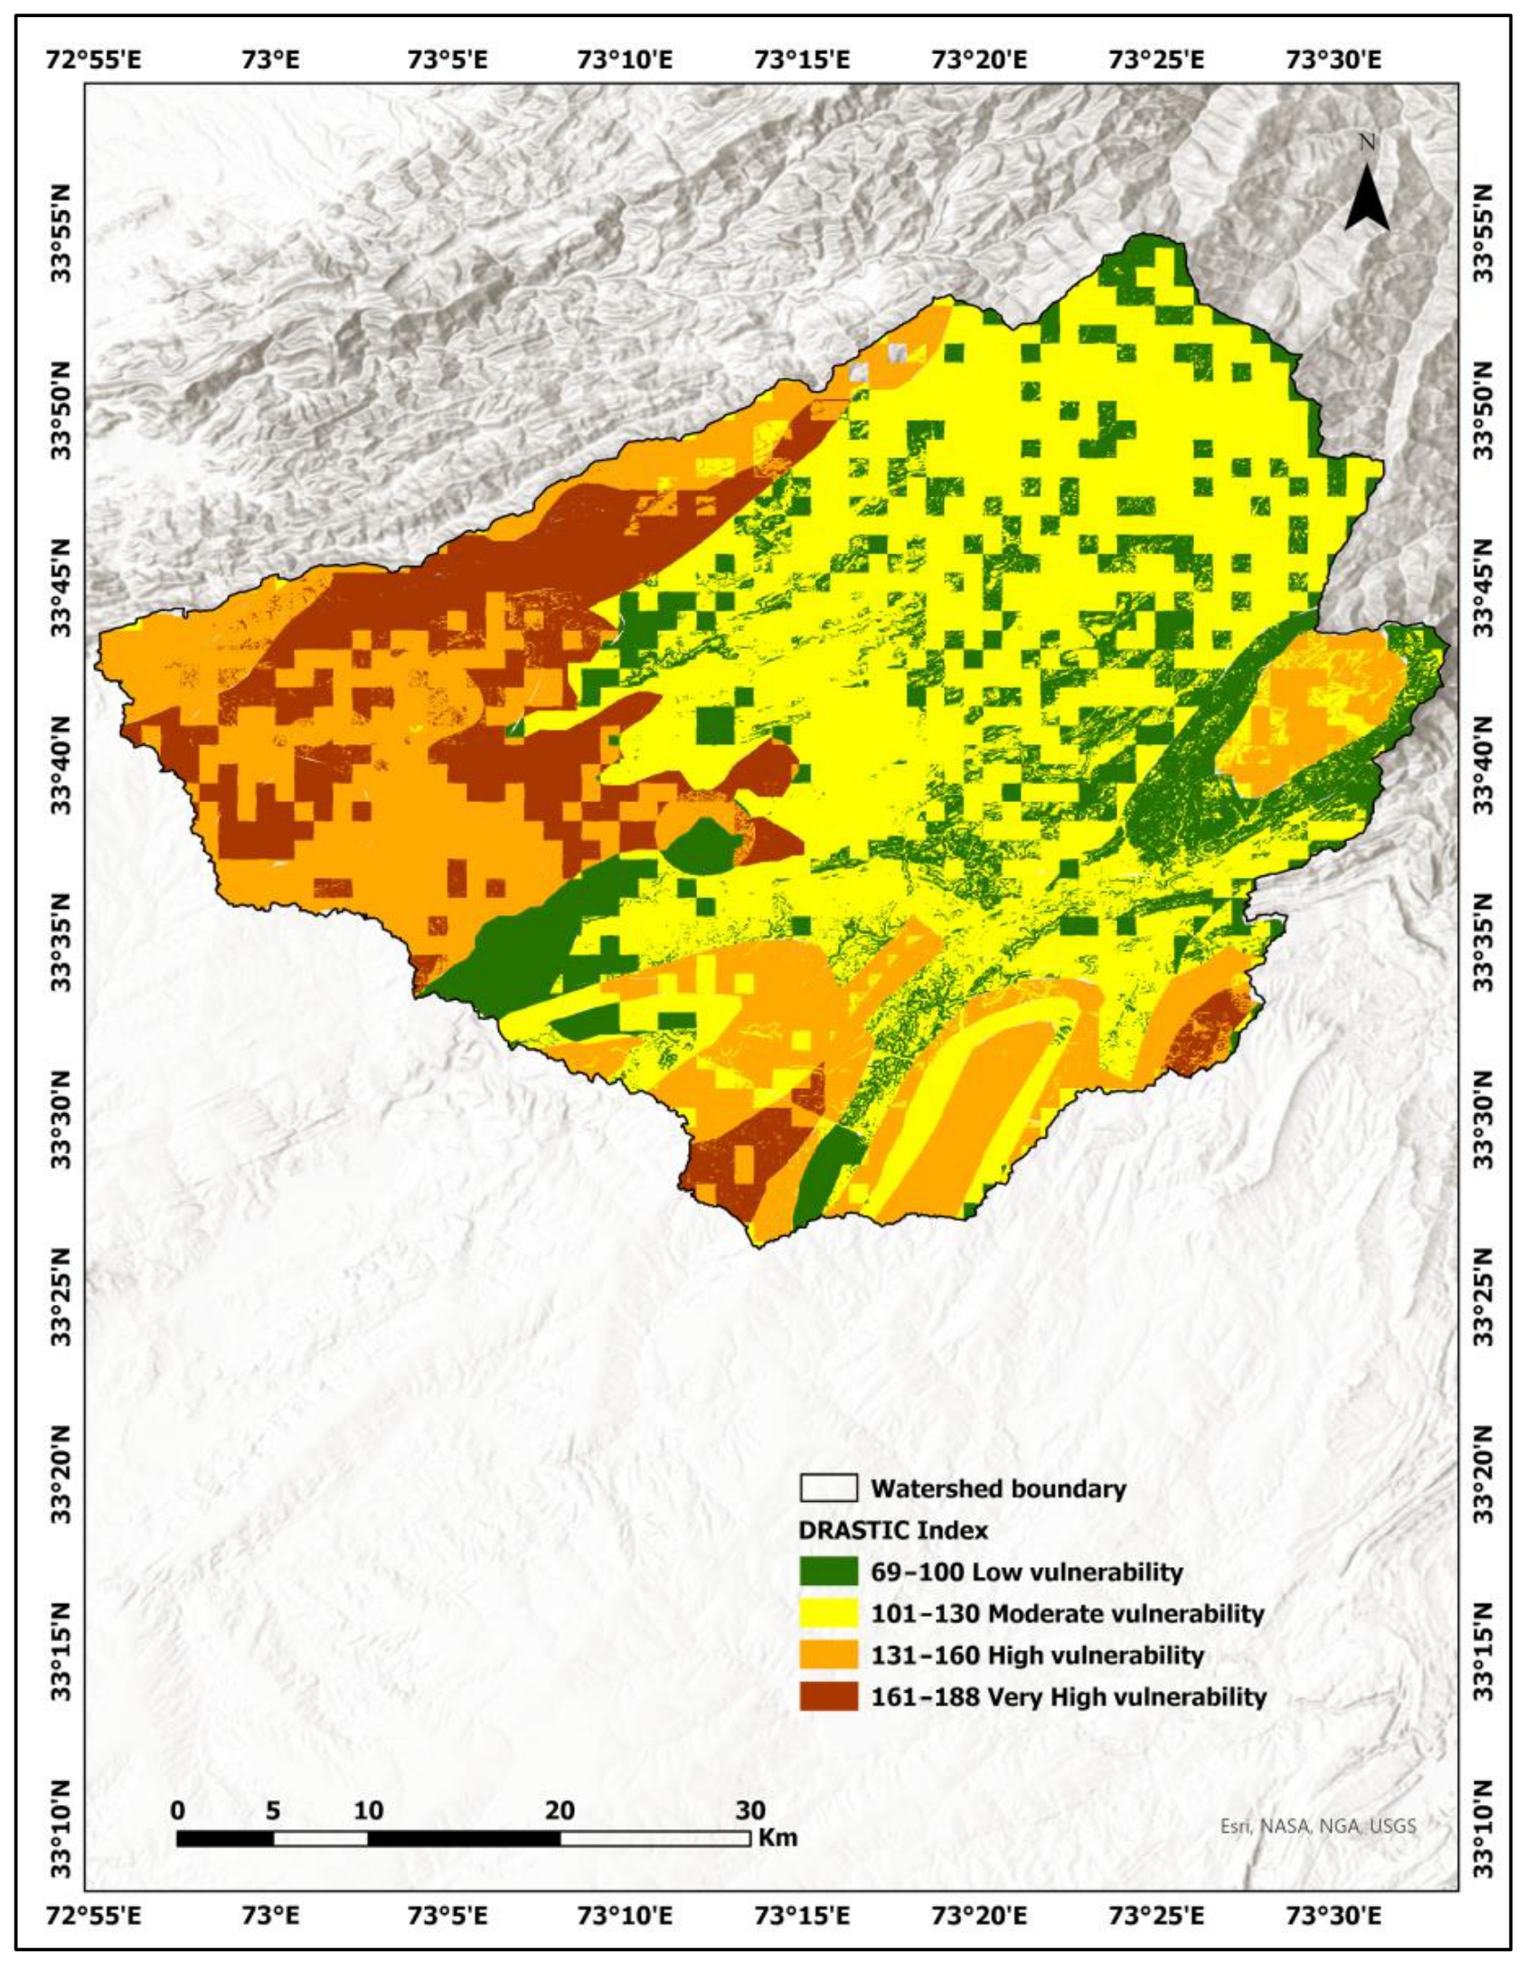
The assessed alluvial zone had a DRASTIC Index range of 69 to 188 (Figure 5). Very High vulnerability covered 209.3 km2 (12.9% of the mapped watershed), generally focused in the western urban core of Islamabad, with shallow alluvial water tables being less than 5 m below the surface. High vulnerability covered 407.1 km2 (25.1%), distributed along alluvial corridors, and Moderate vulnerability covered the central watershed (702.8 km2, 43.4%). The lowest scores (Low; 300.4 km2; 18.5%) were associated with the northern part of the Margalla piedmont, where the bedrock is fractured, and the underlying water table is deep. The index values for the shallow western alluvial wells were the highest, and the lowest-conductivity wells provided the lowest values in the borehole network. These class areas are computed over the full mapped watershed (≈1620 km2); the validation analysis below is confined to the productive alluvial subdomain. The seven individual parameter rasters are available in Supplementary Figure S1.

4.2. Sensitivity Analysis Results

Single-parameter sensitivity analysis (SPSA) (Table 1) showed that the two parameters with the highest theoretical weights, impact of the vadose zone (I) and depth to water table (D), also had the greatest effective influence on the index (mean Si = 1.14 ± 0.05 and 1.09 ± 0.07, respectively). Topography (T) and soil media (S) were least sensitive (Si ≈ 0.91 and 0.90) because the spatial variation in these over the low-relief urban alluvial plain is small. The intermediate parameters ranked aquifer media (Si = 1.01), hydraulic conductivity (Si = 1.01), and net recharge (Si = 1.00); full descriptive statistics (mean, standard deviation, minimum and maximum effective weight) for all seven parameters are given in Table 1. These patterns are similar to those observed in sensitivity analyses for comparable urban alluvial aquifers [43,44,45].

4.3. Independent Validation Against Measured Nitrate

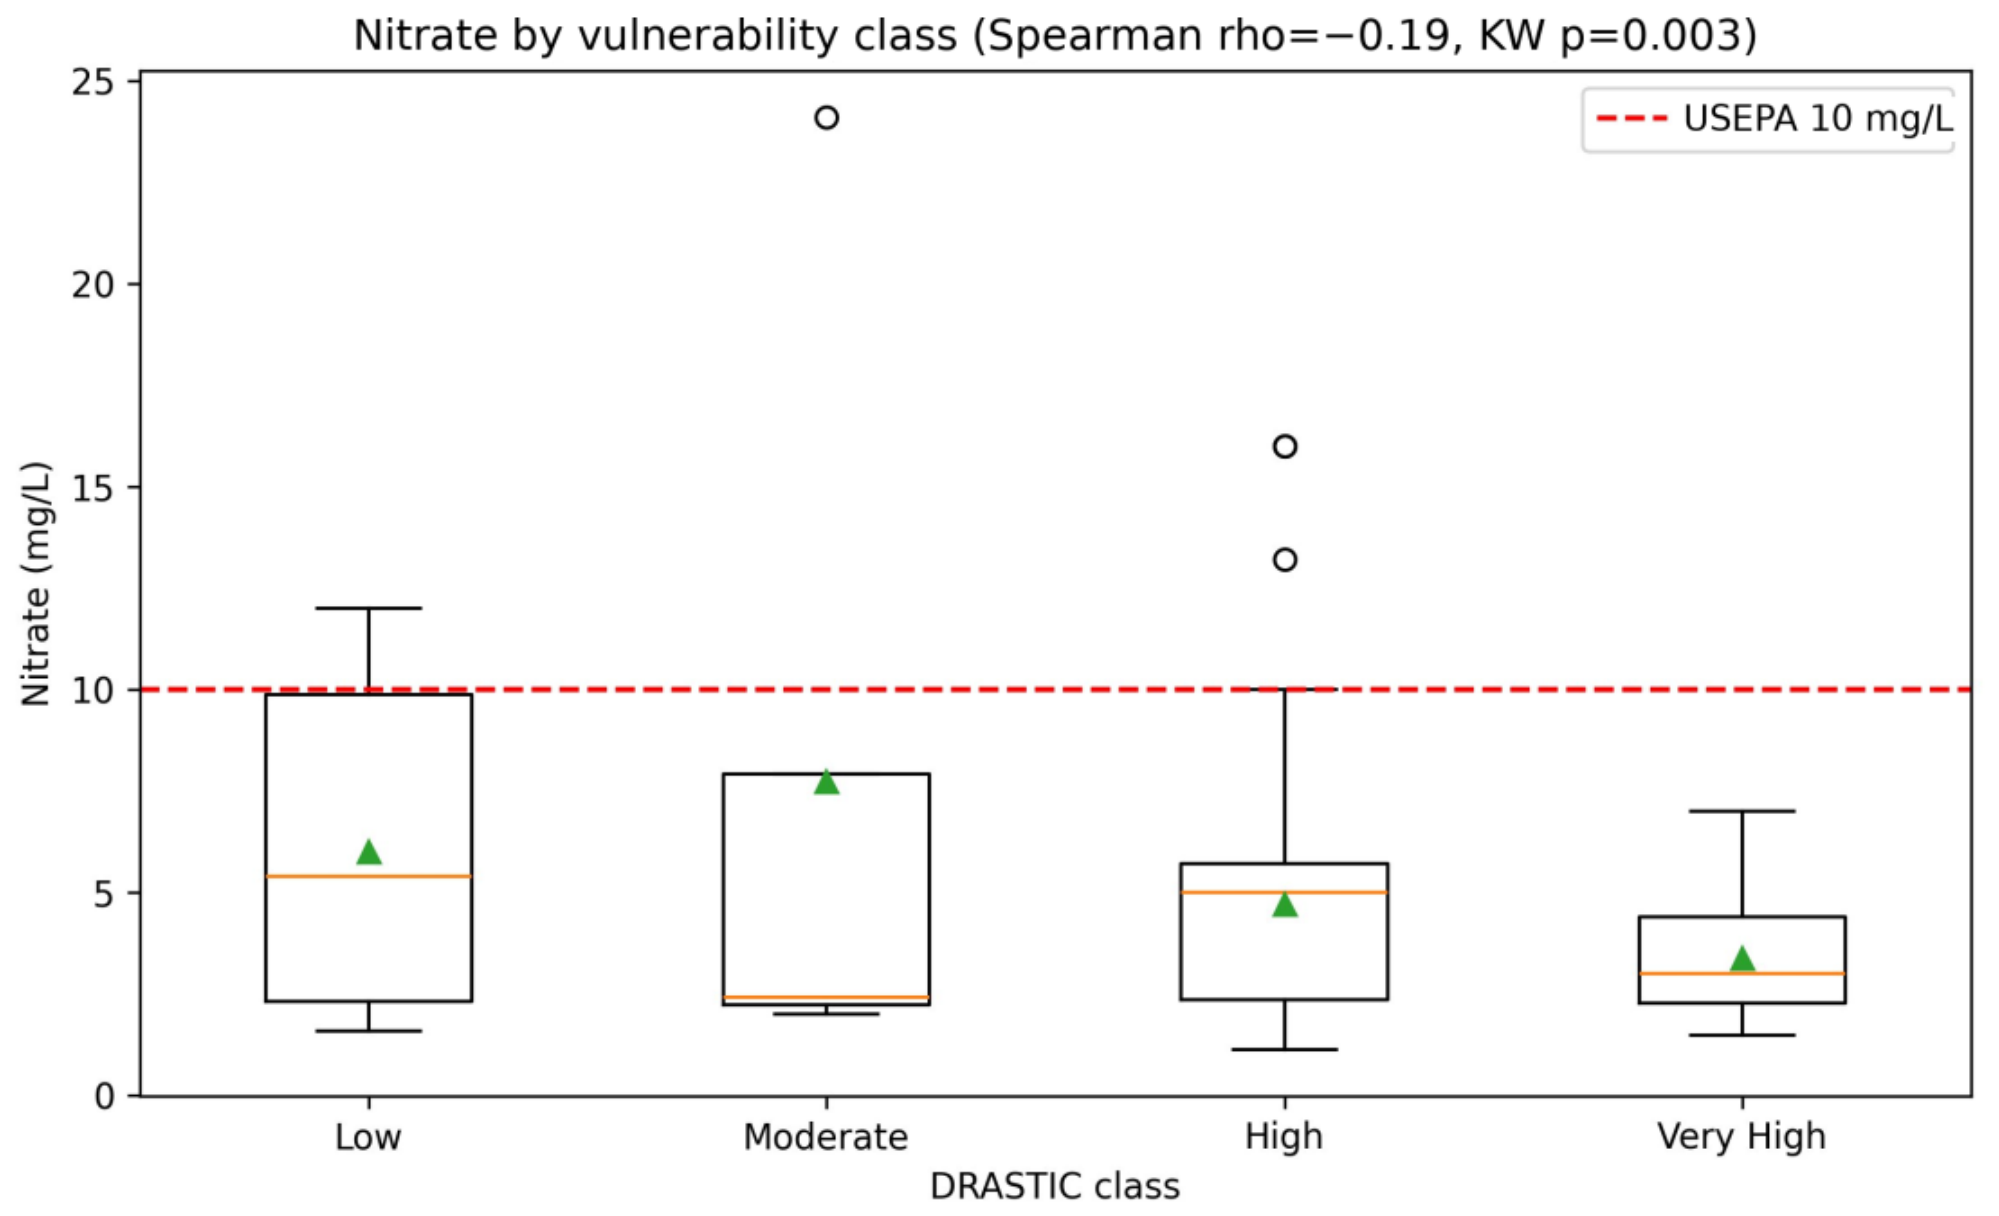
The measured nitrate data from the pooled independent dataset (201 wells having numeric nitrate data) showed a statistically significant negative relationship with DRASTIC vulnerability; the Pearson correlation coefficient was −0.27 (p < 0.001), and the Spearman correlation coefficient was −0.19 (p = 0.007). These correlations are statistically significant but substantively weak: the Pearson coefficient corresponds to r2 ≈ 0.07 (95% CI for r: −0.40 to −0.14) and the Spearman to ρ2 ≈ 0.04, so intrinsic DRASTIC vulnerability explains only about 4–7% of the variance in measured nitrate. The relationship is therefore best interpreted as a consistent inverse direction of weak explanatory power rather than a strong predictive association. Nitrate concentration decreased with increasing vulnerability class, from 6.0 mg/L in Low and 7.7 mg/L in Moderate, to 4.7 mg/L in High and 3.4 mg/L in Very High vulnerability (Table 2, Figure 6). These inter-class differences were found to be significant by the Kruskal–Wallis test (H = 14.10, p = 0.003). Because the Low and Moderate classes are sparsely populated (n = 11 and n = 4) and the Moderate-class mean is influenced by a single high value (24.1 mg/L), class-level results are reported using medians and interquartile ranges as the primary statistics and were confirmed by sensitivity checks: merging the Low and Moderate classes into a single low-vulnerability group (H = 13.3, p = 0.001) and re-testing with the extreme value removed (H = 16.7, p < 0.001) both preserved the significant inverse pattern, indicating the result does not hinge on one point. The small-sample limitation of the low-vulnerability classes is nonetheless acknowledged in the interpretation. The highest nitrate concentration (24.1 mg/L) occurred in a Moderate vulnerability well, whereas the Very High category contained no wells with nitrate exceeding 7.0 mg/L. The presence of coliform and E. coli in the wells showed the same direction of trend, but not significantly; the point-biserial correlation between the presence of coliform/E. coli and the DRASTIC Index was r = −0.08 (p = 0.23).

4.4. Temporal Consistency (2018 vs. 2024)

Since the validation data were obtained from two independent campaigns six years apart, the relationship was analyzed separately in each (Table 3). The direction of the inverse relationship was the same in both datasets. This relationship was strong and significant across all tests in the 2024 CDA campaign, which covered a wide range of nitrate concentrations (up to 24.1 mg/L): Pearson r = −0.34, p < 0.001; Spearman ρ = −0.33, p < 0.001; and Kruskal–Wallis p = 0.003. The 2018 campaign recorded a considerably smaller range of nitrate, and only the linear Pearson test was significant (r = −0.25, p = 0.011), while the Spearman (ρ = −0.05) and Kruskal–Wallis (p = 0.36) tests were not, because the nitrate range in the dataset was very limited. The difference in statistical strength is due to the more extended contamination gradient resolved in 2024. In the 2018 campaign, only the parametric Pearson test was significant, while the rank-based Spearman test was not (ρ = −0.05, p = 0.60), indicating that the 2018 signal is driven by a few extreme values rather than a monotonic relationship. The 2018 data are therefore consistent with, but do not independently confirm, the inverse relationship, which is robustly established in the 2024 campaign.

4.5. Random Forest and SHAP Analysis of Nitrate

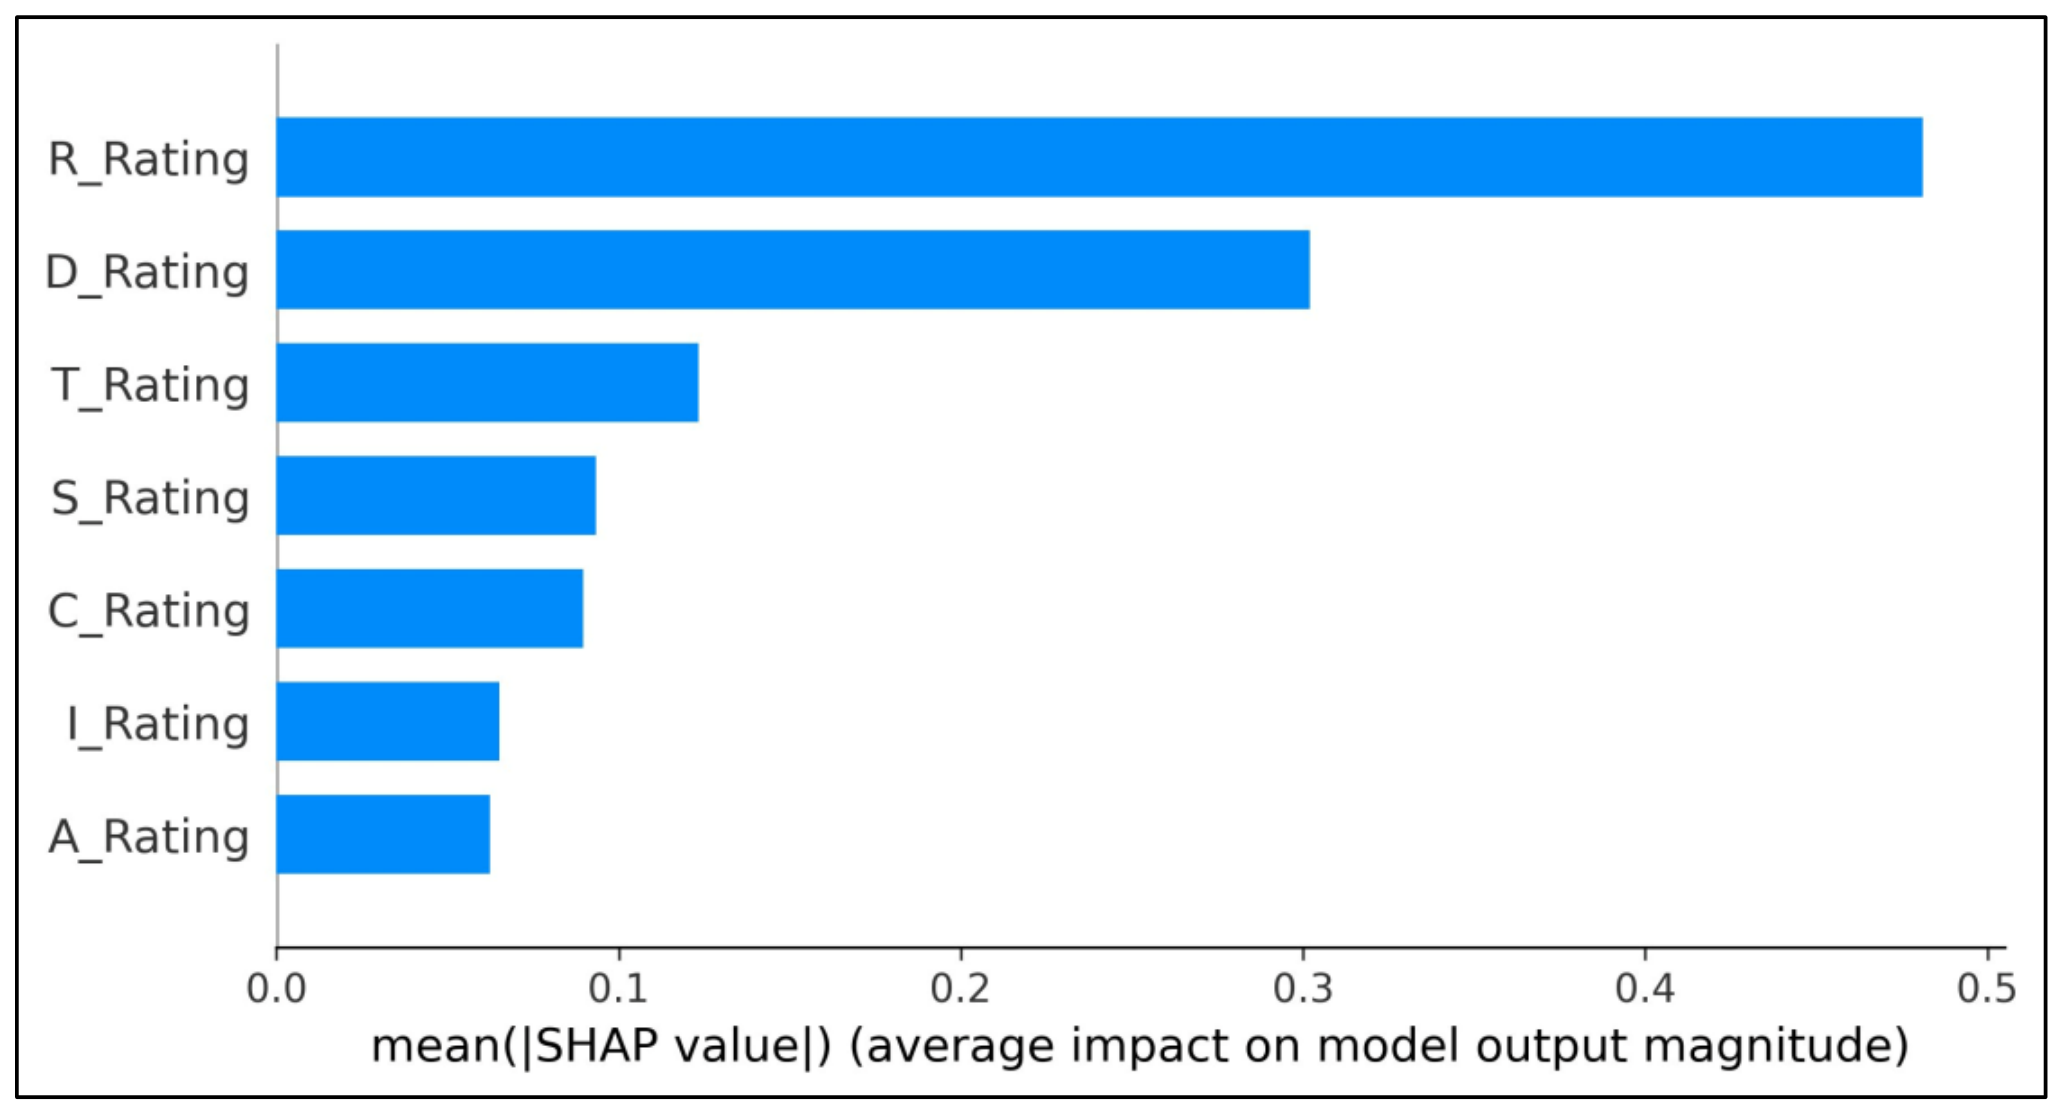
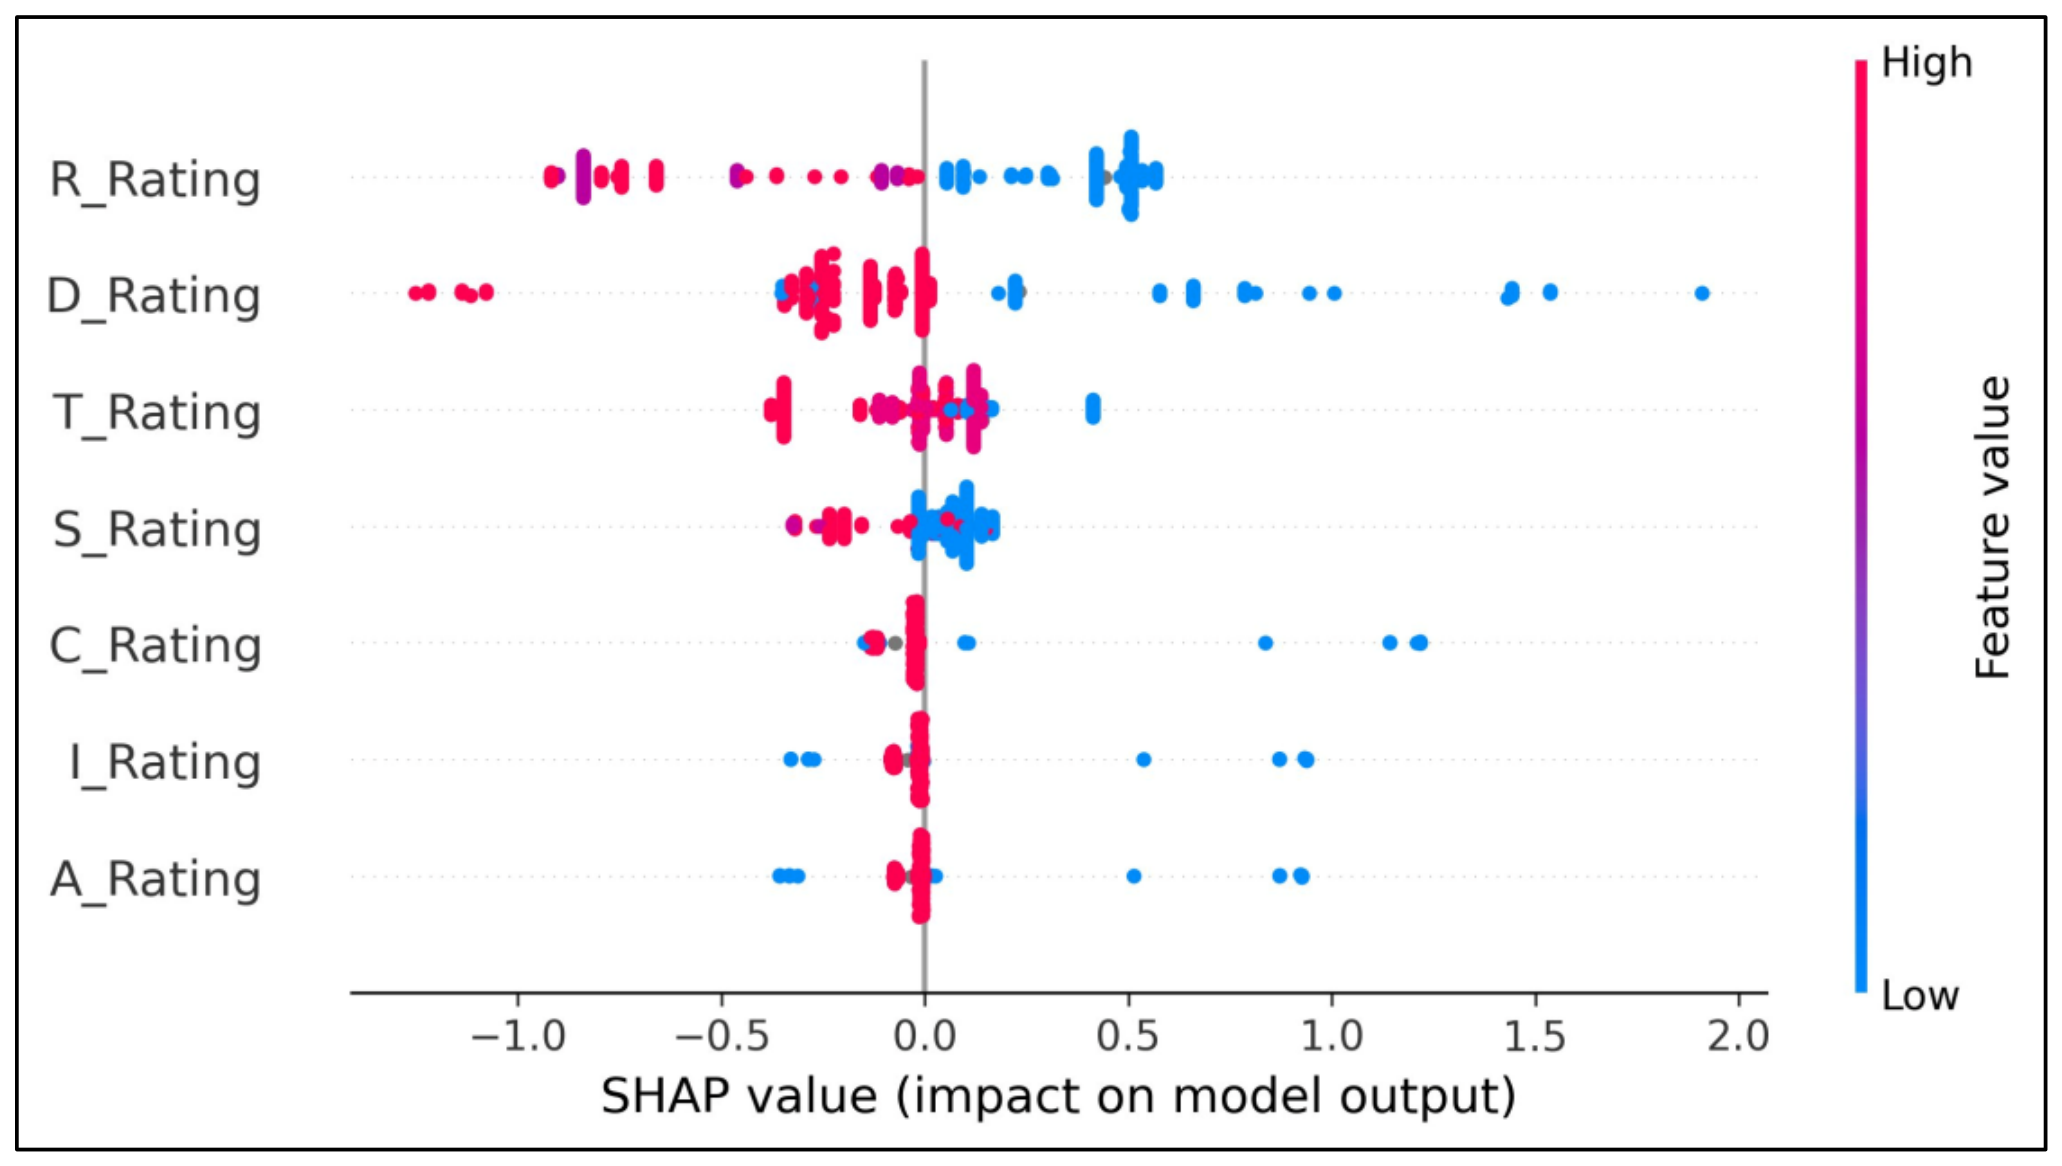
The Random Forest model trained on measured nitrate had limited predictive ability (five-fold cross-validated R2 = 0.08; out-of-bag R2 = 0.08; MAE = 1.87 mg/L), and it was found that the DRASTIC parameters are not predictive of observed nitrate concentrations. Both feature importance (Table 4) and mean absolute SHAP values (Figure 7) showed that net recharge (R) and depth to water table (D) were the most important features. Most importantly, the direction of the associations was shown by the SHAP beeswarm plot (Figure 8): high D and R scores (shallow water tables and high recharge rates) correspond to lower predicted nitrate concentrations, and low scores (deep water tables and low recharge rates) correspond to higher nitrate concentrations. We hypothesize that the inverse relationship reflects, at a parameter level, the association of the most vulnerable settings with active recharge and dilution rather than with higher loadings. Because this interpretation rests on a Random Forest model with low predictive skill (R2 = 0.08) and is not corroborated by independent geochemical evidence, it is presented as a plausible hypothesis rather than a demonstrated mechanism; these SHAP associations describe direction only.

4.6. Land-Use and the Localized Nature of Contamination

Land-use class was obtained for each well to determine whether observed nitrate reflected diffuse land-use loading (Table 5). The land-use classes were almost indistinguishable with respect to mean nitrate concentrations (Urban 4.6 mg/L, Agriculture 4.3 mg/L; Kruskal–Wallis H = 7.23, p = 0.065). The wells with the highest nitrate concentrations were not exclusively associated with one land-use class but were sporadic: the highest nitrate concentration (24.1 mg/L) was found at a peri-urban site (Park Enclave), and a group of high concentrations (8.6–12.0 mg/L) was found at Model Town Humak, a dense residential–industrial suburb along the southern watershed edge. The lack of a land-use gradient, together with the distribution of the highest nitrate concentrations, suggests that nitrate contamination in this watershed is controlled by local point sources and not by diffuse land-use loading or aquifer susceptibility.

4.7. Vulnerability–Contamination Typology

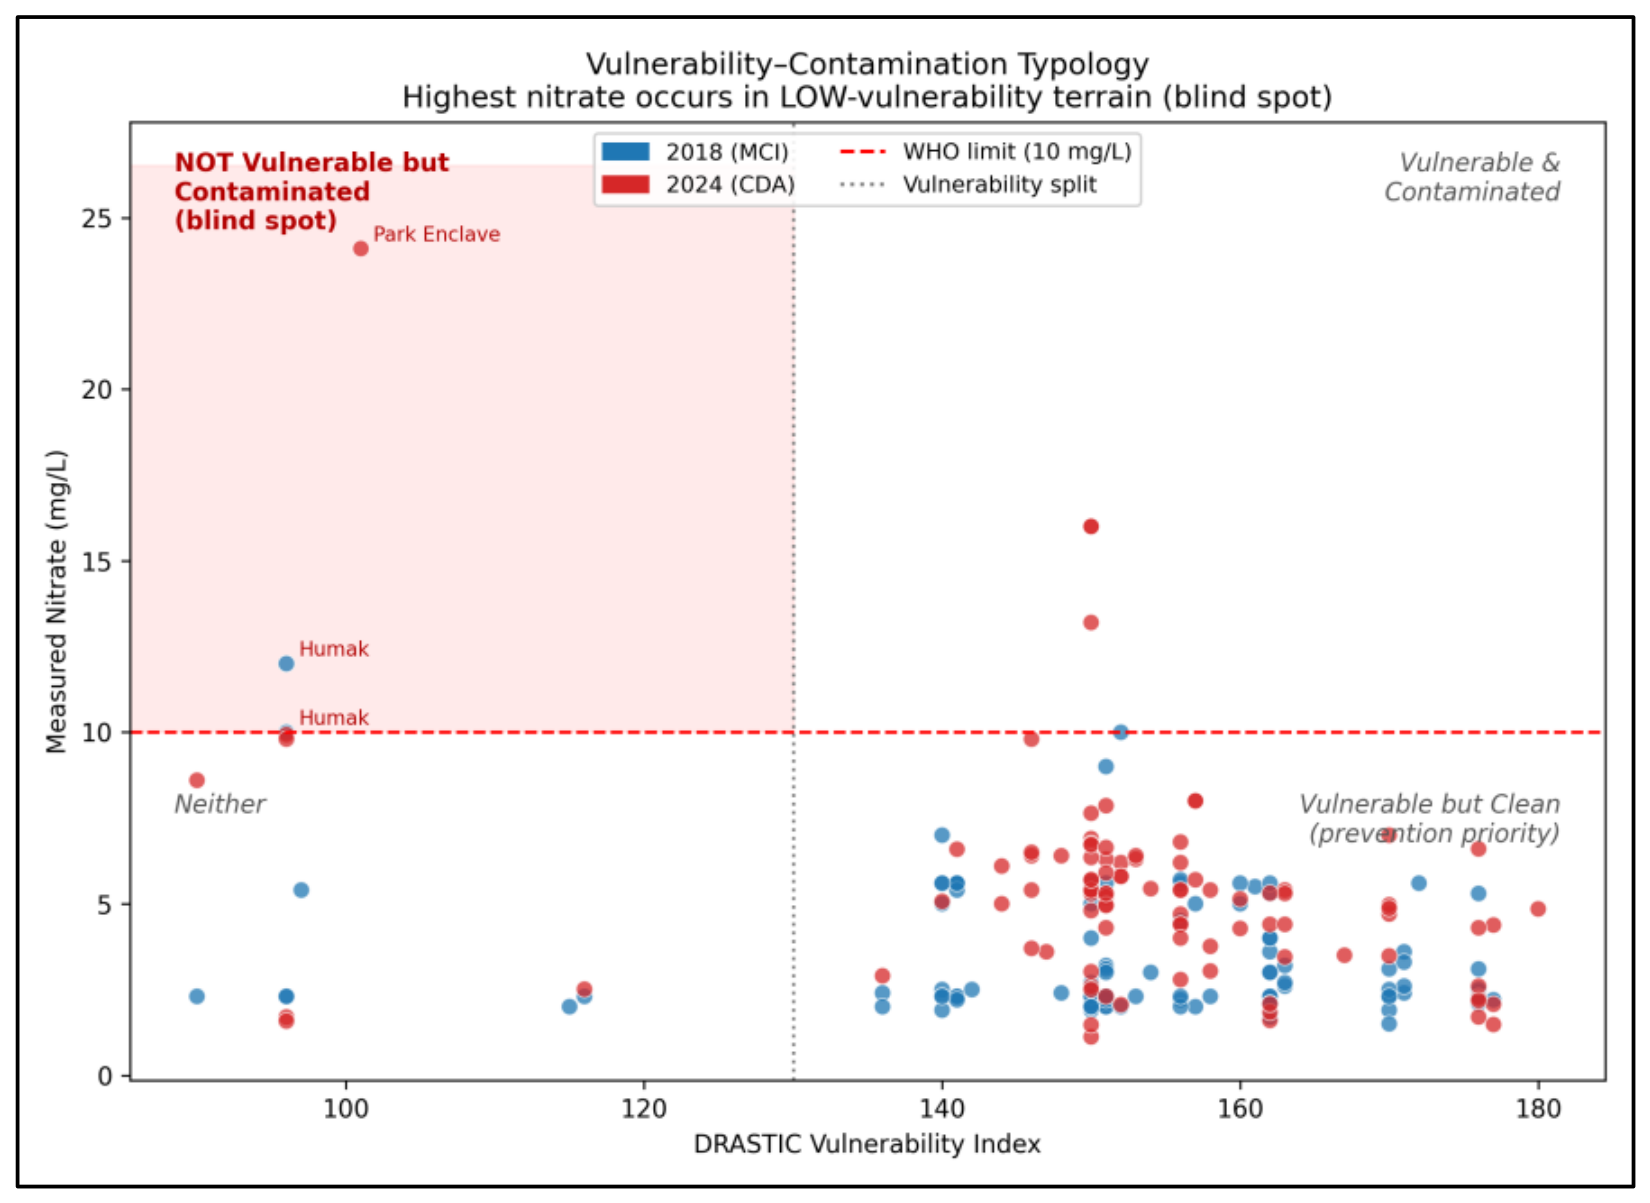
The inverse relationship was translated into a management-relevant framework by cross-classifying the wells by vulnerability (DRASTIC Index above or below 130) and contamination (nitrate above or below the USEPA maximum contaminant level of 10 mg/L), which resulted in four categories (Figure 9). The majority of wells (182, 90.5%) were classified as Vulnerable-but-Clean, which are naturally vulnerable but not contaminated at present, and which are the main targets of preventive protection. A further 12 wells (6.0%) were Not-Vulnerable-and-Clean, and only 4 wells (2.0%) were both Vulnerable and Contaminated—the only combination that a vulnerability map is designed to flag. Most importantly, three wells (1.5%) were classified as Not-Vulnerable-but-Contaminated. Two were in Model Town Humak (10.0 and 12.0 mg/L), and the third was the Park Enclave well, which recorded 24.1 mg/L—the highest nitrate concentration in the entire dataset, more than double the USEPA maximum contaminant level. All three lie in low-to-moderate vulnerability terrain (DRASTIC Index 96–101), well below the high-vulnerability threshold and therefore not flagged by a vulnerability-based prioritization. This clearly illustrates the danger of relying on intrinsic vulnerability mapping alone, which would have deprioritized—and may have overlooked—the most contaminated locations in the watershed. Even though the number of contaminated wells is limited, the significance of the finding is evident: the maximum contamination in the watershed occurs precisely where the vulnerability map indicates the lowest susceptibility.

4.8. Spatial Robustness

Because the validation wells were clustered in the alluvial zone, two analyses were performed to determine whether the inverse relationship was a spatial artifact. First, spatial autocorrelation of the measured nitrate was calculated using Moran’s I and returned a value of −0.316 with a permutation p-value of 0.96, indicating no significant positive spatial autocorrelation; this means that nitrate concentrations in neighboring wells are not systematically similar, and that the vulnerability–nitrate relationship is not the result of spatial dependence. Second, a spatial-block cross-validation was performed (entire geographic blocks of wells were left out), and the coefficient of determination was a negative R2 of −0.18, indicating that the DRASTIC parameters have no predictive skill for nitrate when spatial leakage between training and test wells is removed. The negative rank correlation was nonetheless still significant (Spearman ρ = −0.19, p = 0.007). Combined, these findings provide a statistical basis that the inverse association is not a clustering artifact and that there is no predictive skill—both of which are important to the interpretation outlined in Section 5.

5. Discussion

5.1. Depth and Recharge as Dominant Controls

The single-parameter sensitivity analysis and the nitrate-trained Random Forest address different questions—the former identifies which parameters control the internal DRASTIC Index, the latter which parameters associate with measured contamination—yet both converge on depth to water table and net recharge as dominant. This convergence is hydrogeologically meaningful: high monsoon recharge and shallow water tables (<5 m) dominate the behavior of the western alluvial core. This is in line with the conclusions of Shirazi et al. [12], who highlighted the strongly local nature of each DRASTIC parameter’s influence and its poor representation by global parameter weights, and with Gómez-Escalonilla and Martínez-Santos [16], who showed that the importance of each DRASTIC parameter, as determined by machine-learning, varies significantly from the standard DRASTIC weights.

5.2. The Inverse Vulnerability–Nitrate Relationship

The main result is that there is an inverse relationship between measured nitrate and intrinsic DRASTIC vulnerability: the more vulnerable the zone, the lower the measured nitrate. In the pooled data, this result was statistically significant, and more strongly so in the 2024 campaign, with the 2018 data showing a consistent inverse direction that did not reach rank-based significance. The SHAP analysis offers a parameter-level mechanism, in that lower nitrate is related to shallow, high-recharge settings, which are rated most vulnerable, suggesting, as a hypothesis, that active recharge and dilution rather than contaminant accumulation may characterize the high-vulnerability alluvial zone; this remains to be confirmed with independent geochemical or isotopic evidence. This apparent paradox is a well-documented one in which the ease of movement of surface contaminants to the aquifer (quantified by DRASTIC) and the observed water chemistry are both influenced by the spatial distribution of contaminant loading, as well as residence time. The most vulnerable western alluvium is recharged by active monsoon processes, which diminish dissolved load, while lower-vulnerability settings with longer residence times build up dissolved load.
The alluvial aquifer is also composed of a heterogeneous and complex stratigraphy (Figure 4), including layers of gravel and boulders bound by lenses of clay that act as preferential flow paths. In the higher-conductivity zones, increased hydraulic conductivity leads to reduced local water levels (increasing depth-to-water and apparent vulnerability) and reduced solute residence times (effectively decreasing pollutant build-up by flushing) [50,51]. Recent studies of heterogeneous and riparian aquifers have shown that these preferential pathways are entry points for solute transport and are often the dominant control on water-quality distributions, more important than intrinsic susceptibility [51,52]. Given the uncertainty of geological conditions, the probabilistic delineation of connected high-conductivity networks in alluvial environments [39,50] offers a conceptual framework for why a distance-based vulnerability index may not account for the factors controlling observed contamination. The inverse relationship found here is therefore not anomalous but is mechanistically consistent with preferential-pathway and residence-time processes.

5.3. Localized Point-Source Control of Contamination

The land-use analysis makes sense of the inverse relationship. Nitrate did not differ significantly between land-use classes (p = 0.065), and the urban and agricultural classes were nearly indistinguishable—the opposite of what diffuse land-use loading would produce. High concentrations were not related to land-use but occurred as isolated sites: the Model Town Humak cluster (a dense residential–industrial suburb, 8.6–12.0 mg/L) and an individual peri-urban well at Park Enclave exceeding 24 mg/L. This suggests that nitrate contamination is driven by localized point sources (sewerage systems, septic systems, and industrial facilities) superimposed on a hydrogeological background. The vulnerability–contamination typology (Figure 9) operationalizes this: the most contaminated wells in the watershed lie in the Not-Vulnerable-but-Contaminated quadrant, indicating that they are not intrinsically vulnerable but have been contaminated by point-source loads in low-susceptibility terrain. This is in line with previous studies that have attributed nitrate and microbial contamination in the Islamabad–Rawalpindi area to sewage, drainage, and waste-disposal sources [27,28,29].

5.4. Avoiding Circularity in Machine-Learning DRASTIC

A methodological point underlies the interpretation above. A common approach in machine-learning DRASTIC studies trains a model to predict the DRASTIC Index from the same seven parameters that define it. Because the target is an exact function of the predictors, such models necessarily achieve high apparent accuracy, but this reflects the internal consistency of the index rather than any validation against contamination, and the resulting data-driven weights are not independently grounded. To avoid this circularity, the present study trained the Random Forest on independently measured nitrate rather than on the index. The resulting low predictive skill (R2 = 0.08) is itself informative: it demonstrates honestly that the DRASTIC parameters, however configured, do not predict observed nitrate in this watershed—a conclusion that a circular index-trained model would have obscured behind a spuriously high accuracy.

5.5. Limitations

There are a few limitations to note. First, the DRASTIC map was created with 21 production boreholes, which is not a high monitoring density compared to published urban-aquifer DRASTIC maps [31,32], and this introduces uncertainty in the depth-to-water interpolation across this density; the assessment is also restricted to the alluvial domain rather than the fractured northern uplands. Second, the inverse relationship is established within the urbanized alluvial zone, where both the aquifer and population are concentrated; the absence of significant spatial autocorrelation (Moran’s I = −0.32, p = 0.96) indicates that the relationship is not biased by this spatial concentration. Third, the correlation between vulnerability and nitrate is weak (|r| < 0.3), and this is not a drawback of the model but a substantive conclusion of the study: the weak correlation, together with the negative spatial cross-validation skill, quantifies the limited explanatory power of intrinsic vulnerability for the observed nitrate. Fourth, some DRASTIC parameters are not very discriminating because they are relatively constant in space throughout the alluvial zone (such as hydraulic conductivity and the impact of the vadose zone). Fifth, the 2018 validation dataset included only a small gradient of nitrate, which restricted the temporal comparison, and the small number of wells with nitrate above the USEPA maximum contaminant level (n = 7) means the typology is interpreted qualitatively. Finally, the Random Forest analysis is exploratory given the very weak contamination gradient, and is interpreted as representing the direction of parameter association rather than as a predictive model.

5.6. Implications

The results have a useful application for groundwater management. Based on the DRASTIC vulnerability maps identifying where the aquifer is intrinsically susceptible to surface contamination, the western alluvial zone remains the best area in which to implement measures to protect the aquifer from future surface contamination. Such maps, however, must not be used as maps of existing contamination, which in this watershed is localized at point sources and controlled by residence-time effects, as shown by the inverse relationship with current nitrate. For effective groundwater protection, it is therefore not enough to rely on intrinsic vulnerability alone; specific monitoring of point-source loadings, especially around dense residential–industrial settlements such as Model Town Humak, must also be conducted.

6. Conclusions

This study assessed groundwater vulnerability in the Islamabad Watershed using a GIS-based DRASTIC model, examined the controls on the index using sensitivity analysis and a Random Forest trained on independent measured nitrate, and validated the map against 233 georeferenced groundwater samples from two independent campaigns. The principal conclusions are:
  • The DRASTIC model classified 12.9% of the mapped watershed (209.3 km2) as Very High vulnerability, concentrated in the shallow western alluvial zone of urban Islamabad, with vulnerability declining northward toward the fractured Margalla piedmont.
  • Depth to water table and net recharge were the dominant controls on the index and on its association with measured nitrate, consistent with the shallow, actively recharged character of the western alluvial aquifer.
  • Validation against independent groundwater data revealed a statistically significant inverse relationship between intrinsic vulnerability and measured nitrate (pooled Spearman ρ = −0.19, p = 0.007; 2024 ρ = −0.33, p < 0.001). The inverse direction was robustly significant in the 2024 dataset and consistent with, though not independently confirmed by, the more limited 2018 dataset; statistical strength scaled with the contamination gradient captured.
  • The inverse relationship reflects the distinction between intrinsic transport vulnerability and observed water chemistry: the most vulnerable zones receive active recharge that dilutes contaminants, whereas observed nitrate is governed by localized point sources rather than diffuse land-use, for which no significant gradient was found (p = 0.065).
  • Training the Random Forest on measured nitrate rather than on the DRASTIC Index avoided the circularity inherent in index-trained models; the resulting low predictive skill (R2 = 0.08) honestly demonstrates that the DRASTIC parameters do not predict observed nitrate in this watershed.
  • For groundwater management, DRASTIC vulnerability maps remain valuable for identifying zones intrinsically susceptible to future surface contamination and should guide protective planning, but they should not be interpreted as maps of existing contamination. Effective protection requires pairing intrinsic vulnerability assessment with targeted point-source monitoring.

Supplementary Materials

The following supporting information can be downloaded at: https://www.mdpi.com/article/10.3390/w18151827/s1. Supplementary Figure S1. Individual DRASTIC parameter rating rasters.

Author Contributions

Conceptualization, W.A., E.K. and S.Z.; methodology, W.A.; software, W.A.; validation, W.A., E.K. and S.Z.; formal analysis, W.A.; investigation, W.A.; resources, E.K., S.Z. and H.R.; data curation, W.A. and H.R.; writing—original draft preparation, W.A.; writing—review and editing, E.K., S.Z. and H.R.; visualization, W.A.; supervision, E.K. and S.Z.; project administration, E.K.; funding acquisition, E.K. All authors have read and agreed to the published version of the manuscript.

Funding

This research received no external funding. The Article Processing Charge (APC) was funded by the University of Warsaw under Activity I.2.4, “Microgrants for employees: support for scientific publications”, of the Excellence Initiative—Research University (IDUB) programme.

Data Availability Statement

Borehole hydrogeological data are available from the Capital Development Authority (CDA), Islamabad, subject to CDA data-access policies. The groundwater quality datasets were provided by the Pakistan Council of Research in Water Resources (PCRWR) and are available from the corresponding author upon reasonable request.

Acknowledgments

The authors thank Hifza Rasheed for providing additional hydrogeological and groundwater-quality data used in this study. The remaining datasets were obtained from previously published research, and we acknowledge the respective authors for making these data available. The authors also express their gratitude to the University of Warsaw and the IDUB program for supporting the publication of this article.

Conflicts of Interest

The authors declare no conflicts of interest.

References

  1. Foster, S.S.D.; Hirata, R.; Gomes, D.; D’Elia, M.; Paris, M. Groundwater Quality Protection: A Guide for Water Utilities, Municipal Authorities, and Environment Agencies; The World Bank: Washington, DC, USA, 2002. [Google Scholar]
  2. Qureshi, A.S.; McCornick, P.G.; Sarwar, A.; Sharma, B.R. Challenges and prospects for sustainable groundwater management in the Indus Basin, Pakistan. Water Resour. Manag. 2010, 24, 1551–1569. [Google Scholar]
  3. National Research Council. Ground Water Vulnerability Assessment: Contamination Potential Under Conditions of Uncertainty; National Academies Press: Washington, DC, USA, 1993. [Google Scholar]
  4. Margat, J. Vulnérabilité des Nappes d’Eau Souterraine à la Pollution; Document BRGM 68 SGL 198 HYD; Bureau de Recherches Géologiques et Minières: Orléans, France, 1968.
  5. Aller, L.; Bennett, T.; Lehr, J.H.; Petty, R.J.; Hackett, G. DRASTIC: A Standardized System for Evaluating Ground Water Pollution Potential Using Hydrogeologic Settings; EPA/600/2-87/035; U.S. Environmental Protection Agency: Washington, DC, USA, 1987.
  6. Barbulescu, A. Assessing groundwater vulnerability: DRASTIC and DRASTIC-like methods—A review. Water 2020, 12, 1356. [Google Scholar] [CrossRef]
  7. Rahman, A. A GIS based DRASTIC model for assessing groundwater vulnerability in shallow aquifer in Aligarh, India. Appl. Geogr. 2008, 28, 32–53. [Google Scholar] [CrossRef]
  8. Ghosh, R.; Sutradhar, S.; Mondal, P.; Das, N. Application of DRASTIC model for assessing groundwater vulnerability: A study on Birbhum district, West Bengal, India. Model. Earth Syst. Environ. 2021, 7, 171–179. [Google Scholar]
  9. Goyal, D.; Haritash, A.K.; Singh, S.K. A comprehensive review of groundwater vulnerability assessment using index-based, modelling, and coupling methods. J. Environ. Manag. 2021, 296, 113161. [Google Scholar] [CrossRef]
  10. Machiwal, D.; Jha, M.K.; Singh, V.P.; Mohan, C. Assessment and mapping of groundwater vulnerability to pollution: Current status and challenges. Earth-Sci. Rev. 2018, 185, 901–927. [Google Scholar] [CrossRef]
  11. Dixon, B. Groundwater vulnerability mapping: A GIS and fuzzy rule based integrated tool. Appl. Geogr. 2005, 25, 327–347. [Google Scholar] [CrossRef]
  12. Shirazi, S.M.; Imran, H.M.; Akib, S. GIS-based DRASTIC method for groundwater vulnerability assessment: A review. J. Risk Res. 2012, 15, 991–1011. [Google Scholar] [CrossRef]
  13. Neshat, A.; Pradhan, B. An integrated DRASTIC model using frequency ratio and two statistical methods for groundwater vulnerability assessment. Nat. Hazards 2015, 76, 543–563. [Google Scholar]
  14. Napolitano, P.; Fabbri, A.G. Single-parameter sensitivity analysis for aquifer vulnerability assessment using DRASTIC and SINTACS. In Proceedings of the HydroGIS 96 Conference, Vienna, Austria, 16–19 April 1996; IAHS Publication No. 235; IAHS Press: Wallingford, UK, 1996; pp. 559–566. [Google Scholar]
  15. Elzain, H.E.; Chung, S.Y.; Venkatramanan, S.; Selvam, S.; Ahemd, H.A.; Seo, Y.K.; Bhuyan, M.S.; Yassin, M.A. Novel machine learning algorithms to predict the groundwater vulnerability index to nitrate pollution at two levels of modeling. Chemosphere 2023, 314, 137671. [Google Scholar] [CrossRef] [PubMed]
  16. Gómez-Escalonilla, V.; Martínez-Santos, P. A machine learning approach to map the vulnerability of groundwater resources to agricultural contamination. Hydrology 2024, 11, 153. [Google Scholar] [CrossRef]
  17. Barzegar, R.; Moghaddam, A.A.; Deo, R.; Fijani, E.; Tziritis, E. Mapping groundwater contamination risk of multiple aquifers using multi-model ensemble of machine learning algorithms. Sci. Total Environ. 2018, 621, 697–712. [Google Scholar] [CrossRef] [PubMed]
  18. Busico, G.; Kazakis, N.; Cuoco, E.; Colombani, N.; Tedesco, D.; Voudouris, K.; Mastrocicco, M. A novel hybrid method of specific vulnerability to anthropogenic pollution using multivariate statistical and regression analyses. Water Res. 2019, 171, 115386. [Google Scholar] [PubMed]
  19. Breiman, L. Random forests. Mach. Learn. 2001, 45, 5–32. [Google Scholar] [CrossRef]
  20. Sajedi-Hosseini, F.; Malekian, A.; Choubin, B.; Rahmati, O.; Cipullo, S.; Coulon, F.; Pradhan, B. A novel machine learning-based approach for the risk assessment of nitrate groundwater contamination. Sci. Total Environ. 2018, 644, 954–962. [Google Scholar] [CrossRef] [PubMed]
  21. Rahmati, O.; Choubin, B.; Fathabadi, A.; Coulon, F.; Soltani, E.; Shahabi, H.; Mollaefar, E.; Tiefenbacher, J.; Cipullo, S.; Ahmad, B.B.; et al. Predicting uncertainty of machine learning models for modelling nitrate pollution of groundwater using quantile regression and UNEEC methods. Sci. Total Environ. 2019, 688, 855–866. [Google Scholar] [CrossRef] [PubMed]
  22. Rodriguez-Galiano, V.; Mendes, M.P.; Garcia-Soldado, M.J.; Chica-Olmo, M.; Ribeiro, L. Predictive modeling of groundwater nitrate pollution using Random Forest and multisource variables related to intrinsic and specific vulnerability: A case study in an agricultural setting (Southern Spain). Sci. Total Environ. 2014, 476–477, 189–206. [Google Scholar] [CrossRef] [PubMed]
  23. Khosravi, K.; Panahi, M.; Bui, D.T. Spatial prediction of groundwater spring potential mapping based on an adaptive neuro-fuzzy inference system and metaheuristic optimization. Hydrol. Earth Syst. Sci. 2018, 22, 4771–4792. [Google Scholar] [CrossRef]
  24. Lee, S.; Kim, Y.S.; Oh, H.J. Application of a weights-of-evidence method and GIS to regional groundwater productivity potential mapping. J. Environ. Manag. 2012, 96, 91–105. [Google Scholar] [CrossRef]
  25. Lundberg, S.M.; Lee, S.I. A unified approach to interpreting model predictions. Adv. Neural Inf. Process. Syst. 2017, 30, 4765–4774. [Google Scholar]
  26. Shabbir, R.; Ahmad, S.S. Water resource vulnerability assessment in Rawalpindi and Islamabad, Pakistan using analytic hierarchy process (AHP). J. King Saud Univ. Sci. 2016, 28, 293–299. [Google Scholar] [CrossRef]
  27. Rana, S.A.; Ali, S.M.; Ashraf, M.; Shah, A.A.; Iqbal, K.M.J.; Ullah, W.; Tariq, M.A.U.R.; Iqbal, N.; Akhtar, N.; Ulain, Q. GIS-based assessment of selective heavy metals and stable carbon isotopes in groundwater of Islamabad and Rawalpindi, Pakistan. Front. Environ. Sci. 2022, 10, 1027323. [Google Scholar] [CrossRef]
  28. Rana, S.A.; Ali, S.M.; Ashraf, M.; Akhtar, N.; Ulain, Q.; Eqani, S.A.M.A.S. Groundwater assessment for domestic and irrigation water supply based on water quality indices and geographic information systems in the Islamabad-Rawalpindi metropolitan area, Pakistan. Environ. Earth Sci. 2026, 85, 22. [Google Scholar]
  29. Kahlown, M.A.; Majeed, A.; Ashraf, M.; Tahir, M.A. Drinking Water Quality in Pakistan: A Case Study of Islamabad and Rawalpindi Cities; PCRWR: Islamabad, Pakistan, 2005.
  30. Shinwari, F.U.; Khan, M.A.; Siyar, S.M.; Liaquat, U.; Kontakiotis, G.; Zhran, M.; Shahab, M.; Alshehri, F. Evaluating the contamination susceptibility of groundwater resources through anthropogenic activities in Islamabad, Pakistan: A GIS-based DRASTIC approach. Appl. Water Sci. 2025, 15, 81. [Google Scholar] [CrossRef]
  31. Hussain, Y.; Ullah, S.F.; Hussain, M.B.; Martinez-Carvajal, H.; Aslam, A.Q. Modelling the vulnerability of groundwater to contamination in an unconfined alluvial aquifer in Pakistan. Environ. Earth Sci. 2017, 76, 84. [Google Scholar] [CrossRef]
  32. Bera, A.; Mukhopadhyay, B.P.; Das, S. Groundwater vulnerability and contamination risk mapping of semi-arid Totko river basin, India using GIS-based DRASTIC model and AHP techniques. Chemosphere 2022, 307, 135831. [Google Scholar] [CrossRef] [PubMed]
  33. Ahmad, Z.; Ashraf, A.; Hafeez, M. Appraisal of Groundwater Flow Simulation in the Sub-Himalayan Watershed of Pakistan. In Groundwater—Contaminant and Resource Management; Javaid, M.S., Ed.; IntechOpen: London, UK, 2016. [Google Scholar] [CrossRef] [PubMed]
  34. Abbas, I.; Kiyani, S.G.; Ahsan, M.S.; Akram, H. Spatiotemporal Analysis of Water Table Within Rawalpindi Municipal Jurisdiction; [Technical Report]; Advanced GIS Course Project, Institute of Geographical Information Systems, National University of Sciences and Technology (NUST): Islamabad, Pakistan, 2012. [Google Scholar] [CrossRef]
  35. Sheikh, I.M.; Pasha, M.K.; Williams, V.S.; Raza, S.Q.; Khan, K.S.A. Environmental Geology of the Islamabad–Rawalpindi Area, Northern Pakistan. In Regional Studies of the Potwar Plateau Area, Northern Pakistan; U.S. Geological Survey Bulletin 2078; U.S. Geological Survey: Reston, VA, USA, 2007; pp. G1–G32. [Google Scholar]
  36. Government of Punjab; Soil Survey of Pakistan. Soil Survey Report of Islamabad and Rawalpindi Districts; Soil Survey of Pakistan: Lahore, Pakistan, 2009.
  37. American Public Health Association (APHA). Standard Methods for the Examination of Water and Wastewater, 24th ed.; APHA Press: Washington, DC, USA, 2023. [Google Scholar]
  38. ESRI. ArcGIS Pro, Version 3.2.0; Environmental Systems Research Institute: Redlands, CA, USA, 2023.
  39. Schiavo, M. Probabilistic delineation of subsurface connected pathways in alluvial aquifers under geological uncertainty. J. Hydrol. 2022, 615, 128674. [Google Scholar] [CrossRef]
  40. Pacheco, F.A.L.; Pires, L.M.G.R.; Santos, R.M.B.; Fernandes, L.F.S. Factor weighting in DRASTIC modeling. Sci. Total Environ. 2015, 505, 474–486. [Google Scholar] [CrossRef] [PubMed]
  41. Huan, H.; Wang, J.; Teng, Y. Assessment and validation of groundwater vulnerability to nitrate based on a modified DRASTIC model: A case study in Jilin City of northeast China. Sci. Total Environ. 2012, 440, 14–23. [Google Scholar] [CrossRef] [PubMed]
  42. Babiker, I.S.; Mohamed, M.A.A.; Hiyama, T.; Kato, K. A GIS-based DRASTIC model for assessing aquifer vulnerability in Kakamigahara Heights, Gifu Prefecture, central Japan. Sci. Total Environ. 2005, 345, 127–140. [Google Scholar] [CrossRef] [PubMed]
  43. Liggett, J.E.; Allen, D.M. Evaluating the sensitivity of DRASTIC using different data sources, interpretations and mapping approaches in areas of limited geological variability. Environ. Geol. 2011, 62, 1577–1595. [Google Scholar]
  44. Javadi, S.; Kavehkar, N.; Mohammadi, K.; Khodadadi, A.; Kahawita, R. Calibrating DRASTIC using field measurements, sensitivity analysis and statistical methods to assess groundwater vulnerability. Water Int. 2011, 36, 719–732. [Google Scholar] [CrossRef]
  45. Dai, H.; Yang, Y.; Zhang, F.; Guadagnini, A.; Yang, J.; Bu, X.; Wang, L.; Yuan, S.; Ye, M. Identification of Key Factors Driving Dissolved Oxygen in Riparian Aquifers Through Deep Learning-Assisted Global Sensitivity Analysis. Water Resour. Res. 2026, 62, e2025WR041884. [Google Scholar] [CrossRef]
  46. Pedregosa, F.; Varoquaux, G.; Gramfort, A.; Michel, V.; Thirion, B.; Grisel, O.; Blondel, M.; Prettenhofer, P.; Weiss, R.; Dubourg, V. Scikit-learn: Machine learning in Python. J. Mach. Learn. Res. 2011, 12, 2825–2830. [Google Scholar]
  47. Lundberg, S.M.; Erion, G.; Chen, H.; DeGrave, A.; Prutkin, J.M.; Nair, B.; Katz, R.; Himmelfarb, J.; Bansal, N.; Lee, S.I. From local explanations to global understanding with explainable AI for trees. Nat. Mach. Intell. 2020, 2, 56–67. [Google Scholar] [CrossRef] [PubMed]
  48. Hollander, M.; Wolfe, D.A.; Chicken, E. Nonparametric Statistical Methods, 3rd ed.; Wiley: Hoboken, NJ, USA, 2013. [Google Scholar]
  49. World Health Organization (WHO). Guidelines for Drinking-Water Quality: Fourth Edition Incorporating the First Addendum; WHO: Geneva, Switzerland, 2017. [Google Scholar]
  50. Schiavo, M.; Riva, M.; Guadagnini, L.; Zehe, E.; Guadagnini, A. Probabilistic identification of Preferential Groundwater Networks. J. Hydrol. 2022, 610, 127906. [Google Scholar] [CrossRef]
  51. Zehe, E.; Loritz, R.; Edery, Y.; Berkowitz, B. Preferential pathways for fluid and solutes in heterogeneous groundwater systems: Self-organization, entropy, work. Hydrol. Earth Syst. Sci. 2021, 25, 5337–5353. [Google Scholar] [CrossRef]
  52. Hester, E.T.; Fox, G.A. Preferential Flow in Riparian Groundwater: Gateways for Watershed Solute Transport and Implications for Water Quality Management. Water Resour. Res. 2020, 56, e2020WR028186. [Google Scholar] [CrossRef]
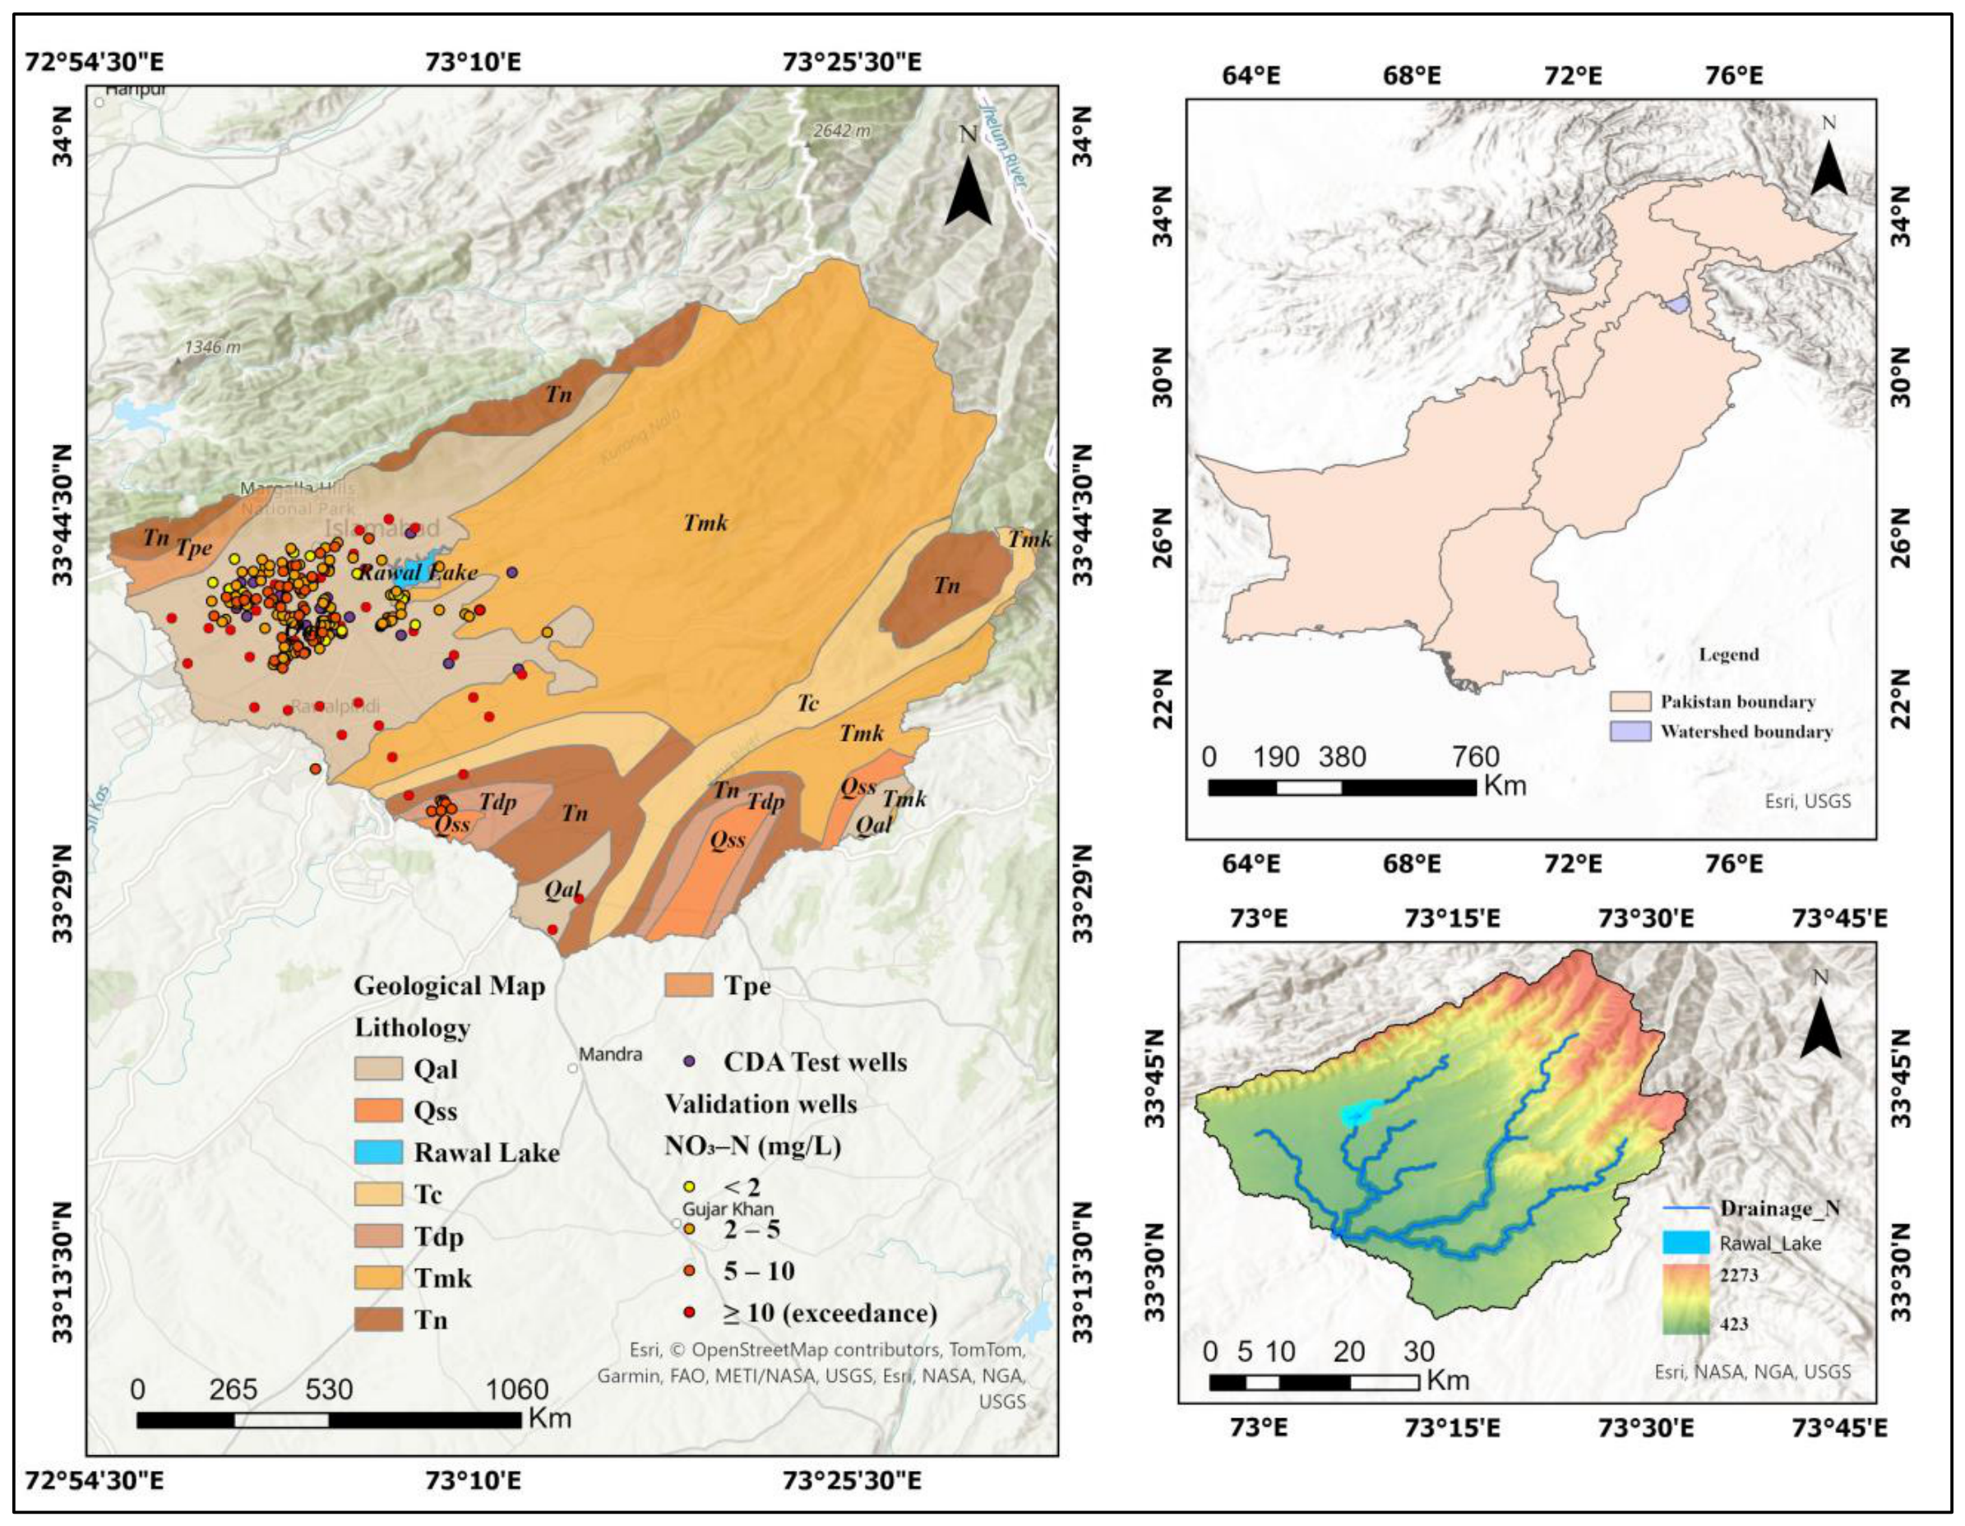
Figure 1. Location map of the Islamabad Watershed showing the study area boundary, CDA borehole locations (n = 21), independent validation wells (n = 233), geological units, and drainage network. Coordinate system: WGS 1984 UTM Zone 43N.
Water 18 01827 g001
Figure 2. Groundwater-systems map of the Islamabad Watershed. The base shows the hydrogeological units graded by aquifer productivity, from the productive porous alluvial aquifer (Qal) and semi-confined/confined units in the west, through the fractured Tpe, to the low-permeability fractured bedrock aquitard (Tmk, Tc) of the eastern uplands. The overlain polygon (bold outline) delineates the productive Islamabad–Rawalpindi groundwater basin, within which the sub-basins C-I, C-II and C-III are labeled (after PCRWR/Naveed et al.); arrows indicate generalized groundwater flow directions.
Water 18 01827 g002
Figure 3. Anthropogenic pressures map of the Islamabad Watershed. Land-use/land cover (urban, agriculture, forest, barren, water) forms the base. Point sources of potential groundwater contamination are overlain in three groups—industrial/fuel, waste, and sanitation/services facilities (compiled from OpenStreetMap, © OpenStreetMap contributors, under the Open Database License)—together with the nitrate sampling wells graduated by measured NO3–N concentration. The highest nitrate concentrations coincide with the densely urbanized western zone, supporting a point-source rather than diffuse-loading control on contamination.
Water 18 01827 g003
Figure 4. Hydrogeological framework of the Islamabad–Rawalpindi alluvial aquifer system: (a) representative hydrolithological column of the shallow alluvial aquifer, showing the overburden (unconsolidated silt/clay surface cover), four boulder/gravel aquifer horizons interbedded with three clay layers, the underlying shale bedrock/aquitard, and the water table, plotted on an elevation scale (m a.s.l.); and (b) stratigraphic and groundwater-elevation cross-section based on borehole logs, showing the overburden, boulder/gravel and clay units, shale bedrock, the natural surface level (NSL) and the water table in 1998, 2003 and 2007 (reproduced from Abbas et al. [34]).
Water 18 01827 g004
Figure 5. DRASTIC groundwater vulnerability map of the Islamabad Watershed alluvial zone, classified into Low (69–100), Moderate (101–130), High (131–160), and Very High (161–188) vulnerability.
Water 18 01827 g005
Figure 6. Box plot of measured nitrate-nitrogen concentration across the four DRASTIC vulnerability classes. Boxes show the interquartile range and median, whiskers the range, triangles the class means, and circles individual outliers. Across the pooled dataset, the relationship is inverse and significant (Spearman ρ = −0.19; Kruskal–Wallis H = 14.10, p = 0.003). Red dashed line: guideline value of 10 mg/L NO3–N.
Water 18 01827 g006
Figure 7. Mean absolute SHAP values for the Random Forest model trained on measured nitrate.
Water 18 01827 g007
Figure 8. SHAP beeswarm summary plot showing the direction of each parameter’s association with measured nitrate. High D and R ratings (High vulnerability) are associated with lower nitrate.
Water 18 01827 g008
Figure 9. Vulnerability–contamination typology. Wells are cross-classified by DRASTIC vulnerability (split at Index = 130) and measured nitrate (split at the USEPA maximum contaminant level of 10 mg/L). The highest-nitrate wells (Park Enclave, Humak) occupy the Not-Vulnerable-but-Contaminated quadrant (upper left).
Water 18 01827 g009
Table 1. Single-parameter sensitivity analysis results (n = 21 Capital Development Authority (CDA) boreholes). Si denotes the effective weight (single-parameter sensitivity index).
ParameterMean SiStd. dev.MinMaxRank
Impact of Vadose Zone (I)1.1448±0.04701.0001.2001
Depth to Water Table (D)1.0869±0.07230.9481.1932
Aquifer Media (A)1.0089±0.02250.9381.0353
Hydraulic Conductivity (C)1.0063±0.03230.8821.0354
Net Recharge (R)0.9995±0.07280.9261.2335
Topography (T)0.9112±0.01010.8830.9386
Soil Media (S)0.8999±0.01980.8880.9687
Table 2. Measured nitrate concentration by DRASTIC vulnerability class (pooled dataset, n = 201).
Vulnerability ClassnMean NO3–N (mg/L)Median (mg/L)Max (mg/L)
Low (69–100)115.995.4012.0
Moderate (101–130)47.732.4024.1
High (131–160)1274.715.0016.0
Very High (161–188)593.373.007.0
Table 3. Vulnerability–nitrate relationship by campaign.
CampaignnPearson r (p)Spearman ρ (p)Kruskal–Wallis H (p)
2018101−0.25 (0.011)−0.05 (0.599)3.23 (0.357)
2024100−0.34 (<0.001)−0.33 (<0.001)14.01 (0.003)
Table 4. Random Forest feature importance (target: measured nitrate).
ParameterImportance
Depth to Water Table (D)0.31
Net Recharge (R)0.20
Hydraulic Conductivity (C)0.12
Impact of Vadose Zone (I)0.10
Aquifer Media (A)0.10
Topography (T)0.09
Soil Media (S)0.07
Table 5. Measured nitrate by land-use class.
Land-Use ClassnMean NO3–N (mg/L)Median (mg/L)
Urban1234.645.00
Agriculture654.283.20
Forest113.603.10
Barren22.252.25
Note: Kruskal–Wallis across land-use classes: H = 7.23, p = 0.065 (not significant).
Disclaimer/Publisher’s Note: The statements, opinions and data contained in all publications are solely those of the individual author(s) and contributor(s) and not of MDPI and/or the editor(s). MDPI and/or the editor(s) disclaim responsibility for any injury to people or property resulting from any ideas, methods, instructions or products referred to in the content.