


Abstract
Per- and polyfluoroalkyl substances (PFAS) are a group of anthropogenically manufactured chemicals widely detected in the environment. Characterizing their transport and fate in soil is important for assessing the potential of their human exposure and health impact. However, to date, few studies have been conducted to investigate the influence of PFAS on soil physical properties. This study investigates the impact of PFAS exposure on the surface wettability of soil via contact angle (θ) measurements. Contact angle was measured based on the fluid uptake rate in the Washburn capillary rise (WCR) method. Contact angles were measurably affected by the presence of 0.5 µg/g PFAS, with an increase of 4.5–6.8% for the exposed Accusand 40/50 and a decrease of 3.6–16% for the exposed Eustis soil, after 7 days of contact. The changes were attributed to the modification of the surface properties caused by the adsorbed PFAS. These results demonstrate that PFAS can potentially alter the surface properties of soils, which could subsequently impact soil hydraulic properties as well as affect geochemical interactions.
1. Introduction
Per- and polyfluoroalkyl substances (PFAS) are organic contaminants of critical concern that have received extensive attention in recent years. PFAS have been used in a large variety of industrial and consumer products (e.g., [1,2]). Their significant toxicity to humans and ecosystems, along with their persistent and bio-accumulative nature, has made PFAS a major public health concern (e.g., [3,4]). PFAS have been detected in various environmental compartments (e.g., [5,6,7]). Hence, there is great interest in characterizing and modeling their transport and fate in the environment to assess exposure potential. Soils serve as major long-term reservoirs of PFAS at many PFAS-impacted sites [5]. Numerous studies have been conducted to examine PFAS sorption by soils, and to evaluate retention and transport behavior (e.g., [8,9,10,11,12]). Conversely, few studies have been conducted to investigate the potential impact of PFAS on soil physical properties.
The surface wettability of soils is a critical property that influences several processes, including fluid retention and flow, interfacial adsorption, and pore-scale mass transfer (e.g., [13,14]). It is well established that solutes present in porewater can impact wettability by adsorbing at the solid surface and thereby altering contact angles. Both naturally occurring matter (e.g., dissolved organic carbon) and anthropogenic contaminants can impact wettability.
The ability of fluorinated compounds to alter the wettability of different types of surfaces has been demonstrated in prior research. Given the amphiphilic nature of many PFAS, it is anticipated that they have the potential to alter the wettability of soils. A recent preliminary study has demonstrated that the presence of 25 µg/L perfluorooctanoic acid (PFOA) in water significantly decreased the contact angles of a few environmental media, including topsoil, as measured by the goniometer method [15]. Additional research is needed to further investigate the influence of PFAS on soil surface properties.
The goal of the present study is to investigate the potential for PFAS to alter the wettability of soil surfaces. The impact of PFAS exposure on wettability was determined by contact angle (θ) measurement using the Washburn capillary rise (WCR) technique. The influence of fluid composition (e.g., organic solvent, deionized water, and 0.01 M NaCl) was tested by monitoring the capillary flow in the packed glass column. Several soils comprising a range of physicochemical properties were tested, along with baseline reference media quartz sand and silica flour. Sodium perfluorooctanoate (PFOA-Na), potassium perfluorooctanesulfonate (PFOS-K), and perfluorooctanesulfonic acid (PFOS-H) were used as representative PFAS. Two hydrocarbon surfactants (sodium dodecylbenzenesulfonate, SDBS, and sodium dodecyl sulfate, SDS) were included for comparison.
2. Materials and Methods
2.1. Materials
PFOA-Na (CAS# 335-95-5, 97%), PFOS-K (CAS# 2795-39-3, 98%), and SDBS (CAS# 25155-30-0, >98%) were purchased from Manchester Organics (Runcorn, UK), Matrix Scientific (Columbia, SC, USA), and Tokyo Chemical Industry (TCI, Portland, OR, USA), respectively. PFOS-H (CAS# 1763-23-1, 98%) and SDS (CAS# 151-21-3, ≤100%) were purchased from Sigma Aldrich (St. Louis, MO, USA). Solutions were prepared in deionized water (DIW, ≥18.2 MΩ•cm) from NANOpure ultrapure water system (Barnstead®, Waltham, MA, USA).
Commercially available quartz sand (Accusand 40/50) was employed as a representative reference solid. It was treated with a 50% methanol solution and dried at 105 °C for 24 h to produce a “clean” reference surface. Crushed quartz silica flour (SIL-CO-SIL® 250, Ottawa, IL, USA, Lot#: 50072022, denoted as Silica flour 250) was used to test the influence of particle size. A natural soil (Eustis, B horizon, siliceous, thermic Psammentic Paleudults) was employed as a representative soil. Properties of the porous media are presented in Table 1. In addition to these media, measurements were conducted with a sample of the Accusand 40/50 that had been exposed to trichloroethene (TCE) for several years. This exposed sand is denoted as Accusand-TCE. A subsample of the Accusand-TCE was washed with DIW and air-dried at room temperature in the fume hood for three days and is denoted as Accusand-TCE-Hood. No humidity control was applied for the storage or measurement of the solids, unless noted otherwise.
Table 1.
Solid properties.
2.2. PFAS Exposure Experiments
A 10 g sample of the solid was weighed into a polypropylene container, after which 5 mL of solution was added containing 1 mg/L PFOA-Na, PFOS-K, PFOS-H, SDBS, or SDS. This is the equivalent of 0.5 µg/g per solid-phase mass. The container was covered for 24 h, uncovered, and air-dried at room temperature in the fume hood for several days. No additional humidity control was adapted. The influence of sample drying and humidity effects are discussed in Text S2 of the Supplementary Materials. No specific temperature control was used other than that controlling room temperature (~23–25 C). Control samples including solid-only and solid with DIW or 0.01 M NaCl were also created. At the predetermined time interval, a 1.5 g subsample of solid was removed for direct contact angle measurement in DIW or 0.01 M NaCl solution.
2.3. Contact Angle Measurement
Multiple methods are available to measure contact angle (θ), including sessile drop, Wilhelmy plate, and Washburn capillary rise (WCR). The WCR technique is especially suited to characterize the θ of particulate media with irregular surface topography like soils (e.g., [20]). This approach has been demonstrated to be representative when θ is < 90° [21]. The Washburn equation is (e.g., [20,22]),
where θ (°) is contact angle, η (mPa•s) is viscosity, c (mm5) is the material constant, ρ (g/cm3) is density, γL (mN/m) is fluid–air surface tension, m (g) is the mass of the penetrating fluid, and t (s) is fluid uptake time. It should be noted that ρ, γL, and η are the properties of the penetrating fluid, e.g., those of DIW when the θ is measured in DIW.
Inspection of Equation 1 shows that measuring the mass of solvent taken up by the packed medium versus time (i.e., ) can produce a measure of the contact angle when all parameters in the term are known. Information on the fluid properties is typically readily available, leaving the material constant as the critical parameter requiring determination. The WCR method is based on treating the packed medium as a simplified bundle of constant-radius capillary tubes. The material constant is a system-specific geometric constant characterizing the micro-pore structures inside the testing column (e.g., [23,24]). It considers the fact that the materials are not perfectly packed. When the same material is packed in the same way, the material constant can be assumed the same.
Applications of the method often initially employ a solvent with perfect wettability, i.e., a contact angle of zero, to determine the material constant for the selected porous medium. Once this constant is determined, the tests can be used to determine θ for that porous medium. Because of its low surface tension (18.4 mN/m, Table 2), much lower than that of 72.8 mN/m for DIW, hexane is frequently employed as a completely wetting solvent in the WCR method (e.g., [20]). Ethanol (EtOH) has a relatively low surface tension of 22.4 mN/m and its use has also been reported [21]. Preliminary tests were conducted with these two solvents along with two additional alcohol solvents, isopropanol (iPrOH, 20.9 mN/m) and methanol (MeOH, 22.5 mN/m), for comparison.
Table 2.
Properties of common solvents for determining material constant c, as compared to water. The γ, η, and ρ are provided by the built-in software in the Sigma 701 Force Tensiometer.
Contact angle measurements were conducted in a glass column with a sintered glass bottom (part# BL-T112, Biolin Scientific, Phoenix, AZ, USA) using the powder wettability test function of the Sigma 701 Force Tensiometer (Biolin Scientific). After each use, the glass column was ultrasonically cleaned in MeOH followed by sonication in DIW to minimize particle residuals. The column was then dried at 105 °C for 30 min and, thereafter, placed in a fume hood. Once cooled, 1.5 g of the solid was added to the column. The column was lightly tapped the same number of times to ensure the medium was settled. The fluid uptake kinetics, i.e., squared mass (mass2) uptake vs. time (s), were recorded by the software. Multiple preliminary tests were conducted to ensure the final measurements were robust, as will be discussed in the Results and Discussion. The majority of the tests were conducted at least three times, with some conducted twice, and others up to 7 times.
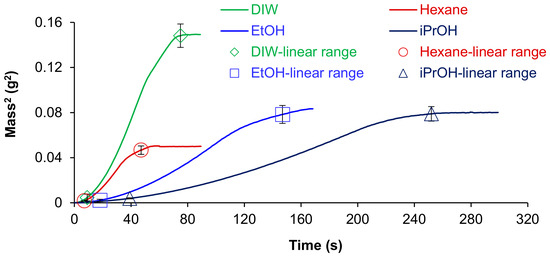
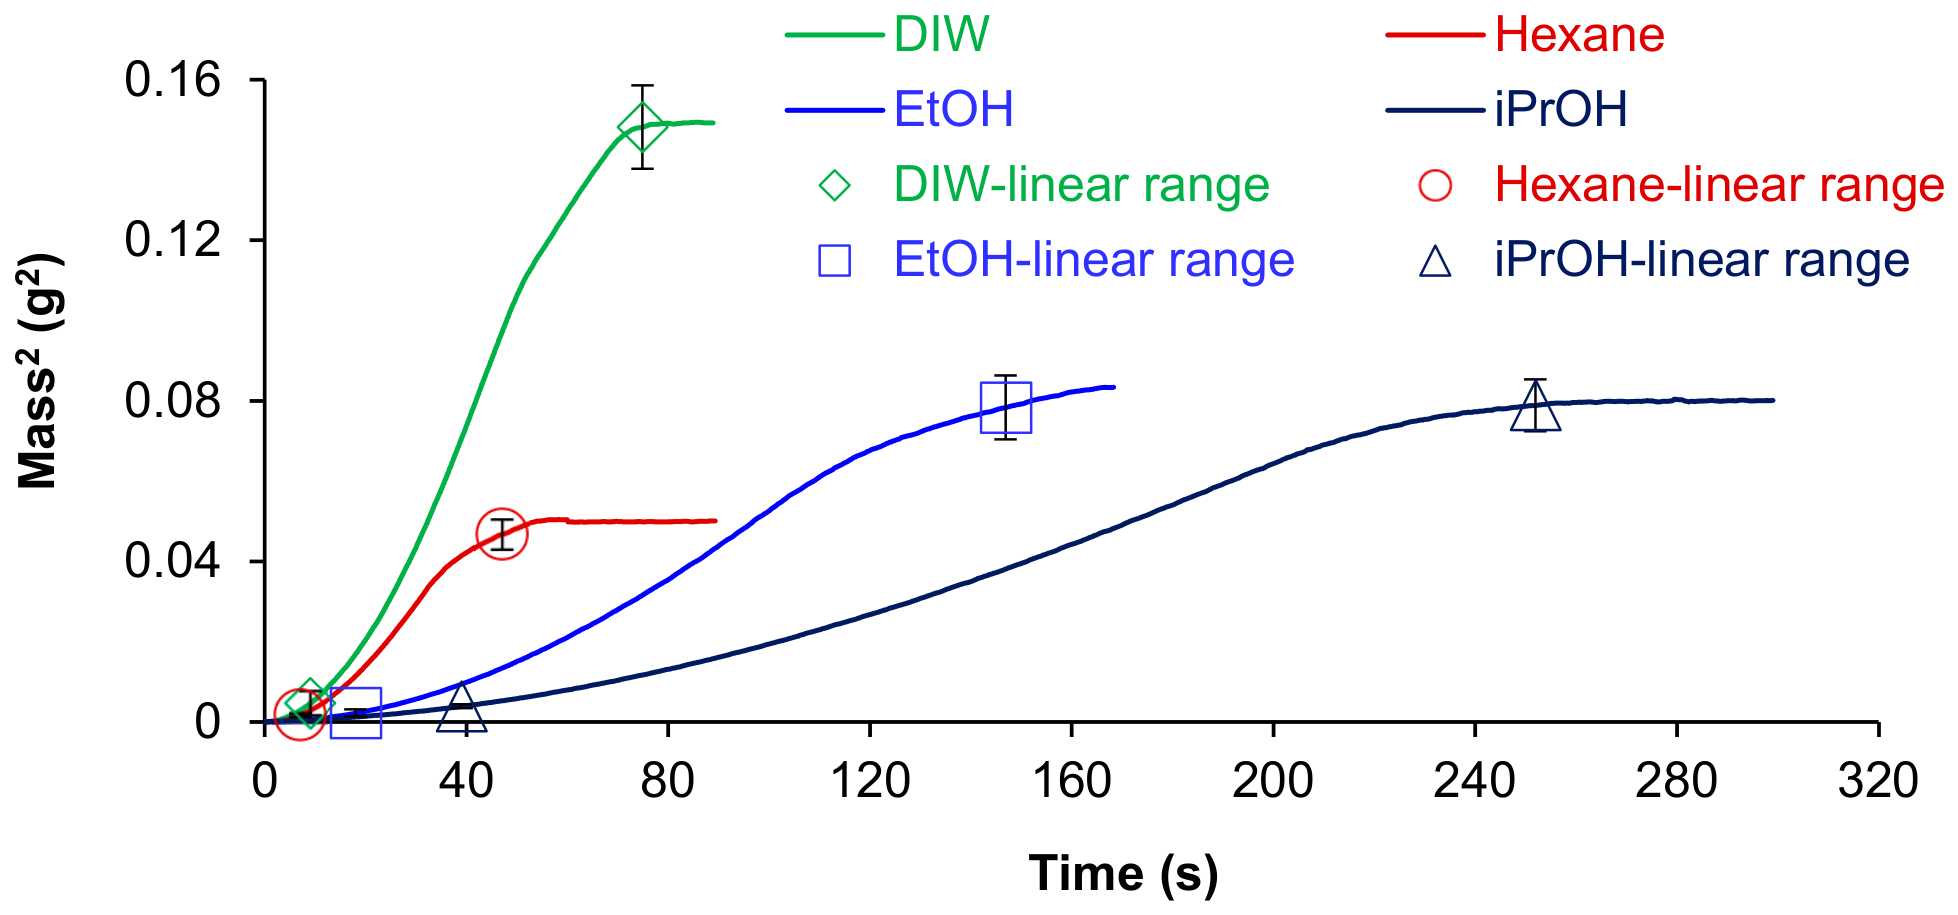
Different extraction time intervals of the mass2 uptake kinetics led to different calculated c and θ values. The shorter the integration time interval, the higher is the coefficient of determination (R2). This procedure, however, may possess uncertainty. A demonstration is shown in Figure 1. The time interval for the DIW series between 31 and 50 s has a slope of 3.2 × 10⁻³ g2/s (R2 of 0.9996), whereas the 52–69 s interval has a slope of 1.9 × 10⁻³ g2/s (R2 of 0.9995), the cos θ of which is ~40% lower than that for 31–50 s. Similarly, if EtOH was used as the completely wetting solvent, the 52–69 s integration range would give a 39% higher θ value than the 31–50 s time interval. Therefore, for consistency, the m2/t was determined from the slope of the extended linear m2 vs. t range that occurs immediately before the curve plateau, which produced high R2 values. Hence, the integration interval between 9 and 75 s in Figure 1 with a slope of 2.5 × 10⁻³ g2/s for the DIW series was chosen for the θ determination.
Figure 1.
Measured squared mass (mass2) uptake rates of different fluids for Accusand. A linear calculation range is set between the symbols.
3. Results and Discussion
3.1. Choice of Completely Wetting Solvent for WCR Method
When the θ in Eq 1 is assigned zero, the material constant c is equal to η/(ρ2 γL) × m2/t. For the same solid and penetrating fluid, the function (ρ2 γL)/η is proportional to the slope of the fluid uptake m2/t. MeOH had the second-highest sensitivity based on the (ρ2 γL)/η (Table 2). However, the use of MeOH was not viable due to its high evaporation potential. Because iPrOH had the smallest m2/t, it was not considered as sensitive as the remaining two solvents and thus eliminated from consideration. The selection between hexane and EtOH as the wetting solvent is investigated in the following section.
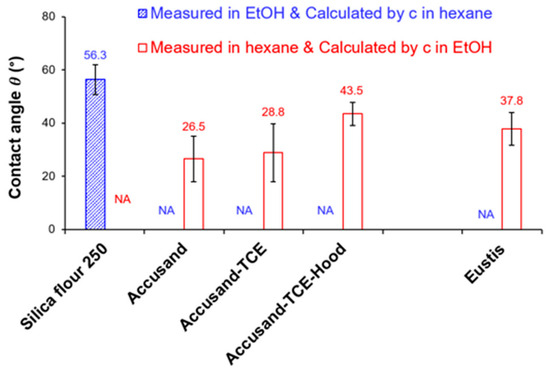
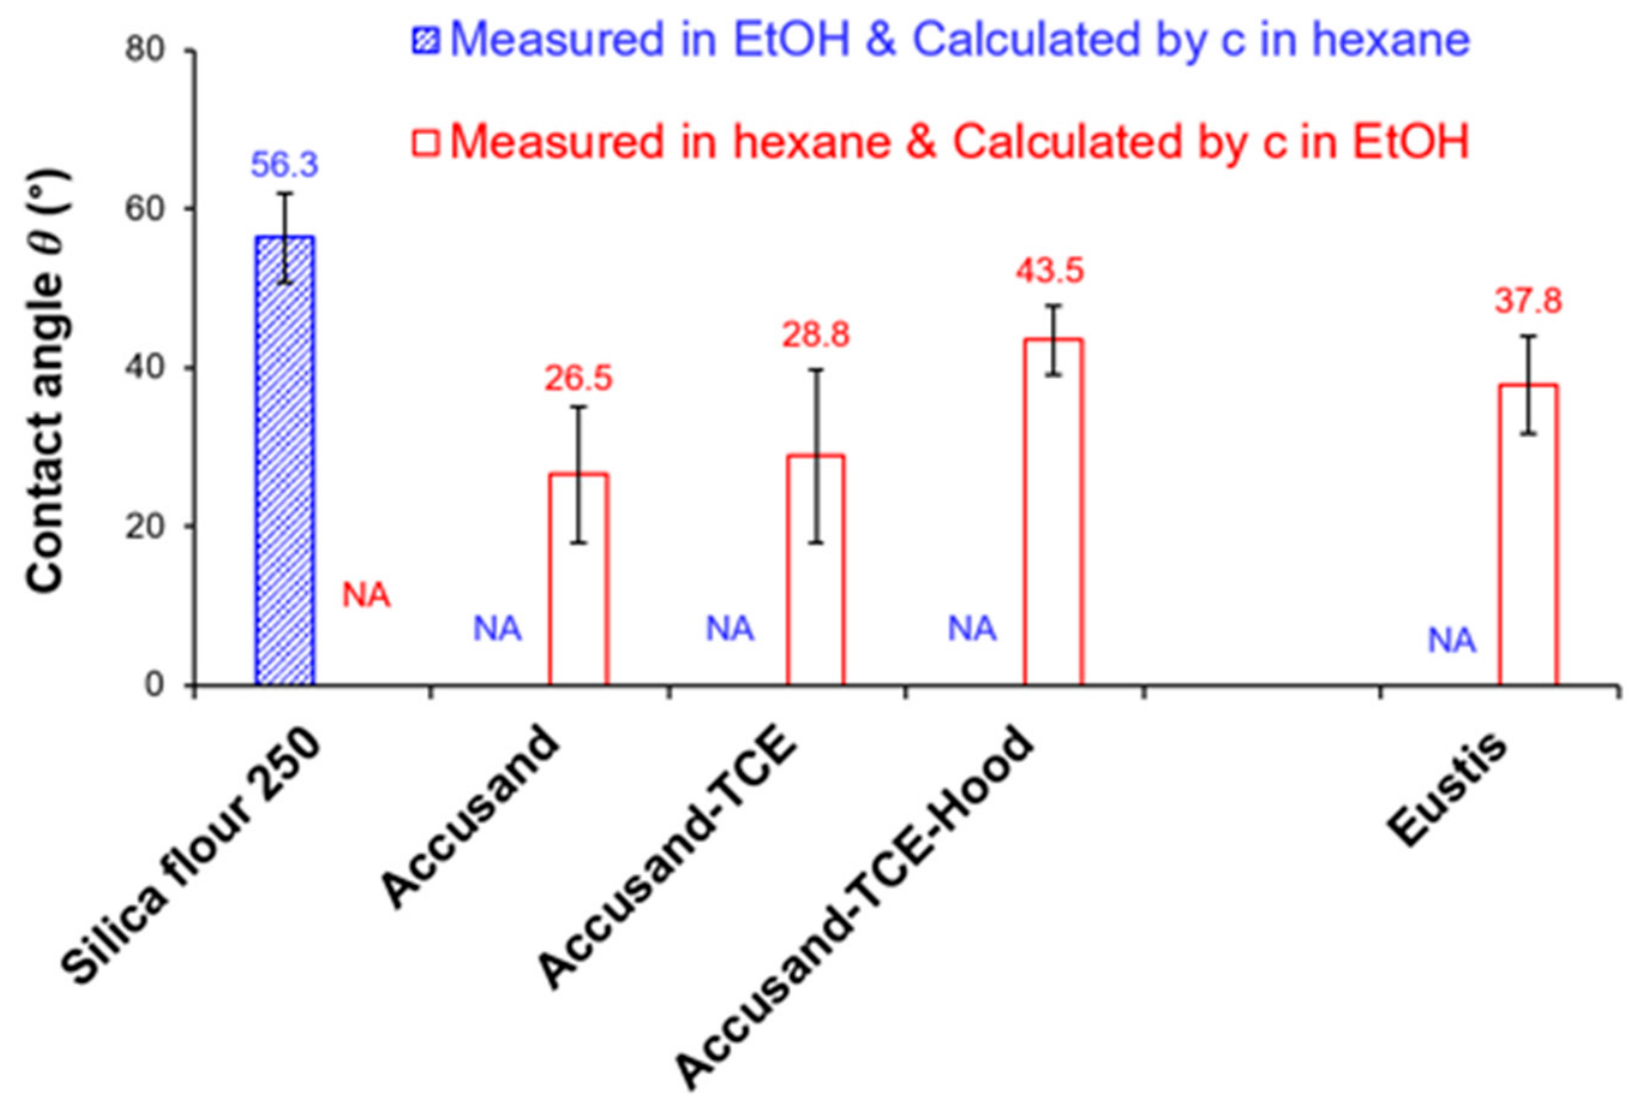
Two sets of tests were conducted to determine the material constant and contact angle. For the first set, mass uptake was measured for hexane as the wetting solvent to determine the material constant, with the assumption that hexane has a contact angle of zero. The mass uptake of ethanol was then measured to calculate the θ for that solvent, using the c value obtained from the hexane measurement. The m2/t measured for EtOH for Accusand was 7.86 (±0.58) × 10−4 g2/s (mean value ± standard deviation), and the hexane-measured c was 5.90 (±0.44) × 10−2 mm5. The subsequently calculated cos θ in EtOH was >1, meaning that the theoretical θ was lower in EtOH than in hexane (i.e., the calculated θ was lower than zero, shown as NA in Figure 2, which is physically incorrect).
Figure 2.
Contact angle θ in EtOH and hexane, calculated by the material constant that was determined in hexane and EtOH, respectively. NA means that the calculated cos θ was > 1, i.e., θ in the measuring solvent was lower than in the solvent for which θ was assumed as zero.
A second set of tests was conducted by reversing the use of the two solvents. For this case, the m2/t measured for hexane for Accusand was 1.51 (±0.11) × 10−3 g2/s and the c determined with EtOH was 6.65 (±0.49) × 10−2 mm5, assuming θ is zero for ethanol. The calculated θ for hexane was 26.5 ± 8.6°, confirming that the theoretical θ was lower for EtOH than hexane for Accusand. In contrast, when Silica flour 250 was used, the calculated θ was 56.3 ± 5.6° for EtOH using hexane as the completely wetting solvent, and cosθ was >1 for hexane using EtOH as the completely wetting solvent. The higher θ for EtOH than hexane indicates that the assumption of θ = 0 for hexane was more valid for Silica flour 250, which was attributed to its distinctive hydrophobicity, as explained below in Section 3.2. Similar tests were also conducted for the soil.
Based on the preceding results, all media appear to be more completely wetted by EtOH than hexane except for Silica flour 250. Therefore, EtOH was chosen as the complete wetting solvent for the WCR measurements (i.e., θ of zero assumed in EtOH). EtOH was used as the wetting fluid to measure the material constants for the various media used in the subsequent experiments to calculate θ in aqueous solutions.
3.2. Contact Angle Measurement in Different Aqueous Solutions
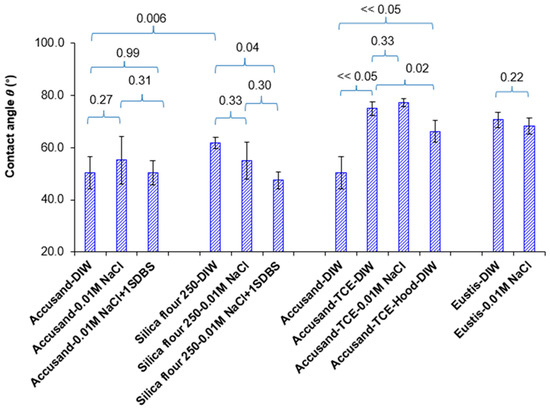
Contact angles for a solid surface are typically represented as the soil–air–water contact angle, i.e., dry-packed solid to uptake aqueous solution. Diverse parameters, such as particle size (e.g., [25,26]), soil composition (e.g., [27,28,29]), and the properties of the penetrating aqueous solution (e.g., [30]), can impact the measurement. As shown in Figure S1 in Supplementary Materials, the DIW uptake rate was lower for the smaller size silica flour 250 (45 µm) at 2.36 (±0.16) × 10−3 g2/t than Accusand (350 µm) at 3.05 (±0.39) × 10−3 g2/t, leading to a higher calculated θ of 74.8 (±1.1)° for silica flour 250 than 50.4 (±6.1)° for Accusand (p << 0.05, two-tailed t-test in Excel, Figure 3). Trends in the m2/t of different fluids were the same for Accusand and Eustis following DIW > hexane > EtOH, while the order of m2/t for silica flour 250 was hexane > DIW > EtOH (Figure S1). While the silica flour was used as received without the EtOH pretreatment, the results are consistent with prior work (e.g., [31,32]) and support the hydrophobic nature of the silica flour as compared to the other tested solids.
Figure 3.
Contact angle θ in DIW for different materials as calculated using the material constant c determined in EtOH, and the θ for Silica flour 250 calculated using the c determined in hexane. p-values noted in brackets above the bars were obtained by two-tailed t-test in Excel. Contact angles for Accusand, Accusand-TCE, and Accusand-TCE-Hood measured in DIW have a p << 0.05 by ANOVA single factor test in Excel. The error bars represent the standard deviation. The “+1SDBS” represents addition of 1 mg/L SDBS.
The impact of soil composition was tested by comparing the contact angles of the different solids. The θ measured for Eustis soil was significantly higher than for the Accusand (Figure 3). This is attributed to its greater organic-carbon and clay-mineral contents (Table 1), both of which can increase soil θ (e.g., [27,28,29]).
The impact of the penetrating aqueous solution properties was assessed by the presence of electrolyte (i.e., DIW vs. 0.01 M NaCl) and the co-existing hydrocarbon surfactant SDBS. The surface tensions of DIW and 0.01 M NaCl solution were comparable. Constant surface tension was thus assumed in Eq 1. The p values of 0.27, 0.32, 0.33, and 0.22, respectively, for Accusand, Silica flour 250, Accusand-TCE, and Eustis, suggested an insignificant difference between the θ measured in DIW and 0.01 M NaCl (Figure 3). The presence of 1 mg/L SDBS in 0.01 M NaCl had no measurable influence on the θ for Accusand (p = 0.31) or Silica flour 250 (p = 0.31). Based on the preceding results, it is concluded that the influence of low concentrations of constituents (i.e., 0.01 M NaCl or 1 mg/L SDBS) in the penetrating solution was minimal for the studied sand and soil samples.
3.3. Influence of TCE Exposure on Contact Angle Measurement for Accusand
Three Accusand samples, i.e., Accusand, Accusand-TCE, and Accusand-TCE-Hood, were evaluated for the influence of chemical exposure. As shown in Figure S2, the material constant c using EtOH as the completely wetting solvent was 6.65 (±0.49) × 10−2, 6.85 (±0.27) × 10−2, and 6.94 (±0.19) × 10−2 mm5, respectively, for Accusand, Accusand-TCE, and Accusand-TCE-Hood (p = 0.58, ANOVA single factor test in Excel), suggesting an insignificant influence of long-term TCE exposure on c determination. Therefore, it was assumed that c remains unchanged. The determined θ for DIW were significantly different for the treated media, with magnitudes following the order Accusand < Accusand-TCE-Hood < Accusand-TCE (Figure 3, with p << 0.05 by ANOVA single factor test in Excel). These results indicate that the prior contact with TCE led to a decrease in the surface wettability of Accusand.
3.4. Influence of PFAS and Hydrocarbon Surfactant Exposure
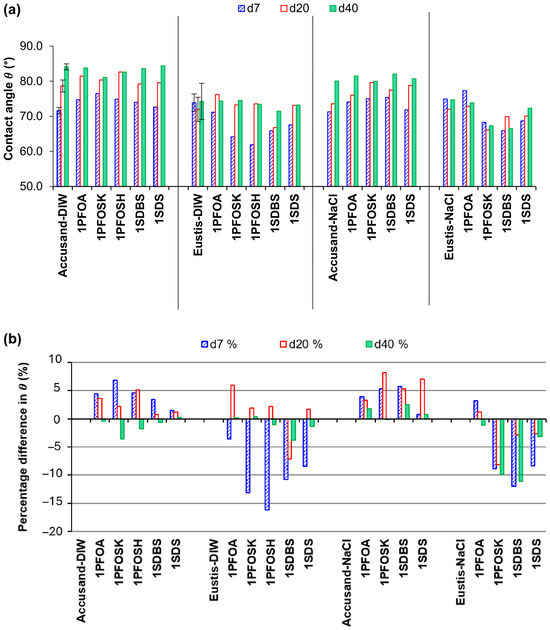
Contact angles measured for Accusand and Eustis soil before and after exposure to PFAS or hydrocarbon surfactants are shown in Figure 4a. The samples were not dried in the oven prior to measurement to prevent potential property variations from the oven drying process. Also, because the surface water content may be influenced by the air humidity, as discussed in detail in Text S2 and Figures S3–S5 in Supplementary Materials, the percentage difference in θ was calculated against the respective control (e.g., sample with the addition of 5 mL 1 mg/L PFOA-Na in 0.01 M NaCl vs. that of 5 mL 0.01 M NaCl). The results are shown in Figure 4b.
Figure 4.
Influence of media exposure to PFAS or hydrocarbon surfactant on contact angle measurement. (a) Contact angles for Accusand and Eustis with or without exposure. (b) Percentage difference in the contact angle measurement in the presence and absence of a surfactant (% = (θpresence − θabsence)/θabsence × 100). The “absence” means DIW or NaCl spiked samples. Negative value means the determined contact angle was lower than that in the control. The “d7, d20 and d40” represent measurements conducted after drying in fume hood for 7, 20, and 40 days, respectively. Measurement was conducted in 0.01 M NaCl. Mass of solids was 10 g, the initial solution volume was 5 mL, and the number “1” in the X-axis represents a 1 mg/L concentration of the constituent, corresponding to 5 µg/g exposure.
Some deviations among the d7, d20, and d40 treatments are observed for both media for the DIW system. Specifically, the d40 results differ from the d7 and d20 results for Accusand, and the d20 results differ from the d7 and d40 results for Eustis. Greater consistency is observed for the measurements conducted with the 0.01 NaCl solution. This may be related to greater adsorption of the surfactants in the presence of electrolyte.
Overall, the results indicate that soil exposure to PFAS or anionic hydrocarbon surfactants increased the θ of Accusand by 4.5–6.8% at an exposure of 0.5 µg/g in 7 days. In contrast to the results presented for Accusand, the measurements demonstrate that exposure of the soil to PFAS or the anionic hydrocarbon surfactants reduced θ by 3.6–16.1% for Eustis soil in 7 days (Figure 4). The contrasting impacts of surfactant exposure on contact angles for Accusand versus Eustis, increased versus decreased θ, is significant, with a p << 0.05 based on ANOVA single factor test in Excel.
The difference observed between the two media may be related to the predominant mechanisms mediating surfactant adsorption for the two media and the specific disposition of surfactant molecules at the solid surface. Accusand has minimal organic carbon, whereas Eustis soil has a greater organic-carbon content that provides increased potential for PFAS adsorption, as demonstrated by the larger Kd values reported in Table 1. It is noted that the greatest changes in θ for both media are obtained with PFOS and SDBS, both of which have greater magnitudes of adsorption by these media compared to PFOA and SDS. In addition to adsorption magnitudes, the adsorption mechanisms may differ between the two media, with potential differences in the position/orientation of the adsorbate molecules at the solid surface (e.g., [10,11,12]). The interaction of PFAS and hydrocarbon surfactants with soil surfaces can be complex, and additional measurements and experiments would be necessary to delineate operative mechanisms.
4. Conclusions
PFAS is present in soils at many sites and, therefore, adsorbed PFAS is likely to exist in these soils. However, experiment and modeling investigations of PFAS transport and fate have, to date, not considered the potential impact of PFAS exposure on soil surface properties. The Washburn capillary rise (WCR) technique was used to measure the contact angles of sands and soils, with and without PFAS exposure.
Exposure to PFAS impacted the contact angles for Accusand and Eustis soil. For example, contact angles increased by 4.5–6.8% for Accusand 40/50 and decreased by 3.6–16% for Eustis soil after 7 days. The changes were attributed to the modification of the surface caused by the adsorbed PFAS. This work provides an initial illustration that PFAS exposure can impact soil surface wettability. The results suggest that the potential impact of PFAS on the wettability of soils may need to be considered in characterizing and modeling transport and fate in soil. More studies are needed to fully understand the influence of PFAS exposure on θ, including testing soils with different physical and geochemical properties and testing a range of PFAS and their concentrations.
Supplementary Materials
The following supporting information can be downloaded at: https://www.mdpi.com/article/10.3390/w18131541/s1, Text S1: Water potential measurement by WP4C; Text S2: Influence of drying on contact angle measurement; Figure S1: Squared mass uptake rate of different fluids for different materials using the same column; Figure S2: Material constants of different materials by using EtOH as the completely wetting solvent; Figure S3: Influence of drying on contact angle measurement; Figure S4: Water potential and contact angle of differently treated Accusand samples; Figure S5: Air humidity obtained from “Tucson, AZ Weather History, Weather Underground”. References [33,34,35,36,37,38,39,40] are cited in Supplementary Materials.
Author Contributions
M.L.B. conceptualized the study and revised the first draft. X.H. conducted the experiments, data analyses, and wrote the first draft. Both authors contributed to the study design. All authors have read and agreed to the published version of the manuscript.
Funding
This research was supported by the Arizona Board of Regents TRIF Program.
Data Availability Statement
All processed data are provided in the tables and figures presented in the manuscript and Supplementary Materials.
Acknowledgments
We thank the reviewers for their constructive and helpful comments.
Conflicts of Interest
The authors declare no conflicts of interest.
References
- Glüge, J.; Scheringer, M.; Cousins, I.T.; DeWitt, J.C.; Goldenman, G.; Herzke, D.; Lohmann, R.; Ng, C.A.; Trier, X.; Wang, Z. An overview of the uses of per- and polyfluoroalkyl substances (PFAS). Environ. Sci. Process. Impacts 2020, 22, 2345–2373. [Google Scholar] [CrossRef] [Scilit] [PubMed]
- Gaines, L.G. Historical and current usage of per- and polyfluoroalkyl substances (PFAS): A literature review. Am. J. Ind. Med. 2023, 66, 353–378. [Google Scholar] [PubMed]
- Sunderland, E.M.; Hu, X.C.; Dassuncao, C.; Tokranov, A.K.; Wagner, C.C.; Allen, J.G. A review of the pathways of human exposure to poly- and perfluoroalkyl substances (PFASs) and present understanding of health effects. J. Expo. Sci. Environ. Epidemiol. 2019, 29, 131–147. [Google Scholar] [PubMed]
- Fenton, S.E.; Ducatman, A.; Boobis, A.; DeWitt, J.C.; Lau, C.; Ng, C.; Smith, J.S.; Roberts, S.M. Per- and polyfluoroalkyl substance toxicity and human health review: Current state of knowledge and strategies for informing future research. Environ. Toxicol. Chem. 2021, 40, 606–630. [Google Scholar] [PubMed]
- Brusseau, M.L.; Anderson, R.H.; Guo, B. PFAS concentrations in soils: Background levels versus contaminated sites. Sci. Total Environ. 2020, 740, 140017. [Google Scholar] [CrossRef] [Scilit] [PubMed]
- Evich, M.G.; Davis, M.J.; McCord, J.P.; Acrey, B.; Awkerman, J.A.; Knappe, D.R.; Lindstrom, A.B.; Speth, T.F.; Tebes-Stevens, C.; Strynar, M.J. Per- and polyfluoroalkyl substances in the environment. Science 2022, 375, eabg9065. [Google Scholar] [CrossRef] [Scilit] [PubMed]
- Johnson, G.R.; Brusseau, M.L.; Carroll, K.C.; Tick, G.R.; Duncan, C.M. Global distributions, source-type dependencies, and environmentally-relevant concentrations of per- and polyfluoroalkyl substances in groundwater. Sci. Total Environ. 2022, 841, 156602. [Google Scholar] [CrossRef] [Scilit] [PubMed]
- Du, Z.; Deng, S.; Bei, Y.; Huang, Q.; Wang, B.; Huang, J.; Yu, G. Adsorption behavior and mechanism of perfluorinated compounds on various adsorbents—A review. J. Hazard. Mater. 2014, 274, 443. [Google Scholar] [CrossRef] [Scilit] [PubMed]
- Brusseau, M.L. Assessing the potential contributions of additional retention processes to PFAS retardation in the subsurface. Sci. Total Environ. 2018, 613–614, 176–185. [Google Scholar] [CrossRef] [Scilit] [PubMed]
- Alves, A.V.; Tsianou, M.; Alexandridis, P. Fluorinated surfactant adsorption on mineral surfaces: Implications for pfas fate and transport in the environment. Surfaces 2020, 3, 516–566. [Google Scholar] [CrossRef] [Scilit]
- Brusseau, M.L. Field versus laboratory measurements of PFAS sorption by soils and sediments. J. Hazard. Mater. Adv. 2024, 16, 100508. [Google Scholar] [CrossRef] [Scilit]
- Ghaznavi, S.M.; Choudhary, M.; Hannan, M.; Hettiarachchi, G.M.; Apul, O.G. A critical review of per-and polyfluoroalkyl substances adsorption by soil. J. Hazard. Mater. Org. 2025, 1, 100001. [Google Scholar]
- Letey, J. Measurement of contact angle, water drop penetration time, and critical surface tension. In Proceedings of the Symposium on Water-Repellent Soils; University of California: Riverside, CA, USA, 1969; pp. 43–47. [Google Scholar]
- Ding, F.; Gao, M. Pore wettability for enhanced oil recovery, contaminant adsorption and oil/water separation: A review. Adv. Colloid Inter. Sci. 2021, 289, 102377. [Google Scholar] [CrossRef] [Scilit]
- Brahana, P.J.; Patel, R.; Bharti, B. Surface science view of perfluoroalkyl acids (PFAAs) in the environment. ACS Environ. Au 2024, 4, 173–185. [Google Scholar] [CrossRef] [Scilit] [PubMed]
- Wang, Y.; Khan, N.; Huang, D.; Carroll, K.C.; Brusseau, M.L. Transport of PFOS in aquifer sediment: Transport behavior and a distributed-sorption model. Sci. Total Environ. 2021, 779, 146444. [Google Scholar] [CrossRef] [Scilit] [PubMed]
- Van Glubt, S.; Brusseau, M.L.; Yan, N.; Huang, D.; Khan, N.; Carroll, K.C. Column versus batch methods for measuring PFOS and PFOA sorption to geomedia. Environ. Pollut. 2021, 268, 115917. [Google Scholar] [CrossRef] [Scilit] [PubMed]
- Parsons, J.D.; Bush, J.W.; Syvitski, J.P. Hyperpycnal plume formation from riverine outflows with small sediment concentrations. Sedimentology 2001, 48, 465–478. [Google Scholar] [CrossRef] [Scilit]
- Brusseau, M.L.; Khan, N.; Wang, Y.; Yan, N.; Van Glubt, S.; Carroll, K.C. Nonideal transport and extended elution tailing of PFOS in soil. Environ. Sci. Technol. 2019, 53, 10654–10664. [Google Scholar] [CrossRef] [Scilit] [PubMed]
- Alghunaim, A.; Kirdponpattara, S.; Newby, B.-m.Z. Techniques for determining contact angle and wettability of powders. Powder Technol. 2016, 287, 201–215. [Google Scholar] [CrossRef] [Scilit]
- Letey, J.; Carrillo, M.; Pang, X. Approaches to characterize the degree of water repellency. J. Hydrol. 2000, 231, 61–65. [Google Scholar] [CrossRef] [Scilit]
- Kirdponpattara, S.; Phisalaphong, M.; Newby, B.-m.Z. Applicability of Washburn capillary rise for determining contact angles of powders/porous materials. J. Colloid Interface Sci. 2013, 397, 169–176. [Google Scholar] [CrossRef] [Scilit] [PubMed]
- Lazghab, M.; Saleh, K.; Pezron, I.; Guigon, P.; Komunjer, L. Wettability assessment of finely divided solids. Powder Technol. 2005, 157, 79–91. [Google Scholar] [CrossRef] [Scilit]
- Nowak, E.; Robbins, P.; Combes, G.; Stitt, E.H.; Pacek, A.W. Measurements of contact angle between fine, non-porous particles with varying hydrophobicity and water and non-polar liquids of different viscosities. Powder Technol. 2013, 250, 21–32. [Google Scholar]
- Goebel, M.-O.; Bachmann, J.; Woche, S.K.; Fischer, W.R.; Horton, R. Water potential and aggregate size effects on contact angle and surface energy. Soil Sci. Soc. Am. J. 2004, 68, 383–393. [Google Scholar] [CrossRef] [Scilit]
- Dang-Vu, T.; Hupka, J. Characterization of porous materials by capillary rise method. Physicochem. Probl. Miner. Process. 2005, 39, 47–65. [Google Scholar]
- Chenu, C.; Le Bissonnais, Y.; Arrouays, D. Organic matter influence on clay wettability and soil aggregate stability. Soil Sci. Soc. Am. J. 2000, 64, 1479–1486. [Google Scholar] [CrossRef] [Scilit]
- Ellerbrock, R.; Gerke, H.; Bachmann, J.; Goebel, M.-O. Composition of organic matter fractions for explaining wettability of three forest soils. Soil Sci. Soc. Am. J. 2005, 69, 57–66. [Google Scholar] [CrossRef] [Scilit]
- Matthews, G.; Watts, C.; Powlson, D.; Price, J.; Whalley, W. Wetting of agricultural soil measured by a simplified capillary rise technique. Eur. J. Soil Sci. 2008, 59, 817–823. [Google Scholar] [CrossRef] [Scilit]
- Chaudhuri, R.G.; Paria, S. Dynamic contact angles on PTFE surface by aqueous surfactant solution in the absence and presence of electrolytes. J. Colloid Interface Sci. 2009, 337, 555–562. [Google Scholar] [CrossRef] [Scilit] [PubMed]
- Bachmann, J.; Horton, R.; Van Der Ploeg, R.; Woche, S. Modified sessile drop method for assessing initial soil-water contact angle of sandy soil. Soil Sci. Soc. Am. J. 2000, 64, 564–567. [Google Scholar] [CrossRef] [Scilit]
- Kirchberg, S.; Abdin, Y.; Ziegmann, G. Influence of particle shape and size on the wetting behavior of soft magnetic micropowders. Powder Technol. 2011, 207, 311–317. [Google Scholar] [CrossRef] [Scilit]
- Ewing, G.E. Thin film water. J. Phys. Chem. B 2004, 108, 15953–15961. [Google Scholar] [CrossRef] [Scilit]
- Hassanizadeh, S.M.; Gray, W.G. Thermodynamic basis of capillary pressure in porous media. Water Resour. Res. 1993, 29, 3389–3405. [Google Scholar] [CrossRef] [Scilit]
- Klitzke, S.; Lang, F. Hydrophobicity of soil colloids and heavy metal mobilization: Effects of drying. J. Environ. Qual. 2007, 36, 1187–1193. [Google Scholar] [CrossRef] [Scilit] [PubMed]
- Li, X.; Zhang, T.; Jiang, S.; Sun, K.; Zhang, J. Unsaturation triggers specific adsorption performance of water films in the clay nanopores. Colloids Surf. A Physicochem. Eng. Asp. 2024, 694, 134186. [Google Scholar] [CrossRef] [Scilit]
- Michel, J.C.; Riviere, L.M.; Bellon-Fontaine, M.N. Measurement of the wettability of organic materials in relation to water content by the capillary rise method. Eur. J. Soil Sci. 2001, 52, 459–467. [Google Scholar] [CrossRef] [Scilit]
- Papendick, R.; Campbell, G. Water Potential Relations in Soil Microbiology; Parr Chairman, J.F., Gardner, W.R., Elliott, L.F., Eds.; Soil Science Society of America: Madison, WI, USA, 1981; pp. 1–22. [Google Scholar]
- Rawls, W.; Pachepsky, Y.A.; Ritchie, J.; Sobecki, T.; Bloodworth, H. Effect of soil organic carbon on soil water retention. Geoderma 2003, 116, 61–76. [Google Scholar] [CrossRef] [Scilit]
- Wuddivira, M.N.; Robinson, D.A.; Lebron, I.; Bréchet, L.; Atwell, M.; De Caires, S.; Oatham, M.; Jones, S.B.; Abdu, H.; Verma, A.K. Estimation of soil clay content from hygroscopic water content measurements. Soil Sci. Soc. Am. J. 2012, 76, 1529–1535. [Google Scholar] [CrossRef] [Scilit]

Disclaimer/Publisher’s Note: The statements, opinions and data contained in all publications are solely those of the individual author(s) and contributor(s) and not of MDPI and/or the editor(s). MDPI and/or the editor(s) disclaim responsibility for any injury to people or property resulting from any ideas, methods, instructions or products referred to in the content. |
© 2026 by the authors. Licensee MDPI, Basel, Switzerland. This article is an open access article distributed under the terms and conditions of the Creative Commons Attribution (CC BY) license.