


Abstract
Flooding is one of the most common and destructive natural disasters worldwide, and projections indicate that its intensity will increase across various climate regions during this century. South Sudan is particularly vulnerable due to a combination of factors, including hydrological releases from Lake Victoria, local rainfall patterns, and wetland retention dynamics. These factors raise important questions regarding the hydrological connectivity between Lake Victoria and the Nile system. This study examined how upstream hydrological conditions impact flood dynamics in South Sudan’s flood-prone regions, specifically in the states of Jonglei and Unity along the River Nile. To statistically estimate flood propagation lag time from Lake Victoria to the Sudd wetland, we used Cyclone Global Navigation Satellite System (CYGNSS) remote sensing data and water-level altimetry from both Lake Victoria and the River Nile at Mangalla. The analytical methods included moving block bootstrap (MBB) cross-correlation and Gaussian process (GP) modeling. Furthermore, we validated the event-based propagation and inundation patterns using flood event reports from the Displacement Tracking Matrix (DTM). The findings indicate that the statistical propagation signals took approximately 106 days during the wet season (95% confidence interval [CI]: 60–150 days) and 134 days during the dry season (95% CI: 75–195 days) for the downstream water level response to reach the River Nile at Mangalla, and 3–4 weeks to reach the adjacent floodplains downstream. Residual stationarity diagnostics showed augmented Dickey–Fuller (ADF) statistics below −7 across the analyzed propagation pathways, indicating statistically stationary lag-adjusted residual behavior. Consistent temporal correspondence between inferred flood arrival windows and independently reported DTM flood-impact periods provides cautious support for the hydrological plausibility of the estimated propagation structure.
1. Introduction
Floods are among the most frequent and devastating natural disasters globally [1], primarily caused by heavy rainfall, river overflow, storm surges, and rising sea levels. Projections indicate that extreme precipitation and flood severity will increase across most climate regions [2], with a predicted rise of approximately 9% to 50% in global flooding throughout this century [3]. This suggests that many basins will experience either more frequent or more extensive flood events, marking a statistically significant increase in flood frequency [4]. Notably, the total number of flood events recorded from 2000 to 2019 surpassed that of the previous two decades, more than doubling the figures documented between 1980 and 1999 [5,6,7].
In watersheds characterized by large lakes, such as Lake Victoria, in their upper reaches, the processes of flood inundation become increasingly complex due to the lakes’ substantial storage capacity. This capacity effectively buffers incoming precipitation and runoff, delays peak outflows, and attenuates flood waves before they migrate downstream [8]. These mechanisms have been particularly influential in causing frequent inundation across the Sudd wetland region in South Sudan, leading to alterations in the wetland’s morphology [9]. Notably, flooding in the wetland does not primarily occur in response to local rainfall events; rather, it is when increased discharge from Lake Victoria flows through the Nile system. Sustained inflows from these upstream lakes maintain unusually high water levels in the Sudd for multiple consecutive months, resulting in persistent floodplain expansion, ecological changes, and lasting socio-economic effects [10].
Instead of responding directly to rainfall events, downstream flood behavior is influenced by cumulative hydrological releases and internal wetland retention processes, rendering conventional rainfall-based early-warning systems inadequate when used in isolation. These dynamics underline the necessity for research that not only investigates rainfall variability but also explores hydrological propagation throughout the basin and the conditions under which stored upstream flows lead to extreme inundation downstream.
The long-term fluctuations in the water levels of Lake Victoria have been extensively documented and are well recognized for their influence on downstream discharge and flood dynamics within the Sudd wetland along the River Nile system. For example, remote-sensing data, reanalysis products, and observed outflows have been combined to demonstrate the sensitivity of lake levels to both climatic variability and human-controlled releases [11]. An annual water balance model has been developed that successfully reproduces observed lake levels and outflows, including the extreme 1997–1998 high-water event, highlighting the model’s ability to capture interannual variability [12]. The influence of Lake Victoria on Upper Nile flows has been investigated using a conceptual routing model representing interconnected lakes and wetlands, confirming that downstream discharge responds strongly to changes in lake storage and release patterns [13]. Historical lake-level fluctuations (1956–1978) have been reconstructed using precipitation estimates together with measured inflows and discharges, achieving strong agreement with observed levels [14]. Collectively, these studies demonstrate that Lake Victoria’s water balance and level fluctuations are strongly controlled by precipitation inputs and regulated outflows, and that these variations significantly influence downstream Nile hydrology.
Conversely, recent studies have increasingly focused on the hydrodynamics of the Sudd wetland and its role within the Nile system. For example, long- and short-term total annual water storage anomalies have been analyzed using high-resolution downscaled and reconstructed datasets to assess climate change impacts on Sudd dynamics [15]. The flood pulse has been characterized through multi-temporal, multi-sensor remote sensing, identifying spatial and seasonal inundation patterns, evaporation dynamics, and a suggested 3–4-month lag following inflows at Juba station and catchment-scale runoff contributions [16]. A long-term wetland extent time series has been developed for the Sudd floodplain, with a rapid expansion rate (1.19 × 10⁴ km2 yr−1) detected during the period 2019–2022, linked to upstream precipitation anomalies [17]. Transmission losses across successive Sudd reaches were quantified, and the hydrological response to increased flows associated with rising Lake Victoria levels was examined, with the results showing that higher upstream inflows expanded both permanent and seasonal inundation areas [18].
While previous studies have greatly improved our understanding of Lake Victoria’s water balance and the Sudd wetland’s storage dynamics, floodplain expansion, and climate sensitivity, they have not quantitatively assessed the basin-scale hydrological lag between Lake Victoria and the Sudd, nor have they systematically analyzed temporal flood propagation through the wetland system. This knowledge gap limits process-based understanding of how upstream lake-level variability translates into downstream flooding. This study aims to address this gap by: (i) estimating the basin-scale signal propagation lag between Lake Victoria and the Sudd wetland, (ii) characterizing the seasonal dynamics of lagged flood signal transmission within the wetland system, and (iii) quantifying the relationship between variability in upstream lake levels and inundation of the downstream floodplain. Ultimately, the study provides statistical evidence of a quantitative connection between upstream hydrological influences and downstream floodplain responses.
The analysis utilized high-resolution, satellite-derived measurements of lake water levels alongside altimetry-based river stage data collected at Mangalla. It incorporated a comprehensive flood inundation time series from the Cyclone Global Navigation Satellite System (CYGNSS) v.3.2 product and rainfall observations from Climate Hazards Group InfraRed Precipitation with Station (CHIRPS) across Panyijiar, Guit, Ayod, and Fangak counties within the Sudd Wetland region. The findings will enhance hydrological forecasting and flood risk management throughout the Nile Basin by providing a science-based framework that aids decision-making by the Ministry of Water Resources and Irrigation, as well as county and payam authorities in the Sudd region.
2. Materials and Methods
2.1. Study Area
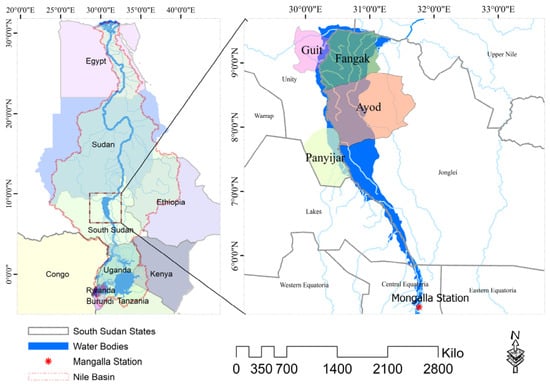
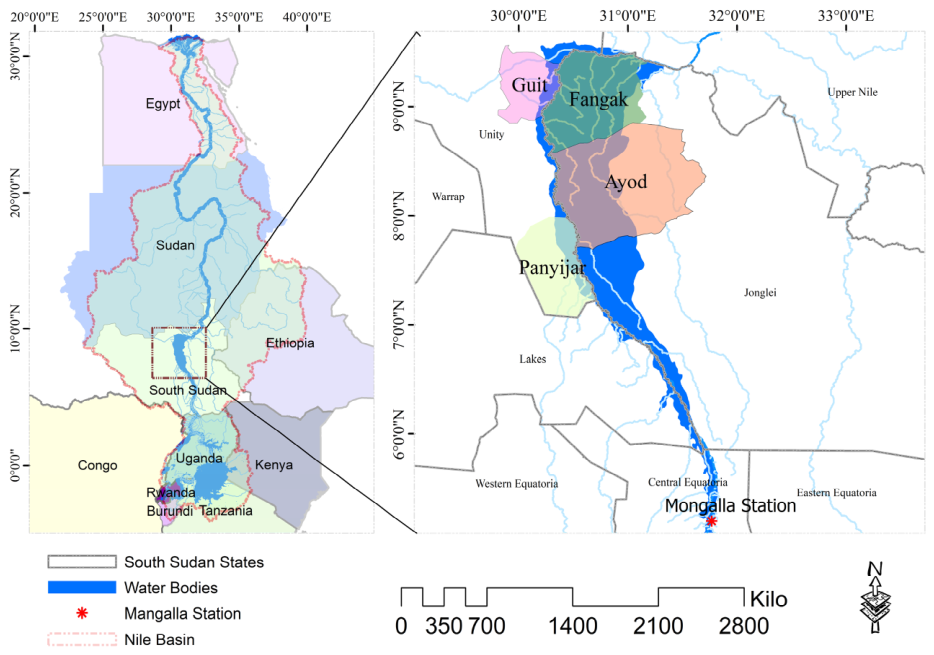
Situated in East Africa, South Sudan is a landlocked nation that became the 54th independent country on the continent and the 193rd member of the United Nations (UN) [19]. The country’s geography is predominantly shaped by the Nile River, which flows through its central plains from south to north, significantly influencing the surrounding landscapes and ecosystems. One of its most important hydrological features is the Sudd Wetland (Figure 1).
Figure 1.
Location Map of the Study Area, Sudd Wetland and the Nile Basin.
The Sudd is one of the world’s largest freshwater wetlands, playing a critical role in regulating water flows, evaporation rates, and seasonal inundation patterns across a vast expanse of central South Sudan, particularly in the states of Jonglei and Unity. This study focused on four flood-prone counties located within this region: Fangak and Ayod in Jonglei State, and Panyijiar and Guit in Unity State. Each of these counties is shaped by the hydrological influence of the Sudd. Fangak county spans approximately 7617 km2 and has a population of 110,130 people, while Ayod county extends over roughly 13,469 km2 and is home to 139,283 people. In Unity State, Guit County occupies nearly 3438 km2, supporting a population nearing 33,004 people, whereas Panyijiar county covers about 5370 km2 and was home to roughly 50,723 people in 2008, according to the last national census conducted by the National Bureau of Statistics. It is important to note that county-level data in South Sudan are often unreliable; many more recent figures are estimates from UN or NGO sources. Population numbers have also been affected by displacement and food security issues since then. Therefore, reliance on 2008 population data represents a limitation, as it may not accurately capture current demographic conditions.
These counties are located within the River Nile/Sudd floodplain system and adjacent seasonal wetlands, where the landscape is dominated by floodwater and river channels. Seasonal flooding and extensive wetlands greatly influence land use and accessibility. The primary livelihoods in the area are agro-pastoralism combined with flood-recession agriculture and fishing, all of which are impacted by seasonal floods. Cattle hold significant cultural and economic importance. Furthermore, access to markets and services is limited and frequently disrupted due to floods and conflict [20].
2.2. Materials
2.2.1. Rainfall
The rainfall data for the Lake Victoria watershed and the Sudd wetland were sourced from the CHIRPS dataset, which covers a quasi-global area from 50° S to 50° N. This dataset has been available since 1981 and continues to the present day. The CHIRPS dataset provides high-quality daily rainfall climatological data derived from satellite imagery, with a resolution of 0.25°. Its robustness in the East Africa region has been validated through comparisons with rain gauge measurements from approximately 1200 stations, evaluated across daily, decadal, and monthly time scales [21].
2.2.2. Altimetry Data: Lake Victoria and River Nile Water Levels
Altimeter satellite data, acquired through spaceborne radar and laser altimeters, offer continuous and spatially comprehensive measurements of inland water surface elevations [22]. In this study, we extensively utilized altimeter satellite data acquired from 2018 to 2025 from Theia Hydroweb Operational Altimetry River Water Level. The dataset is a global compilation of water level time series derived from satellite altimetry at designated “virtual stations”. Hydroweb virtual stations are established at the intersections of satellite altimetry ground tracks and river centerlines. Water-level estimates for each overpass are derived from quality-controlled observations within the station footprint, with the median value reported as the water level and the standard deviation used as an uncertainty measure. Each virtual station offers geolocation data, a continuous temporal series of water surface height estimates relative to a reference ellipsoid/geoid, and associated uncertainty measurements [23]. Among the available Hydroweb virtual stations, KM4916 was selected for this study and used as a downstream indicator for assessing the propagation of hydrological signals from Lake Victoria. Most operational stations are updated within approximately 3 days after new altimeter data becomes available. The inland water level time series data have been aggregated from various radar altimetry missions, including historical missions such as the Topography Experiment (TOPEX)/Poseidon, Jason-1/2, Envisat, Satellite with ARgos and ALtiKa (SARAL), and Geosat Follow-On (GFO), with the latest updates primarily sourced from Jason-3 and Sentinel-3A/3B, covering both rivers and lakes [24]. The water level of Lake Victoria was sourced from the Global Reservoirs and Lakes Monitor (G-REALM), provided by the U.S. Department of Agriculture (USDA) (https://ipad.fas.usda.gov/cropexplorer/global_reservoir/, accessed on 1 January 2026). G-REALM is a satellite altimetry-based system that offers time-series water level data for several of the world’s largest lakes and reservoirs. It primarily uses radar altimetry from the TOPEX/Poseidon and Jason series (T/P, Jason-1, Jason-2, Jason-3, Sentinel-6), which operate on a 10-day repeat cycle. Additional coverage is provided by missions such as Envisat and Sentinel-3.
ArcGIS dataset characterizes both the spatial and temporal variability of water levels in Lake Victoria and the River Nile, providing crucial insights into the propagation of water-level signals from upstream lake storage to downstream floodplain inundation. Furthermore, they facilitate the monitoring of flood wave transmission, prolonged high-water periods, and drought events, which influence the timing, magnitude, and duration of inundation across the Sudd floodplain.
2.2.3. Water Surface Area (CYGNSS Watermask)
The CYGNSS Level 3 UC Berkeley Watermask v3.2 (https://cygnss.engin.umich.edu/) is a daily 0.01° binary inland water product derived from CYGNSS L1 SDR v3.2, accessed on 1 January 2026. It employs a random-walk algorithm over 30-day observation windows to create daily maps. In the Watermask dataset, each pixel is classified as either water surface (pixel value = 1), non-water surface (pixel value = 0), or nodata (ocean surface). In this study, the total water surface area within each county was calculated by extracting water surface pixels within each county polygon and summing the area of each pixel.
The area of each pixel (the pixel size in the latitude and longitude directions) was calculated based on the latitude of the pixel center using the GRS80 Model (https://komoriss.com/calculate-distance-on-earth/, accessed on 2 February 2026). It should be noted that in the Watermask data, both permanent water and flooded water are represented by a pixel value = 1, and the water surface area shown here includes both. The data is provided as daily netCDF-4 files, with about 6 days of latency, from September 2018 onward, based on the eight-satellite CYGNSS constellation (35° inclination, frequent tropical revisits). This watermask supports flood detection and validation by offering high-temporal-resolution surface water time series that can be used to map inundation dynamics and cross-check other satellite or model-based flood products.
2.2.4. Mangalla Water Level
Mangalla Station was established in 1905 to monitor the water level of the River Nile. However, the current dataset of water level observations spans from only 2007 to the present day due to interruptions caused by civil war and political instability that have affected the station’s operations. Water level data were obtained from the Ministry of Water Resources and Irrigation; however, some data gaps were present.
2.3. Detection of Hydrological Lag and Flood Propagation
Satellite-derived records of Lake Victoria’s water levels, alongside altimetry-based measurements of the Nile River at KM4916 near Mangalla, were utilized to investigate the hydrological dynamics. The analysis employed moving block bootstrap (MBB) cross-correlation, a robust nonparametric method introduced by [25]. This technique facilitates random resampling of the original dataset, generating replicate datasets that allow estimation of key statistical distributions, such as means, variances, and correlations. By resampling contiguous blocks of data over 1000 iterations, the method mitigates the risk of overfitting in non-stationary time series, while also preserving the integrity of the statistical properties, resulting in refined estimates of lag times and their corresponding 95% confidence intervals (CI). The MBB was adapted in this study to divide a dependent time series of length into overlapping blocks, each of fixed length . The first block contained observations from to , the second block included observations from 2 to , and so forth. In total, blocks were resampled with replacement from this collection, which were then concatenated in the order of selection to create a bootstrap replicate of the original series [26]. The lag-time estimates derived from the MBB approach were based on several statistical assumptions related to stationarity and temporal dependence. Specifically, weak stationarity was assumed, i.e., a constant mean and variance with an autocovariance function depending solely on lag, not on absolute time, allowing overlapping blocks extracted from different record segments to be compared. Additionally, it presumed short-range dependence, typically defined through mixed conditions, indicating that autocorrelation diminished with increasing lag and was adequately captured within blocks of finite length [27].
The altimeter observations taken at 10-day intervals were converted into daily data using linear interpolation. This process created a continuous, gap-free dataset of lake water levels, river water levels, and inundation areas (CYGNSS watermask) used for the analysis. The cross-correlations were computed over season-specific lag windows of 60–150 days (wet) and 50–195 days (dry), with the peak lag defined as the lag corresponding to the maximum correlation within each window. The moving block bootstrap (MBB) technique was applied, employing data-adaptive block lengths of 47 days (wet, n = 2170) and 33 days (dry, n = 1091). The reported lag represents the mean of the bootstrap peak lags, with uncertainty expressed as a 95th percentile confidence interval. No formal significance threshold was established for the correlation amplitudes; therefore, the bootstrap confidence interval on the lag position serves as the primary inferential constraint for assessing the reliability of the identified lag structure.
To derive a clearer, more dependable representation of the correlation structure, Gaussian Process (GP) correlogram smoothing was employed. This provides a flexible, non-parametric framework for modelling latent functions based on noisy observations, making it particularly well-suited for smoothing sparse correlograms in hydrological time series analysis. The GP was characterized by a mean function m(x) and a covariance function, or kernel, k(x, x′). In its simplest form, it was expressed as follows:
This indicated that any collection of points derived from the function f(x) adhered to a multivariate Gaussian distribution with mean m(x) and covariance k(x, x′). Kernel hyperparameters, such as the characteristic length scale and signal variance of the radial basis function (RBF), were used to maximize the log marginal likelihood through gradient-based optimization, employing Cholesky decomposition for improved numerical stability. The choice of kernel function has a profound impact on the behavior of the GP; hence, it measures the similarity or correlation between two points in the input space. The radial basis function (RBF) or Gaussian kernel was represented as follows:
where is the Euclidean distance between the two feature vectors and is the characteristic length scale, and is signal variance. In lag detection, GP regression treats correlation values as noisy observations of an underlying smooth function over lag, yielding denoised peak estimates with associated uncertainty that are robust to altimetry noise. The GP model assumes observations arise from a multivariate GP with covariance defined by the selected kernel. When a stationary kernel (such as the Matérn or squared exponential) is used, the process is inherently regarded as weakly stationary, with covariance reliant solely on temporal separation. Consequently, autocorrelation is explicitly parameterized through the kernel and does not necessarily have to decay rapidly unless mandated by its functional form [28]. Furthermore, the model typically presumes homoscedastic Gaussian noise unless it is modified to accommodate time-varying variance.
Furthermore, the study employed residual stationarity testing to evaluate whether the preprocessing framework and lag-adjustment procedure adequately reduced non-stationary behavior, including long-term trends and seasonal persistence, within the propagated hydrological signals. Residuals were defined as the difference between the downstream anomaly series and lag-shifted upstream anomaly signals following alignment at the estimated optimal propagation lag [29]. These tests included unit-root tests, autocorrelation diagnostics, variance stability checks, and structural break detection, all critical for validating hydrological models and the reliability of lag, correlation, routing, and forecasting analyses.
This ensemble approach quantifies uncertainty, compares linear and nonlinear methods, and assesses data quality. It aligns with established methodologies for flood lag analysis in climate-variable environments such as the Sudd Wetland, ensuring a thorough and rigorous investigation of the hydrological dynamics.
3. Results
3.1. Regression and Correlation Analysis
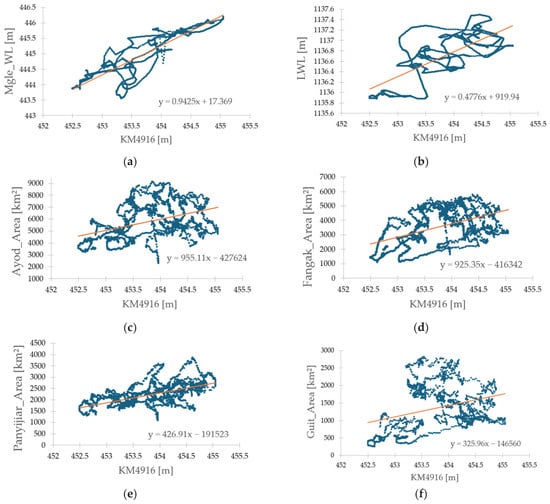
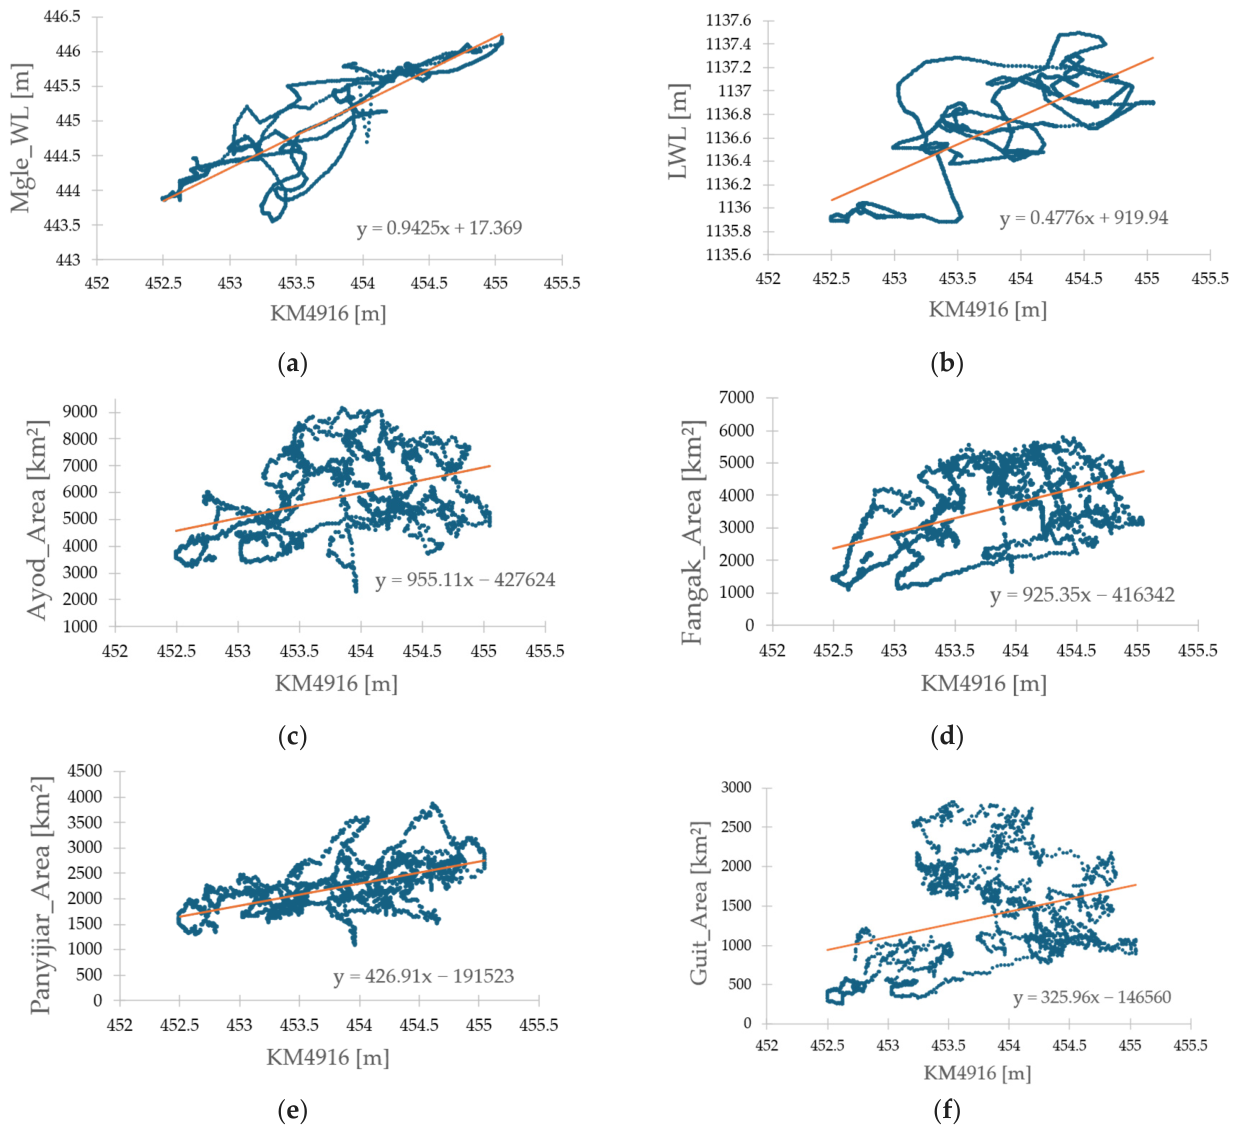
The observed Mangalla water levels and HydroWeb virtual stations KM4916 altimetry show strong agreement (Figure 2a), with and regression (, 2018–2024). Model performance is high, with bias of −0.000 m, RMSE of 0.31 m, and uncertainty of ±0.62 m. While Lake Victoria water levels significantly influence the KM4916 stage (Figure 2b), yielding , , and regression . The model shows bias +0.000 m, RMSE 0.43 m, and uncertainty ±0.86 m.
Figure 2.
Scatter plots of water level relationships: (a) KM4916 vs. Mangalla, (b) KM4916 vs. Lake Victoria, and (c–f) KM4916 vs. surface water area in Sudd sub-regions.
The relationships between KM4916 levels and Sudd inundation vary spatially (Figure 2c–f). Weak correlations are observed in Ayod () and Guit (), while Panyijiar () and Fangak () shows moderate coupling, indicating stronger hydraulic connectivity. Inundation uncertainty across all regions is ±120 km2.
3.2. Upstream Lag Detection: Lake Victoria to KM4916
Estimated hydrological lag times describe the downstream movement of disturbances in river discharge and stage that arises from variations in upstream inflow. Accurate statistical estimation of hydrological lag time is crucial for quantifying the estimated lag distribution under changing inflow conditions and for creating the inundation maps that are vital for flood-prone areas [30]. The seasonal analysis of flood propagation, which compared the LWL with the water level at KM4916, revealed statistically inferred lags of multiple months in the transfer of LWL variability to downstream River Nile stations. The seasonal windows were defined to reflect the primary hydrologic conditions that influence lagged signal propagation and storage response within the Lake Victoria–River Nile system. The wet season, spanning from April to November, coincides with sustained high lake storage, increased inflows, and extended downstream discharge following both long and short rainfall periods. In contrast, the dry season, occurring from December to March, is characterized by reduced storage and recession flow conditions.
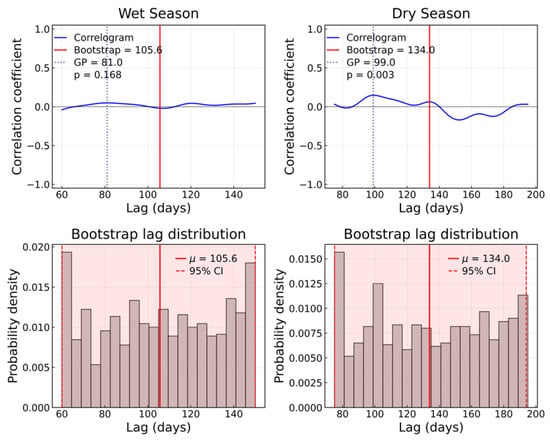
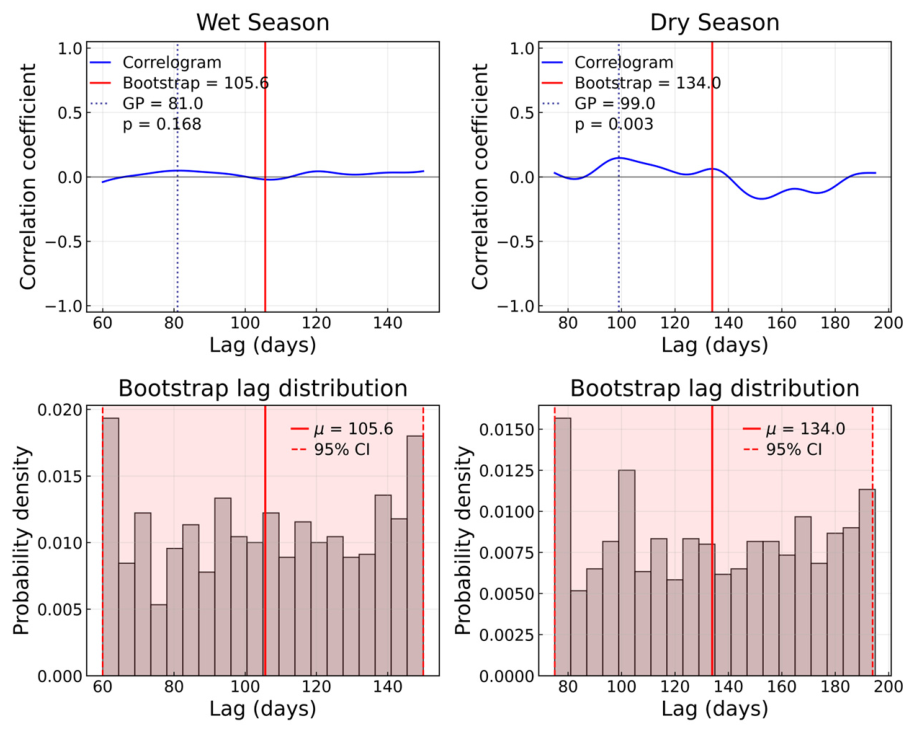
A bootstrap analysis of satellite altimetry data estimated the mean propagation lags from Lake Victoria to KM4916 as 106 days (95% CI: 60–150 days) during the wet season and 134 days (95% CI: 75–195 days) in the dry season (Figure 3).
Figure 3.
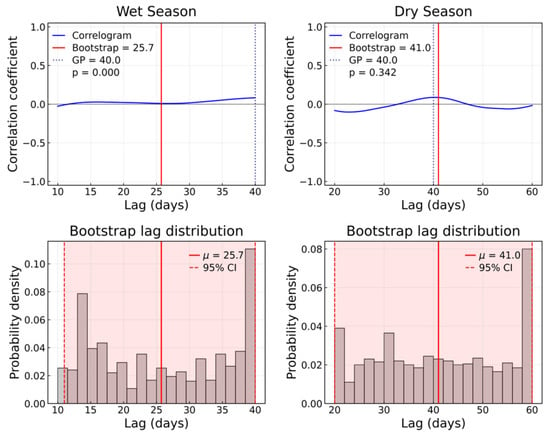
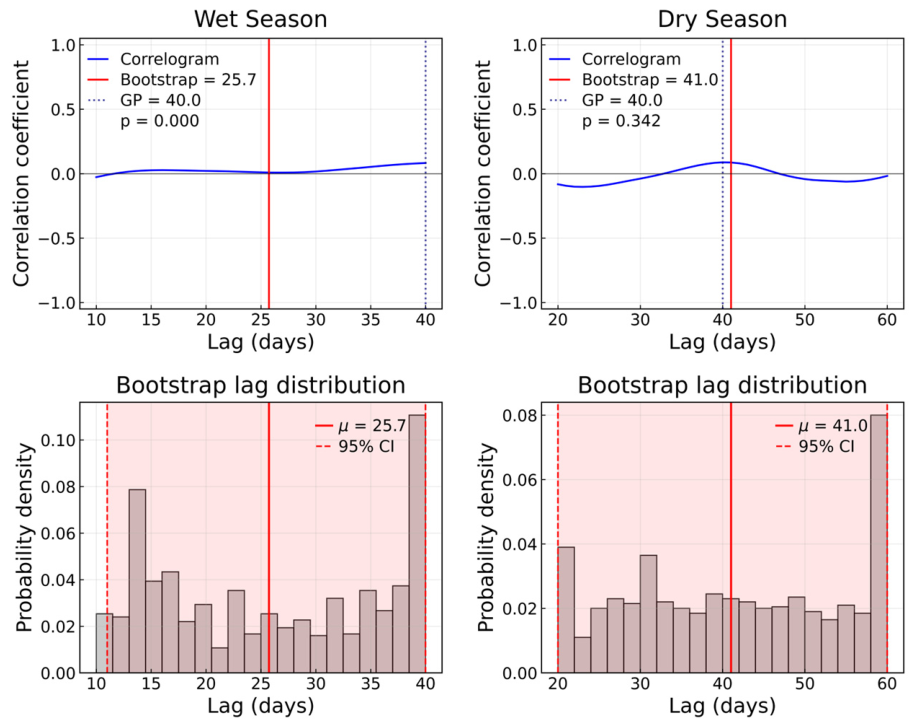
Seasonal lag estimation between hydrological signals at Lake Victoria and KM4916 derived using cross-correlation analysis. The top panels present correlograms with lag estimates (in days) from the MBB mean and GP, while the bottom panels show MBB lag distributions with the mean (μ) and 95% CI.
As illustrated in (Figure 3), there is a notable delay in the seasonal statistical propagation signals from Lake Victoria to KM4916 along the River Nile. Bootstrap cross-correlation analyses of the average delay between these two points reveal substantial variability in estimated lags, evidenced by very wide confidence intervals. During the dry season, the longer average delay and broader distribution of delays indicate increased hydraulic attenuation and temporary storage within the Sudd Wetlands. In contrast, the wet season experiences a shorter average estimated lag due to statistically shorter observed lag times, consistent with higher discharge levels that reduce hydraulic residence time.
Lag-adjusted residual diagnostics indicated stationary behaviour in the wet season, with an ADF statistic of −13.19 (p < 0.001), well below the 5% critical threshold of −2.90. For the dry season, the ADF statistic of −8.07 similarly fell below the critical threshold; however, the associated p-value (p = 0.520) did not reach conventional significance levels. Moreover, the Residual autocorrelation analysis revealed significant short-lag persistence that gradually declined with increasing lag, indicating remaining temporal dependence within the propagated lag signal. When employing GP smoothing, the lags were found to be shorter (81 days for the wet season; 99 days for the dry season), which was likely due to regularization effects that sharpened cross-correlation peaks. The consistent seasonal ordering across the two methods reinforced the physical validity of the delay.
3.3. Downstream Lag Propagation: KM4916 to Sudd Floodplain
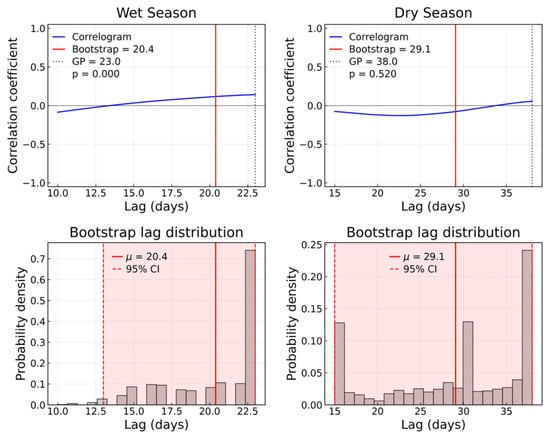
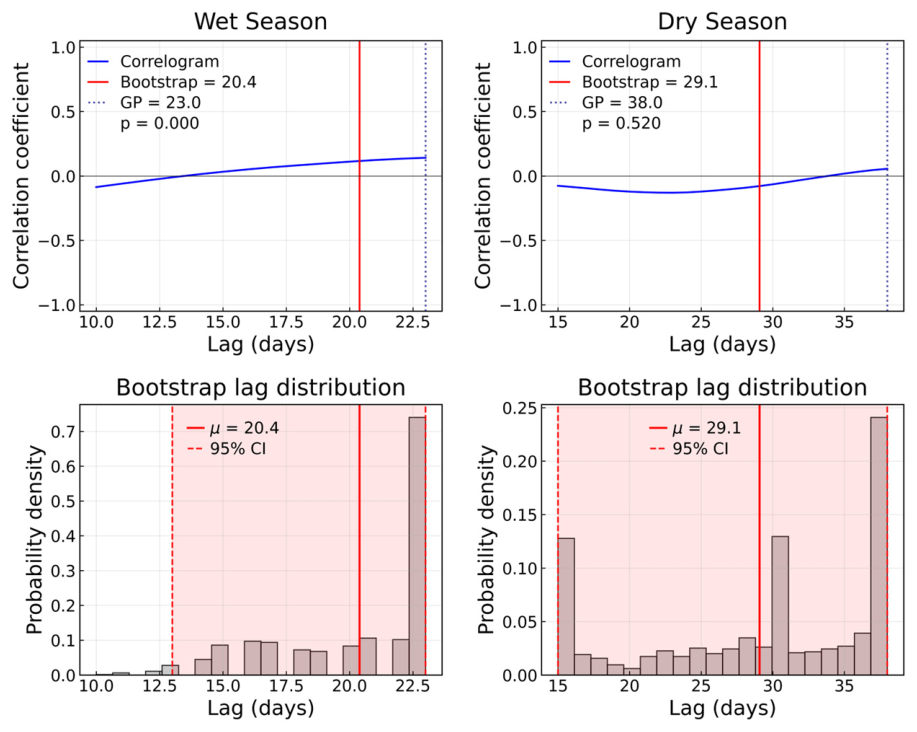
Flood propagation from KM4916 to downstream locations in the states of Jonglei and Unity demonstrated spatially coherent patterns with a presence of strongly negative ADF statistics (ADF < −7) across all sites, indicating rejection of the null hypothesis of non-stationarity and supporting the stationarity of lag-adjusted residuals. On the eastern bank, Ayod (Figure 4) experienced a quicker response than Fangak (Figure 5) in both seasons. The wet season lags at Ayod were approximately 20 days (95% CI: 13–23; GP: 23 days), extending to about 25 days at Fangak. During the dry season, the lags increased further, reaching 29 days at Ayod and 39 days at Fangak.
Figure 4.
Seasonal lag estimation between hydrological signals at KM4916 and the Ayod floodplain derived using cross-correlation analysis. The top panels present correlograms with lag estimates (in days) from the MBB mean and GP, while the bottom panels show MBB lag distributions with the mean (μ) and 95% CI.
Figure 5.
Seasonal lag estimation between hydrological signals at KM4916 and the Fangak floodplain derived using cross-correlation analysis. The top panels present correlograms with lag estimates (in days) from the MBB mean and GP, while the bottom panels show MBB lag distributions with the mean (μ) and 95% CI.
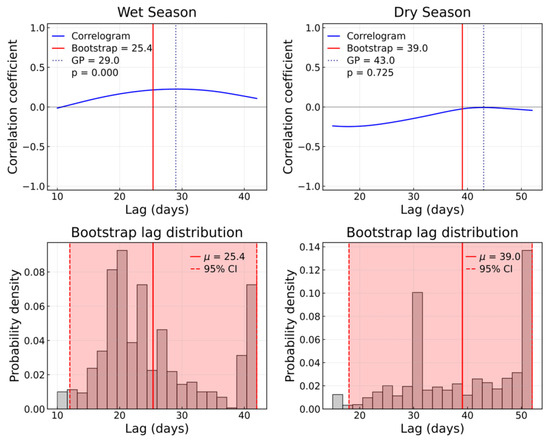
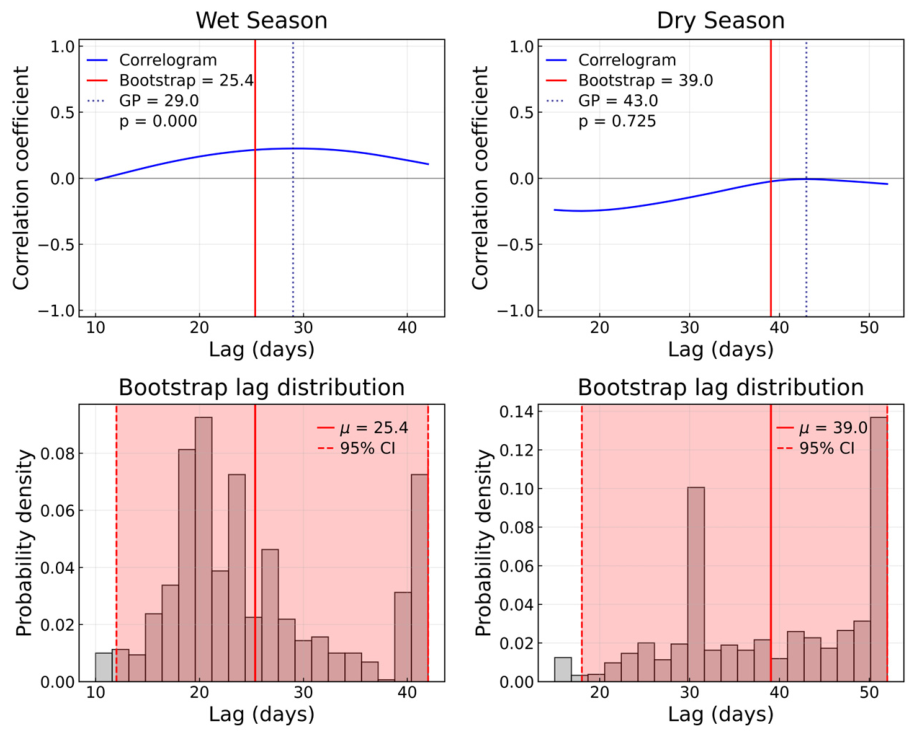
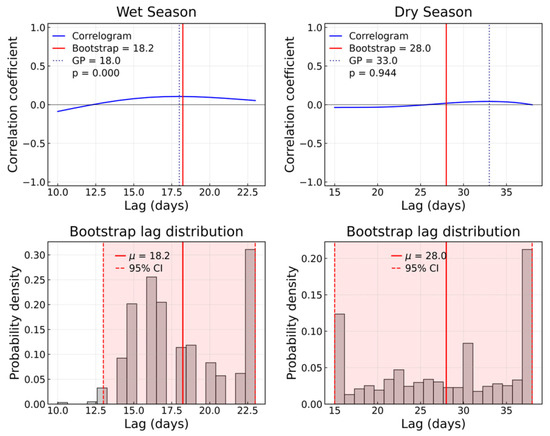
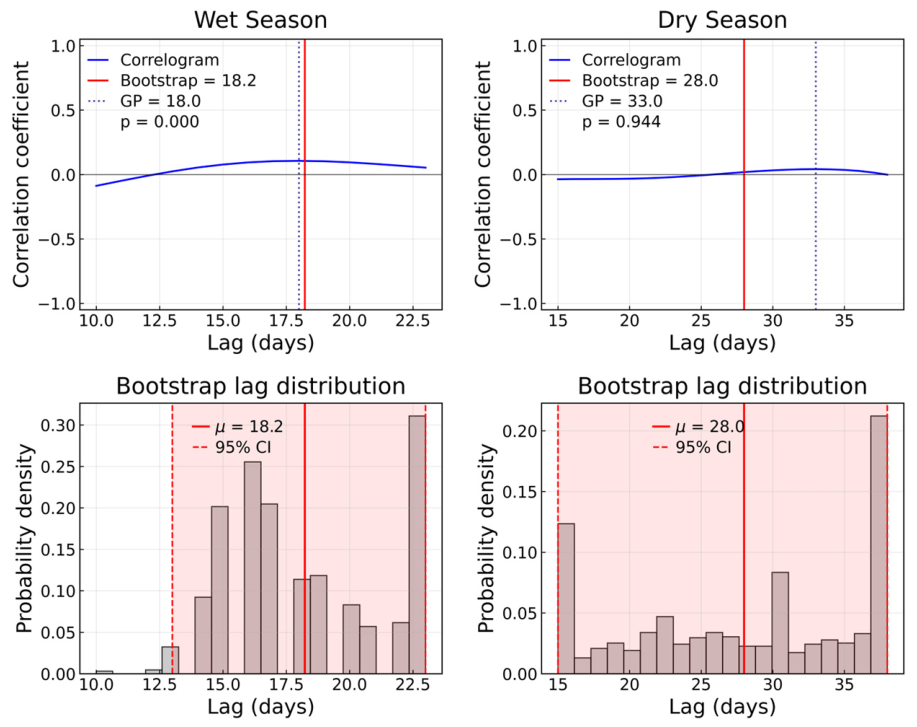
A similar gradient was observed on the western bank. Panyijiar (Figure 6) exhibited the shortest wet season lag, of around 18 days (95% CI: 13–25; GP: 18 days), while Guit (Figure 7) responded later, with lags of approximately 26 days. During the dry season, the lags increased further, reaching 28 days at Panyijiar and 41 days at Guit.
Figure 6.
Seasonal lag estimation between hydrological signals at KM4916 and the Panyijiar floodplain derived using cross-correlation analysis. The top panels present correlograms with lag estimates (in days) from the MBB mean and GP, while the bottom panels show MBB lag distributions with the mean (μ) and 95% CI.
Figure 7.
Seasonal lag estimation between hydrological signals at KM4916 and the Guit floodplain derived using cross-correlation analysis. The top panels present correlograms with lag estimates (in days) from the MBB mean and GP, while the bottom panels show MBB lag distributions with the mean (μ) and 95% CI.
Table 1 presents a summary of the lag correlation analysis between upstream and downstream flood signals across various counties during both wet and dry seasons. It includes the mean propagation lag, confidence intervals, correlation coefficients, and values for statistical significance, alongside the results of the stationarity test (ADF) and the number of observations. Overall, the findings indicate a temporal presence of a relationship in flood propagation between upstream and downstream locations, although the strength and statistical significance of the correlation vary across counties and seasons.
Table 1.
Summary of lag estimation statistics, uncertainty metrics, and data availability for each county and season.
3.4. Inundation Dynamics Across the Sudd Wetland
Figure 8, Figure 9, Figure 10, Figure 11, Figure 12 and Figure 13 present a comprehensive analysis of flood propagation signals and inundation responses in Fangak and Ayod in Jonglei, and Guit and Panyijiar in the Unity floodplain within the Sudd wetland during the 2024 floods. The analysis evaluated the differences in timing and flood magnitude in relation to upstream forcing from Lake Victoria and intermediate signal transfer through the River Nile at KM4916. The long rainy season in the Lake Victoria basin occurs from March to May, resulting in rising lake levels that extend into July [31]. Our analysis period was therefore from March to July.
Figure 8.
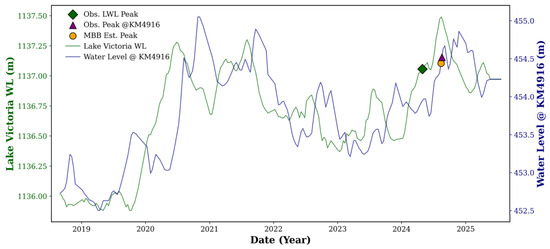
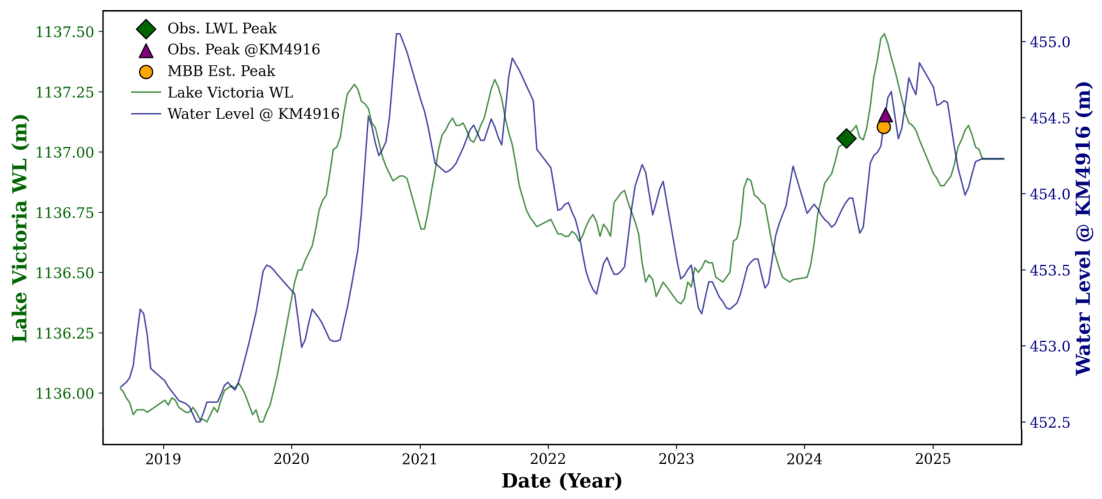
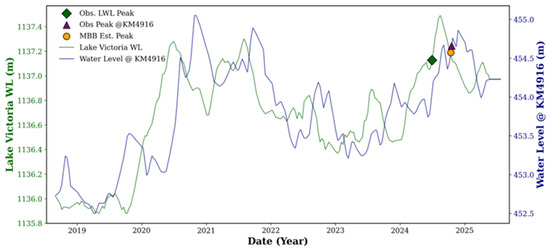
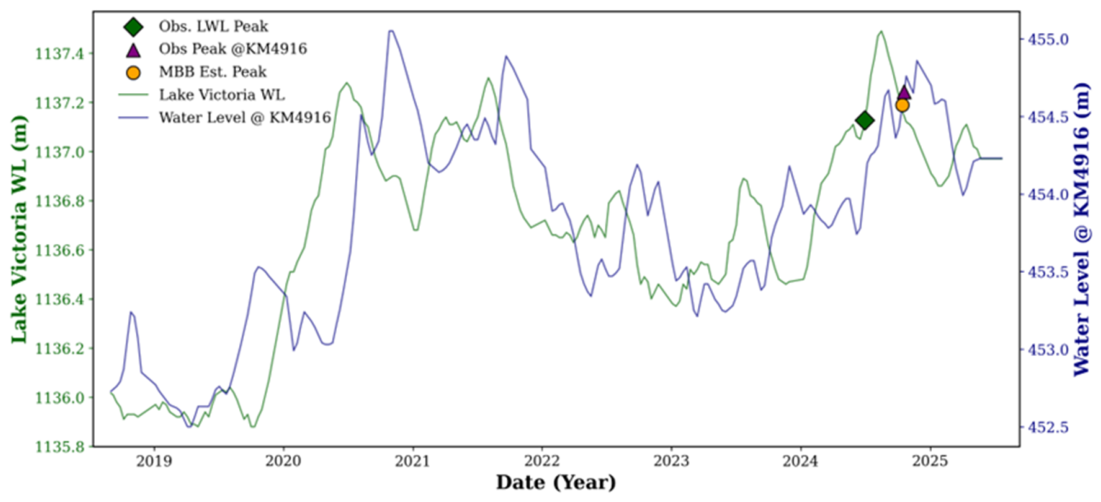
Statistical flood propagation signals from Lake Victoria to KM4916 during the water level rise in March–April. Peaks were observed, marked in green for Lake Victoria and pink for KM4916; the MBB-estimated peak at KM4916 is indicated by an orange symbol.
Figure 9.
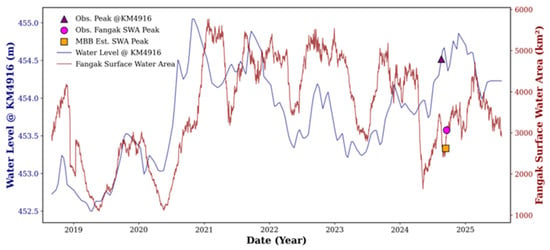
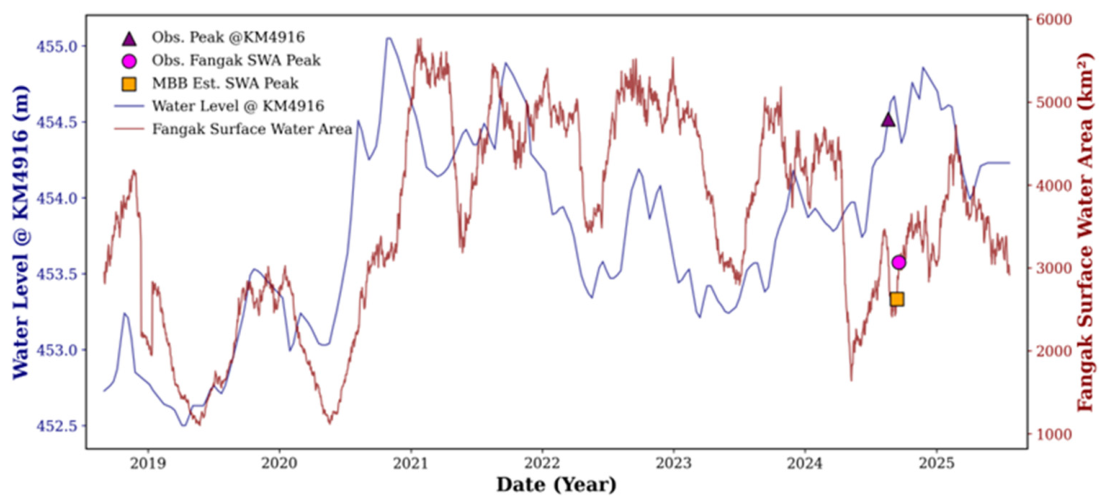
Statistical flood propagation signal from KM4916 to Fangak during the water level rise in March–April. Peaks were observed, marked in pink for KM4916 and red for Fangak surface water area; the MBB-estimated peak at KM4916 is indicated by an orange symbol.
Figure 10.
Statistical flood propagation signal from Lake Victoria to KM4916 during the water level rise in May–June. Peaks were observed, marked in green for Lake Victoria and pink for KM4916; the MBB-estimated peak at KM4916 is indicated by an orange symbol.
Figure 11.
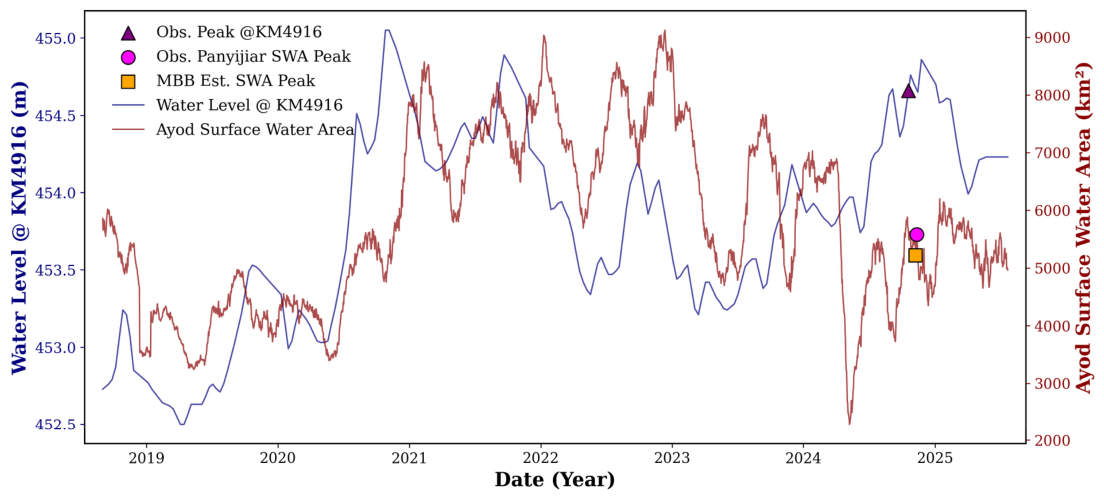
Statistical flood propagation signal from KM4916 to Ayod during the water level rise in March–April. Peaks were observed, marked in pink for KM4916 and red for Ayod surface water area; the MBB-estimated peak at KM4916 is indicated by an orange symbol.
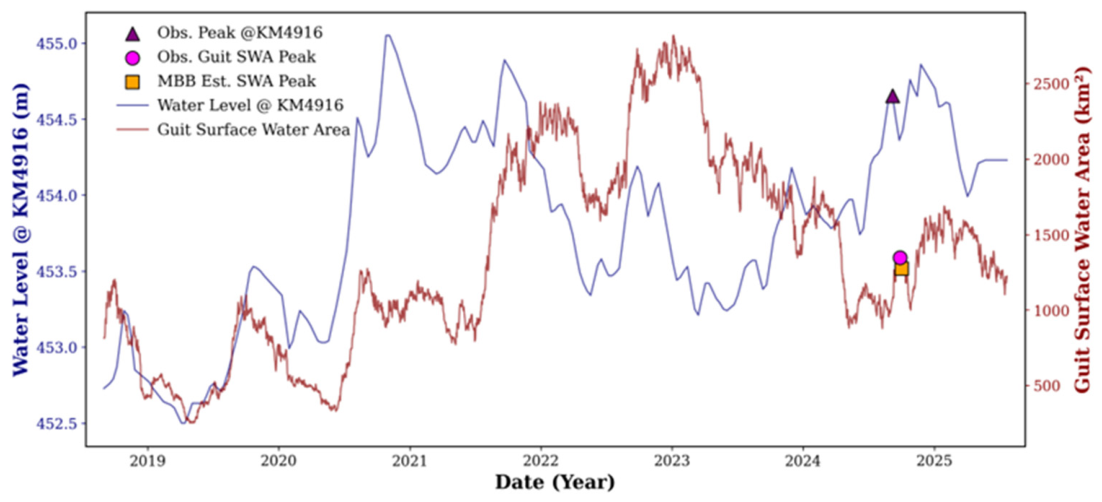
Figure 12.
Statistical flood propagation signal from KM4916 to Guit during the water level rise in May–June. Peaks were observed, marked in pink for KM4916 and red for Guit surface water area; the MBB-estimated peak at KM4916 is indicated by an orange symbol.
Figure 13.
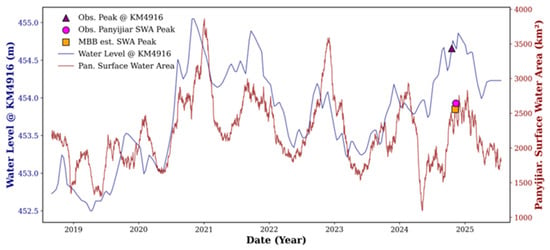
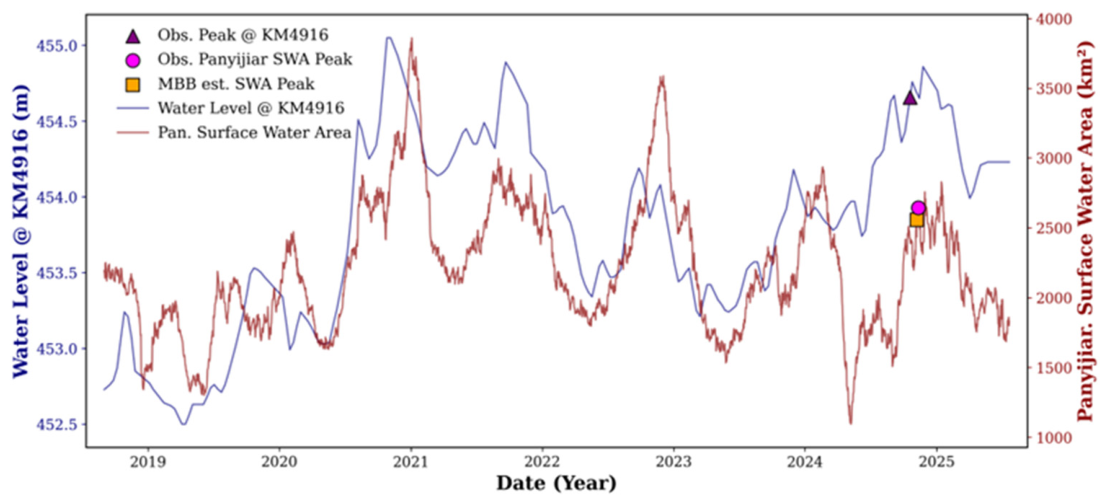
Statistical flood propagation signal from KM4916 to Panyijiar during the water level rise in May–June. Peaks were observed, marked in pink for KM4916 and red for Panyijiar surface water area; the MBB-estimated peak at KM4916 is indicated by an orange symbol.
In the March–April cycle, Lake Victoria reached a peak level of 1137.06 m on 30 April 2024. This was followed by a peak at KM4916 of 454.41 m on 19 August (≈111-day lag), closely aligned with the bootstrap estimate of 14 August (Figure 8).
Between the 106-day bootstrap estimate and the 111-day observed lag highlights the distinction between a statistically derived mean propagation time and the actual peak-to-peak timing recorded within a single hydrological year. The latter is affected by specific hydroclimatic events and routing conditions.
Subsequently, the estimated lag signal corresponded with inundation onset in the eastern floodplain, where Fangak attained a peak inundation of 3066 km2 on 18 September, about 30 days after the KM4916 peak. The bootstrap estimate of 13 September indicated a 4.3% expansion (Δ = +125 km2) (Figure 9).
During the May–June rise, Lake Victoria reached a level of 1137.13 m on 30 June, and KM4916 peaked at 454.8 m on 19 October (Figure 10).
Ayod experienced a maximum inundation of 5580 km2 on 11 November, with a lag of approximately 23 days and only a minimal bootstrap adjustment of +0.8%, as shown in (Figure 11).
On the western bank, Guit peaked on 27 September (approximately a 21-day lag) but showed a negligible change in magnitude (+0.5%) (Figure 12). Panyijiar peaked on 11 November (approximately a 23-day lag), demonstrating moderate expansion (+1.4%) (Figure 13).
The bootstrap-based lag estimation predicted the peak inundated area in Guit on 2 October 2024, which had a relatively uncertain flood magnitude (Δ = +7.3; 0.5% increase), implying decreased hydraulic efficiency between the main channel and the western floodplain.
Overall, Figure 8, Figure 9, Figure 10, Figure 11, Figure 12 and Figure 13 illustrate a statistically coherent sequence of upstream to downstream signal propagation, suggesting a lagged hydrological linkage between Lake Victoria and the inundation of floodplains within the Sudd Wetland. Following the rise of lake levels during the March to July rainy season, an increase in river stage can be observed at KM4916 along the White Nile. This is subsequently followed by the peak extent of surface water across the downstream floodplains in Fangak, Ayod, Guit, and Panyijiar. This temporal progression reveals statistically estimated lag patterns consistent with delayed and attenuated signal transfer through the wetland system. The temporal alignment between the paired upstream and downstream hydrological series was quantitatively assessed using lagged cross-correlation analysis. The reported lag values indicate the maximum correlation coefficients, which represent the statistically optimal temporal alignment between the two-time series.
This study systematically aligned hydrological signals with independently documented displacement events from the Displacement Tracking Matrix (DTM) flood reports obtained from the International Organization for Migration (IOM). The DTM records detail periods of flood impacts and displacement, which were derived from key informant interviews and field assessments. To facilitate temporal comparisons with the propagation estimates, a representative observation date was assigned for each reported flooding window.
For example, a rise in the water level of Lake Victoria on 30 June correlated with an estimated peak at KM4916 on 19 October. Given the estimated propagation time from KM4916 to the lower floodplain, flood impacts were anticipated in Panyijiar and Ayod within approximately 3–4 weeks. The MBB estimates of the flood arrival window closely matched the reported flood impact periods. According to DTM documentation, flooding occurred in Ayod from 1–15 November and in Panyijiar over the same period, consistent with the MBB-predicted arrival window.
Similarly, increases in lake levels on 30 April and 28 May were followed by peak water levels at KM4916 on 19 August and 6 September, respectively. The MBB-estimated downstream flood timing closely corresponded to reported inundation periods in Fangak (DTM reported flooding from 1–30 September) and Guit (DTM reported flooding from 16–31 October), indicating general temporal consistency between the estimated propagation timing and independently reported flood occurrence. To enable effective comparison, representative dates were assigned within the reported flooding windows; however, these dates are approximate and introduce some uncertainty into the temporal assessment. The estimated and reported dates exhibited a strong Spearman rank correlation (ρ = 0.949, p = 0.051). Nevertheless, the marginal p-value and limited sample size suggest that careful interpretation is warranted. The timing differences were generally minor, with a mean absolute error (MAE) of 3.8 days and a root mean square error (RMSE) of 4.0 days. The mean difference of −1.2 ± 4.3 days (mean ± SD) indicates that the estimated flood timing was largely consistent with the reported inundation periods.
The interpreted timing precision should be approached with caution, as the acquired data were interpolated to daily values. This interpolation process smooths out temporal variability and may introduce uncertainty into the estimated lag timing. Consequently, the day-scale error statistics presented should be viewed as approximate indicators of temporal consistency, rather than precise measures of flood-arrival accuracy. Additionally, the DTM comparison should be interpreted as supportive evidence of temporal consistency. It is worth noting that the DTM data are subject to reporting bias arising from reliance on key informants, uneven spatial coverage, and variable access to affected areas, which may influence the representativeness and accuracy of the observation.
Although rainfall contributes to surface wetting of the Sudd floodplain, it was not possible to quantify its impact on the extent of inundation. The extremely weak statistical relationship between local rainfall and flooded area (R2 = 0.008, 0.002, 0.013, 0.001 for Panyijiar, Ayod, Fangak, and Guit, respectively) supports prior research indicating that local precipitation alone does not adequately explain the observed large-scale inundation dynamics through an immediate direct response [32]. Accordingly, the current framework focuses on capturing the dominant behavior of large-scale flood propagation driven by upstream inflows, without resolving lateral inflows, subsurface drainage, or direct water budget partitioning. On this spatial scale, these processes are viewed as secondary modulators of low significance, even though they may aggravate flooding under unusual rainfall conditions [33].
4. Discussion
The lag analyses indicate consistent patterns of downstream signal propagation from Lake Victoria through the River Nile into the downstream floodplains of the Sudd Wetland. Multi-month propagation delays of approximately 106 to 134 days provide evidence of delayed downstream response, suggesting that hydrological disturbances arising in the lake basin take several months to affect river stages downstream, though the strength of this association varies considerably across seasons and locations.
The multi-month delays between Lake Victoria and KM4916, and the subsequent propagation of weeks into the Jonglei and Unity floodplains, are broadly consistent with the findings in the hydrology literature of the River Nile. The findings of the study align with the well-documented buffering function of the Sudd Wetland, which serves as one of Africa’s largest natural floodplain storage systems and significantly alters flow transmission within the Upper Nile basin. Given the highly complex hydrological signal transmission and propagation processes in the target area, coupled with a critical lack of detailed topographic information, including river networks, land-use data, and meteorological and hydrological input data, analysing estimated lags using numerical hydrological models presents significant challenges. Therefore, this method, which utilizes the latest satellite data, is considered effective [34,35,36,37].
The longer lags observed during the dry season reflect the slower movement of flow signals, driven by enhanced water retention and gradual release from wetlands and floodplains under low-flow conditions. Such behavior is consistent with previous hydrological studies showing that the Sudd Wetland dampens flood peaks and prolongs hydrograph recession through extensive floodplain storage and evapotranspiration losses [38]. In conditions of reduced flow, localized storage impacts, disconnection between channels and floodplains, and heightened evapotranspiration can diminish the clarity of downstream propagation signals, leading to wider correlation peaks and increased uncertainty in the estimated lags.
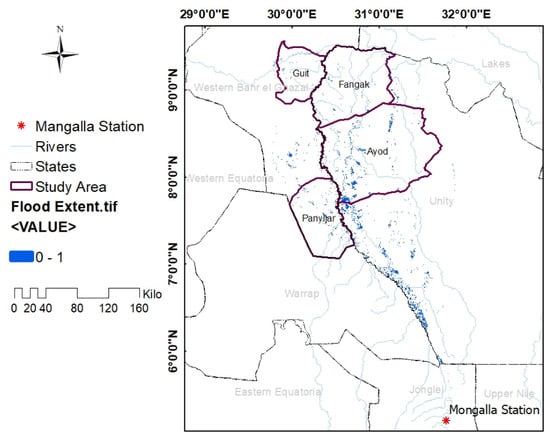
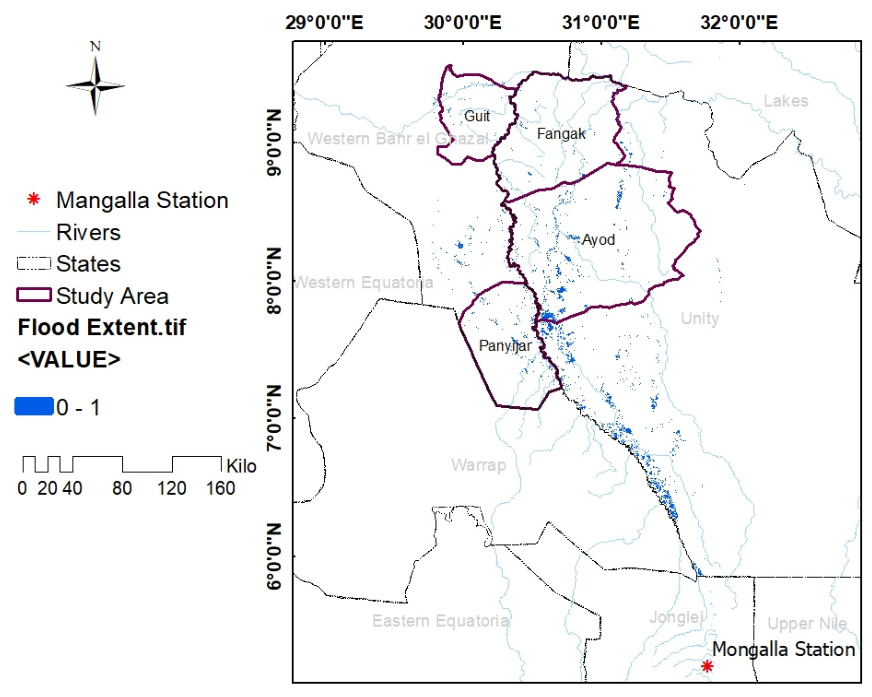
The floodplain response varies between the eastern and the western banks; upstream areas respond earlier than downstream locations, and inundation magnitude differs across the system. The eastern Jonglei floodplain shows more frequent and sustained channel floodplain exchange under high stage conditions than the western Unity floodplain. This pattern suggests that floodplain connectivity in the Sudd is highly stage-dependent, producing uneven lateral inundation even under relatively uniform upstream forcing [39]. A Sentinel-1 SAR-derived inundation map for peak flood conditions in 2024 is given to illustrate the spatial context of the expected propagation dynamics (Figure 14). The SAR data qualitatively reveal significant lateral floodplain flooding and spatial discrepancies in the connection between the eastern and western Sudd regions. Nonetheless, due to variations in revisit frequency, temporal consistency, and processing methodologies, the SAR data serve as supplementary spatial evidence rather than formal validation.
Figure 14.
Sentinel-1 SAR-derived inundation extent during peak flooding conditions in the Sudd Wetland, 2024.
The comparison between MBB and GP provides a methodological insight with broader relevance for hydrological signal analysis in a data-sparse environment. Both approaches reproduced the overall seasonal lag structure, though this agreement should be interpreted with caution as it does not necessarily confirm the physical accuracy of the inferred lags; instead, it reflects the shared input data and overlapping methodological assumptions. However, the wider confidence interval from the MBB approach captures both statistical uncertainty and regime-dependent variability in flood estimated lag, indicating that delays are not fixed but vary with flow conditions, especially during the dry season. This highlights that the satellite-derived hydrological signals in complex wetland systems encompass uncertainty that deterministic point estimate methods fail to capture [40]. Additionally, the application of Gaussian Process (GP) smoothing to the windowed cross-correlation surface inherently assumes a Radial Basis Function (RBF) covariance structure, with hyperparameters optimized through single-start log-marginal likelihood maximization, which promotes smooth temporal dependencies across the lag domain. As a result, the estimated lag is sensitive to the kernel hyperparameters, particularly the optimized length scale. This length scale can incorporate edge effects from the chosen lag window or may overly smooth weak seasonal correlation structures. In seasons characterized by sparsity or noise, such smoothing can either broaden or shift the inferred lag peak when compared to the moving block bootstrap estimate, suggesting that the observed lag behavior is influenced more by the kernel than by purely physical factors [41]. Thus, the GP-derived lag is interpreted as the lag corresponding to the maximum smoothed correlation representing the most probable delay given the assumed covariance structure. Due to these structural limitations, the moving block bootstrap is the main method used for lag inference. Meanwhile, the GP approach offers a complementary perspective that relies on smoothing. It is important to interpret the results from the GP method within the context of its kernel assumptions, rather than viewing them as confirmation of physical evidence.
Consequently, alternative non-stationary signal decomposition approaches, such as Ensemble Empirical Mode Decomposition (EEMD) and wavelet coherence analysis, present unique advantages for isolating multi-scale propagation behaviors without the constraints of strict stationarity assumptions. These methods can offer deeper insights into the temporal evolution of hydrological relationships across various frequency domains, making them recognized and promising directions for future methodological advancements.
In this study, we estimated the delay in flow from upstream lakes to wetland inflow points by utilizing satellite altimeter data on lake and river water levels. While the satellite’s orbits impose the sampling locations for altimeter data, limiting the acquisition of water level information to specific sites, the application of this data allows for the assessment of time delays across various regions globally. Furthermore, by incorporating CYGNSS Watermask data, we could monitor the dynamics of wetland inundation areas on a daily basis. This advancement facilitates a broader understanding of the relationship between inflow changes to wetlands and the resulting temporal and spatial variations in inundation area, including the estimation of lag times.
Despite these constraints, our analysis indicates a degree of temporal correspondence between estimated flood arrival time windows and independently reported displacement events during the 2024 flood season, with timing errors constrained to a few days across multiple locations. While this correspondence is encouraging, it should be approached with caution due to the uncertainties surrounding both the propagation estimates and the reported displacement records. Unlike physically based routing approaches, which employ geomorphic unit hydrograph methods with spatially distributed velocity fields [42], the present study adopts a satellite altimetry-based framework for statistical lag estimation rather than an explicit runoff-routing simulation. Moreover, both approaches converge on the central importance of watershed travel-time dynamics in governing flood behavior.
The propagation framework developed in this study indicates that it could be beneficial in enhancing anticipatory flood forecasting and early warning systems along the Nile River corridor, provided it is integrated with real-time lake water level observations and updated hydrodynamic routing models. The lead times inherent in this propagation structure represent a potentially useful operational window for anticipatory action, including early warning dissemination, pre-positioning of humanitarian assistance, and adjustment of agricultural and grazing practices ahead of inundation.
The study experienced several challenges and limitations. The analysis relied on remote-sensed and altimetry observations, which may have temporal gaps and lower spatial resolution. The absence of in situ hydrometric data and flow measurements introduced uncertainty in quantifying lag times. The CYGNSS v3.2 water mask data form the primary dataset for inundation area estimation in this study, offering key advantages due to its L-band frequency sensitivity and high revisit rate, which help bridge observational gaps inherent in conventional remote sensing approaches. However, certain limitations, including moderate spatial resolution, data latency, and sparse observations, can introduce uncertainties in lag time estimation. These factors may lead to temporal smoothing or delayed detection of inundation signals, particularly in low-gradient wetland environments where estimated hydrological lag times are naturally attenuated. A further limitation of this study is the relatively short temporal record available for the lag analysis. This constraint leads to seasonal partitioning, which decreases the effective sample size and results in inferred lag estimates that are sensitive to sampling variability and a weak correlation structure. Therefore, the estimated lags should be regarded as probabilistic dominant propagation tendencies within the analyzed period. Although paired statistical frameworks were applied to improve robustness, extending the observational records to encompass additional hydrological extremes would likely enhance the statistical stability and reliability of the inferred lag relationships.
Overall, this study extends beyond previous investigations of the Sudd floodplain storage dynamics and wetland buffering by providing an observation-driven, basin-scale estimation of flood signal propagation delays from Lake Victoria to downstream floodplains. By deriving spatially distributed lag estimates from satellite altimetry and inundation records, and explicitly quantifying uncertainty through paired statistical frameworks (MBB and GP), this study indicates that flood estimated lags across the Upper Nile system are seasonally variable, complementing earlier interpretations of wetland buffering into temporally resolved, data-sparse compatible estimates of hydrological signal transmission.
5. Conclusions
The finding indicates a moderate association, suggesting a hydrological connection between fluctuations in Lake Victoria’s water levels and the dynamics of downstream flooding along the Nile River and the Sudd wetlands. The observed delays in flood signal propagation align with hydrologically plausible lag structures consistent with characteristic patterns in the lagged transmission of hydrological signals throughout the river-wetland system.
The general consistency observed between the estimated flood arrival times and independently documented instances of flood-related displacement events offers cautious evidence of temporal plausibility within the proposed framework, indicating some efficiency in capturing predominant flood timing patterns. It is important to note that this does not constitute robust predictive validation. Rather, it presents promising, though preliminary, evidence of the framework’s potential advantage in data-scarce environments.
In conclusion, the variability of Lake Victoria’s water levels serves as a significant hydrological indicator for assessing downstream hydrological signal propagation and informing flood risk assessment and early warning measures with appropriate caution. Additionally, the estimated lag times offer empirically grounded insight into large-scale hydrological connectivity and temporal propagation patterns within the Nile-Sudd system. Through the comparison of estimated lag times in our study with those obtained from hydraulic and hydrological models, we would like to further clarify the validity of our estimates and to examine the potential for improving flood predictability by utilizing our proposed method.
Moreover, future research should prioritize the integration of seasonally adaptive hydrological models that explicitly account for wetland storage dynamics, alongside the establishment of distributed ground-based monitoring networks. Such advancements will improve the accuracy of flood estimated lag estimations and reinforce predictive capabilities under diverse hydrological conditions.
Author Contributions
Conceptualisation, R.G.; methodology, R.G. and H.I.; software, R.G.; resources, writing—original draft preparation, R.G.; writing—review and editing, R.G. and H.I.; supervision, H.I., J.M. and K.S. All authors have read and agreed to the published version of the manuscript.
Funding
This research was funded by JSPS KAKENHI Grant Number 26K07691.
Data Availability Statement
The original contributions presented in this study are included in the article. Further inquiries can be directed to the corresponding author.
Acknowledgments
The authors would like to express their gratitude to the Faculty of Engineering at Yamanashi University. They also extend their appreciation to the Interdisciplinary Centre for River Basin Environment at the University of Yamanashi for offering technical guidance and institutional support for this research.
Conflicts of Interest
The authors declare no conflicts of interest.
References
- Rentschler, J.; Salhab, M.; Jafino, B.A. Flood exposure and poverty in 188 countries. Nat. Commun. 2022, 13, 3527. [Google Scholar] [CrossRef] [Scilit]
- Tabari, H. Climate change impact on flood and extreme precipitation increases with water availability. Sci. Rep. 2020, 10, 13768. [Google Scholar] [CrossRef] [Scilit] [PubMed]
- Wing, O.E.J.; Bates, P.D.; Quinn, N.D.; Savage, J.T.S.; Uhe, P.F.; Cooper, A.; Collings, T.P.; Addor, N.; Lord, N.S.; Hatchard, S.; et al. A 30 m Global Flood Inundation Model for Any Climate Scenario. Water Resour. Res. 2024, 60, e2023WR036460. [Google Scholar] [CrossRef] [Scilit]
- Najibi, N.; Devineni, N. Recent trends in the frequency and duration of global floods. Earth Syst. Dyn. 2018, 9, 757–783. [Google Scholar] [CrossRef] [Scilit]
- Yu, Q.; Wang, Y.; Li, N. Extreme Flood Disasters: Comprehensive Impact and Assessment. Water 2022, 14, 1211. [Google Scholar] [CrossRef] [Scilit]
- Liu, Q.; Du, M.; Wang, Y.; Deng, J.; Yan, W.; Qin, C.; Liu, M.; Liu, J. Global, regional and national trends and impacts of natural flood1990–2022. Bull. World Health Organ. 2024, 102, 410–420. [Google Scholar] [CrossRef] [Scilit]
- Feng, B.; Zhang, Y.; Bourke, R. Urbanization impacts on flood risks based on urban growth data and coupled flood models. Nat. Hazards 2021, 106, 613–627. [Google Scholar] [CrossRef] [Scilit]
- Iahs, P.; Sene, K.; Carr, H.H.; Tych, W. Reflections on almost a century of hydrological studies on Africa’s largest lake. Proc. Int. Assoc. Hydrol. Sci. 2021, 384, 141–147. [Google Scholar]
- Ruuskanen, C. Monitoring wetland cover changes during the past two decades within the protected areas of the Sudd wetland in South Sudan using MODIS data. In Student Thesis Series INES; Department of Physical Geography and Ecosystem Science: Lund, Sweden, 2021. [Google Scholar]
- Di Vittorio, C.A.; Georgakakos, A.P. Hydrologic Modeling of the Sudd Wetland using Satellite-based Data. J. Hydrol. Reg. Stud. 2021, 37, 100922. [Google Scholar] [CrossRef] [Scilit]
- Vanderkelen, I.; Van Lipzig, N.P.M.; Thiery, W. Modelling the Water Balance of Lake Victoria (East Africa)—Part 2: Future Projections. Hydrol. Earth Syst. Sci. 2018, 22, 5527–5549. [Google Scholar] [CrossRef] [Scilit]
- Tate, E.; Sutcliffe, J.; Conway, D.; Farquharson, F. Water balance of Lake Victoria: Update to 2000 and climate change modelling to 2100. Hydrol. Sci. J. 2004, 49, 563–574. [Google Scholar] [CrossRef] [Scilit]
- Sene, K.J. Theoretical Estimates for the Influence of Lake Victoria on Flows in the Upper White Nile. Hydrol. Sci. J. 2000, 45, 125–145. [Google Scholar] [CrossRef] [Scilit]
- Yin, X.; Nicholson, S.E.; Yin, X.; Nicholson, S.E. The water balance of Lake Victoria The water balance of Lake Victoria. Hydrol. Sci. J. 1998, 43, 789–811. [Google Scholar] [CrossRef] [Scilit]
- Kudagama, D.; Awange, J.; Wang, J.; Zerihun, A.; Luna, L. A century of Sudd wetland’s water storage dynamics using reconstructed and downscaled GRACE/GRACE-FO Data. Sci. Remote Sens. 2025, 11, 100232. [Google Scholar] [CrossRef] [Scilit]
- Rebelo, L.M.; Senay, G.B.; McCartney, M.P. Flood pulsing in the Sudd wetland: Analysis of seasonal variations in inundation and evaporation in South Sudan. Earth Interact. 2012, 16, 1–19. [Google Scholar] [CrossRef] [Scilit]
- Dong, B.; Peng, S.; Liu, G.; Pu, T.; Prigent, C.; Lin, X.; Safdi, C.G. Underestimation of Methane Emissions From the Sudd Wetland: Unraveling the Impact of Wetland Extent Dynamics. Geophys. Res. Lett. 2024, 51, e2024GL110690. [Google Scholar] [CrossRef] [Scilit]
- Sutcliffe, J.; Brown, E. Water losses from the Sudd. Hydrol. Sci. J. 2018, 63, 527–541. [Google Scholar] [CrossRef] [Scilit]
- Salman, S.M.A. The new state of South Sudan and the hydro-politics of the Nile Basi. Water Int. 2011, 36, 154–166. [Google Scholar] [CrossRef] [Scilit]
- Humphrey, A.; Stites, E.; Gai, T.J.; Lony, N. Faced with Floods: Shifting Livelihood Strategies Among South Sudan’s Pastoralists; Supporting Pastoralism and Agriculture in Recurrent and Protracted Crises (SPARC): London, UK, 2023. [Google Scholar]
- Geleta, C.D.; Deressa, T.A. Evaluation of Climate Hazards Group InfraRed Precipitation Station (CHIRPS) satellite-based rainfall estimates over Finchaa and Neshe Watersheds, Ethiopia. Eng. Rep. 2021, 3, e12338. [Google Scholar] [CrossRef] [Scilit]
- An, Z.; Chen, P.; Tang, F.; Yang, X.; Wang, R.; Wang, Z. Evaluating the Performance of Seven Ongoing Satellite Altimetry Missions for Measuring Inland Water Levels of the Great Lakes. Sensors 2022, 22, 9718. [Google Scholar] [CrossRef] [Scilit]
- Santos, J.; Calmant, S.; Seyler, F.; Corrêa, O.; Filho, R.; Cochonneau, G.; João, W. Remote Sensing of Environment Water levels in the Amazon basin derived from the ERS 2 and ENVISAT radar altimetry missions. Remote Sens. Environ. 2010, 114, 2160–2181. [Google Scholar] [CrossRef] [Scilit]
- Normandin, C.; Telly, A.; Marieu, V. Evolution of the Performances of Radar Altimetry Missions from ERS-2 to Sentinel-3A over the Inner. Remote. Sens. Environ. 2018, 10, 833. [Google Scholar] [CrossRef] [Scilit]
- Künsch, R. The Jackknife and the Bootstrap for General Stationary Observations. Ann. Stat. 1989, 17, 1217–1241. [Google Scholar] [CrossRef] [Scilit]
- Sivakumar, B. Chaos in Hydrology: Bridging Determinism and Stochasticity; Springer: Dordrecht, The Netherlands, 2017. [Google Scholar] [CrossRef] [Scilit]
- Beyaztas, B.H.; Firuzan, E. An Empirical Comparison of Block Bootstrap Methods: Traditional And Newer Ones. J. Data Sci. 2016, 14, 641–656. [Google Scholar] [CrossRef] [Scilit]
- Noack, M.M.; Luo, H.; Risser, M.D. A unifying perspective on non-stationary kernels for deeper Gaussian processes. APL Mach. Learn. 2024, 2, 1–37. [Google Scholar] [CrossRef] [Scilit]
- Moffat, I.U.; Akpan, E.A. White Noise Analysis: A Measure of Time Series Model Adequacy. Appl. Math. 2019, 10, 989–1003. [Google Scholar] [CrossRef]
- Pandey, B.R. Flood Wave Propagation. In Proceedings of the 12th IOE Graduate Conference, Kathmandu, Nepal, 19–22 October 2022; Volume 12, pp. 1144–1155. [Google Scholar]
- Tumusiime, M.D.; Aribo, L.; Kalema, B.; Makula, E.K.; Tumusiime, M.D. Influence of Spatiotemporal Variability of Raifall on East Africa Shared Surface Water Resources. Int. J. Innov. Sci. Res. Technol. (IJISRT) 2024, 12, 1–8. [Google Scholar] [CrossRef] [Scilit]
- Galla, R.; Ishidaira, H.; Magome, J.; Souma, K. Long-Term Innovative Trend Analysis of Hydro-Climatic Data of the Sudd Region of South Sudan. Water 2025, 17, 1961. [Google Scholar] [CrossRef] [Scilit]
- Mohamed, Y.A.; Bastiaanssen, W.G.M.; Savenije, H.H.G. Spatial variability of evaporation and moisture storage in the swamps of the upper Nile studied by remote sensing techniques. J. Hydrol. 2004, 289, 145–164. [Google Scholar] [CrossRef] [Scilit]
- Sutcliffe, J.V.; Parks, Y.P. The Bahr el Jebel and the Sudd. Hydrol. Nile 1999, 21, 57–87. [Google Scholar]
- Mohamed, Y.; Savenije, H.H.G. Impact of climate variability on the hydrology of the Sudd wetland: Signals derived from long term (1900-2000) water balance computations. Wetl. Ecol. Manag. 2014, 22, 191–198. [Google Scholar] [CrossRef] [Scilit]
- Williams, M.A.J.; Adamson, D.; Cock, B.; Mcevedy, R. Late Quaternary Environments in the White Nile Region, Sudan. Glob. Planet. Change 2000, 26, 305–316. [Google Scholar] [CrossRef] [Scilit]
- Wolft, C.G.; Burges, S.J. An Analysis of the Influence of River Channel Properties on Flood Frequency. J. Hydrol. 1994, 153, 317–337. [Google Scholar] [CrossRef] [Scilit]
- Howell, P.; Lock, M.; Cobb, S. The Jonglei Canal: Impact and Opportunity; Cambridge University Press: Cambridge, UK, 1988. [Google Scholar]
- Petersen, G. The Hydrology of the Sudd Hydrologic Investigation and Evaluation of Water Balances in the Sudd Swamps of Southern Sudan. Ph.D. Thesis, Christian-Albrechts Universität Kiel, Kiel, Germany, 2008. [Google Scholar]
- Schumann, G.; Bates, P.D.; Horritt, M.S.; Matgen, P.; Pappenberger, F. Progress in integration of remote sensing-derived flood extent and stage data and hydraulic models. Rev. Geophys. 2009, 47, 1–20. [Google Scholar] [CrossRef] [Scilit]
- Rasmussen, C.E.; Williams, C.K.I.; Processes, G.; Press, M.I.T.; Jordan, M.I. Gaussian Processes for Machine Learning; MIT Press: Cambridge, MA, USA, 2006. [Google Scholar]
- Wang, W.-C.; Zhao, Y.-W.; Chau, K.-W.; Xu, D.-M.; Liu, C.-J. Improved flood forecasting using geomorphic unit hydrograph based on spatially distributed velocity field. J. Hydroinform. 2021, 23, 724–739. [Google Scholar] [CrossRef] [Scilit]

Disclaimer/Publisher’s Note: The statements, opinions and data contained in all publications are solely those of the individual author(s) and contributor(s) and not of MDPI and/or the editor(s). MDPI and/or the editor(s) disclaim responsibility for any injury to people or property resulting from any ideas, methods, instructions or products referred to in the content. |
© 2026 by the authors. Licensee MDPI, Basel, Switzerland. This article is an open access article distributed under the terms and conditions of the Creative Commons Attribution (CC BY) license.