


Abstract
To reveal the overtopping dam-break mechanism under extreme rainfall conditions and assess downstream flood risk, a series of dam-break flume tests, flood routing simulations and inundation risk assessments were conducted. Using the Hubuling Reservoir in Rizhao City, Shandong Province as a case study, a circulating extreme rainfall dam-break flume system with a controllable reservoir water level was constructed at a geometric similarity scale of 1:70. Four test conditions were designed: no rainfall and 50-year, 100-year and 2000-year rainfall return periods. Pore water pressure, earth pressure and water content sensors were embedded in critical dam sections to monitor real-time internal dynamic responses. The results show that, due to the combined effect of the highest rainfall intensity, rapid reservoir water-level rise, progressive infiltration-induced weakening and concentrated surface erosion, a dam-break occurs only under the 2000-year rainfall return period. The failure process is divided into four stages: initial infiltration, slope surface scour, overtopping initiation and rapid breach development. Based on dam-break parameters obtained by physical model tests, a two-dimensional numerical using HEC-RAS was conducted. The results show that, under the 2000-year rainfall return period, the flood reaches the downstream area at 80 min after dam failure. The maximum inundation area reaches 15.20 km2 at 200 min, with a maximum inundation depth of 11.80 m and a maximum inundation duration of 144 h. By integrating the maximum inundation depth, inundation duration and land use conditions, the expected economic loss is estimated to be 690 million yuan. The results provide important support for dam-break early warnings, emergency management and disaster mitigation of similar small- and medium-sized reservoirs.
1. Introduction
Dam stability is fundamental to the effective utilization of water resources and the enhancement of basin-wide flood control capacity [1]. However, global warming and unregulated human activities have intensified extreme weather events, thereby increasing the risks of both flooding and dam-breaks [2]. By the end of 2020, 2068 dams over 15 m had failed worldwide. Since 1956, China has experienced 3558 dam failures, and the annual average number far exceeds the general accepted annual failure probability in the international dam engineering community [3]. Dam failure mechanism analysis and quantitative risk assessment can enhance the scientific rigor and effectiveness of reservoir safety management, and inform disaster prevention strategies and territorial spatial planning [4].
Based on numerical simulations and physical model tests, scholars have primarily elucidated dam failure mechanisms under varying reservoir water conditions, geological settings and operational scenarios [5]. In particular, model test-based studies enable direct observation of breach development and accurate measurement of key parameters such as flow rate, flow velocity and scour topography [6]. Chinnarasri et al. [7] simulated the overtopping failure of homogeneous earth dams through flume tests, and quantitatively related the breach development rate and failure duration to upstream unit-width discharge. Qiu et al. [8] adopted flume model tests to clarify the longitudinal and transverse cross-sectional evolution, and the face slab failure characteristics during overtopping-induced dam failure, identifying two typical seepage failure modes on downstream slopes under invalid waterstop conditions and the influence of seepage action on breach progression. Shi et al. [9] reproduced landslide dam breaching for fine-grained, well-graded and coarse-grained materials under different inflows, and the influences of dam materials and inflow on breach development, the outflow hydrograph and erosion characteristics were analyzed. Verma et al. [10] divided the embankment breaching process into three stages (initial erosion, headcut erosion and lateral erosion) based on six flume tests, with most erosive movement associated with lateral expansion.
Flood inundation analysis focuses on assessing macroscopic risk information, including inundation extent, flood depth and arrival time [11]. Commonly used software includes the MIKE series, the Storm Water Management Model, the Delft series, HEC-RAS and FLUENT. The accuracy and efficiency of the HEC-RAS two-dimensional module have been validated worldwide [12]. Eghbali et al. [13] explored the failure mechanism of tailings dams by integrating physical model tests with two-dimensional HEC-RAS numerical simulation, and a unified analytical framework was established to compare erosion modes at different breach locations, and the effects of breach width, initial water level and reservoir geometry on the outflow process were systematically analyzed. Yang et al. [14] built a two-dimensional dam-break model for Baoshi Reservoir using HEC-RAS unsteady flow, and a complete workflow was described including terrain processing, boundary setup and computation, and inundation extent, depth, velocity and arrival time were obtained. Awal et al. [15] used HEC-RAS to simulate failure of the Budhigandaki arch dam in Nepal and assessed downstream flood risks, in which breach elevation was identified as the most sensitive parameter, and corresponding non-structural mitigation measures were recommended.
The concept of risk was introduced to dam safety in the 1960s [16]. The International Commission on Large Dams defines risk as a comprehensive measure of the likelihood and severity of adverse impacts on human life, property and the environment [17]. Fu et al. [18] analyzed dam failure probability and life loss, proposed an event tree analysis method based on fuzzy set theory, optimized the life loss assessment model and successfully applied it to a reservoir dam in Jiangxi Province, China. Zhu et al. [19] examined the direct and indirect factors influencing life loss risk due to dam failure, developed an adaptive differential evolution method that dynamically adjusts mutation and crossover factors to optimize algorithm performance, and evaluated the similarity of life loss in dam failure accidents using a fuzzy clustering iteration approach. Ji et al. [20] integrated cloud models and matter-element analysis to address uncertainties in consequence assessment, based on which an improved evaluation model and a multi-dimensional index system covering life, economic, environmental and social losses was established.
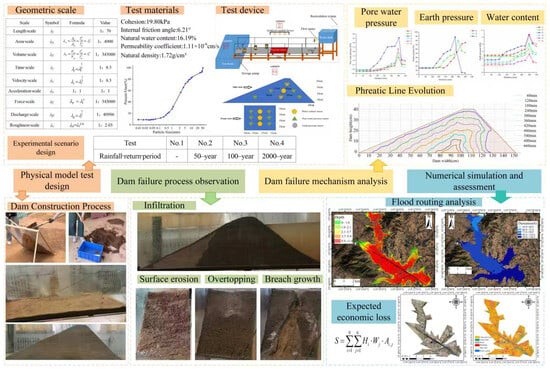
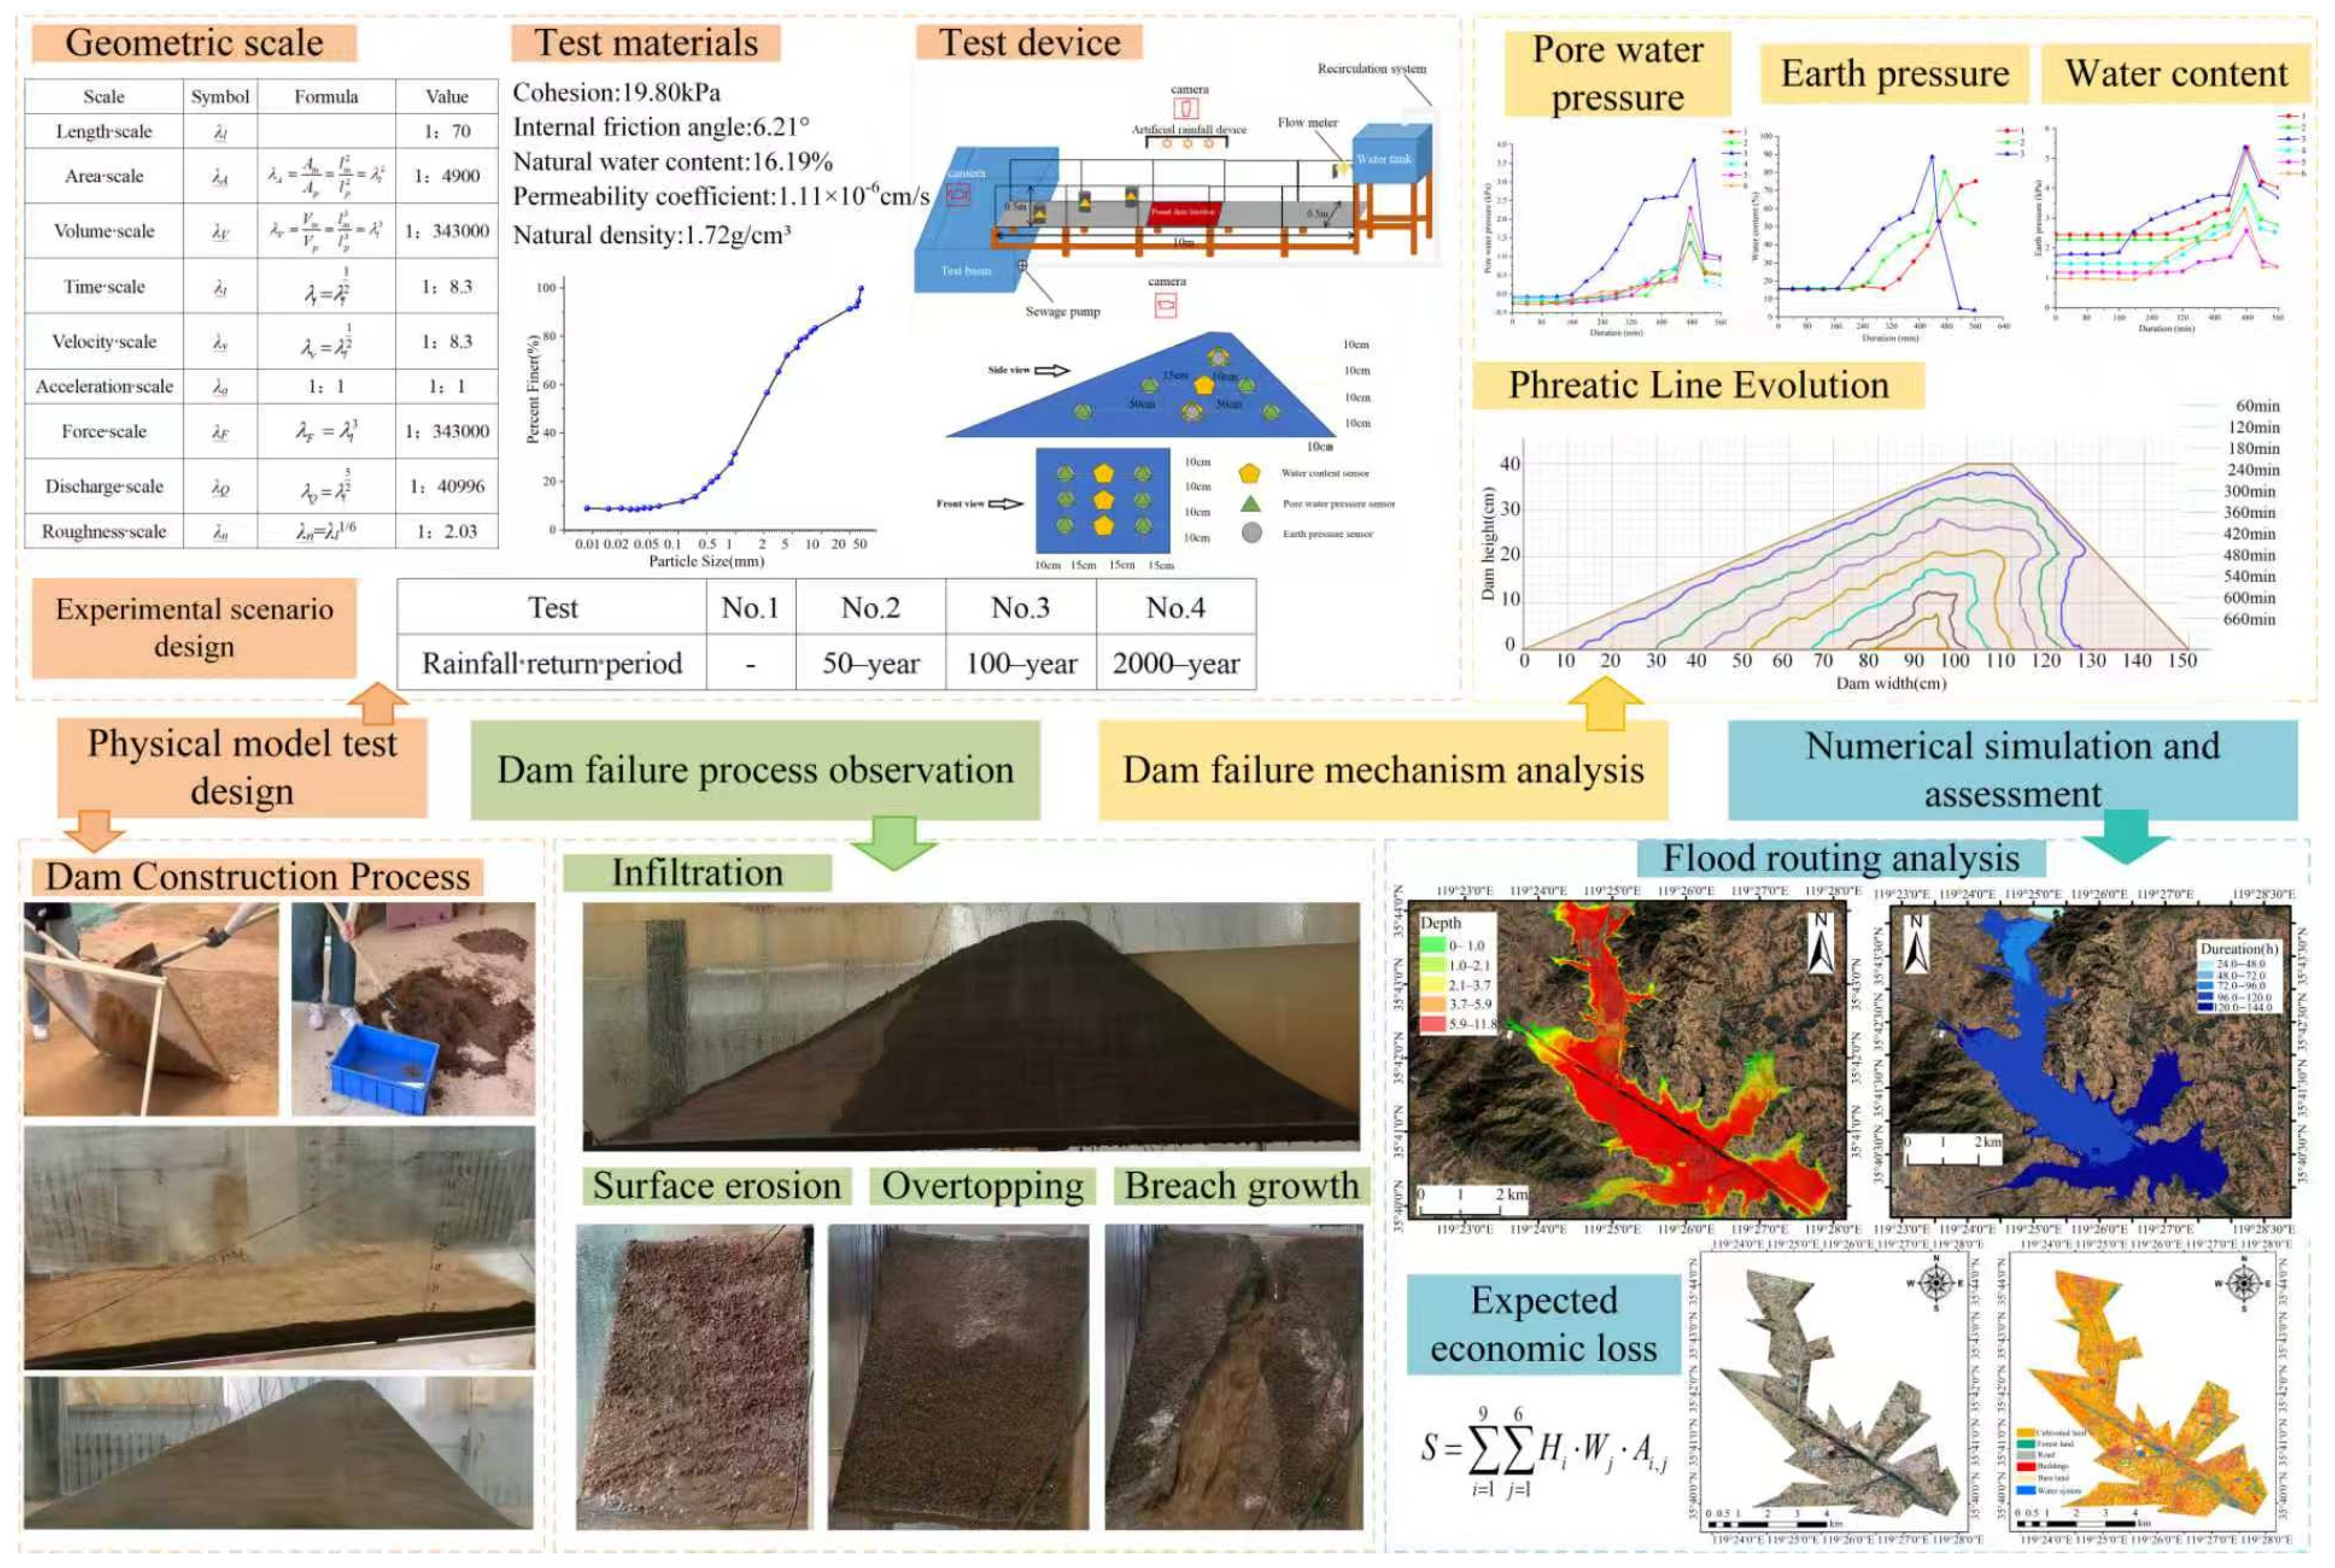
Refined physical model tests of the entire dam failure process under extreme rainfall conditions, i.e., from saturation and overtopping to scour-induced breaching driven by coupled infiltration and runoff, remain relatively limited [21]. Systematic predictions and assessment of inundation economic losses are also insufficient, hindering comprehensive support for flood risk decision-making and resource allocation [22]. A dam-break flume test focused on extreme rainfall conditions was conducted to reveal the overtopping failure mechanism of the dam in this paper, taking the Hubuling Reservoir in Wulian County, Rizhao City, Shandong Province as the research object. The experimental results then calibrated and drove a two-dimensional hydrodynamic model in HEC-RAS to simulate the dam-break flood routing process and calculate the expected economic losses from flooding. A dam-break flood risk assessment was then completed. The novelty lies in two aspects: (1) this paper reproduced the full failure sequence—saturation, overtopping, and scour breaching—driven by rainfall infiltration-runoff under a 2000-year return period event, revealing the failure mechanism and flood risk. (2) through multi-sensor collaborative monitoring, it established the spatiotemporal correspondence between the internal dam responses and external failure, and further revealed the intrinsic link between these internal responses and overtopping initiation. The research workflow was shown in Figure 1.
Figure 1.
Research flowchart.
2. Research Object and Data
2.1. Hubuling Reservoir and Potential Inundation Area Overview
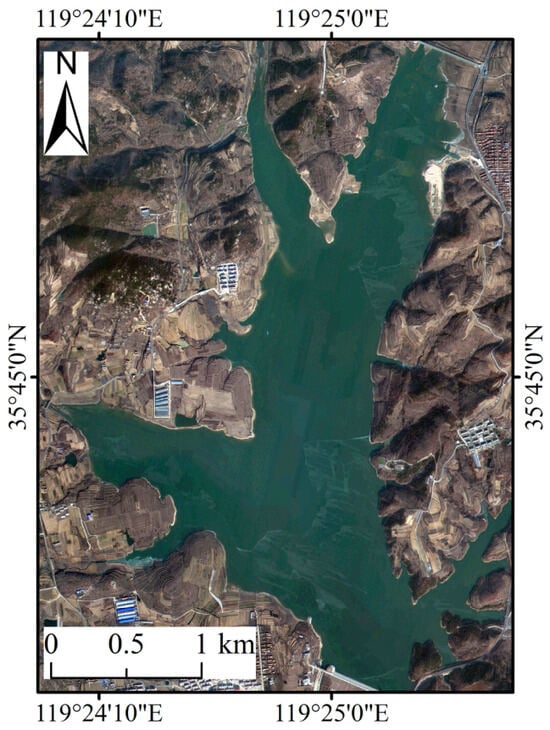
Hubuling Reservoir is in Hubuling Town, Wulian County, Rizhao City, Shandong Province, spanning 119°24′27.05″ E to 119°25′43.13″ E and 35°44′04.38″ N to 35°45′57.97″ N. It lies within the Chaobai river system and the upper reaches of the Laozhi river. A satellite image of the reservoir is shown in Figure 2. The area has a typical warm temperate, humid monsoon continental climate, with an average annual precipitation of 784.5 mm. Precipitation is unevenly distributed spatially and exhibits high interannual variability. Summer rainfall accounts for approximately 61% of the annual total. Due to this concentrated rainfall pattern, floods and short-duration heavy rainfall events occur frequently [23].
Figure 2.
Satellite image of Hubuling reservoir.
The reservoir was initially constructed in 1959 and began impoundment and operation in 1960, with reinforcement works carried out in 2015. It is a medium-sized reservoir primarily serving as flood control and water supply, as well as irrigation, aquaculture and ecological water supplementation. The river length above the dam site is 10 km, draining a controlled area of 64 km2. The total, active, and dead storage capacities are 4.621 × 10⁷ m3, 2.801 × 10⁷ m3 and 1.20 × 10⁶ m3, respectively. The design and check flood standards correspond to 100-year and 2000-year floods, respectively. The dam is a homogeneous earthfill structure with a length of 580 m, a height of 27.32 m, and a crest width of 6 m. The upstream and downstream slope ratios are 1:1 and 1:2.5, respectively [24].
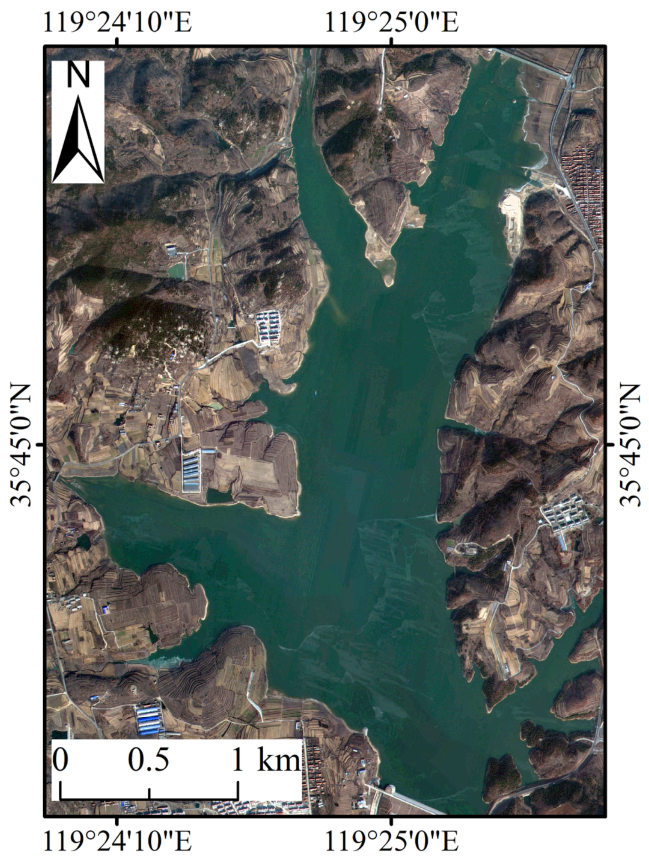
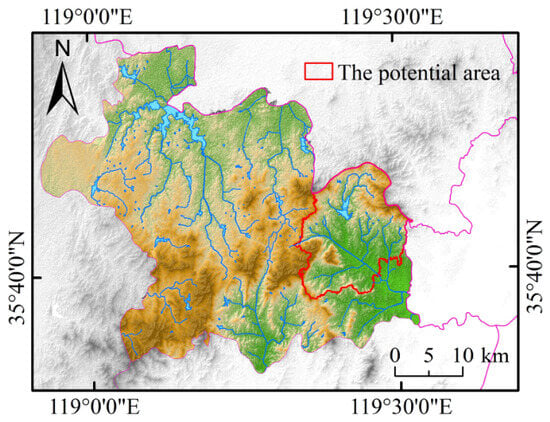
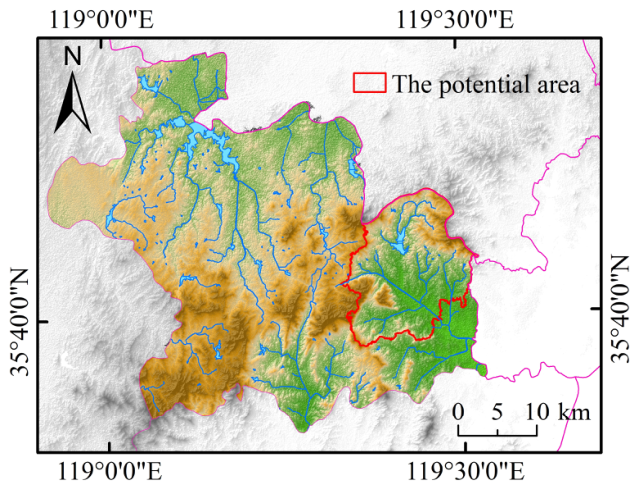
The potential inundation area induced by dam-break floods of Hubuling Reservoir covers Hubuling Town and Kouguan Town, as shown in Figure 3. Hubuling Town features rugged terrain dominated by mountains and rolling hills, with scattered plains, and covers an area of 102.07 km2. Its population is unevenly distributed, with dense settlement in the southwest and sparse settlement in the northeast. Kouguan Town belongs to a coastal low hilly and mountainous zone, with a terrain sloping from the higher northwest to the lower southeast, spanning 116.22 km2 with a continuous stretch of mountains. The main rivers in the town are the Panlong river and the Chaohe river. The population is scattered, with dense settlement along the central river valleys and cultivated areas, and sparse settlement in forested regions [25].
Figure 3.
The potential area of flood inundation.
2.2. Research Data and Sources
The data used in this paper were divided into four categories: basic topographic and remote sensing data, meteorological and rainfall data, reservoir engineering parameters and monitoring data from dam-break flume tests. Basic topographic data support the development of the two-dimensional hydrodynamic model. Remote sensing images enable inundation range analysis and risk assessment. Meteorological and rainfall data, together with reservoir engineering parameters, are used to design events with extreme rainfall conditions and inflow hydrographs. Dam-break flume monitoring data help reveal the dam-break mechanism. The detailed data and their corresponding sources are shown in Table 1.
Table 1.
Data and corresponding sources used in this paper.
3. Test Preparation and Scheme
3.1. Physical Model Similarity Criteria
This paper adopted a local cross-section scaled model with gravity similarity as the primary control criterion, in accordance with the fundamental principles of geometric, kinematic and dynamic similarity [26,27]. Considering test effectiveness and site limitations, the geometric scale was set to 1:70. Other similarity scales were subsequently derived and are shown in Table 2.
Table 2.
Similarity scales.
Froude similarity was adopted because overtopping flow and breach erosion are dominated by gravity-driven free-surface flow. Velocity, discharge and time scales were derived from the geometric scale. However, seepage, infiltration and soil–particle interactions cannot be fully scaled simultaneously with free-surface hydraulics in a small-scale movable-bed model. This paper focused on the relative failure sequence and coupling mechanisms, rather than a direct one-to-one reproduction of prototype seepage rates. To mitigate scale distortion, prototype dam soil was used as the test material. Initial water content and compacted density were controlled to match measured field values. Rainfall intensity and inflow hydrographs were converted using the similarity scales. Boundary effects were reduced by roughening the sidewalls.
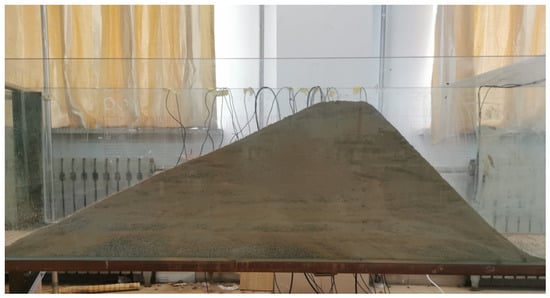
Based on the similarity scales described above, the test model was designed with the following dimensions: dam length of 0.5 m, dam height of 0.4 m, crest width of 0.09 m, upstream slope ratio of 1: 1 and downstream slope ratio of 1:2.5.
3.2. Test Setup
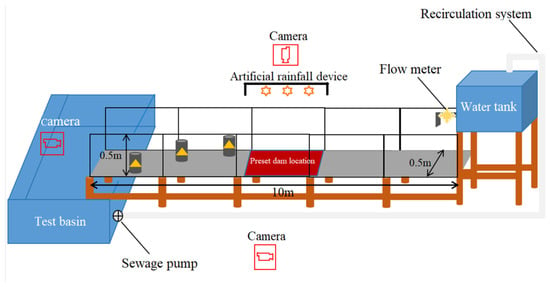
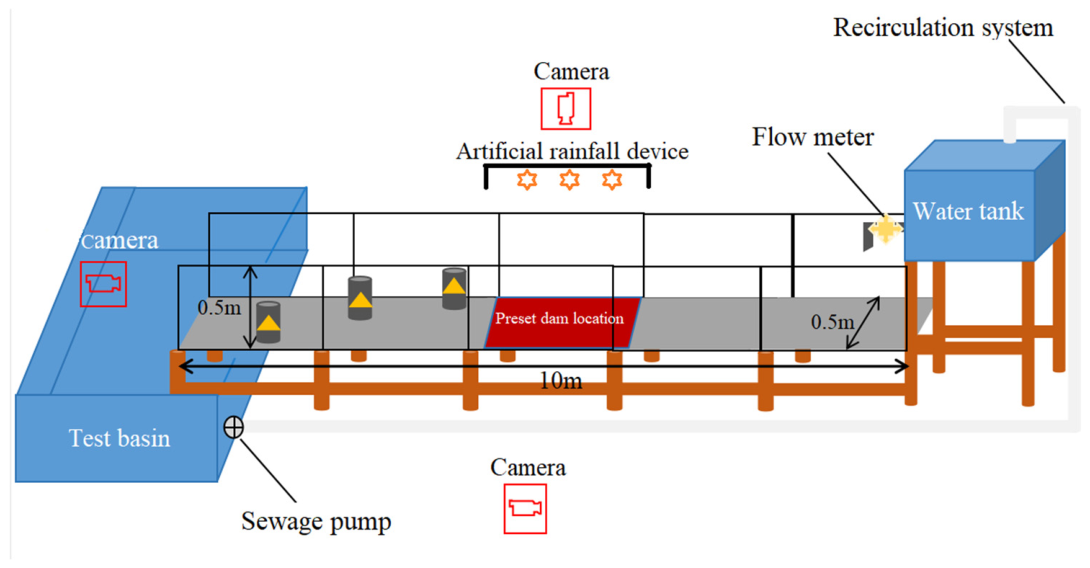
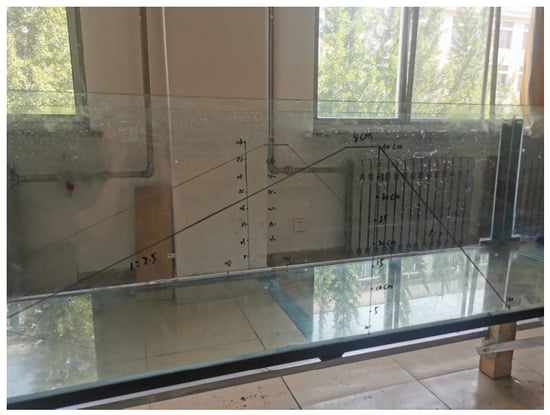
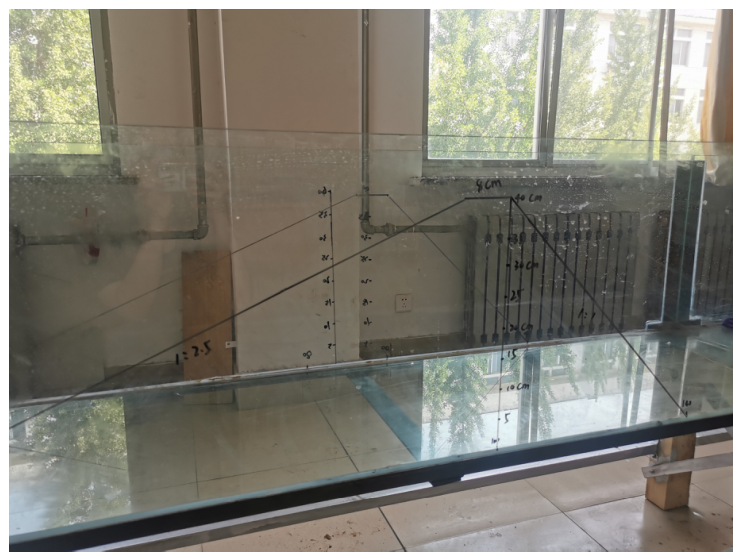
A circulating extreme-rainfall-condition dam-break flume system was designed by Shandong University of Technology. The experimental setup consists of a water storage tank, a tempered organic glass flume, a water collection tank, circulating water pumps and PVC connecting pipes. The flume is 10 m long, 0.5 m wide and 0.5 m high, assembled from five 2 m segments. Its frame is supported by a steel structure, with wooden piles elevating the lower part. A longitudinal slope of 1% is set at the flume bottom. A subsidence zone measuring 1 m in length and 0.1 m in depth is positioned 5 m from the right endpoint to simulate a mobile riverbed. A water pump placed in the downstream collection tank is connected to the upstream storage tank via PVC pipes to enable water circulation. To maintain an equal reservoir storage capacity before each test, the dam construction starting point is fixed at 2.5 m from the right endpoint, as shown in Figure 4.
Figure 4.
Circulating extreme-rainfall-condition dam-break flume test device.
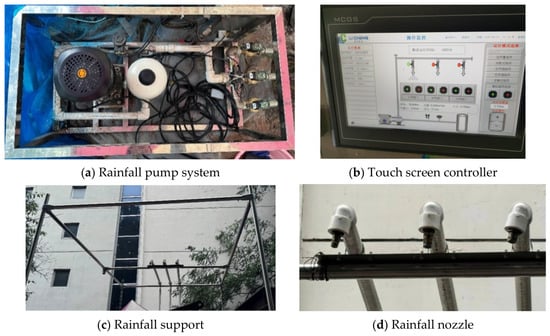
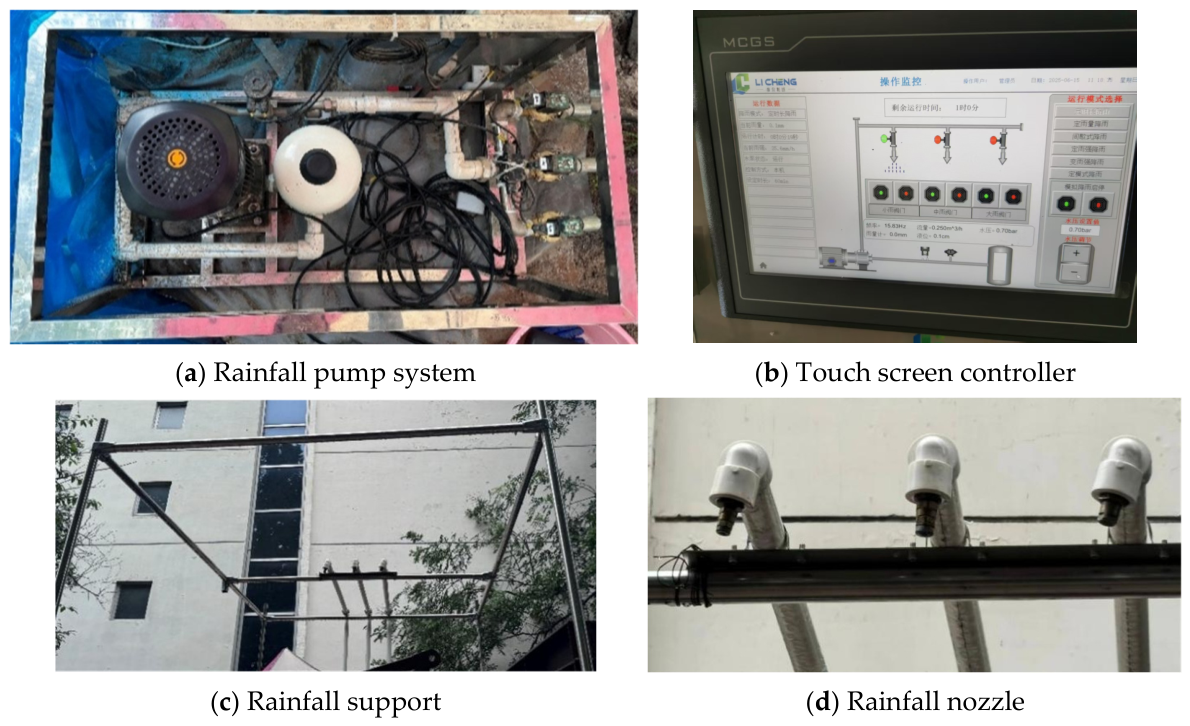
The artificial rainfall simulation system consists of rainfall pump system, touch screen controller, rainfall supports and rainfall nozzles. It can simulate rainfall events with intensities from 5.0 to 200.0 mm/h and durations up to 108 h. The rainfall intensity adjustment accuracy is 0.1 mm/h, as shown in Figure 5.
Figure 5.
Artificial rainfall simulation system.
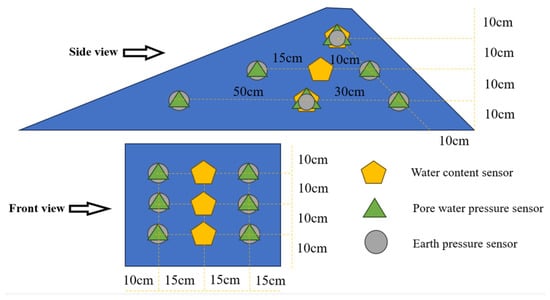
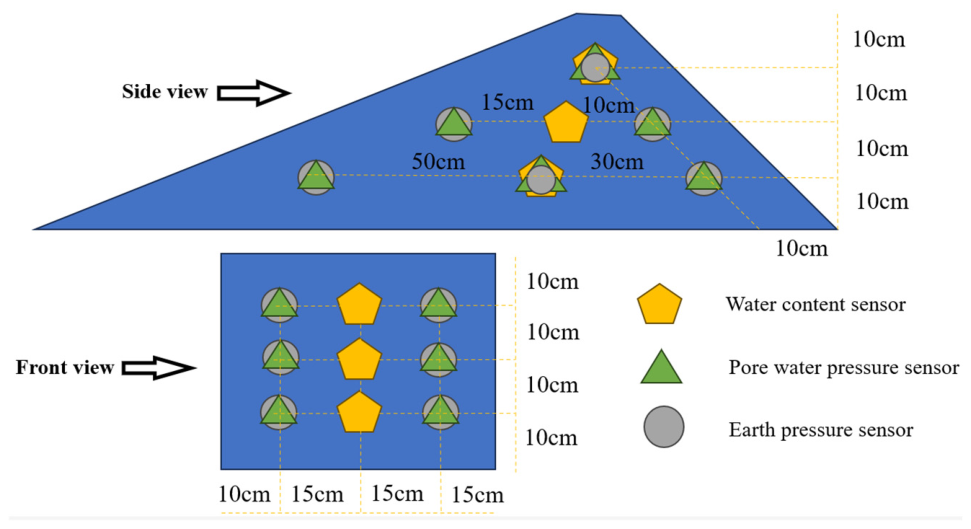
The monitoring system comprises six pore water pressure sensors, six earth pressure sensors, three volumetric water content sensors, two multichannel data acquisition devices and three cameras. These instruments synchronously capture dam surface morphology, internal water migration and stress evolution [28]. The installation positions of the sensors are shown in Figure 6.
Figure 6.
Installation positions of the sensors.
3.3. Test Materials
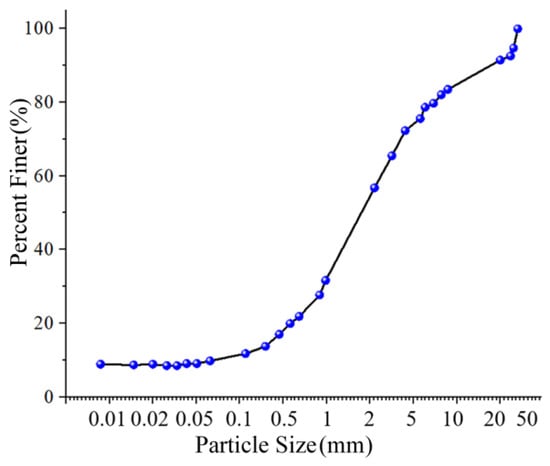
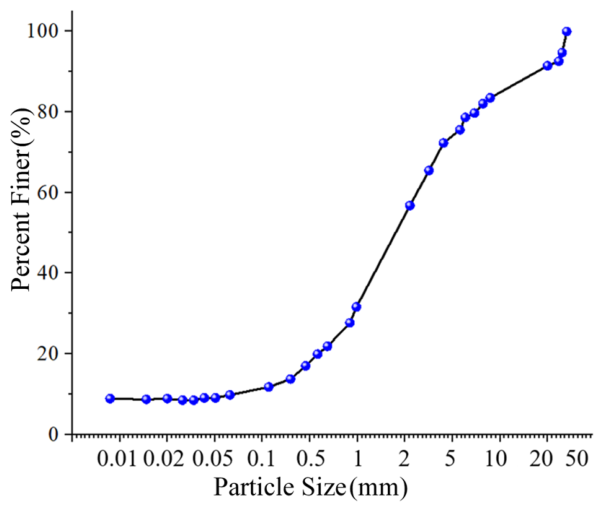
To ensure high similarity to the prototype dam, soil samples were collected from three typical locations at the Hubuling Reservoir dam as the test materials. All sampling sites were backfilled and compacted immediately after sampling. In accordance with the Code for Geotechnical Tests in Water Conservancy and Hydropower Engineering (DL/T 5355-2006), a series of geotechnical laboratory tests were carried out to obtain the physical and mechanical parameters of the test materials [29]. The physical and mechanical property results are shown in Table 3, and the particle grading curve is shown in Figure 7.
Table 3.
Physical and mechanical properties of test materials.
Figure 7.
Particle grading curve.
Material variability was assessed by calculating the standard deviation and coefficient of variation (CV) for each parameter from three sampling points. Cohesion, natural density and natural water content all exhibited values below 3%, indicating relatively uniform mechanical and physical conditions. The internal friction angle showed moderate variability (CV = 5.88%), whereas the permeability coefficient exhibited the highest variability (CV = 14.32%), which may partly account for the non-uniform spatial responses of pore water pressure and wetting front migration observed in the tests. Since all rainfall scenarios shared the same material preparation and compaction procedure, this variability does not alter the conclusion that the 2000-year rainfall produced the most adverse infiltration–overtopping response; however, it should be considered when extrapolating exact response times to other reservoirs.
3.4. Test Scheme Design
This paper conducted four groups of tests based on initial reservoir water level, rainfall duration and rainfall return period, as shown in Table 4.
Table 4.
Design of test conditions.
To facilitate a comparative mechanism analysis, the 50-year, 100-year and 2000-year return periods were selected based on engineering design relevance. The 100-year and 2000-year events correspond to the design and check flood standards of the medium-sized Hubuling Reservoir, respectively. The 50-year event, a less intense yet still extreme scenario, was introduced to examine whether infiltration softening and surface erosion alone could trigger breach initiation before the reservoir level reached the dam crest.
Based on the rainstorm intensity formula for Wulian County and the Shandong Provincial Design Rain Pattern Table, rainfall intensities for different return periods over a duration of 72 h were derived, as shown in Table 5.
Table 5.
Rainfall intensities for different return periods over a 72 h duration.
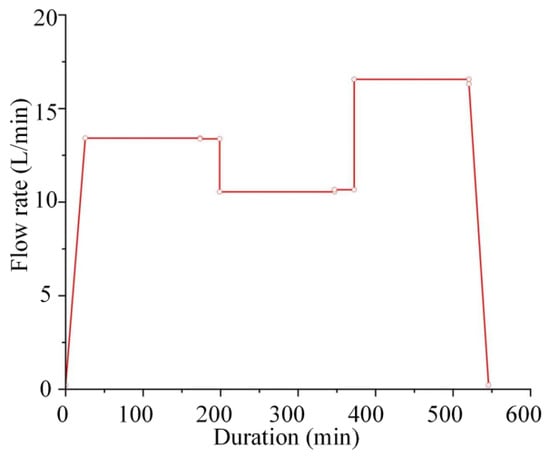
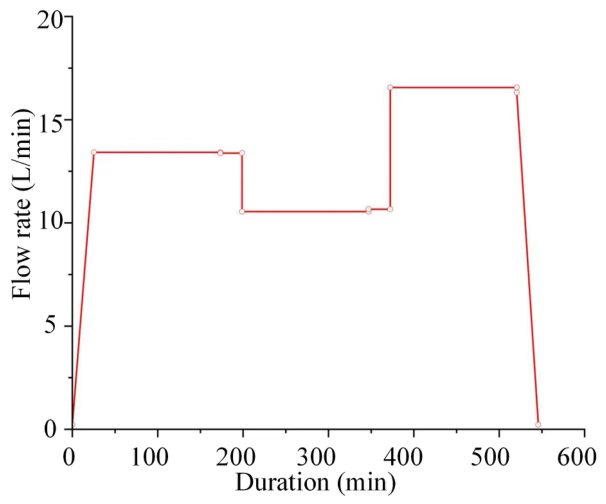
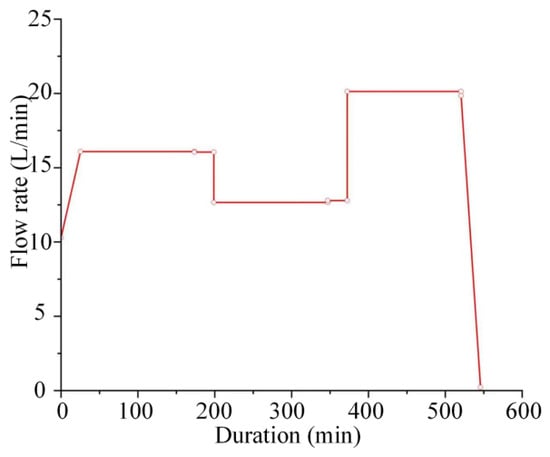
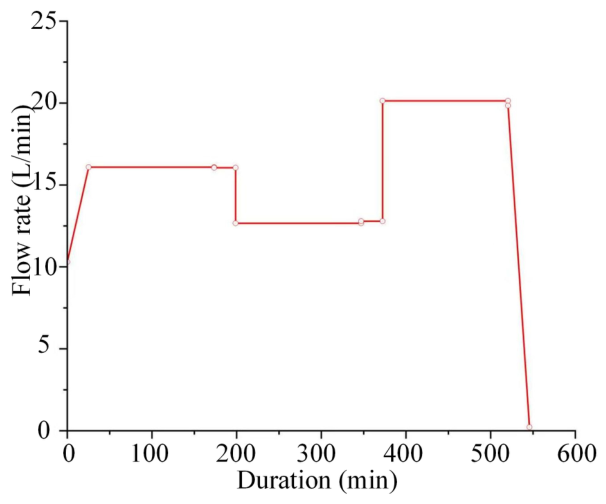
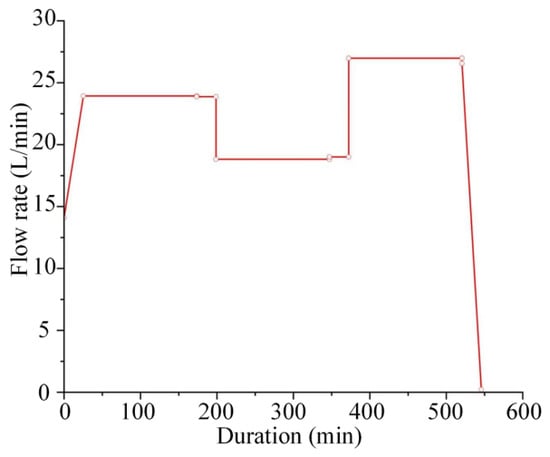
The SCS-CN model and the unit hydrograph method were applied to compute net rainfall and runoff concentration, respectively [30]. Inflow hydrographs for different rainfall return periods were then derived. Subsequently, the inflow hydrographs for the model tests were determined based on the discharge scale λQ, as shown in Figure 8, Figure 9 and Figure 10.
Figure 8.
Inflow hydrograph for a 50-year rainfall return period.
Figure 9.
Inflow hydrograph for a 100-year rainfall return period.
Figure 10.
Inflow hydrograph for a 2000-year rainfall return period.
3.5. Test Model Preparation
- (1) Test material pretreatment
Prior to testing, impurities such as concretions, grass roots, branches and particles larger than 10 mm were removed from the raw soil materials. The treated samples were then oven-dried. An appropriate amount of water was sprayed to regulate the water content to the in situ level. The prepared materials were sealed with black plastic films and placed in a cool environment for 24 h. This prevented moisture loss from direct solar radiation.
- (2) Flume pretreatment
The flume was cleaned and wiped dry with paper towels. The outline of the test model was drawn on the sidewalls and flume bottom. A 2 mm thick layer of Vaseline was applied within the outlined area. This increased interface friction and reduced the boundary effect of the flume sidewalls on the test model [31], as shown in Figure 11.
Figure 11.
Flume pretreatment.
- (3) Dam construction and compaction
The test model was prepared by layered compaction. Each layer was compacted to a thickness of 8 cm. A predetermined mass of test material was weighed based on the natural density of the soil and the geometric dimensions of the test model. The material was then compacted to 8 cm using a self-developed gravity compaction apparatus, as shown in Figure 12.
Figure 12.
Dam construction process.
- (4) Sensor embedding using the excavation and burial method
The exact embedding positions were determined according to Figure 6. After each soil layer was laid, holes of appropriate sizes were excavated at the designated positions. Following sensor embedding, the connecting wires were arranged upward along the right-side glass wall of the flume. They were then connected to the data acquisition system. The excavated holes were then promptly backfilled [32].
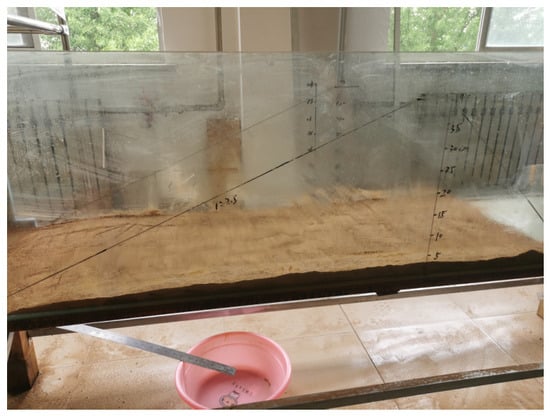
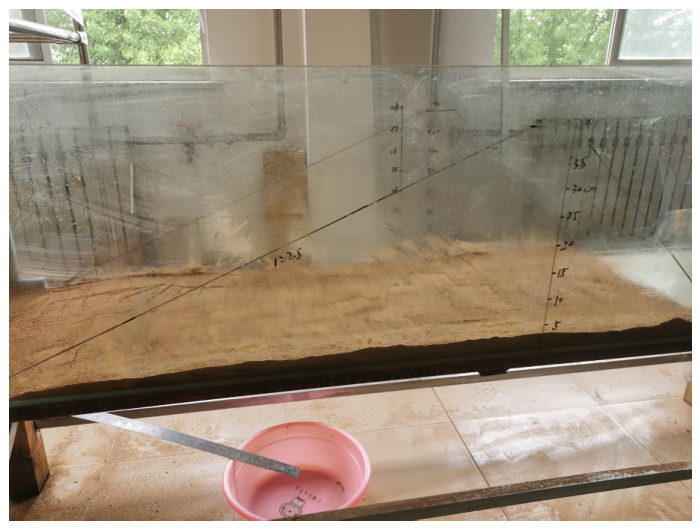
- (5) Surface roughening and curing
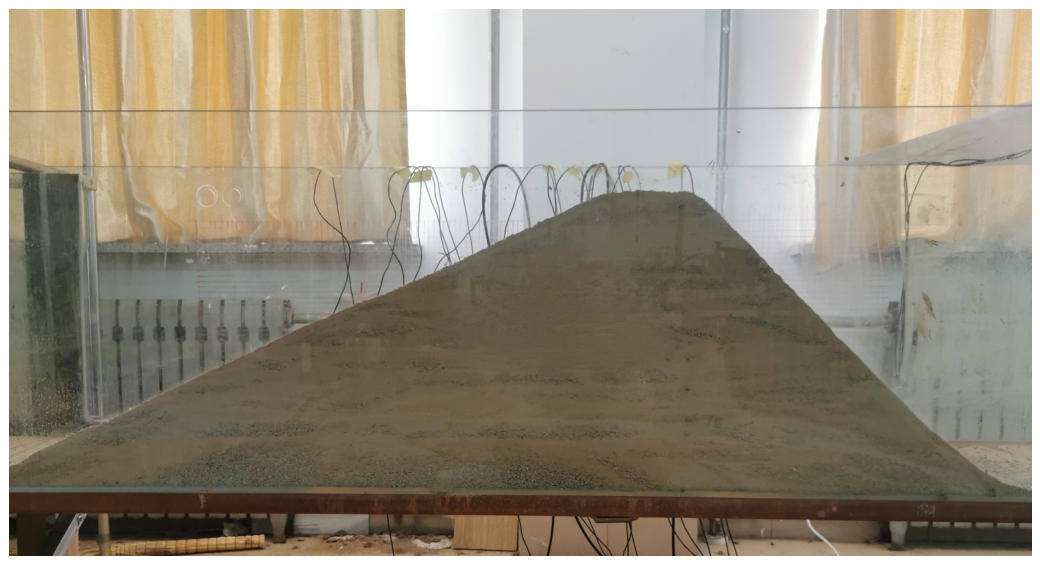
After dam construction, the dam slope was roughened according to the test model outline. This produced a smooth, uniform surface and a dam model with the specified dimensions. To prevent moisture loss, the constructed dam was covered with black plastic film. It was then allowed to cure for at least 48 h to ensure full consolidation, as shown in Figure 13.
Figure 13.
Test model after surface roughening.
4. Analysis of Test Results
4.1. Classification of Typical Stages
The influence of extreme rainfall conditions on dam stability is manifested in three aspects: infiltration softening, slope surface scour and overtopping failure. Four groups of tests were conducted sequentially as specified in Table 4 and Table 5, Figure 8, Figure 9 and Figure 10. All four groups exhibited infiltration softening. Slope surface scour occurred in Tests 2–4, but only Test 4 eventually failed, because the internal seepage weakening and external overtopping erosion reached a critical coupled state. Compared with Tests 2 and 3, Test 4 produced a combined effect of the highest rainfall intensity, rapid reservoir water-level rise, progressive infiltration-induced weakening and concentrated surface erosion. Tests 2 and 3 did not reach the dam crest nor develop sufficient flow concentration to trigger progressive breach enlargement.
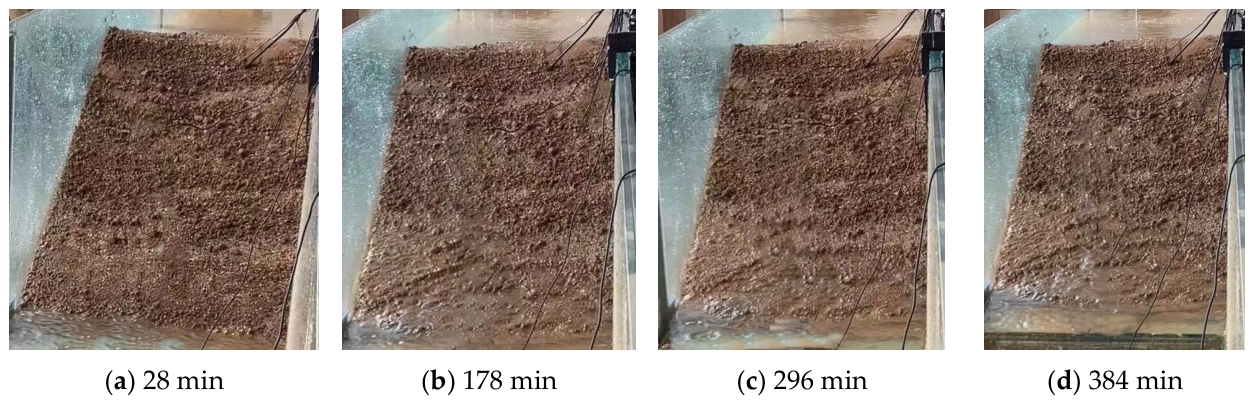
The failure process of Test 4 is divided into four stages, initial infiltration, slope surface scour, overtopping initiation and rapid breach development.
- (1) Initial infiltration (0–178 min)
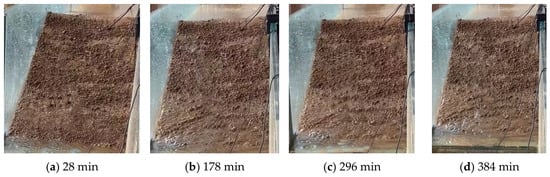
Rainfall infiltrated into the dam. No visible surface runoff was observed. The surface soil gradually darkened, indicating an increase in the water content of near-surface soil. The overall geometry of the dam remained intact. The water level rose from 20 cm to 27 cm, and most regions of the dam body remained unsaturated, as shown in Figure 14a,b.
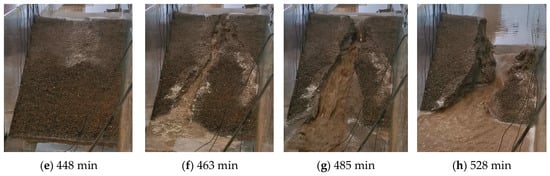
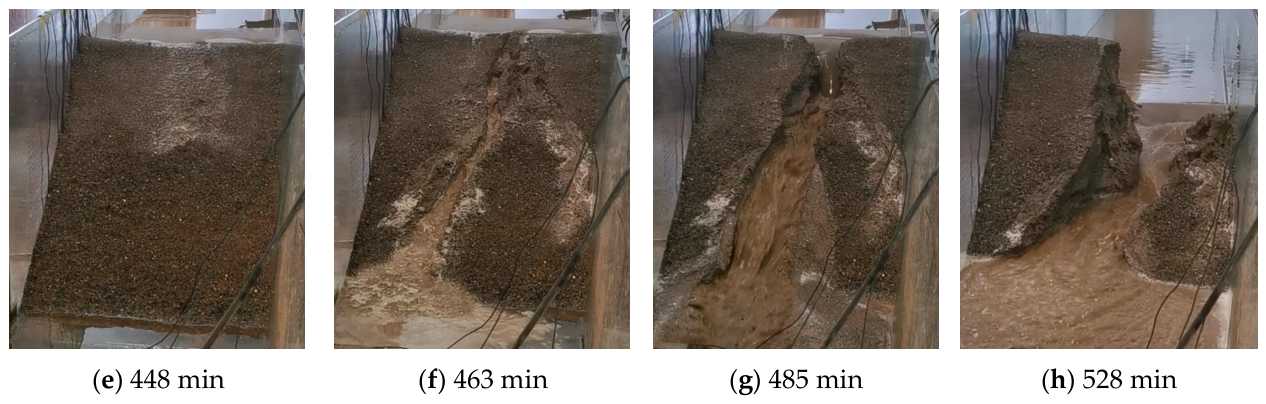
Figure 14.
Dam failure overview.
- (2) Slope surface scour (178–448 min)
During this stage, the water level rose from 27 cm to 38 cm. At 180 min, small concentrated flows appeared on the middle and lower downstream slope. At 296 min, a visible rill emerged on the downstream slope at two-thirds of the dam height below the crest. At 384 min, it had developed into a 4 cm wide and 3 cm deep V-shaped rill. The rill propagated upward via headward erosion and extended to the slope toe, where scoured deposits accumulated. The shallow dam body approached saturation, as shown in Figure 14c–e.
- (3) Overtopping initiation (448–463 min)
Water began to pass over the crest, and a thin 5 cm wide water tongue formed on the dam crest and cascaded onto the downstream slope. Small scour pits appeared on the downstream slope and eroded upward toward the crest. At 463 min, an initial breach formed on the dam crest, with a top width of 6 cm and a maximum depth of 4 cm. Meanwhile, the main erosion gully on the downstream slope deepened by 2 cm within 10 min, as shown in Figure 14f.
- (4) Rapid breach development (463–528 min)
After 463 min, the breach expanded rapidly. The water level decreased from 34 cm to 15 cm within 62 min. The breach bottom elevation dropped 11 cm between 463 min and 485 min (vertical downcutting rate of 0.5 cm/min), and a further 7 cm between 485 and 528 min (rate of 0.16 cm/min). The dam finally collapsed at 528 min. The final breach exhibited a trapezoidal cross-section, with a top width of 20 cm, a bottom width of 16 cm and a maximum depth of 22 cm, as shown in Figure 14g,h.
4.2. Breach Development Process
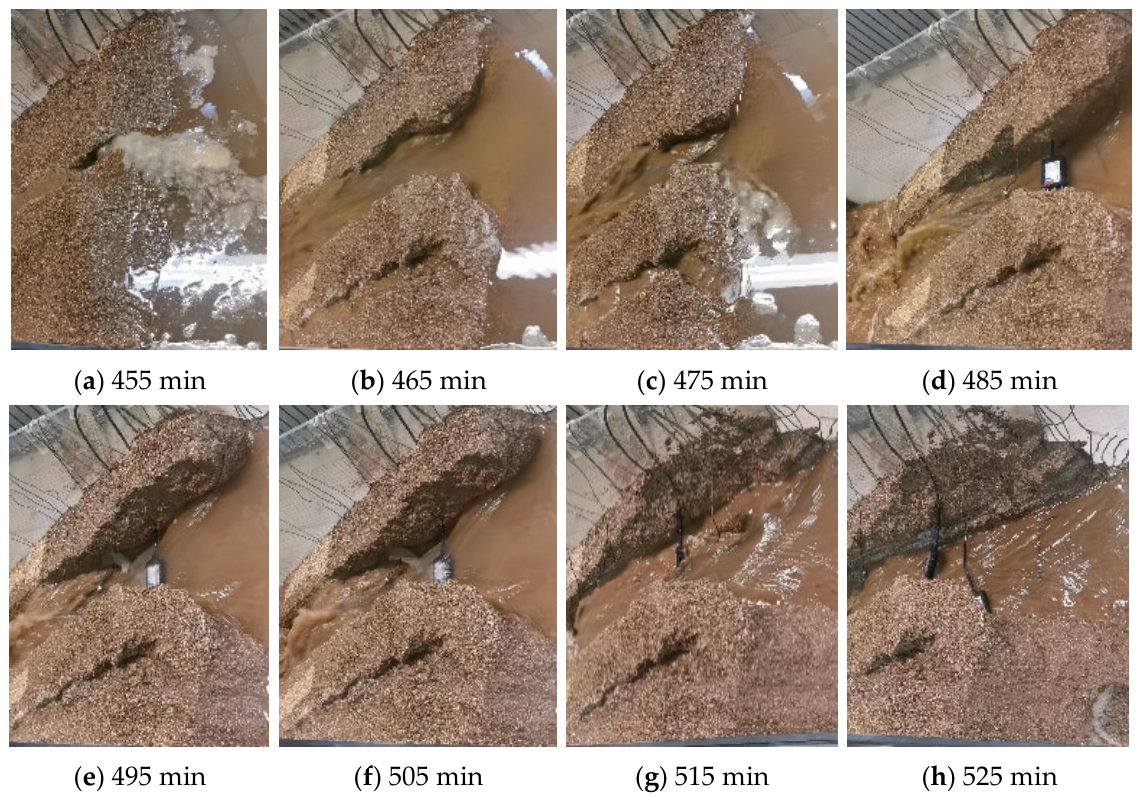
Based on the morphological evolution of the breach in Test 4, the breach development process can be divided into two stages: vertical downcutting and lateral widening.
- (1) Vertical downcutting
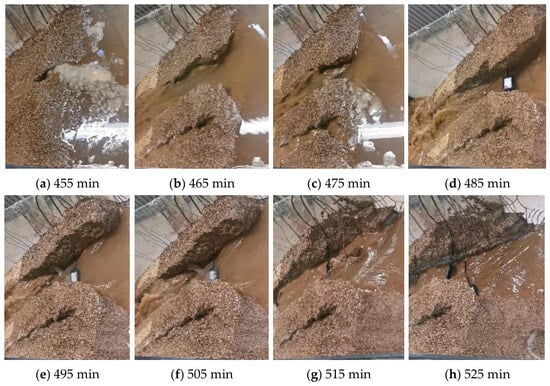
An initial breach formed at the junction of the dam crest and the downstream slope at 463 min, with a depth of 4 cm. Over the following 22 min, the breach depth increased to 15 cm (cumulative downcutting was 11 cm, and the average rate was 0.50 cm/min). The breach top width increased only marginally. The breach sidewalls locally steepened but remained generally stable, with only sporadic collapses observed, as shown in Figure 15a–d.
Figure 15.
Breach development process.
- (2) Lateral widening
After 485 min, the breach depth increased from 15 cm to 22 cm over 43 min (a total downcutting of 7 cm and an average downcutting rate of 0.16 cm/min). Meanwhile, the breach top width expanded rapidly from 8 cm to 20 cm. The breach sidewalls collapsed frequently and collapsed materials were removed by the flow. The dam body finally collapsed completely at 528 min, forming a wide breach through the dam from upstream to downstream, as shown in Figure 15e–h.
4.3. Sensor Monitoring Data
Based on the sensor data from Test 4, the assessment characteristics of pore water pressure, water content and earth pressure during the dam-break process were analyzed.
- (1) Pore water pressure
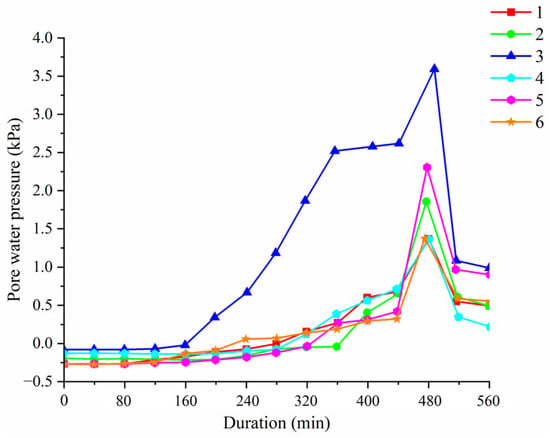
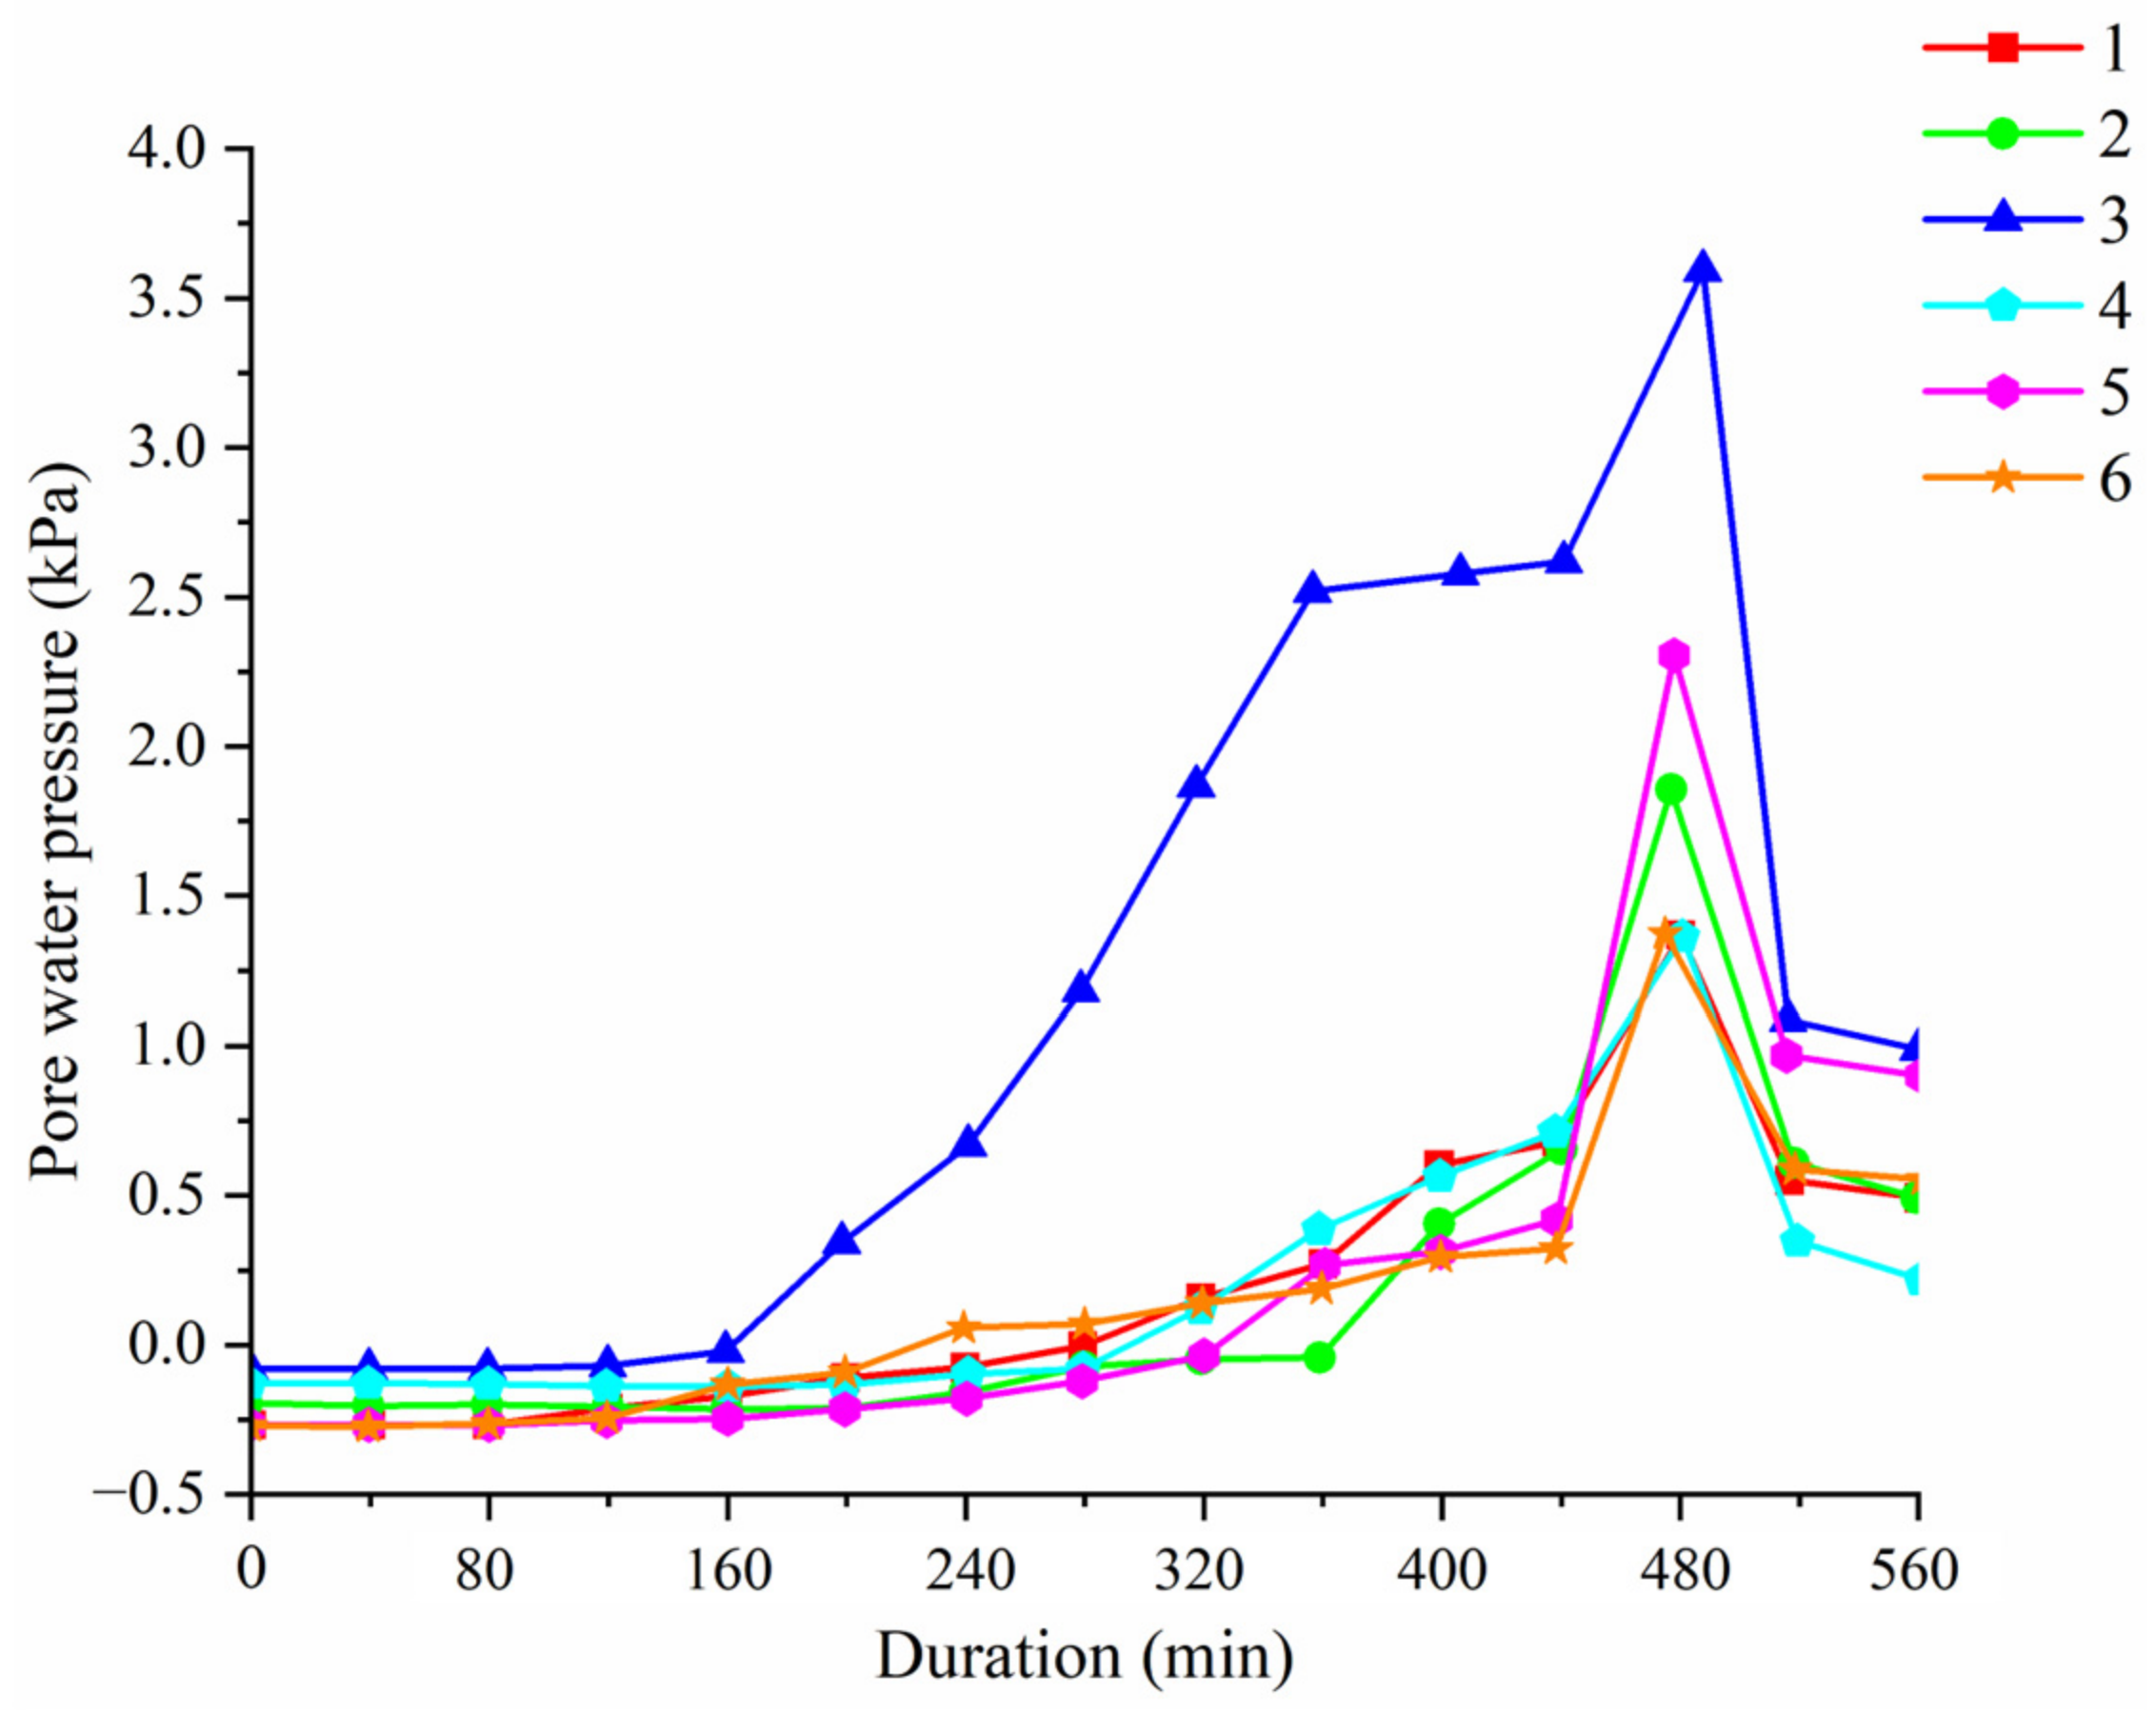
Initially, all sensor readings were negative (with values of −0.25 kPa at Point 1, −0.23 kPa at Point 2, −0.1 kPa at Point 3, −0.15 kPa at Point 4, −0.25 kPa at Point 5 and −0.25 kPa at Point 6). During infiltration, the pressure increased progressively. The pressure became positive at 178 min, 249 min, 296 min, 296 min, 353 min and 364 min for Point 3, Point 6, Point 4, Point 1, Point 5 and Point 2, respectively. After turning positive, the pressure continued to increase at a relatively fast rate, and the hydraulic gradient grew continuously. The pore water pressure at Point 3 reached 2.5 kPa at 357 min and 3.5 kPa at 458 min (an average increase rate of approximately 0.013 kPa/min during the rising phase). At 463 min, the overtopping failure occurred, and data from all sensors dropped sharply, as shown in Figure 16.
Figure 16.
Pore water pressure variation of Test 4.
The darkening of the surface soil observed before 178 min indicates shallow wetting rather than full saturation of the dam body. Full saturation requires both a substantial increase in water content and a positive pore water pressure response across a connected zone [33].
- (2) Water content
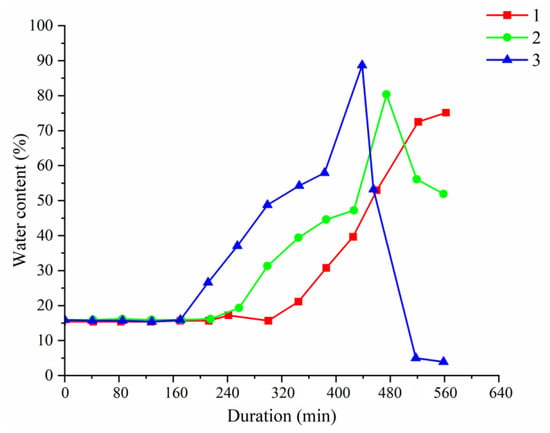
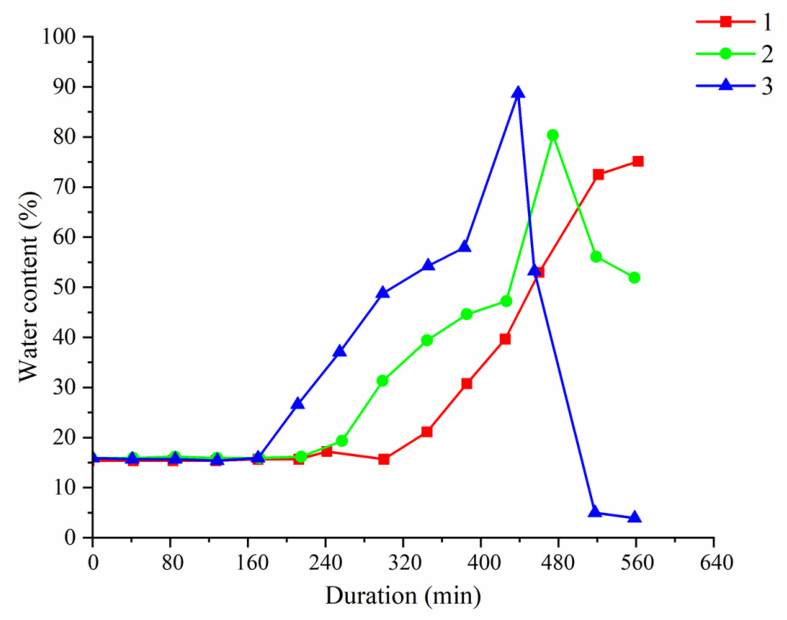
The initial water content was 16.2%. Point 3 responded first, as its water content began to increase at 168 min and peaked at 401 min. Point 2 and Point 1 responded at 268 min and 338 min, respectively. The average delay between Point 3 and Point 1 was 170 min. All sensors recorded sharp fluctuations from 457 min onward due to exposure during failure, as shown in Figure 17.
Figure 17.
Trend of water content of Test 4.
- (3) Earth pressure
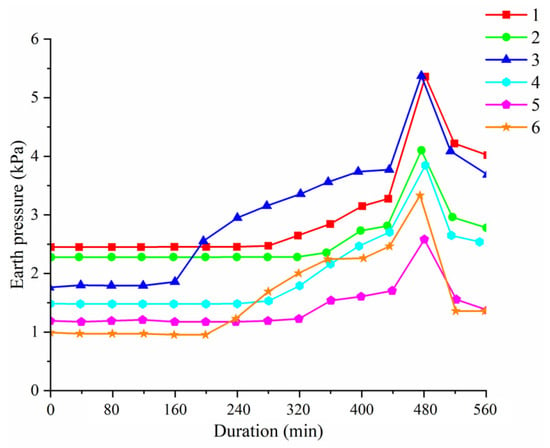
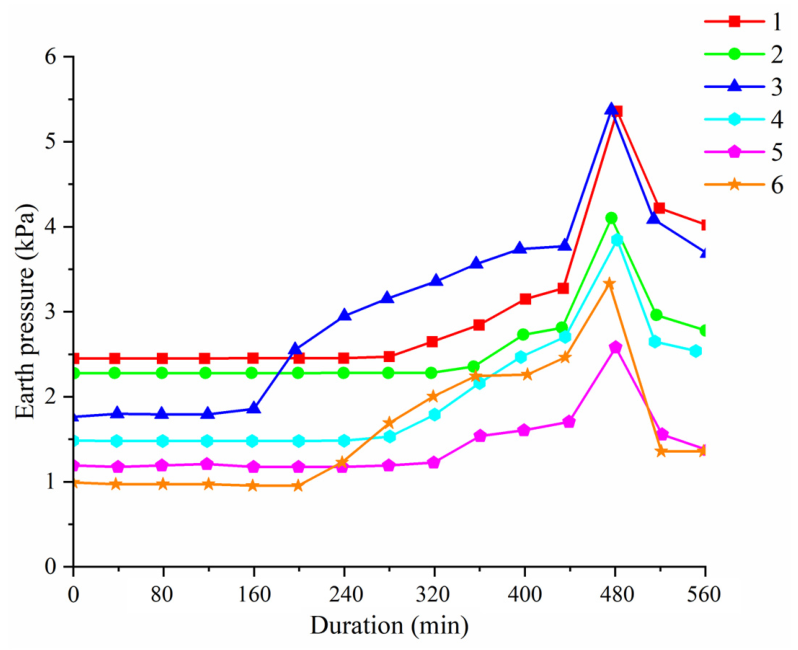
Owing to the dam self-weight, the initial earth pressures were positive: 2.5 kPa, 2.3 kPa, 1.8 kPa, 1.5 kPa, 1.2 kPa and 1.0 kPa for Point 1, Point 2, Point 3, Point 4, Point 5 and Point 6, respectively. With ongoing rainfall infiltration, the earth pressure increased gradually. The pressure began to rise rapidly at 178 min, 252 min, 309 min, 316 min, 358 min and 392 min for Point 3, Point 6, Point 1, Point 4, Point 2 and Point 5, respectively. The earth pressure reached 3.5 kPa at 375 min and 4.8 kPa at 427 min for Point 3 (a 167% increase relative to its initial value). Point 6 increased from 1.0 to 2.3 kPa (130% increase). The mid-upper dam zone (Point 3 and Point 1) exhibited greater absolute increases and higher peak values than the lower zone (Point 2 and Point 5). At 463 min, all earth pressure values dropped sharply, as shown in Figure 18.
Figure 18.
Trend in soil pressure for Test 4.
4.4. Phreatic Line Migration Process
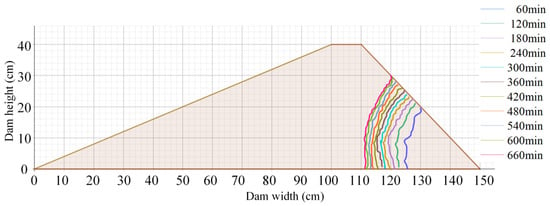
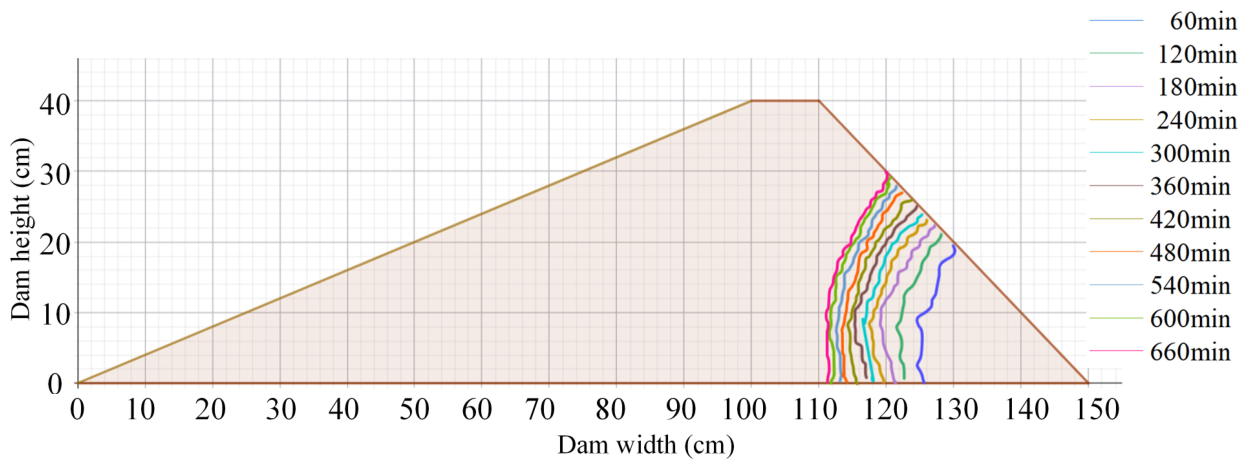
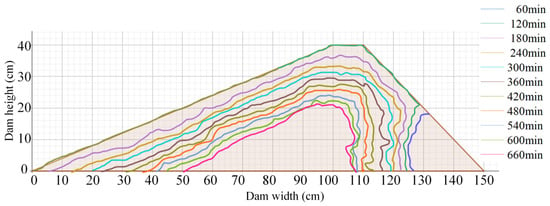
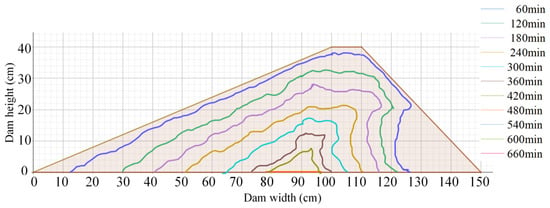
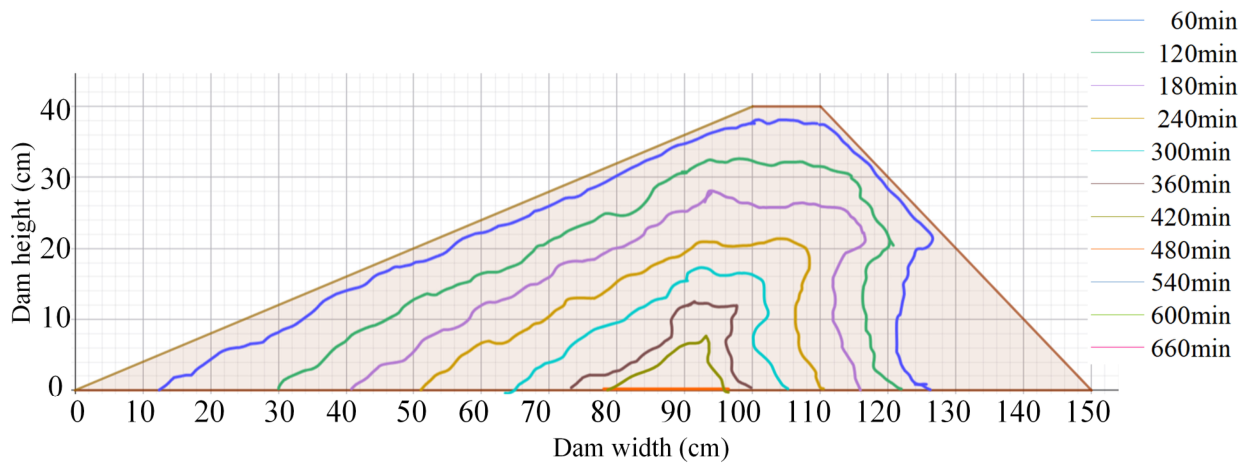
In Test 1, the dam was only affected by the initial reservoir water level (20 cm). From 0 to 120 min, the phreatic line rose slowly, and the wetting zone expanded in a fan shape upward from the slope toe. The phreatic line height reached 22 cm at 121 min and 25 cm at 243 min, after which its advancement rate decreased significantly. From 360 to 480 min, the phreatic line advanced toward the dam crest at a further reduced speed. The arc became flatter, the wet zone darkened further, and the dam crest and downstream slope stayed dry throughout the test. From 540 to 660 min, the rising rate of the phreatic line slowed further. The phreatic line did not reach the dam crest, and the downstream slope remained dry. The dam body remained entirely unsaturated, as shown in Figure 19.
Figure 19.
Phreatic line migration process of Test 1.
In Test 2–Test 4, the dam was affected by both reservoir water-level rise and direct rainfall. The wetting zone exhibited a bidirectional squeezing characteristic: from the upstream side driven by reservoir water and from the slope surface driven by rainfall infiltration. The phreatic migration rate was driven by rainfall infiltration.
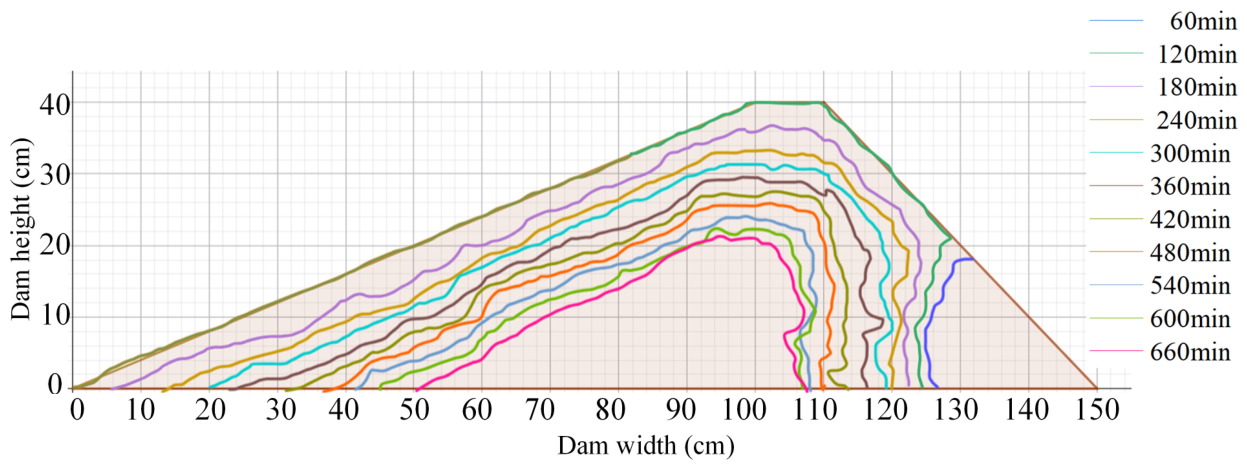
In Test 2, a distinct phreatic line appeared on the slope surface at 118 min. The soil within 10 cm of the crest darkened at 305 min. The phreatic line covered half of the dam body at 502 min (reservoir level: 31 cm). The dam did not become fully saturated, as shown in Figure 20.
Figure 20.
Phreatic line migration process of Test 2.
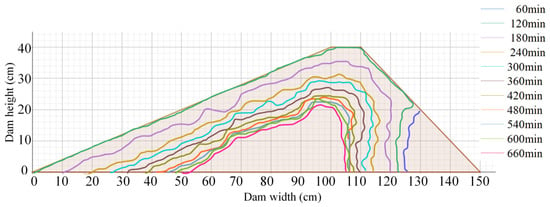
In Test 3, migration was faster: the phreatic line reached 23 cm at 114 min, and the soil within 10 cm of the crest darkened at 253 min (52 min earlier than in Test 2). It covered the upper half of the dam body at 351 min (reservoir level: 28 cm), as shown in Figure 21.
Figure 21.
Phreatic line migration process of Test 3.
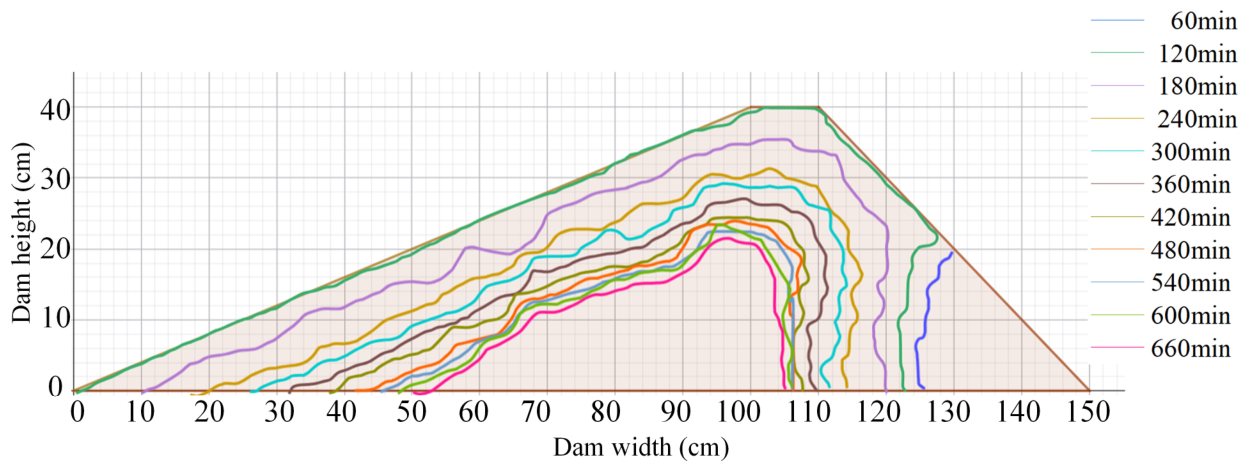
In Test 4, migration was the fastest. The phreatic line reached 22 cm at 63 min. The upper one-third of the dam body was darkened at 240 min, and the upper two-thirds at 306 min. Complete penetration of the dam body occurred at 449 min, as shown in Figure 22.
Figure 22.
Phreatic line migration process of Test 4.
4.5. Dam-Break Mechanism Analysis
Dam instability under extreme rainfall conditions is not governed by a single factor but by a progressive coupled process including water infiltration, saturation zone expansion, pore water pressure accumulation, stress redistribution, slope erosion and overtopping scour [34].
4.5.1. Synergistic Effects of Sensor Data
As shown in Table 6, multi-sensor records reveal that water content, pore water pressure and earth pressure form the transition from infiltration wetting to internal weakening. This sequence constitutes a progressive deterioration chain. Infiltration-driven advancement of the phreatic line first causes a water content increase and a matric suction decrease, gradually eroding the soil’s shear strength reserve. As a transient saturated zone develops, the pore water pressure turns positive, indicating a loss of effective stress and the onset of internal softening. Earth pressure responds with a discernible delay, reflecting stress redistribution caused by the rising soil unit weight and the altered internal load path.
Table 6.
Sensor variations at different time points.
From a spatial distribution perspective, water content reveals the advancement path of the phreatic line. Pore water pressure reflects the location and extent of the transient saturation zone. Earth pressure indicates internal load redistribution and stress-state variation caused by saturation zone expansion. The three types of sensors show that moisture and stress variations inside the dam body are non-uniform. They show spatial lag and heterogeneity. Specifically, local zones reach a critical state first and then expand gradually to surrounding areas. This non-uniform evolution features local instability prior to overall instability. It determines the progressive failure characteristic of the dam.
4.5.2. Stage-Dependent Internal Mechanisms of Dam-Break
Building on the typical stages in Section 4.1, the dam-break process can be interpreted as a sequential coupling of distinct internal and external mechanisms.
- (1) Initial infiltration stage: stability reserve started to deplete.
At this stage, vertical infiltration dominates with no surface runoff. The principal internal process is the gradual loss of matric suction, which slowly diminishes the shear strength reserve. Because internal stress fluctuates only slightly, stability degradation is governed entirely by the reduction in suction-induced strength, with no macroscopic failure evident.
- (2) Slope surface scour stage: co-development of local saturation and surface erosion.
At this stage, internal seepage weakening and external runoff erosion began to couple. Pore water content turned to positive, and the soil tends to be saturated. Internal softening facilitates scour development, while slope scour in turn enhances local infiltration and flow concentration effects. The thin-layer runoff generated on the upper slope develops a certain confluence length, leading to increased flow velocity and shear stress. At two-thirds of the slope height, the combined effects of rainfall infiltration and downward seepage reduce soil erosion resistance. Consequently, rills first appear at this location [35].
- (3) Overtopping initiation stage: internal and external driving forces reached a critical state.
At this stage, the reservoir level reaches the dam crest. Concentrated flow scours the crest. Pore water pressure exhibits a distinct peak. This reflects an abrupt increase in internal hydraulic head and intensified seepage forces. Water content approaches saturation. Earth pressure attains its maximum. These indicates that internal load and stress state approach critical limits. The dam thus simultaneously satisfies two conditions for breach initiation: internal shear strength is severely degraded, and external hydrodynamic attack becomes highly concentrated. Localized crest failure results from these converging critical states.
- (4) Rapid breach development stage: uncontrolled positive feedback among flow–erosion–collapse.
At this stage, both pore water pressure and earth pressure decreased rapidly, indicating that the dam body shifted from continuous energy storage to rapid unloading. A positive feedback mechanism developed. Breach enlargement increased discharge capacity, which further intensifies erosion and collapse and promotes additional breach expansion. This process eventually led to overall dam instability. The local soil was washed away, and sensor responses disappeared.
4.5.3. Physical Mechanisms of Progressive Dam Failure
Overtopping dam-break under extreme rainfall conditions results from the coupled assessment of internal seepage weakening and external hydrodynamic erosion. The failure evolution proceeds through the following stages: (1) infiltration reduces matric suction and advances the phreatic line, progressively depleting the internal stability reserve; (2) a transient saturated zone forms, turning pore water pressure positive, redistributing stress, and softening the soil; (3) surface runoff initiates slope erosion, which interacts with the weakened soil to create a coupled deterioration mode; (4) when the reservoir level reaches the crest, concentrated flow exploits the degraded crest to initiate a breach, with internal loads approaching their peak; and (5) breach formation triggers a positive feedback among flow concentration, vertical incision, sidewall collapse, and lateral widening, accelerating failure to complete collapse. As confirmed by multi-sensor data, this process is spatially non-uniform: local critical states develop first and expand progressively—a hallmark of the observed progressive failure. This coupled internal–external framework explains how extreme rainfall transforms a stable dam into a rapidly breaching structure [36].
5. Dam-Break Flood Risk Assessment of Hubuling Reservoir
Dam-break floods are highly destructive. The immense energy poses a serious threat to downstream areas and may cause significant casualties and property losses [37]. In this paper, HEC-RAS 6.6 and ArcGIS 10.2 were used to analyze the flood routing process after the dam failure of Hubuling Reservoir in Test 4, and a corresponding risk assessment was performed.
The reservoir area was modeled under the linear reservoir assumption and governed by the storage-capacity curve. Geometric modeling was performed in RAS mapper. The dam coordinates in the CGCS2000 projection and the DEM of the surrounding reservoir were imported. The near-dam area was represented as a storage area. The downstream potential inundation zone was discretized into 50 m × 50 m 2D flow areas. Upstream and downstream boundary lines were defined along the perimeter of the computational domain. The 2D model was further refined by generating computational points at a 30 m spacing. Manning’s roughness coefficients were assigned by land cover type, i.e., water, forest, and bare land cultivated land, and buildings and roads were 0.035, 0.012, 0.020, 0.040, 0.050 and 0.018, respectively. A 72 h inflow hydrograph with a 2000-year return period was specified at the upstream boundary. The downstream boundary was set to a normal depth, controlled by the average channel slope. The dam body and overtopping breach were defined through SA/2D Connections. Parameters included the breach centerline location, final bottom width, left and right side slopes, breach development time, weir flow coefficient, orifice flow coefficient and trigger water level. An unsteady flow computation time step of 2 s was adopted. Results were output at 1 min intervals.
5.1. Flood Routing Analysis
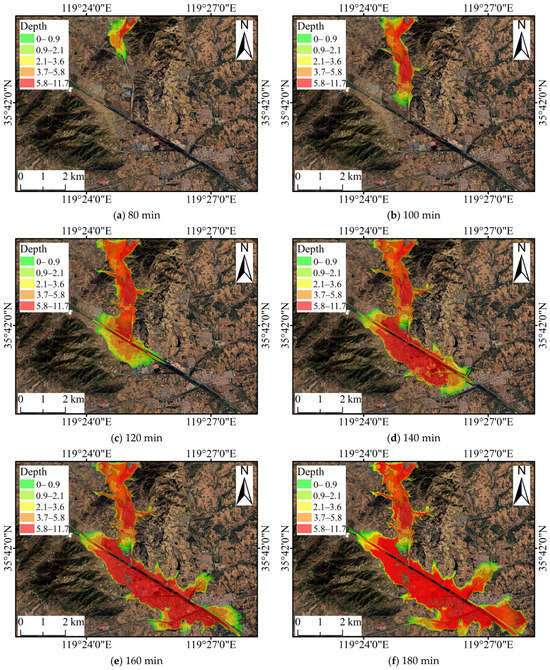
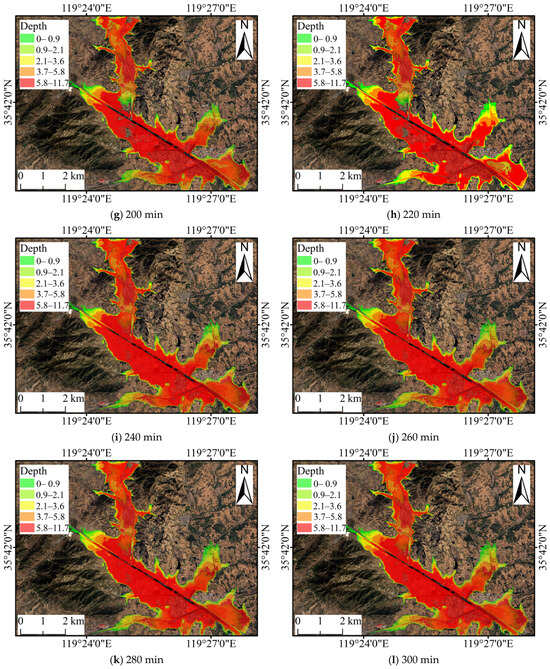
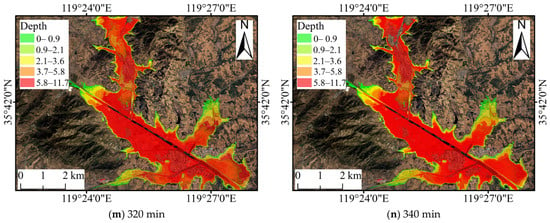
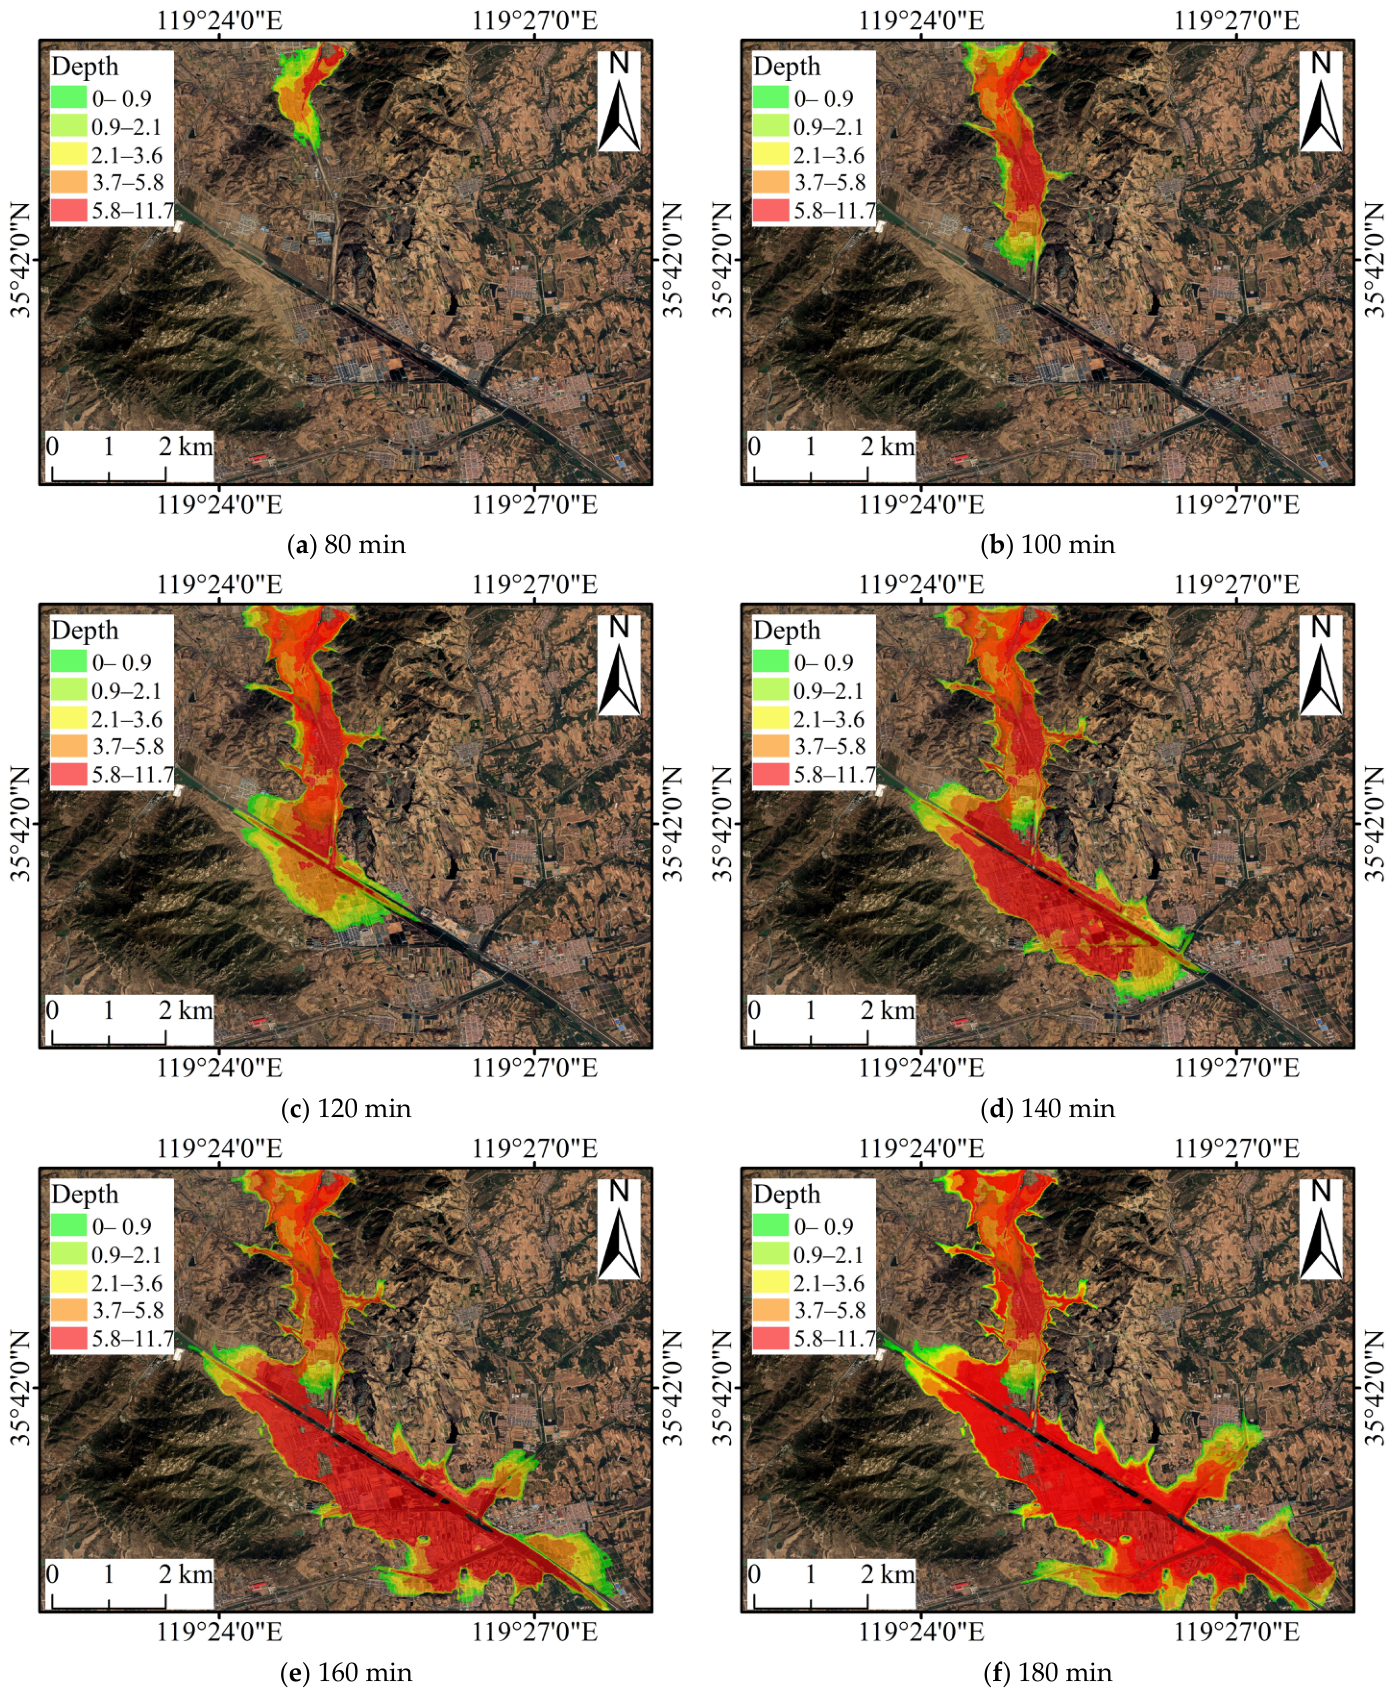
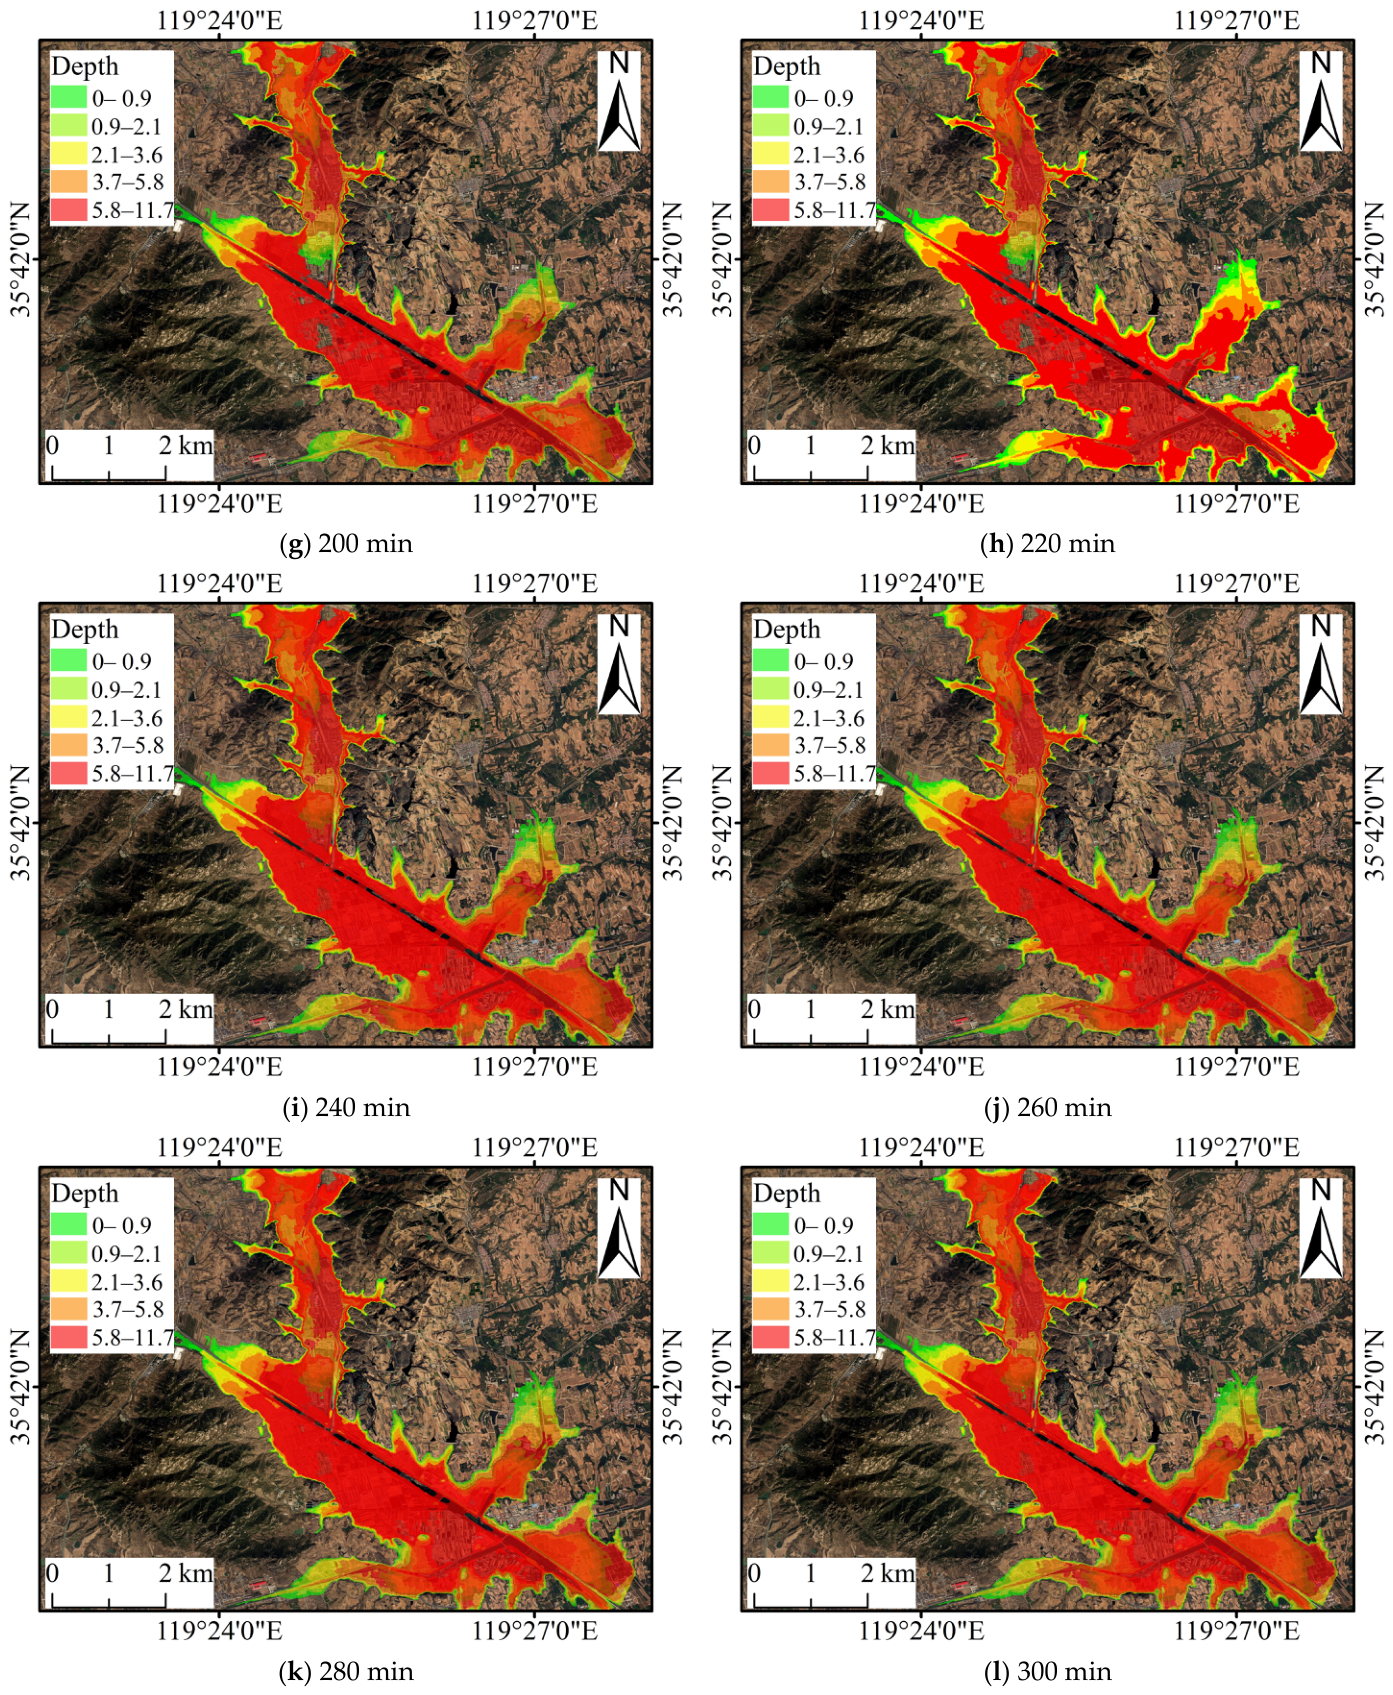
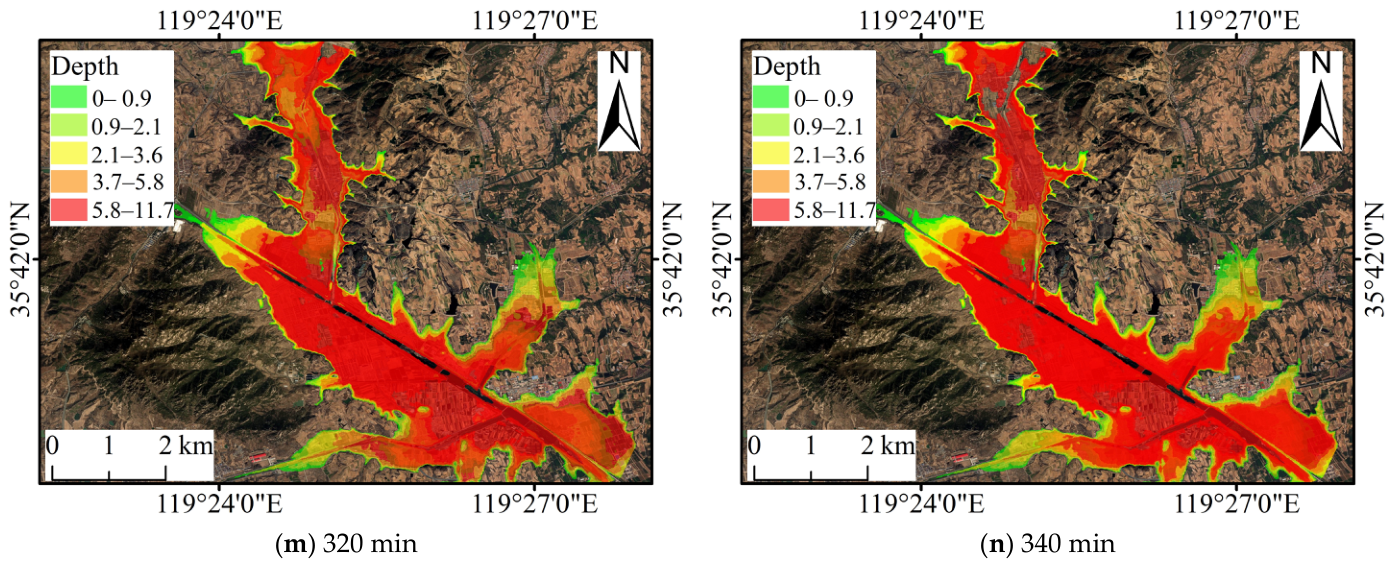
Floodwater reached the downstream area at 80 min. The inundation area peaked at 15.20 km2 at 200 min, including 11.80 km2 in Hubuling Town and 3.40 km2 in Kouguan Town. The flood inundation extents and water depths at different times are shown in Figure 23.
Figure 23.
Numerical simulation results of flood inundation area.
Based on the maximum inundation depth, the damage level was classified into five categories: slight (0–1.0 m), moderate (1.0–2.1 m), medium (2.1–3.7 m), severe (3.7–5.9 m) and extreme (5.9–11.8 m). The corresponding inundation areas were 1.84 km2, 2.44 km2, 3.64 km2, 4.24 km2 and 3.04 km2, accounting for 12.11%, 16.05%, 23.95%, 27.89% and 20.00% of the total inundation area, respectively.
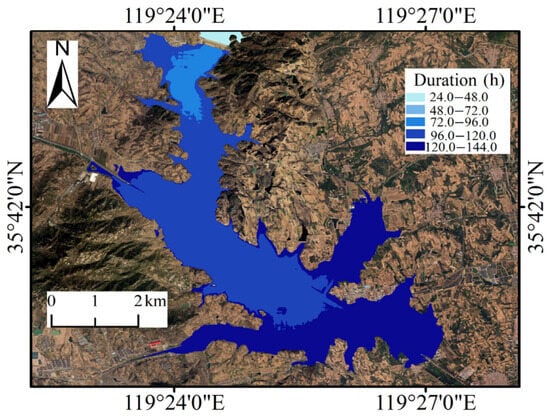
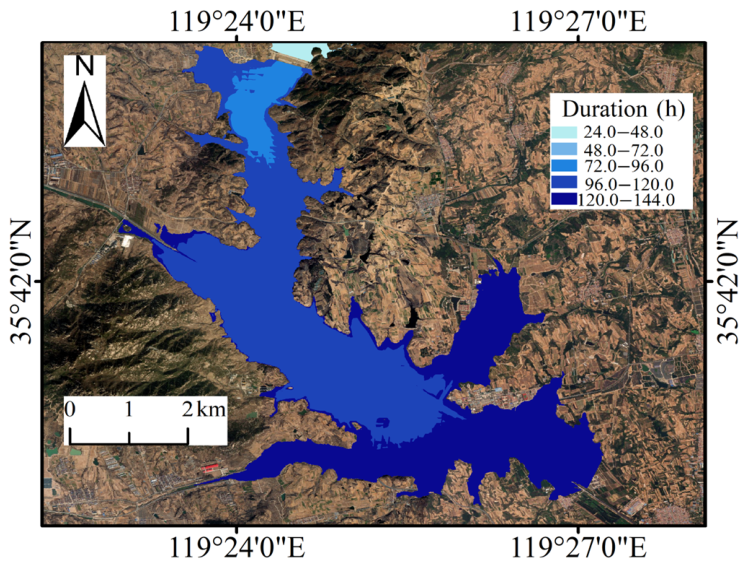
The flood inundation duration showed significant spatial variability, with a maximum of 144 h occurring in the low-lying area south of Kouguan Town, as shown in Figure 24.
Figure 24.
Flood inundation duration distribution.
The inundation duration was classified into five levels: Inundation I (24–48 h), Inundation II (48–72 h), Inundation III (72–96 h), Inundation IV (96–120 h) and Inundation V (120–144 h). The corresponding inundation areas were 1.64 km2, 4.38 km2, 2.26 km2, 5.42 km2 and 1.50 km2, accounting for 10.80%, 28.80%, 14.90%, 35.70% and 9.80% of the total inundation area, respectively.
5.2. Economic Loss Calculation
Economic losses within an inundated area are primarily governed by the maximum inundation depth and inundation duration. The area is divided into nine risk zones, as shown in Table 7.
Table 7.
Risk zone classification.
The areas of risk zones I–IX were 1.69 km2, 0.98 km2, 3.52 km2, 3.67 km2, 2.04 km2, 0.35 km2, 1.31 km2, 1.19 km2 and 0.45 km2, accounting for 11.11%, 6.45%, 23.16%, 24.14%, 13.42%, 2.31%, 8.62%, 7.83% and 2.96% of the total inundation area, respectively. Corresponding economic loss rates were further assigned to each risk zone, as shown in Table 8.
Table 8.
Assigned economic loss rates.
The loss ratios in Table 8 follow a stepwise vulnerability concept that integrates inundation depth and duration. Higher risk zones, characterized by deeper and longer inundation, are assigned proportionally larger loss ratios. This aligns with the standard flood-loss assessment framework: exposed assets are classified and assigned unit values, and relative damage ratios are linked to flood intensity indicators such as water depth and inundation duration. The loss ratios range from 10% to 90% across risk zones, reflecting the spectrum from minor to severe damage under corresponding hazard conditions. Unit prices for different land use types were derived from previous regional studies and adjusted to match the land use classification adopted in this study.
The calculated loss represents direct tangible economic loss only. Indirect losses—including traffic interruption, business suspension, emergency response, and long-term recovery—were excluded due to the lack of reliable local data. The reported value should therefore be interpreted as a conservative estimate of direct economic loss, not the total socioeconomic loss.
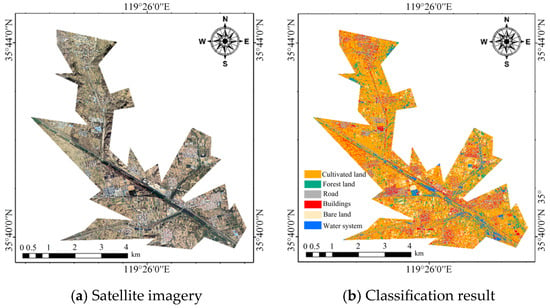
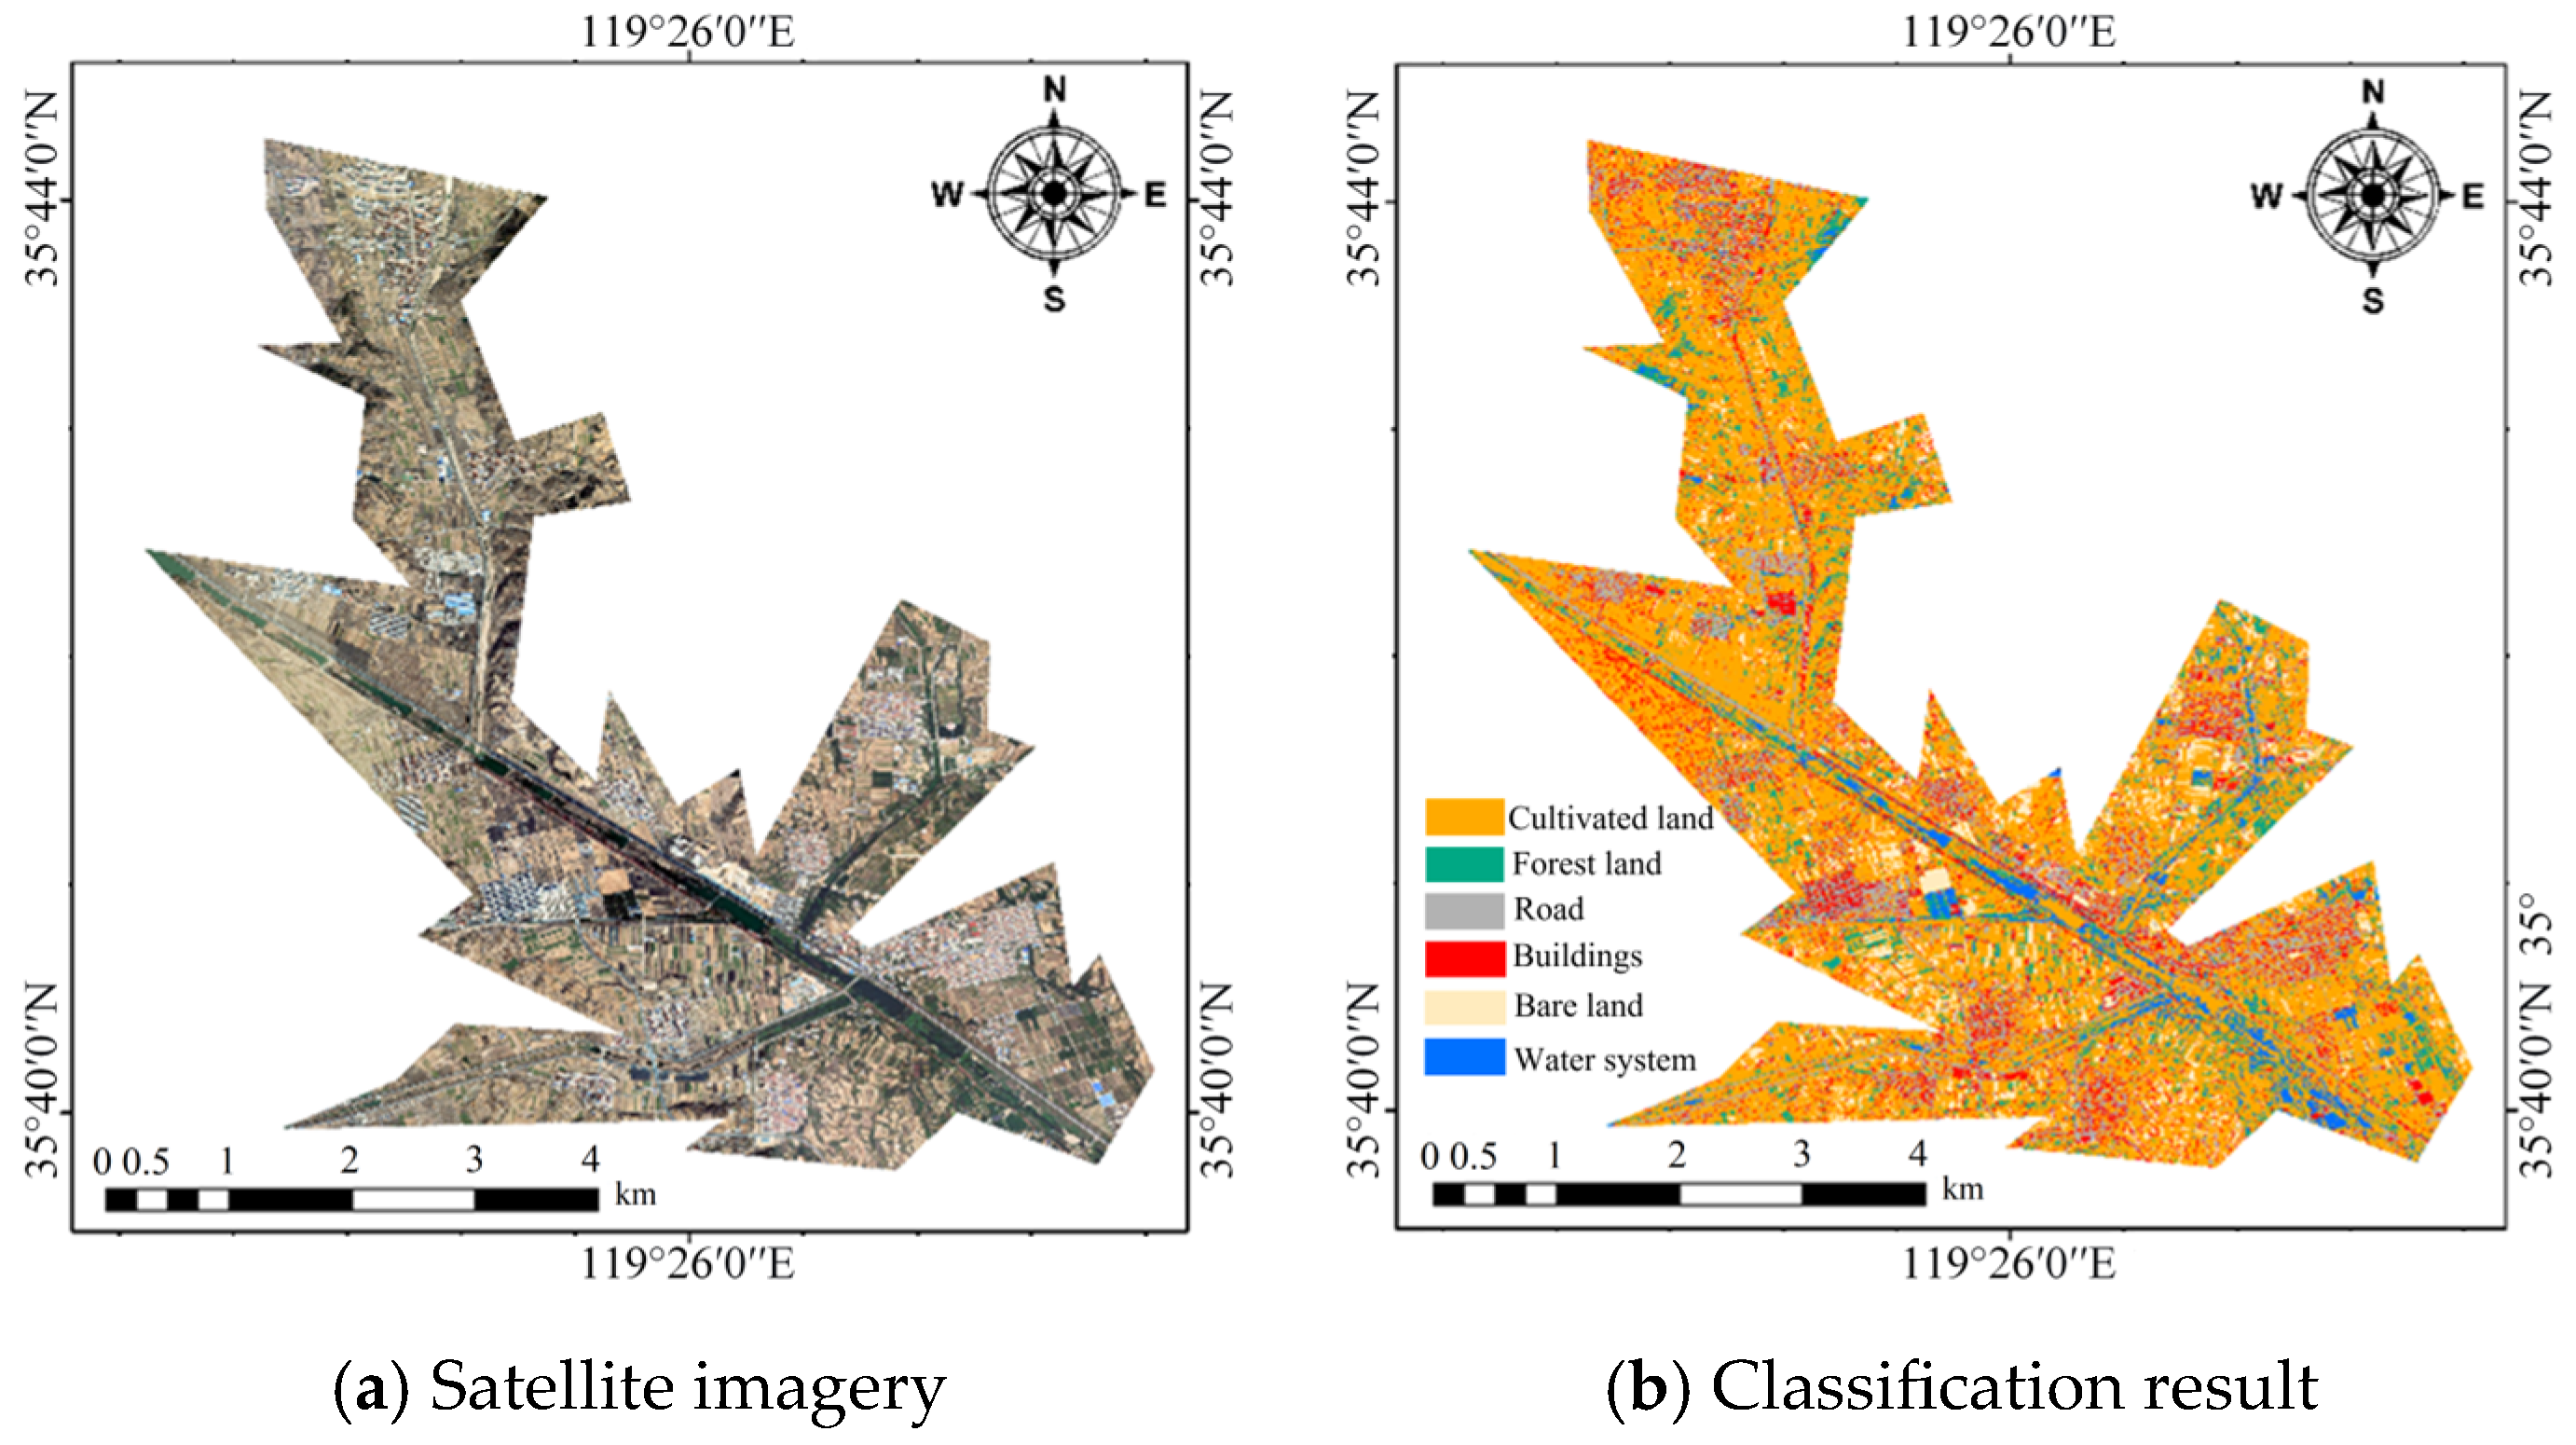
Land use type in the inundated area was classified using the maximum likelihood classifier in ArcGIS 10.2, as shown in Figure 25.
Figure 25.
Land use type classification.
Unit prices for economic loss assessment of each land use type in the inundated area were determined based on Tan et al. [38] and Ma et al. [39], as shown in Table 9.
Table 9.
Economic loss assessment unit price.
Using the inundation area, maximum inundation depth, and duration, as obtained in Section 5.1, together with socioeconomic data, the inundation risk induced by dam-break floods was quantified by calculating the expected economic loss [40], as shown in Equation (1).
where: S is the expected economic loss, Hi is the economic loss rate of risk zone i, Wj is the unit price for economic loss assessment of land use type j, and Ai,j is the area of land use type j within risk zone i.
The expected economic loss within the inundated area was calculated to be 690 million yuan. These assessment results provide a quantitative basis for decision-making in disaster prevention planning, post-disaster reconstruction, and engineering reinforcement assessment.
A first-order uncertainty assessment was conducted by uniformly perturbing the loss ratios and unit land prices by ±10%. The resulting direct economic loss ranged from approximately 621 to 759 million yuan, compared with the baseline estimate of 690 million yuan. This indicates that, while the spatial pattern of risk zones remains unchanged, the absolute loss magnitude is sensitive to the selected damage coefficients and asset unit prices.
6. Discussion
6.1. Comparative Analysis of Dam-Break Mechanism and Stage Division
Comparative tests showed that rainfall intensity controls dam-break initiation through two pathways: reservoir water-level rise and rainfall infiltration. In Test 2 and Test 3, the reservoir water level rose but did not reach the crest, and no dam-break occurred. In Test 4, the higher rainfall intensity both raised the water level to 37 cm at 448 min, and significantly accelerated pore water pressure responses within the dam body. The time when pore water pressure at Point 3, Point 6, Point 4, Point 1, Point 5 and Point 2 turned to positive was 178 min, 249 min, 296 min, 296 min, 353 min and 364 min, all earlier than the corresponding times in Test 2. These two pathways exhibited a clear temporal sequence: the positive shift in pore water pressure occurred before the water level approached the crest, and the weakening of internal strength due to rainfall infiltration precedes the overtopping threat posed by the reservoir water level.
The dual-source driving mechanism of dam-break initiation is as follows. Rainfall infiltration reduces the shear strength of the dam body in advance, while reservoir water-level rise creates the conditions for overtopping. The temporal superposition of these two factors determines whether a dam-break occurs [41]. Below a certain threshold, insufficient infiltration weakening and a water level below the crest keep the dam stable. Above the threshold, significant internal strength degradation occurs before overtopping, and once overtopping flow is formed, it triggers a positive feedback-driven dam-break process. This explains the reason why only Test 4 experienced a full-scale overtopping dam-break under the same dam material and initial water-level conditions.
Key response indicators for different test conditions are shown in Table 10.
Table 10.
Key response indicators for different test conditions.
6.2. Correspondence Between Dam-Break Stage Classification and Sensor Responses
By comparing the dam-break process with sensor data, a temporal chain of sensor responses was established. During the initial infiltration stage (0–178 min), water content increased slowly, pore water pressure remained negative, and the dam body stayed unsaturated and stable. In the slope scour stage (178–448 min), the water content rose first (Point 3 began to change at 168 min), followed by the pore water pressure turning from negative to positive (Point 3 turned positive at 178 min), indicating the formation of a transient saturation zone and the loss of matric suction. The earth pressure rise rate lagged (Point 3 accelerated at 178 min), reflecting stress redistribution caused by the expansion of the saturation zone. In the overtopping initiation stage (448–463 min), pore water pressure and earth pressure exhibited abrupt peaks, indicating a strengthened hydraulic head boundary and intensified seepage concentration under high water-level conditions. In the rapid breach development stage (463–528 min), all sensor readings dropped sharply, reflecting the transition of the dam body from stress accumulation to unloading instability.
The temporal response chain also holds true in spatial distribution. The pore water pressure at Point 3, located in the middle-upper section of the downstream slope, turned positive at 178 min, markedly earlier than Point 2 near the bottom of the dam body at 364 min. The underlying physical mechanism indicates that the middle-upper part of the downstream slope receives recharge from both rainfall infiltration and downward seepage from the crest. These findings reveal the progressive evolutionary characteristics of overtopping-induced dam failure in earth dams under extreme rainfall conditions: internal strength degradation precedes external structural failure. The spatiotemporal differences in sensor responses provide reliable quantitative indicators for dam-break early warnings.
6.3. Dam-Break Mechanism and Stage Division
Previous physical model studies have improved the understanding of overtopping-induced breaching of embankment and earthfill dams. Chinnarasri et al. [7] quantified breach development and outflow characteristics. Verma et al. [11] divided embankment breaching into initial erosion, headcut erosion and lateral erosion. The transition from rapid vertical downcutting to lateral widening observed in this study is generally consistent with these findings. However, this study further shows that overtopping failure under extreme rainfall was not caused by overtopping erosion alone. Before overtopping, the dam body had already experienced rainfall-induced wetting, pore water pressure buildup and slope-surface rill development. Therefore, overtopping acted as the final external trigger on an internally weakened dam body. The four-stage sequence identified here, including initial infiltration, slope surface scour, overtopping initiation and rapid breach development. This sequence reflects the coupling between internal seepage weakening and external hydraulic erosion. Nevertheless, this stage division was obtained from a homogeneous earthfill dam under a long-duration rainfall. Future studies should examine whether the same sequence applies to core-wall dams, riprap-protected dams and short-duration high-intensity rainfall events.
6.4. Multi-Sensor Response and Early-Warning Implication
Many previous dam-breach experiments mainly focused on breach morphology, outflow hydrographs or surface erosion characteristics. Sensor-based studies have shown the value of pore water pressure and soil moisture monitoring, but the combined interpretation of water content, pore water pressure and earth pressure during dam breaching remains limited [29,35]. In this study, the synchronous monitoring results reveal a clear internal response chain. Volumetric water content increased first, indicating wetting-front migration and matric suction reduction. Pore water pressure then shifted from negative to positive, reflecting local saturation and effective stress loss. Earth pressure increased later, indicating a saturation-induced unit-weight increase and internal stress redistribution. This sequence provides direct evidence that internal weakening developed before visible breach formation. In Test 4, the pore water pressure at Point 3 turned positive approximately 270 min before overtopping initiation, suggesting potential early-warning value. However, these responses should be regarded as process-based indicators rather than universal thresholds. Their timing depends on soil properties, model scale, rainfall pattern and reservoir water level. Future work should calibrate these indicators using prototype monitoring data and additional model tests.
6.5. Limitations and Future Perspectives
This paper focused on the overtopping-induced failure of the Hubuling Reservoir under site-specific hydrogeological and climatic conditions, and the findings regarding the failure process, flood inundation extent and economic losses are inherently limited. To improve the generalizability of the proposed framework, future research should extend it to different dam types, climatic regions and a wider range of rainfall return periods. Standardized comparative studies across multiple reservoirs would further help identify transferable patterns and establish empirical relationships that go beyond site-specific conditions.
Riprap protection primarily acts as a surface protective layer to reduce direct erosion. However, the stabilizing effect of riprap was not explicitly simulated as an independent structural layer in this paper, because it could not be simultaneously reproduced at a 1:70 geometric scale while maintaining earthfill material similarity. Therefore, the failure response of the homogeneous earthfill body was investigated under a conservative condition where surface protection was assumed locally damaged. The results should not be interpreted as a direct evaluation of riprap design performance. For reservoirs with well-maintained riprap protection, the initiation of surface erosion and overtopping breaching may be delayed, and this issue should be further examined in future tests.
7. Conclusions
This paper took Hubuling reservoir in Rizhao City, Shandong Province as a case study. A series of flume model tests were designed and conducted to reveal the progressive failure mechanism of the dam under the combined effects of rainfall infiltration and reservoir water-level rise. A two-dimensional dam-break flood routing model was developed based on HEC-RAS 6.6, and a quantitative assessment of economic losses induced by flood inundation was further performed. The main conclusions are as follows:
(1) Complete overtopping failure occurred only under the 2000-year rainfall duration. The 50-year and 100-year durations caused infiltration and surface erosion, but did not trigger full breaching. This result indicates that dam failure under extreme rainfall was not governed by overtopping alone. Rainfall infiltration first weakened the dam body. Slope runoff then formed preferential erosion paths. Overtopping flow finally accelerated breach enlargement. Compared with previous studies focused mainly on overtopping erosion, this study highlights the important pre-overtopping role of rainfall-induced internal weakening.
(2) The failure process was divided into four stages. The observed transition from rapid vertical downcutting to lateral widening is generally consistent with previous embankment overtopping experiments. It shows that external erosion was preceded by rainfall-induced wetting, pore water pressure buildup, and stress redistribution within the dam body.
(3) The multi-sensor monitoring results reveal a clear internal response chain. Volumetric water content increased first. Pore water pressure then shifted from negative to positive. Earth pressure increased later. This sequence reflects wetting-front migration, matric suction reduction, effective stress loss and internal stress redistribution. These responses can serve as process-based indicators for identifying progressive instability before visible breach formation.
(4) The HEC-RAS simulation showed that, under the 2000-year condition, the maximum inundation area reached 15.20 km2. The expected direct economic loss was approximately 690 million yuan. A first-order uncertainty assessment showed that the estimated direct loss ranged from 621 million yuan to 759 million yuan when the loss rates and unit asset values were perturbed by ±10%.
Author Contributions
Conceptualization, X.Z.; Methodology, C.Y.; Software, J.L.; Validation, T.S.; Formal analysis, X.Z.; Investigation, C.Y.; Resources, J.L.; Data curation, T.S.; Writing—original draft, X.Z.; Writing—review and editing, C.Y.; Visualization, J.L.; Supervision, T.S.; Project administration, X.Z.; Funding acquisition, C.Y. All authors have read and agreed to the published version of the manuscript.
Funding
This research was supported by the National Natural Science Foundation of China (Grant No. 51808327) and the Natural Science Foundation of Shandong Province (Grant No. ZR2019PEE016).
Data Availability Statement
The original contributions presented in this paper are included in the article. Further inquiries can be directed to the corresponding author.
Conflicts of Interest
The authors declare no conflicts of interest.
References
- Bashar, N.A.M.; Zainol, M.; Aziz, M.S.A.; Mazlan, A.Z.A.; Zawawi, M.H.; Manan, T.S.A. Comprehensive Review on Sustainable Dam Infrastructure: Issues and Challenges, Factors Causing Dam Failure and Future Direction in a Globally Changing Climate. Pertanika J. Sci. Technol. 2025, 33, 1387–1412. [Google Scholar] [CrossRef] [Scilit]
- Nasser, R.; Tzioutzios, D.; Liu, Y.L. Statistical Analysis of Global Dam Accidents in the 21st Century: A Focus on Common Features and Causes. Water Resour. Manag. 2025, 39, 6493–6516. [Google Scholar] [CrossRef] [Scilit]
- Moreno-Rodenas, A.; Mantilla-Jones, J.D.; Valero, D. Age, climate and economic disparities drive the current state of global dam safety. Nat. Water 2025, 3, 284–295. [Google Scholar] [CrossRef] [Scilit]
- Cao, J.; Chai, J.R.; Ding, W.H.; Cheng, L.; Wang, T.; Xu, P.; Cao, C.; Wen, L.J.; Bo, P.; Wang, M.Y. The mechanisms of seepage failure in the reservoir-dam systems of the Yellow River Basin: A review. Adv. Sci. Technol. Water Resour. 2025, 45, 26–35. [Google Scholar]
- Zhong, Q.; Jiang, Z.; Chen, L.; Shan, Y. A state-of-the-art review on the simulation technologies of overtopping-induced breaching process of earth-rock dams. Adv. Water Sci. 2025, 36, 1084–1096. [Google Scholar]
- Wang, Z.G.; Bowles, D.S. Three-dimensional non-cohesive earthen dam breach model. Part 2: Validation and applications. Adv. Water Resour. 2006, 29, 1490–1503. [Google Scholar] [CrossRef] [Scilit]
- Chinnarasri, C.; Jirakitlerd, S.; Wongwises, S. Embankment dam breach and its outflow characteristics. Civ. Eng. Environ. Syst. 2004, 21, 247–264. [Google Scholar] [CrossRef] [Scilit]
- Li, Y.L.; Qiu, W.; Wang, L.; Wen, L.; Bu, P. Numerical simulation for concrete-face sand-gravel dam breaching due to overtopping. Chin. J. Appl. Mech. 2023, 40, 96–106. (In Chinese) [Google Scholar]
- Shi, Z.; Zhang, G.; Peng, M.; Zhang, Q.; Zhou, Y. Experimental Investigation on the Breaching Process of Landslide Dams with Differing Materials under Different Inflow Conditions. Materials 2022, 15, 2029. [Google Scholar] [CrossRef] [Scilit] [PubMed]
- Verma, D.; Berwal, P.; Gupta, N.; Alfaisal, F.M.; Khan, M.A.; Alam, S.; Qadri, J. Experimental Investigation of Breach Mechanism for Overtopped Cohesive and Non-Cohesive Embankments. Water 2023, 15, 3030. [Google Scholar] [CrossRef] [Scilit]
- Gomes, J.M.N.; Castro, M.A.R.A.; Castillo, L.M.R.; Sánchez, M.H.; Giacomoni, M.H.; Rodrigo, C.D.P.; Paul, D.B. Spatio-temporal performance of 2d local inertial hydrodynamic models for urban drainage and dam-break applications. J. Hydrol. 2025, 665, 134661. [Google Scholar] [CrossRef] [Scilit]
- Mohamed, M.J.; Karim, I.R.; Fattah, M.Y.; Al-Ansari, N. Modelling flood wave propagation as a result of dam piping failure using 2D-HEC-RAS. Civ. Eng. J. 2023, 9, 2503–2515. [Google Scholar] [CrossRef] [Scilit]
- Eghbali, A.; Shayan, P.; Darvishi, M.; Javan, M.; Mohseni, O. Flood hydrograph analysis of tailings dam failure. Environ. Earth Sci. 2025, 84, 704. [Google Scholar] [CrossRef] [Scilit]
- Yang, M.J.; Wang, L.K. Calculation of 2D dam-break flood based on HEC-RAS. Sichuan Water Resour. 2020, 41, 83–85. (In Chinese) [Google Scholar]
- Awal, A.; Bhattarai, U.; Pandey, P.V.; Bhattarai, P.K. Downstream impacts of dam breach using HEC-RAS: A case of Budhigandaki concrete arch dam in central Nepal. Environ. Syst. Res. 2024, 13, 37. [Google Scholar] [CrossRef] [Scilit]
- Zhang, S.; Hou, W.; Yin, J.; Lin, Z. A review of research and practice on the theory and technology of reservoir dam risk assessment. Sustainability 2022, 14, 14984. [Google Scholar] [CrossRef] [Scilit]
- International Commission on Large Dams. Risk assessment in dam safety management: A reconnaissance of benefits, methods and current applications. In ICOLD Bulletins; ICOLD: Paris, France, 2005; Volume 130. [Google Scholar]
- Fu, X.; Gu, C.S.; Su, H.Z.; Qin, X.N. Risk analysis of earth-rock dam failures based on fuzzy event tree method. Int. J. Environ. Res. Public Health 2018, 15, 886. [Google Scholar] [CrossRef] [Scilit]
- Zhu, Y.; Niu, X.; Gu, C.; Dai, B.; Huang, L. A Fuzzy Clustering Logic Life Loss Risk Evaluation Model for Dam-Break Floods. Complexity 2021, 2021, 7093256. [Google Scholar] [CrossRef] [Scilit]
- Ji, Y.; Chen, A.; Li, Z.; Li, B.; Ge, W. A comprehensive evaluation of the consequences of dam failure using improved matter element analysis. Environ. Earth Sci. 2021, 80, 695. [Google Scholar] [CrossRef] [Scilit]
- Zhong, Q.; Wang, L.; Chen, S.; Chen, Z.; Shan, Y.; Zhang, Q.; Ren, Q.; Mei, S.; Jiang, J.; Hu, L.; et al. Breaches of embankment and landslide dams-State of the art review. Earth-Sci. Rev. 2021, 216, 103597. [Google Scholar] [CrossRef] [Scilit]
- Aqilah, S.S.; Karmilla, K.Z.; Tamanna, K.; Ali, Z.; Mat, N. Assessing socio-economic and environmental losses of dam-failure flood risk: A review on sustainable framework. J. Sustain. Sci. Manag. 2024, 19, 171–195. [Google Scholar]
- Zhou, X.J.; Zhu, X.H.; Li, C.J. Study on Derivation of Rainstorm Intensity Formula in Rizhao City. J. Mar. Meteorol. 2018, 38, 117–121. (In Chinese) [Google Scholar]
- Zhang, Z.B. Comparison and Selection of Reinforcement Schemes for the Control Section of Spillway of Hubuling Reservoir. Shanxi Hydrotech. 2023, 2, 9–11. (In Chinese) [Google Scholar]
- Ji, W.D.; Yu, H.; Sun, P.L.; Lu, D.; Wang, S.Q.; Lyu, X.X.; Wang, X.W. Characteristics and Influencing Factors of Non-grain Cultivated Land of Different Types of Farmers in Hilly Areas: A Case Study Based on Wulian County, Shandong Province. Shandong Land Resour. 2023, 39, 28–34. (In Chinese) [Google Scholar]
- Wan, C.F.; Fell, R. Investigation of rate of erosion of soils in embankment dams. J. Geotech. Geoenviron. Eng. 2004, 130, 373–380. [Google Scholar] [CrossRef] [Scilit]
- Hai, T.; Zeng, Z.X.; Yu, G.P.; Luo, C. Experimental and numerical investigation of the tailings flow characteristics due to dam failure: A Chinese case study. KSCE J. Civ. Eng. 2025, 29, 100253. [Google Scholar] [CrossRef] [Scilit]
- Peranić, J.; Čeh, N.; Arbanas, Ž. The use of soil moisture and pore-water pressure sensors for the interpretation of landslide behavior in small-scale physical models. Sensors 2022, 22, 7337. [Google Scholar] [CrossRef] [Scilit] [PubMed]
- Kouzehgar, K.; Hassanzadeh, Y.; Eslamian, S.; Yousefzadeh Fard, M.; Babaeian Amini, A. Physical modeling into outflow hydrographs and breach characteristics of homogeneous earthfill dams failure due to overtopping. J. Mt. Sci. 2021, 18, 462–481. [Google Scholar] [CrossRef] [Scilit]
- Awadallah, A.G.; Saad, H.; Elmoustafa, A.; Hassan, A. Reliability assessment of water structures subject to data scarcity using the SCS-CN model. Hydrol. Sci. J. 2016, 61, 696–710. [Google Scholar] [CrossRef] [Scilit]
- Wei, H.; Yu, M.; Wang, D.; Li, Y. Overtopping breaching of river levees constructed with cohesive sediments. Nat. Hazards Earth Syst. Sci. 2016, 16, 1541–1551. [Google Scholar] [CrossRef] [Scilit]
- Ma, J.X.; Wang, Y.H.; Zhang, M.Y.; Bai, X.; Liu, X. Experimental study on penetration characteristics of open pipe pile based on fiber Bragg grating sensing technology. Laser Optoelectron. Prog. 2020, 57, 130602. [Google Scholar] [CrossRef] [Scilit]
- Junghwan, K.; Yongmin, K.; Sangseom, J.; Moonhyun, H. Rainfall-induced landslides by deficit field matric suction in unsaturated soil slopes. Environ. Earth Sci. 2017, 76, 808. [Google Scholar] [CrossRef] [Scilit]
- Refaiy, A.R.; AboulAtta, N.M.; Gad, M.A.; El-Molla, D.A. Modeling the successive failure of complex dams systems: A necessity in the light of climatic shifts in extreme storms. Ain Shams Eng. J. 2024, 15, 103033. [Google Scholar] [CrossRef] [Scilit]
- Yao, C.; Lei, T.; Elliot, W.J.; McCool, D.K.; Zhao, J.; Chen, S. Critical conditions for rill initiation. Trans. ASABE 2008, 51, 107–114. [Google Scholar] [CrossRef] [Scilit]
- Gebremariam, F.T.; Tesfay, A.H.; Sigtryggsdóttir, F.G.; Goitom, H.; Lia, L. Overtopping-Induced Embankment Breaching Experiments: State-of-the-Art Review on Measurement and Instrumentation. Water 2025, 17, 1051. [Google Scholar] [CrossRef] [Scilit]
- Heidarzadeh, M.; Feizi, S. A cascading risk model for the failure of the concrete spillway of the Toddbrook dam, England during the August 2019 flooding. Int. J. Disaster Risk Reduct. 2022, 80, 103214. [Google Scholar] [CrossRef] [Scilit]
- Tan, Z.; Yin, C.; Zhang, X.; Ma, X.; Liu, X.; Li, S. Stability assessment of shallow soil landslide and activating rainfall threshold. Nat. Hazards Rev. 2024, 25, 04024004. [Google Scholar] [CrossRef] [Scilit]
- Ma, X.; Yin, C.; Li, J.; Sun, T.; Chen, J. Identification and risk assessment of potentially reactivated landslide based on FIS-YOLOv8 model. Adv. Space Res. 2026, 77, 350–370. [Google Scholar] [CrossRef] [Scilit]
- Duy, T.Q.; Shinichi, N.; Masateru, S.; Nishiyama, T. Risk of Embankment Dam Failure from Viewpoint of Hydraulic Fracturing: Statistics, Mechanism, and Measures. Rev. Agric. Sci. 2020, 8, 216–229. [Google Scholar] [CrossRef] [Scilit]
- Li, Y.; Xu, X.; Guo, S. Coupled effects of heavy rainfall and falling water-level exhibit the most significant influences on reservoir bank failures. Earth Surf. Process. Landf. 2024, 49, 3177–3188. [Google Scholar] [CrossRef] [Scilit]

Disclaimer/Publisher’s Note: The statements, opinions and data contained in all publications are solely those of the individual author(s) and contributor(s) and not of MDPI and/or the editor(s). MDPI and/or the editor(s) disclaim responsibility for any injury to people or property resulting from any ideas, methods, instructions or products referred to in the content. |
© 2026 by the authors. Licensee MDPI, Basel, Switzerland. This article is an open access article distributed under the terms and conditions of the Creative Commons Attribution (CC BY) license.