


Abstract
This study investigates how land use changes upstream and the Kamal Khan Dam have reshaped patterns of water allocation and intensified hydropolitical tensions in the Helmand/Hirmand Transboundary River Basin (HTRB). Remote sensing and deep learning techniques were employed to analyze land use changes from 2012 to 2024. After radiometric and atmospheric corrections were applied to Landsat imagery, pixel-based classification was performed using a Deep Belief Network model. Additionally, hydrological changes were analyzed using Sentinel-2 data, with attention paid to the diversion of water flows toward the Godzareh Depression. The classification results revealed considerable expansion of agricultural land downstream of the Kajaki Dam, primarily at the expense of rangeland, forest, and barren land. Moreover, sentinel imagery confirmed that, following the commissioning of the Kamal Khan Dam in 2021, systematically diverted Helmand/Hirmand hydrosystem flows toward the Godzareh Depression. Also, this study applied the painted water framework to analyze the evolution of hydropolitical dynamics in the HTRB across two critical periods, 1954–1980 and 2010–2025. The analysis revealed a fundamental transformation from green water-dominated natural flow regimes to infrastructure-controlled systems characterized by concurrent increases in both yellow water (controlled but not immediately consumed) and red water (controlled and consumed). The Kamal Khan Dam’s operationalization represents a pivotal inflection point, dramatically expanding Afghanistan’s yellow water reserves. This dual expansion of controlled water categories, empirically documented through satellite imagery, confirms the emergence of negative hydrohegemony in the basin. Consequently, Iran’s position has transitioned from a historically stable painted water class to one characterized by critical dependency.
1. Introduction
The management of transboundary water resources is inherently political and profoundly shaped by the broader geopolitical context [1]. This reality is exemplified by the concept of hydrohegemony, the dominance of a state within a shared river basin, achieved through strategies such as allocation, integration, diversion, and control of resources [2].
According to Zeitoun and Warner (2006) [2], hydrohegemony can manifest in two distinct forms. In its positive form, a hegemonic state cultivates a cooperative environment, generating benefits for all riparian countries. Conversely, negative or coercive hydrohegemony arises when the hegemonic state uses its control over water resources to impose its will and enforce an inequitable distribution of benefits. These power dynamics fundamentally shape how countries interact within shared river basins. Negative hydrohegemony can manifest through the weaponization of water, defined by Gleick (2019) as the intentional use of water resources as tools or weapons [3] that encompasses acts such as the deliberate diversion or contamination of flows, the creation of man-made floods, and other similar actions [3]. These actions, as argued by Daoudy (2020), serve as instruments for legitimization and consolidation of absolute sovereignty, where coercive water control becomes a political lever to demonstrate the hegemonic actor’s absolute power [4].
Negative hydrohegemony is evident in several international river basins. In the Jordan River Basin, for example, Israel maintains dominance through strategies of resource capture and containment, utilizing mechanisms such as the Joint Water Committee (JWC) as instruments of control rather than cooperation [5]. This has resulted in an inequitable distribution of water resources, perpetuating ongoing conflict. Similarly, in the Nile Basin, Egypt’s unilateral initiatives, such as the Toshka Project, exemplify a dominant approach that impedes development in upstream states like Ethiopia and Sudan [6]. In contrast, the Orange–Senqu River Basin in Southern Africa demonstrates positive hydrohegemony: South Africa, as the basin hegemon, has taken a leadership role by integrating benefit-sharing strategies within the SADC protocol, resulting in a more stable and equitable outcome [7]. Although the role of power is crucial for managing the uncertainties inherent in water allocation, an geographical upstream position allows significant agency to be retained, as upstream countries, through infrastructure projects such as dams, diversion, or the introduction of pollutants, can alter water flows and profoundly impact downstream communities. Turkey’s hydrohegemony in the Tigris–Euphrates Basin illustrates a prime example of how geographic position, when coupled with substantial exploitation potential and technical capacity, becomes a negative hydrohegemony tool [8].
Due to its geographical position and the presence of shared water resources, Iran maintains a complex relationship with its neighbors [9]. The Helmand/Hirmand Transboundary River Basin (HTRB), originating in Afghanistan, exemplifies this complexity [10]. The construction of dams on transboundary rivers like the HTRB has significant direct and indirect impacts on both the environment and human communities. As extensively documented, dam development and operation can profoundly alter natural and human systems, often resulting in major changes in land cover and land use [11]. While dams provide benefits such as flood control and water regulation [12,13,14], they also increase water demand and threaten ecological integrity [15,16,17].
The development of upstream dams in Afghanistan, including the Kajaki and Kamal Khan Dams, has triggered environmental and economic crises downstream, particularly in Iran’s Sistan region [18]. To manage its water resources, Iran has implemented projects such as the Chah Nimeh reservoirs, built to supply drinking water to cities like Zabol and Zahedan [19]. However, the construction of the Kamal Khan Dam, which has diverted substantial flows toward the Godzareh Depression, has disrupted water supplies for the Chah Nimeh reservoirs and intensified transboundary water disputes [20].
On the other hand, Afghanistan is among the countries with the lowest greenhouse gas emissions; data from 2018 indicate a per capita emission of 0.3 tonnes of carbon dioxide [21]. Reports show a 0.6 °C increase in Afghanistan’s average annual temperature since 1960 [22]. Droughts and climate change-induced floods have had varied impacts on Afghanistan and communities downstream of the Helmand/Hirmand hydrosystem [23]. The consequences of these changes and resulting damages, exacerbated by events such as earthquakes and floods, are expected to intensify in the future. Wetland restoration is the most important strategy for adapting to and combating climate change. The preservation and restoration of the Hamoun international wetlands are vital not only for maintaining current ecosystems but also because they are a crucial factor for the future of Afghanistan; when climate change threatens the entire ecosystem, region, and world, they will serve as a vital aquatic lifeline.
Given the uncertainty in climatic parameters and upstream activities, including the development of hydraulic infrastructure such as dams and canals that reduce inflow to Iran, a shift in perspective regarding the management of shared water resources is unavoidable. The failure of cooperation between Iran and Afghanistan in utilizing the Helmand/Hirmand hydrosystem, along with the subsequent loss of the Hamoun international wetlands, will expose both countries to more severe impacts from flow fluctuations.
Moreover, the construction of regional dams on river systems can heighten socio-economic tensions among riparian countries, potentially impacting downstream agricultural productivity [24] and vegetation dynamics [25,26]. These developments demand careful technical planning to prevent severe ecological disruption [27,28,29]. Unsustainable and uncoordinated water and land management along the Iran–Afghanistan border has contributed significantly to the desiccation of the Hamoun international wetlands [19], resulting in widespread negative impacts on local livelihoods and the broader socio-ecological system.
In the modern era, human activities have dramatically transformed the Earth’s environment [30]. Among the most prominent manifestations of these transformations are changes in land cover and land use patterns, which are primary drivers of environmental change [31,32,33,34,35]. These changes are driven by factors such as population growth [36]; urban expansion [37]; agricultural intensification [38]; and increasing demands for energy, food, and natural resources [39]. Such dynamics strongly influence soil quality, nutrient cycling, carbon stocks, biodiversity [40,41,42,43], and water quality [44,45,46,47]. Land use changes in the HTRB, coupled with worsening water scarcity, ecosystem degradation, and mounting pressure on resources, have created significant transboundary challenges [48,49]. Therefore, assessing land use dynamics in the HTRB following the operation of the Kamal Khan and Kajaki Dams, as well as addressing issues related to equitable water allocation in the basin and downstream areas, is urgently needed. Such efforts are essential to mitigate environmental and social pressures and foster transboundary cooperation.
Undoubtedly, satellite remote sensing technology, which provides integrated and synoptic data on land cover and land use across extensive geographic areas and defined time intervals, has marked a major advancement in the study and monitoring of such changes [50,51,52,53,54].
Remote sensing provides extensive, globally covered data enabling monitoring of hydrological variables across diverse climates [55]. However, processing and integrating this vast volume of data require advanced computational techniques [56]. Machine learning algorithms, such as Artificial Neural Networks (ANNs) and random forests (RFs), have improved the accuracy of hydrological variable estimations and produce more efficient results by combining remote sensing and ground-based data [57,58]. Utilizing machine learning methods, particularly time-series models and deep learning approaches, facilitates the integration of these data with other hydrological and meteorological datasets to develop more accurate predictive models [59,60,61]. Furthermore, combining remote sensing data with deep neural networks (DNNs) and complex hybrid algorithms can significantly enhance prediction accuracy and provide precise simulations under diverse climatic and hydrological conditions. Multi-source (thermal, radar, and optical) and multi-temporal (high-frequency and long-term) data will be particularly crucial in this domain.
Recent research shows that applying machine learning algorithms in remote sensing [62,63,64,65] and spatial data analyses significantly improves the accuracy and efficiency of land use and land cover change detection [66,67,68,69,70]. Machine learning models are particularly effective for simulating land use changes because they can incorporate multiple driving forces and capture both linear and nonlinear phenomena, capabilities often lacking in conventional dynamic and statistical models [71]. Algorithms such as neural networks [72], random forests [73], and support vector machines [74] enable GIS specialists to tackle complex spatial challenges, including land use classification and environmental monitoring [75]. Practical applications have demonstrated that integrating machine learning models like XGBoost, SVM, and CART with satellite imagery and GIS techniques yields superior classification accuracy [76,77,78,79,80]. Deep Belief Networks (DBNs), as advanced machine learning models, have gained increasing attention for simulating land use changes [81,82,83,84]. This study highlights the potential of integrating DBNs into remote sensing applications to simulate and monitor land use dynamics across different time scales, paving the way for more accurate and reliable systems for continuous land use monitoring. Such hybrid approaches offer substantial advantages, including speed, accuracy, and reproducibility, in the analysis of large-scale spatial datasets [85].
This study aims to evaluate land use changes and the impact of dam construction on water allocation dynamics in the Helmand River Basin, with a particular focus on monitoring the diversion of water flow from the Kamal Khan Dam toward the Godzareh Depression between 2012 and 2024. To achieve this, the research employs an integrated methodology combining remote sensing, deep learning, and Geographic Information Systems (GISs). A key innovation of this study is the development of a robust framework for monitoring transboundary basins in data-scarce environments. Another objective is to assess the applicability of the painted water concept as an analytical tool introduced by Shahbazbegian and Dinar (2023) [86] for understanding the dynamic of water negotiations in international water and for scrutinizing hydropolitical relations between Iran and Afghanistan, achieved through a retrospective analysis framework of the HTRB for the periods 1954–1980 and 2010–2025.
2. Materials and Methods
2.1. Case Study: The Helmand/Hirmand Transboundary River Basin
In the early twentieth century, significant efforts were undertaken to revitalize agricultural development in Afghanistan’s Helmand Valley. A major phase of this development began in 1937, when Japanese engineers were employed to expand irrigation infrastructure, most notably the Boghra Canal. Although these projects were interrupted by World War II, they resumed in 1946 with the Afghan government enlisting the American firm Morrison-Knudsen. This company led the construction of major projects, including dams, canals, and Kandahar Airport, until 1959. Central to these initiatives was the construction of the Kajaki Dam, a major earth-fill structure built with U.S. support in the early 1950s on the Helmand/Hirmand Transboundary River Basin (HTRB).
In terms of the span of the Helmand/Hirmand Transboundary River Basin (HTRB), approximately 82% of it lies in Afghanistan, 15% lies in Iran, and 3% lies in Pakistan, between 59–69° E longitude and 29–34° N latitude [87]. The basin’s hydrology is shaped by two major dams: the Kajaki Dam in northern Afghanistan and the Kamal Khan Dam near the Iran–Afghanistan border. The Kajaki Dam, which is located approximately 115 miles west-northwest of Kandahar [88], was designed to enhance hydropower generation and facilitate water transfer. Prior to the construction of the Kamal Khan Dam, the HTRB followed its historical-natural course toward the Sistan Plain. The river would eventually overflow into the Hamoun international wetlands, which straddle the border between Iran and Afghanistan [89]. Historically, large floods often filled the Hamoun international wetlands in Iran, with excess water spilling into the Godzareh Depression through the Shile River [90]. The Kamal Khan Dam is situated 18 km from Chahar Borjak and 95 km from Zaranj, as a diversion structure with a height of 20 m and a length of approximately 2 km, diverting a significant portion of the Helmand/Hirmand hydrosystem flow to the Godzareh Depression, directly impacting water availability in Iran’s Sistan region [91]. Construction of this dam, which had been halted for decades due to internal security issues in Afghanistan, resumed in phases: the first phase began in 2011, the second commenced in 2012 and was completed by early 2015, and the third phase encountered security-related delays but ultimately resumed in 2017, leading to the dam’s commissioning in 2021 [92]. In recent years, the dam’s operation has diverted HTRB flows from their traditional path; instead, the water is redirected toward the Godzareh Depression [89]. This diversion has significantly reduced water availability for Iran’s Sistan region, impacting downstream ecosystems and transboundary water allocation [93].
The case study area is defined by the spatial extent of the HTRB and the direct influence zones of the Kajaki and Kamal Khan Dams (Figure 1). The focus of the research is on quantifying land use changes and hydrological shifts resulting from dam operations, using satellite imagery and machine learning to monitor the environmental and hydropolitical consequences.
Figure 1.
Location of the study site within its broader geographic context.
2.2. The Six-Phase Data Analysis Framework
This study was conducted through six primary stages, each designed to ensure comprehensive analysis.
- Satellite Data Acquisition and Preprocessing
Landsat 8 and 9 OLI/TIRS images for 2020 and 2024, along with Landsat TM/ETM+ imagery for 2012, were sourced from the USGS EarthExplorer database (Table 1). These timeframes were selected to coincide with key phases in the development and operation of the Kajaki and Kamal Khan Dams. To enhance spectral data quality and minimize atmospheric effects, radiometric and atmospheric corrections were applied, converting digital numbers into surface reflectance values [94,95,96].
Table 1.
Input variables and data sources for monitoring land use and hydrological changes.
- Training Data Collection
Training samples for major land use categories, including urban, agricultural, rangeland, forest, water bodies, and barren land, were identified using visual interpretation and high-resolution imagery available via Google Earth [97,98,99].
- Deep Belief Network (DBN) for Image Classification
A DBN model was implemented in R to classify land use from satellite imagery [100]. The model used spectral bands as inputs and produced pixel-level land use classification maps as outputs. DBNs are especially effective for land use classification due to their capacity to integrate both unsupervised and supervised learning, enabling automatic extraction of spectral and spatial features from imagery. These models typically yield higher accuracy than conventional techniques like support vector machines (SVMs) [101,102]. Moreover, combining DBNs with preprocessing techniques such as Gabor filtering and advanced optimization algorithms can further enhance classification accuracy [81].
- Model Accuracy Assessment
The accuracy and performance of the classification model were evaluated using a confusion matrix, which provided both overall and class-specific accuracy metrics, thereby validating the thematic map results [103]. Additional metrics, precision, recall, and F1-score, were calculated for each class [104,105,106,107]. Receiver Operating Characteristic (ROC) curves were also plotted, and the Area Under the Curve (AUC) was computed for each class to summarize the model’s discriminatory power, with higher AUC values indicating better performance [108,109,110,111]. All analyses were conducted using R.
- Land Use Change Detection
Land use changes were assessed by comparing classification outputs for the periods 2012–2020 and 2020–2024, and a heatmap was created in R to visually represent the rates of land use change, highlighting both rapidly transforming and relatively stable areas. To monitor hydrological changes and track the diversion of water toward the Godzareh Depression, Sentinel-2 satellite imagery from the European Space Agency (ESA) for 2020, 2022, and 2024 was also employed (Table 1). These images underwent geometric and atmospheric corrections to ensure consistency across time. The processed maps clearly demonstrated that, following the commissioning of the dam, most river flow was diverted toward the Godzareh Depression, resulting in substantial reductions in downstream flow into Iran.
- The Painted Water Concept: A Framework for Transboundary River Basin Analysis
The painted water concept offers an innovative hydropolitical framework for analyzing transboundary river basins. This approach classifies water based on hydrological characteristics, manageability, and its role in human activities, allowing for a nuanced understanding of the hydropolitical dynamics between countries sharing water resources.
Based on the methodology outlined Shahbazbegian and Dinar (2023) [86], the calculation of painted water in a transboundary basin explicitly integrates both human and environmental factors, though certain hydrological details are omitted due to the scenario-based nature of the analysis. The model accounts for human activities through variables such as water capture capacity (WCC), which is determined by financial investments in dams and infrastructure, as well as upstream water demand (UWD) driven by socio-economic development. However, finer environmental processes like rainfall–runoff dynamics, evaporation, or seasonal hydrological variability are not explicitly modeled at a granular level. Instead, natural discharge (ND) is treated as an exogenous input often held constant based on long-term averages, and climate-related uncertainties are explored through sensitivity analysis rather than a detailed hydrological simulation. This simplification allows the model to focus on the hydropolitical allocation and negotiability of water, but it acknowledges that incorporating more detailed hydrological models would improve accuracy, especially under climate change scenarios.
Regarding the painted water concept, it is important to distinguish it from other color-coded water classifications such as water footprint, green/blue/grey water, and virtual water. While green/blue/grey water refers to water sources and quality (e.g., soil moisture, surface water, and polluted water), and virtual water and water footprint focus on embedded water in products and consumption patterns, painted water is uniquely hydropolitical and negotiation-oriented. It classifies water not by its physical state or use but by its negotiability and controllability in transboundary settings:
- Green Water: Uncapturable flow, automatically available to downstream states.
- Yellow Water: Capturable but not consumed, serving as a basis for negotiation.
- Red Water: Captured and consumed, negotiable.
Thus, painted water complements existing frameworks by introducing a strategic, decision-centric lens tailored to water diplomacy and conflict resolution, rather than hydrology or resource accounting alone. This makes it a novel tool for analyzing upstream–downstream power dynamics, negotiation strategies, and hydropolitical risk in shared basins.
To assess the utility of the painted water framework for analyzing hydropolitical relations between Iran and Afghanistan, this study adopts a retrospective approach, applying the concept to the Helmand/Hirmand Transboundary River Basin (HTRB) for two periods: 1954–1980 and 2010–2025. Calculations for painted water components follow established equations: total available water (AW) is the sum of natural discharge (ND) and tributary inflows; green water is the surplus water exceeding the upstream state’s capture capacity; yellow water is water captured but not immediately used; and red water is water captured and consumed domestically. Water capture capacity (WCC) was estimated using economic proxies such as foreign direct investment, GDP, foreign aid, and budget allocation for dam projects, subsequently converted into physical capacity through unit costs [84].
For the years 1956–1980, observed discharge data from the USGS Report were available for the Kajaki and Arghandab Dams. For 2010–2025, river discharge was estimated using a combination of time-series prediction with a random forest algorithm and satellite imagery. Water capture capacity for 2010–2025 was determined using the existing capacities of the Kajaki, Dehle, and Kamal Khan Dams. Also, the Kamal Khan Dam’s capacity was set to zero before operation and, after commissioning, reflected the volume of water diverted to the Godzareh Depression. While data limitations remain, this methodology provides a comprehensive overview of the evolution of painted water in the basin.
In summary, the Vensim model was used to visualize the painted water spectrum. By creating the Stock and Flow Diagram (SFD) in Vensim, which is a quantitative modeling tool in system dynamics and follows qualitative Causal Loop Diagrams (CLDs), it was possible to provide a conceptual dynamic model that structures our analysis of the painted water spectrum in the Helmand/Hirmand hydrosystem (Figure 2). As a matter of fact, the SFD diagram enables us to visually and conceptually trace the systemic consequences of infrastructure projects. For further reference, we recommend key texts on system dynamics that detail SFD construction and its applications [112,113,114,115].
Figure 2.
Stock–Flow Diagrams (SFDs) in the Vensim model for painted water classification adapted from Shahbazbegian and Dinar (2023) [86].
Additionally, Boxes S1 and S2 in the Supplementary File provide more detail and the equations used to calculate painted water attributes in a transboundary river, along with the assumptions underlying the estimated parameters.
3. Results and Discussion
3.1. Land Use Changes in 2012, 2020, and 2024 Based on DBN
The land use map for 2012 (Figure 3a) spans from southern and southwestern Afghanistan to eastern Iran’s Sistan region, offering a comprehensive overview for evaluating ecological conditions and water resource management challenges within the Helmand/Hirmand Transboundary River Basin (HTRB). In 2012, the northern and eastern portions of the study area were largely dominated by rangelands interspersed with forest patches and agricultural lands. In contrast, the southern and western areas were primarily barren, with agriculture confined to a narrow corridor along the river. The Kajaki Dam is situated in the northern, relatively water-rich and agriculturally productive zone, while the Kamal Khan Dam, constructed in the arid southwestern section, is surrounded by mostly barren land with only a thin strip of cropland following the river’s path. The prevalence of barren land in the south reflects the HTRB’s arid and semi-arid climate. This landscape pattern, where agricultural land is distributed linearly along the river, emphasizes the region’s complete dependence on surface water for farming. The concentration of rangelands in the northern and central basin further highlights the ecological fragility of the area. The strategic placement of the major Kajaki Dam upstream in the north and the Kamal Khan Dam near the Iran–Afghanistan border in the southwest underscores the critical influence of Afghanistan’s (upstream) water management on downstream land use patterns in Iran.
Figure 3.
Evolution of land use in the study area in (a) 2012, (b) 2020, and (c) 2024.
A comparison of land use maps from 2012 and 2020 (Figure 3b) reveals significant transformations across the HTRB. Around the Kajaki Dam, rangelands and forest that predominated in 2012 were largely converted into agricultural fields by 2020, underscoring the dam’s role in securing irrigation water and enhancing agricultural productivity. While the area was mostly barren in 2012, by 2020, agriculture along the river had expanded considerably, demonstrating the dam’s effectiveness in reclaiming arid lands in water-scarce regions.
Following 2020, agricultural growth near the Kajaki Dam became more evident. By 2024 (Figure 3c), this trend intensified, affirming the dam’s pivotal role in stabilizing water resources for agricultural development. However, the conversion of rangelands and forest to croplands raises concerns about potential biodiversity loss, disruptions to ecosystem functions, and increased pressure on already limited natural resources. These patterns align with the findings of Arfa et al. (2025) [116], who identified land use and land cover (LULC) changes as a key factor driving the increase in agricultural activities in the HTRB. Additionally, the increase in water bodies near the Kamal Khan Dam in 2024 reflects the dam’s direct impact on reclaiming arid land. This pattern is directly associated with the diversion of flow toward the Godzareh Depression, a policy disrupting the natural-historical flow toward Iran; this practice is explicitly violates Article V of the Helmand/Hirmand Treaty 1951 [19]. Such alterations to the river’s natural flow regime signal a shift in Afghanistan’s water management strategy toward unilateral exploitation, carrying both regional and transboundary ramifications. The Godzareh Depression, as a closed basin, experiences high evaporation rates that result in significant water loss, effectively wasting valuable resources within the HTRB. Moreover, this diversion has drastically reduced inflows into the Hamoun transboundary wetlands and Iran’s Sistan lowlands [46].
Taken together, the three maps demonstrate that water allocation and diversion have concentrated land use transformations within Afghanistan while simultaneously preventing water inflows into Iran. A direct consequence of these changes has been increased upstream water withdrawals, resulting in reduced inflows downstream. The results align with the findings of Hajihosseini et al. (2019) [48], who showed that expanding irrigation in the middle the Helmand/Hirmand Transboundary River Basin (HTRB) annually decreases downstream flows by hundreds of millions of cubic meters. Also, the results align with those of Noorali et al. (2025) [49], who emphasized that land use changes, including alterations in water bodies, vegetation cover, and soil, directly influence the hydropolitical dynamics of the HTRB.
Despite the drought, the area under cultivation in Afghanistan has significantly increased, coinciding with the onset of political changes that directly reflect profound socio-economic transformations. According to Figure 4, between 2012 and 2024, land use underwent significant transformations. Agricultural land steadily expanded, increasing by more than 27% over the study period. Additionally, built-up areas expanded rapidly until 2020 but slightly declined by 2024, ultimately recording a net growth rate of 47%. In contrast, bare land consistently decreased, losing more than 27%, indicating its conversion to other land uses. Rangelands also expanded steadily, gaining nearly 15%.
Figure 4.
Land use area changes in 2012, 2020, and 2024.
Demographic pressure and food security imperatives, economic reliance on agriculture, climate change, extremes droughts, storms, and a lack of participatory governance in the transboundary river basin, compounded by human factors like land use change, extensive upstream dam construction, and deforestation, have created conditions conducive to hydrological and socio-economic droughts in the HTRB. These conditions have posed significant challenges regarding urban and agricultural water supply, as well as increasing dust storm occurrences downstream.
Overall, the dominant trend reflects a reduction in bare land and its conversion into agricultural areas, rangelands, and water bodies, while forest changes remained unstable. This pattern highlights that the main pressure on land resources has been driven by the expansion of agriculture and human-related land uses, leading to the depletion of bare land and instability in forest cover. A direct consequence of this process has been increased upstream water withdrawal and a corresponding decline in downstream inflows. This outcome is consistent with the findings of Hajihosseini et al. (2019) [48], who demonstrated that the expansion of irrigation in the middle Helmand/Hirmand hydrosystem annually reduces downstream flows by hundreds of millions of cubic meters, not only threatening Iran’s water security but also pushing the Hamoun international wetlands into severe ecological crisis.
3.2. Evaluation of DBN for Land Use Classification (2012, 2020, 2024)
The evaluation of the DBN model’s performance for 2012 (Figure 5a) shows that, according to the normalized confusion matrix, the most significant misclassification occurred in the built-up class, with 62.6% of samples incorrectly identified. In contrast, the forest class achieved the highest accuracy at 85.2%. The model demonstrated strong capabilities in distinguishing forest, cropland, and barren land, yet it struggled to accurately separate built-up, rangeland, and water classes. This trend is reinforced by the evaluation metrics: the forest class attained the highest scores (precision = 0.85, recall = 0.75, F1 = 0.80), while built-up areas lagged with the lowest metrics (precision = 0.70, recall = 0.70, F1 = 0.70). Notably, all classes maintained robust AUC values above 0.85, with the forest class leading at 0.922 and water scoring the lowest at 0.886. The classification accuracy by class was highest for rangeland, cropland, and built-up areas (approximately 77%), while water recorded the weakest result (69.6%). Overall, the DBN model in 2012 presented satisfactory performance, excelling in classifying forest and cropland, though built-up and water categories remained problematic.
Figure 5.
Performance evaluation of DBN in land use mapping for different time periods: (a) 2012, (b) 2020, and (c) 2024.
By 2020 (Figure 5b), the normalized confusion matrix reflected notable improvements, particularly for cropland (87%), forest (84.4%), built-up land (82.6%), and barren land (80.7%). However, water (68.3%) and rangeland (68.7%) continued to pose classification challenges. This pattern was consistently observed in the evaluation metrics: cropland (F1 = 0.87) and forest (F1 = 0.84) remained the best-performing classes, while built-up and barren land achieved moderate scores (F1 ≈ 0.81–0.82). Water (F1 = 0.72) and rangeland (F1 = 0.71) still displayed the lowest F1-scores. AUC values were uniformly high across all classes (ranging from 0.889 to 0.913), with the forest (0.913) and barren land (0.911) classes performing best. Built-up areas, despite having the lowest AUC (0.889), still showed acceptable results. Per-class classification accuracy highlighted built-up land (81.7%), cropland (80.5%), and forest (81.0%) as the most reliably identified, while rangeland (76.5%) and water (75.9%) remained more error-prone.
In 2024 (Figure 5c), the DBN model exhibited substantial progress relative to previous years. The normalized confusion matrix indicated high accuracy for barren land (90.5%), built-up areas (88.7%), and cropland (86.3%). While forest (82.2%) and rangeland (79.5%) displayed moderate misclassification rates, water class accuracy improved to 71.1%, a notable enhancement, though it remained the most challenging class to distinguish. Evaluation metrics corroborated this trend: built-up (precision = 0.90, recall = 0.88, F1 = 0.89) and barren land (precision = 0.86, recall = 0.86, F1 = 0.88) achieved the highest scores, followed by cropland (precision = 0.86, recall = 0.85, F1 = 0.86) and forest (precision = 0.82, recall = 0.82, F1 = 0.82). Rangeland (precision = 0.80, recall = 0.85, F1 = 0.82) and water (precision = 0.71, recall = 0.83, F1 = 0.77) continued to be the most difficult classes for the model. The AUC values remained strong across all categories (0.888–0.918), with barren land (0.918) and water (0.904) achieving the highest separability, while forest (0.888) had the lowest among the classes. Per-class classification accuracy confirmed that built-up (86.4%) and barren land (86.2%) were the DBN’s most accurately classified categories, while forest (82.2%) and water (83.1%) had slightly lower, though still satisfactory, accuracies.
In summary, the performance of the DBN model showed continuous and marked improvement over the three study periods, culminating in a notably stable and reliable classification accuracy by 2024. Despite these advancements, the model continued to face challenges in accurately distinguishing between water and rangeland classes, which consistently recorded the lowest accuracies. Nevertheless, the DBN exhibited robust and dependable results in land use mapping, in line with findings from previous studies [117,118,119,120,121]. These outcomes underscore the DBN’s effectiveness as a tool for land use classification in the HTRB, offering significant value for both management applications and future research.
3.3. Comparative Assessment of DBN Performance in Land Use Mapping (2012, 2020, 2024)
A comparative assessment of DBN performance across 2012, 2020, and 2024 (Figure 6) revealed a consistent upward trend in key metrics, including accuracy, AUC, F1-score, and Kappa coefficient. In 2012, the model achieved an accuracy of 0.75, an AUC of 0.902, an F1-score of 0.739, and a Kappa coefficient of 0.696, reflecting moderate initial performance. By 2020, accuracy improved to 0.80, the F1-score increased to 0.787, and the Kappa coefficient rose to 0.757, while the AUC remained strong at 0.901. This progression demonstrates that, although the model’s discriminative power (AUC) was robust from the beginning, other performance indicators improved steadily as the model evolved. In 2024, the DBN reached its peak performance, with an accuracy of 0.85, an F1-score of 0.837, and a Kappa coefficient of 0.815. The AUC held steady at 0.900, highlighting the model’s consistently high ability to distinguish between land use classes throughout the study period. These results confirm that, while AUC values were stable and high across all years, the model achieved substantial gains in overall accuracy, reliability, and classification consistency over time. Altogether, the DBN advanced from moderate effectiveness in 2012 to a robust and reliable classification tool by 2024, which is consistent with prior research affirming the strong potential of DBNs for land use and land cover classification [122,123,124].
Figure 6.
Comparative performance of the DBN model in 2012, 2020, and 2024.
3.4. Heatmaps of Land Use Change Rates Across Successive Periods
The heatmap (Figure 7) illustrates the differences in land use change rates between the two periods (2012–2020 and 2020–2024), highlighting which land use transitions intensified or diminished in the more recent years. The most significant negative change occurred in forest cover, which saw a substantial reduction of 32.7%, primarily due to its conversion into agricultural land (+25.8%). Additionally, forest-to-water conversions increased by 17.9%, underscoring mounting pressures on forest ecosystems. The forest class exhibited the highest variability, with both positive (up to +17.9%) and negative (−32.7%) fluctuations across different regions, reflecting the heterogeneous nature of degradation and restoration pressures. Significant negative changes were also observed for built-up areas, especially in their conversion to agricultural land (−8.1%). Built-up areas experienced contrasting trends, with some regions showing notable expansion (+18.8%), while others displayed sharp declines (−18.7%), indicating uneven patterns of urban growth or shifting land use policies. The conversion of bare land to rangeland increased substantially (+19.3%), suggesting dynamic exchanges between these two classes. Bare land demonstrated marked positive and negative changes (+19% vs. −19.3%), likely driven by a combination of human activities and natural processes. Water-related changes varied across regions, ranging from positive gains (+14.4%) in some areas (upstream of the Kajaki Dam and in the Godzareh Depression) to negative declines (−6.1%) downstream of the Kamal Khan Dam, influenced by both climatic variability and water management practices. These results indicate that, during the 2020–2024 period, forests were under increased pressure, with large areas converted to agricultural land and water bodies, while bare land, rangeland, and built-up areas experienced dynamic reciprocal exchanges. These patterns align with those of previous global studies [125,126], which have reported that deforestation and the conversion of forests to agricultural land are among the most prominent land use transitions worldwide. Similarly, the dynamic interchanges among bare land, forest, rangeland, and agricultural areas observed in the HTRB reflect broader global trends in land use change.
Figure 7.
Variation in land use change rates across successive periods (2020–2024 minus 2012–2020).
Overall, the pattern underscores that the primary pressure on land resources has stemmed from the expansion of agriculture and other human-driven land uses, leading to the depletion of bare land and ongoing instability in forest areas.
3.5. Assessment of Water Diversion from the Kamal Khan Dam to the Godzareh Depression Using Satellite Imagery (2020, 2022, and 2024)
Sentinel satellite images from January 2020 (Figure 8a) to February 2022 (Figure 8b) revealed substantial changes in the flow regime following the operation of the Kamal Khan Dam. The 2020 imagery, captured before large-scale water storage behind the dam, shows a flow pattern in which most runoff was directed eastward and southeastward, with a portion continuing downstream toward the Iranian border. However, the February 2022 imagery clearly demonstrates that water retained behind the Kamal Khan Dam was diverted toward the Godzareh Depression, resulting in the formation of extensive water bodies within this closed basin. Additional evidence from Sentinel imagery taken between September 2022 (Figure 8c) and May 2024 (Figure 8d) illustrates a profound hydrological shift downstream of the dam. In both cases, water was primarily redirected into the Godzareh Depression rather than following its natural westward and southwestward course toward Iran. The September 2022 image highlights the emergence of substantial water bodies within the Godzareh Depression, confirming large-scale diversion and entrapment of flow. By May 2024, the spatial extent of these water bodies had increased, indicating an intensified concentration of runoff within the depression and an effective cessation of transboundary flows to Iran.
Figure 8.
Sentinel-based monitoring of water diversion from Kamal Khan Dam to Godzareh in (a) 2020, (b) and (c) 2022, (d) 2024.
These spatial changes confirm that post-dam water management has significantly reduced or even completely interrupted the flow reaching the Iranian border, severely diminishing Iran’s downstream water resources. Overall, the Sentinel imagery not only verifies the major hydrological transformations in the region but also demonstrates that diverted water has transformed the Godzareh Depression into an evaporation sink for substantial water volumes, where intense evaporation leads to non-recoverable losses for the entire basin, severely weakening the natural hydrological connectivity between Afghanistan and downstream areas in Iran. As a result, the ecological balance and livelihoods in Iran’s transboundary areas have been severely affected.
The results align with the findings of Maleki et al. (2024) [89], who reported that, following the operation of the Kamal Khan Dam, water allocation to Iran’s Chah Nimeh reservoirs decreased sharply, with their mean water level declining by approximately 54% between 2020 and 2023. As a matter of fact, the Godzareh Depression, the main recipient of diverted flows, has experienced significant evaporation losses, leading to the dissipation of much of the stored water. Consequently, water management practices implemented after the construction of the Kamal Khan Dam not only disrupted hydrological connectivity between Afghanistan and downstream Iran but also resulted in substantial water losses due to intense evaporation in Godzareh. This quantitative evidence is supported by Maleki et al. (2024) [89], who demonstrated that the average daily evaporation rate in the Godzareh Depression is approximately 5 mm/day higher than in the Chah Nimeh reservoirs, with the total evaporated volume from Godzareh showing an increasing trend following the operation of the Kamal Khan Dam.
In addition, our analysis of hydroclimatic indices provides further evidence of anthropogenic influence. The results reveal a statistically significant increase in Potential Evapotranspiration (PET), particularly around the Kamal Khan Dam, which exacerbates water loss. Concurrently, the Palmer Drought Severity Index (PDSI) exhibits extreme fluctuations after 2020, a pattern that shows the dominance of the upstream country over the hydrological regime of the Hirmand/Helmand hydrosystem. Additional evidence of the status of hydroclimatic indicators in the Helmand/Hirmand hydrosystem is provided in the Supplementary File.
Overall, Afghanistan is systematically diverting natural-historical flow from the Helmand/Hirmand hydrosystem toward the closed Godzareh Depression, effectively removing it from the hydrological cycle. This action is inherently hegemonic and represents a strategic transformation of water into a hegemonic resource. This approach weaponizes water scarcity as a form of political leverage downstream, thereby undermining transboundary water security and ecological viability. These results are consistent with the findings of Akbari et al. (2021) [127], which highlight the impacts of upstream flow regulation on the desiccation of the Hamoun international wetlands.
3.6. Dynamics of Painted Water and the Emergence of Negative Hydrohegemony in the HTRB
The evolution of the Helmand Transboundary River Basin (HTRB) between Iran and Afghanistan represents a compelling case study in the transformation of water governance from natural flow regimes to infrastructure-dominated control systems. The painted water framework, with its classification of red (controlled and consumed), yellow (controlled but not immediately consumed), and green (uncontrolled natural flow) water, effectively captures the progressive disruption of the basin’s hydrological balance. As shown in Figure 9, the historical trajectory from 1954 to 1980 marks the initial phase of this anthropogenic transformation, initiated by the Kajaki Dam’s commissioning and the Boghra Irrigation Canal’s completion. During this period, the basin witnessed its first significant shift away from green water dominance toward increased red and yellow water categories, establishing a precedent for subsequent infrastructure-driven water appropriation.
Figure 9.
Trend analysis results of the Helmand/Hirmand hydrosystem’s available water through the painted water lens (1954–1980): green water (natural flow), yellow water (controlled, non immediately consumed), and red water (controlled and consumed).
According to Figure 10, the contemporary period from 2010 to 2025 reveals an intensification of this trend, with the 2021 completion of the Kamal Khan Diversion Dam serving as a pivotal inflection point. This infrastructure development fundamentally altered Afghanistan’s hydrostrategic position by dramatically expanding its yellow water reserves, water that is controlled but not necessarily consumed domestically. Simultaneously, Afghanistan’s red water demands escalated due to agricultural expansion, population growth, and national food security imperatives. This increasing trend is supported by current research, which, through the examination of satellite images, reveals a growing dependence on red water associated with agricultural land expansion, particularly in regions downstream of the Kajaki Dam. This dual increase in both red and yellow water categories has created a far more complex hydropolitical landscape than the original three-tiered hierarchy suggested by earlier painted water conceptualizations. Indeed, the framework now appears better represented as overlapping circles, where various water uses and negotiations occur not in discrete categories but in the intersections between them. The implications of this evolution extend beyond technical water accounting to reveal the emergence of negative hydrohegemony in the region. Afghanistan’s geographic advantage as the upstream riparian, combined with technological capabilities and international support, has enabled unilateral actions that fundamentally disadvantage Iran as the downstream state. The accumulation of yellow water capacity, particularly through the Kamal Khan Dam, grants Afghanistan leverage to use water as a coercive instrument, effectively weaponizing hydrological regime control. This represents a departure from cooperative water governance toward a more asymmetric power dynamic where Iran’s historical water security is increasingly precarious. The absence of effective implementation mechanisms and guarantees for the 1973 treaty further exacerbates this imbalance, leaving Iran vulnerable to upstream decisions over which it has minimal influence.
Figure 10.
Trend analysis results of the Helmand/Hirmand hydrosystem’s available water through the painted water lens (2010–2025): green water (natural flow), yellow water (controlled, non immediately consumed), and red water (controlled and consumed).
However, the analysis also highlights critical methodological limitations, particularly data-related challenges and conceptual assumptions that temper these conclusions. Despite constraints, the painted water framework demonstrates considerable analytical value in illuminating how infrastructure development reshapes transboundary water relations, transforming what were once negotiable resources governed by natural flow patterns into politically charged assets controlled through human intervention.
3.6.1. Limitations
Although this study provides a comprehensive analysis of hydropolitical dynamics in the HTRB using the painted water framework, its findings and calculations are affected by a set of methodological limitations, particularly data-related challenges and conceptual assumptions, which must be acknowledged.
The most significant challenge facing this research was the scarcity and heterogeneity of reliable observational data. For the historical period (1954–1980), although USGS report data were used for the discharge of the Kajaki and Arghandab Dams, these data represent observational estimates and do not provide complete coverage of all hydrological parameters of the basin. This shortcoming was even more pronounced for the contemporary period (2010–2025), for which we lacked a unified and long-term dataset of natural discharge. To address this gap, we employed a combination of time-series forecasting with the random forest algorithm and satellite imagery to estimate natural discharge. While this methodological approach is innovative and represents the best available alternative, it inherently carries uncertainties associated with statistical models and cannot fully replicate the accuracy of direct and continuous field measurements. The reliance on modeled rather than observed data introduces potential propagation of errors throughout the painted water calculations.
Furthermore, the present study is based on several key estimates and assumptions that necessarily simplify complex hydrological realities. Most notably, the variable value of natural discharge was treated as a normalized value based on long-term historical averages for analytical tractability. In reality, river discharge is subject to substantial variability driven by climate change, interannual precipitation fluctuations, and extreme events such as droughts and floods. This simplification of natural discharge as a constant baseline may introduce systematic errors in estimating the relative proportions of green, yellow, and red water, particularly during periods of exceptional hydrological stress or abundance. The assumption fails to capture how climate variability affects not only the absolute quantities of water available but also the dynamics of how water transitions between painted water categories.
Additionally, the water capture rates for major infrastructure, including the Kajaki Dam, Dahla Dam, and Kamal Khan Diversion Dam, which play decisive roles in determining the composition of painted water, were estimated from the total current storage and diversion capacity of these facilities. The capacity of the Kamal Khan Dam was set to zero before its commissioning in 2021; after its operationalization, it was assumed to represent the volume of water diverted into the Godzareh Depression. While practical and grounded in available technical specifications, this approach carries the risk of underestimating or overestimating the actual operational capacity and efficiency of water infrastructure. Dams rarely operate at theoretical maximum capacity due to sedimentation, maintenance requirements, operational constraints, and varying water management priorities. Moreover, this approach does not fully account for potential future infrastructure developments or modifications to existing facilities that could further alter the painted water composition.
The conceptual application of the painted water framework itself introduces interpretive challenges. While the framework provides valuable analytical clarity by categorizing water into red (controlled and consumed), yellow (controlled but not immediately consumed), and green (uncontrolled natural flow) categories, the boundaries between these classifications are not always discrete in practice. The modified approach recognizes that painted water categories function more as overlapping circles rather than a strict hierarchy, with negotiability varying depending on specific uses and political contexts. This complexity means that assigning water to specific categories involves judgment calls that may not fully capture the nuanced realities of water governance and competing claims. Furthermore, the framework’s focus on control and consumption may not adequately represent other dimensions of water security, such as water quality, ecological flows, and the cultural or spiritual significance of water resources to riparian communities.
Despite these limitations, this study’s integrated methodological approach combining historical data, remote sensing, land use classification, hydrological changes, and the painted water framework provides a robust and empirically grounded overview of the evolution of hydropolitical dynamics in the Helmand/Hirmand hydrosystem. The convergence of multiple data sources and analytical techniques strengthens confidence in the study’s core findings regarding the emergence of negative hydrohegemony and Iran’s transition toward increasingly precarious water security conditions. Future research would benefit from enhanced ground-truthing, continuous hydrological monitoring, incorporation of climate projection scenarios, and refinement of the painted water framework to better accommodate the temporal and spatial variability inherent in transboundary water systems.
3.6.2. Research Prospects and Management Suggestions
The limitations identified in Section 3.6.1, particularly concerning hydrological data and the static nature of the painted water model, point to clear directions for both future research and practical governance. A primary research prospect is the dynamic integration of the painted water framework with advanced hydrological and climate models. Future studies should develop a painted water module for existing decision support systems (such as WEAP or SWAT) that incorporates climate change projections and the seasonal variability of natural discharge. This enhancement would allow the model to simulate how painted water categories shift in response to droughts, floods, and long-term climatic trends, moving the framework from a diagnostic tool to a predictive one for strategic planning. Furthermore, the conceptual boundaries of painted water can be refined. Qanbari and Shahbazbegian (2025) demonstrate the value of applying this lens to re-examine international water law principles, suggesting that future research should explore how the framework can clarify contested legal norms such as equitable and reasonable utilization [128]. For example, does an increasing volume of yellow water upstream necessitate a reevaluation of what constitutes equitable use downstream? This interdisciplinary approach bridges hydropolitics and legal scholarship. From a management and negotiation standpoint, the painted water concept offers a strategic roadmap for all riparian states. For downstream states, a critical suggestion is to proactively green their water security profile. This involves investing in demand-side management, water use efficiency, and the development of alternative sources (e.g., wastewater reuse) to reduce dependence on yellow water and red water. Domestically, this builds resilience; internationally, it transforms their position from one of vulnerability to one of stronger agency in negotiations. For upstream states, the responsible exercise of geographical power lies in managing yellow water transparently as a shared strategic asset for benefit-sharing, rather than solely as a tool for coercion. Creating formal mechanisms where downstream states contribute to upstream infrastructure or energy projects in exchange for reliable yellow water releases can foster cooperative, positive-sum outcomes [86]. As explored in decision support models to assist international and transboundary water negotiations [129], combining this strategic lens with formal decision support tools and negotiation methods (like multi-criteria analysis) can institutionalize cooperative management.
Ultimately, the framework’s greatest potential lies in its ability to reframe transboundary water diplomacy. Future work should focus on institutionalizing the painted water concept within basin organizations and treaty mechanisms. Could future agreements include clauses that recognize different categories of water, with distinct cooperation rules for managing green flows versus negotiating over yellow reserves? Moreover, painted water offers a novel metric for tracking and incentivizing cooperation. Monitoring the proportion of a downstream state’s demand met by secure green water over time could serve as a tangible, politically salient indicator for measuring progress on Sustainable Development Goal (SDG) Indicator 6.5.2. By making the hydropolitical dimensions of shared rivers explicit and actionable, the painted water concept coupled with the methodologies and legal insights highlighted by Shahbazbegian and Dinar and Qanbari (2023, 2025, 2026) [86,128,129] provides a powerful, interdisciplinary compass for navigating the complex path toward sustainable and equitable basin management.
4. Conclusions
The findings of this study demonstrate that changes in water allocation patterns in the Helmand/Hirmand hydrosystem, particularly following the construction of the Kamal Khan Dam, have directly reduced water inflow to Iran and fundamentally transformed the basin’s hydropolitical landscape. The application of the DBN proved highly accurate (Kappa = 0.815, AUC = 0.90, F1 = 0.837) for monitoring spatiotemporal land use changes, particularly in distinguishing agricultural and forest classes, although some challenges remain in differentiating water bodies from rangelands. The results highlight significant transformations induced by the construction and operation of the Kajaki and Kamal Khan Dams. In the Kajaki Dam area, agricultural expansion (27%) has occurred at the expense of rangelands, forest, and barren lands, indicating the direct influence of water management on reshaping land use patterns.
The differences in land use change rates between the two periods (2012–2020 and 2020–2024) also indicate the highest variability in the forest class, with both positive (up to +17.9%) and negative (−32.7%) fluctuations across different regions, underscoring mounting pressures on forest ecosystems. Additionally, water-related changes range from positive gains (+14.4%) in some areas (upstream of the Kajaki Dam and in the Godzareh Depression) to negative declines (−6.1%) downstream of the Kamal Khan Dam, influenced by both climatic variability and water management.
Sentinel satellite images confirm that the diversion of flows toward the Godzareh Depression has triggered fundamental changes in the area’s hydrological system. These water accumulations not only represent a significant loss of resources due to high evaporation in this closed basin but also disrupt the natural continuity of the river.
Applying the painted water framework to the Helmand/Hirmand Transboundary River Basin (HTRB) reveals a critical evolution from natural flow-based governance to infrastructure-dominated control systems. The historical trajectory from 1954 to 1980, initiated by the Kajaki Dam’s commissioning and the Boghra Irrigation Canal’s completion, marked the basin’s first significant shift away from green water dominance toward increased red and yellow water categories. The contemporary period from 2010 to 2025 has witnessed an intensification of this trend, with the 2021 completion of the Kamal Khan Dam serving as a pivotal inflection point. Afghanistan’s water development policies have engineered a dual transformation: dramatically expanding yellow water reserves through enhanced storage and diversion capacity while simultaneously escalating red water consumption through agricultural expansion driven by population growth and food security imperatives. The deliberate diversion of flows toward the Godzareh Depression, empirically confirmed by Sentinel-2 imagery documenting the formation of extensive water bodies in 2020, 2022, and 2024, represents a massive conversion of green water into controlled yellow water. This dual increase in both red and yellow water categories has created a far more complex hydropolitical landscape than simple hierarchical classifications suggest, better conceptualized as overlapping categories where various water uses and negotiations occur at their intersections.
Taken together, the painted water analysis, supported by robust remote sensing evidence and land use classification data, confirms the emergence of negative hydrohegemony in the HTRB. This confirmation means that the hydropolitical architecture of the Helmand/Hirmand Transboundary River Basin (HTRB) and its past era of relative stability governed by natural flow patterns are demonstrably over; the basin now exemplifies infrastructure-driven asymmetric power dynamics. Despite constraints, the painted water framework demonstrates considerable analytical value in illuminating how infrastructure development reshapes transboundary water relations from negotiable resources to politically charged assets controlled through human intervention. To prevent the entrenchment of increasingly complex and precarious water classifications that threaten regional stability, both countries must urgently recalibrate their strategies. Moving forward requires not only technical solutions but also fundamental shifts toward cooperative governance mechanisms that acknowledge the evolving nature of painted water categories and prioritize equitable redistribution of shared water resources over unilateral appropriation. Without such recalibration, the basin risks descending into a prolonged crisis characterized by heightened scarcity, diplomatic tension, and the consolidation of negative hydrohegemony.
Supplementary Materials
The following supporting information can be downloaded at: https://www.mdpi.com/article/10.3390/w18101117/s1, Box S1: Equations to calculate painted water attributes in a transboundary river, Box S2: Simplifying assumptions for estimated parameters, Section S1: Hydroclimatic Index Changes in the Helmand/Hirmand Transboundary River Basin, including materials and methods, results and discussion, and references. Figure S1. Spatiotemporal Trend Analysis and Statistical Significance of Hydro-Climatic Indice (PDSI) in the Helmand/Hirmand Basin. Figure S2. Spatiotemporal Trend Analysis and Statistical Significance of Hydro-Climatic Indice (PET) in the Helmand/Hirmand Basin. Figure S3. Investigation of Hydro-Climatic and Vegetation Indices (a. PDSI and b. PET) in the Helmand/Hirmand Basin. References [25,130,131,132,133,134,135,136,137,138,139,140,141] are cited in the supplementary materials.
Author Contributions
M.J.: Writing—Review and Editing, Writing—Original Draft, Visualization, Validation, Software, Resources, Methodology, Investigation, Formal Analysis, Data Curation, and Conceptualization; A.R.M.B.: Supervision and Writing—Original Draft, Funding Acquisition, Formal Analysis, Project Administration; M.S.: Supervision and Writing—Original Draft, Funding Acquisition, Methodology. All authors have read and agreed to the published version of the manuscript.
Funding
This research is part of the Blue Peace Middle East Capacity Development project (JUST-WDC), funded by the Swiss Agency for Development and Cooperation (SDC).
Data Availability Statement
The original contributions presented in this study are included in the article. Further inquiries can be directed to the corresponding author.
Acknowledgments
The authors express their gratitude to the Water Diplomacy Center (WDC) at Jordan University of Science and Technology (JUST) for their valuable support, which made this research possible. This article is based on a PhD dissertation water resources, completed at the University of Tehran.
Conflicts of Interest
The authors declare no conflicts of interest.
References
- Mirumachi, N. Transboundary Water Politics in the Developing World, 1st ed.; Routledge: London, UK, 2015; pp. 1–202. [Google Scholar]
- Zeitoun, M.; Warner, J. Hydro-hegemony: A framework for analysis of transboundary water conflicts. Water Policy 2006, 8, 435–460. [Google Scholar] [CrossRef] [Scilit]
- Gleick, P.H. Water as a weapon and casualty of conflict: Freshwater and international humanitarian law. Water Resour. Manag. 2019, 33, 1737–1751. [Google Scholar] [CrossRef] [Scilit]
- Daoudy, M. Water weaponization in the Syrian conflict: Strategies and dynamics of violence. Water Int. 2020, 45, 345–362. [Google Scholar]
- Selby, J. Cooperation, domination and colonisation: The Israeli-Palestinian Joint Water Committee. Water Alternatives 2013, 6, 1–24. [Google Scholar]
- Warner, J. The Toshka mirage in the Egyptian desert-River diversion as political diversion. Environ. Sci. Policy 2013, 30, 102–112. [Google Scholar] [CrossRef] [Scilit]
- Turton, A. A South African perspective on a possible benefit-sharing approach for transboundary waters in the SADC region. Water Altern. 2008, 1, 180–200. [Google Scholar]
- Warner, J. Contested hydrohegemony: Hydraulic control and security in Turkey. Water Altern. 2008, 1, 271–288. [Google Scholar]
- Amiraslani, F.; Dragovich, D. Iran’s regional transnational water partnerships: Unclear rules, unstable partnerships, and an unsettled future. Sustainability 2023, 15, 11889. [Google Scholar] [CrossRef] [Scilit]
- Najafi, A.; Vatanfada, J. Transboundary water management improvements, the way forward in the middle east: Case study: Transboundary water management of iran and neighbors. Geopolit. Q. 2013, 8, 135–155. [Google Scholar]
- Rufin, P.; Gollnow, F.; Müller, D.; Hostert, P. Synthesizing dam-induced land system change. Ambio 2019, 48, 1183–1194. [Google Scholar] [CrossRef] [Scilit]
- Joyce, S. Is it worth a dam. Environ. Health Perspect. 1997, 105, 1050–1055. [Google Scholar] [CrossRef]
- Tortajada, C. Dams: An essential component of development. J. Hydrol. Eng. 2015, 20, A4014005. [Google Scholar] [CrossRef] [Scilit]
- Zhang, J.; Ding, W.; Zhou, H.; Li, M.; Wang, Q.; Peng, Y. Quantifying flood control storage substitution in cascade reservoirs. J. Hydrol. 2025, 652, 132621. [Google Scholar] [CrossRef] [Scilit]
- Bigham, K.A.; Keane, T.D.; Moore, T.L. Effect of flow regulation on streambank erosion: A perspective downstream of a flood control dam, Kansas, USA. River Res. Appl. 2024, 40, 14–28. [Google Scholar] [CrossRef] [Scilit]
- Eekhout, J.P.; Boix-Fayos, C.; Pérez-Cutillas, P.; deVente, J. The impact of reservoir construction and changes in land use and climate on ecosystem services in a large Mediterranean catchment. J. Hydrol. 2020, 590, 125208. [Google Scholar] [CrossRef] [Scilit]
- Jeuland, M. The economics of dams. Oxf. Rev. Econ. Policy 2020, 36, 45–68. [Google Scholar] [CrossRef] [Scilit]
- Shirazian, S.; Karimidouzaji, A.; Anisi, M.S. Construction and Development of Dams on Transboundary Rivers under Precautionary Principle (A case study of the Kajaki dam). CIFILE J. Int. Law 2021, 2, 72–85. [Google Scholar]
- Nagheeby, M.; Warner, J. The 150-year Itch: Afghanistan-Iran hydropolitics over the helmand/hirmand river. Water Altern. 2022, 3, 551–573. [Google Scholar]
- Thomas, V.; Varzi, M.A. Legal licence for an ecological disaster: The inadequacies of the 1973 Helmand/Hirmand water treaty for sustainable transboundary water resources development. Int. J. Water Resour. Dev. 2015, 31, 499–518. [Google Scholar] [CrossRef] [Scilit]
- Crippa, M.; Oreggioni, G.; Guizzardi, D.; Muntean, M.; Schaaf, E.; Lo Vullo, E.; Solazzo, E.; MonfortiFerrario, F.; Olivier, J.; Vignati, E. Fossil CO2 and GHG Emissions of All World Countries: 2019 Report; Publications Office of the European Union: Luxembourg, 2019; pp. 1–255. [Google Scholar]
- UNFCCC. Islamic Republic of Afghanistan Intended Nationally Determined Contribution (INDC) Submission to the United Nations Framework Convention on Climate Change; United Nations Framework Convention on Climate Change (UNFCCC): Bonn, Germany, 2015; pp. 1–12. [Google Scholar]
- Rosvold, E.L.; Funnemark, A.; Grand, A.O.; Tarif, K.; Smith, E. Climate, Peace and Security Fact Sheet: Afghanistan; Norwegian Institute of International Affairs (NUPI): Oslo, Norway; Stockholm International Peace Research Institute (SIPRI): Stockholm, Sweden, 2021; pp. 1–4. [Google Scholar]
- Moridi, A.; Rafipour, M.; Hatamkhani, A.; Haghighi, A.T. Conflict Resolution between Energy Production and Agricultural Demand in a Transboundary River. Renew. Energy 2025, 12, 123793. [Google Scholar] [CrossRef] [Scilit]
- Almalki, R.; Khaki, M.; Saco, P.M.; Rodriguez, J.F. The impact of dam construction on downstream vegetation area in dry areas using satellite remote sensing: A case study. Remote Sens. 2023, 15, 5252. [Google Scholar] [CrossRef] [Scilit]
- Almalki, R.; Khaki, M.; Saco, P.M.; Rodriguez, J.F. Understanding Environmental Facto1rs Influencing Vegetation Cover Downstream of Dams. Int. J. Environ. Res. 2025, 19, 14. [Google Scholar] [CrossRef] [Scilit]
- Aladelokun, A.O. The sustainability of dam construction through environmental management. IOSR J. Environ. Sci. Toxicol. Food Technol. 2012, 1, 1–5. [Google Scholar] [CrossRef] [Scilit]
- Khan, S.A.; Nafees, M. Construction of dams on Kabul River and its socio-economic implications for Khyber Pakhtunkhwa, Pakistan. Cent. Asia 2018, 83, 1–18. [Google Scholar] [CrossRef] [Scilit]
- Tangi, M.; Schmitt, R.; Almeida, R.; Bossi, S.; Flecker, A.; Sala, F.; Castelletti, A. Robust hydropower planning balances energy generation, carbon emissions and sediment connectivity in the Mekong River Basin. Earth’s Future 2024, 12, 3647. [Google Scholar] [CrossRef] [Scilit]
- Wang, L.; Yang, Z.L. Changes in land use influenced by anthropogenic activity. In Oxford Research Encyclopedia of Environmental Science; Oxford University Press: Oxford, UK, 2020. [Google Scholar]
- Abdo, Z.A.; Prakash, S. A review paper on monitoring environmental consequences of land cover dynamics with the help of geo-informatics technologies. Geosfera Indones. 2020, 5, 364–389. [Google Scholar] [CrossRef] [Scilit]
- Chidananda, A.V.; Agasnalli, C.; Narayana, G.; Nerlikar, D. Land use and land cover change dynamics analysis using remote sensing and GIS technologies: A review. J. Res. Environ. Earth Sci. 2025, 11, 33–38. [Google Scholar] [CrossRef] [Scilit]
- Lambin, E.F.; Geist, H.J.; Lepers, E. Dynamics of land-use and land-cover change in tropical regions. Annu. Rev. Environ. Resour. 2003, 28, 205–241. [Google Scholar] [CrossRef] [Scilit]
- Song, X.P.; Hansen, M.C.; Stehman, S.V.; Potapov, P.V.; Tyukavina, A.; Vermote, E.F.; Townshend, J.R. Global land change from 1982–2016. Nature 2018, 560, 639–643. [Google Scholar] [CrossRef] [Scilit]
- Turner, B.; Meyer, W.B.; Skole, D.L. Global land-use/land-cover change: Towards an integrated study. Ambio 1994, 23, 91–95. [Google Scholar]
- Mir, Y.H.; Mir, S.; Ganie, M.A.; Bhat, J.A.; Shah, A.M.; Mushtaq, M.; Irshad, I. Overview of land use and land cover change and its impacts on natural resources. In Ecologically Mediated Development: Promoting Biodiversity Conservation and Food Security; Springer Nature: Singapore, 2025; pp. 101–130. [Google Scholar]
- Zhang, A.; Tariq, A.; Quddoos, A.; Naz, I.; Aslam, R.W.; Barboza, E.; Abdullah-Al-Wadud, M. Spatio-temporal analysis of urban expansion and land use dynamics using google earth engine and predictive models. Sci. Rep. 2025, 15, 69–93. [Google Scholar] [CrossRef] [Scilit]
- Dembele, B.A.; Traore, S.S.; Omobowale, M. Analysis and monitoring of land use and land cover (LULC) changes from 1990 to 2023 in Faragouaran Municipality Southern Mali. GeoJournal 2025, 90, 203. [Google Scholar] [CrossRef] [Scilit]
- Józefowska, A.; Loaiza-Usuga, J.C.; Schmidt, O. Consequences of land-use changes for soil quality and function, with a focus on the EU and Latin America. In Climate Change and Soil Interactions; Elsevier: New York, NY, USA, 2020; Volume 11, pp. 207–228. [Google Scholar]
- Delelegn, Y.T.; Purahong, W.; Blazevic, A.; Yitaferu, B.; Wubet, T.; Göransson, H.; Godbold, D.L. Changes in land use alter soil quality and aggregate stability in the highlands of northern Ethiopia. Sci. Rep. 2017, 7, 13602. [Google Scholar] [CrossRef] [Scilit]
- Fartyal, A.; Bargali, S.S.; Bargali, K.; Negi, B. Changes in soil properties, organic carbon, and nutrient stocks after land-use change from forests to grasslands in Kumaun Himalaya, India. Land Degrad. Dev. 2025, 36, 2438–2457. [Google Scholar] [CrossRef] [Scilit]
- Ngatia, L.; Moriasi, D.; Grace, J.M., III; Fu, R.; Gardner, C.; Taylor, R. Land Use Change Affects Soil Organic Carbon: An Indicator of Soil Health. In Environmental Health; Otsuki, T., Ed.; IntechOpen: London, UK, 2021; pp. 1–15. [Google Scholar]
- Mojiri, A.; Emami, N.; Ghafari, N. Effects of land use changes on soil quality attributes (a review). Adv. Nat. Appl. Sci. 2011, 5, 42–46. [Google Scholar]
- Bohenek, J.; Sulliván, S. Inland waters Rivers: Land use and water quality. Encycl. Inland Waters 2022, 5, 453–470. [Google Scholar]
- DeFries, R.; Eshleman, K. Land-use change and hydrologic processes: A major focus for the future. Hydrol. Process. 2004, 18, 2183–2186. [Google Scholar] [CrossRef] [Scilit]
- Camara, M.; Jamil, N.R.; Abdullah, A. Impact of land uses on water quality in Malaysia: A review. Ecol. Process. 2019, 8, 10. [Google Scholar] [CrossRef] [Scilit]
- Gunawardana, C.; McDonald, W. Impacts of land use changes on discharge and water quality in rivers and streams: Case study of the continental United States. J. Am. Water Resour. Assoc. 2024, 60, 725–740. [Google Scholar] [CrossRef] [Scilit]
- Hajihosseini, M.; Hajihosseini, H.; Morid, S.; Delavar, M.; Booij, M. Impacts of land use changes and climate variability on transboundary Hirmand River using SWAT. J. Water Clim. Change 2019, 11, 1695–1711. [Google Scholar] [CrossRef] [Scilit]
- Noorali, H.; Ahmadi, S.A.; Campana, M.; Barroudi, M. Evaluation of environmental factors affecting hydropolitics of helmand transboundary basin. Iran Cauc. 2025, 29, 77–89. [Google Scholar] [CrossRef] [Scilit]
- Manetu, W.M.; Mironga, J.M.; Ondiko, J.H. Remote sensing for land resources: A review on satellites, data availability and applications. Am. J. Remote Sens. 2023, 10, 39–49. [Google Scholar]
- Mashala, M.; Dube, T.; Mudereri, B.; Ayisi, K.; Ramudzuli, M. A systematic review on advancements in remote sensing for assessing and monitoring land use and land cover changes impacts on surface water resources in semi-arid tropical environments. Remote Sens. 2023, 15, 3926. [Google Scholar] [CrossRef] [Scilit]
- Parece, T.; Campbel, J. Land use land cover monitoring and geospatial technologies. Adv. Watershed Sci. Assess. 2015, 33, 1–32. [Google Scholar]
- Roy, P.S.; Roy, A. Land use and land cover change in India: Aremote sensing and GIS prespective. J. Indian Sci. 2010, 90, 489–502. [Google Scholar]
- Sun, Z.; Zhang, R. Multidimensional applications of remote sensing technology in land use monitoring and efficacy analysis. Front. Sustain. Dev. 2024, 4, 49–54. [Google Scholar] [CrossRef] [Scilit]
- Abegeja, D. The application of satellite sensors, current state of utilization, and sources of remote sensing dataset in hydrology for water resource management. J. Water Health 2024, 22, 1162–1179. [Google Scholar] [CrossRef] [Scilit]
- Drogkoula, M.; Kokkinos, K.; Samaras, N. A comprehensive survey of machine learning methodologies with emphasis in water resources management. Appl. Sci. 2023, 13, 12147. [Google Scholar] [CrossRef] [Scilit]
- Hadadi, F.; Moazenzadeh, R.; Mohammadi, B. Estimation of actual evapotranspiration: A novel hybrid method based on remote sensing and artificial intelligence. J. Hydrol. 2022, 609, 127774. [Google Scholar] [CrossRef] [Scilit]
- Kim, Y.I.; Park, W.H.; Shin, Y.; Park, J.W.; Engel, B.; Yun, Y.J.; Jang, W.S. Applications of Machine Learning and Remote Sensing in Soil and Water Conservation. Hydrology 2024, 11, 183. [Google Scholar] [CrossRef] [Scilit]
- Liu, D.; Wang, Z.; Wang, L.; Chen, J.; Li, C.; Shi, Y. Improved remote sensing reference evapotranspiration estimation using simple satellite data and machine learning. Sci. Total Environ. 2024, 947, 174480. [Google Scholar] [CrossRef] [Scilit] [PubMed]
- Mekonnen, Y.G.; Alamirew, T.; Chukalla, A.D.; Malede, D.A.; Yalew, S.G.; Mengistu, A.F. Remote sensing in hydrology: A systematic review of its applications in the Upper Blue Nile Basin, Ethiopia. HydroResearch 2024, 8, 1–12. [Google Scholar] [CrossRef] [Scilit]
- Zhao, X.; Wang, H.; Bai, M.; Xu, Y.; Dong, S.; Rao, H.; Ming, W. A Comprehensive Review of Methods for Hydrological Forecasting Based on Deep Learning. Water 2024, 16, 1407. [Google Scholar] [CrossRef] [Scilit]
- Issa, S.; Sultan, M. Land Use and Land Cover Mapping Using Google Earth Engine: A Comparative Analysis of Machine Learning Algorithms. In Proceedings of the Seventh International Conference on Engineering Geophysics, Al Ain, United Arab Emirates, 14–17 October 2024; pp. 147–151. [Google Scholar]
- Reddy, G.O.; Kumar, K.A. Machine learning algorithms for optical remote sensing data classification and analysis. In Data Science in Agriculture and Natural Resource Management; Mishra, G., Ed.; Springer: Singapore, 2021; pp. 195–220. [Google Scholar]
- Vijay, A.; Varija, K. Spatio-temporal classification of land use and land cover and its changes in Kerala using remote sensing and machine learning approach. Environ. Monit. Assess. 2024, 196, 459. [Google Scholar] [CrossRef] [Scilit]
- Zhao, Z.; Islam, F.; Waseem, L.A.; Tariq, A.; Nawaz, M.; Islam, I.U.; Hatamleh, W.A. Comparison of three machine learning algorithms using google earth engine for land use land cover classification. Rangel. Ecol. Manag. 2024, 92, 129–137. [Google Scholar] [CrossRef] [Scilit]
- Dangayach, R.; Pandey, A.K. Technologies and methods for land use and land cover: A comprehensive review. In Remote Sensing and GIS Application in Forest Conservation Planning; Springer Nature: Cham, Switzerland, 2025; pp. 369–390. [Google Scholar]
- Farda, N.M. Multi-temporal land use mapping of coastal wetlands area using machine learning in Google earth engine. In Proceedings of the 5th Geoinformation Science Symposium, Yogyakarta, Indonesia, 27–28 September 2017. [Google Scholar]
- Feizizadeh, B.; Omarzadeh, D.; Kazemi Garajeh, M.; Lakes, T.; Blaschke, T. Machine learning data-driven approaches for land use/cover mapping and trend analysis using Google Earth Engine. J. Environ. Plan. Manag. 2023, 66, 665–697. [Google Scholar] [CrossRef] [Scilit]
- Masalvad, S.K.; Patil, C.; Vardhan, A.R.; Yadav, A.; Lavanya, B.; Sakare, P.K. Predicting land use changes and ecosystem service impacts with CA-Markov and machine learning techniques. Environ. Dev. Sustain. 2025, 1–23. [Google Scholar] [CrossRef] [Scilit]
- Singh, R.K.; Singh, P.; Drews, M.; Kumar, P.; Singh, H.; Gupta, A.K.; Kumar, M. A machine learning-based classification of LANDSAT images to map land use and land cover of India. Remote Sens. Appl. Soc. Environ. 2021, 24, 100624. [Google Scholar] [CrossRef] [Scilit]
- Aburas, M.; Ahamad, M.S.S.; Omar, N.Q. Spatio-temporal simulation and prediction of land-use change using conventional and machine learning models. Environ. Monit. Assess. 2019, 191, 205. [Google Scholar] [CrossRef] [Scilit]
- Hamad, R. An assessment of artificial neural networks, support vector machines and decision trees for land cover classification using sentinel-2 data. Sciences 2020, 8, 459–464. [Google Scholar] [CrossRef] [Scilit]
- Hebryn-Baidy, L.; Rees, G. Machine Learning Algorithms Evaluated for Urban Land Use and Land Cover Classification Using Sentinel 2 Data. Red 2024, 10, 664. [Google Scholar]
- Chaturvedi, V.; deVries, W.T. Machine Learning Algorithms for Urban Land Use Planning: A Review. Urban Sci. 2021, 5, 68. [Google Scholar] [CrossRef] [Scilit]
- Siddique, I. Machine learning empowered geographic information systems: Advancing Spatial analysis and decision making. World J. Adv. Res. Rev. 2024, 22, 10–30574. [Google Scholar] [CrossRef] [Scilit]
- Abdi, A.M. Land cover and land use classification performance of machine learning algorithms in a boreal landscape using Sentinel-2 data. GIScience Remote Sens. 2020, 57, 1–20. [Google Scholar] [CrossRef] [Scilit]
- Musali, S.K.; Janthakal, R.; Rajasekhar, N. Holdout based blending approaches for improved satellite image classification. J. Electr. Comput. Eng. 2024, 14, 2088–8708. [Google Scholar]
- Swetanisha, S.; Panda, A.R.; Behera, D.K. Land use/land cover classification using machine learning models. J. Electr. Comput. Eng. 2022, 12, 2088–8708. [Google Scholar] [CrossRef] [Scilit]
- Xu, S.; Zhao, Q.; Yin, K.; Zhang, F.; Liu, D.; Yang, G. Combining random forest and support vector machines for object-based rural-land-cover classification using high spatial resolution imagery. J. Appl. Remote Sens. 2019, 13, 014521. [Google Scholar] [CrossRef] [Scilit]
- RajaPerumal, R.N.; Sivasubramaniyan, T. Identifying land use land cover dynamics using machine learning method and GIS approach in Karaivetti, Tamil Nadu. J. Auton. Intell. 2024, 7, 1–15. [Google Scholar]
- Bhatt, A.; Thakur, V. An optimized deep belief network for land cover classification using synthetic-aperture radar images and Landsat images. Comput. J. 2023, 66, 2043–2058. [Google Scholar] [CrossRef] [Scilit]
- Fayaz, M.; Nam, J.; Dang, L.M.; Song, H.K.; Moon, H. Land-cover classification using deep learning with high-resolution remote-sensing imagery. Appl. Sci. 2024, 14, 1844. [Google Scholar] [CrossRef] [Scilit]
- Ou, C.; Yang, J.; Du, Z.; Li, P.; Zhu, D. Simulating multiple land use changes by incorporating deep belief network into cellular automata: A case study in Beijing-Tianjinhebei region, China. In Proceedings of the 21st AGILE Conference on Geographic Information Science, Lund, Sweden, 12–15 June 2018; pp. 12–15. [Google Scholar]
- Peng, M.; Liu, Y.; Khan, A.; Ahmed, B.; Sarker, S.K.; Ghadi, Y.Y.; Ali, Y.A. Crop monitoring using remote sensing land use and land change data: Comparative analysis of deep learning methods using pre-trained CNN models. Big Data Res. 2024, 36, 100448. [Google Scholar] [CrossRef] [Scilit]
- Ekeanyanwu, C.V.; Obisakin, I.F.; Aduwenye, P.; Dede-Bamfo, N. Merging GIS and machine learning techniques: A paper review. J. Geosci. Environ. Prot. 2022, 10, 61–83. [Google Scholar] [CrossRef]
- Shahbazbegian, M.R.; Dinar, A. Painted water: A Concept to Shape Water Negotiation Strategies in Shared River Basins. Water 2023, 15, 334. [Google Scholar] [CrossRef] [Scilit]
- Mianabadi, H.; Alioghli, S.; Morid, S. Quantitative evaluation of no-harm rule in international transboundary water law in the Helmand River basin. J. Hydrol. 2021, 599, 126368. [Google Scholar] [CrossRef] [Scilit]
- Hanifi, S.M. Water in Afghanistan: A modern history. Water Hist. 2024, 16, 141–164. [Google Scholar] [CrossRef] [Scilit]
- Maleki, S.; Mohajeri, S.H.; Samadi, A.; Hasani, H.; Akbary, M. Remote sensing insights into water allocation and evaporation challenges in the Hirmand River Basin, after the operation of Kamal Khan Dam. J. Hydrol. Reg. Stud. 2024, 56, 101996. [Google Scholar] [CrossRef] [Scilit]
- Whitney, J.W. Geology, water, and wind in the lower Helmand Basin, southern Afghanistan. Sci. Investig. Rep. 2006, 5182, 40. [Google Scholar]
- Yosufi, N.A. Foreign Development Assistance in Afghanistan, 2001–2018: A Critical Analysis. Himal. Cent. Asian Stud. 2019, 23, 165–174. [Google Scholar]
- Loodin, N.; Eckstein, G.; Singh, V.P.; Sanchez, R. Assessment of the trust crisis between upstream and downstream states of the Helmand River Basin (1973–2022): A half-century of optimism or cynicism. ACS EST Water 2023, 3, 1654–1668. [Google Scholar] [CrossRef] [Scilit]
- Akbari, M.; Torabi Haghighi, A. Satellite-based agricultural water consumption assessment in the ungauged and transboundary Helmand Basin between Iran and Afghanistan. Remote Sens. Lett. 2022, 13, 1236–1248. [Google Scholar] [CrossRef] [Scilit]
- Ponzoni, F.J.; Dos Santos, S.B. Conversão de números digitais de imagens orbitais em valores de FRB de superfície. Bol. Ciências Geod. 2008, 14, 541–556. [Google Scholar]
- Sun, A.; He, S.; Gu, Y.; Li, P.; Liu, C.; Ye, G.; Zhou, F. Performance Assessment of Landsat-9 Atmospheric Correction Methods in Global Aquatic Systems. Remote Sens. 2024, 16, 4517. [Google Scholar] [CrossRef] [Scilit]
- Xu, C.; Feng, X.; Xiao, P.; Wang, P. Evaluation of the surface reflectance retrieval on the satellite data. In Geoinformatics 2007: Remotely Sensed Data and Information; SPIE: Bellingham, WA, USA, 2007; Volume 6752, pp. 332–340. [Google Scholar]
- Bey, A.; Sánchez-Paus Díaz, A.; Maniatis, D.; Marchi, G.; Mollicone, D.; Ricci, S.; Miceli, G. Collect earth: Land use and land cover assessment through augmented visual interpretation. Remote Sens. 2016, 8, 807. [Google Scholar] [CrossRef] [Scilit]
- Clark, M.L.; Aide, T.M. Virtual interpretation of Earth Web-Interface Tool (VIEW-IT) for collecting land-use/land-cover reference data. Remote Sens. 2011, 3, 601–620. [Google Scholar] [CrossRef] [Scilit]
- Ghorbani, A.; Pakravan, M. Land use mapping using visual vs. digital image interpretation of TM and Google earth derived imagery in Shrivan-Darasi watershed (Northwest of Iran). J. Exp. Biol. 2013, 3, 576–582. [Google Scholar]
- Yadav, D.; Kapoor, K.; Yadav, A.K.; Kumar, M.; Jain, A.; Morato, J. Satellite image classification using deep learning approach. Earth Sci. Inform. 2024, 17, 2495–2508. [Google Scholar] [CrossRef] [Scilit]
- Lv, Q.; Dou, Y.; Niu, X.; Xu, J.; Xu, J.; Xia, F. Urban land use and land cover classification using remotely sensed SAR data through deep belief networks. J. Sens. 2015, 1, 538063. [Google Scholar] [CrossRef] [Scilit]
- Tun, S.W.; Tun, K.M.M. Object-Based Urban Land Use Classification Using Deep Belief Network. In Proceedings of the 2nd International Conference on Advanced Information Technologies, Yangon, Myanmar, 1–2 November 2018; pp. 74–80. [Google Scholar]
- Yi, L.; Zhang, G. Object-oriented Remote Sensing Imagery Classification Accuracy Assessment Based on Confusion Matrix. In Proceedings of the 20th International Conference on Geoinformatics, Beijing, China, 15–17 August 2022; pp. 1–8. [Google Scholar]
- MaHamounkar, G.S.; Netak, L.D. Comparison of Various Deep CNN Models for Land Use and Land Cover Classification. In Proceedings of the International Conference on Intelligent Human Computer Interaction, Pilani, India, 18–20 December 2021; pp. 499–510. [Google Scholar]
- Minallah, N.; Alkhalifah, A.; Khan, R.; Rahman, H.U.; Khan, S. On the Performance Analysis of Classifier Fusion for Land Cover Classification. In Proceedings of the International Conference on Recent Advances in Space Technologies, Istanbul, Turkey, 16–19 June 2015; pp. 271–275. [Google Scholar]
- Pandit, Y.; Ghosh, A. Evaluation of Supervised Classification Techniques for Land Use and Land Cover Mapping in Kalyan-Dombivali Region. In Proceedings of the International Conference on Communication and Electronics Systems, Coimbatore, India, 23–25 May 2024; pp. 1622–1629. [Google Scholar]
- Waghela, H.; Patel, S.; Sudesan, P.; Raorane, S.; Borgalli, R. Land Use Land Cover Classification Using Machine Learning. In Proceedings of the International Conference on Automation, Computing and Renewable Systems, Pune, India, 13–15 December 2022; pp. 708–711. [Google Scholar]
- Aljebreen, M.; Mengash, H.A.; Alamgeer, M.; Alotaibi, S.S.; Salama, A.S.; Hamza, M.A. Land use and land cover classification using river formation dynamics algorithm with deep learning on remote sensing images. IEEE Access 2024, 12, 11147–11156. [Google Scholar] [CrossRef] [Scilit]
- Jodhani, K.H.; Patel, D.; Madhavan, N.; Gupta, N.; Singh, S.K.; Pandey, M. ML-Based Land Use and Land Cover Classification: Assessing Performance and Predicting Future Changes. J. Hydrol. Eng. 2025, 30, 05025011. [Google Scholar] [CrossRef] [Scilit]
- Kim, J.H.; Shin, S.H.; Kang, H.C. A case study on the use of ROC curve and AUC in the evaluation of discriminant model. J. Korean Data Anal. Soc. 2018, 20, 609–619. [Google Scholar] [CrossRef] [Scilit]
- Mas, J.F. Receiver operating characteristic (ROC) analysis. In Geomatic Approaches for Modeling Land Change Scenarios; Springer International Publishing: Cham, Switzerland, 2018; pp. 465–467. [Google Scholar]
- Senge, P.M. The Fifth Discipline: The Art and Practice of the Learning Organization, 1st ed.; Doubleday/Currency: New York, NY, USA, 1990; pp. 1–424. [Google Scholar]
- Sterman, J.D. System dynamics modeling: Tools for learning in a complex world. Calif. Manag. Rev. 2001, 43, 8–25. [Google Scholar] [CrossRef] [Scilit]
- Forrester, J.W. Industrial dynamics: A major breakthrough for decision makers. Harv. Bus. Rev. 1958, 36, 37–66. [Google Scholar]
- Ford, A. Modeling the Environment, 2nd ed.; Island Press: Washington, DC, USA, 2009; pp. 1–408. [Google Scholar]
- Arfa, A.; Ayyoubzadeh, S.A.; Shafizadeh-Moghadam, H.; Mianabadi, H. Transboundary hydropolitical conflicts and their impact on river morphology and environmental degradation in the Hirmand Basin, West Asia. Sci. Rep. 2025, 15, 2754. [Google Scholar] [CrossRef] [Scilit] [PubMed]
- Albarakati, H.M.; Khan, M.A.; Hamza, A.; Khan, F.; Kraiem, N.; Jamel, L.; Almuqren, L.; Alroobaea, R. Novel deep learning architecture for agriculture land cover and land use classification from remote sensing images based on network-level fusion of self-attention architecture. IEEE J. Sel. Top. Appl. Earth Obs. Remote Sens. 2024, 17, 6338–6353. [Google Scholar] [CrossRef] [Scilit]
- Ayhan, B.; Kwan, C. Application of Deep Belief Network to Land Cover Classification Using Hyperspectral Images. In Proceedings of the International Symposium on Neural Networks, Sapporo, Japan, 21–26 June 2017; pp. 269–276. [Google Scholar]
- Bui, D.T.; Tsangaratos, P.; Nguyen, V.T.; Van Liem, N.; Trinh, P.T. Comparing the prediction performance of a Deep Learning Neural Network model with conventional machine learning models in landslide susceptibility assessment. Catena 2020, 188, 104426. [Google Scholar] [CrossRef] [Scilit]
- Maxwell, A.E.; Warner, T.A.; Guillén, L.A. Accuracy assessment in convolutional neural network-based deep learning remote sensing studies Part 1: Literature review. Remote Sens. 2021, 13, 2450. [Google Scholar] [CrossRef] [Scilit]
- Lv, Q.; Dou, Y.; Niu, X.; Xu, J.; Li, B. Classification of Land Cover Based on Deep Belief Networks Using Polarimetric RADARSAT-2 Data. In Proceedings of the IEEE Geoscience and Remote Sensing Symposium, Quebec City, Canada, 13–18 July 2014; pp. 4679–4682. [Google Scholar]
- Deng, Y.; Chen, R.; Wu, C. Examining the deep belief network for subpixel unmixing with medium spatial resolution multispectral imagery in urban environments. Remote Sens. 2019, 11, 1566. [Google Scholar] [CrossRef] [Scilit]
- Gavade, A.B.; Rajpurohit, V.S. A hybrid optimization-based deep belief neural network for the classification of vegetation area in multi-spectral satellite image. Int. J. Knowl.-Based Intell. Eng. Syst. 2020, 24, 363–379. [Google Scholar] [CrossRef] [Scilit]
- Nigar, A.; Li, Y.; Jat Baloch, M.Y.; Alrefaei, A.F.; Almutairi, M.H. Comparison of machine and deep learning algorithms using Google Earth Engine and Python for land classifications. Front. Environ. Sci. 2024, 12, 1378443. [Google Scholar] [CrossRef] [Scilit]
- Ababu, T.; Eyasu, A.; Abebe, M.; Negasa, A.; Girma, G.; Furo, G. Analysis of land use change from forest to agriculture and its determinants: The case of East Shewa Oromia Ethiopia. J. Soc. Environ. Issues 2024, 5, 75–87. [Google Scholar] [CrossRef] [Scilit]
- Drummond, M.A.; Loveland, T. Land-use Pressure and a Transition to Forest-cover Loss in the Eastern United States. BioScience 2010, 60, 286–298. [Google Scholar] [CrossRef] [Scilit]
- Akbari, M.; Mirchi, A.; Roozbahani, A.; Gafurov, A.; Klöve, B.; TorabiHaghighi, A. Desiccation of the Transboundary Hamoun Lakes between Iran and Afghanistan in Response to Hyro-climatic Droughts and Anthropogenic Activities. J. Great Lakes Res. 2021, 48, 876–889. [Google Scholar] [CrossRef] [Scilit]
- Qanbari, M.; Shahbazbegian, M. Revisiting international water law principles from the painted water lens. In The Palgrave Handbook of Environmental Policy and Law; Gordon, G.J., Kaime, T., Eds.; Springer Nature: Cham, Switzerland, 2025; pp. 311–321. [Google Scholar]
- Shahbazbegian, M.; Dinar, A. Decision Support Models to Assist International and Transboundary Water Negotiations: Methodologies and Applications; Oxford University Press: Oxford, UK, 2026; pp. 1–320. [Google Scholar]
- Kotikot, S.M.; Omitaomu, O.A. Spatial–temporal patterns of historical, near-term, and projected drought in the conterminous United States. Hydrology 2021, 8, 136. [Google Scholar] [CrossRef] [Scilit]
- Faghfouri, A.; Fortin, G.; Ullmann, A.; Raymond, F.; Poirier, C.; Dubreuil, V.; Germain, D. Trends and historical patterns of meteorological droughts in New Brunswick, Canada, using PDSI and SEDI indices. Theor. Appl. Climatol. 2025, 156, 257. [Google Scholar] [CrossRef] [Scilit]
- Sasanya, B.F.; Ademola, A.A.; Adesogan, S.O. Spatiotemporal trend analysis of precipitation, temperature, and soil moisture in selected agrarian locations within Nigeria—A comparative study. Arab. J. Geosci. 2024, 17, 228. [Google Scholar] [CrossRef] [Scilit]
- Garba, H.; Udokpoh, U.U. Analysis of trend in meteorological and hydrological time-series using Mann-Kendall and Sen’s slope estimator statistical test in Akwa Ibom state, Nigeria. Int. J. Environ. Clim. Change 2023, 13, 1017–1035. [Google Scholar] [CrossRef] [Scilit]
- Yuan, S.; Quiring, S.M. Drought in the US Great Plains (1980–2012): A sensitivity study using different methods for estimating potential evapotranspiration in the Palmer Drought Severity Index. J. Geophys. Res. Atmos. 2014, 119, 10,996–11,010. [Google Scholar] [CrossRef] [Scilit]
- Collaud Coen, M.; Andrews, E.; Bigi, A.; Martucci, G.; Romanens, G.; Vogt, F.P.; Vuilleumier, L. Effects of the prewhitening method, the time granularity, and the time segmentation on the Mann–Kendall trend detection and the associated Sen’s slope. Atmos. Meas. Tech. 2020, 13, 6945–6964. [Google Scholar] [CrossRef] [Scilit]
- Hussain, M.; Mahmud, I. pyMannKendall: A python package for non parametric Mann Kendall family of trend tests. J. Open Source Softw. 2019, 4, 1556. [Google Scholar] [CrossRef] [Scilit]
- Koudahe, K.; Koffi, D.; Kayode, J.; Awokola, S.; Adebola, A. Impact of climate variability on crop yields in southern Togo. Environ. Pollut. Clim. Chang 2018, 2, 1–9. [Google Scholar]
- Nguyen, H.M.; Ouillon, S.; Vu, V.D. Sea level variation and trend analysis by comparing Mann–Kendall test and innovative trend analysis in front of the Red River Delta, Vietnam (1961–2020). Water 2022, 14, 1709. [Google Scholar] [CrossRef] [Scilit]
- Frimpong, B.F.; Koranteng, A.; Molkenthin, F. Analysis of temperature variability utilising Mann–Kendall and Sen’s slope estimator tests in the Accra and Kumasi Metropolises in Ghana. Environ. Syst. Res. 2022, 11, 24. [Google Scholar] [CrossRef] [Scilit]
- Almalki, R.; Khaki, M.; Saco, P.M.; Rodriguez, J.F. Remote sensing assessment of dam impact on arid basins in Southern Saudi Arabia: A machine learning and space-for-time approach. J. Hydrol. Reg. Stud. 2025, 58, 102221. [Google Scholar] [CrossRef] [Scilit]
- Gou, Q.; Guo, W.; Li, Y.; Liu, J.; Wang, G. Dynamic changes in soil moisture in three typical landscapes of the Heihe River Basin. Front. Environ. Sci. 2022, 10, 1049883. [Google Scholar] [CrossRef] [Scilit]
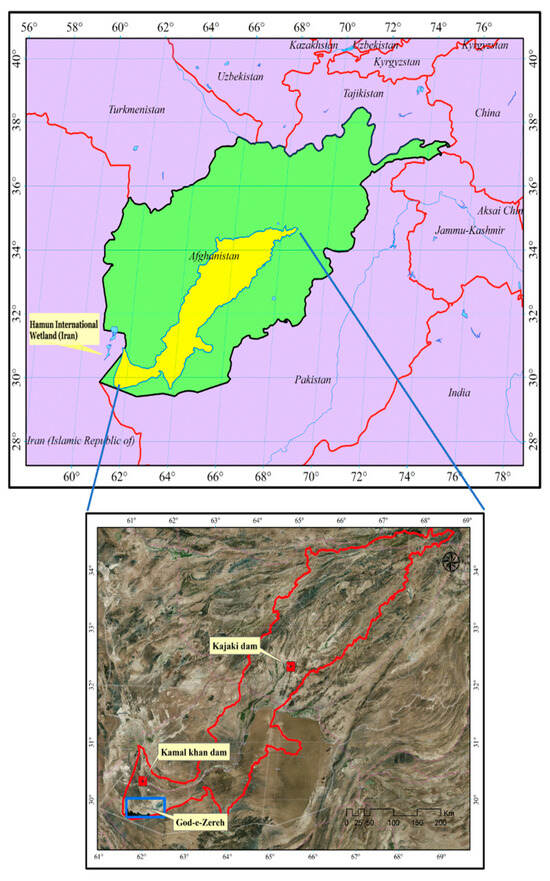
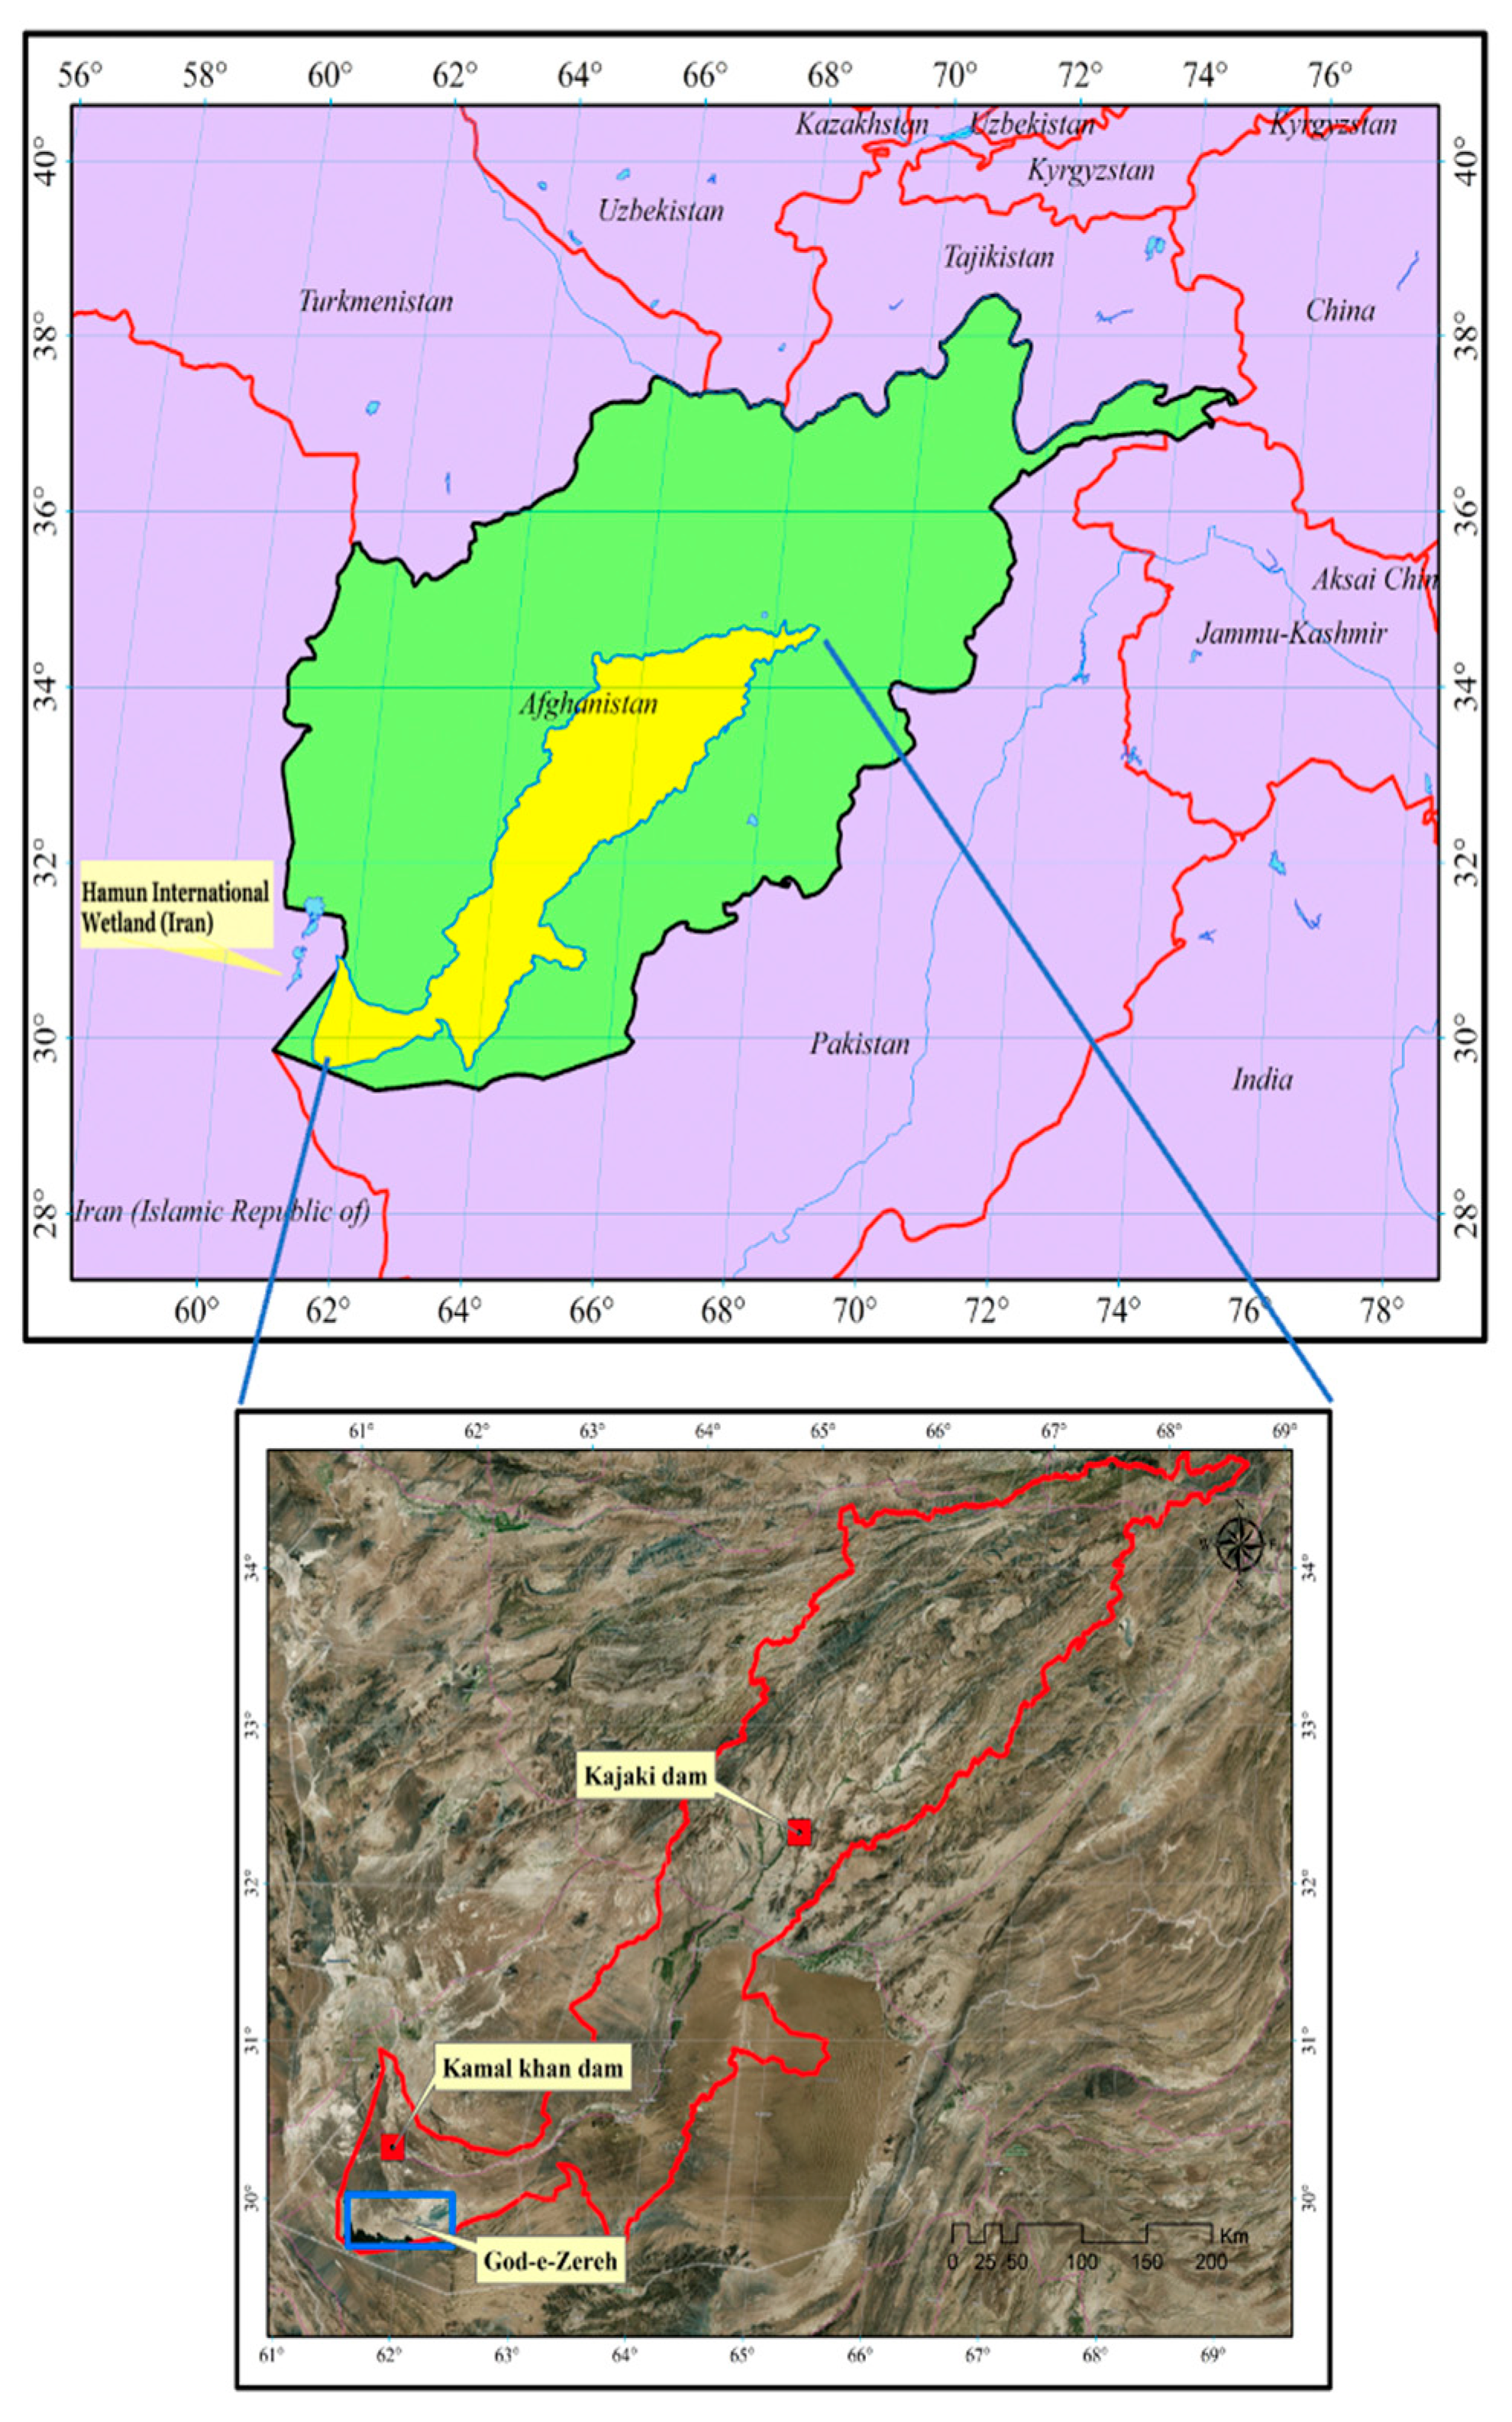
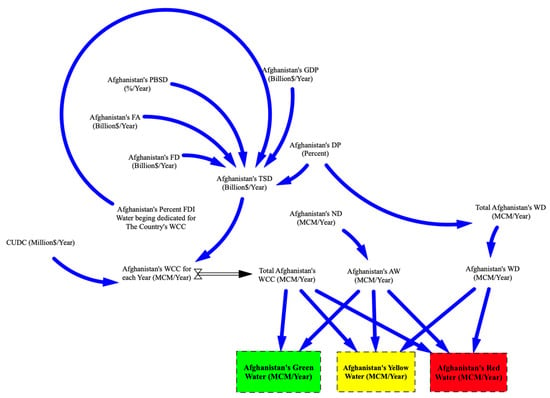
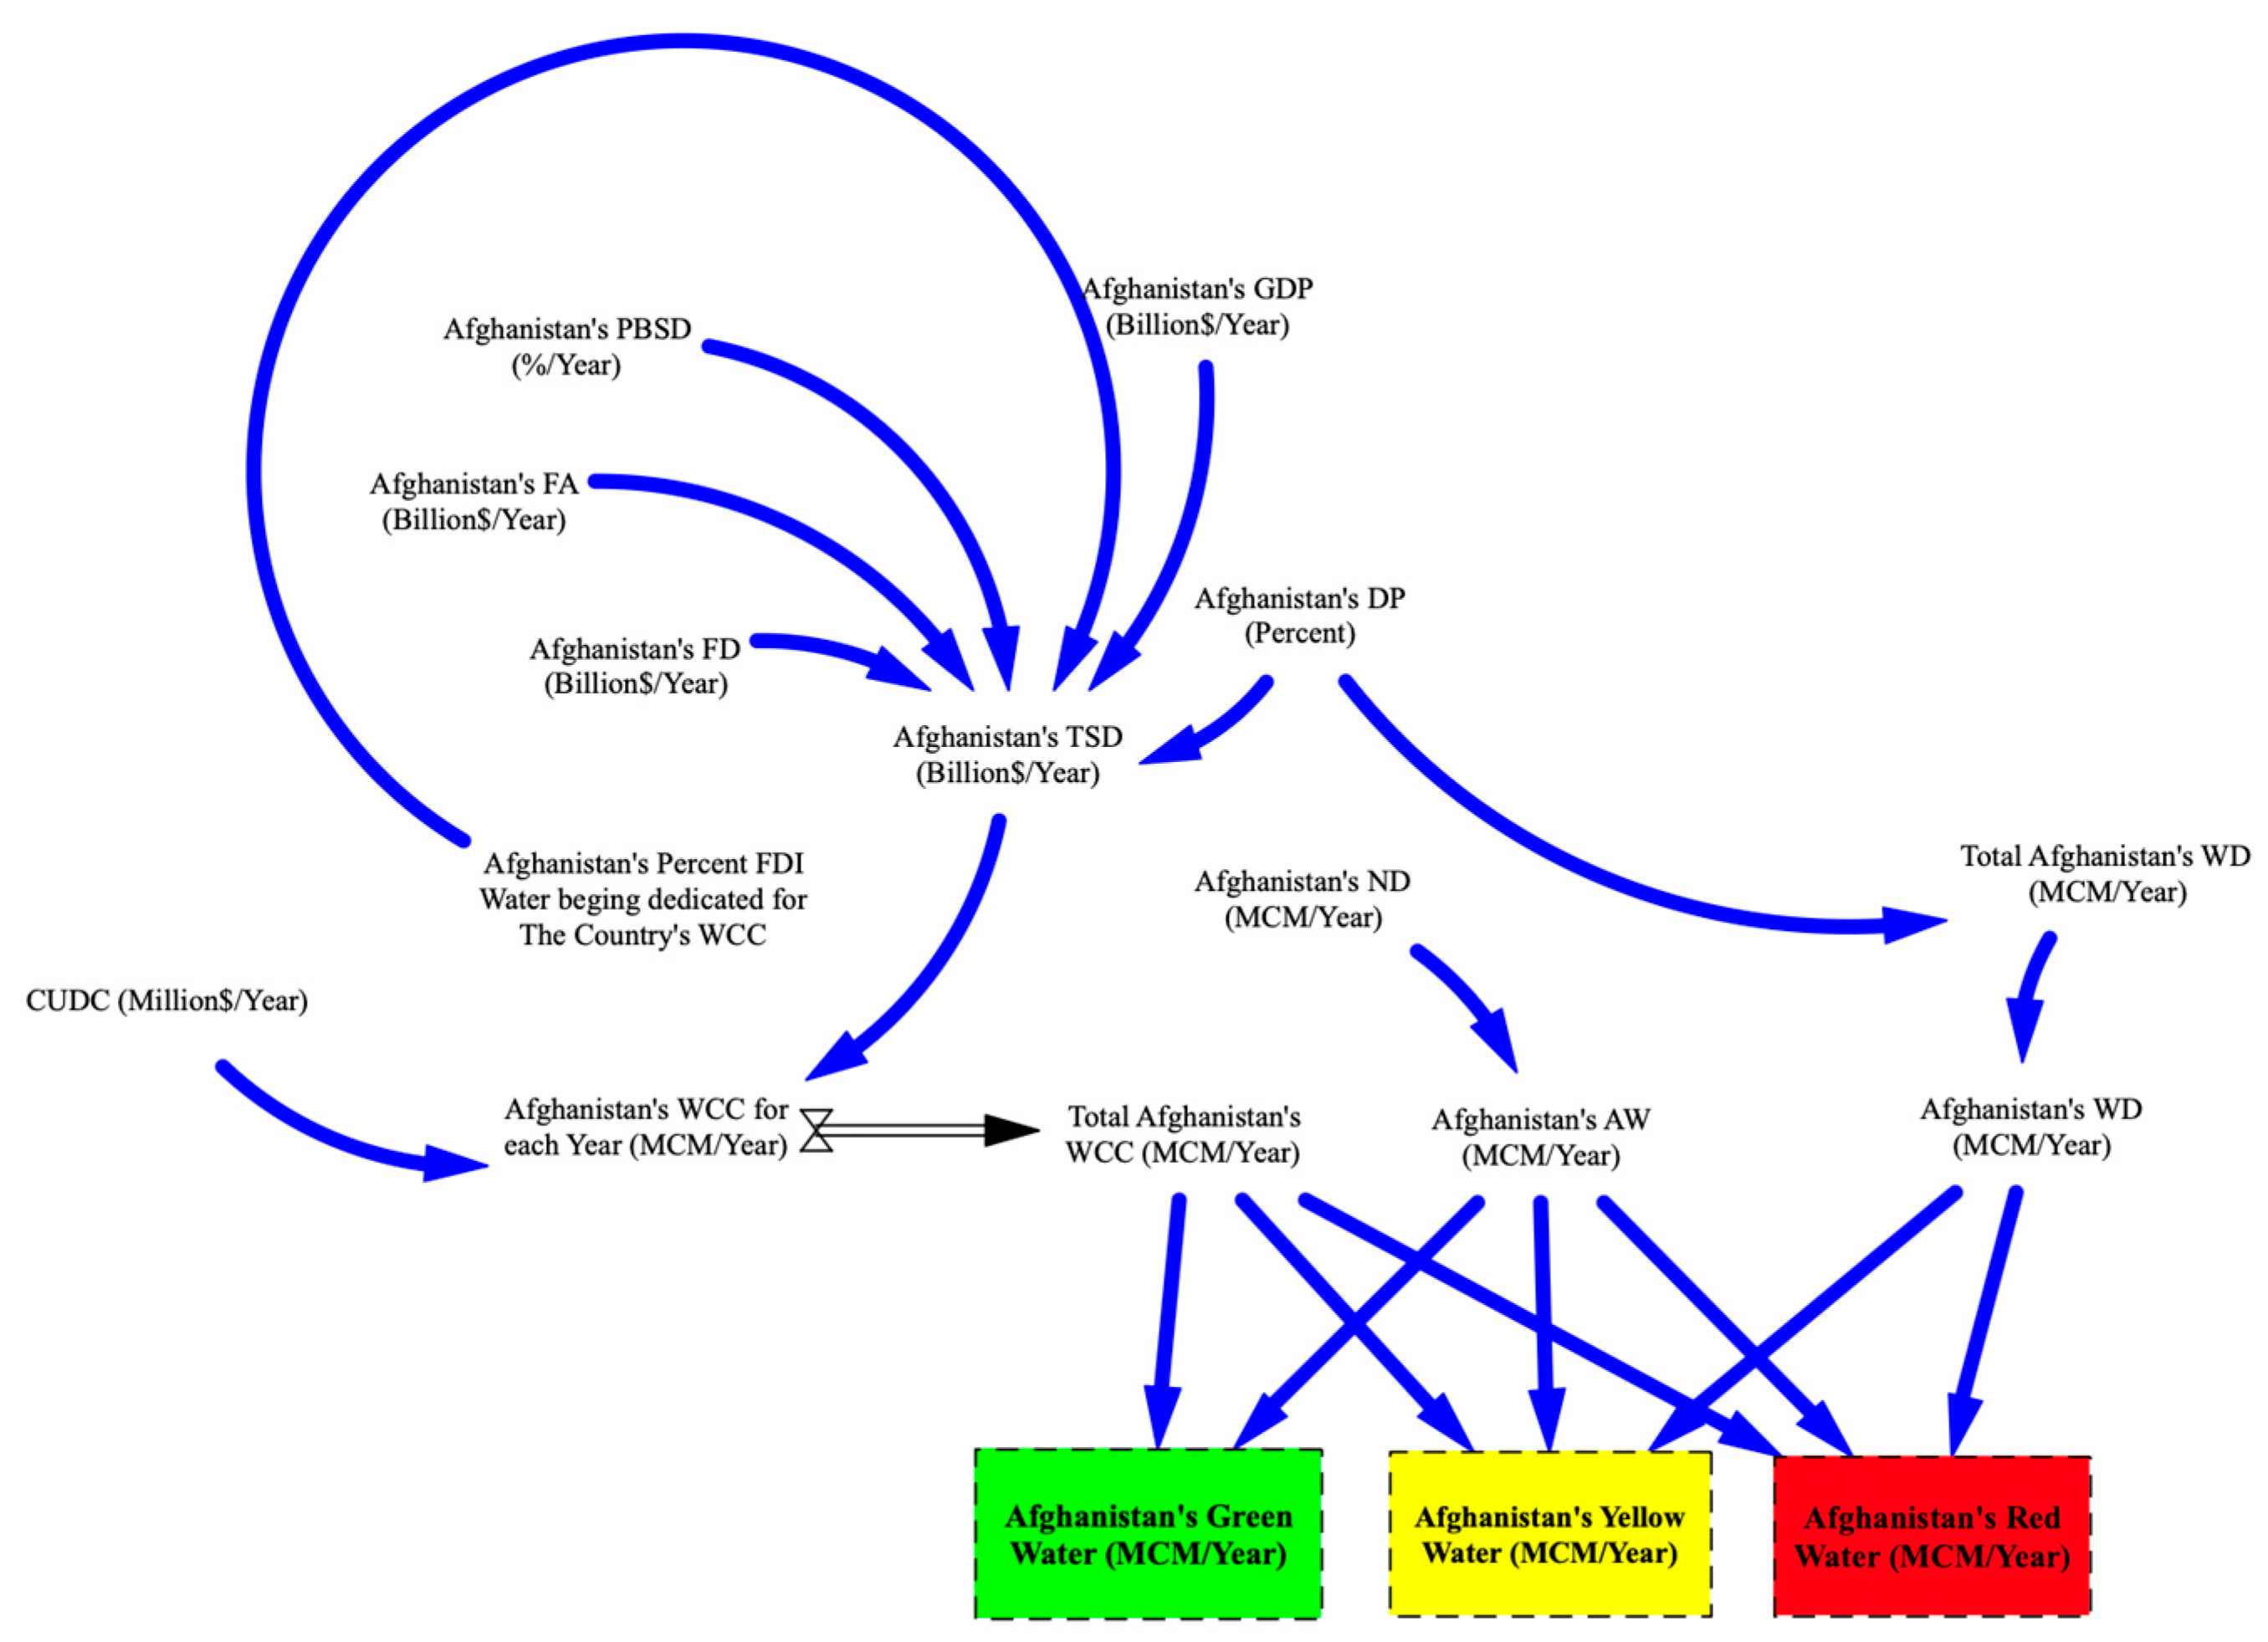
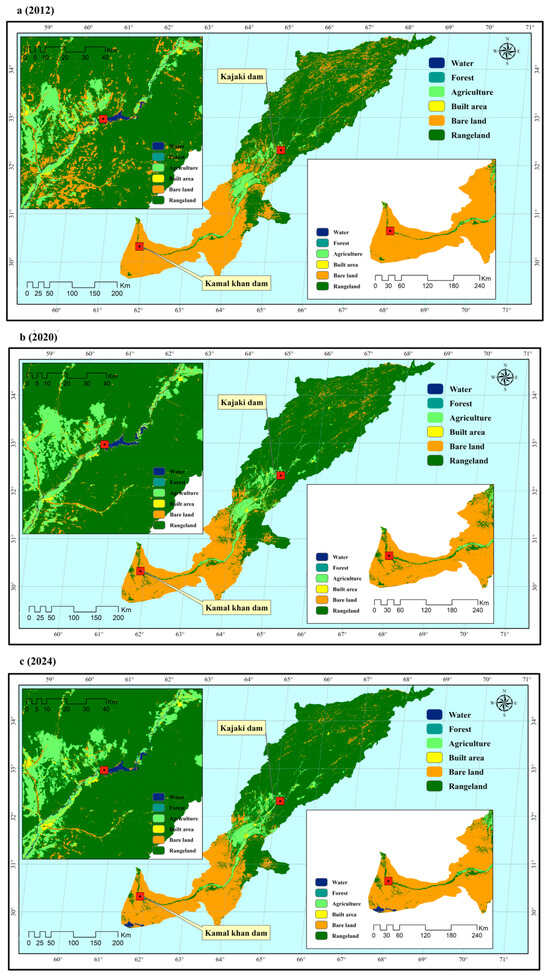
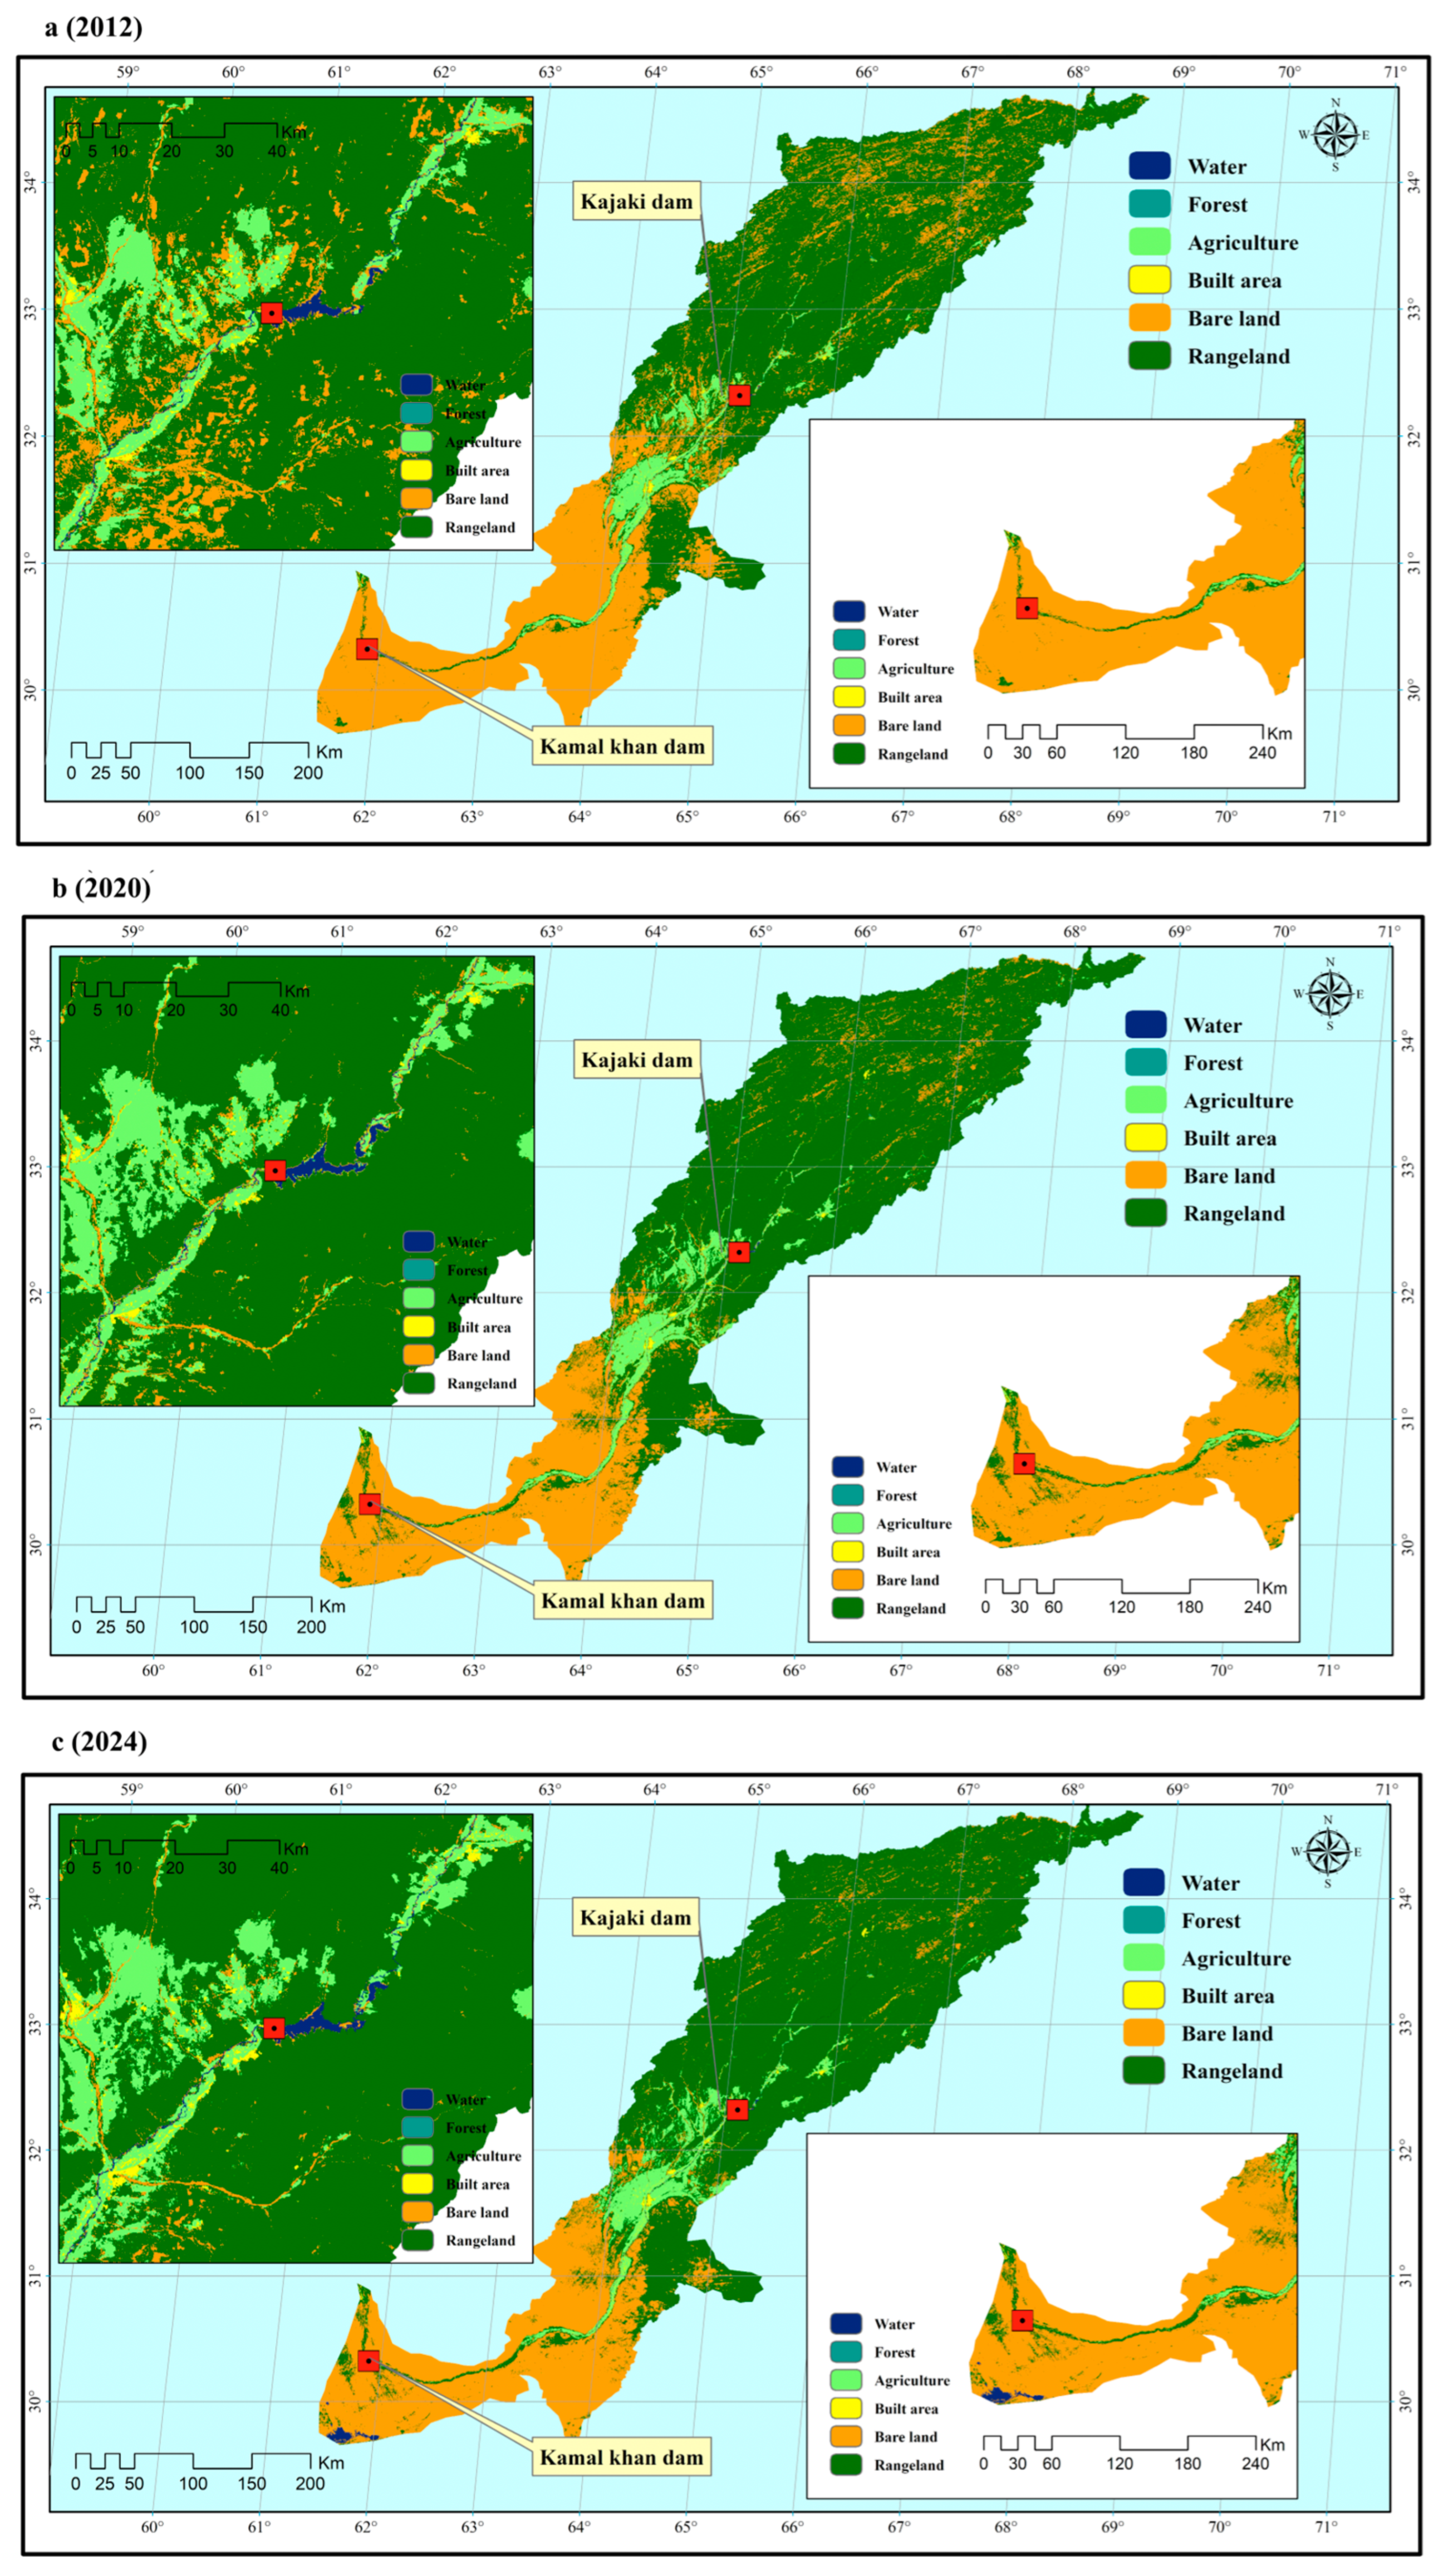
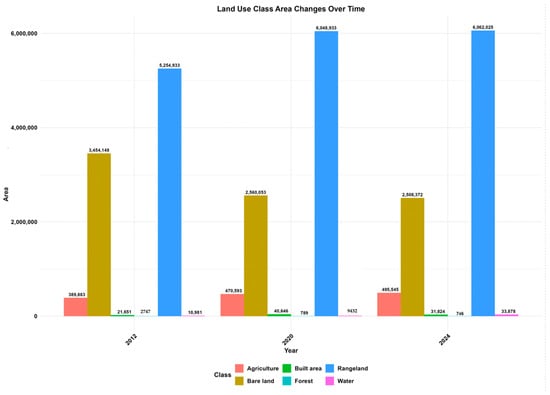
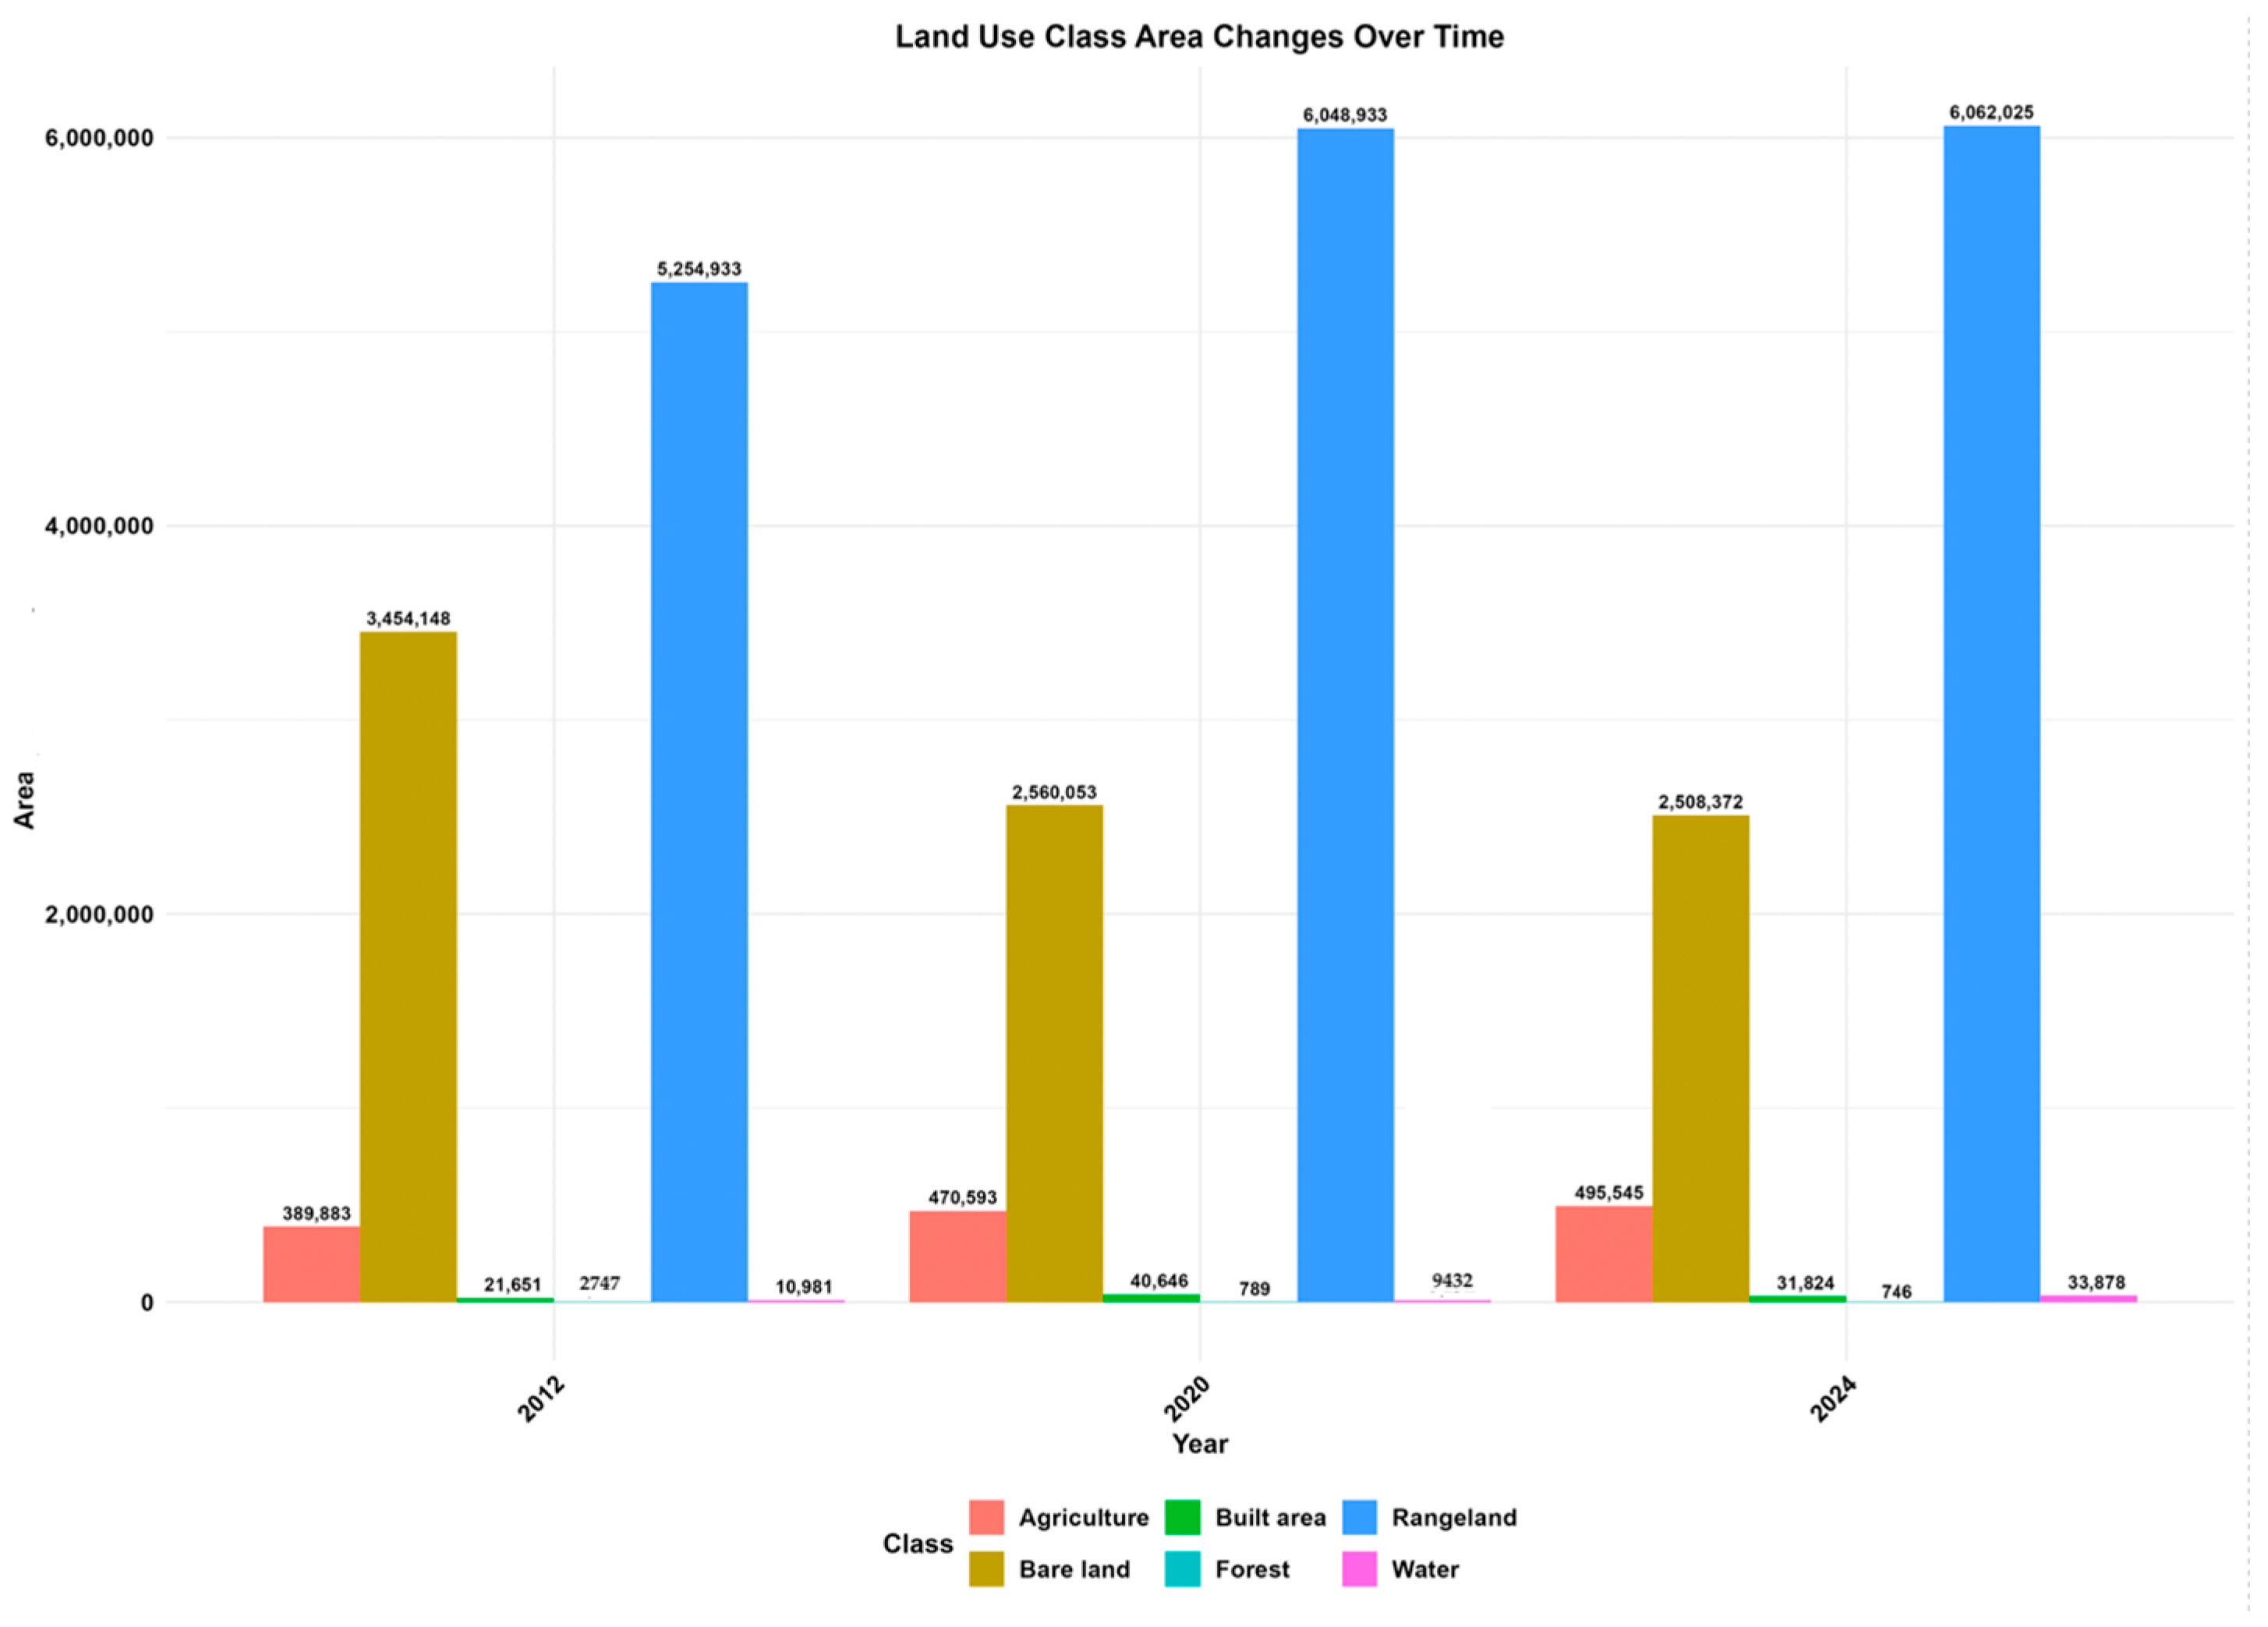
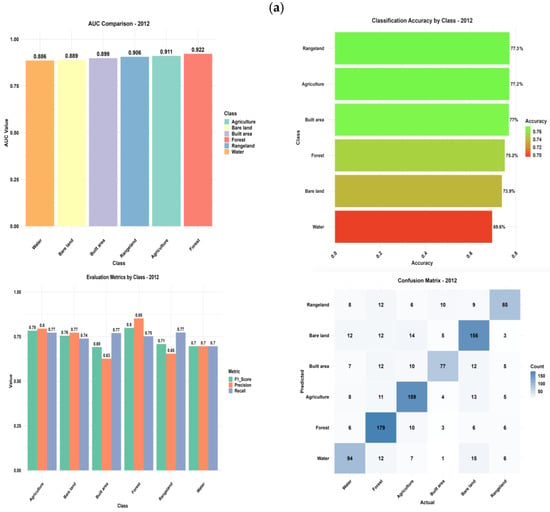
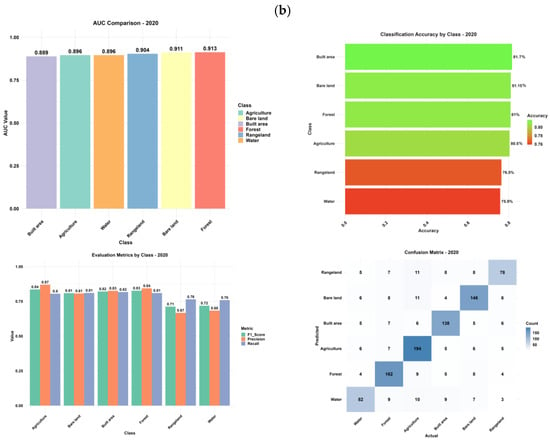
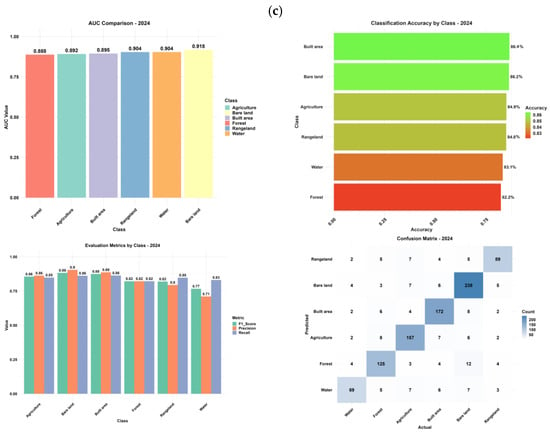
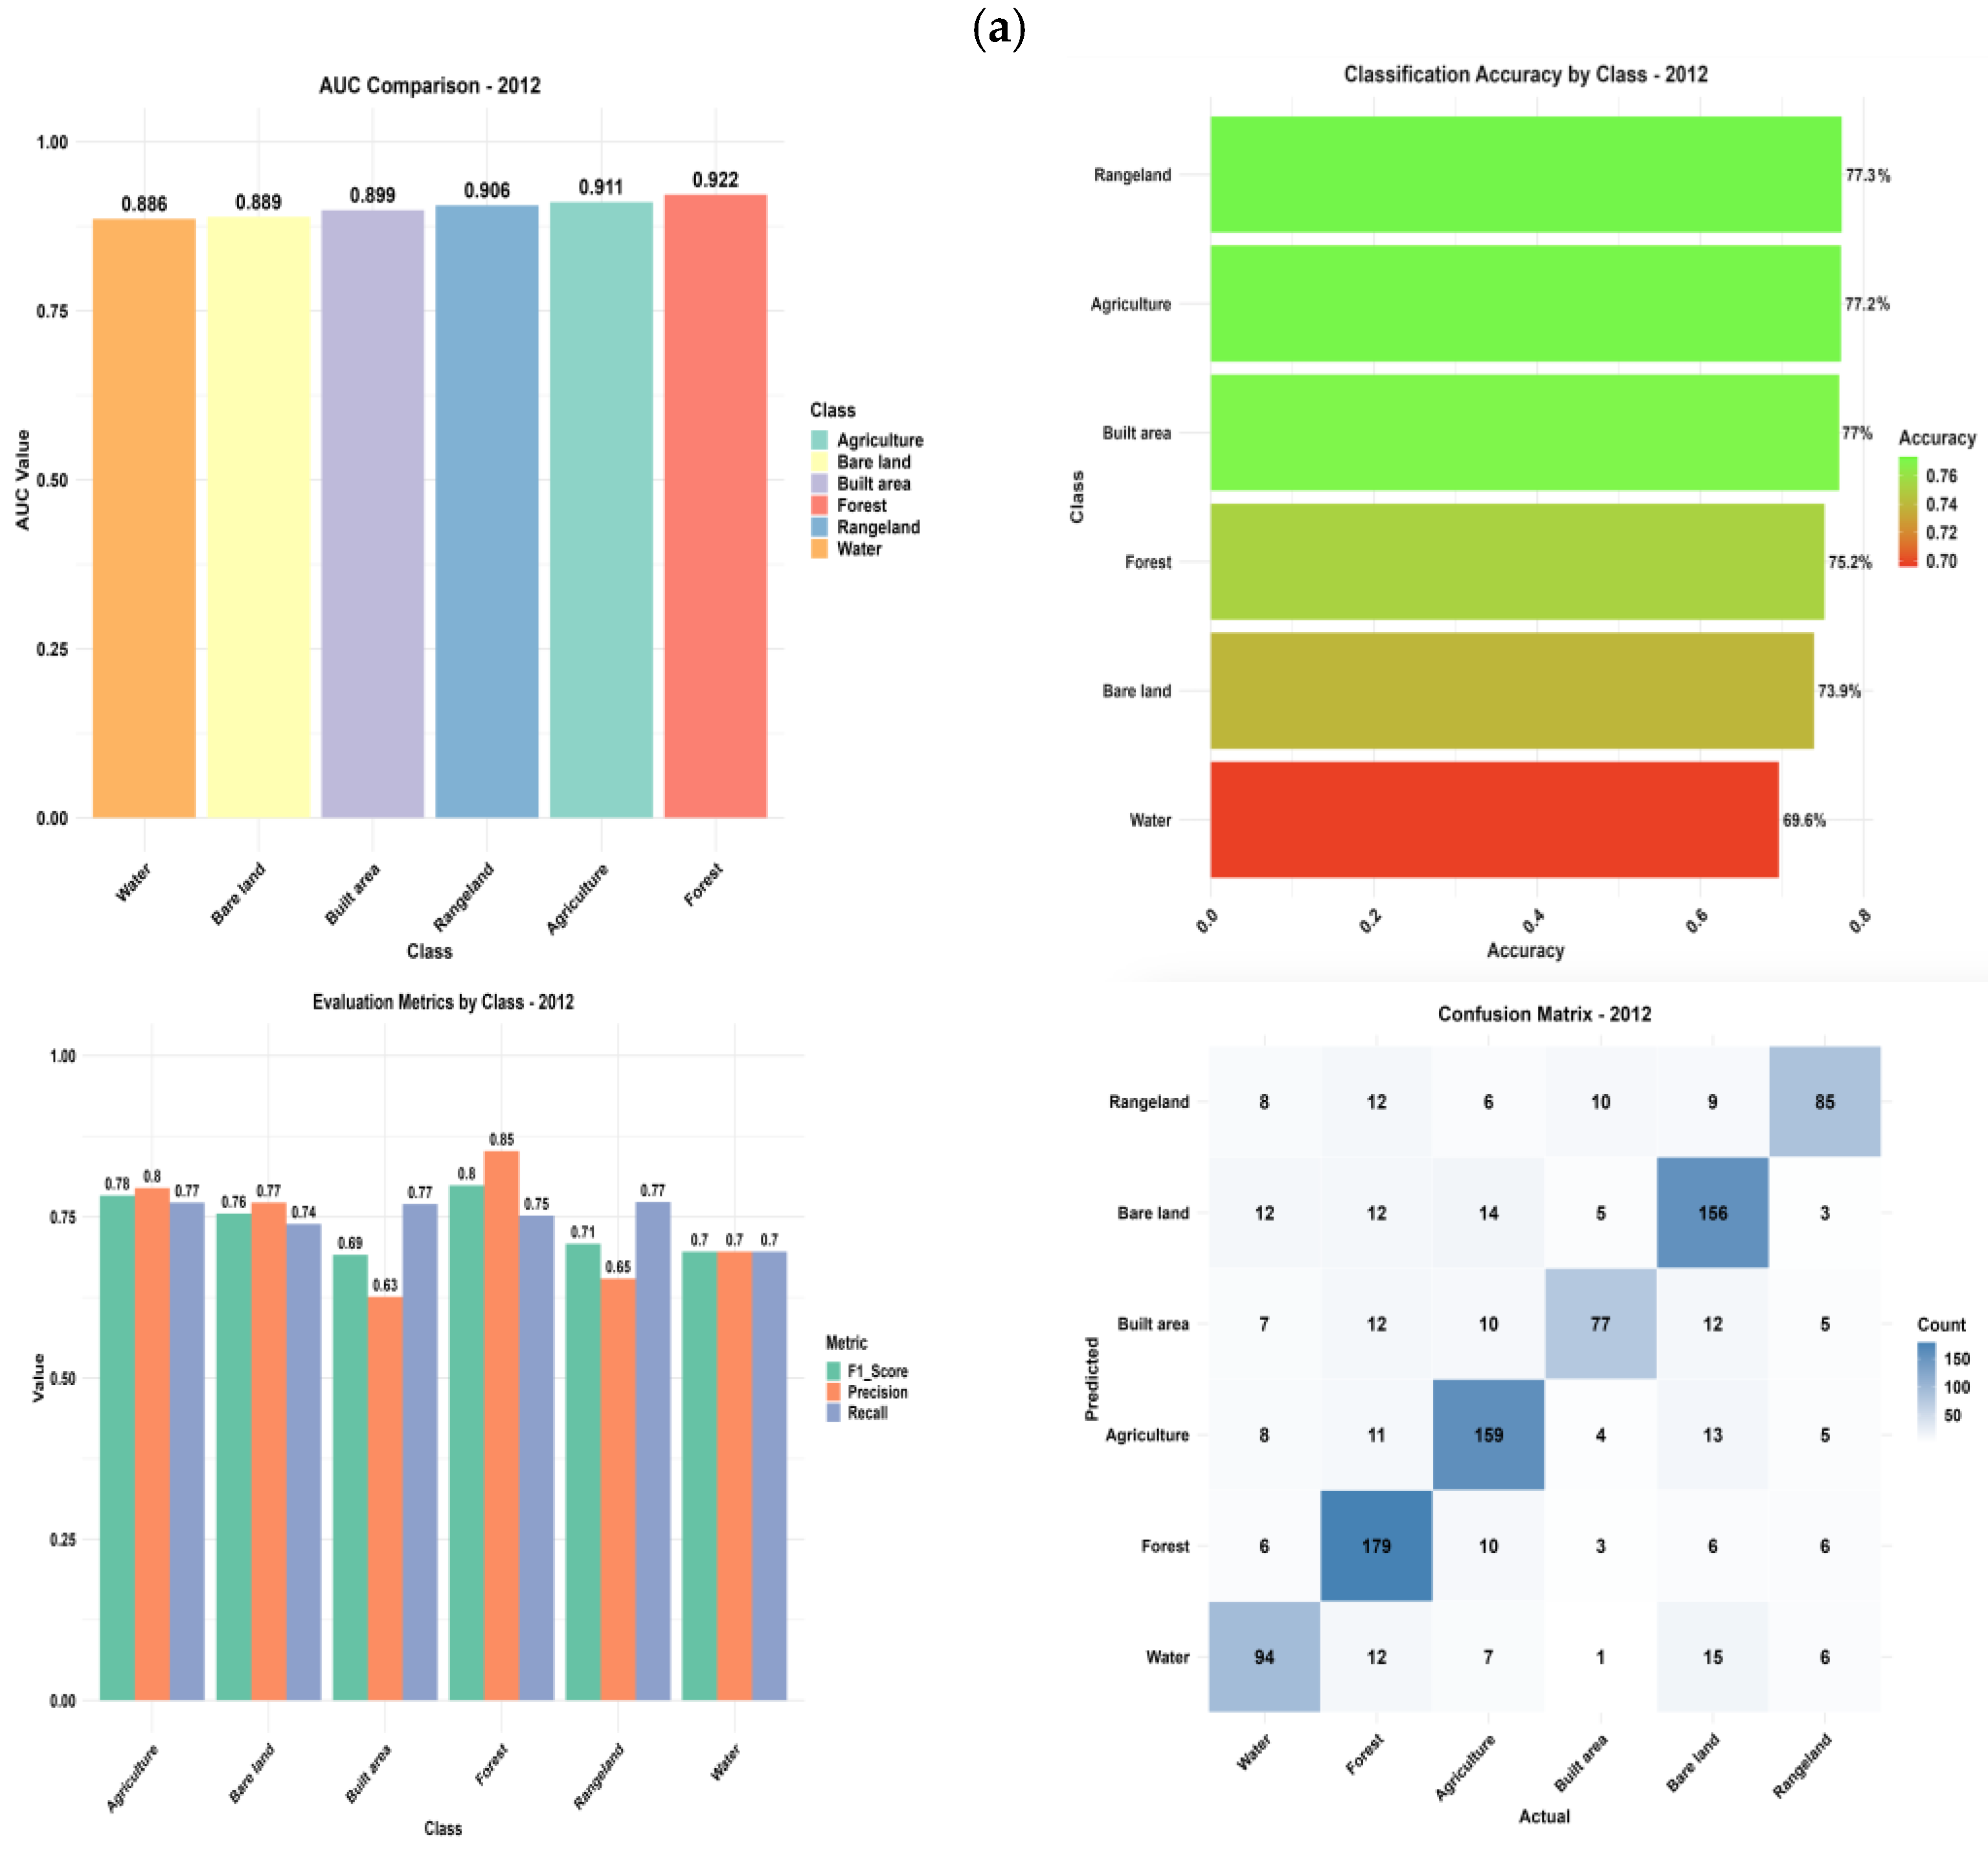
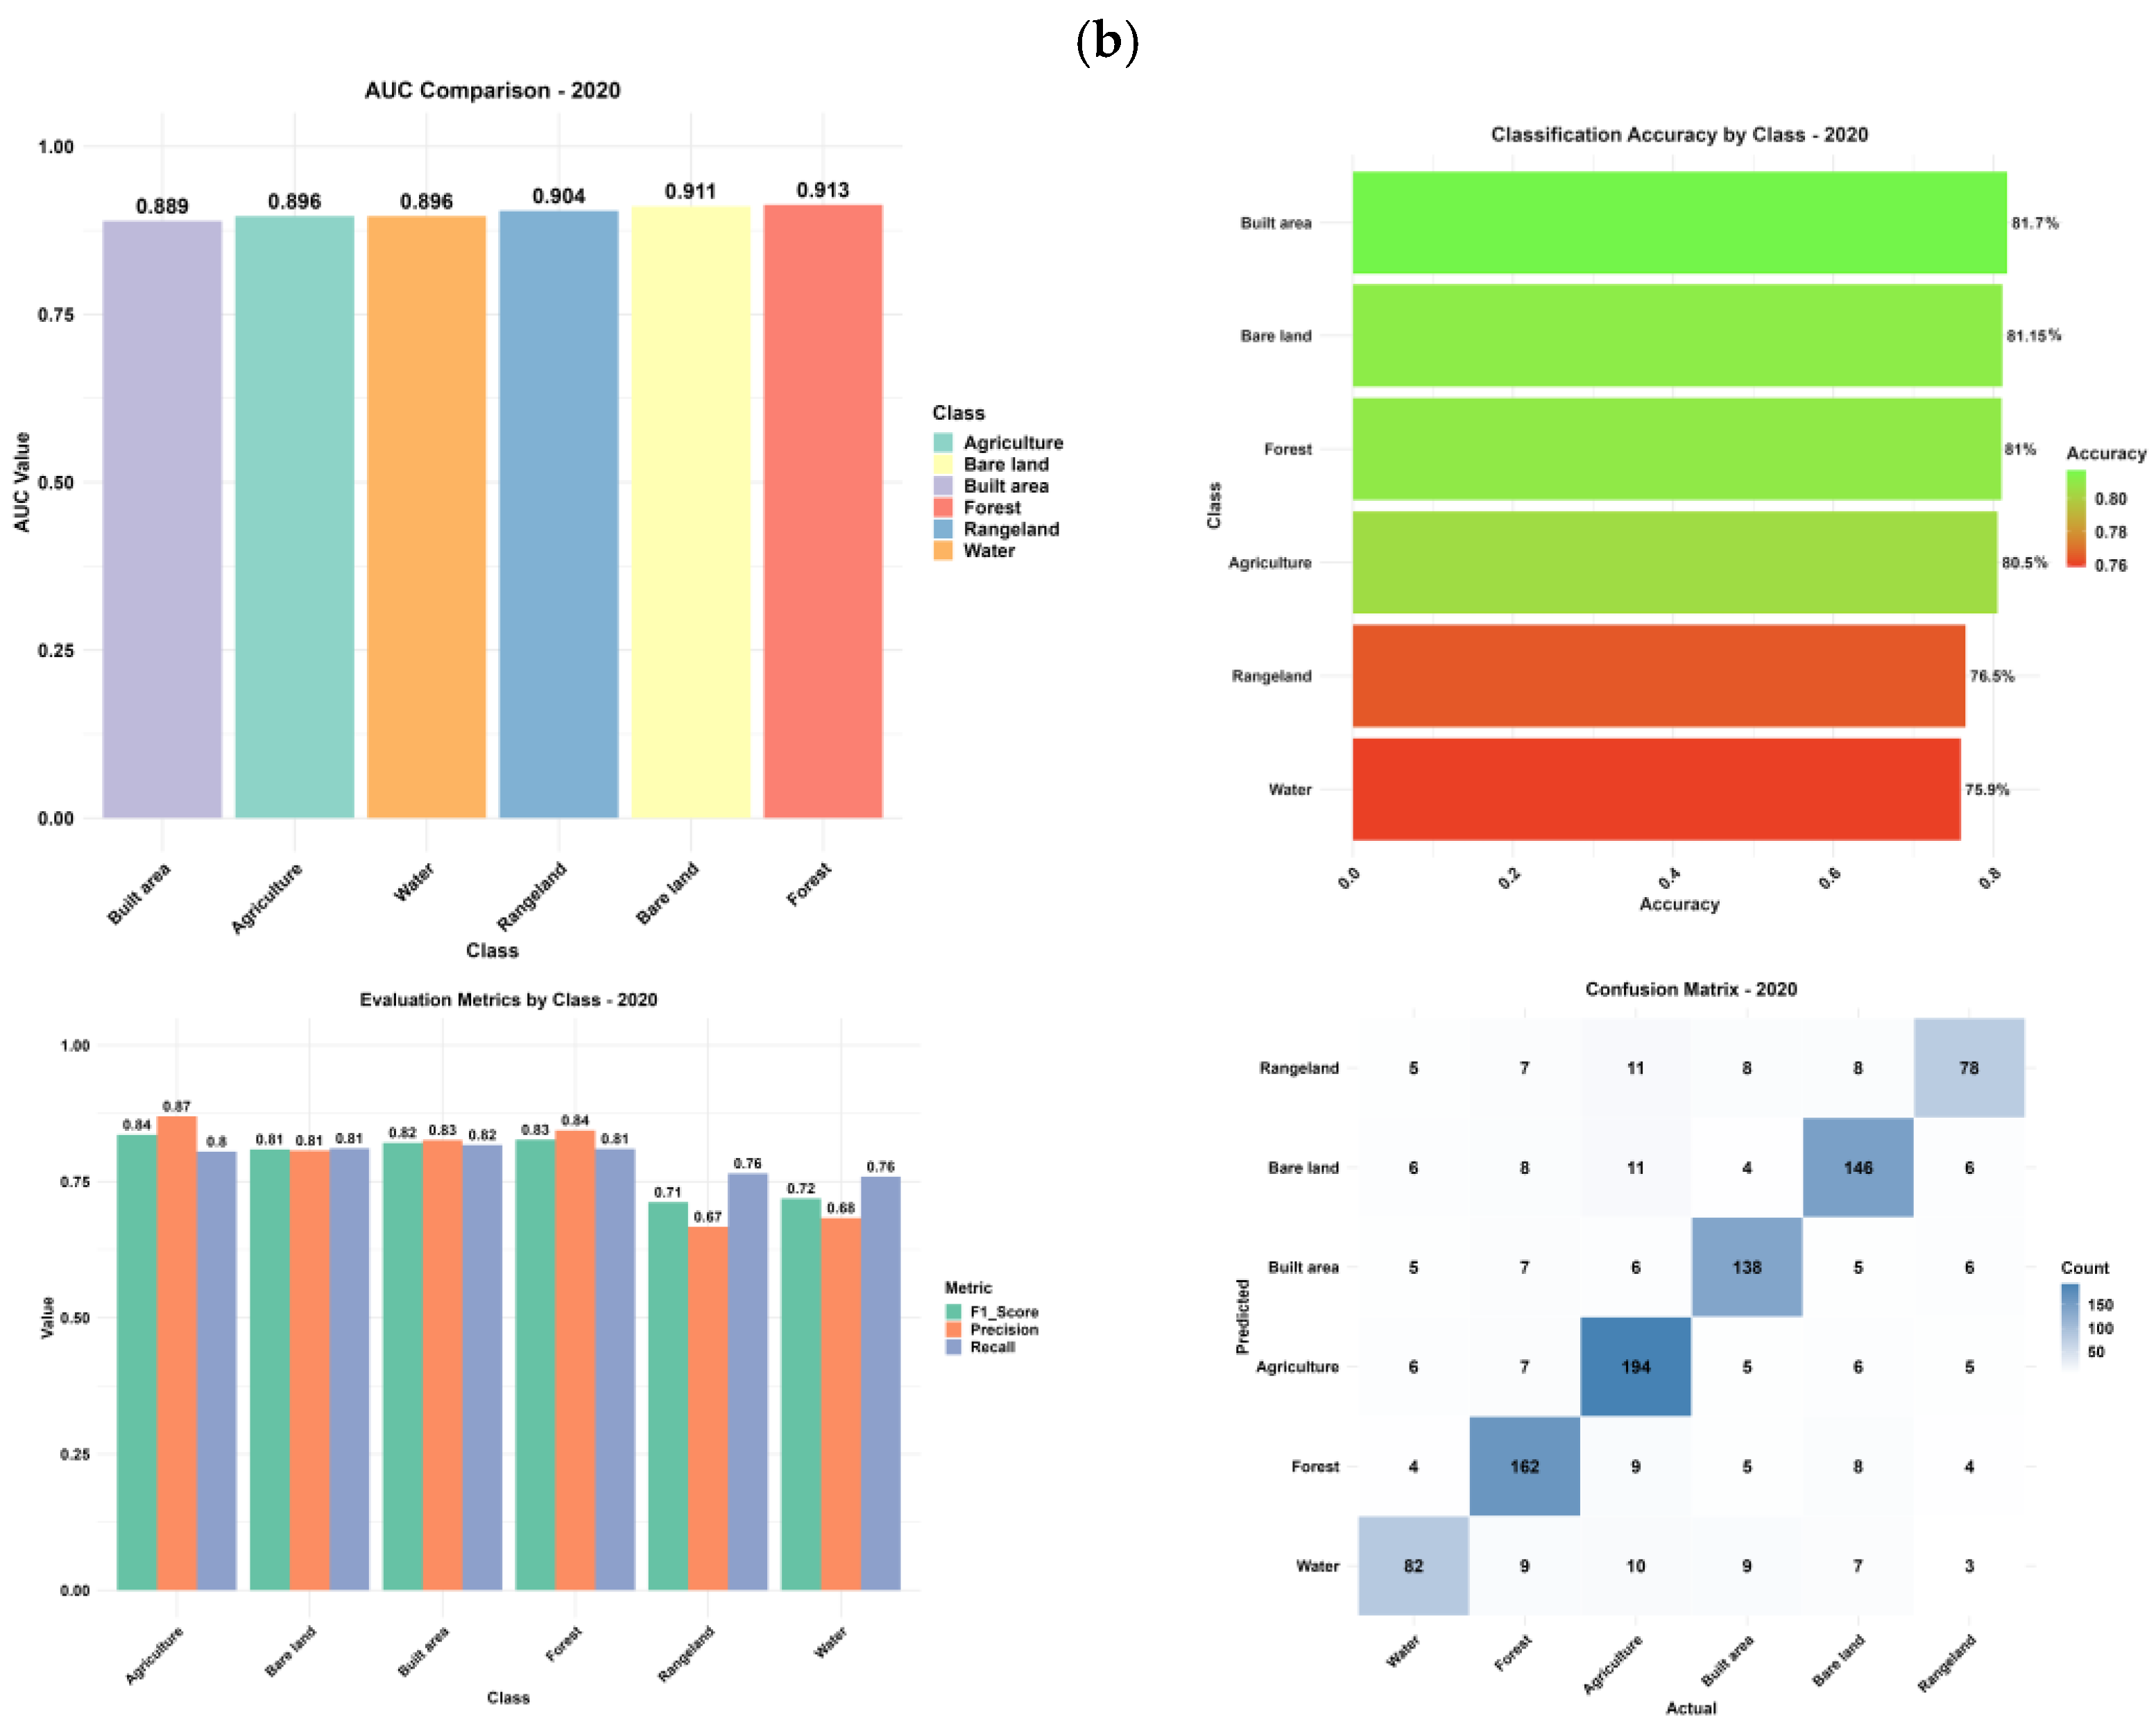
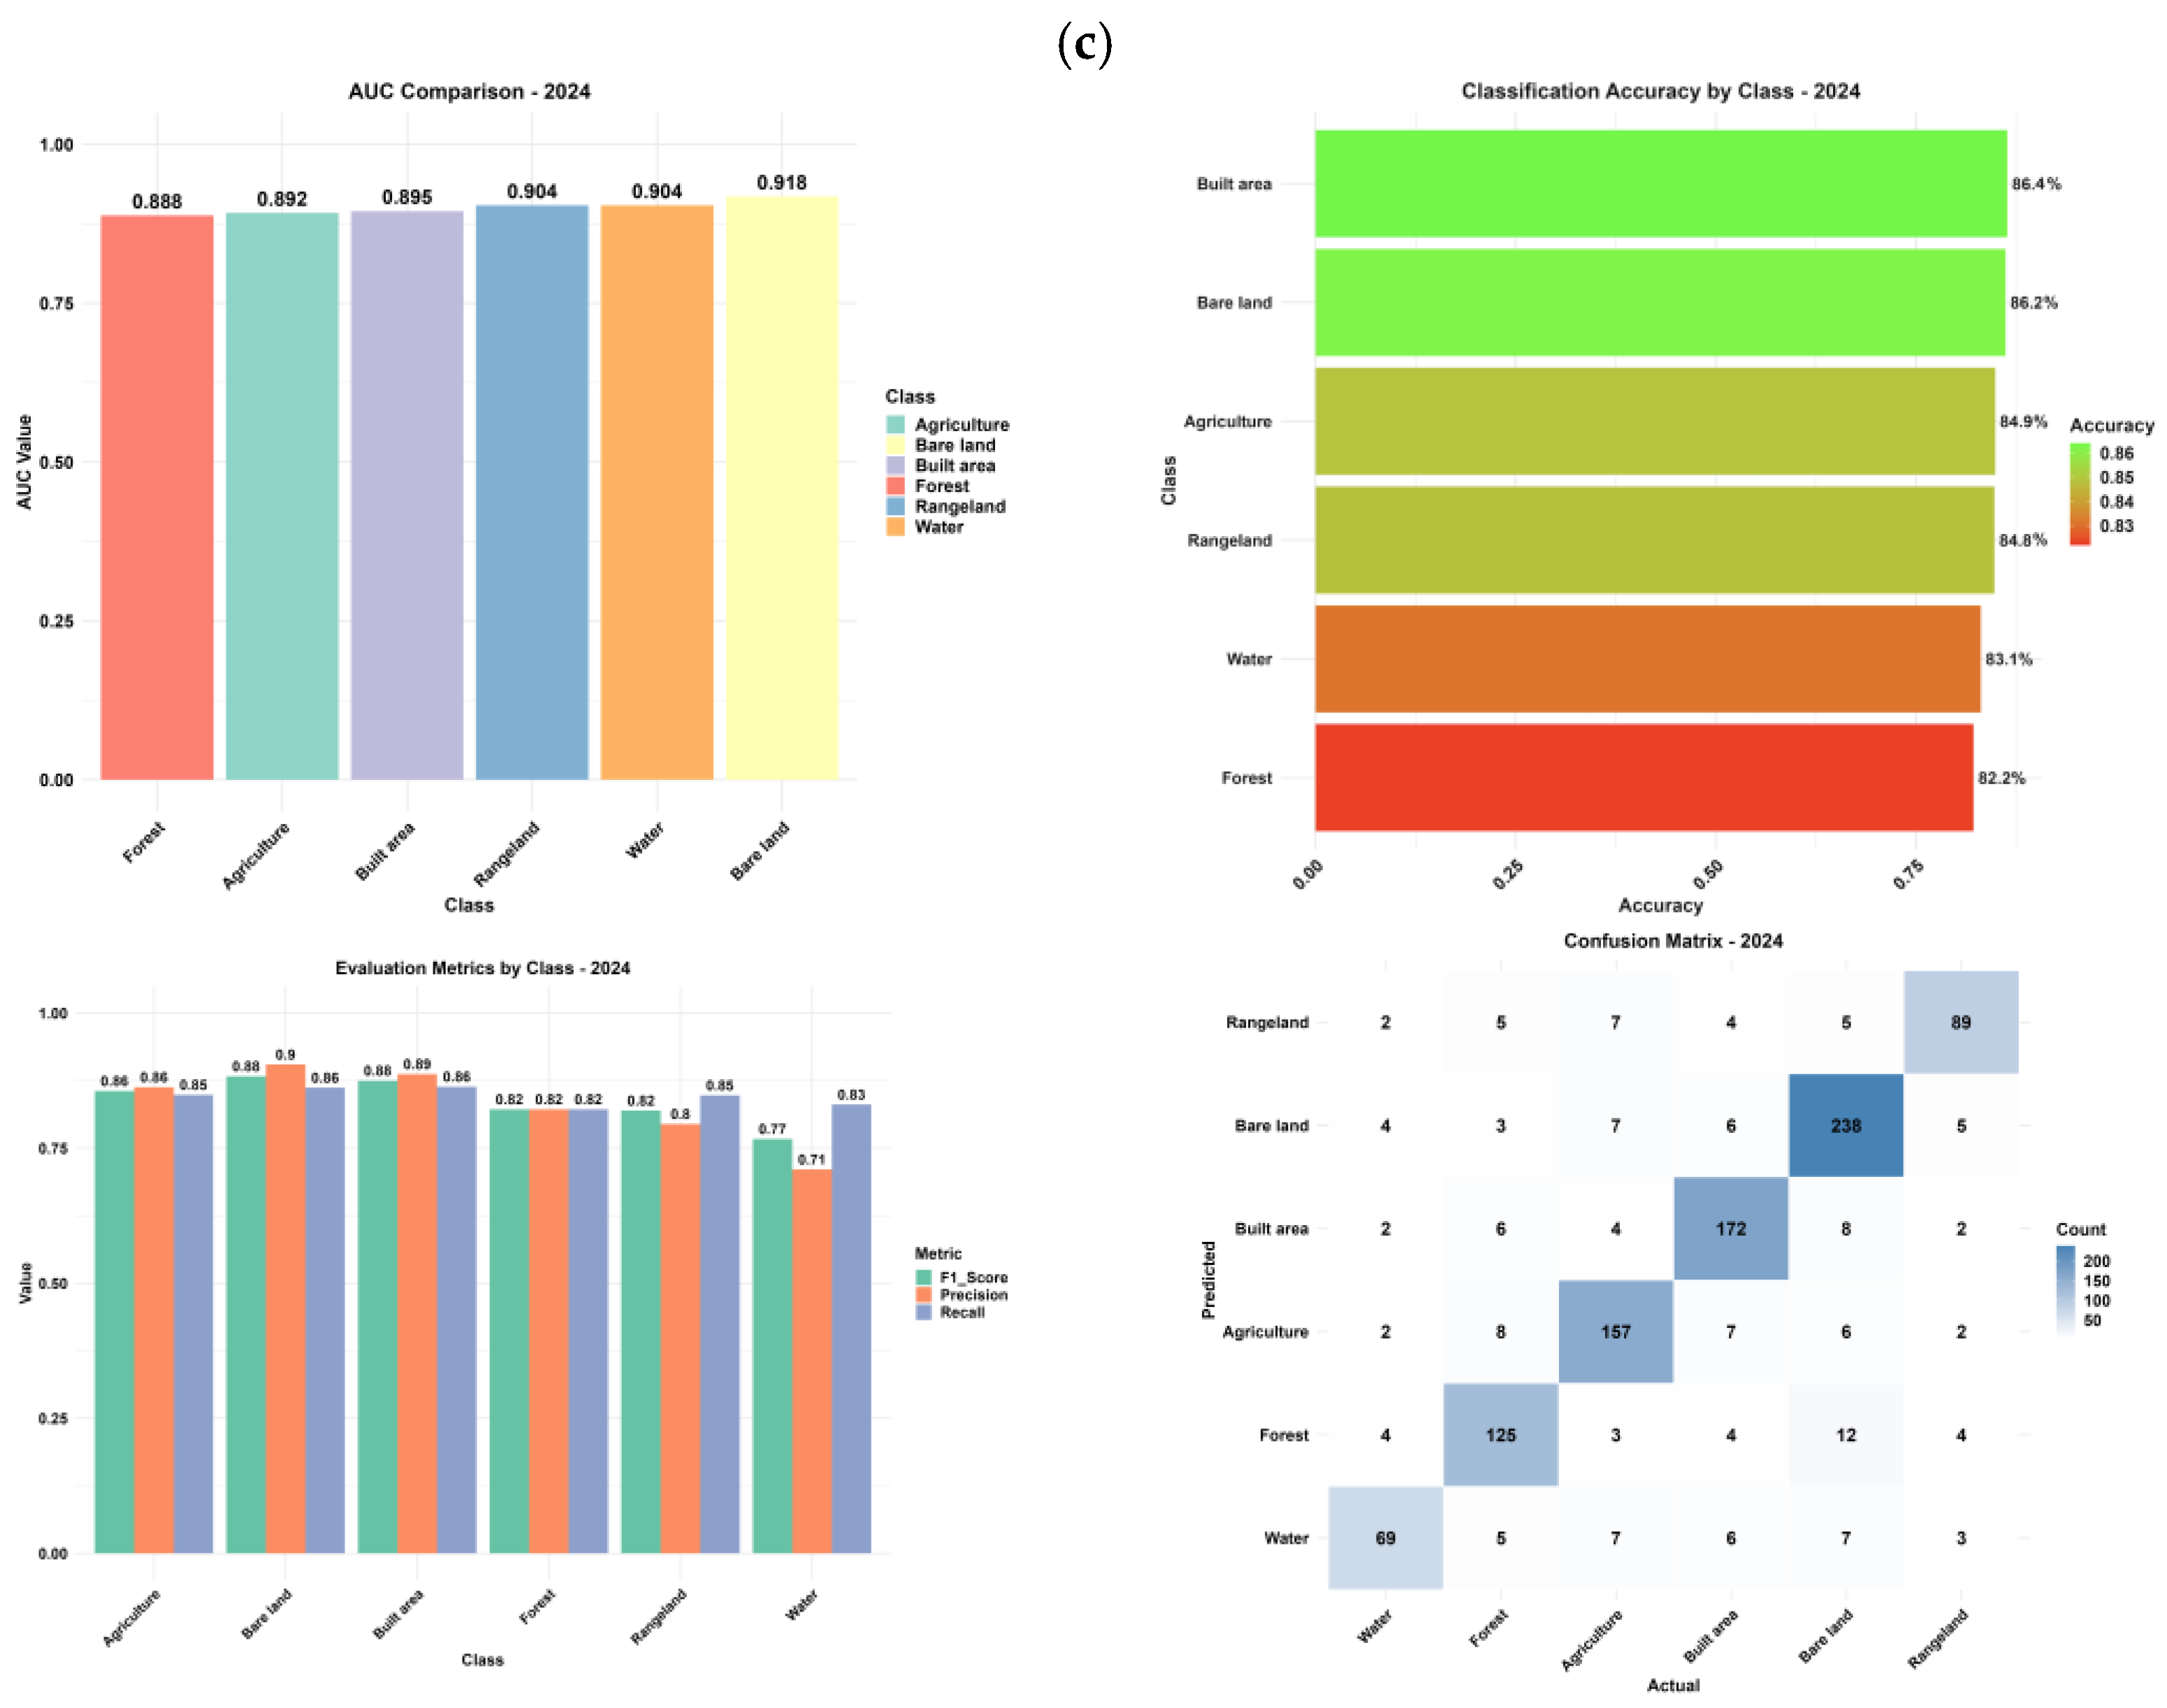
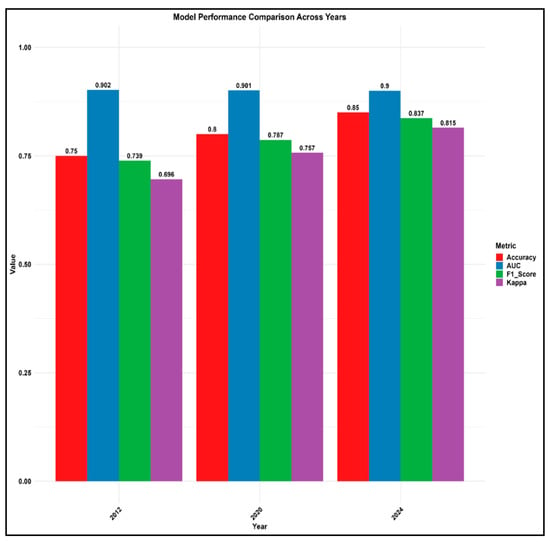
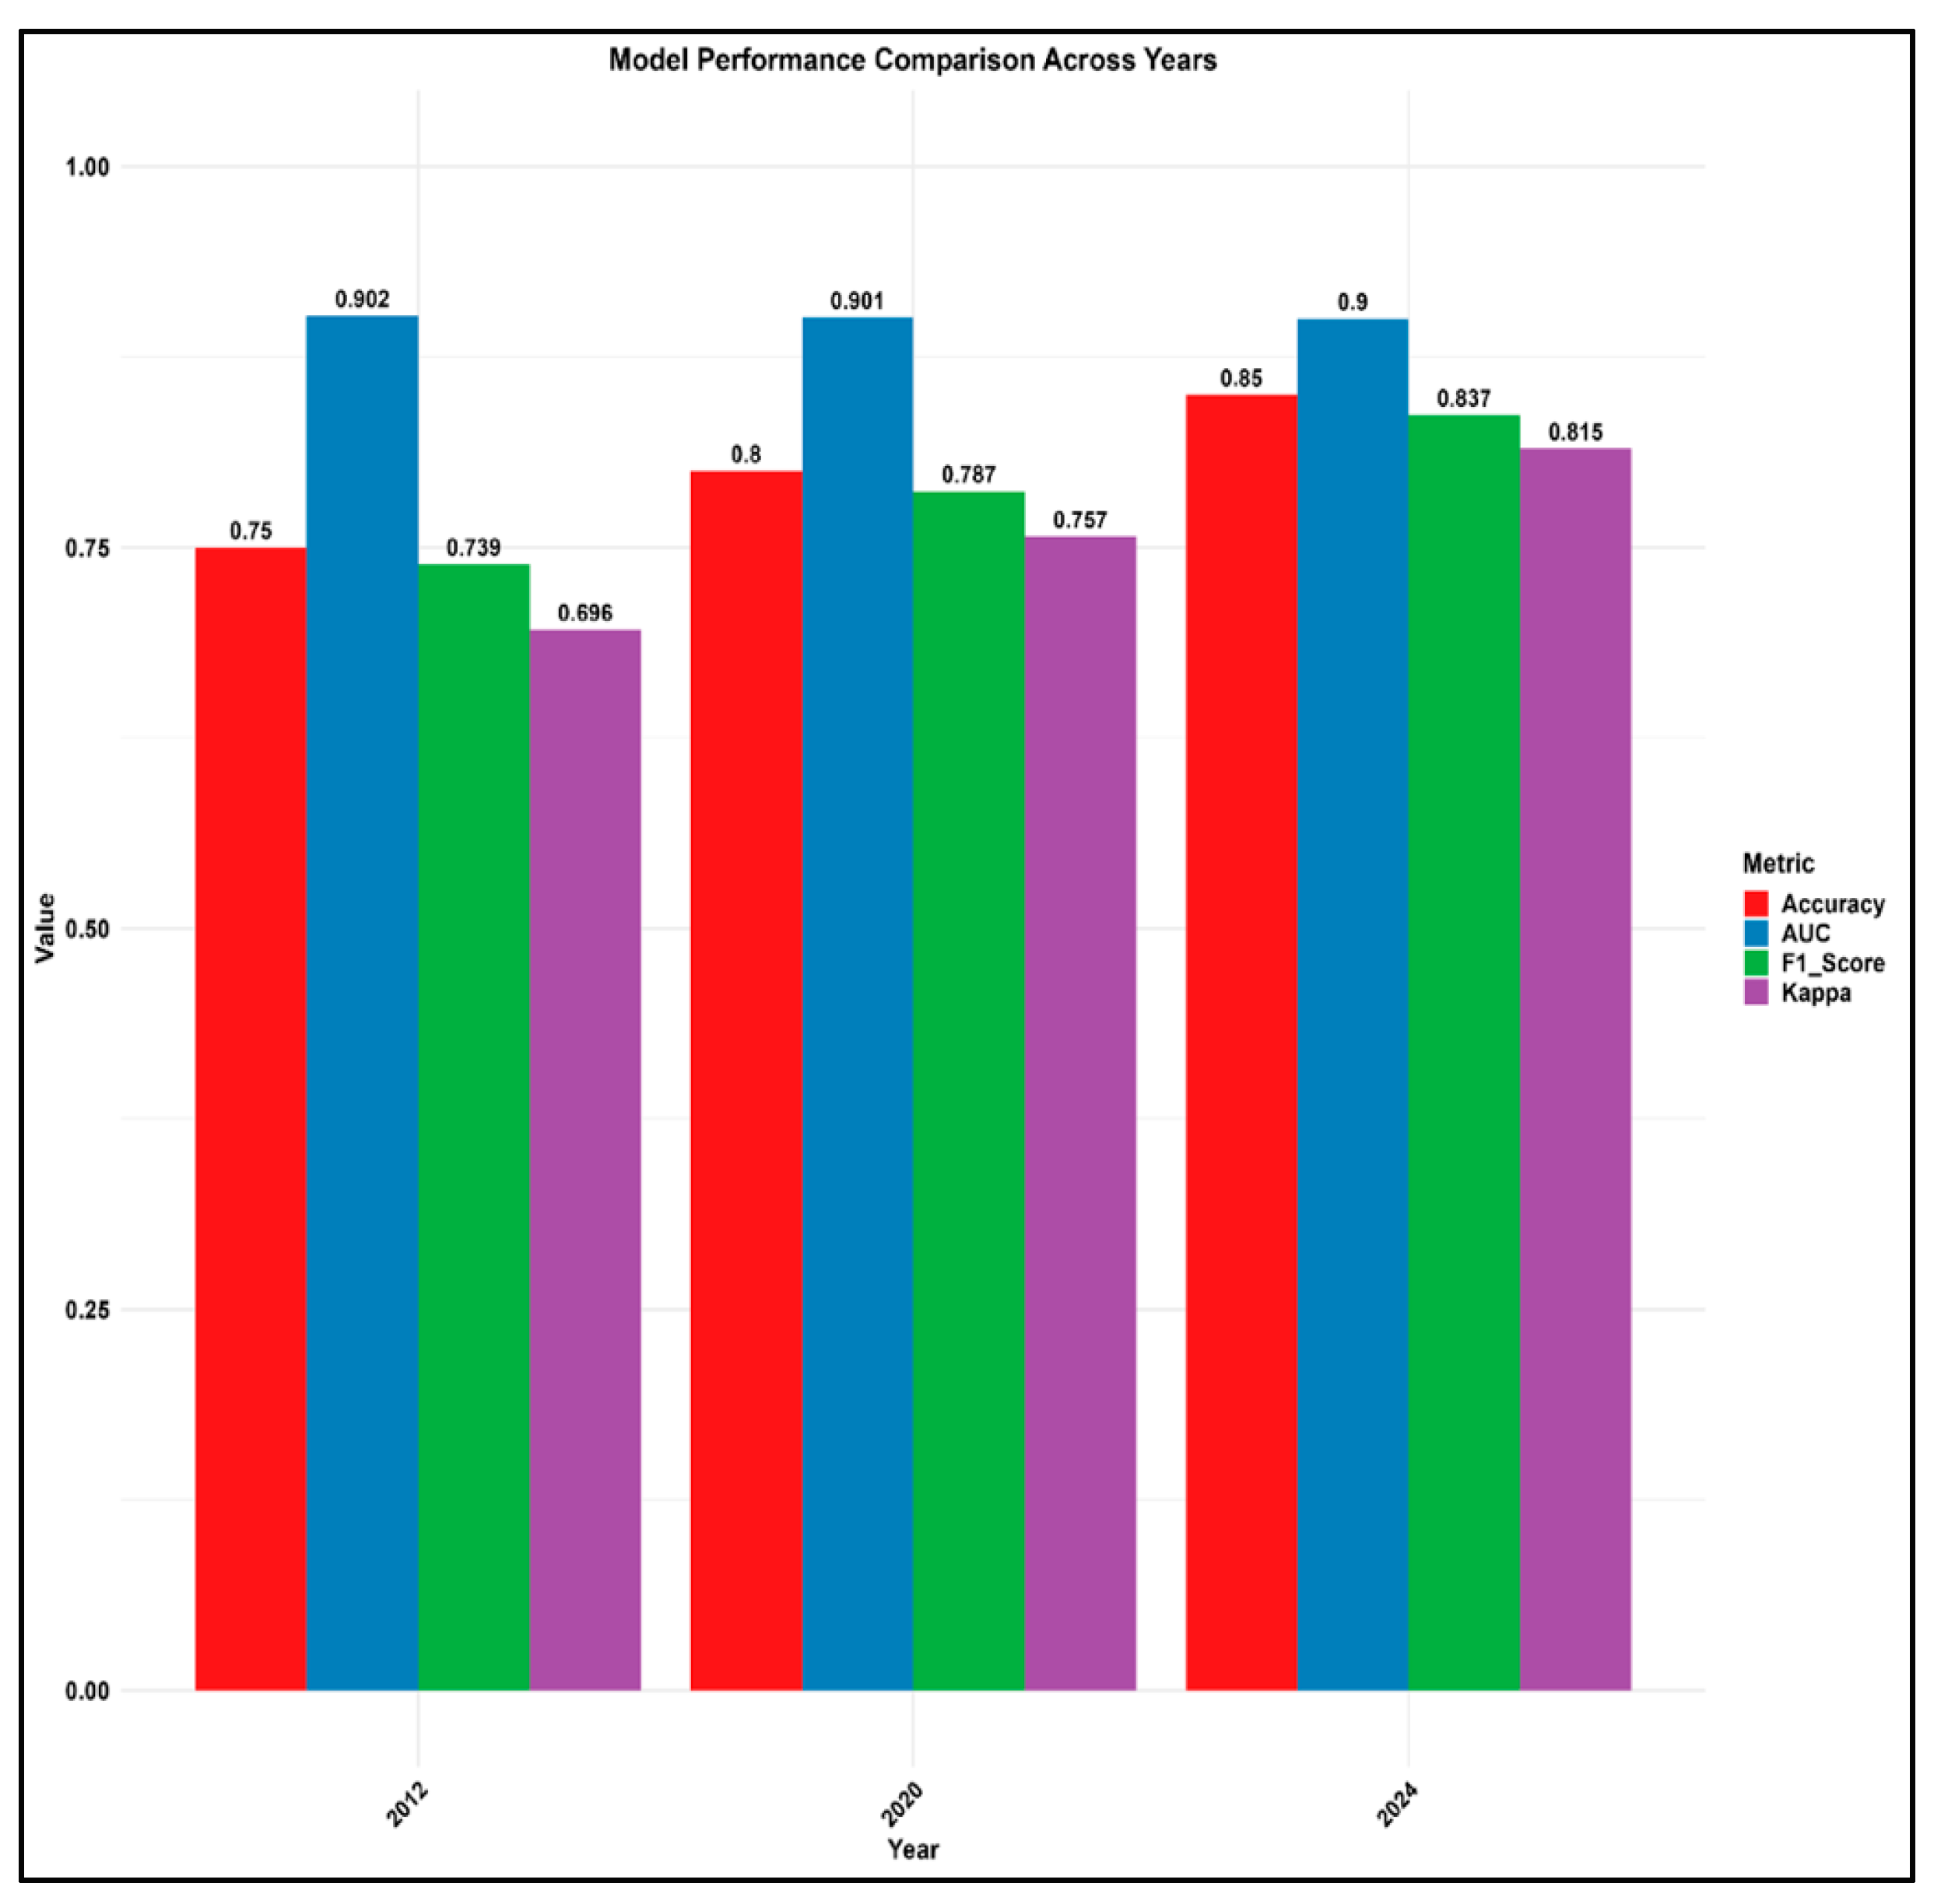
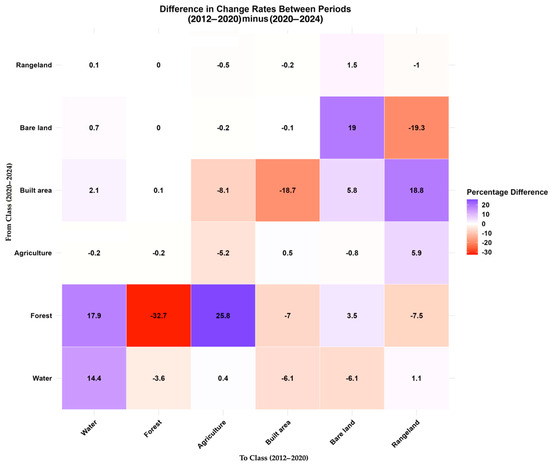
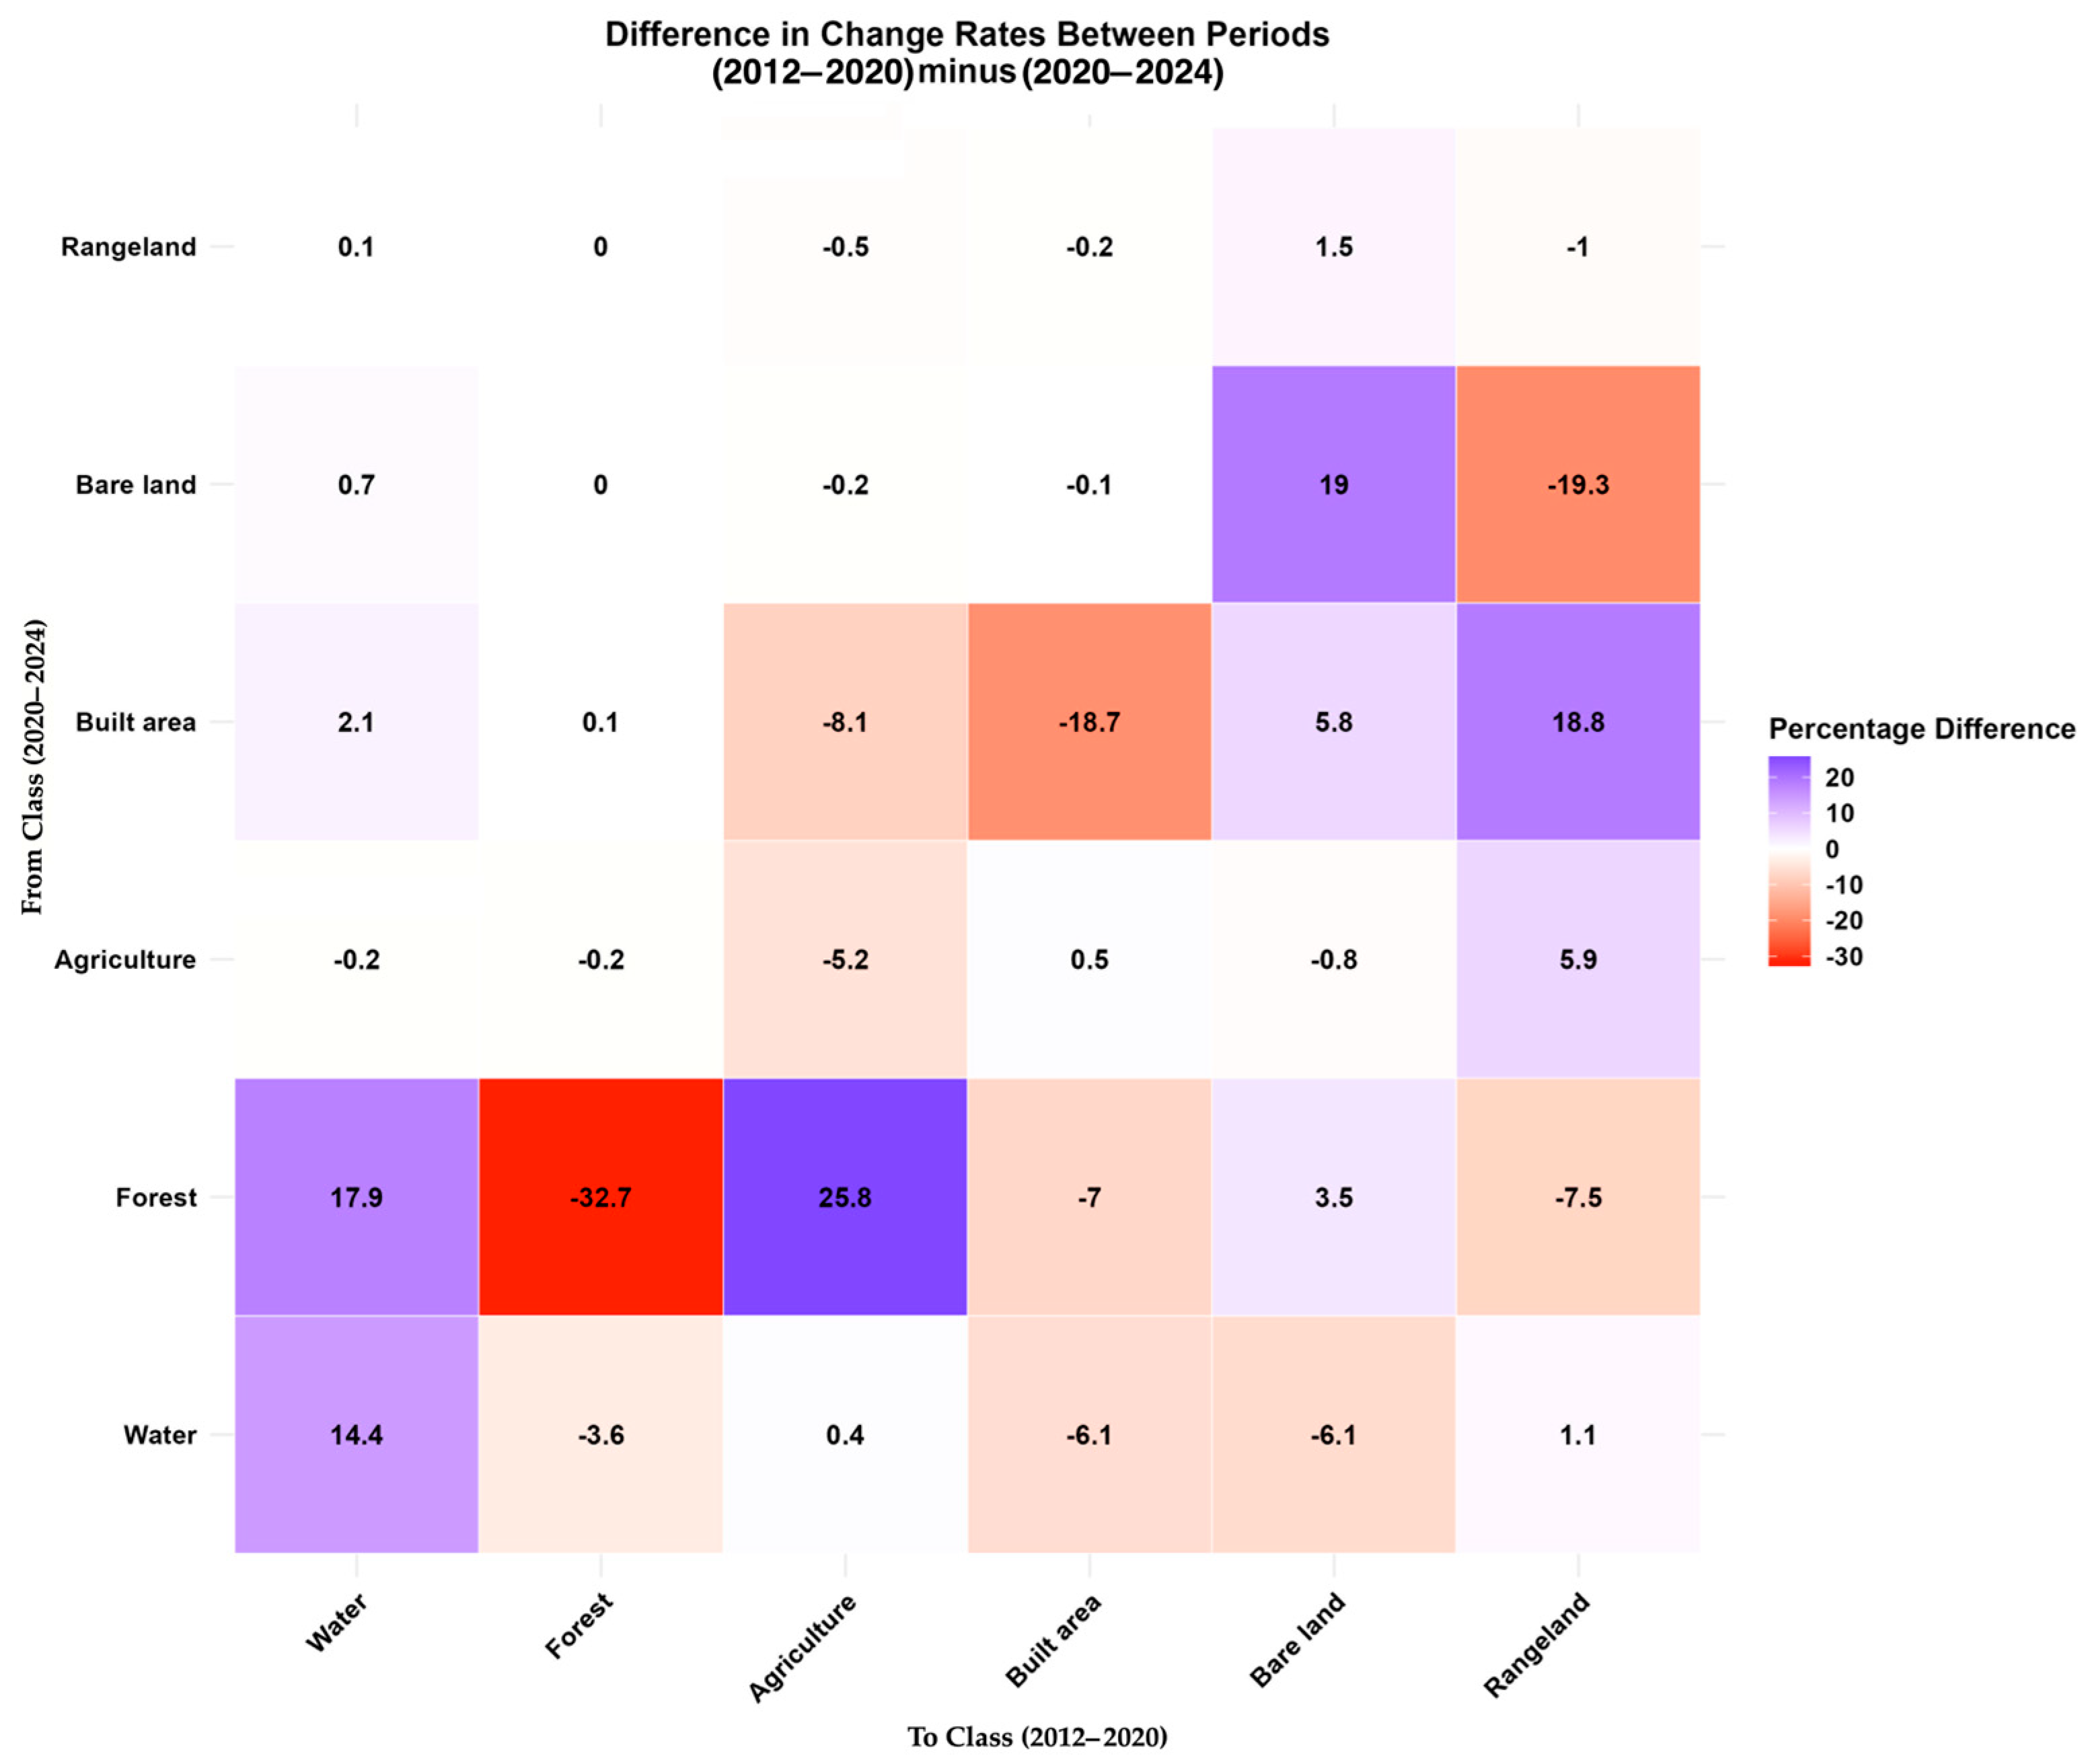
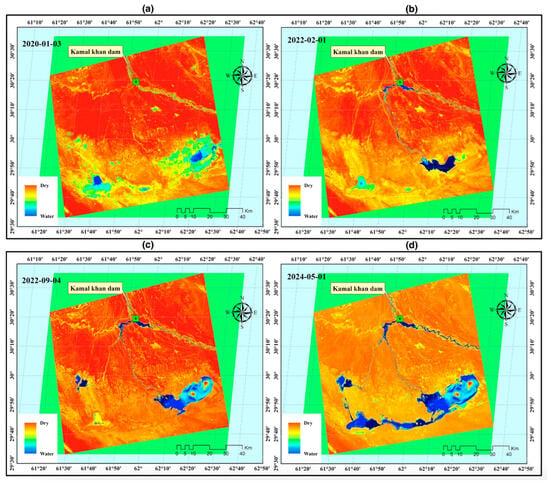
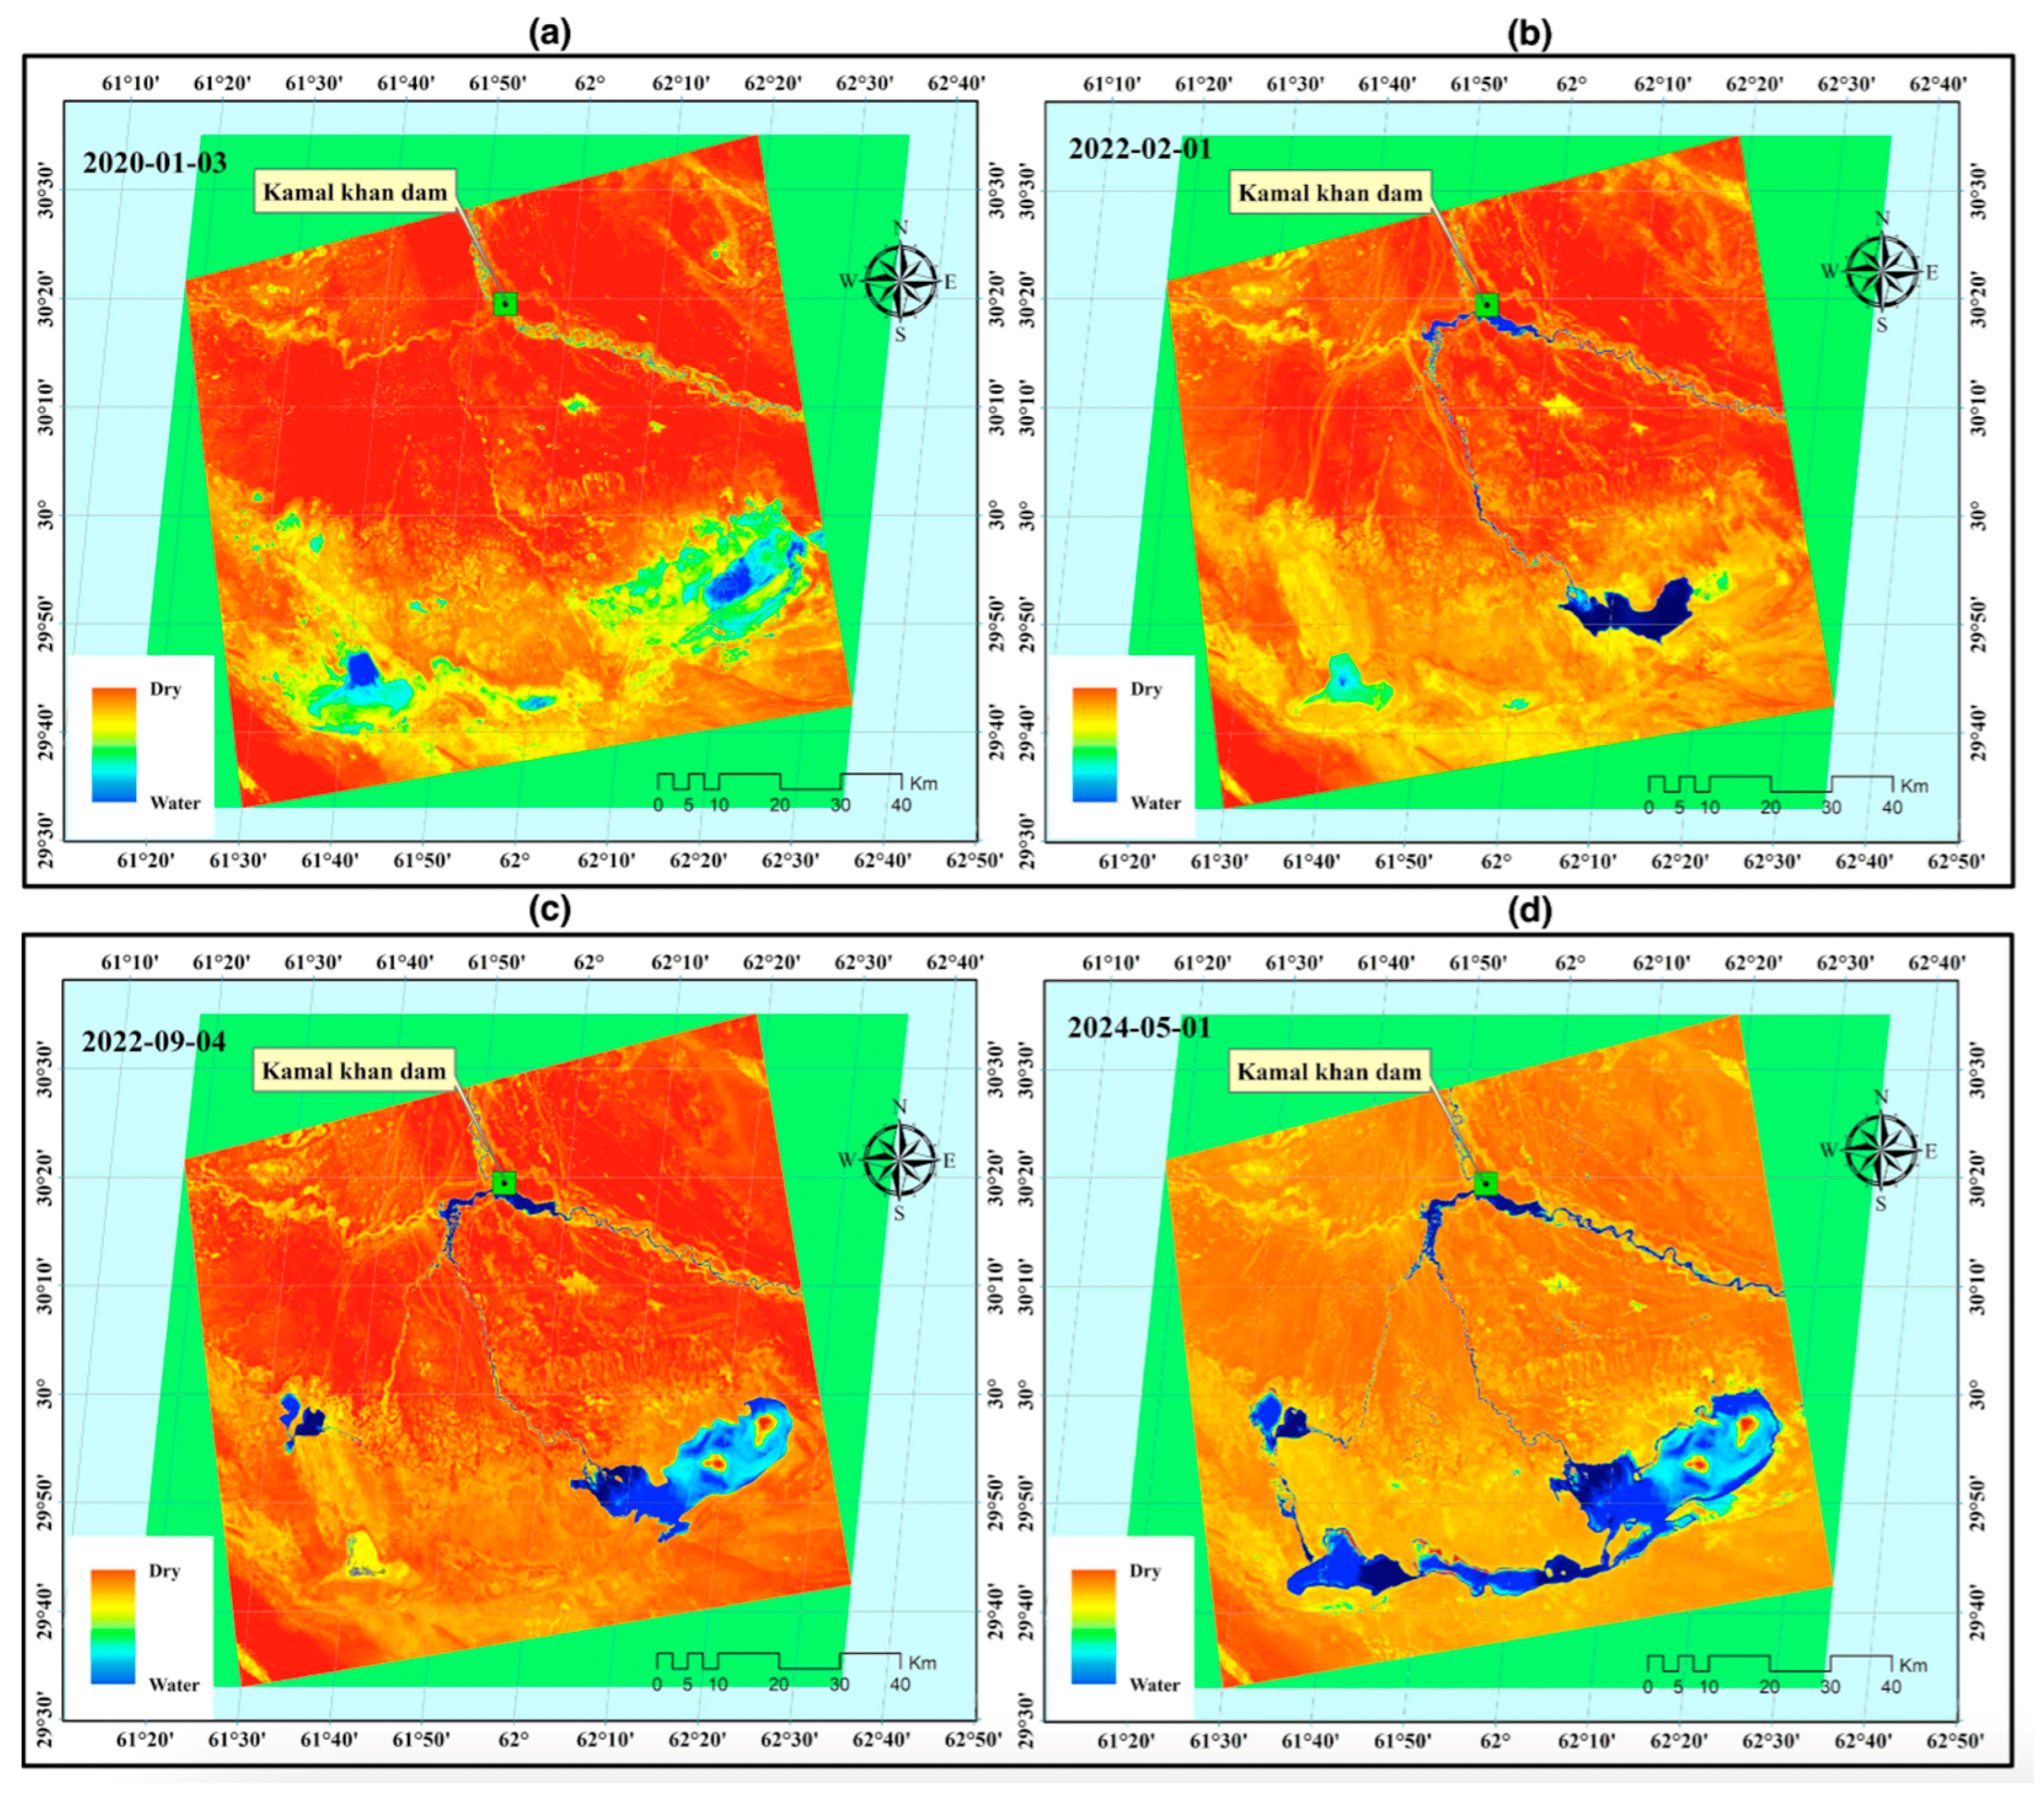
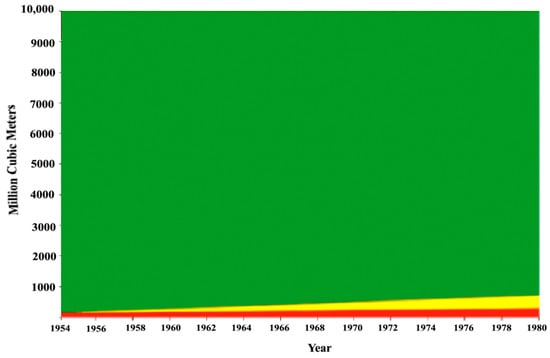
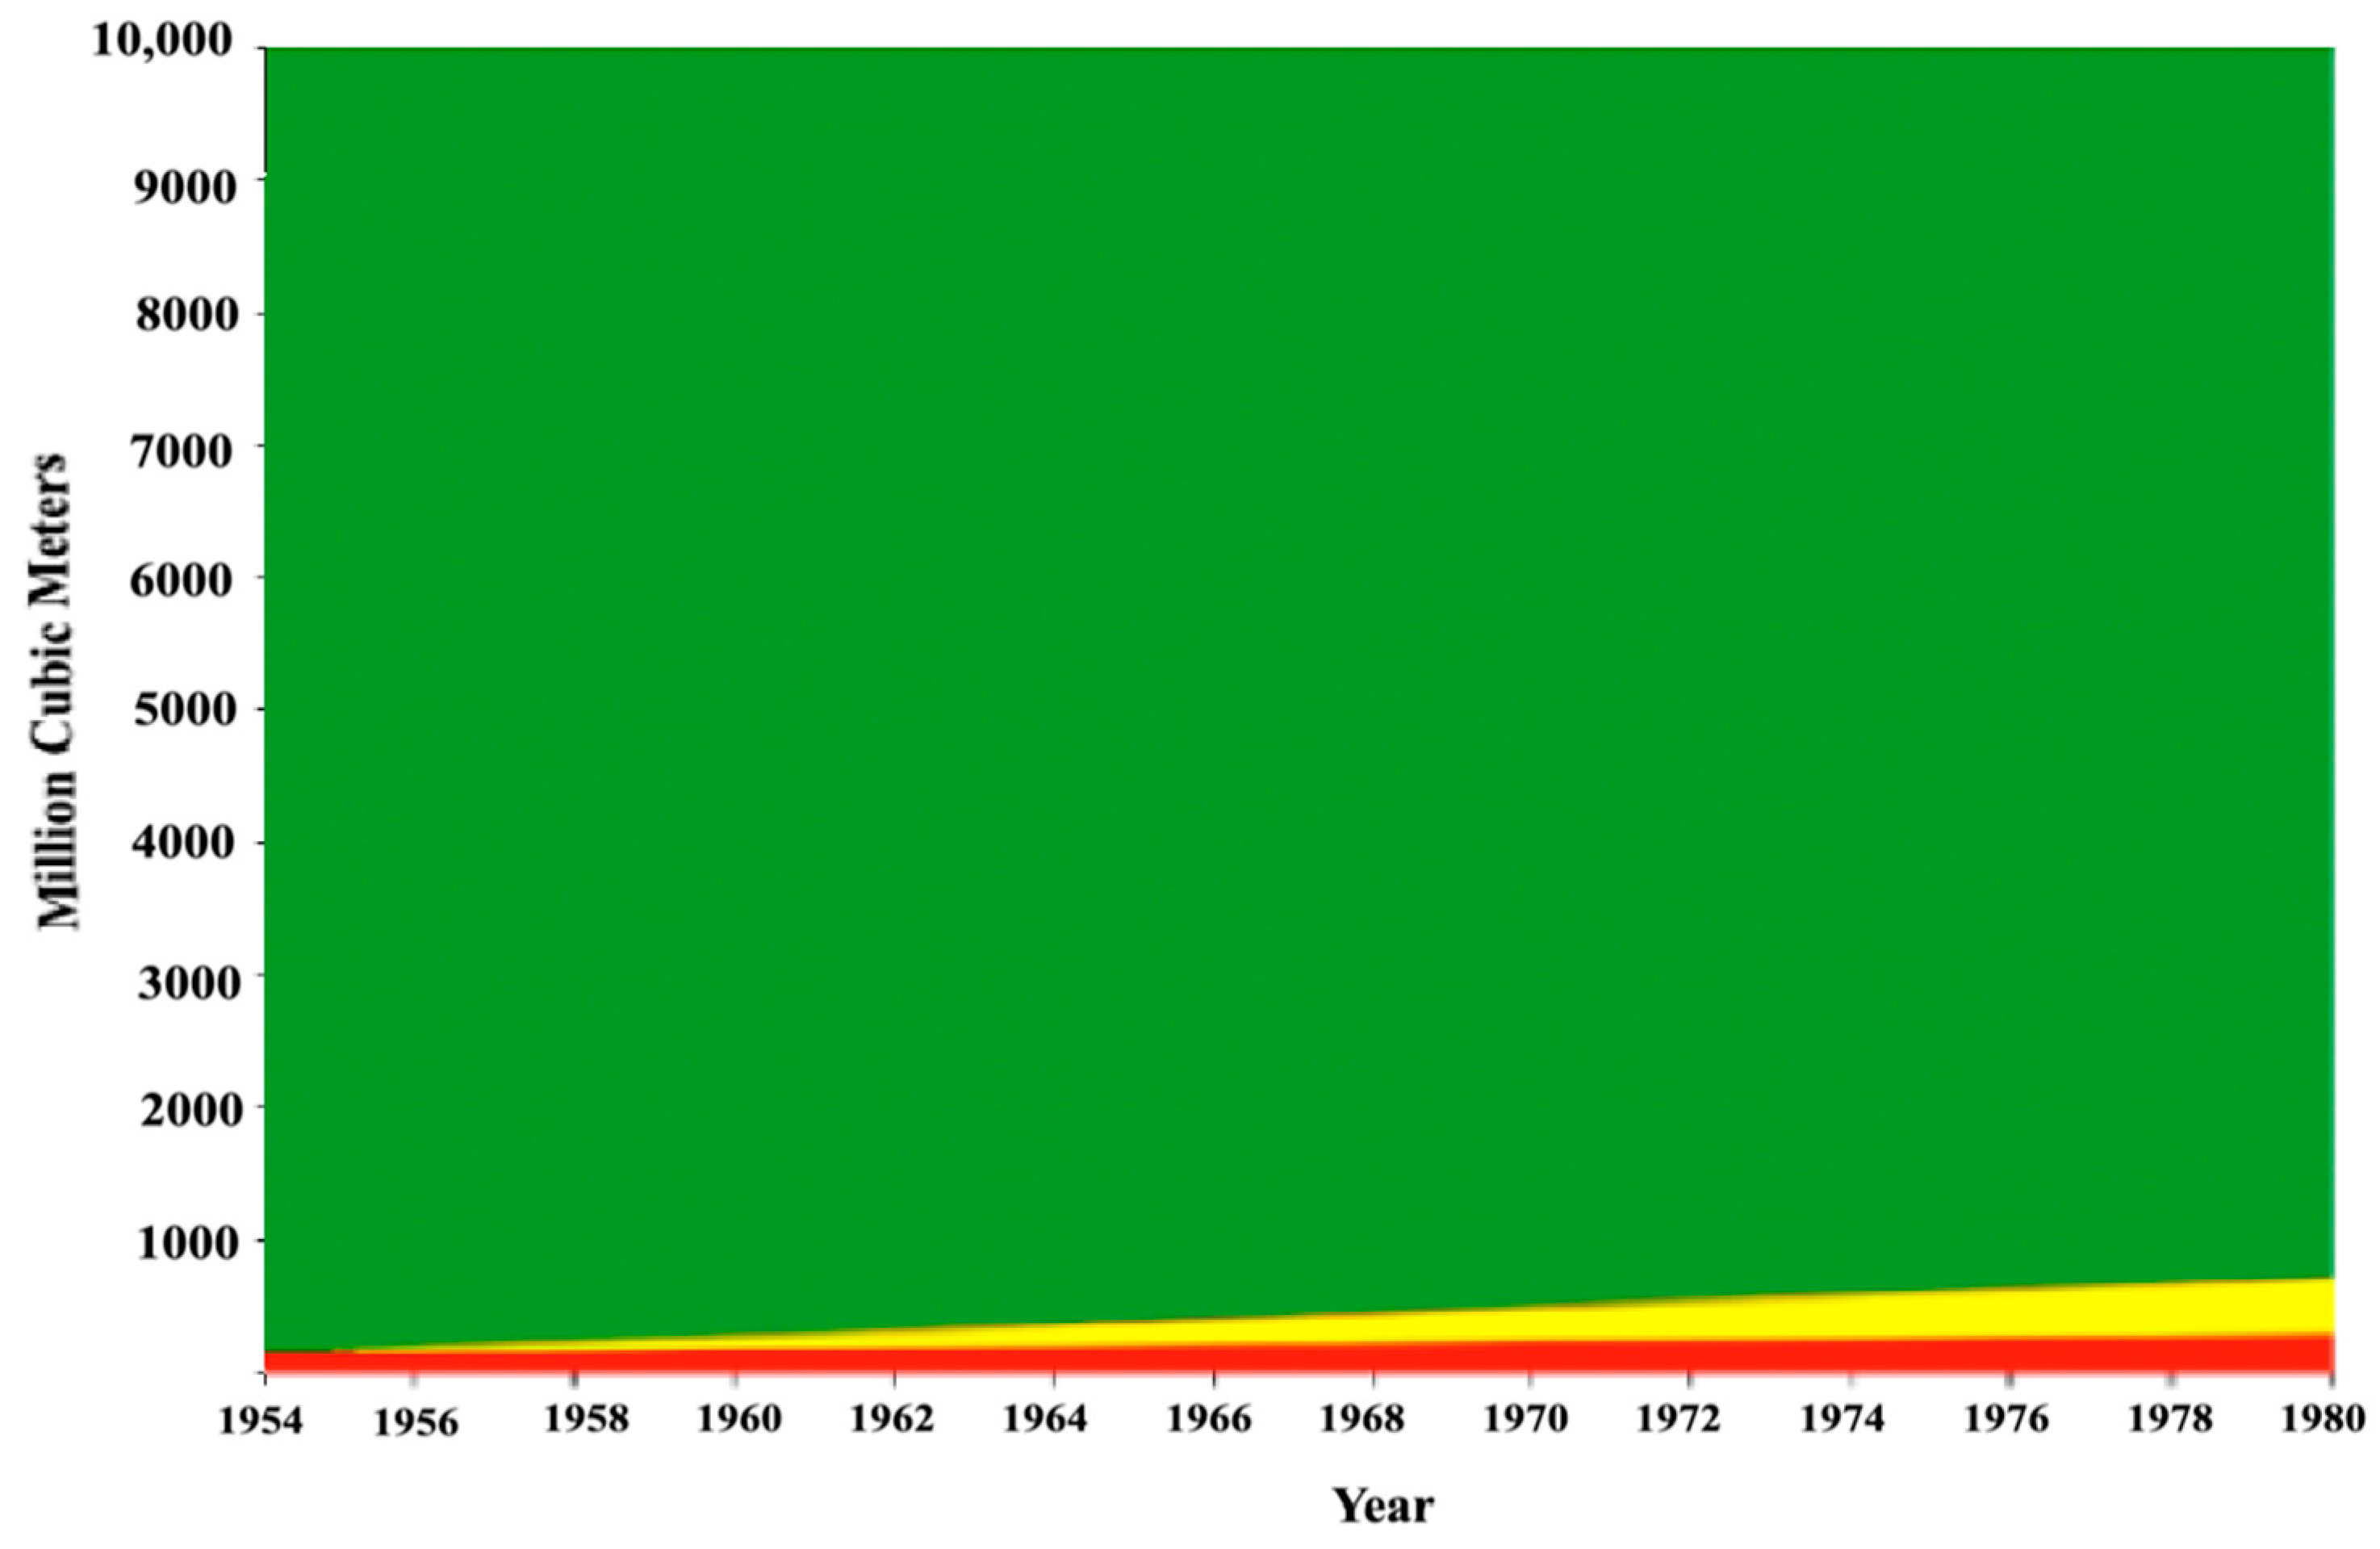
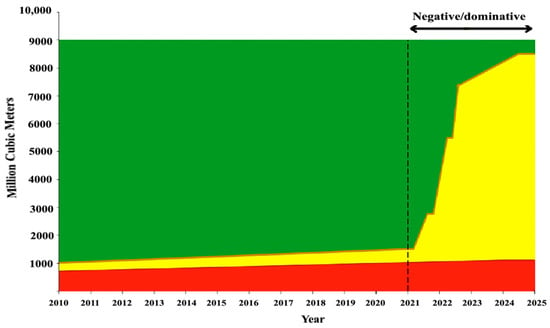
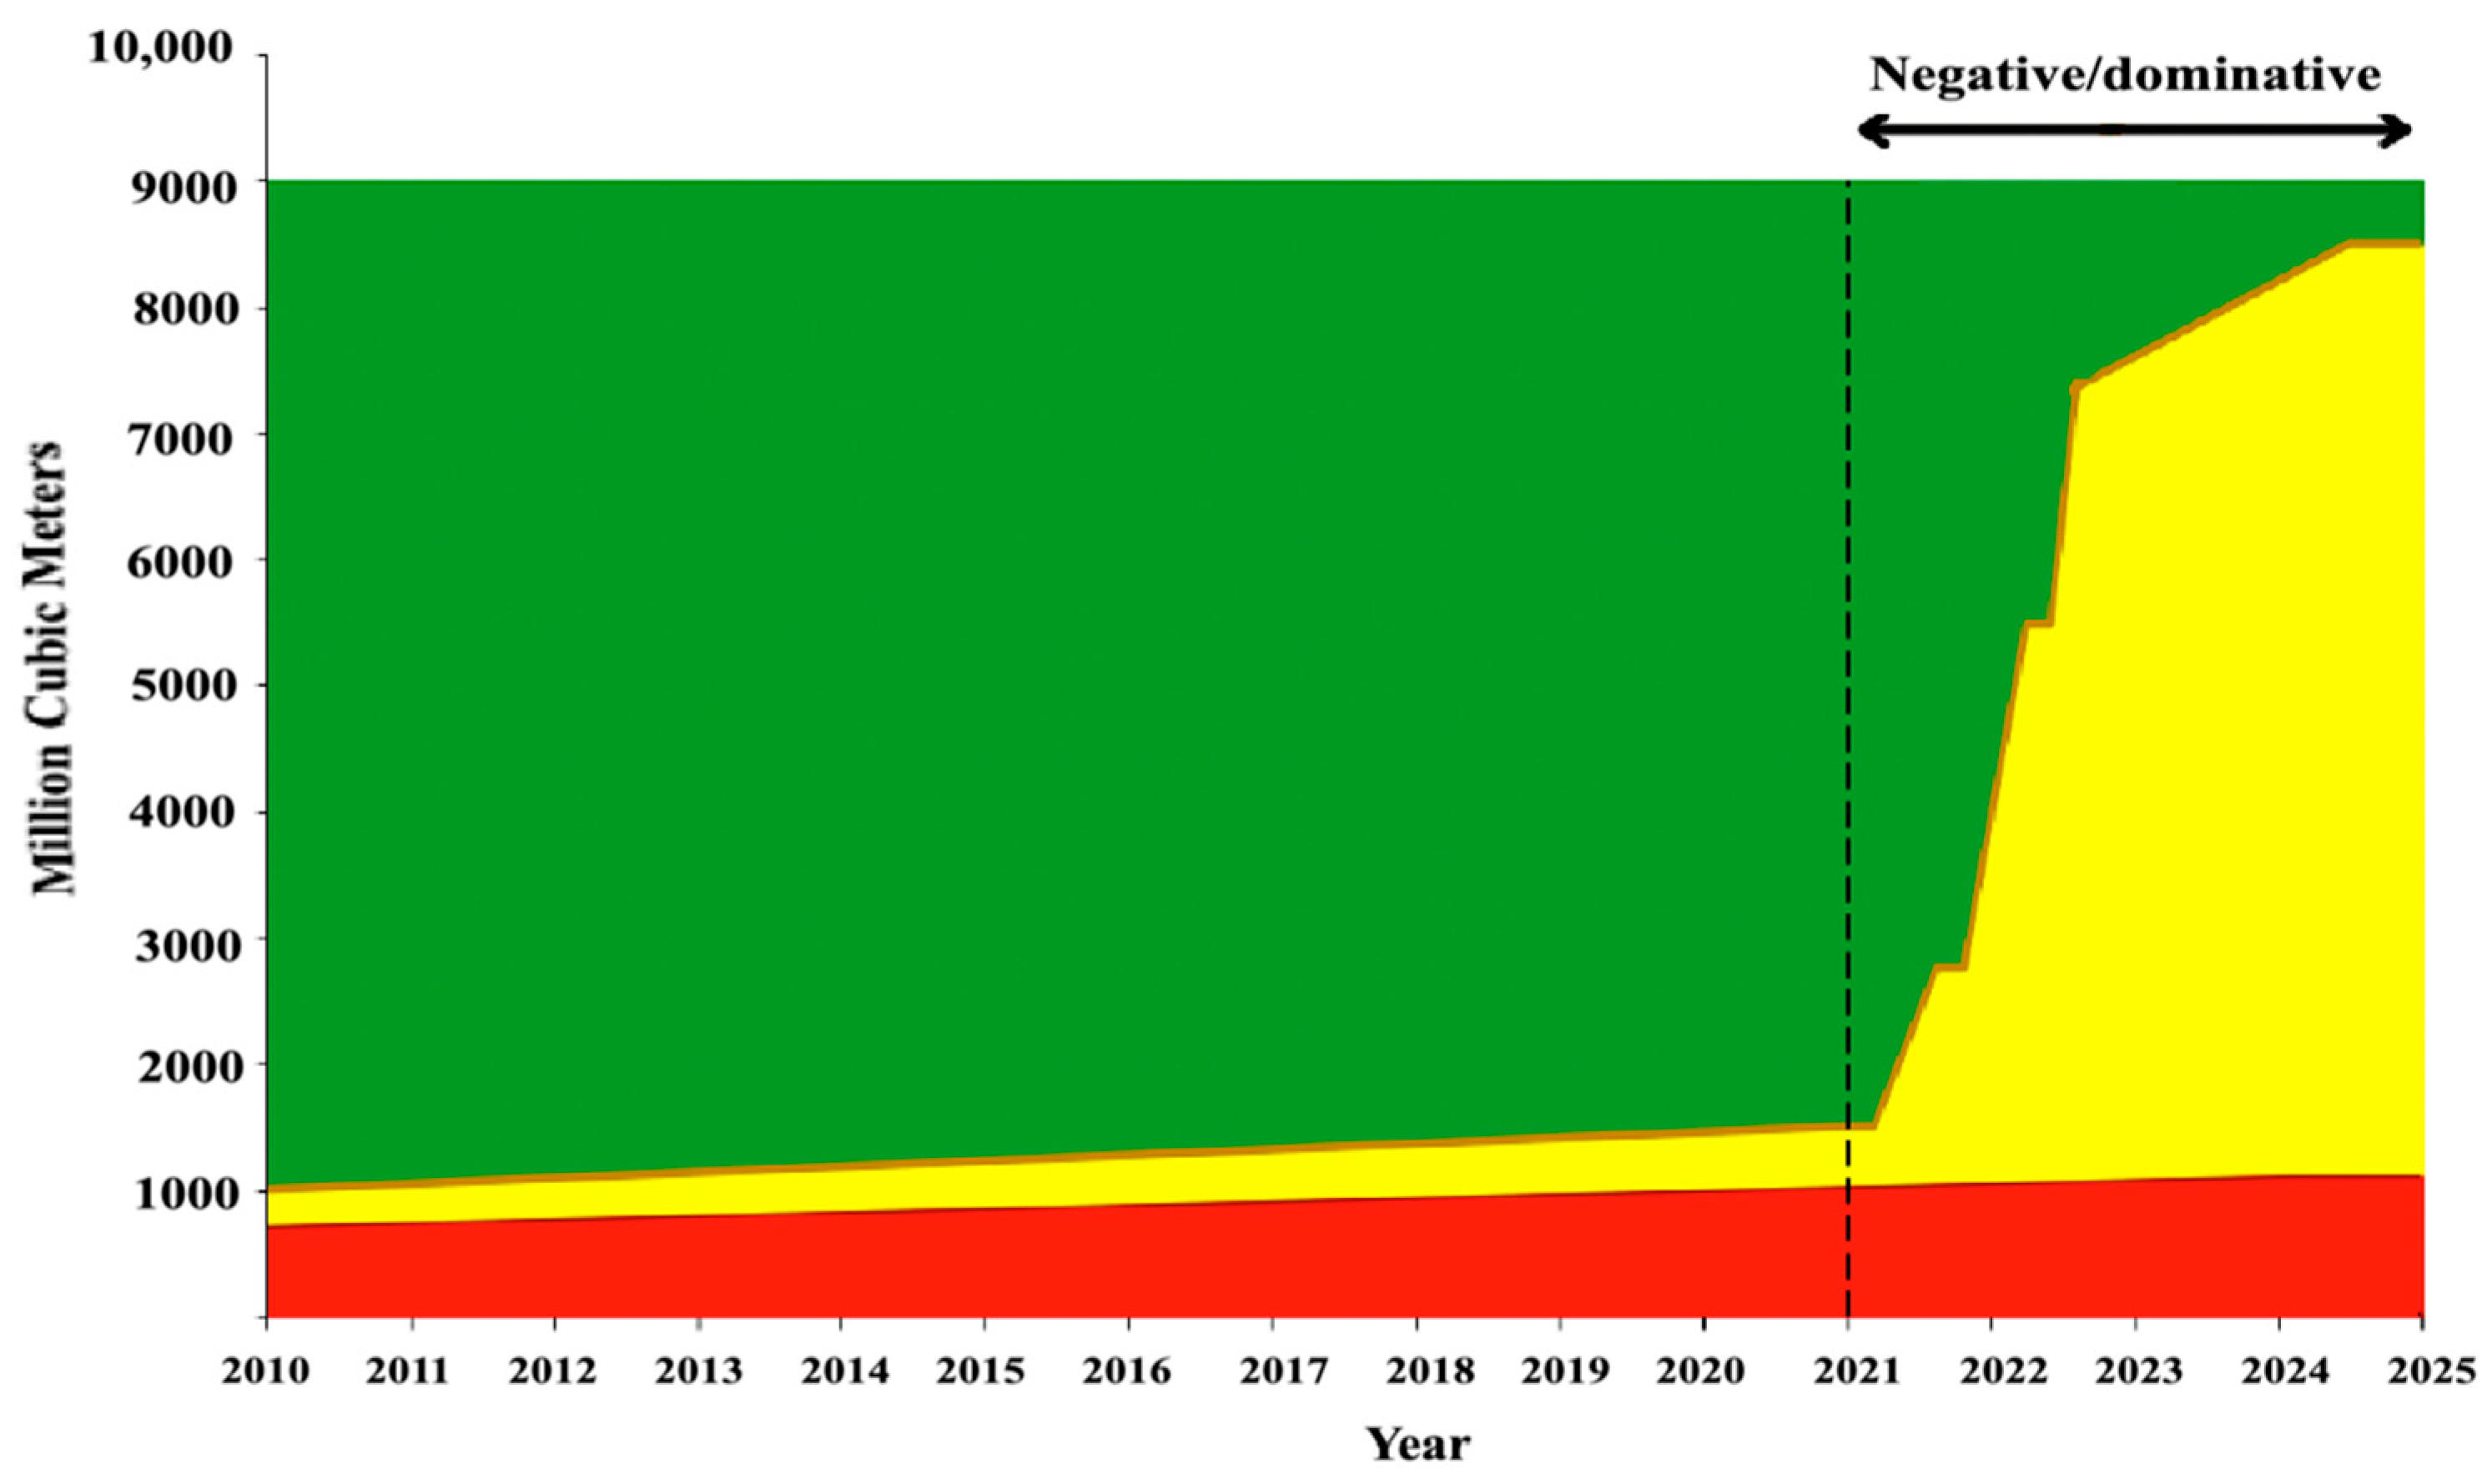

Disclaimer/Publisher’s Note: The statements, opinions and data contained in all publications are solely those of the individual author(s) and contributor(s) and not of MDPI and/or the editor(s). MDPI and/or the editor(s) disclaim responsibility for any injury to people or property resulting from any ideas, methods, instructions or products referred to in the content. |
© 2026 by the authors. Licensee MDPI, Basel, Switzerland. This article is an open access article distributed under the terms and conditions of the Creative Commons Attribution (CC BY) license.