


Abstract
Zeolite is a popular soil amendment capable of improving physical and chemical properties of soils. This study investigates how zeolite concentration affects the hydrological connectivity of sandy loam soil. Soil samples with different zeolite concentrations Cz (0, 1, 1.5, 2.5, 5, 10, 15, and 30%) were analyzed for changes in water dynamics through Fast Field Cycling Nuclear Magnetic Resonance (FFC-NMR) relaxometry. FFC-NMR data revealed that the investigated zeolite can modify the pore size distribution in a wide range (1–15%) of Cz, as the zeolite particle size distribution has a percentage of coarse particles (56%) appreciably higher than that of the original soil (37%). Moreover, a concentration of 1% produces a more relevant increase in the soil’s meso- and macropores, while for Cz > 1.5%, the change in pore size distribution is damped by the increase in water retention that occurs upon increasing zeolite concentration. The analysis also demonstrated that Cz = 1% is sufficient to achieve the highest values of both structural and functional connectivity indexes. In conclusion, for sandy loam soil, adding a zeolite concentration of 1% is sufficient to improve the soil’s physical characteristics, with significant effects on soil hydrological behavior, and can be considered a valid practice to manage the addition of a water resource to the soil.
1. Introduction
Zeolites can be considered valuable tools to help farmers and agronomists, as they help to mitigate soil and water pollution, heavy metal contamination, and nutrient loss and promote water conservation in arid zones [1]. Their agricultural applications have expanded significantly [2], especially after being classified as a “non-toxic” substance by the International Agency for Research on Cancer (IARC) and “safe for human consumption” by the Food and Drug Administration (FDA) [3]. Structurally, zeolites are crystalline hydrated aluminosilicates of alkali and alkaline earth elements, occurring in both natural and synthetic forms [4]. They are known as “molecular sieves” as they have micropores with specific channels and voids [5]. Zeolites exhibit three distinctive properties: (i) high cation exchange capacity, CEC (ten times more than that of the soil); (ii) a large amount of free water within structural voids and channels; and (iii) strong adsorption due to their high specific surface area [6].
Zeolites are widely applied inorganic soil conditioners capable of improving physical and chemical soil properties, such as water holding capacity, infiltration rate, saturated hydraulic conductivity (Ks), and CEC [4,7,8]. Their porous nature reduces bulk density and increases total porosity, thereby enhancing water holding capacity, WHC [9]. Zeolites can retain up to 60% of their weight in water molecules because of the great porosity of their crystalline structure [10]. Zeolites alter the pore size distribution and pore channel connectivity [11]. In light-textured soils, zeolite addition increases soil water retention and WHC while reducing Ks and the infiltration rate [7]. Conversely, in heavy-textured soils (such as clay and silty clay soil), zeolite may increase Ks by creating larger pores that facilitate faster water movement [9,10]. These effects are strongly dependent on the average soil particle size [4,12], with sandy and loamy soils that can show reduced hydraulic conductivity, while clay soils may exhibit increased conductivity [11,12,13,14].
Experimental studies confirm these texture-dependent effects. Belviso et al. [15] demonstrated that silt loam soil amended with zeolite (1–10%) exhibited higher water retention capacity and decreased Ks. These effects were explained by a shift in pore size distribution toward more micro- and mesopores and fewer macropores, effectively transforming the soil into a “clay-like” structure. Similarly, Comegna et al. [16] tested sandy loam and silty loam soils with zeolite concentrations up to 10%, finding more pronounced changes at 5–10%. These modifications, independent of the original soil texture, were attributed to the addition of fine zeolite particles that altered the pore distribution. This circumstance can be explained considering that when the zeolite size is smaller than the pore size, the zeolite can induce a clogging effect. However, additional experiments and data sets are required to validate these findings for soils of different pedological contexts and textural characteristics, also employing different zeolites (i.e., synthetic and natural, different size) [17].
The concept of connectivity describes how environmental systems facilitate the transfer of matter and energy [18,19,20,21,22]. In this context, connectivity refers to the capacity of vectors, such as water, to transport materials across spatial and temporal scales [23,24,25,26,27], accounting for the heterogeneity and complexity of the system. Wainwright et al. [28] distinguished between structural connectivity (SC), defined by the physical arrangement and linkage of landscape elements [29,30,31], and functional connectivity (FC), which captures how interactions between structure and flow vectors influence dynamic processes. In soils, SC relates to particle arrangement and texture, while FC reflects physical–chemical interactions between water and pore surfaces. Thus, SC provides a static view, while FC represents the dynamic behavior of the system. Conte and Ferro [32,33,34] introduced the concept of Hydrological Connectivity within the Soil (HCS) to describe how water movement is governed by the interaction between structural patterns and physical–chemical processes. In this framework, SC describes the spatial distribution of pores and channels, while FC encompasses water movement through these structures and its interaction with pore walls [32,33,34].
Understanding water dynamics in zeolite-amended soils is crucial for predicting runoff and erosion and for employing zeolite as a sustainable land management strategy to reduce soil loss [1]. To date, few studies have investigated the effects of adding zeolite to soil on HCS using Fast Field Cycling Nuclear Magnetic Resonance (FFC-NMR) relaxometry. Moreover, the existing results require confirmation through experiments on soils with different soil textures and zeolite types [17].
This study addresses these gaps by exploring how different zeolite concentrations can affect hydrological connectivity in soil of agricultural interest, typical of Mediterranean orchards. In particular, sandy loam soil amended using eight different zeolite concentrations Cz (0, 1, 1.5, 2.5, 5, 10, 15, and 30%) was analyzed using FFC-NMR relaxometry, which is a powerful laboratory technique useful for probing molecular dynamics in complex systems.
2. Materials and Methods
2.1. Investigated Soil and Applied Zeolite Characteristics
The investigated soil was collected from an orchard located in the experimental area of the Department of Agricultural, Food and Forest Sciences, the University of Palermo. Based on its particle size distribution, this soil is classified as sandy loam, with 12.8% clay, 31.4% silt, and 55.8% sand [35], and contains a negligible amount of gravel.
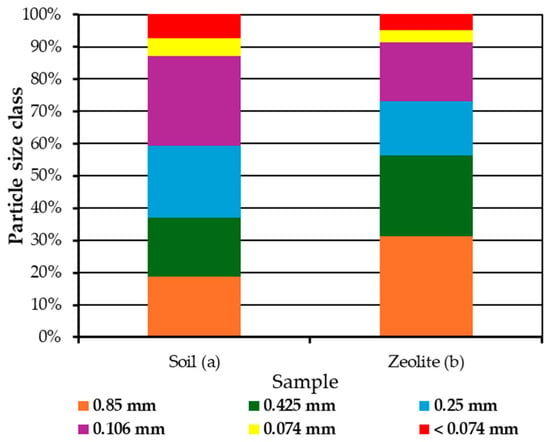
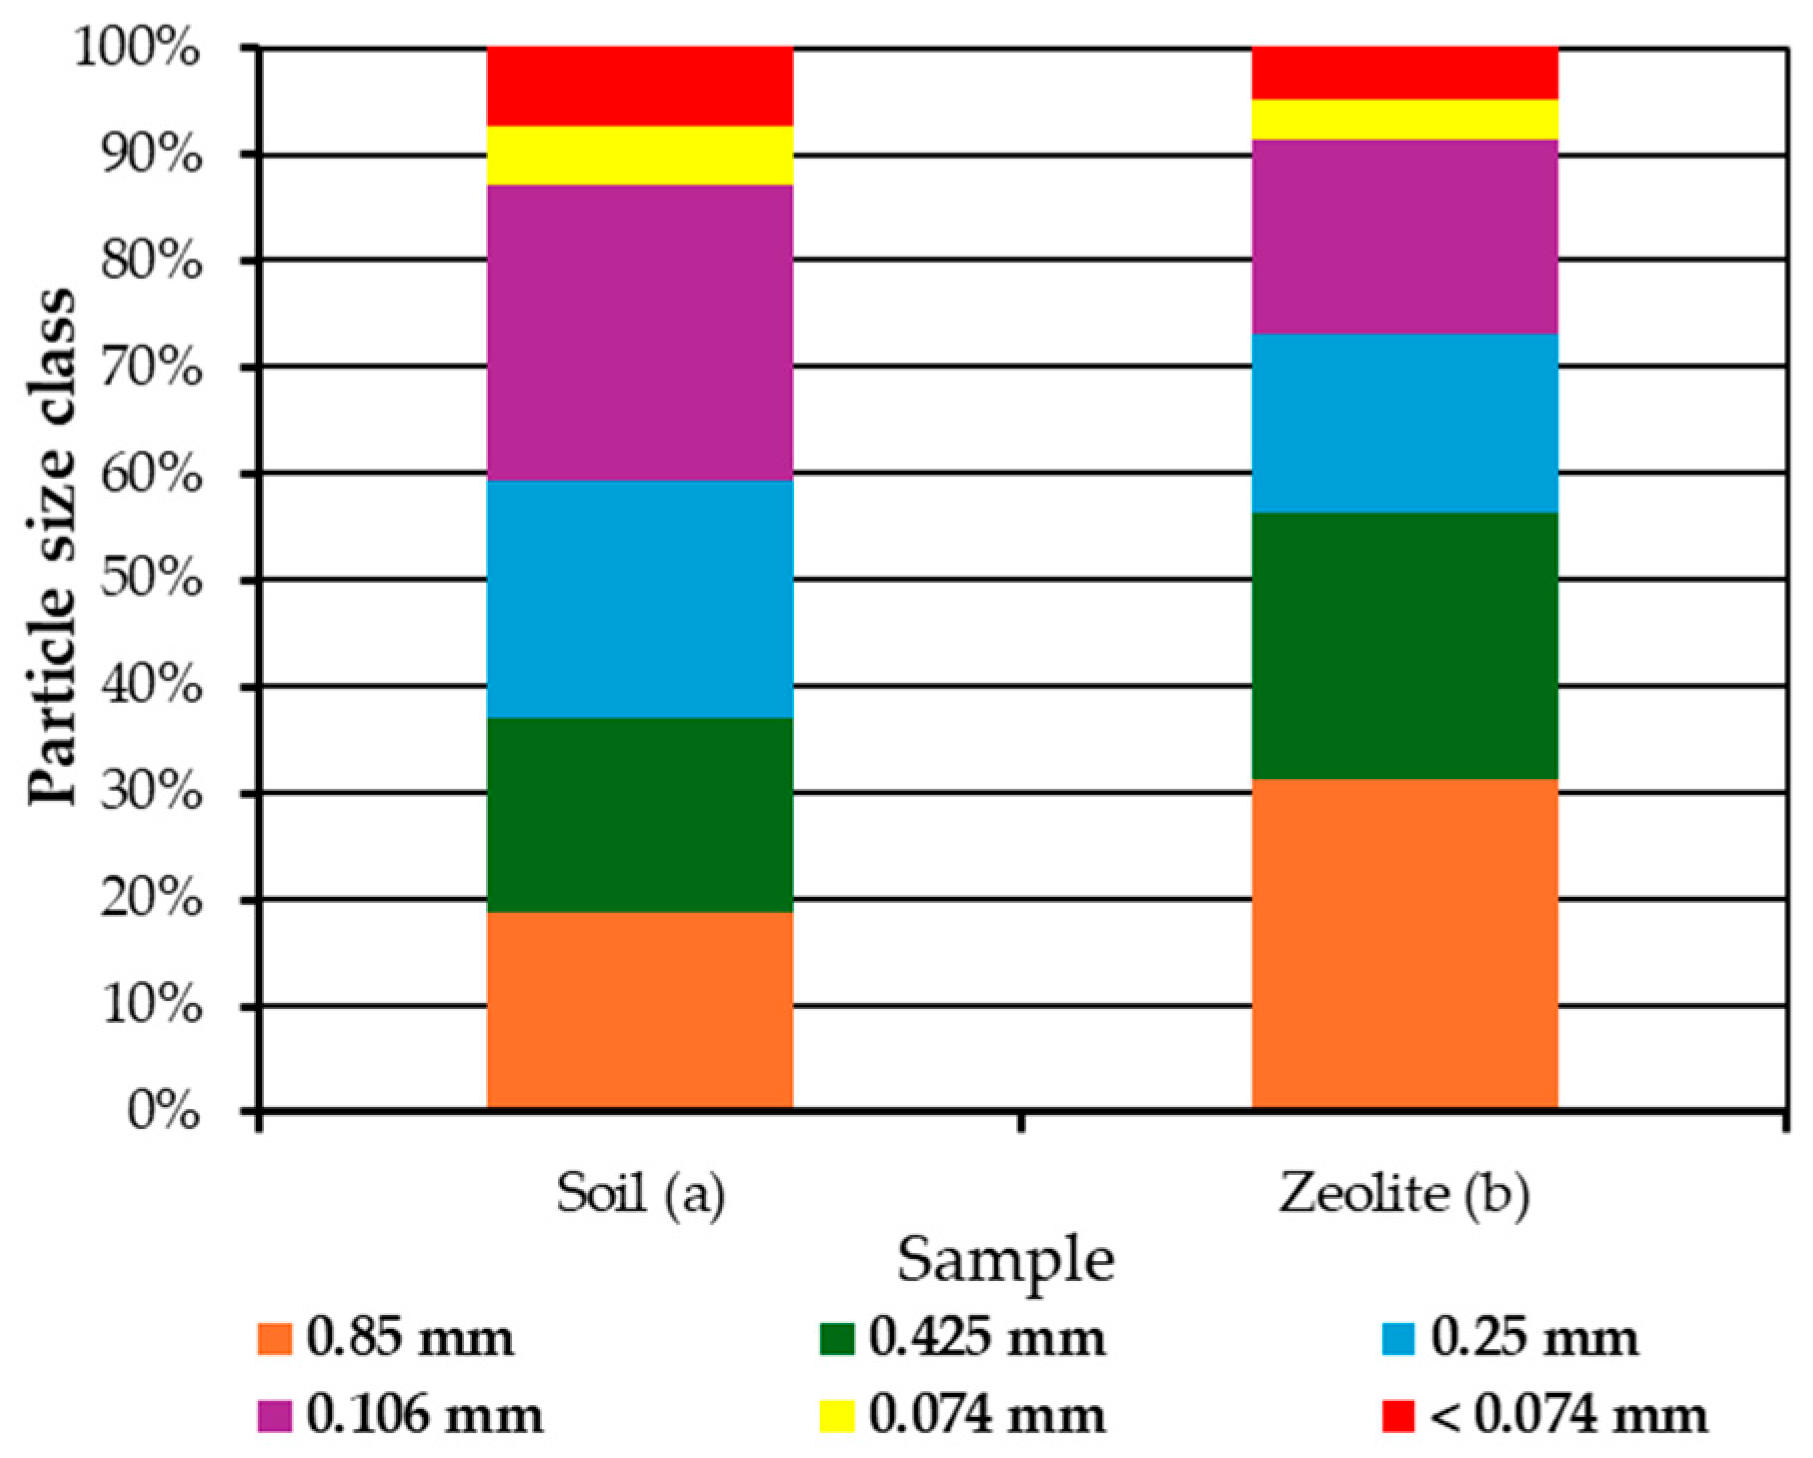
The applied zeolite is composed of Heulandite (53%) and Mordenite (47%), with a bulk density of 0.98 g dm−3 and a surface area of 40 m2 g−1. Figure 1, which shows the particle size distribution of both the sandy loam soil and the zeolite, points out that the soil contains 37% of coarse particles (0.425–0.85 mm), which is lower than that of the zeolite (56%). Therefore, the addition of the zeolite increases the percentage of coarse particles in the soil–zeolite mixture compared to the original sandy loam soil. Both the soil and zeolite were oven-dried at 60 °C, sieved at 2 mm before mixing, and then homogenized to ensure the maximum uniformity of the samples.
Figure 1.
The particle size distribution of both the sandy loam soil (a) and zeolite (b).
In this study, the WHC of both the soil and mixture samples was measured to obtain a reference to be used for the preparation of the samples for the FFC-NMR relaxometry analyses. A plastic funnel was placed in a plastic test tube and filled with filter paper (Whatman 46, Kent, UK) containing 10 g of the investigated sample (either the soil or mixture). Milli-Q (Darmstadt, Germany) grade water (an electrical conductivity of 18.2 Ω−1) was homogeneously added to the samples till the first drop was discharged from the bottom of the funnel. The difference between the weights of either the soil or mixture sample before and after the experiment corresponds to the maximum amount of water that either the soil or the mixture is able to retain.
To simulate the effect of different zeolite concentrations, soil samples were amended with eight zeolite concentrations Cz (0, 1, 1.5, 2.5, 5, 10, 15, and 30%). In addition to untreated soil (Cz = 0%) and amended soil (soil–zeolite mixtures) samples, additional measurements were performed on samples composed exclusively of zeolite. However, “pure zeolite” samples were excluded because FFC-NMR measurements were found to be insensitive to the samples, as the spectrum was dominated by free water. For each sample, two replicates were prepared and examined by the FFC-NMR instrument.
2.2. FFC-NMR Instrument and Data Analysis
The relaxometry experiments were performed using the Stelar SmarTracer Fast Field Cycling (FFC) NMR Relaxometer (Stelar s.r.l., Mede, Italy), operating at a constant temperature of 25 °C. The relaxometer works by rapidly switching among three magnetic fields: the polarization field (Bpol), the relaxation field (Brlx), and the acquisition field (Bacq). These fields are optimized to enhance NMR sensitivity, allow relaxation, and acquire the NMR signal, respectively.
The acquisition field (Bacq) was applied to preserve observable magnetization, generated in this study by a 90° radiofrequency pulse (4.71 μs) immediately after the relaxation phase. The relaxation field was varied so that the proton Larmor frequency (νL) ranged from 0.01 to 10 MHz, corresponding to the operating range of the instrument. The polarization field, corresponding to νL = 10 MHz, was applied only when Brlx fell within the 0.01–3 MHz range.
The polarization time (Tpol) was set to approximately five times the T1 relaxation time estimated at the selected frequency. To determine the distribution of T1 relaxation times, the Uniform PENalty regularization (UPEN) algorithm was used [36] by applying the default parameters as provided by the free downloaded software (https://site.unibo.it/softwaredicam/en/software/upenwin, accessed on 17 November 2025). Following the method proposed by Conte and Ferro [33], the measurements were conducted with a soil-to-water weight ratio corresponding to the water holding capacity (WHC). The T1 distribution was obtained across the νL range of 0.01–10 MHz. Each solid sample was placed in a 10 mm NMR-grade tube, and water was added until the target WHC was reached. The samples were then left undisturbed overnight (≈12–14 h) to allow complete water equilibration and to avoid the formation of preferential flow paths. FFC-NMR measurements were performed on both the original soil and the repacked soil–zeolite samples (the mixture was prepared in the laboratory) using seven zeolite concentrations (1, 1.5, 2.5, 5, 10, 15, and 30%). For each sample replicate, each NMR measurement was performed in triplicate. For fixed experimental conditions, the T1 measurements were characterized by low variability and, for this reason, they were averaged.
The main limitation of FFC-NMR is that the effects arising from changes in pore size and water retention are detected simultaneously and cannot be distinguished. Moreover, the measurement of the zeolite composition revealed a negligible number of paramagnetic species such as iron(III) and manganese(II). Therefore, all the results were not influenced by the aforementioned species.
2.3. Assessing Hydrological Connectivity in Soil (HCS)
NMR relaxometry measures the rate at which the z-component of the nuclear magnetic moment returns from a non-equilibrium to an equilibrium state. These processes, known as relaxation, are driven by local magnetic field fluctuations and are primarily influenced by molecular motion. Therefore, the longitudinal relaxation time (T1) serves as a proxy for molecular dynamics. Specifically, T1 values provide information on motion frequencies in the 105–108 Hz range, which are characteristic of water molecules moving within porous media [34].
In soils, shorter T1 values are associated with small pores, typically bounded by clay particles and micro-aggregates, while longer T1 values correspond to larger pores, such as those delimited by sand, silt, and coarse aggregates [37].
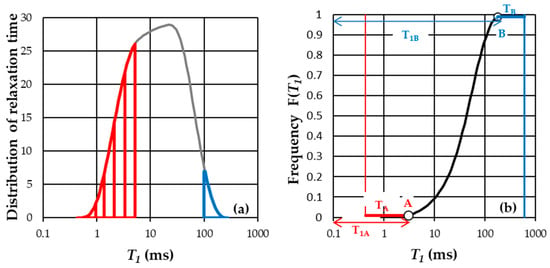
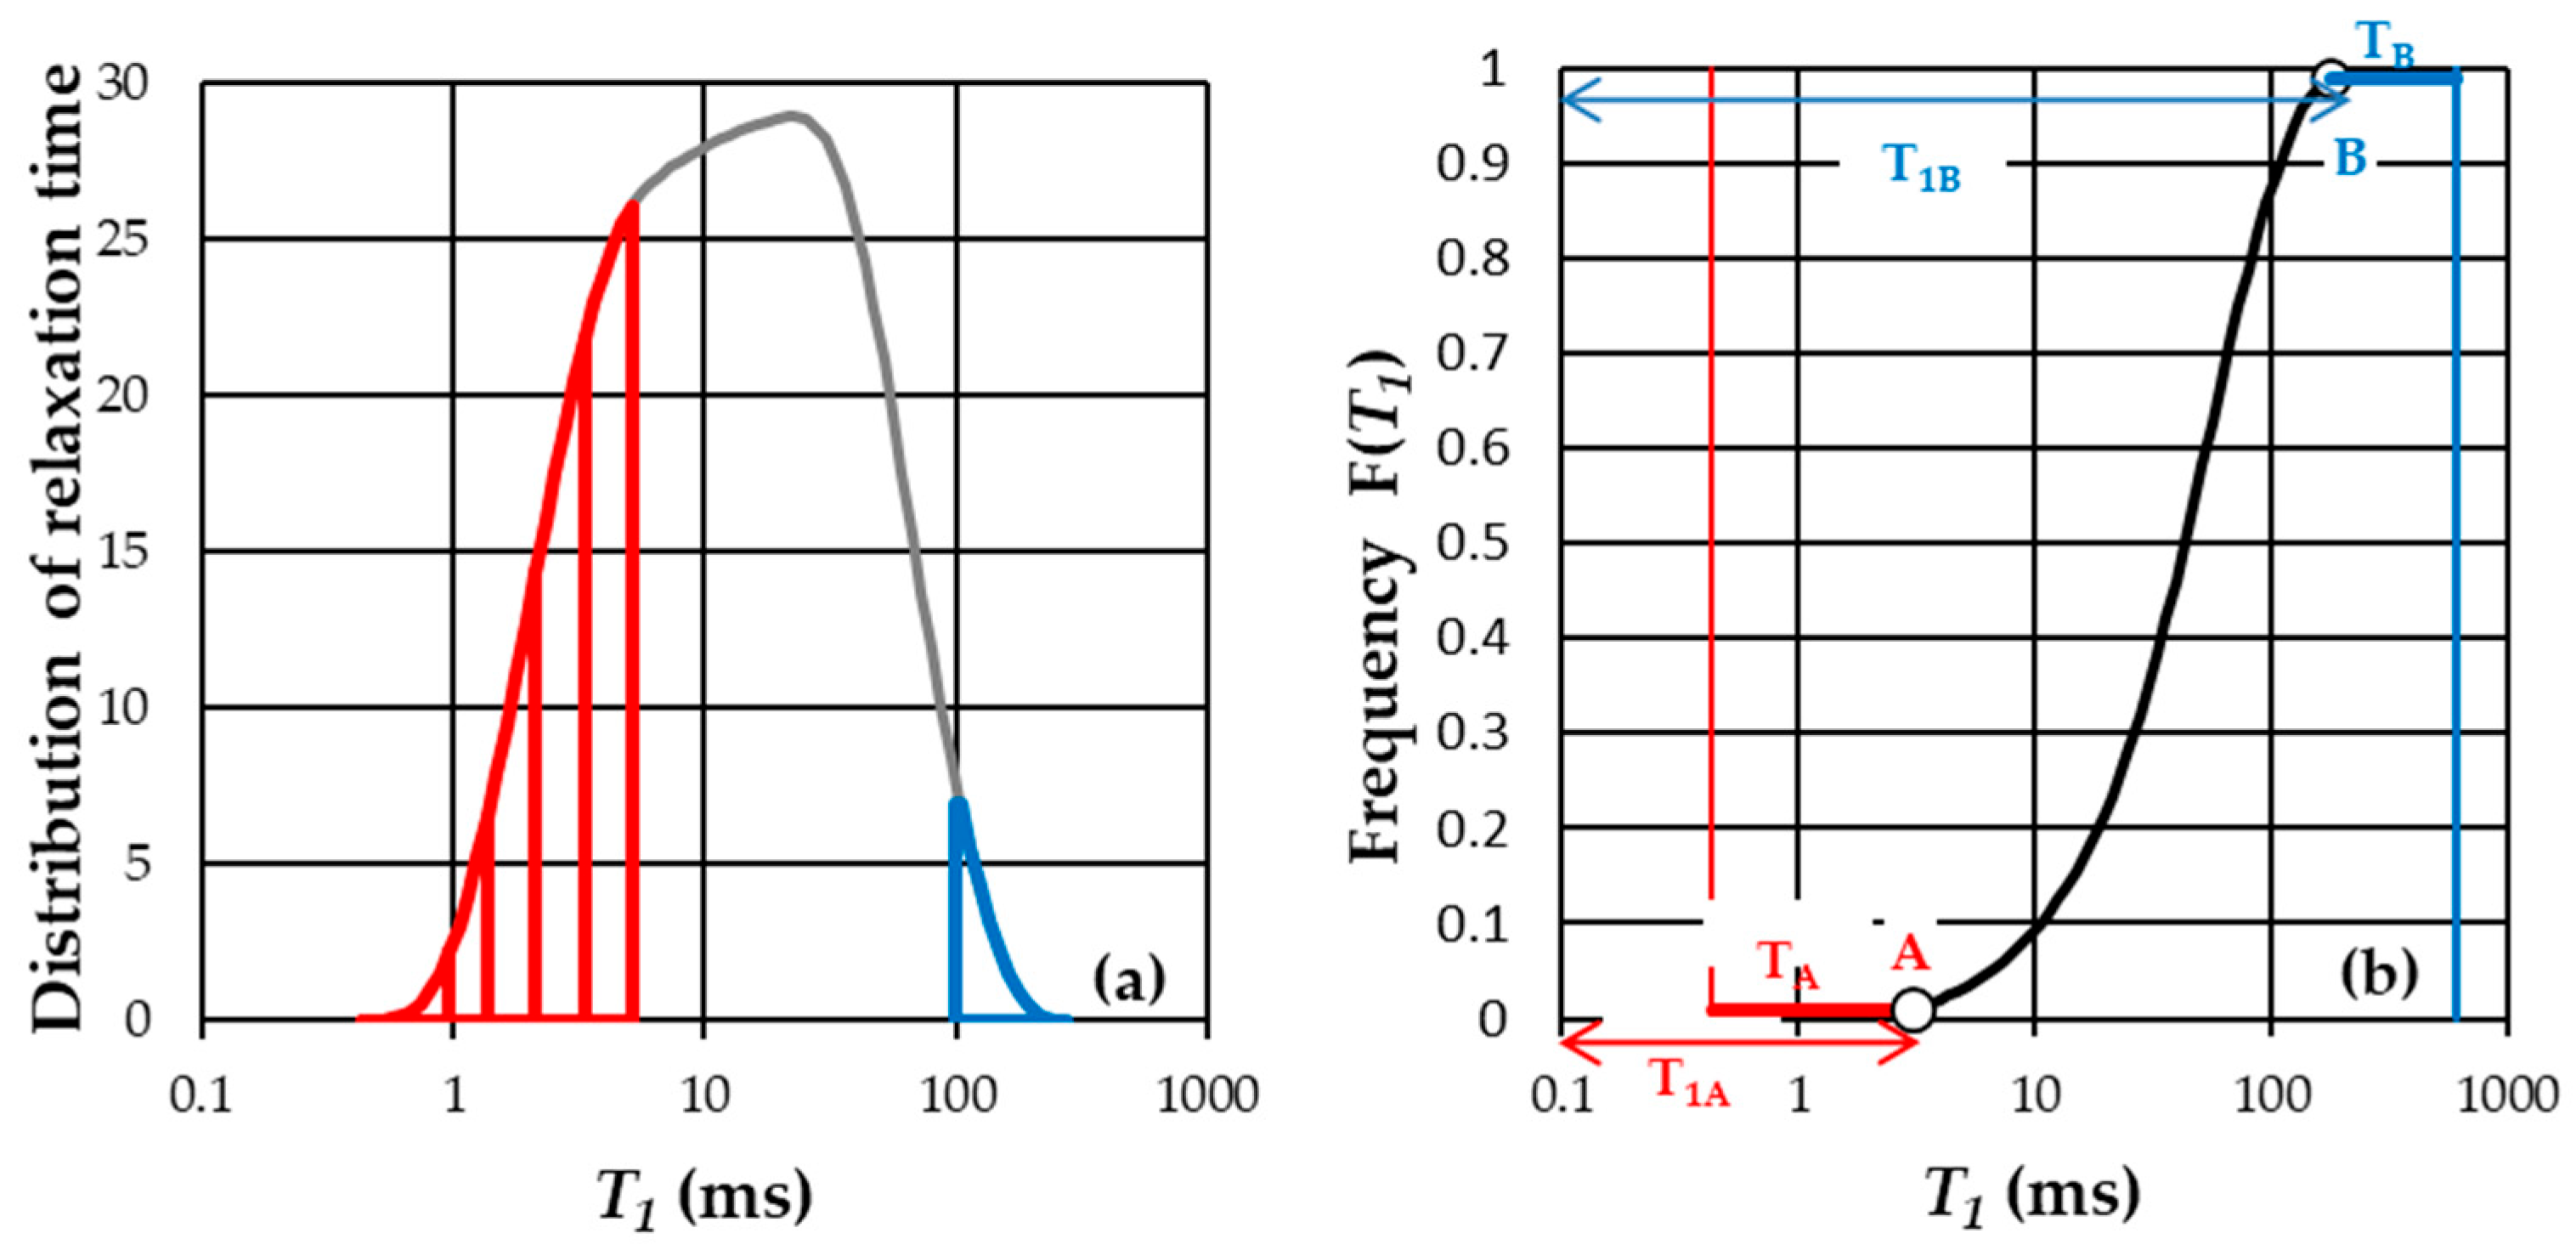
In the measured T1 distributions (Figure 2a), water molecules confined in micropores are found near the lower end of the T1 range (zone TA in Figure 2b), while those in macropores lie near the upper end (zone TB). The intermediate region, between point A (the upper T1 limit of micropores) and point B (the lower T1 limit of macropores), represents mesoporous domains.
Figure 2.
A relaxogram (a) and example of the integral curve of the relaxogram that associates the AT1/A ratio with each T1 value (b). Red refers to the A point, while blue refers to the B point. The arrows indicate the relaxation time of the points A (T1A) and B (T1B).
Conte and Ferro [32,33,34] proposed a novel method for quantifying structural connectivity (SC) and functional connectivity (FC) in soils based on a mathematical analysis of NMR relaxograms. For a given νL, the relaxogram (i.e., T1 distribution) is integrated to compute the AT1 area bounded by the curve and the T1 axis. This area is then normalized by the total area, A, producing the ratio AT1/A, which corresponds to the non-exceedance empirical cumulative frequency F(T1). This function ranges from 0 to 1.
As shown in Figure 2b, F(T1) typically exhibits an S-shaped curve, with two inflection points, A and B, representing the boundaries between micro-, meso-, and macropore domains. The A point is defined where F(T1) = 0.01 and the B point where F(T1) = 0.99, implying that only 1% of the T1 values fall below (or above) these thresholds, respectively.
The movement of water through micropores, mesopores, and macropores defines the Hydrological Connectivity within the Soil (HCS). The T1–pore size relationship allows an interpretation of low F(T1) values (below A) as water in the micropores, where limited space reduces molecular motion, and high values (above B) as water in the macropores, where mobility is greater.
Pore size classification follows Pagliai and Vignozzi [38]: micropores with a diameter (d) < 0.5 μm, mesopores with 0.5 μm ≤ d ≤ 50 μm, and macropores with d > 50 μm. Accordingly, the T1 value at point A (T1A) corresponds to the micropore upper limit and T1B to the macropore lower limit. The range between T1A and T1B defines the mesopore domain. A limitation of this method is the lack of direct calibration between T1 values and pore diameters. Bulk water movement, easily detected via NMR [34], is associated with the central portion of the F(T1) curve, between points A and B. The functional connectivity index (FCI) is defined by the TB/TA ratio, reflecting the contrast between slow-moving water in small pores and fast-moving water in large ones. The structural connectivity index (SCI) is calculated from the coefficient of variation of T1 values within the F(T1) interval 0.01 < F(T1) < 0.99, representing mesopore-related connectivity.
One-Way ANOVA, using “SPC for Excel” add-in software for Excel (BPI Consulting, LLC, Katy, TX, USA), was performed to verify if the empirical cumulative frequency distributions of the considered variables (T1, SCI, and FCI) were statistically different, assuming 95% as the confidence interval. Thus, statistical significance was attributed to a p-value < 0.05.
3. Results
3.1. Analysis of Relaxation Time Distributions
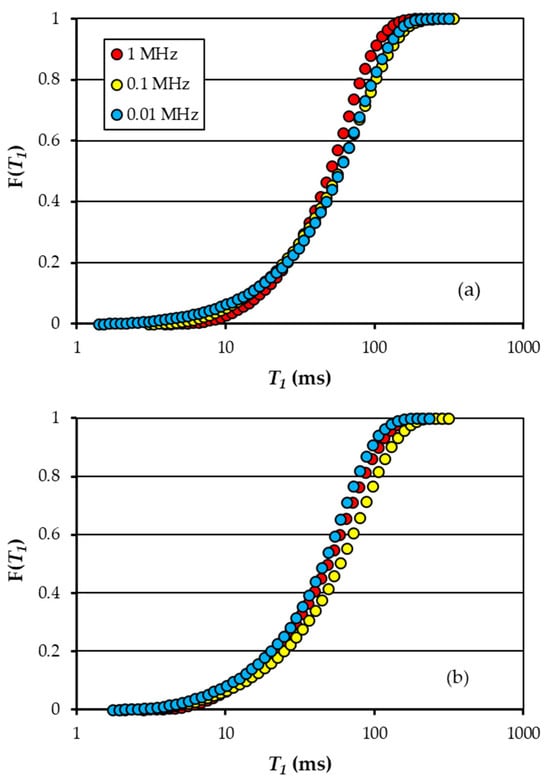
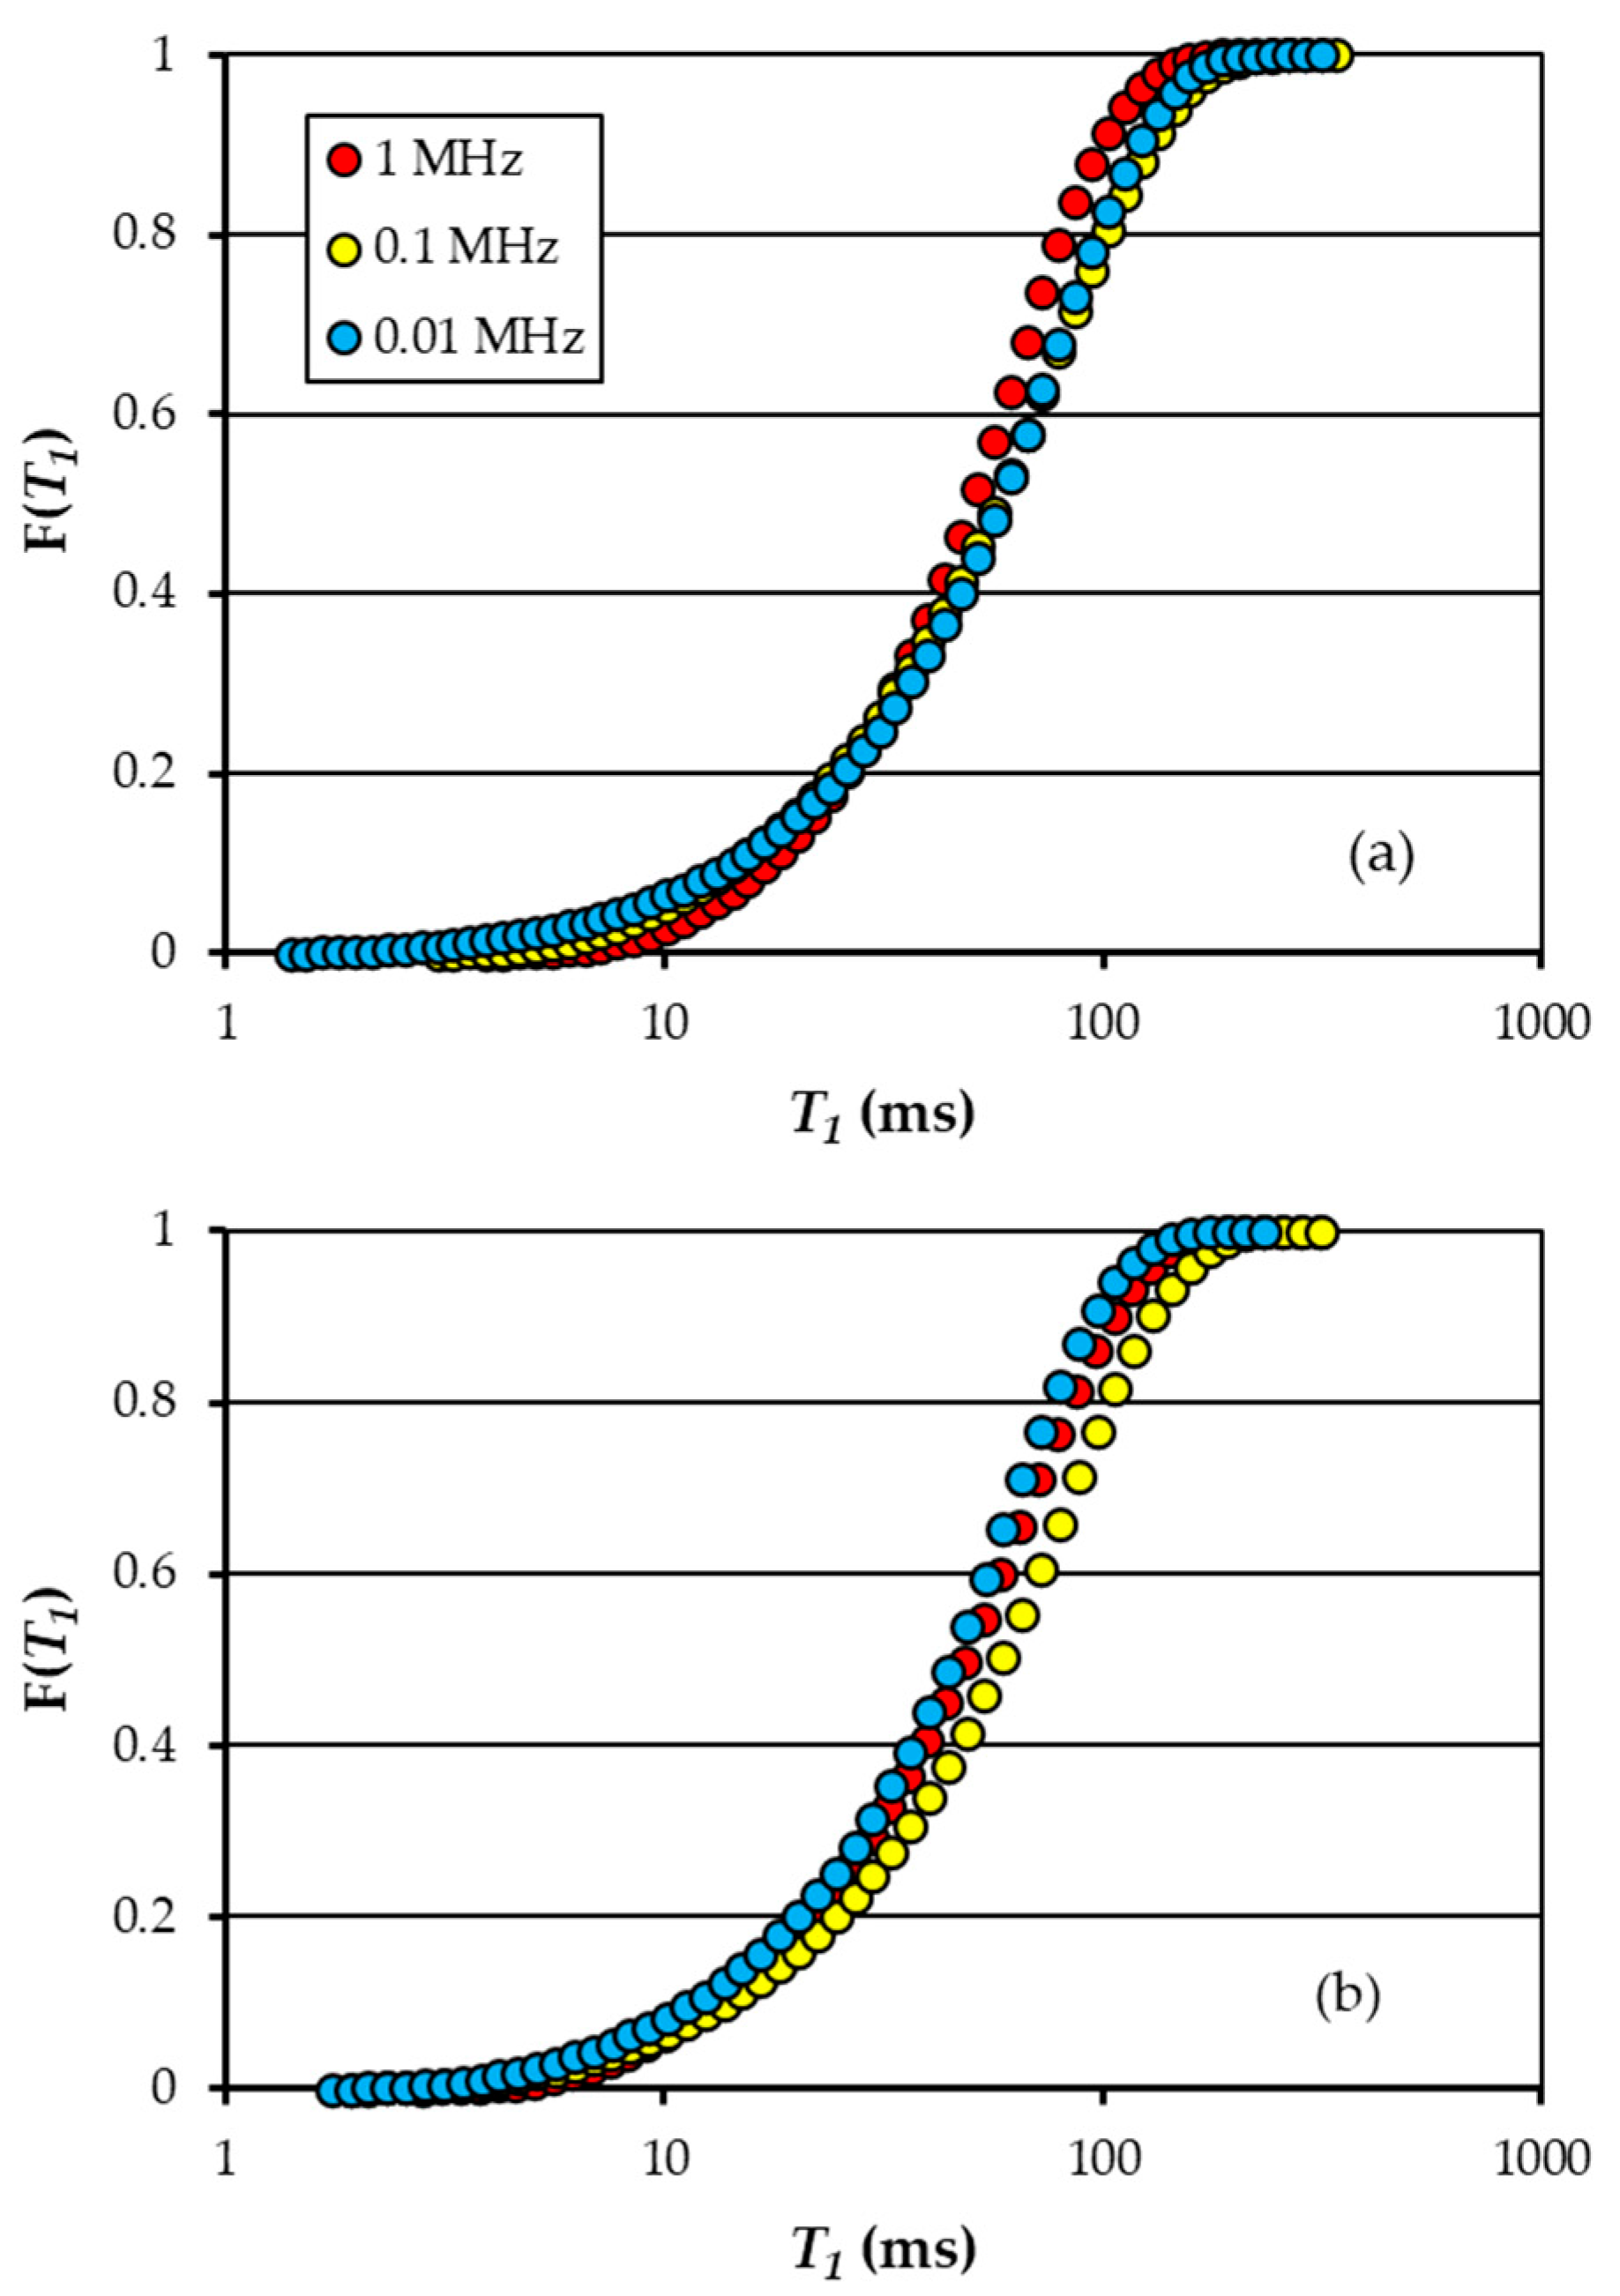
Since the calculation of the structural and functional connectivity indexes relies on the empirical cumulative frequency distribution F(T1) of the eight experimental treatments characterized by different zeolite concentrations (0, 1, 1.5, 2.5, 5, 10, 15, and 30%), the F(T1) distributions were first analyzed. Figure 3 shows, as an example for two zeolite concentrations (2.5 and 10%), F(T1) distributions corresponding to three νL values (0.01, 0.1, and 1 MHz).
Figure 3.
Example, for Cz = 2.5% (a) and Cz = 10% (b), of F(T1) distributions corresponding to three νL values (0.01, 0.1, and 1 MHz).
For both zeolite concentrations (2.5% in Figure 3a and 10% in Figure 3b), the F(T1) curves are nearly superimposed and show no systematic dependence on νL. The T1 data for the given νL were subjected to One-Way ANOVA, which confirmed that these distributions are statistically coincident. To overcome the slight variability due to νL, Conte and Ferro [34] suggested that a proton Larmor frequency of 1 MHz provides an optimal compromise for evaluating the connectivity indexes.
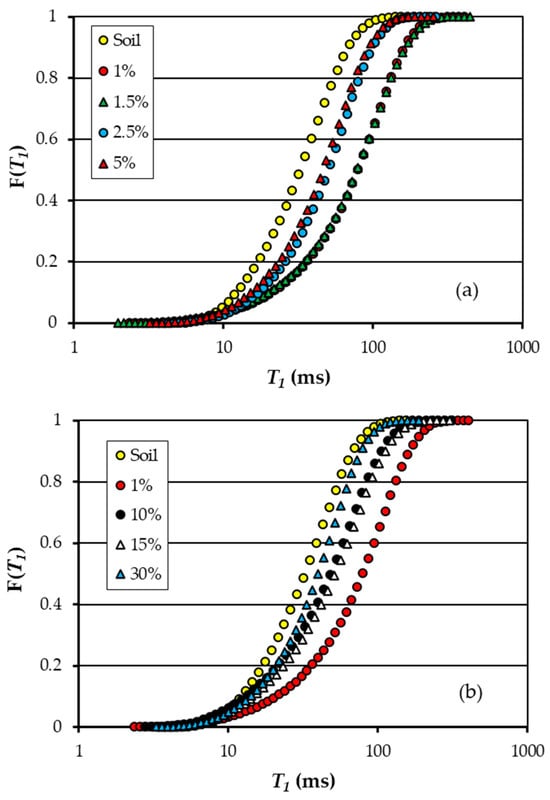
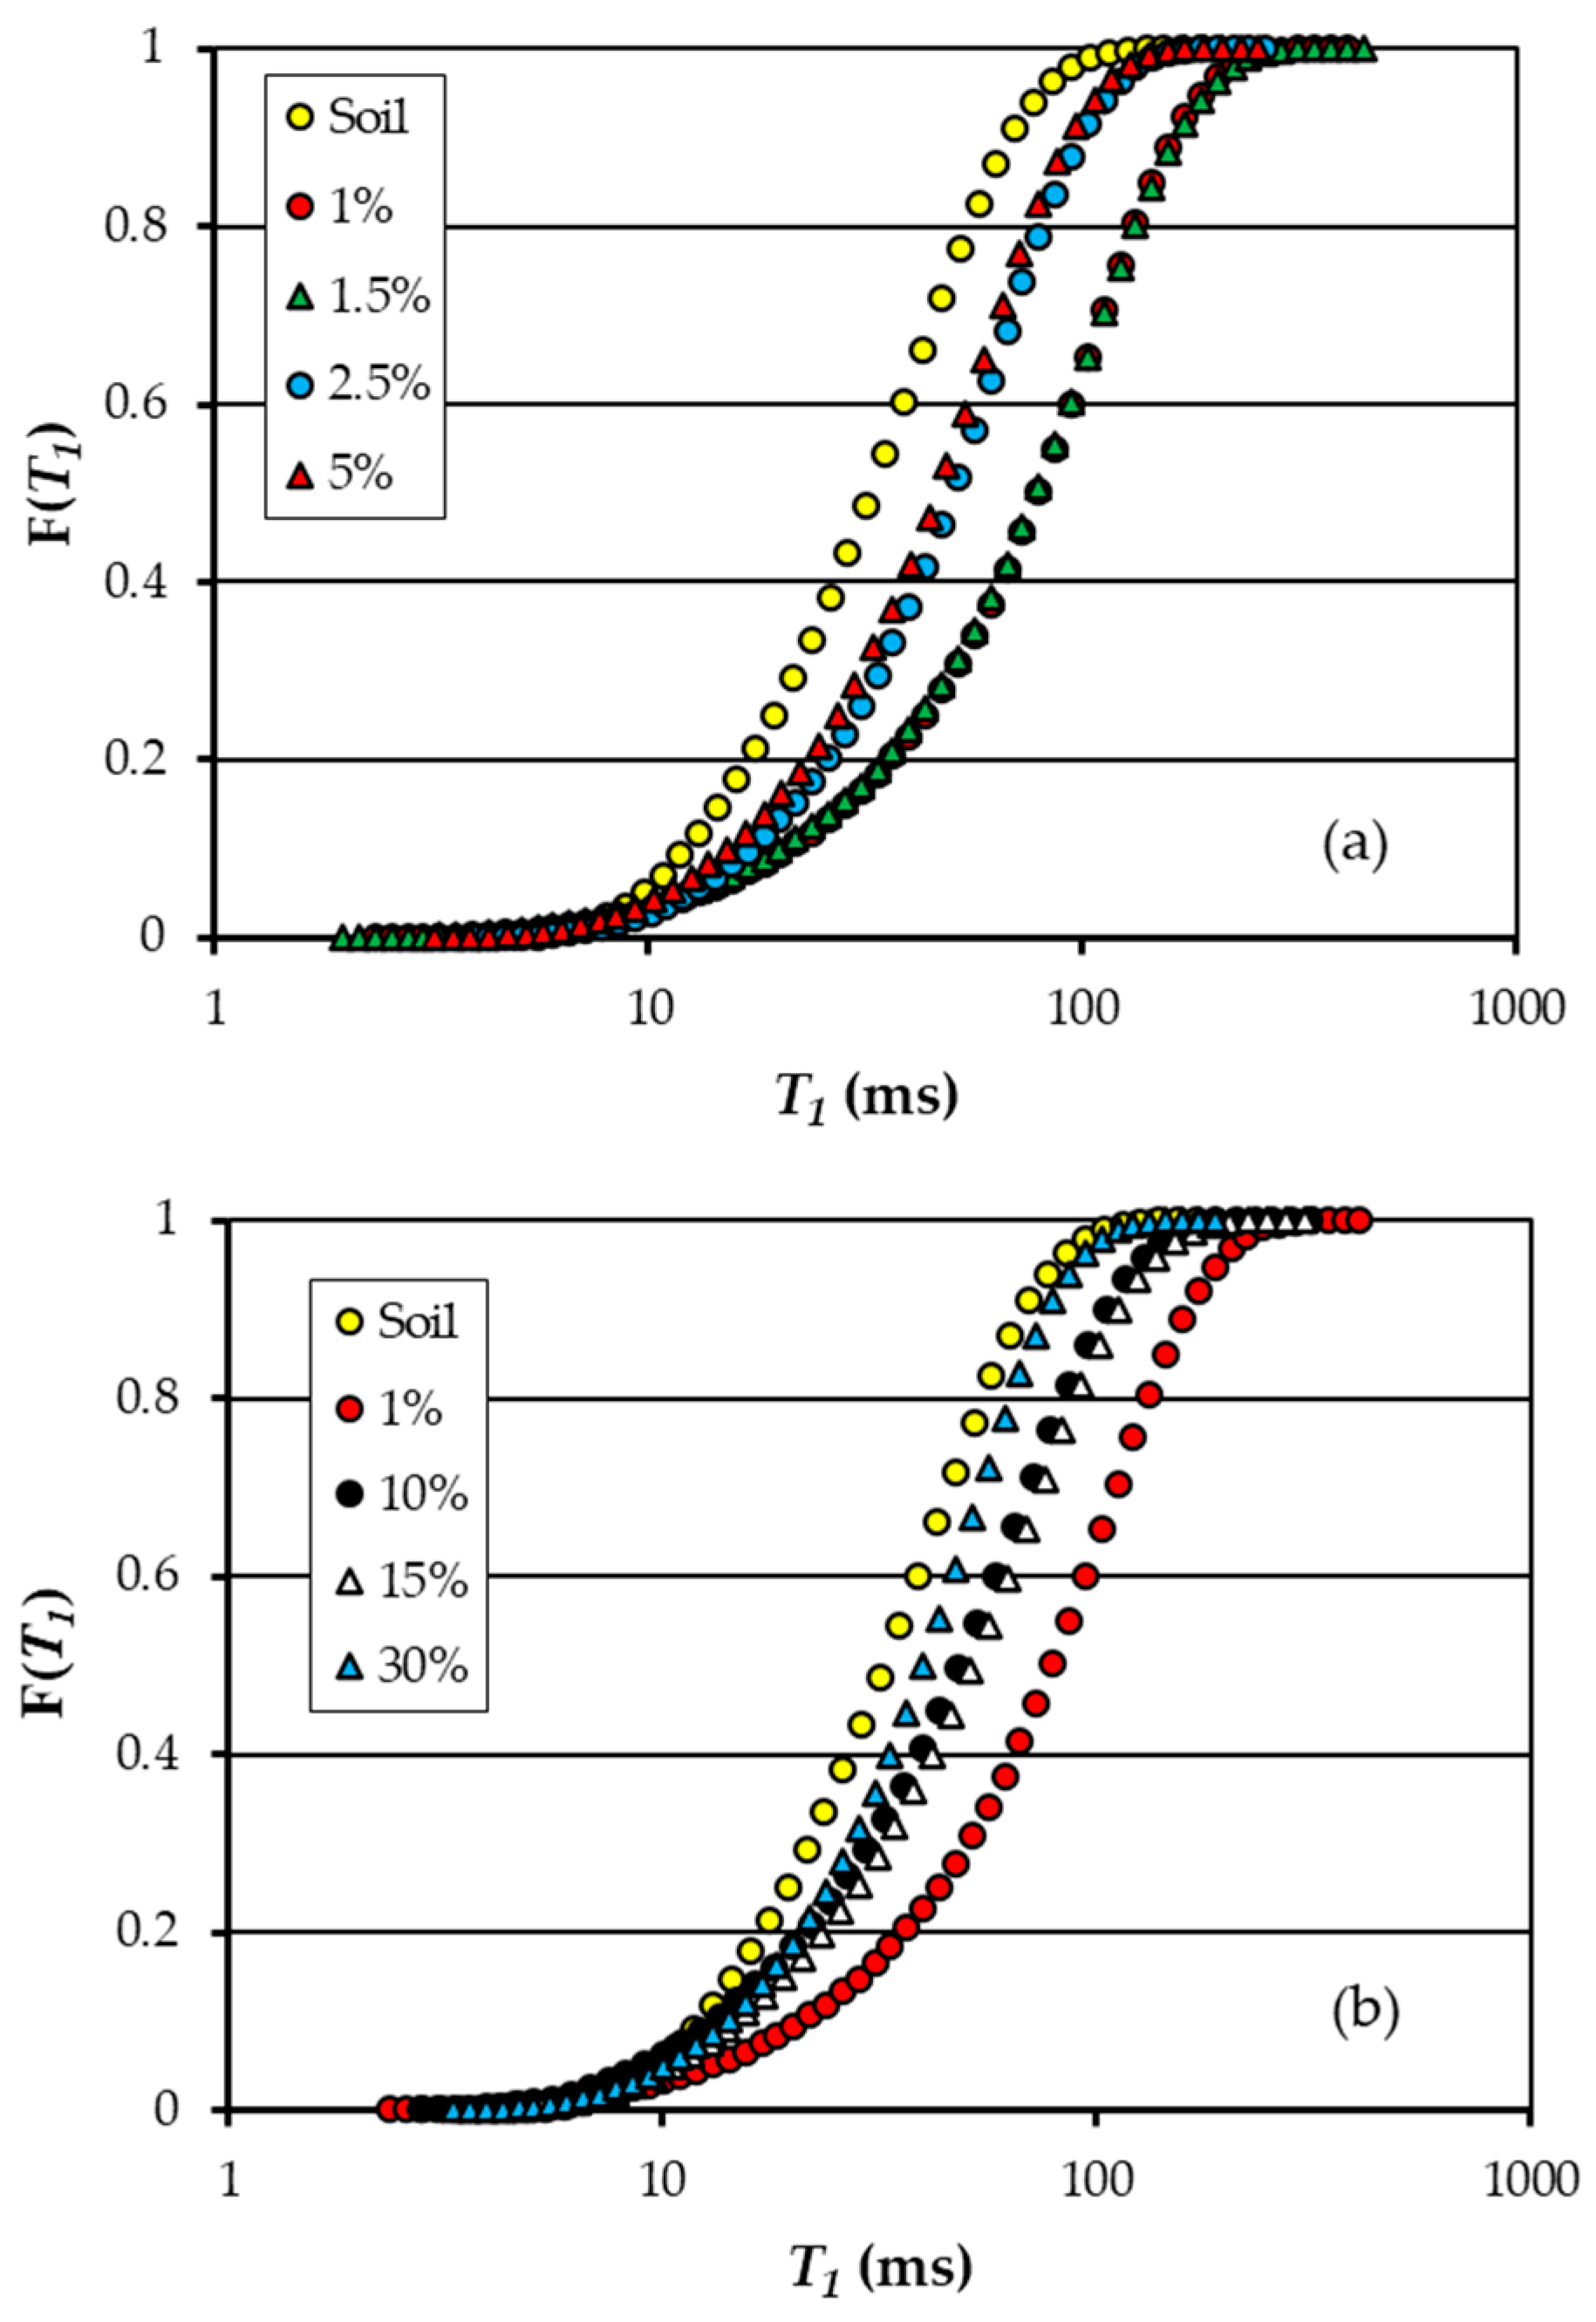
Figure 4 shows the F(T1) distributions at νL = 1 MHz for the sandy loam soil and mixtures with different zeolite concentrations (1, 1.5, 2.5, 5, 10, 15 and 30%). Adding zeolite concentrations from 1 to 5% (Figure 4a) results in a rightward shift in the F(T1) curve, indicating an increase in pore size (i.e., higher T1 values) compared to the untreated soil. However, for the Cz values of 1 and 1.5%, the rightward shift in the F(T1) curve is more pronounced than for the Cz values of 2.5 and 5%, and the curves obtained for the Cz values of 1 and 1.5% overlap. Thus, even a concentration of 1% is sufficient to cause an increase in the meso- and macropore components (Figure 4a), being more effective than higher concentrations (2.5–5%). Figure 4b points out that amending the original soil with 10% and 15% zeolite produces only an increase in the mesopore components in comparison to the original soil, while negligible effects are observed at Cz = 30%. Overall, Figure 4a,b demonstrate that the most evident changes in pore size occur at Cz = 1%.
Figure 4.
F(T1) distributions at νL = 1 MHz for the investigated soil and mixtures characterized by zeolite concentrations, Cz, ranging from 1 to 5% (a) and Cz ranging from 10 to 30% (b).
For νL = 1 MHz, the T1 data were subjected to One-Way ANOVA, which demonstrated that the Cz = 1% and 1.5% series were statistically different to the soil series, confirming the significant changes in terms of T1.
3.2. Analysis of Structural and Functional Connectivity Indexes
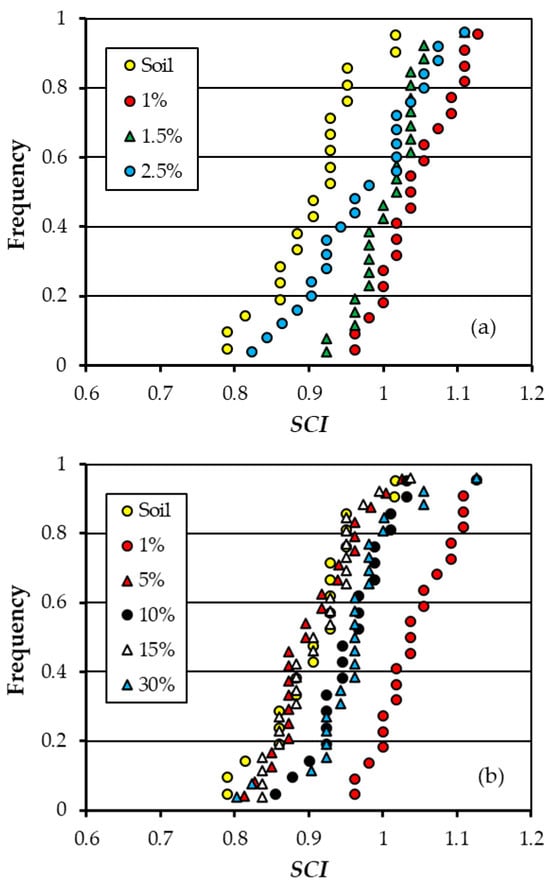
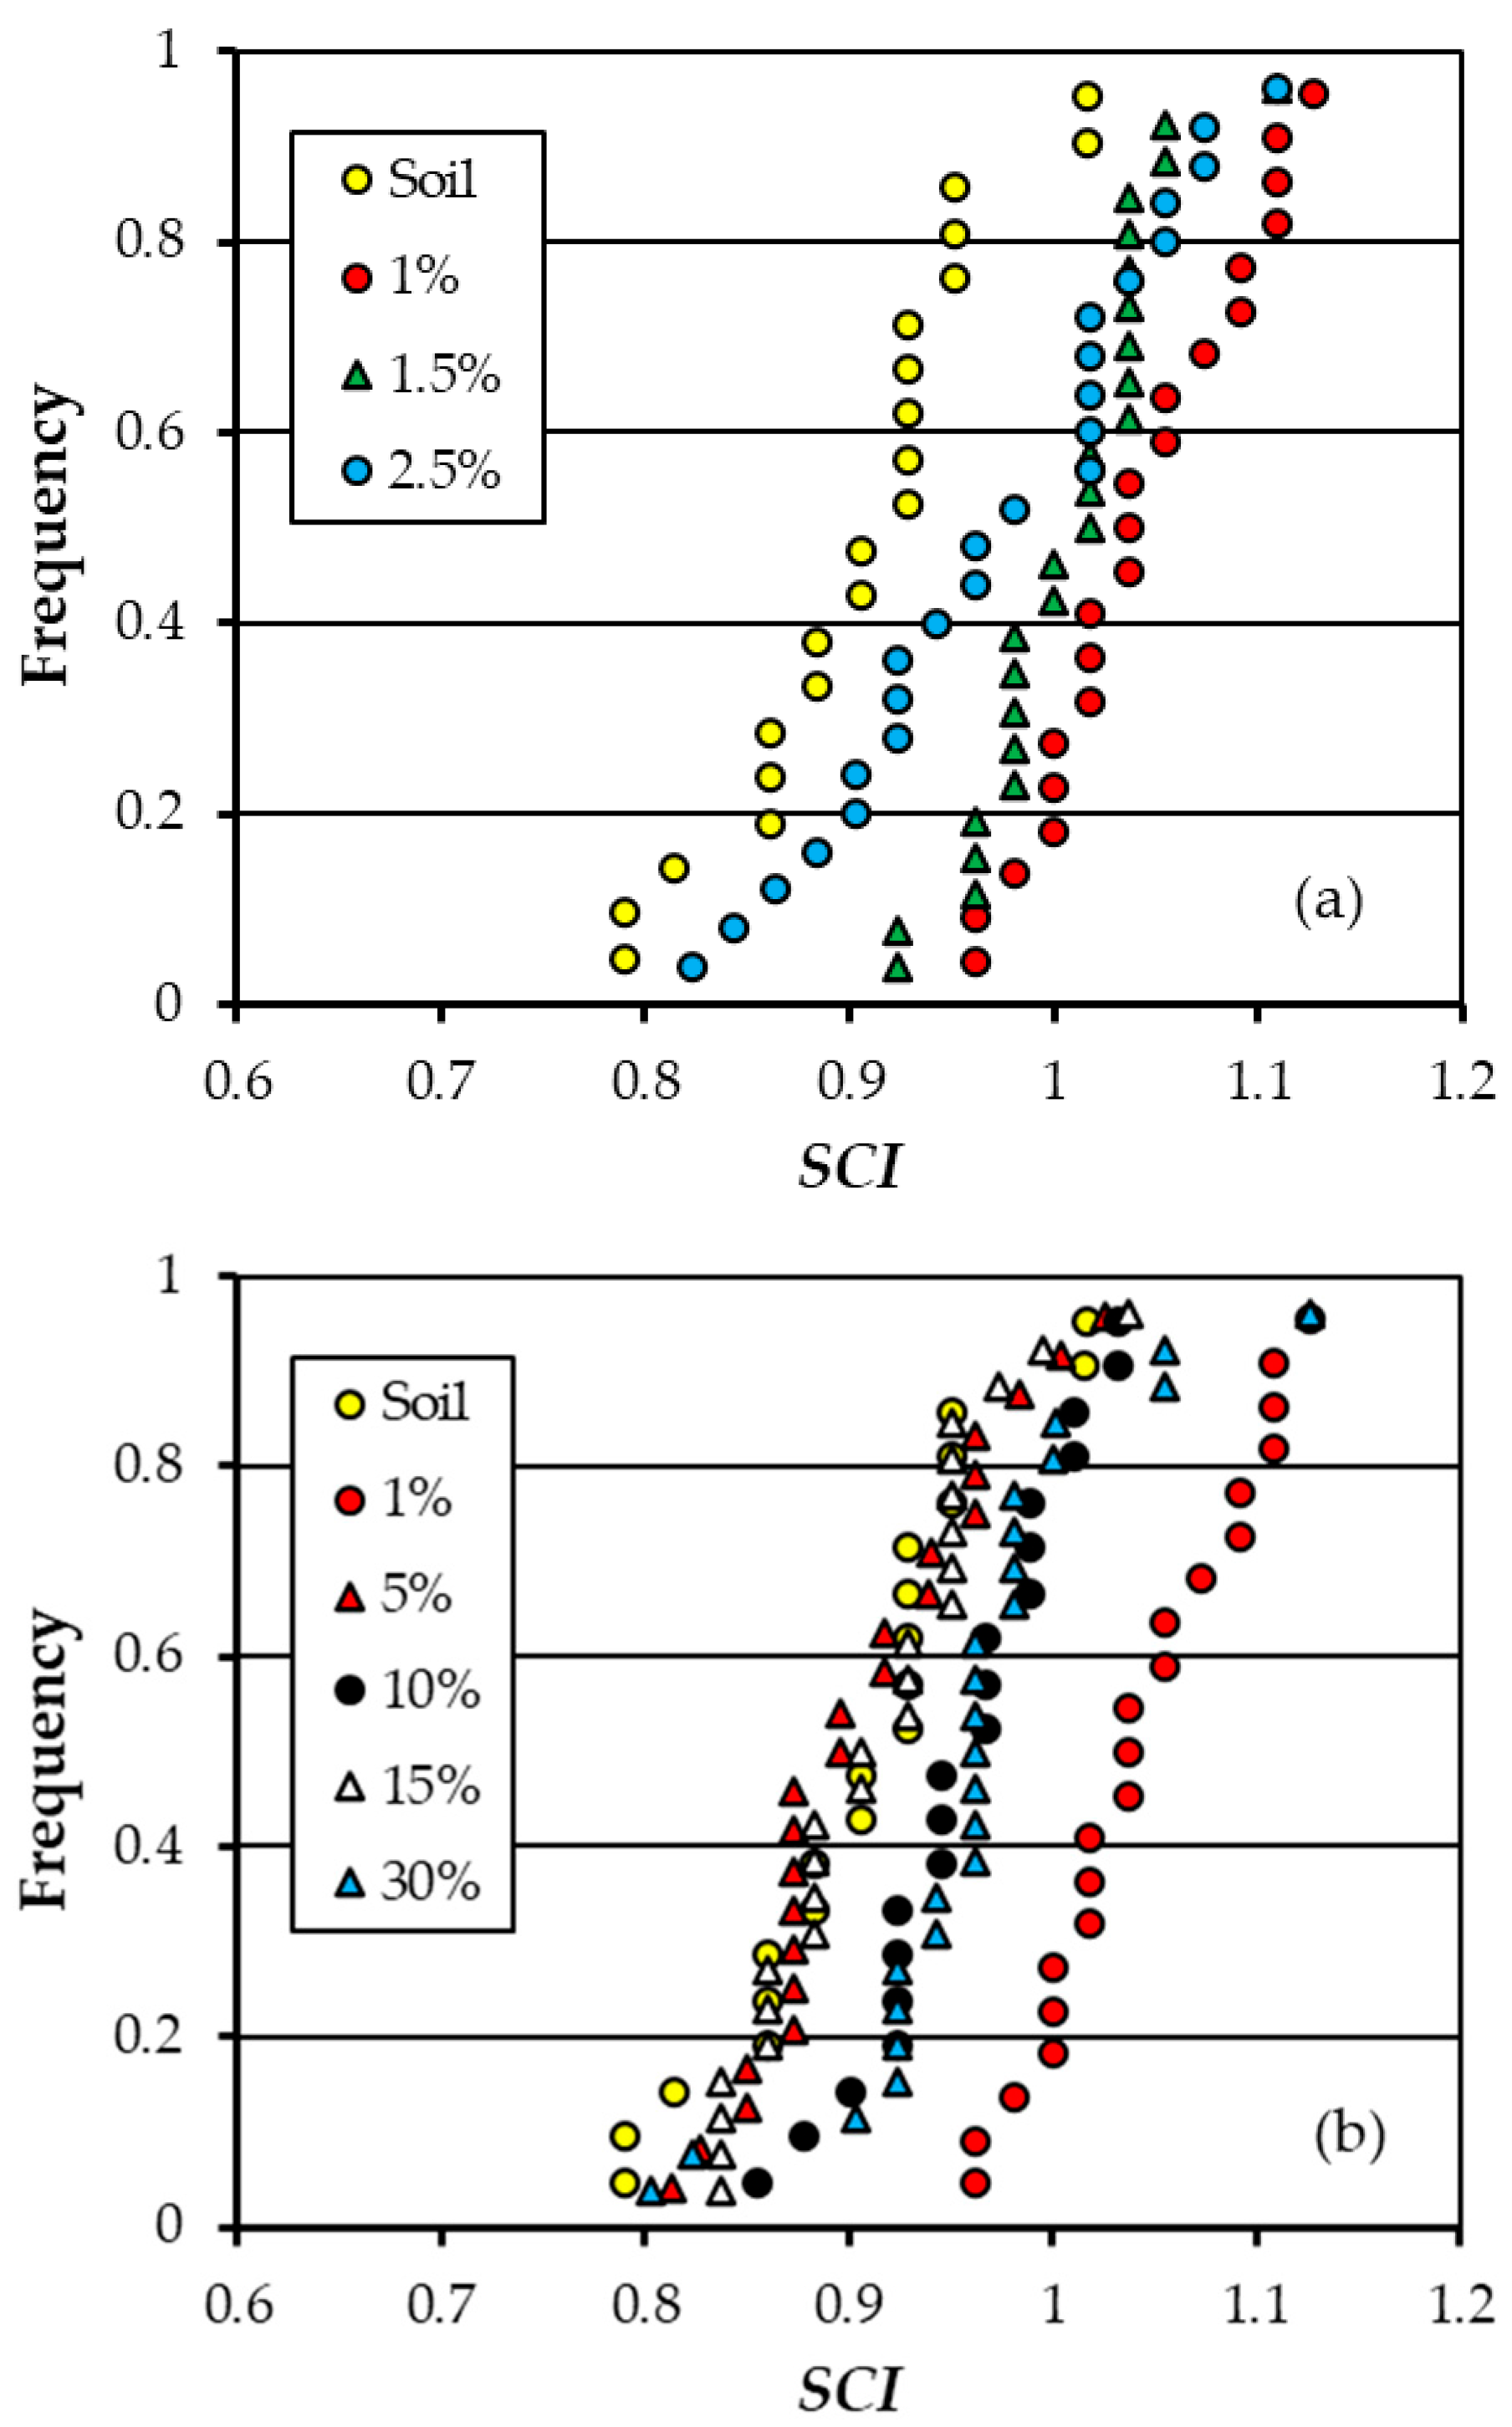
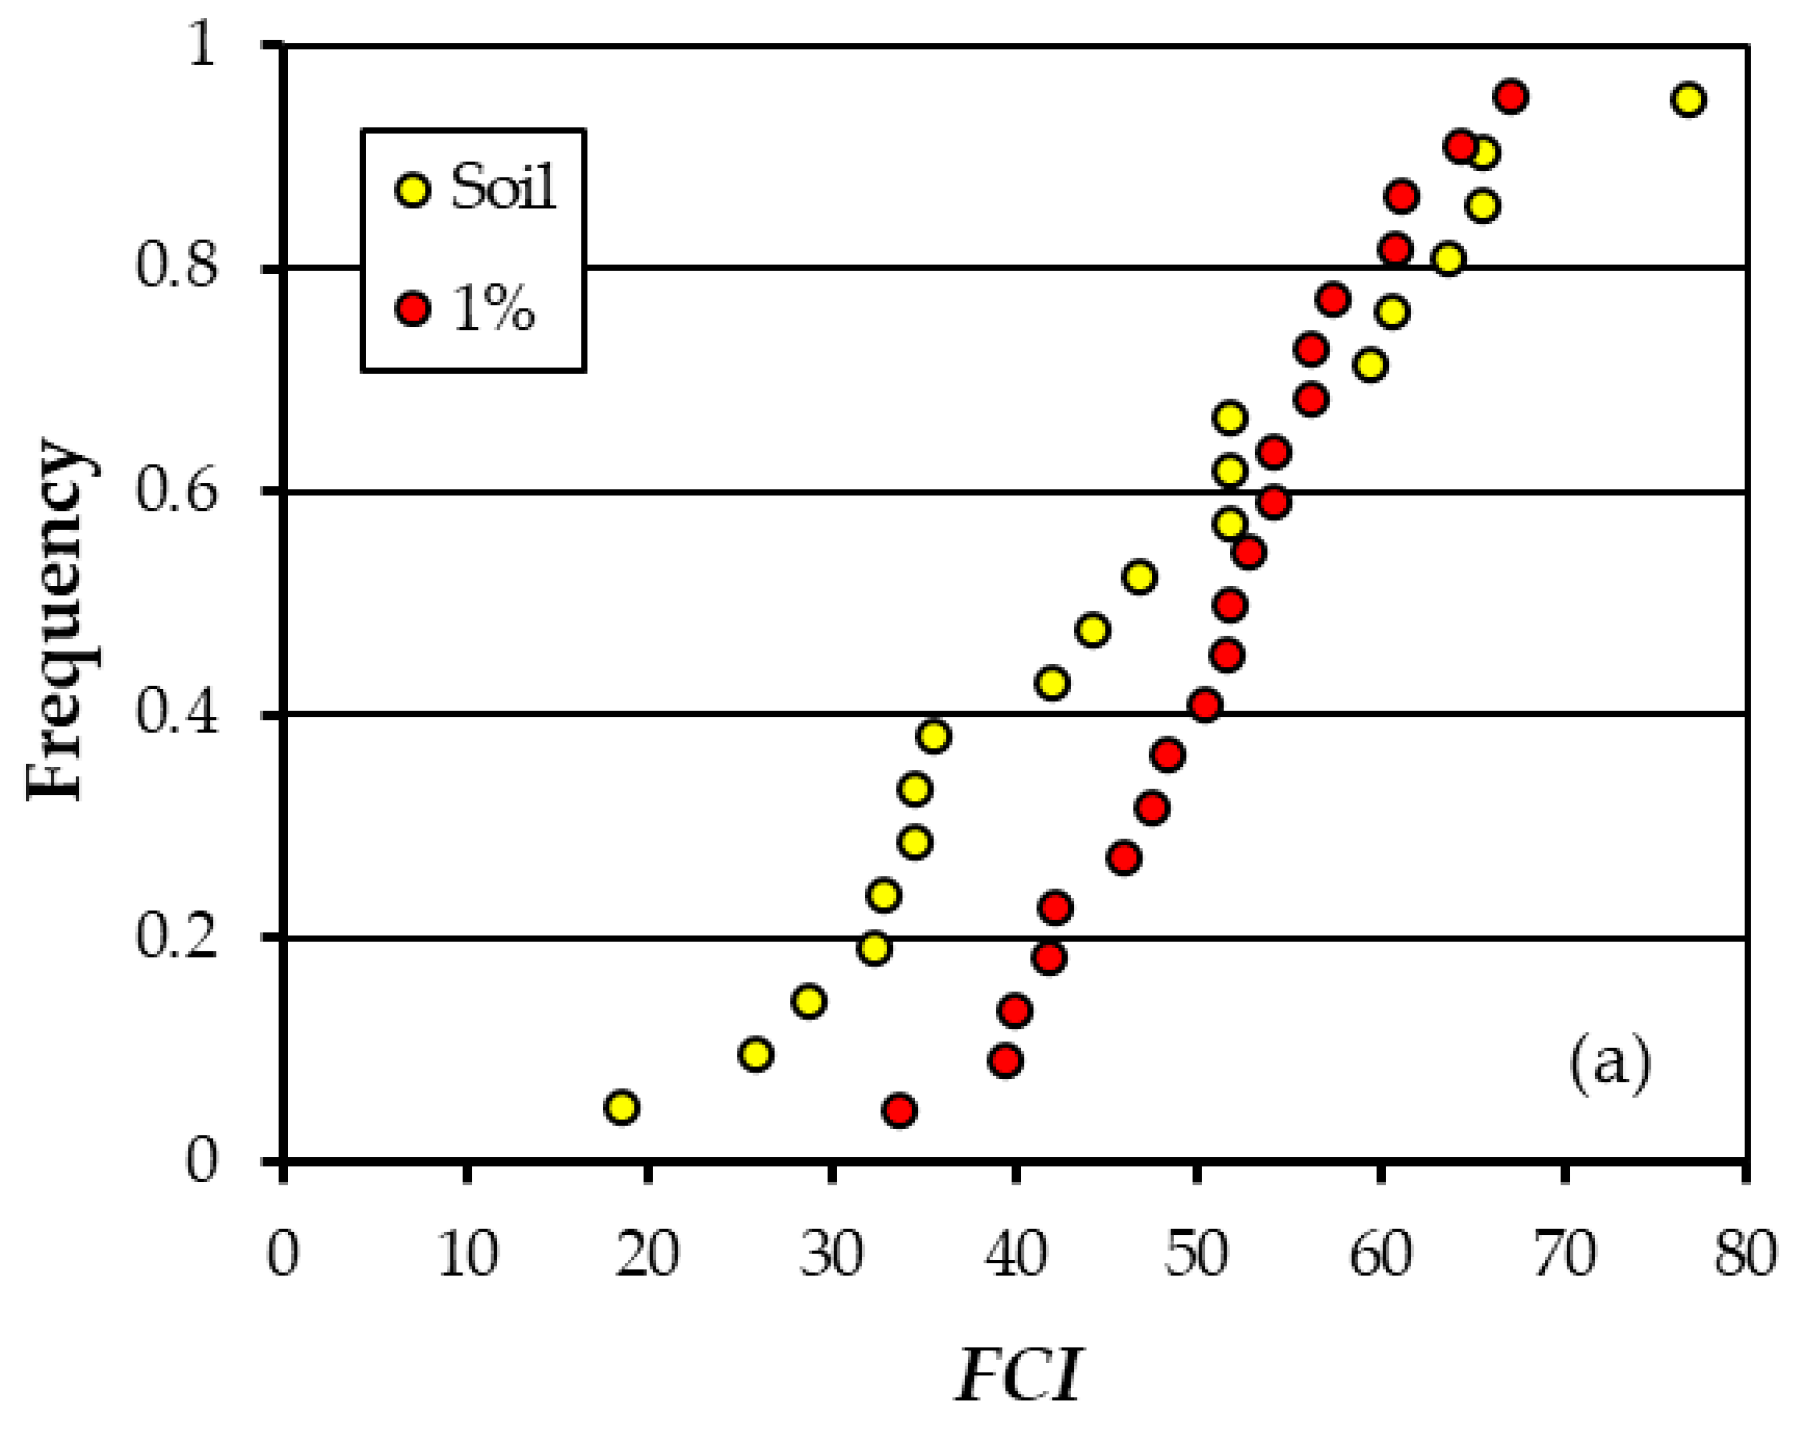
Following the approach by Conte and Ferro [32,33,34], the SCI and FCI values obtained at different νL frequencies were merged into single distributions (Figure 5 and Figure 6). For the investigated soil, Figure 5a shows that SCI distributions vary across zeolite concentrations, though not monotonically. An increase in structural connectivity is detected at 1–1.5% zeolite concentrations, with the highest SCI values for the zeolite concentration of 1%. Appreciable increases in the SCI were observed for the highest concentration values of 10 and 30% (Figure 5b), while intermediate concentrations (5–15%) showed non-monotonic behavior. However, Figure 5 clearly shows that the best condition, corresponding to the maximum shift of the SCI distribution of a mixture of soil and zeolite in comparison to the same distribution of the original soil, was obtained at a zeolite concentration of 1%. Moreover, the SCI data were subjected to One-Way ANOVA, which demonstrated that the Cz = 1% series was statistically different to all the other series, confirming the significant changes in terms of the SCI.
Figure 5.
Empirical cumulative frequency distributions of SCI for the investigated soil and mixtures characterized by zeolite concentrations, Cz, ranging from 1 to 2.5% (a) and Cz ranging from 5 to 30% (b).
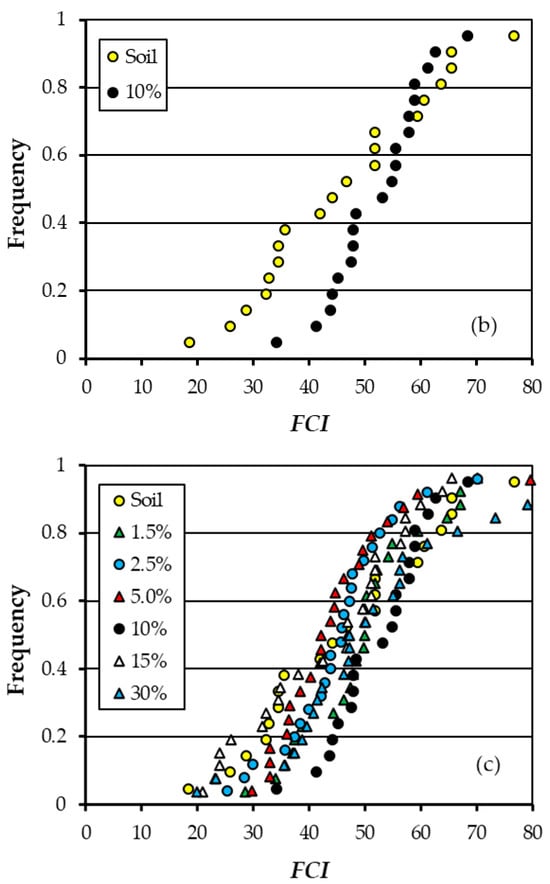
Figure 6.
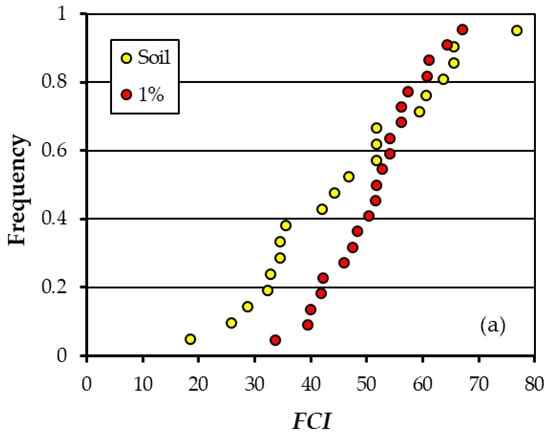
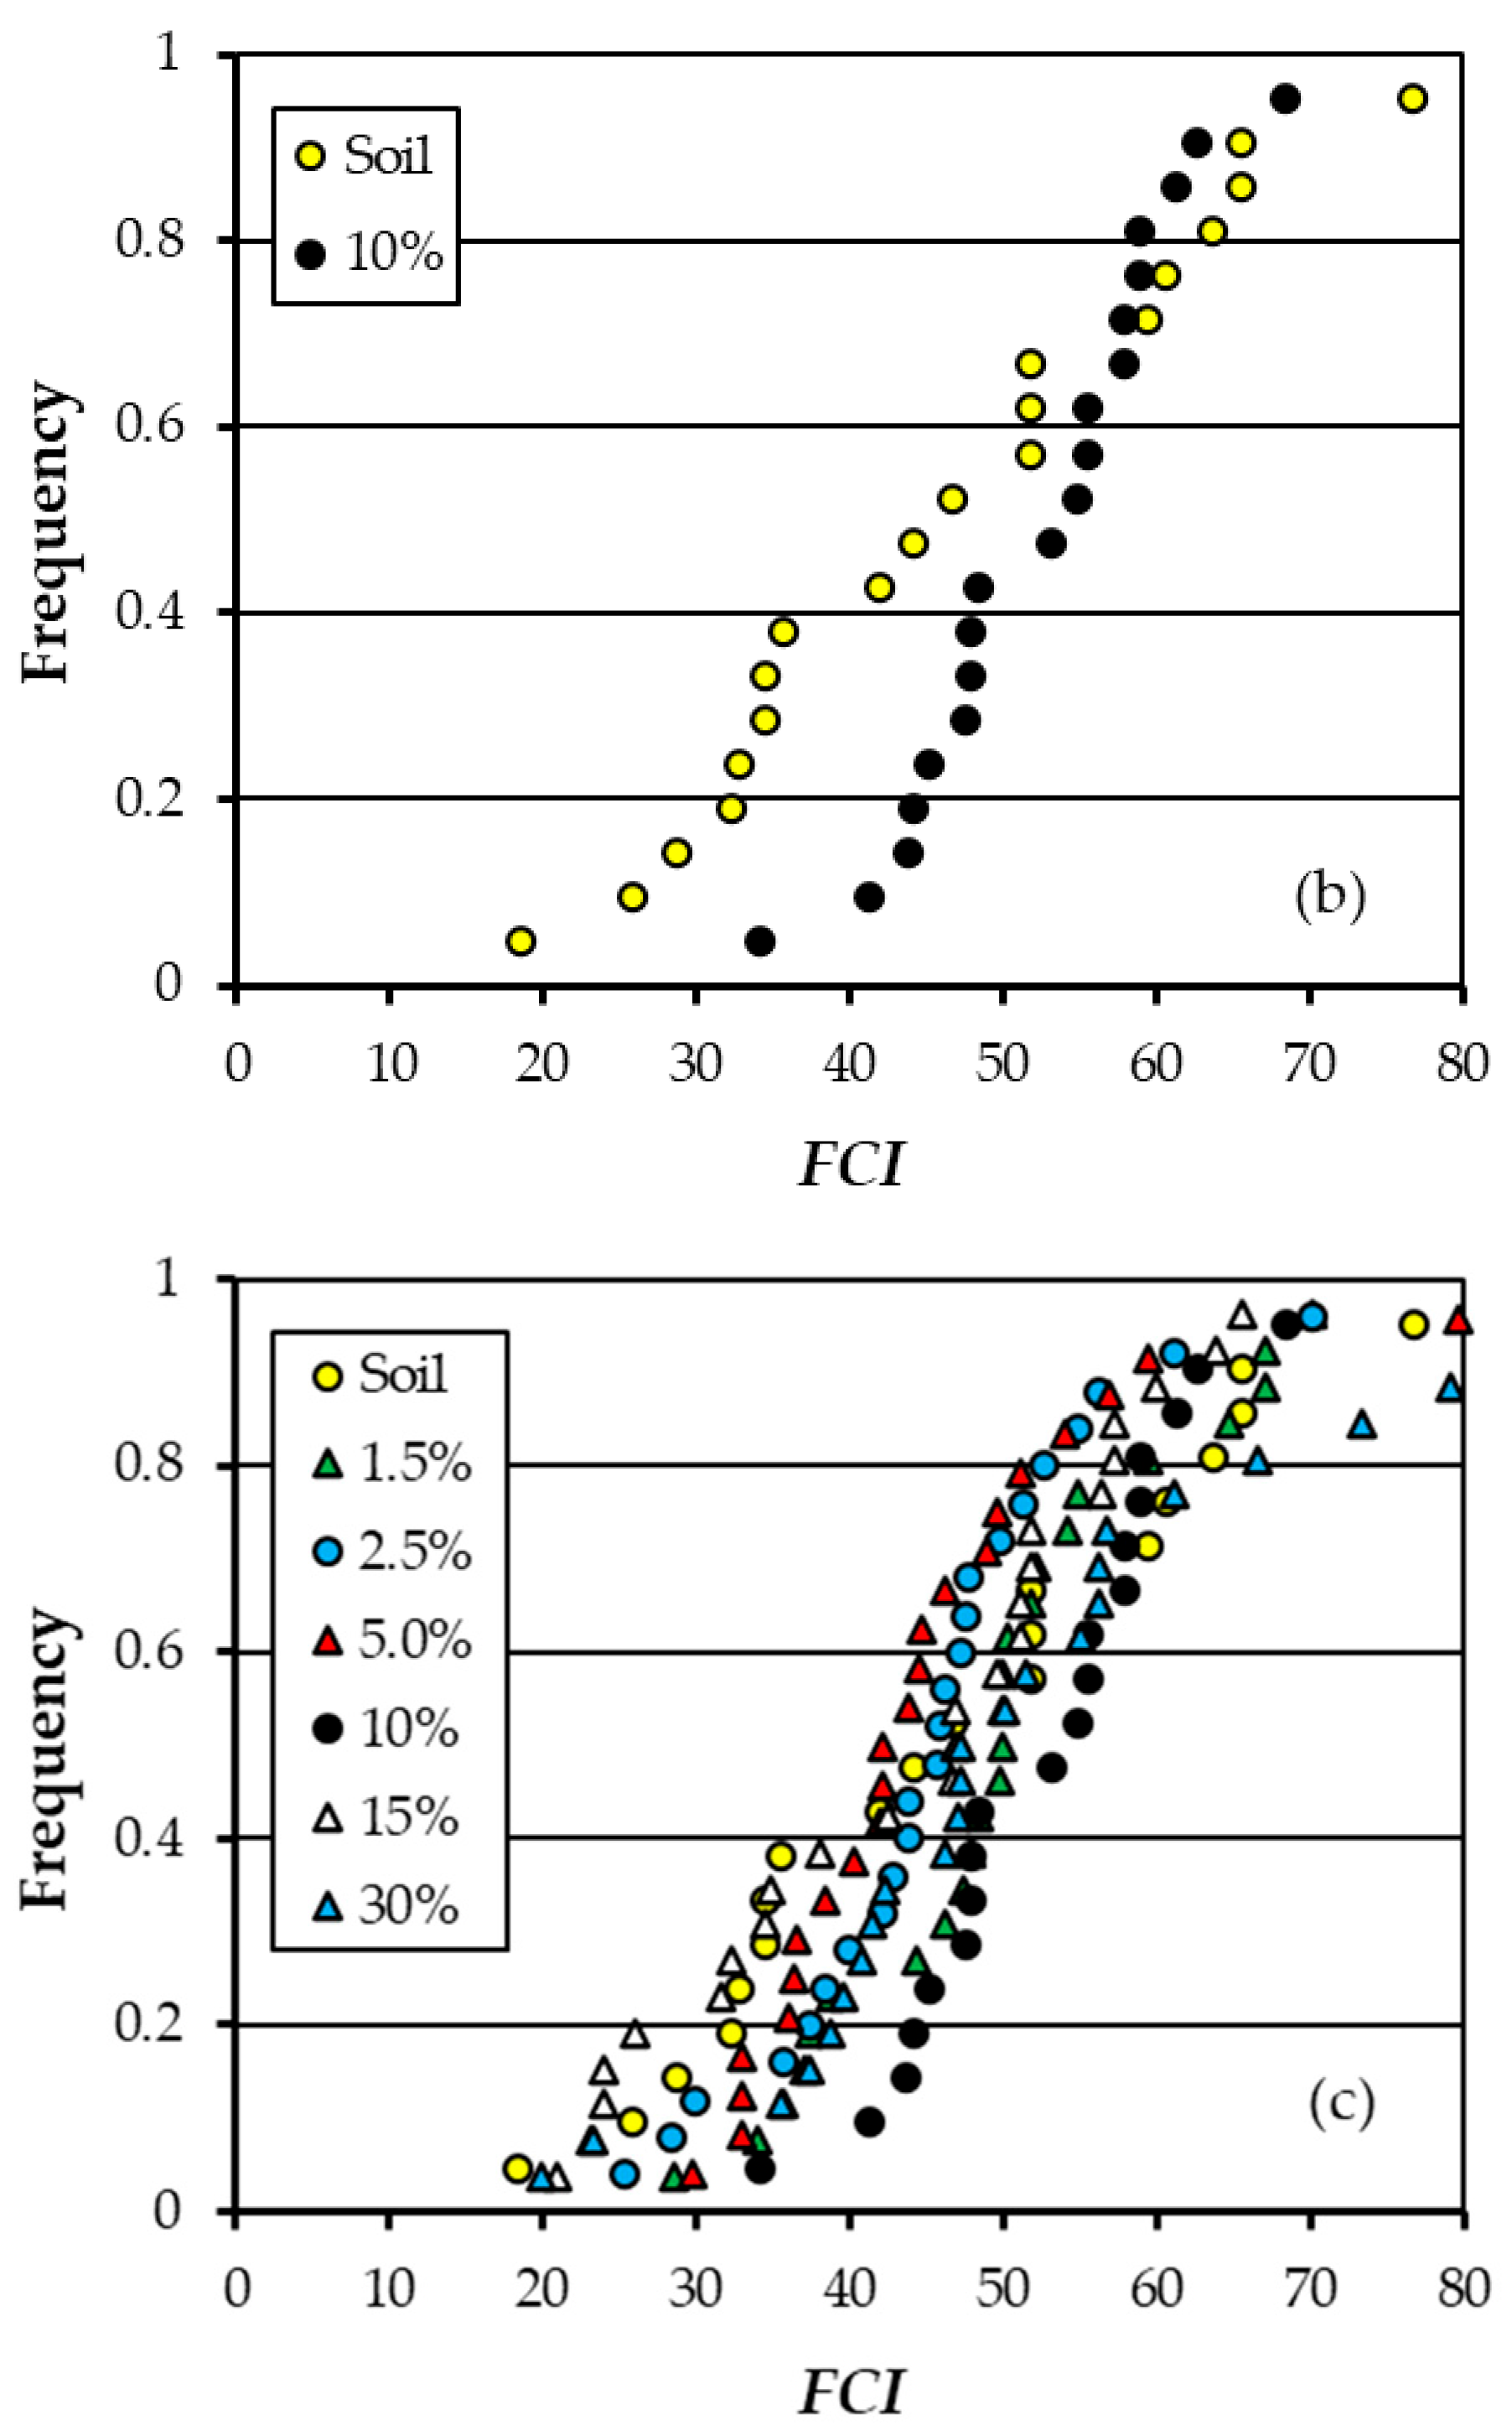
Empirical cumulative frequency distributions of the FCI for the investigated soil and mixtures characterized by zeolite concentrations, Cz, of 1% (a), 10% (b) and Cz ranging from 1.5 to 30% (c).
Similarly, a relevant increase in the functional connectivity index was observed only at a zeolite concentration of 1% (Figure 6a) and 10% (Figure 6b). No significant differences in FCI values were found at zeolite concentrations of 1.5, 2.5, 5, and 15% as the plotted distributions (Figure 6c) appear almost overlaid. Also, in this case, the One-Way ANOVA confirmed that Cz = 1% induces significant changes in terms of the FCI compared to all the other distributions.
For each investigated sample, Table 1 reports the mean values of the SCI, m(SCI), and FCI, m(FCI), and the corresponding standard deviation σ(SCI) and σ(FCI) values.
Table 1.
Mean values of SCI, m(SCI), and FCI, m(FCI), and corresponding standard deviation σ(SCI) and σ(FCI) values.
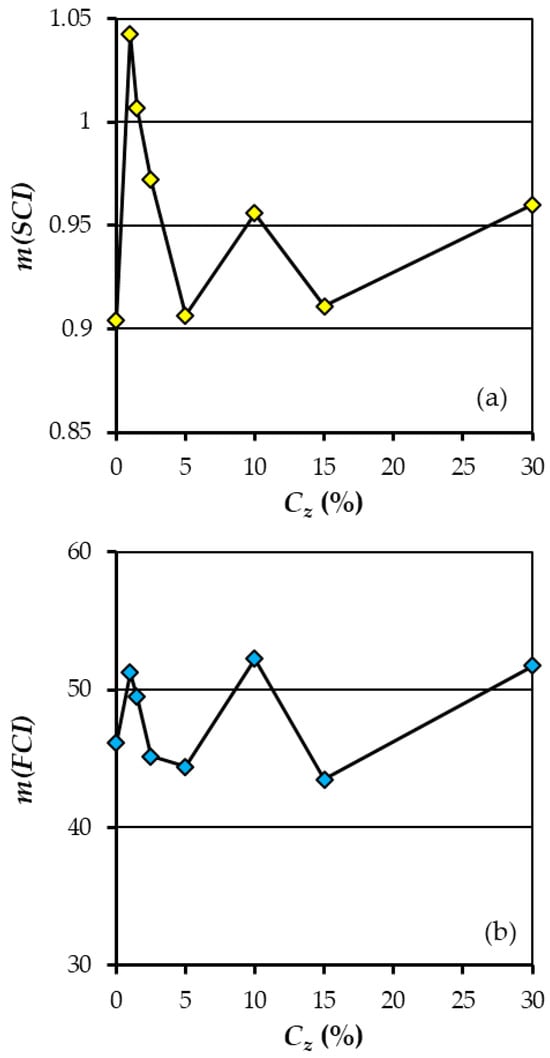
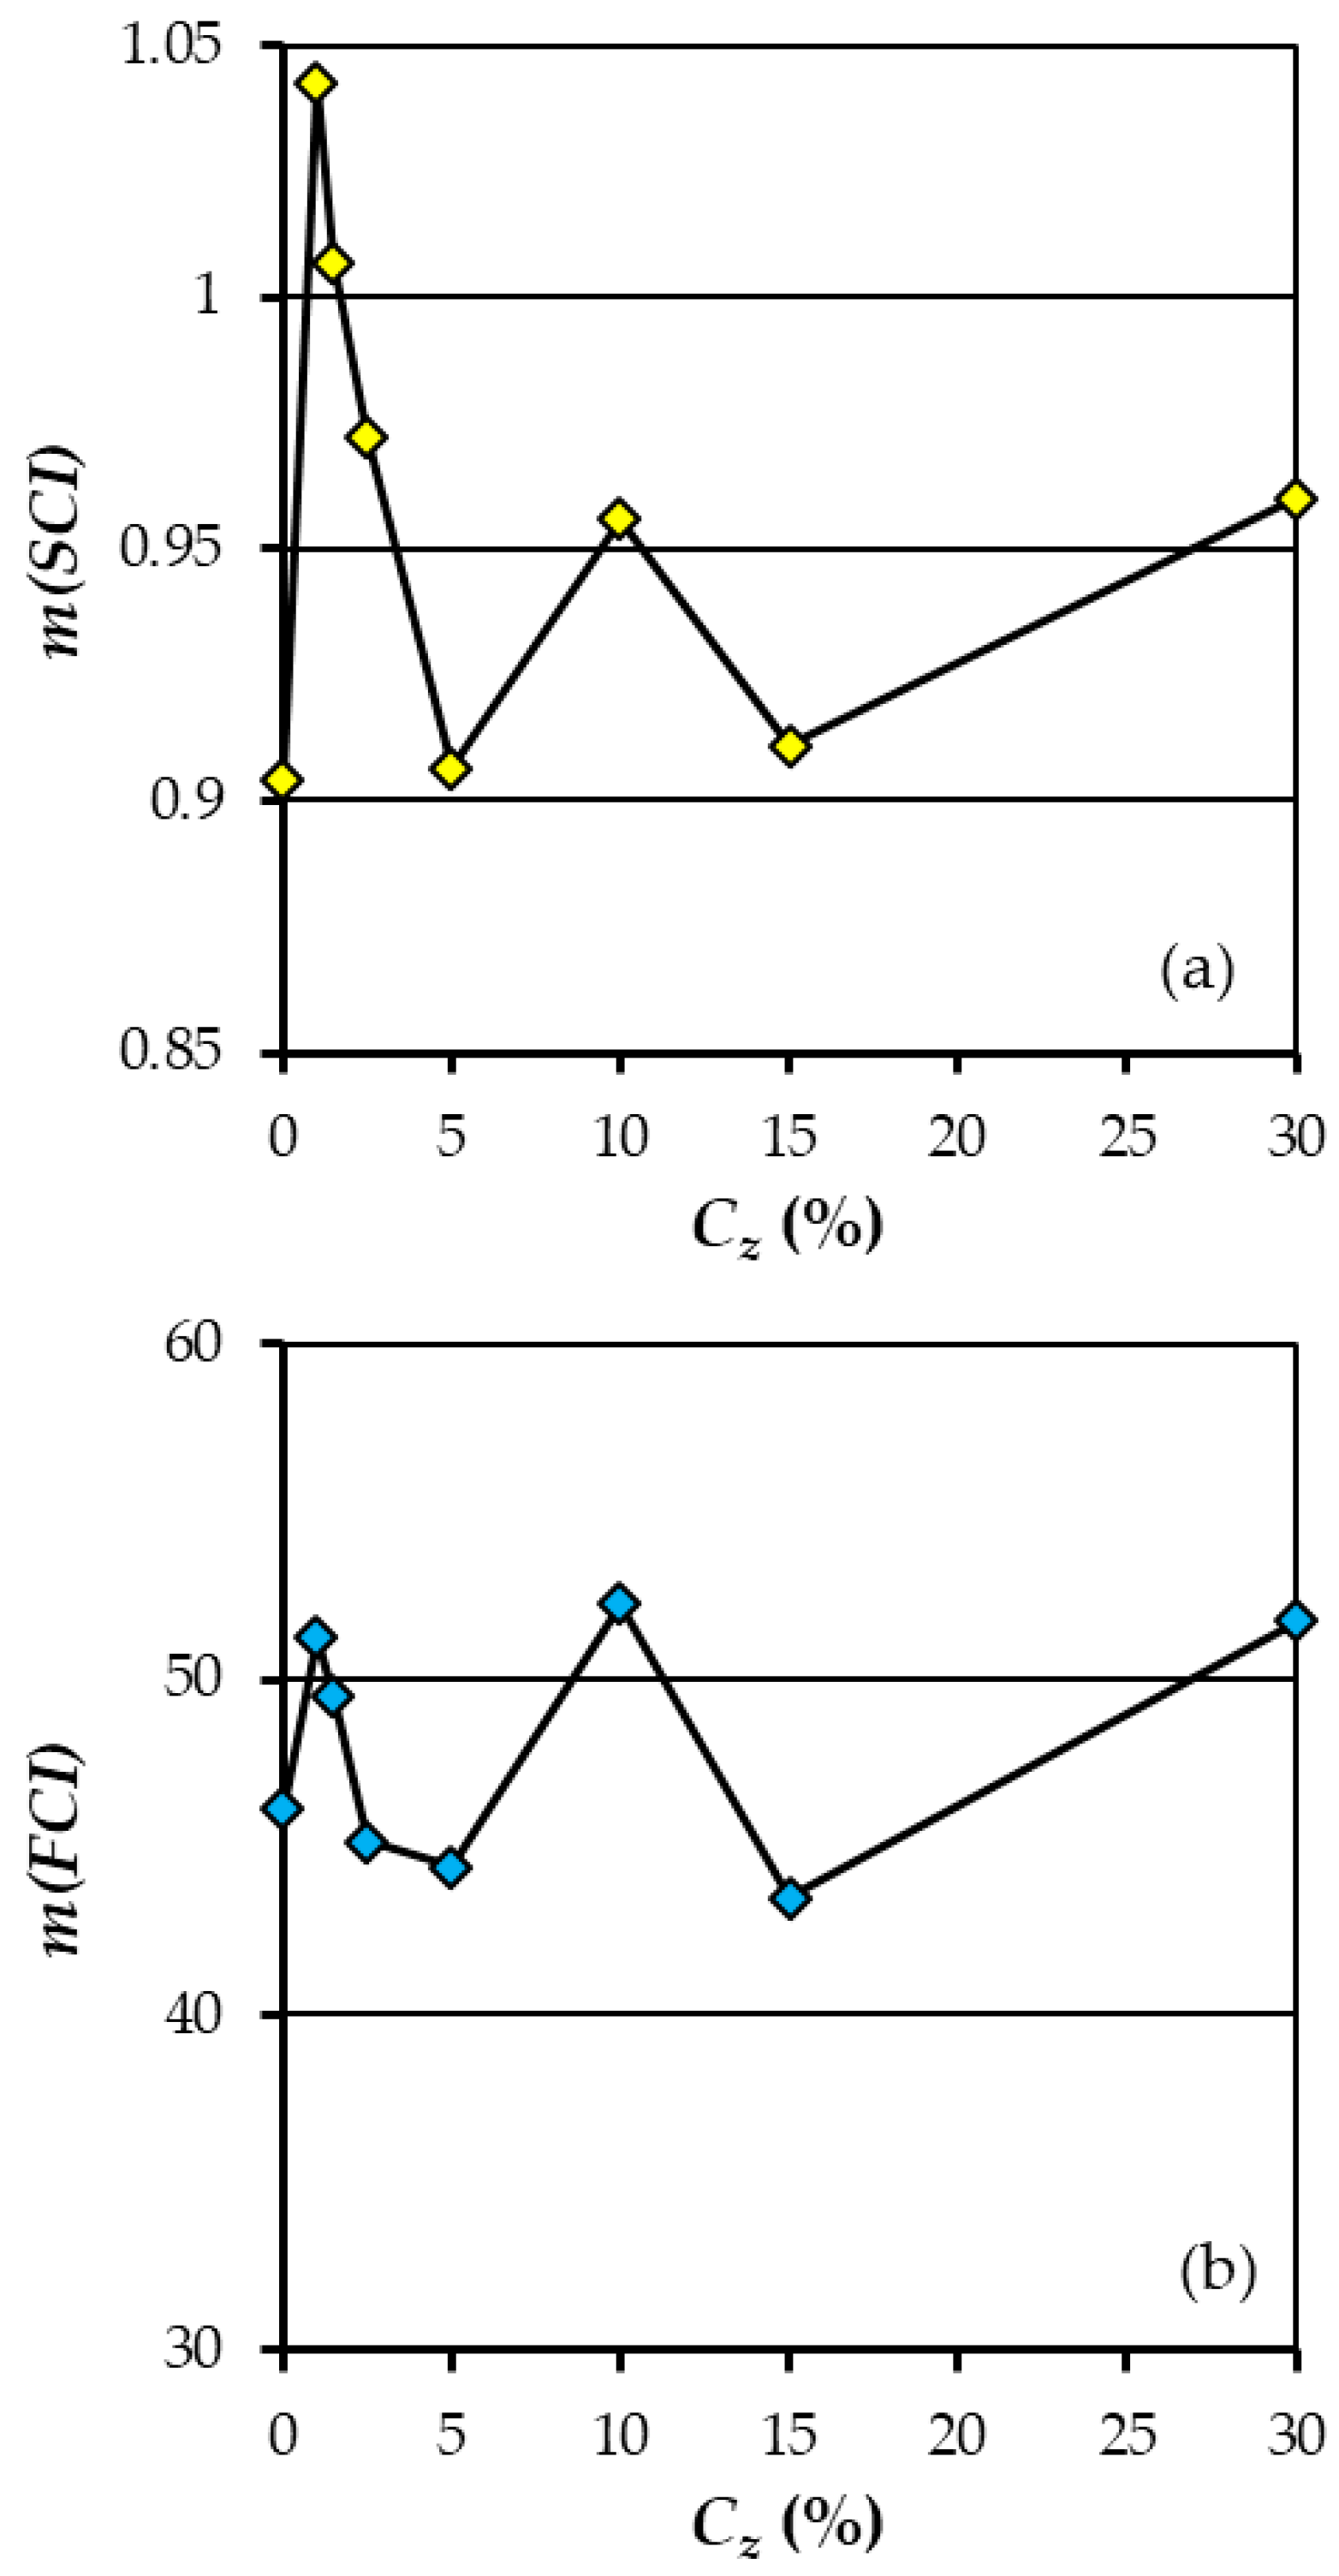
Finally, Figure 7 reports the mean values of the SCI, m(SCI), and FCI, m(FCI), as a function of the added zeolite concentration, Cz. Figure 7a highlights that the maximum m(SCI) value corresponds to a concentration of 1%, in agreement with the maximum shift in the SCI distribution plotted in Figure 5. For this zeolite concentration, the increase in the mean structural connectivity index, referring to the original soil (Cz = 0%), is equal to 15.3%.
Figure 7.
The relationship between the mean values of SCI, m(SCI) (a), and FCI, m(FCI) (b), and the added zeolite concentration, Cz.
Figure 7b shows that the highest m(FCI) values correspond to zeolite concentrations of 1% (m(FCI) = 51), 10% (52), and 30% (52), consistent with the maximum shift in the FCI distribution plotted in Figure 6a (Cz = 1%) and Figure 6c (Cz = 10%). Considering the minimum zeolite concentration (1%), the increase in the mean functional connectivity index, compared to the original soil, is equal to 11.1%.
In conclusion, a zeolite concentration of 1% is sufficient to improve soil physical characteristics, as the highest values of structural and functional connectivity were generally obtained. In fact, for Cz > 1% (ranging from 1.5 to 30%), the values of the SCI and FCI were lower than those corresponding to the concentration of 1%.
4. Discussion
4.1. Analysis of Relaxation Time Distributions
For the sandy loam soil investigated, zeolite addition enlarged the pore system, as shown by the rightward shift in the F(T1) distributions (Figure 4a,b), except for Cz = 30%, where the F(T1) curve nearly overlapped with the untreated soil. Moreover, the developed analysis revealed that the lowest concentrations (Cz = 1% and 1.5%) produced the most significant changes in relaxation times (i.e., pore size), causing a substantial increase in the soil’s meso- and macropore components. The statistical analysis also confirmed that adding a zeolite concentration of 1 or 1.5% leads to statistically significant differences compared to the untreated soil. This indicates that zeolite particles can induce the formation of large pores, allowing faster water motion [11] for the sandy loam soil investigated in this study. Furthermore, amending the original soil with zeolite concentrations ranging from 1% to 15% always produced an increase in the mesopore components (Figure 4), demonstrating that zeolite is able to modify pore size distribution across a wide concentration range.
These results differ from those reported in the literature [15,16], which report that for sandy and loamy soils, the zeolite application can reduce the average particle size, causing a reduction in hydraulic conductivity in comparison to the original soil [13]. Instead, for clay soils, the opposite result is generally expected, and the addition of zeolite particles should enlarge pores (i.e., faster water motion). This discrepancy arises from the particle size distribution of the zeolite used in this investigation (Figure 1), which contains 56% of coarse particles (0.425–0.85 mm), which is appreciably higher than that of the original soil (37%). In other words, even if this soil (sandy loam) is tendentially characterized by wide pores, the used zeolite did not reduce the pore size because of its coarser particles that, instead, induced an increase in pore size.
Given this result, an increase in zeolite concentration should always cause an increase in meso- and macropores corresponding to the highest T1 values. In other words, the pore size distribution of Cz = 30% should be characterized by T1 values higher than those corresponding to Cz = 1% and 1.5%. However, adding a high zeolite concentration also increases the water holding capacity of the mixture. So, the retention effect due to an increased zeolite concentration counterbalances the increase in pore size distribution. In other words, for low zeolite concentrations (1 and 1.5%), the change in pore size distribution is the prevailing effect, and this effect is damped by the increase in water retention occurring for increasing zeolite concentrations (2.5% ≤ Cz ≤ 30%). These two effects (pore size and water retention changes) are simultaneously detected by FFC-NMR analysis and cannot be distinguished. For this reason, the F(T1) curve corresponding to zeolite concentrations of 1 and 1.5% highlight faster water motion.
The developed analysis also demonstrated that the highest values of the structural connectivity index, SCI, were obtained by a zeolite concentration of 1% (Figure 5). This result agrees with the conclusion of Khan et al. [10], who observed that zeolites can modify pore channel connectivity and consequently change soil hydrological characteristics, such as soil water retention, water holding capacity, and saturated hydraulic conductivity.
4.2. Analysis of Structural and Functional Connectivity Indexes
The analysis revealed that a significant increase in the functional connectivity index (FCI) occurs only at zeolite concentrations of 1% (Figure 6a) and 10% (Figure 6c). Consequently, the lowest zeolite concentration (1%) can also be considered optimal for enhancing soil functional connectivity. This result is related to the zeolite’s ability, independently of the applied concentration, to increase the macropore range that, as a consequence, increases the FCI value.
The statistical analysis performed on the SCI and FCI values belonging to the different treatments (the soil or mixture with different zeolite concentrations) confirmed that Cz = 1% caused statistically significant changes in comparison to the untreated soil and the mixtures characterized by higher concentrations.
5. Conclusions
This study demonstrated how zeolite concentration affects the hydrological connectivity of sandy loam soil using Fast Field Cycling Nuclear Magnetic Resonance (FFC-NMR) relaxometry.
The main key findings are the following:
- The investigated zeolite can modify the pore size distribution across a wide range (1–15%) of zeolite concentrations, as the zeolite particle size distribution is characterized by a percentage of coarse particles greater than that of the original soil.
- A concentration of 1% produced the most significant increase in the soil’s meso- and macropores.
- For Cz > 1.5%, pore size distribution changes were damped by the increase in water retention occurring for increasing zeolite concentrations, which FFC-NMR cannot distinguish from pore size effects.
- A zeolite concentration of 1% is also sufficient to achieve the highest values of both the structural and the functional connectivity index.
- Adding a concentration of 1% implies low costs of soil amendment operations and favors field applications.
In conclusion, for sandy loam soil and the investigated zeolite, a concentration of 1% is sufficient to improve the soil’s physical characteristics. Further investigations are required to verify the applicability of these results in soils with different textures, like clay soils, and different types of zeolites. Tests carried out on samples collected in plots with soils amended with different zeolite concentrations should be useful to recognize the applicability of the obtained results to real field conditions. Finally, further experiments could be performed to compare the results observed using zeolite as a soil amendment with those caused by the addition of other clay minerals.
Author Contributions
Conceptualization, A.N., C.L., P.C. and V.F.; methodology, A.N., C.L., P.C. and V.F.; software, A.N., C.L., P.C. and V.F.; validation, A.N., C.L., P.C. and V.F.; formal analysis, A.N., C.L., P.C. and V.F.; investigation, A.N., C.L., P.C. and V.F.; data curation, A.N., C.L., P.C. and V.F.; writing—original draft preparation, A.N., C.L., P.C. and V.F.; writing—review and editing, A.N., C.L., P.C. and V.F.; supervision, P.C. and V.F. All authors have read and agreed to the published version of the manuscript.
Funding
This research received no external funding.
Data Availability Statement
The raw data supporting the conclusions of this article will be available on request due to restrictions.
Conflicts of Interest
The authors declare no conflicts of interest.
References
- Cataldo, E.; Salvi, L.; Paoli, F.; Fucile, M.; Masciandaro, G.; Manzi, D.; Masini, C.M.; Mattii, G.B. Application of zeolites in agriculture and other potential uses: A Review. Agronomy 2021, 11, 1547. [Google Scholar] [CrossRef] [Scilit]
- Williams, C.D. Application of zeolites to environmental remediation. In Urban Pollution: Science and Management, 1st ed.; Charlesworth, S.A., Booth, C.A., Eds.; John Wiley & Sons: Hoboken, NJ, USA, 2019; pp. 249–256. [Google Scholar] [CrossRef] [Scilit]
- Eroglu, N.; Emekci, M.; Athanassiouc, C.G. Applications of natural zeolites on agriculture and food production. J. Sci. Food Agric. 2017, 97, 3487–3499. [Google Scholar] [CrossRef] [Scilit] [PubMed]
- Nakhli, S.A.A.; Delkash, M.; Bakhshayesh, B.E.; Kazemian, H. Application of zeolites for sustainable agriculture: A review on water and nutrient retention. Water Air Soil Pollut. 2017, 228, 464. [Google Scholar] [CrossRef] [Scilit]
- Kukowska, S.; Szewczuk-Karpisz, K. Management of the soil environment using biochar and zeolite in various combinations: Impact on soil condition and economical aspects. J. Soils Sediments 2025, 25, 77–102. [Google Scholar] [CrossRef] [Scilit]
- Xiubin, H.; Zhanbin, H. Zeolite application for enhancing water infiltration and retention in loess soil. Resour. Conserv. Recycl. 2001, 34, 45–52. [Google Scholar] [CrossRef] [Scilit]
- Colombani, N.; Mastrocicco, M.; Di Giuseppe, D.; Faccini, B.; Coltorti, M. Batch and column experiments on nutrient leaching in soils amended with Italian natural zeolitites. Catena 2015, 127, 64–71. [Google Scholar] [CrossRef] [Scilit]
- Colombani, N.; Di Giuseppe, D.; Faccini, B.; Mastrocicco, M.; Coltorti, M. Estimated Water Savings in an Agricultural Field Amended with Natural Zeolites. Environ. Process. 2016, 3, 617–628. [Google Scholar] [CrossRef] [Scilit]
- Jarosz, R.; Szerement, J.; Gondek, K.; Mierzwa-Hersztek, M. The use of zeolites as an addition to fertilizers—A review. Catena 2022, 213, 106125. [Google Scholar] [CrossRef] [Scilit]
- Khan, M.R.; Tarafder, M.A.; Priti, M.S. Potential use of zeolites in agriculture: A review. SAARC J. Agric. 2024, 22, 17–30. [Google Scholar] [CrossRef] [Scilit]
- Gholizadeh-Sarabi, S.; Sepaskhah, A.R. Effect of zeolite and saline water application on saturated hydraulic conductivity and infiltration in different soil textures. Arch. Agron. Soil Sci. 2013, 59, 753–764. [Google Scholar] [CrossRef] [Scilit]
- Mahabadi, A.A.; Hajabbasi, M.; Khademi, H.; Kazemian, H. Soil cadmium stabilization using an Iranian natural zeolite. Geoderma 2007, 137, 388–393. [Google Scholar] [CrossRef] [Scilit]
- Ibrahim, H.M.; Alghamdi, A.G. Effect of the particle size of clinoptilolite zeolite on water content and soil water storage in a loamy sand soil. Water 2021, 13, 607. [Google Scholar] [CrossRef] [Scilit]
- Razmi, Z.; Sepaskhah, A.R. Effect of zeolite on saturated hydraulic conductivity and crack behavior of silty clay paddled soil. Arch. Agron. Soil Sci. 2012, 58, 805–816. [Google Scholar] [CrossRef] [Scilit]
- Belviso, C.; Satriani, A.; Lovelli, S.; Comegna, A.; Coppola, A.; Dargonetti, G.; Cavalcante, F.; Rivelli, A.R. Impact of zeolite from coal fly ash on soil hydrophysical properties and plant growth. Agriculture 2022, 12, 356. [Google Scholar] [CrossRef] [Scilit]
- Comegna, A.; Belviso, C.; Rivelli, A.R.; Coppola, A.; Dragonetti, G.; Sobhani, A.; Di Prima, S.; Satriani, A.; Cavalcante, F.; Lovelli, S. Analysis of critical water flow and solute transport parameters in different soils mixed with a synthetic zeolite. Catena 2023, 228, 107150. [Google Scholar] [CrossRef] [Scilit]
- Satriani, A.; Belviso, C.; Lovelli, S.; Di Prima, S.; Coppola, A.; Hassan, S.B.M.; Rivelli, A.R.; Comegna, A. Impact of a synthetic zeolite mixed with soils of different pedological characteristics on soil physical quality indices. Geoderma 2024, 451, 117084. [Google Scholar] [CrossRef] [Scilit]
- Pringle, C. What Is Hydrologic Connectivity and Why Is It Ecologically Important? Hydrol. Process. 2003, 17, 2685–2689. [Google Scholar] [CrossRef] [Scilit]
- Bracken, J.; Crooke, J. The Concept of Hydrological Connectivity and Its Contribution to Understanding Runoff-Dominated Geomorphic Systems. Hydrol. Process. 2007, 21, 1749–1763. [Google Scholar] [CrossRef] [Scilit]
- Marchamalo, M.; Hooke, J.M.; Sandercock, P.J. Flow and sediment connectivity in semi-arid landscapes in SE Spain: Patterns and controls. Land Degrad. Dev. 2016, 27, 1032–1044. [Google Scholar] [CrossRef] [Scilit]
- Keesstra, S.D.; Bagarello, V.; Ferro, V.; Finger, D.; Parsons, A.J. Connectivity in hydrology and sediment dynamics. Land Degrad. Dev. 2020, 31, 2525–2528. [Google Scholar] [CrossRef] [Scilit]
- Conte, P.; Librici, C.; Nicosia, A.; Palmeri, V.; Pampalone, V.; Ferro, V. Wood-Biochar Influence on Rill Erosion Processes and Hydrological Connectivity in Amended Soils. Hydrol. Process. 2025, 39, e70093. [Google Scholar] [CrossRef] [Scilit]
- Bracken, L.J.; Wainwright, J.; Ali, G.A.; Tetzlaff, D.; Smith, M.W.; Reaney, S.M.; Roy, A.G. Concepts of hydrological connectivity: Research approaches, pathways and future agendas. Earth-Sci. Rev. 2013, 119, 17–34. [Google Scholar] [CrossRef] [Scilit]
- Reaney, S.M.; Bracken, L.J.; Kirkby, M.J. The importance of surface controls on overland flow connectivity in semi-arid environments: Results from a numerical experimental approach. Hydrol. Process. 2014, 28, 2116–2128. [Google Scholar] [CrossRef] [Scilit]
- López-Vicente, M.; Nadal-Romero, E.; Cammeraat, E.L. Hydrological connectivity does change over 70 years of abandonment and afforestation in the Spanish Pyrenees. Land Degrad. Dev. 2017, 28, 1298–1310. [Google Scholar] [CrossRef] [Scilit]
- Conte, P.; Guida, G.; Librici, C.; Nicosia, A.; Palmeri, V.; Ferro, V. Detecting soil hydrological connectivity in a badland area by fast field cycling nuclear magnetic resonance relaxometry. Hydrol. Process. 2024, 38, e15202. [Google Scholar] [CrossRef] [Scilit]
- Conte, P.; Nicosia, A.; Ferro, V. A New Model for Solving Hydrological Connectivity Inside Soils by Fast Field Cycling NMR Relaxometry. Water 2023, 15, 2397. [Google Scholar] [CrossRef] [Scilit]
- Wainwright, J.; Turnbull, L.; Ibrahim, T.G.; Lexartza-Artza, I.; Thornton, S.F.; Brazier, R.E. Linking environmental régimes, space and time: Interpretations of structural and functional connectivity. Geomorphology 2011, 126, 387–404. [Google Scholar] [CrossRef] [Scilit]
- Bélisle, M. Measuring landscape connectivity: The challenge of behavioral landscape ecology. Ecology 2005, 86, 1988–1995. [Google Scholar] [CrossRef] [Scilit]
- Turnbull, L.; Wainwright, J.; Brazier, R.E. A conceptual framework for understanding semi-arid land degradation: Ecohydrological interactions across multiple-space and time scales. Ecohydrol. Ecosyst. Land Water Process Interact. Ecohydrogeomorphology 2008, 1, 23–34. [Google Scholar] [CrossRef] [Scilit]
- Baartman, J.E.; Masselink, R.; Keesstra, S.D.; Temme, A.J. Linking landscape morphological complexity and sediment connectivity. Earth Surf. Process. Landf. 2013, 38, 1457–1471. [Google Scholar] [CrossRef] [Scilit]
- Conte, P.; Ferro, V. Measuring Hydrological Connectivity Inside a Soil by Low Field Nuclear Magnetic Resonance Relaxometry. Hydrol. Process. 2018, 32, 93–101. [Google Scholar] [CrossRef] [Scilit]
- Conte, P.; Ferro, V. Standardizing the Use of Fast-Field Cycling NMR Relaxometry for Measuring Hydrological Connectivity Inside the Soil. Magn. Reson. Chem. 2020, 58, 41–50. [Google Scholar] [CrossRef] [Scilit]
- Conte, P.; Ferro, V. Measuring Hydrological Connectivity Inside Soils with Different Texture by Fast Field Cycling Nuclear Magnetic Resonance Relaxometry. Catena 2022, 209, 105848. [Google Scholar] [CrossRef] [Scilit]
- Lucchese, A.; Nicosia, A.; Palmeri, V.; Pampalone, V.; Ferro, V. Influence of Soil Grain Roughness and Roughness Type on Flow Resistance in Rectangular Rill Channels. Hydrol. Process. 2025, 39, e70238. [Google Scholar] [CrossRef] [Scilit]
- Borgia, G.C.; Brown, R.J.S.; Fantazzini, P. Uniform-Penalty Inversion of Multiexponential Decay Data. J. Magn. Reson. 1998, 132, 65–77. [Google Scholar] [CrossRef] [Scilit]
- Pohlmeier, A.; Haber-Pohlmeier, S.; Stapf, S. A Fast Field Cycling Nuclear Magnetic Resonance Relaxometry Study of Natural Soils. Vadose Zone J. 2009, 8, 735–742. [Google Scholar] [CrossRef] [Scilit]
- Pagliai, M.; Vignozzi, N. The Soil Pore System as an Indicator of Soil Quality. In Sustainable Land Management-Environmental Protection. A Soil Physical Approach; Pagliai, M., Jones, R., Eds.; Advances in GeoEcology; IUSS: Vienna, Austria, 2002; pp. 71–82. [Google Scholar] [CrossRef] [Scilit]

Disclaimer/Publisher’s Note: The statements, opinions and data contained in all publications are solely those of the individual author(s) and contributor(s) and not of MDPI and/or the editor(s). MDPI and/or the editor(s) disclaim responsibility for any injury to people or property resulting from any ideas, methods, instructions or products referred to in the content. |
© 2025 by the authors. Licensee MDPI, Basel, Switzerland. This article is an open access article distributed under the terms and conditions of the Creative Commons Attribution (CC BY) license (https://creativecommons.org/licenses/by/4.0/).