Abstract
As key emergency equipment, high-flow pump devices play a vital role in urban flood control and drainage, and their hydraulic performance directly influences the safety and stability of the entire system. To meet diverse drainage demands during emergency operations, a new type of high-flow drainage pump, capable of operating in series, parallel, and variable-speed modes, has been developed. Using the SST k-ω turbulence model combined with entropy production theory and pressure pulsation analysis, unsteady numerical simulations were conducted to investigate the transient internal flow under series and parallel operating conditions. The numerical model was verified through comparison with experimental hydraulic-performance data, demonstrating good agreement. The results show that under series operation, the pump speed decreases from 1500 r/min to 193 r/min before reversing to −1748 r/min, while under parallel operation the runaway speed reaches −1657 r/min. The flow rate and torque exhibit strong nonlinear variations, with reverse flow and oscillatory behavior appearing in the impeller passages. During the runaway stage, entropy production peaks at 28.17 W/K under series conditions and 29.09 W/K under parallel conditions, with turbulent dissipation accounting for more than 69% of the total. High-entropy regions extend toward the impeller outlet, while energy losses are predominantly concentrated in the secondary suction chamber, contributing 47.56% and 57.12% under the respective conditions. Pressure pulsation analysis indicates that the dominant frequency components are concentrated at the blade-passing frequency (100 Hz) and its harmonics, with the strongest fluctuations near the primary impeller outlet. These results provide theoretical and engineering guidance for improving the efficiency and stability of emergency drainage systems.
1. Introduction
With the intensification of global climate change, extreme weather events have become increasingly frequent, making urban flooding one of the major disasters faced by many cities. As critical facilities for emergency drainage, traditional drainage equipment shows limitations in adaptability and efficiency under complex environmental conditions. There is an urgent need for large-flow, highly mobile, and adaptable emergency drainage equipment capable of handling variable drainage environments. The high-flow volute-type series-parallel mixed-flow pump meets these requirements by switching between parallel and series configurations to increase either head or flow rate, effectively addressing diverse drainage demands across different urban areas. At the same time, it enables the drainage system to complete emergency tasks in complex disaster scenarios, enhance operational adaptability, and allows drainage robots to flexibly adjust operating conditions according to different drainage requirements. This ensures applicability under both high-flow and low-head and low-flow and high-head conditions, improves drainage efficiency, and promotes the technological upgrade of emergency drainage equipment. It features multi-condition switching capability, high flow output, and compact structure. During actual operation, hydraulic transitions such as pump startup, valve switching, and unexpected shutdowns cause abrupt changes in performance parameters such as rotational speed, flow rate, and pressure. This leads to unstable internal flow patterns and transient effects [1]. Unexpected shutdowns can further compromise the safe operation of hydraulic systems due to transient impacts, potentially causing severe damage to pump units and pipelines under extreme conditions and posing risks to personnel safety. Therefore, in-depth research on internal flow losses and fluid excitation forces in series-parallel volute-type mixed-flow pumps is crucial for optimizing their hydraulic design and improving operational efficiency.
Water pumps undergo significant hydraulic transient processes during startup, shutdown, and abnormal operating conditions, where their transient characteristics critically impact system safety and stability. Scholars worldwide have conducted extensive theoretical analyses, experimental studies, and numerical simulations to investigate transient flow dynamics in hydraulic machinery during these transitions [2,3,4,5]. Ren et al. [6] examined how different speed-regulated starting methods affect mixed-flow pumps, focusing on mitigating head shock, tip leakage vortices, and pressure pulsations during startup to minimize vibration and noise. Fu et al. [7] combined experimental observations with numerical simulations to study transient characteristics of axial-flow pumps during startup, analyzing their effects on system load and fluid pressure. Kan et al. [8] employed entropy generation methods to identify energy loss zones in bidirectional axial-flow pumps during transition. Yang et al. [9] utilized one-dimensional and three-dimensional computational fluid dynamics (CFD) simulations to analyze flow patterns and pressure fluctuation evolution in prototype pump-turbine systems during transition. Yun et al. [10] conducted numerical simulations of multi-stage centrifugal pump startups during valve transitions, investigating pump characteristics and internal flow field evolution. Lu et al. [11] measured cavitation and vibration during steady-state and rapid startup phases using experimental systems, revealing strong correlations between these phenomena. Zhu et al. [12] collected noise, shaft vibration, and pressure pulsation data under both linear and nonlinear startup modes, observing high-amplitude sound pressure during the late startup phase. Tang et al. [13] investigated the impact of startup modes on the stability of mixed-flow pumps, revealing a positive correlation between impeller acceleration and external characteristic parameters. Li et al. [14] studied transient flow characteristics during pump-tube system startup, demonstrating that pressure effects could be mitigated by adjusting air volume ratios or valve opening duration. Abdulkhaev et al. [15] analyzed hydraulic shock processes in centrifugal pump startups, emphasizing the critical role of parameter selection for enhancing system reliability.
Lefebvre and Barker [16] investigated the effect of transient operation on the hydrodynamic performance of a centrifugal pump impeller by experiments, and found that the quasi-steady hypothesis in predicting the pump transient characteristics is unreliable. Rezghi [17] studied the hydraulic transient sensitivity of two parallel pump-turbines units during runaway operation, and obtained the effects of modeling parameter’s variation on transient process. For the velocity vector profiles inside the passage of centrifugal pump. Stickland et al. [18] found a good agreement between the results of computational fluid dynamics and particle image velocimetry (PIV) measurement. Liu et al. [19] investigated the transient stopping characteristics of a radial flow pump with the dynamic mesh method, where the volume of fluid (VOF) model was also used to better simulate the real interaction between air and water in the tank. Walseth et al. [20] studied the transient runaway process in a pump-turbine using simplified one-dimensional calculation, and found that it was possible to reproduce the physics characteristics in the measurement by a simple analytical model for the pump-turbine. As early as 1981, Grover and Koranne [21] conducted theoretical analyses of hydraulic transitions during pump startup, revealing the patterns of severe pressure fluctuations at critical moments. Tsukamoto et al. [22,23] investigated the dynamic variations in rotational speed, flow rate, and head during centrifugal pump startup and shutdown phases, demonstrating that the speed ramping stage significantly impacts pump performance parameters. Thanapandi [24] employed a quasi-steady-state model to simulate the transient performance of volute pumps, developing a rapid algorithm for design analysis. Li et al. [25] and Ma et al. [26], respectively, studied transient flow behaviors in centrifugal and mixed-flow pumps through numerical simulations, validating the consistency between simulation results and experimental data, which laid the foundation for optimizing transition phase modeling. Dazin et al. [27] proposed using angular momentum equations and energy equations to predict internal impeller torque, power, and head during transient conditions, asserting that pump impeller behavior depends not only on conventional rotational acceleration and flow rate but also on velocity distribution patterns and their evolution during transients. Ismaier et al. [28] investigated the closure transition process of centrifugal pump outlet valves in pipeline systems, demonstrating that pressure fluctuations at pump outlets interact with valve-induced pressure variations through mutual interference, thereby amplifying water hammer effects. Wu et al. [29] established a closed-loop system to analyze shutdown transition patterns of centrifugal pumps at varying speeds, concluding that rotor inertia and fluid inertia collectively determine flow characteristics during pump shutdowns.
With the further development of computer and grid technology, it is possible to obtain the detailed hydraulic transients characteristics during transient processes such as start-up and shut-down with the dynamic mesh method. Liu et al. [30] studied the transient characteristics and internal flow performance during the power-failure process with three-dimensional simulations. Widmer et al. [31] explored the rotating stall and unstable characteristics in turbine brake operation of pump-turbine, and found that the rotating stall and the formation of static vortexes have the same physical characteristics based on transient simulations. Li et al. [32] studied the transient characteristics of a pump-turbine during the guide vanes closing using a three-dimensional simulation with SST k-ω turbulence model. The results show that the dynamic instability originated from fluctuations occurred in the stay and guide vanes.
Existing studies on pump transient characteristics are largely limited to start-up and normal shutdown conditions, with relatively few investigations addressing the rapid and highly nonlinear transients induced by unexpected shutdowns. Current research typically focuses on single-pump systems or simplified configurations, leaving the hydraulic coupling effects, flow field reconstruction, and pressure pulsation evolution in multi-pump series–parallel systems insufficiently understood. To address these gaps, this study examines the transient behavior of a novel series–parallel pump system subjected to unexpected shutdown. By combining the impeller rotational equilibrium model with full-channel unsteady numerical simulations, the work captures the evolution of rotational speed, flow rate, torque, and internal flow restructuring during fault-induced transients. Moreover, entropy production theory and time–frequency analysis are employed to quantify energy dissipation and pressure pulsation mechanisms. The findings provide new insight into the physical mechanisms governing multi-pump transient interactions and contribute theoretical guidance for the safe and stable operation of high-flow emergency drainage systems.
2. Numerical Method and Experimental Verification
2.1. Numerical Methods
During the unintended shutdown process of series–parallel pumps, a rotational equilibrium exists between the impeller and the surrounding fluid within the impeller flow passages. The computation of the internal flow field and the prediction of the impeller’s rigid-body motion are therefore strongly coupled. In this study, the CFX Rigid Body module was employed to predict the transient rotational speed of the impeller based on the rotational equilibrium equation. The impeller’s rotating domain was defined as a rigid-body subdomain within the overall flow field, and its motion was automatically solved during the simulation by specifying the initial angular velocity, moment of inertia, and mass. Compared with dynamic mesh methods—which require continuous mesh deformation or remeshing and may suffer from mesh distortion under large rotational decelerations—the Rigid Body approach avoids mesh-quality degradation and reduces computational cost while maintaining numerical stability. This makes it a more suitable and efficient choice for simulating the rapid deceleration process during unexpected pump shutdown. The calculation procedure is illustrated in Figure 1, and the governing rotational equilibrium equation for the rotating domain can be expressed as follows:
where is the resultant torque acting on the impeller; is the system load torque; J is the moment of inertia of the multistage pump impeller; is the angular velocity of the impeller’s rotation. t is the rotation of the impeller duration of movement.
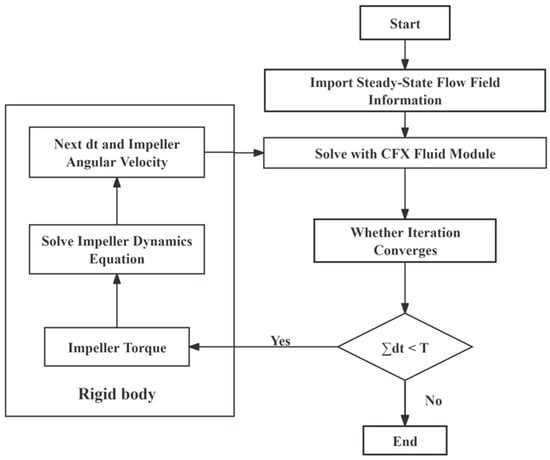
Figure 1.
CFX rigid-body calculation flow.
Following the unexpected shutdown of the series–parallel pumps, the external driving torque is set to zero, while the fluid-induced load torque is obtained directly from the flow field. By discretizing Equation (1) in differential form, the governing equation can be expressed as:
where is the rotational angular velocity of the impeller at time i + 1; is the resultant torque acting on the impeller at time i.
2.2. Research Model and Grid Division
2.2.1. Research Model
As a key component of the water pump system of the flood drainage robot, series and parallel pump can better cope with complex flood drainage environments, freely switch working states for flood drainage robot under multiple working. and optimize the flood drainage system at the same time. The physical picture of the flood drainage robot is shown in Figure 2.
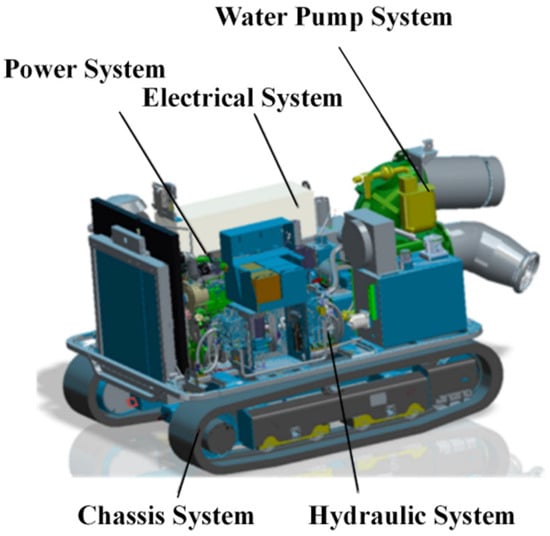
Figure 2.
Physical configuration of the flood drainage robot.
This study investigates a newly designed series–parallel pump system, consisting of a primary pump, secondary pumps, a bell-shaped suction chamber, and a slide valve. The primary and secondary pumps are symmetrically arranged as mixed-flow pumps, with their series-parallel operation achieved through the slide valve mechanism. The physical model of series-parallel pump is illustrated in Figure 3.
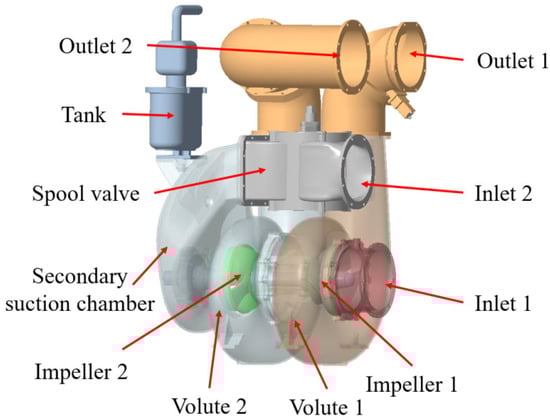
Figure 3.
Series-parallel pump model.
The investigated pump operates under two configurations: series and parallel. In the series configuration, it delivers a flow rate of approximately 900 m3/h, a head of 18 m, and an efficiency exceeding 75%. In the parallel configuration, the corresponding parameters are a flow rate of about 1800 m3/h, a head of 9 m, and an efficiency also above 75%.
2.2.2. Grid Division
Numerical calculations were performed using 25 °C pure water as the working medium, and the SST k-ω turbulence model was selected to solve the flow field. This model combines near-wall accuracy with good free-stream behavior, making it suitable for capturing flow separation and adverse pressure gradients during transient shutdown. Although scale-resolving models such as SAS (Scale-Adaptive Simulation) and LES (Large Eddy Simulation) can provide more detailed turbulence information, their high computational cost is impractical for the complex series–parallel pump system and the long transient duration. Therefore, the SST k-ω model offers an effective balance between accuracy and efficiency. A hybrid mesh was used to divide the computational domain. To better capture the flow field changes near the blade wall, it is necessary to ensure that the height of the first-layer grid is within an appropriate range. In this study, the height of the first-layer grid was set to 0.01 mm, corresponding to a wall + value of less than 1 on all blade and hub surfaces, which satisfies the near-wall resolution requirement of the SST k-ω model. The growth ratio of subsequent grid layers was controlled to be 1.4. To carry out the dimensionless treatment of head and flow rate, the calculation formula is as follows:
where is the head coefficient; is the flow coefficient; D is the outer diameter of the impeller; N is the speed.
To mitigate the impact of mesh size variations on computational accuracy, a mesh independence analysis was conducted using five distinct mesh configurations for testing series operation design conditions. As shown in Table 1 and Figure 4, both Mesh Scheme 4 and Mesh Scheme 3 exhibited negligible changes (less than 1%) in head coefficient and hydraulic efficiency, with head coefficient variations at 0.68% and hydraulic efficiency improvements at 0.55%. After evaluating computational resources and precision requirements, Mesh Scheme 3 (containing approximately 14.83 million cells) was selected for numerical simulation of the series-parallel pump system. The resulting mesh partitioning results are illustrated Figure 5.

Table 1.
Grid independence analysis.
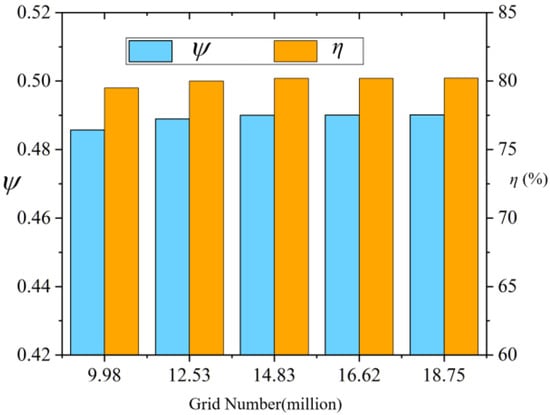
Figure 4.
Grid independence analysis.
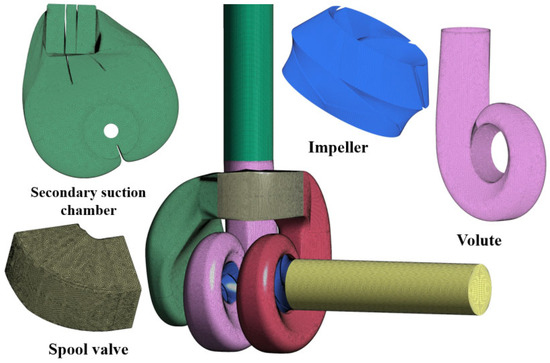
Figure 5.
Fluid Computational Domain Grid.
2.2.3. Boundary Conditions
During an unexpected shutdown of a series-parallel pump, when fluid flows into the computational domain boundary, the input relative pressure is treated as the total pressure; when the fluid flows out of the computational domain boundary, the relative pressure is treated as the relative static pressure. Therefore, the boundary conditions for both the inlet and outlet are set to the Opening type. A steady flow field with zero rotational speed is used as the initial condition for the unsteady calculation of valve-closing startup. The inlet boundary condition is set as a total pressure inlet with a value of 101,325 Pa, and the reference pressure is set to 0. The outlet boundary condition is defined as a mass flow outlet. During the calculation, the impeller water domain is set as the rotating domain, while the other water domains are set as stationary. All wall boundary conditions are configured as no-slip walls, and grid nodes are connected using the GGI method. In n the transient simulation, the impeller flow domain was modeled as a rigid body with a rotational inertia of 0.0507 kg·m2 about the X-axis and an initial angular velocity of 397.94 rad/s along the same axis. The total transient simulation time was set to 1 s, with a time step of 0.001 s and up to 15 iterations per step. The convergence criterion was defined as a maximum residual less than 1 × 10⁻⁴.
2.3. Experimental Verification
Figure 6 illustrates the experimental setup, and Figure 7 shows the comparison between the numerical simulation and experimental results. From the comparison, the maximum relative error of head coefficient and hydraulic efficiency test and simulation under series and parallel working conditions is less than 5%, which proves the correctness and feasibility of the numerical simulation method adopted in this study.
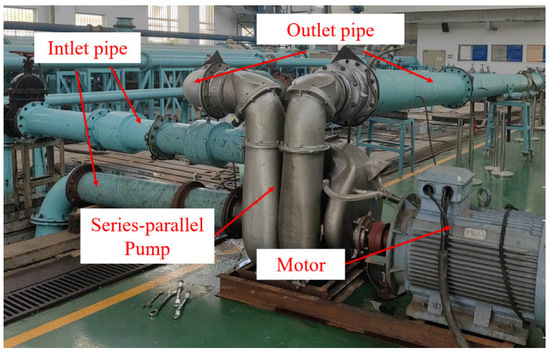
Figure 6.
Test rig.
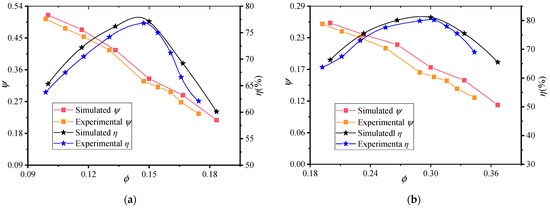
Figure 7.
Comparison of numerical simulation and experimental results. (a) Series operation; (b) Parallel operation.
3. Analysis of Transient Characteristics in Unexpected Shutdown Processes
3.1. Numerical Analysis Method and Monitoring Point Setup
3.1.1. Numerical Analysis Method
In order to analyze the flow loss of series-parallel pumps, the flow loss analysis of the scheme is carried out based on entropy production theory. The calculation formula of unit volume entropy production after Reynolds time averaging is:
where represents the mean term, and represents the direct dissipation entropy production. The represents the pulsation term, which is produced by turbulent dissipation entropy.
In the calculation, using k-ω turbulence model, the entropy production of turbulent dissipation caused by pulsation velocity can be expressed as:
where ε is the turbulent dissipation rate, α = 0.09, and ω represents the specific dissipation rate, and k is the turbulence intensity.
The direct dissipation entropy production and turbulent dissipation entropy production in the calculation domain can be obtained by integrating the above equation in the calculation domain. At the same time, the total wall entropy production is calculated by integrating the entropy production of the computational wall surface in the wall area, and the calculation formulas are, respectively:
where is the wall shear stress and is the average velocity of the fluid at the center of the first layer of mesh.
The traditional Fourier transform focuses solely on the frequency-domain information of a signal, neglecting its temporal resolution and therefore failing to capture the dynamic evolution of spectral components at specific moments. To more comprehensively reveal the unsteady characteristics of the flow field and the time-varying evolution of pulsation sources, this study employs the Continuous Wavelet Transform (CWT) to perform a joint time–frequency analysis of the pressure fluctuation signals. Let the pressure fluctuation signal be denoted as p(t). Its CWT is defined as:
where ψ(t) is the mother wavelet function, ψ ∗ (t) represents its complex conjugate, a is the scale factor corresponding to the frequency characteristics of the signal, and τ is the translation factor used to control time localization. The relationship between the scale a and the frequency f can be expressed as:
where fc is the central frequency of the mother wavelet and Δt is the sampling time interval. By taking the square of the modulus of W(a,τ) the wavelet energy spectrum can be obtained, representing the distribution of signal energy across different times and frequencies.
3.1.2. Monitoring Point Setup
In order to analyze the pressure pulsation characteristics of series and parallel pumps in emergency drainage during large flow during shutdown, 1 s start time was selected as the representative working condition. The impeller monitoring points were arranged inside the channel near the inlet and outlet, and the monitoring points rotated with the impeller calculation domain. The specific arrangement is shown in Figure 8.

Figure 8.
Monitoring points for impeller inlet and outlet pressure pulsation.
The pressure results are nondimensionalized using the pressure fluctuation coefficient Cp to characterize the amplitude of pressure pulsations. It is defined as:
where p is the instantaneous pressure, is the time-averaged pressure, and u is the characteristic velocity.
3.2. Transient Evolution of Pump Performance During Unexpected Shutdown
As shown in Figure 9, the external characteristic variation curve demonstrates the operational characteristics of a series-parallel pump during unexpected shutdowns under series operation. The diagram reveals that the entire shutdown process can be divided into four distinct phases: a, b, c, and d. These correspond to the pump’s operating conditions during emergency shutdown conditions, braking conditions, reverse rotation conditions, and runaway conditions, respectively.
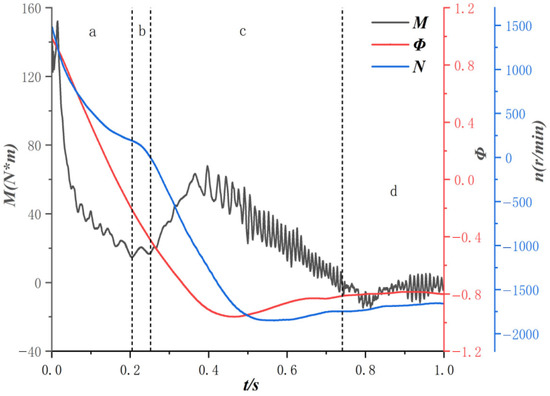
Figure 9.
Pump performance change curve during unexpected shutdown process of series working conditions.
(1) Pump Operating Conditions (t = 0~0.205 s): During this phase, the series-parallel pump operates normally. Upon accidental shutdown, external load drops to zero instantaneously, causing all operational parameters to decline. The rotational speed decreases rapidly from 1500 rpm to 193 rpm, representing a reduction of approximately 87.13%. Flow rate also plunges sharply, reaching zero at t = 0.205 s. Simultaneously, torque experiences a trough with its lowest value reaching 14.77 N·m.
(2) Braking Condition (t = 0.205~0.252 s): This phase represents the braking operation. The flow direction gradually reverses from positive to negative while continuously increasing. Under the impact of reverse flow, the rotational speed decreases rapidly. At t = 0.205 s, the rotational speed drops to zero with a flow coefficient of −0.42, corresponding to a torque rise reaching 16.9 N·m, which begins to oscillate upward from the trough.
(3) Reverse Operation Mode (t = 0.252~0.740 s): This phase involves reverse operation where the impeller rotates in the opposite direction with gradually increasing rotational speed. Although the flow coefficient continues to rise until reaching 0.42, the extended radial flow path of the impeller suppresses axial fluid motion, resulting in a paradoxical decrease in flow rate despite increased rotational speed. Torque peaks at 67.83 N·m during this stage before rapidly declining.
(4) Flyaway Condition (t = 0.740~1 s): This phase represents the flyaway state. The torque fluctuates around 0, with the rotational speed reaching the flyaway speed of −1748 r/min, which is 1.17 times the initial absolute value. The flow rate also enters the flyaway condition, with a flow coefficient of −0.81, equivalent to 0.81 times the initial absolute flow rate.
Figure 10 illustrates the external characteristic variation curve of a series-parallel pump during unexpected shutdown under parallel operation conditions. The diagram reveals that the entire shutdown process can be divided into four phases: a, b, c, and d. These correspond to the pump’s operational states during the shutdown—operational phase (a), braking phase (b), reverse-phase operation (c), and runaway phase (d).
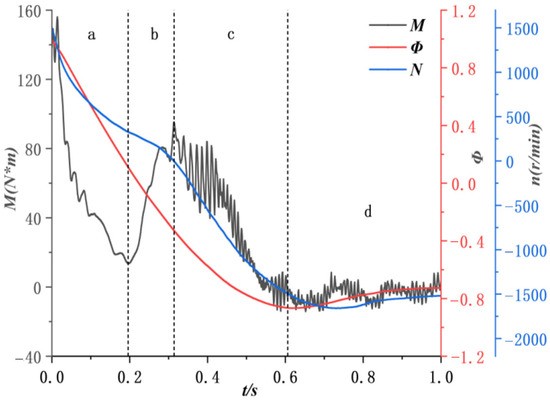
Figure 10.
Pump performance change curve during unexpected shutdown process under parallel working conditions.
(1) Pump Operating Conditions (t = 0~0.194 s): During this phase, the series-parallel pump operates normally. Upon accidental shutdown, external load drops to zero instantaneously, causing all operational parameters to decline. The rotational speed decreases rapidly from 1500 r/min to 339 r/min, representing a reduction of approximately 77.4%. Flow rate also plunges sharply, reaching zero at t = 0.194 s. Simultaneously, torque experiences a trough with its lowest value reaching 13.7 N·m.
(2) Braking Condition (t = 0.194~0.314 s): This phase represents the braking operation. during which the flow reverses direction and continues to gain velocity. Under the impact of reverse flow, the rotational speed decreases rapidly. At t = 0.314 s, the rotational speed drops to zero with a flow coefficient of −0.31, while the corresponding torque rises to −2.27 N·m, beginning to oscillate upward from the trough.
(3) Reverse operation mode (t = 0.314~0.606 s): This stage is the reverse operation mode. The impeller starts to rotate in reverse and gradually increases the reverse speed. The flow coefficient is −0.86, and the to+rque begins to fluctuate and decrease as the impeller starts to rotate in reverse and gradually increases.
(4) Flyaway Condition (t = 0.606~1 s): This phase represents the flyaway state. The torque fluctuates around 0, with the rotational speed reaching the flyaway speed of −1657 r/min, which is 1.10 times the initial absolute value. The flow rate also enters the flyaway condition, with a flow coefficient of −0.81, equivalent to 0.76 times the initial absolute flow rate.
3.3. Transient Changes in Internal Flow During Unexpected Shutdowns
Figure 11 shows the pressure distribution at the middle sections of each stage of the impellers during the unexpected shutdown of the series and parallel pumps under the design flow conditions. Given the multiple time nodes involved in the shutdown process, this study focuses on four operational phases, including the initial phase where key parameters such as time, flow rate, rotational speed, and torque are zero. This approach helps reveal the pressure variations across impeller stages during shutdown operations.
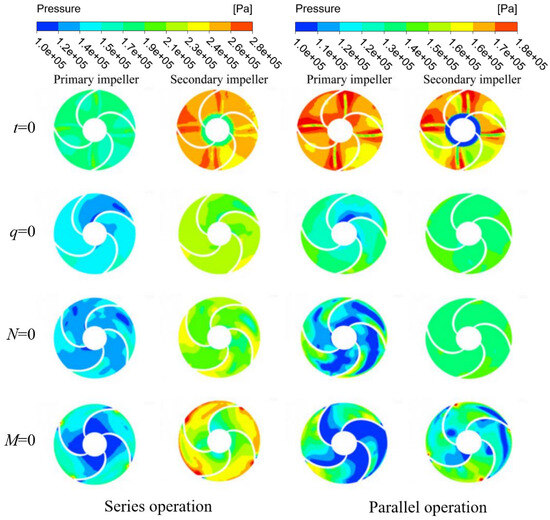
Figure 11.
Pressure distribution of impellers at each stage of series and parallel pumps under different working conditions.
As shown in Figure 11, during the unexpected shutdown under the series-connection condition, the pressure distributions of both the primary and secondary stages exhibit strong similarity. With increasing stage number, the pressure at the secondary impeller cross-sections gradually exceeds that of the primary impeller. After the external load is removed at t = 0 the pressure in the impeller flow passage remains stable, showing a uniform distribution that increases along the radial direction. At q = 0, when opposing flows cancel each other, the overall pressure slightly decreases compared with t = 0, but the radial growth trend remains. At n = 0, reverse-flow impacts generate a high-pressure region near the impeller outlet, while a low-pressure region expands from the inlet along the blade rotation direction, producing significant negative pressure on the suction side. When the system enters the runaway condition at m = 0, the increasing runaway speed raises the pressure and reduces the extent of the low-pressure zone. At the same time, the low-pressure region near the suction-side outlet observed at N = 0 transforms into a high-pressure zone.
During the unexpected shutdown of the series–parallel pumps operating in parallel mode, the external load is lost at the initial moment (t = 0). However, the pressure in the impeller flow passage remains relatively stable and continues to increase along the radial direction. When the flow rate reaches zero, the forward and reverse flows cancel each other, leading to a slight pressure decrease compared with the initial state, although the radial growth trend is still evident. As the rotational speed drops to zero, the reverse-flow impact generates a high-pressure region near the outlet on the blade pressure surface, while a low-pressure zone expands from the impeller inlet along the blade rotation direction. Finally, after the system enters the runaway condition, the overall pressure level rises, and the low-pressure region contracts significantly, remaining only near the inlet of the impeller passage.
Figure 12 shows the changes in the velocity distribution at the cross-sections of each impeller stage when the initial flow rate is the designed flow rate during the unexpected shutdown of the series–parallel pump in both series and parallel operating conditions.
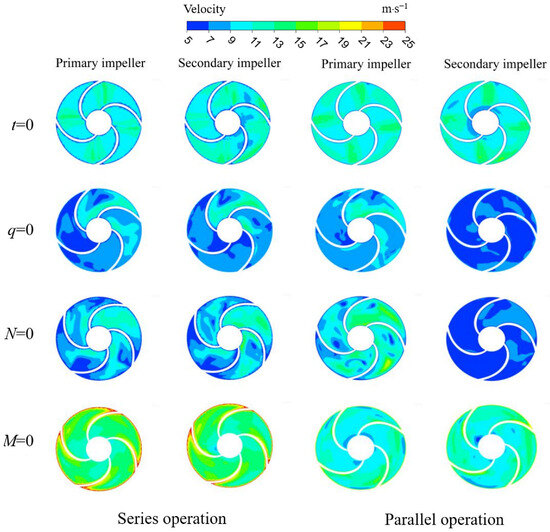
Figure 12.
Flow velocity of impellers at each stage of series and parallel pumps under different working conditions.
As we can see from the figure, when the unexpected shutdown occurs under the series operation condition, the internal velocity distribution of each stage of the impeller is relatively uniform, and the speed increases along the impeller radius direction with the increase in the rotation radius. At the inlet of the turbine passage, fluid velocity is lower due to overcoming inertial and hydrostatic pressures. Conversely, at the outlet, fluid velocity rises significantly as it accelerates while overcoming dynamic pressure. As the shutdown process progresses, the initial braking conditions cause reduced flow rate and rotational speed, leading to decreased energy from fluid motion. The overall velocity distribution becomes less uniform than the initial emergency shutdown state. When reverse operation begins, the impeller experiences uneven velocity distribution due to counter-current impact, resulting in slightly higher overall velocity than during braking. Upon torque reduction to zero (indicating entry into the runaway condition), the impeller’s reverse rotation accelerates. The accelerated fluid within the pump achieves its most uneven velocity distribution during this critical phase.
When an unexpected shutdown occurs in a series-parallel pump under parallel operation, at the beginning of the incident, the internal velocity distribution of each impeller stage is relatively uniform, and the velocity increases along the impeller radius direction with the increase in the rotation radius. At the inlet of the impeller flow channel, due to the fluid’s need to overcome inertia and static pressure, the velocity is relatively low. At the outlet of the flow channel, as the fluid is accelerated and needs to overcome dynamic pressure, the velocity is relatively high. As the shutdown process progresses, at the beginning of the braking condition, the reduction in flow rate and rotational speed leads to a decrease in the energy brought by fluid movement. The overall velocity distribution is smaller than that at the beginning of the unexpected shutdown. At this time, the velocity distribution of the first-stage impeller is more uneven than that of the secondary impeller. When the reverse rotation condition just begins, due to the impact of the reverse flow on the impeller, the velocity distribution inside the impeller is uneven. The velocity distribution of the first-stage impeller is still more uneven than that of the second-stage impeller. When the torque drops to zero, that is, when the pump enters the runaway condition, the reverse rotation speed of the impeller increases. The fluid inside the pump is accelerated by the reverse rotation of the impeller, and the overall speed distribution reaches the most uneven moment during the unexpected shutdown process.
3.4. Transient Evolution of Entropy During Unexpected Shutdown
3.4.1. The Distribution of Entropy Production in the Flow Passage Components
Figure 13a illustrates the variation in entropy production within the pump during unexpected shutdowns under design flow conditions and series-parallel pump configurations. The analysis reveals that the total entropy production shows distinct dynamic patterns corresponding to the four shutdown stages. Initially, as flow rate and rotational speed rapidly decrease, total entropy production plunges to its first trough at 3.92 W/K. With gradual enhancement of reverse flow, total entropy production rises correspondingly, climbing to 8.26 W/K during the braking phase. When reverse rotation commences, the impeller’s rotational speed continues to decline under reverse flow, causing total entropy production to gradually increase to 10.44 W/K. As reverse rotation intensifies further, total entropy production rises again to peak at 28.17 W/K before gradually decreasing, stabilizing after entering the escape phase. Overall, the trends in turbulent dissipation entropy production, wall entropy production, and total entropy production remain consistent. The magnitude and directional fluctuations of flow and velocity, particularly their dramatic variations, dominate entropy production changes. Notably, entropy production fluctuations caused by turbulent dissipation are particularly pronounced, playing a dominant role throughout the process. During the escape phase, turbulent dissipation contributes approximately 63.6% to total entropy production.
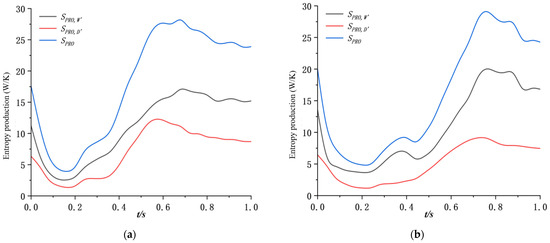
Figure 13.
Entropy production diagram of series and parallel operating conditions. (a) Series operation; (b) Parallel operation.
Figure 13b illustrates the variation in entropy production within the pump during unexpected shutdowns under design flow conditions and parallel operation of series-parallel pumps. The analysis reveals that the total entropy production exhibits distinct dynamic fluctuations influenced by four operational states during the shutdown process. Initially, as flow rate and rotational speed rapidly decrease, total entropy production plunges to its first trough at 4.86 W/K. With gradual enhancement of reverse flow, total entropy production rises correspondingly, climbing to 9.13 W/K during the braking phase. When reverse flow commences, the impeller’s rotational speed continues to decline under reverse flow, leading to a reduction in total entropy production and forming the second trough at 8.49 W/K. As reverse rotation intensifies further, total entropy production rebounds to peak at 29.09 W/K before gradually decreasing, stabilizing after entering the escape phase. Overall, the trends of turbulent dissipation entropy production, wall entropy production, and total entropy production remain consistent. Fluctuations in flow rate and velocity magnitude/direction, particularly their dramatic variations, dominate entropy production changes. Notably, entropy production fluctuations caused by turbulent dissipation are particularly prominent, playing a dominant role throughout the process. During the escape phase, turbulent dissipation contributes approximately 69.29% to total entropy production.
Figure 14a illustrates the variation in total entropy production ratios of major flow components during unexpected shutdowns of series-parallel pumps under design flow conditions. The analysis reveals that the first-stage impeller passage exhibits both higher absolute entropy production values and greater fluctuation amplitudes during shutdowns caused by four operational phases. This trend closely mirrors the overall entropy production changes within the pump, indicating it serves as the primary energy loss source during downtime. This phenomenon primarily stems from unstable flow patterns such as vortices, separation, and recirculation within the first-stage impeller passage, coupled with frequent velocity gradient variations. In contrast, the secondary suction chamber demonstrates significant phase-specific fluctuations: its entropy production ratio rapidly increases upon entering reversal mode and stabilizes after transitioning to fugitive operation. Other components like the secondary impeller, slide valve, and primary-stage volute show relatively minor entropy production variations. Following this pattern, the secondary suction chamber emerges as the component with the highest entropy production at 47.56% after entering fugitive operation, followed by the secondary impeller, primary-stage impeller, and slide valve, while the primary-stage volute exhibits the lowest entropy production ratio.
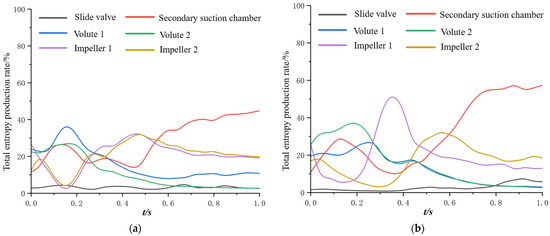
Figure 14.
Total entropy production ratio of each overcurrent component under series and parallel operating conditions. (a) Series operation; (b) Parallel operation.
Figure 14b illustrates the variation in total entropy production ratios of key flow components during unexpected shutdowns of series-parallel pumps under parallel operation conditions at designed flow rates. The analysis reveals that throughout the four phases of the shutdown process, the first-stage impeller passage exhibits both higher absolute values and greater fluctuation amplitudes in total entropy production ratio. This trend closely mirrors the overall entropy production profile within the pump, indicating it serves as the primary energy loss source during downtime. This phenomenon primarily stems from unstable flow patterns such as vortices, separation, and recirculation within the first-stage impeller passage, coupled with frequent velocity gradient variations. In contrast, the secondary suction chamber demonstrates significant phase-specific fluctuations: its entropy production ratio rapidly increases upon entering reversal mode and stabilizes during escape mode. Other flow components—including secondary impellers, slide valves, and primary-stage volute—show relatively minor entropy production ratio changes. Notably, the secondary suction chamber becomes the largest contributor to entropy production after entering escape mode, accounting for 57.12% of total entropy production, followed by secondary impellers, primary-stage impellers, and slide valves, with the primary-stage volute contributing the smallest share.
3.4.2. The Distribution of Entropy Production Rate
Figure 15 illustrates the distribution of local entropy production rates in the series-parallel pump impeller flow channels under initial flow conditions during unexpected shutdowns in series and parallel operation. During unexpected shutdowns in series-parallel pump configurations, the impeller flow passage becomes the primary energy loss zone due to significant turbulent dissipation. This section focuses on analyzing the energy dissipation characteristics of this critical area.
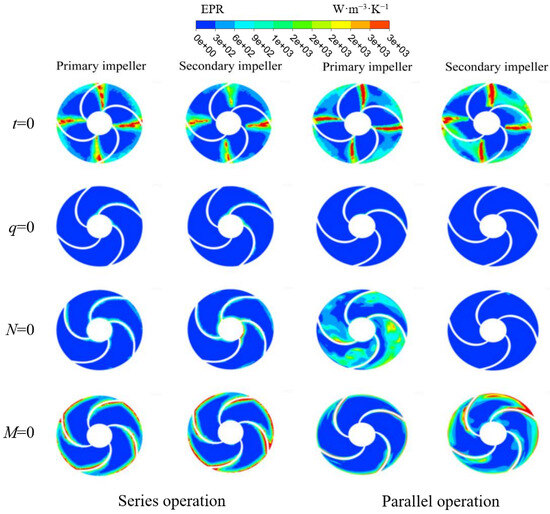
Figure 15.
Entropy production rate distribution of impellers at each stage of series and parallel pumps under different working conditions.
During the unexpected shutdown process under the series connection condition of series-parallel pumps, the analysis reveals that at the initial stage (t = 0), the local entropy production rate distribution within each impeller stage was relatively confined with minimal losses, primarily concentrated near the outlet region of the blade pressure surface due to partial flow separation at the impeller exit. As the shutdown progressed and rotational speed decreased along with reduced flow rate, the distribution range of local entropy production rates expanded significantly, showing marked changes at q = 0. This evolution mainly resulted from enhanced flow instability leading to increased energy loss, though the overall increase remained relatively limited. When the system entered state N = 0, intense reverse flow caused the distribution range and intensity of local entropy production rates to expand substantially, covering nearly the entire flow channel. A particularly high-entropy production zone formed in the central impeller area, indicating severe hydraulic losses. As rotational speed further decreased to complete shutdown (M = 0), impeller reversal triggered dramatic flow structure changes, causing substantial energy loss and altering the distribution characteristics of local entropy production rates. The high-entropy production zone extended from the mid-flow channel toward the impeller outlet, forming distinct strip-like regions near the blade pressure surface. Overall, compared to q = 0, the distribution range of local entropy production rates at M = 0 slightly decreased in size but markedly intensified in intensity.
During the unexpected shutdown of the series–parallel pumps in parallel operation, the results show that at the initial moment (t = 0), entropy production covers a large portion of all impeller stages, with substantial losses concentrated near the blade pressure surfaces at the outlet—regions prone to flow separation. As the rotational speed and flow rate decrease, the entropy-production region gradually expands and becomes more pronounced when the flow reaches zero (q = 0), indicating reduced flow stability and increased energy dissipation despite only slight changes in magnitude. When the system enters reverse-flow conditions (N = 0), both the intensity and coverage of entropy production increase sharply, spreading across almost the entire flow passage. A prominent high-entropy zone develops in the central region of the impeller passage, indicating severe hydraulic losses. Finally, as the rotational speed reaches zero (M = 0), abrupt changes in the internal flow cause further energy loss. High-entropy regions extend from the central passage toward the outlet, forming a band-like distribution along the blade pressure surfaces. Although the overall coverage is slightly smaller than at q = 0, the local intensity continues to increase.
3.5. Analysis of Pressure Pulsation During Accidental Shutdown
3.5.1. Analysis of the Time-Domain Characteristics of Pressure Pulsation
Figure 16 illustrates the time-domain variation characteristics of pressure pulsation within a series-parallel pump during unexpected shutdowns under series operation conditions. The analysis reveals that across four operational phases of the shutdown process, pressure pulsation coefficients in all flow stages exhibited fluctuating trends despite similar overall patterns, with particular variations observed in the primary-stage pump. Initial pressure pulsation at the first-stage flow channel first decreased, briefly rebounded during reversal operation, and then declined again before gradually increasing as the flyaway phase commenced, ultimately manifesting as periodic oscillations. Notably, pressure amplitude measurements at different monitoring points showed significant variations, with the most pronounced fluctuations occurring at the first-stage impeller outlet.
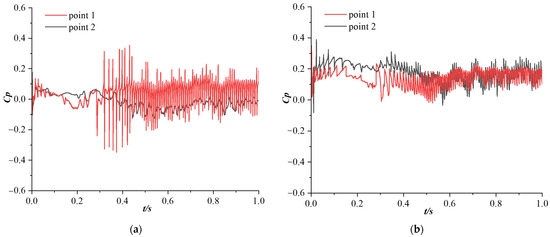
Figure 16.
Time domain diagram of pressure pulsation under series working conditions. (a) Series operation; (b) Parallel operation.
Figure 17 illustrates the time-domain characteristics of pressure pulsation within a series-parallel pump during unexpected shutdowns under parallel operation conditions. The analysis reveals that while pressure fluctuation coefficients across all flow stages generally followed similar trends, significant variations were observed in the primary-stage pump’s performance. Influenced by four phases of the shutdown process, these coefficients exhibited fluctuating patterns across all flow channels as rotational speed and flow rate changed. Initially, the pressure fluctuation coefficient at the primary-stage flow channel began to decline, followed by a slight rebound upon entering reverse rotation mode, and then continued to decrease until gradually increasing during flyaway operation, eventually stabilizing into periodic oscillations. Notably, fluctuation amplitudes varied across monitoring points, with the primary-stage impeller outlet showing the most pronounced variations.
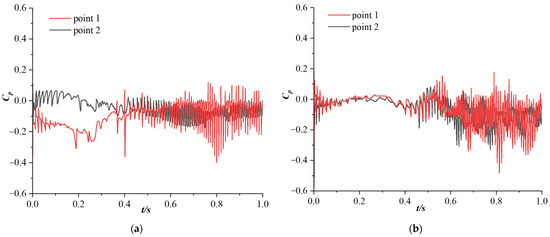
Figure 17.
Time domain diagram of pressure pulsation under parallel operating conditions. (a) Series operation; (b) Parallel operation.
3.5.2. Analysis of the Time-Frequency Domain Characteristics of Pressure Pulsation
Figure 18 illustrates the time–frequency characteristics of pressure pulsation in the first-stage impeller of the series–parallel pump during an unexpected shutdown under series operation. As shown in the figure, the pressure fluctuation signals at both the inlet and outlet monitoring points of the first-stage impeller exhibit significant energy concentration at the blade-passing frequency (100 Hz) and its harmonics, indicating that the pressure oscillations at this stage are primarily influenced by the combined effects of the impeller’s rotational inertia and the unsteady flow within the passage. In contrast, the secondary impeller displays a distinct spatial variation: its inlet monitoring point shows only weak low-frequency energy responses, whereas the outlet point forms pronounced energy bands at the blade-passing frequency and its harmonics, with more persistent high-frequency components. This difference mainly arises because, under series operation, the inlet flow field of the secondary impeller is simultaneously affected by the upstream wake and system flow transients, while at the outlet side, the high static pressure during sudden shutdown induces stronger fluid inertial impacts and pressure wave propagation effects.
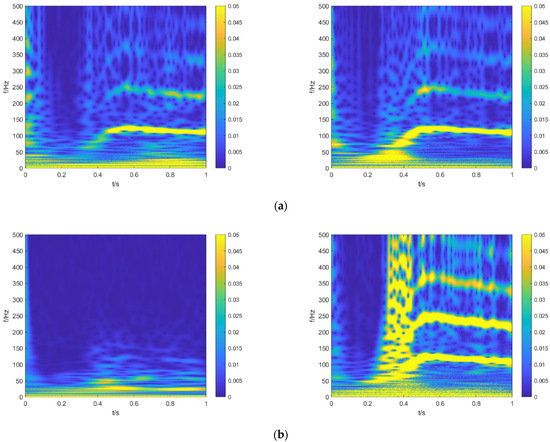
Figure 18.
Time-frequency characteristics of pressure pulsation in the primary and secondary impellers under series working conditions. (a) Series operation; (b) Parallel operation.
Figure 19 presents the time–frequency characteristics of pressure pulsation in the first-stage impeller of the series–parallel pump during an unexpected shutdown under parallel operation. The results indicate that the pressure fluctuation signals at both the inlet and outlet monitoring points of the first-stage impeller also exhibit pronounced energy concentrations at the blade-passing frequency (100 Hz) and its harmonics, reflecting typical rotational periodicity. However, compared with the series operation, the overall energy level of the secondary impeller is significantly lower, showing only weak energy responses at the blade-passing frequency and its harmonics, along with a marked attenuation of high-frequency components. This difference is mainly attributed to the reduced flow rate assigned to the secondary impeller and the weaker flow field interaction during parallel operation, which substantially diminishes the fluid excitation experienced by the secondary impeller during shutdown, resulting in an overall decrease in pulsation energy intensity.
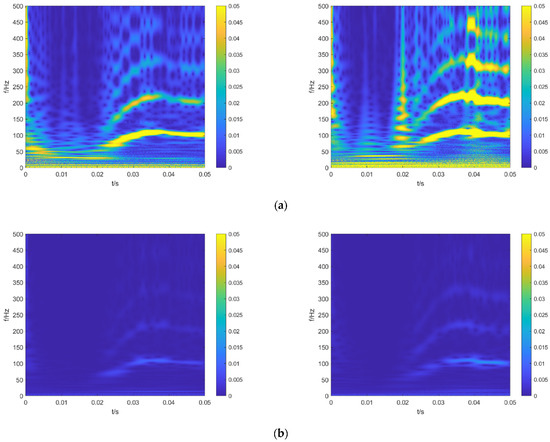
Figure 19.
Time-frequency characteristics of pressure pulsation in the primary and secondary impellers under parallel working conditions. (a) Series operation; (b) Parallel operation.
4. Conclusions
Based on the rotational equilibrium equation of the impeller, this study systematically investigates the dynamic variations in rotational speed, flow rate, torque, and internal flow characteristics of a series–parallel pump during an unintended shutdown. The main conclusions are summarized as follows:
(1) During the unexpected shutdown, the pump’s external characteristics undergo four distinct stages: normal operation, braking deceleration, reverse rotation, and runaway. In series operation, the rotational speed rapidly decreases from 1500 r/min to 193 r/min (a reduction of approximately 87.13%) before accelerating in reverse to −1748 r/min. Under parallel operation, the speed decreases from 1500 r/min to 339 r/min, and the runaway speed reaches −1657 r/min. Throughout these stages, both flow rate and torque exhibit strong nonlinear dynamics with pronounced oscillations and abrupt reversals. The velocity and pressure distributions reveal severe flow disturbances and nonuniformity in the impeller passages during reverse rotation and runaway phases, particularly near the mid-passage and outlet regions.
(2) Entropy production analysis reveals the dynamic evolution of energy loss during shutdown. Under series operation, the total entropy production initially decreases to 3.92 W/K and then sharply rises to a peak of 28.17 W/K during the runaway stage. In parallel operation, the peak reaches 29.09 W/K, with turbulent dissipation contributing up to 69.29% of the total entropy production. The primary impeller passages remain the major source of energy loss throughout the process, showing substantial fluctuations in entropy production ratio. During the runaway phase, the secondary suction chamber becomes the dominant loss region, accounting for 47.56% and 57.12% of total entropy production under series and parallel operations, respectively. Local entropy production distributions demonstrate that high-entropy regions expand toward the impeller outlet under reverse and runaway conditions, accompanied by intensified flow separation and turbulent dissipation—key factors contributing to reduced energy efficiency during shutdown.
(3) During the shutdown process, the pressure fluctuation intensity within the pump first decreases during braking and reverse rotation, and then exhibits pronounced periodic enhancement under flyaway conditions. The outlet of the first-stage impeller shows the strongest fluctuation response, reflecting high sensitivity to transient variations in velocity and flow direction. Time–frequency analysis indicates that the dominant energy components are concentrated at the blade-passing frequency (100 Hz) and its harmonics. Under series operation, the secondary impeller—particularly at the outlet—exhibits stronger and more persistent high-frequency energy due to intensified inertial and pressure-wave effects, whereas under parallel operation, the overall energy level is significantly lower owing to weaker flow field interactions and reduced excitation intensity.
Author Contributions
D.T.: Writing—review and editing, methodology, data curation. K.Z.: Writing—original draft, formal analysis. Y.J.: Software, methodology. Y.Z.: Validation, visualization. P.W.: supervision, resources. Q.S.: investigation, funding acquisition, methodology. All authors have read and agreed to the published version of the manuscript.
Funding
This research received no external funding.
Data Availability Statement
The raw data supporting the conclusions of this article will be made available by the authors on request.
Conflicts of Interest
Author Yuanzhe Ju was employed by the company Shanghai Fire Research Institute of MEM. Author Yong Zhang was employed by the company Xuzhou XCMG Construction Machinery Research Institute Co., Ltd. The remaining authors declare that the research was conducted in the absence of any commercial or financial relationships that could be construed as a potential conflict of interest.
References
- Zhang, Y.L.; Zhu, Z.C.; Zhao, Y.J.; Wu, J.; Zhou, F.-L. Comparative experiments on a self-priming pump delivering water medium during rapid and slow starting periods. Iran. J. Sci. Technol. Trans. Mech. Eng. 2021, 45, 1007–1019. [Google Scholar] [CrossRef]
- Colmenares, F.J.D.; Abuhegazy, M.; Peet, Y.T.; Murman, S.M.; Poroseva, S.V. Sensitivity analysis of direct numerical simulation of a spatially developing turbulent mixing layer to the domain dimensions. J. Verif. Valid. Uncertain. Quantif. 2023, 8, 031001. [Google Scholar] [CrossRef]
- Li, W.; Yang, Q.; Yang, Y.; Ji, L.; Shi, W.; Agarwal, R. Optimization of pump transient energy characteristics based on response surface optimization model and computational fluid dynamics. Appl. Energy 2024, 362, 123038. [Google Scholar] [CrossRef]
- Jokar, M.; Nair, S.; Semperlotti, F. Time transient simulations via finite element network analysis: Theoretical formulation and numerical validation. arXiv 2024, arXiv:2407.02494. [Google Scholar]
- Zhang, B.; Boyd, B.; Ling, Y. Direct numerical simulation of compressible interfacial multiphase flows using a mass–momentum–energy consistent volume-of-fluid method. Comput. Fluids 2022, 236, 105267. [Google Scholar] [CrossRef]
- Ren, Z.; Sun, M.; Zhang, J.; Wang, X.; Huang, Z.; Xu, J.; Huang, C. Start-up strategy of mixed-flow pump system with impulse operation. Ocean Eng. 2023, 277, 114058. [Google Scholar] [CrossRef]
- Fu, S.; Zheng, Y.; Kan, K.; Chen, H.; Han, X.; Liang, X.; Liu, H.; Tian, X. Numerical simulation and experimental study of transient characteristics in an axial flow pump during start-up. Renew. Energy 2020, 146, 1879–1887. [Google Scholar] [CrossRef]
- Kan, K.; Xu, Z.; Chen, H.; Xu, H.; Zheng, Y.; Zhou, D.; Muhirwa, A.; Maxime, B. Energy loss mechanisms of transition from pump mode to turbine mode of an axial-flow pump under bidirectional conditions. Energy 2022, 257, 124630. [Google Scholar] [CrossRef]
- Yang, Z.; Cheng, Y.; Xia, L.; Meng, W.; Liu, K.; Zhang, X. Evolutions of flow patterns and pressure fluctuations in a prototype pump-turbine during the runaway transient process after pump-trip. Renew. Energy 2020, 152, 1149–1159. [Google Scholar] [CrossRef]
- Yun, L.; Bin, L.; Jie, F.; Rongsheng, Z.; Qiang, F. Research on the transient hydraulic characteristics of multistage centrifugal pump during start-up process. Front. Energy Res. 2020, 8, 76. [Google Scholar] [CrossRef]
- Lu, Y.; Tan, L.; Han, Y.; Liu, M. Cavitation–vibration correlation of a mixed flow pump under steady state and fast start-up conditions by experiment. Ocean Eng. 2022, 251, 111158. [Google Scholar] [CrossRef]
- Zhu, G.; Xuan, Y.; Feng, J.; Tang, Z.; Li, Y.; Wang, L. Influence of start-up modes on the noise characteristics of mixed-flow pump during start-up process. Mech. Syst. Signal Process. 2024, 214, 111388. [Google Scholar] [CrossRef]
- Tang, Z.; Zhu, G.; Feng, J.; Wu, Y.; Liu, K.; Lu, Q. Influence of pump start-up mode on the stability of mixed-flow pumps. J. Mech. Sci. Technol. 2023, 37, 2949–2958. [Google Scholar] [CrossRef]
- Li, H.; Bai, C.; Wang, J. Experiments and numerical analysis of the dynamic flow characteristics of a pump–pipeline system with entrapped air during start-up. Eng. Appl. Comput. Fluid Mech. 2023, 17, 2238853. [Google Scholar] [CrossRef]
- Abdulkhaev, Z.E.; Abdurazaqov, A.M.; Sattorov, A.M. Calculation of the transition processes in the pressurized water pipes at the start of the pump unit. JournalNX 2021, 7, 285–291. [Google Scholar]
- Lefebvre, P.; Barker, W. Centrifugal pump performance during transient operation. J. Fluids Eng. 1995, 117, 123–128. [Google Scholar] [CrossRef]
- Rezghi, A.; Riasi, A. Sensitivity analysis of transient flow of two parallel pump-turbines operating at runaway. Renew. Energy 2016, 86, 611–622. [Google Scholar] [CrossRef]
- Stickland, M.T.; Scanlon, T.J.; Fernandez-Francos, J.; Blanco-Marigorta, E.; Parrondo, J. Comparison of CFD Predictions with PIV Measurements in a Pump. In Proceedings of the 2002 ASME Joint U.S.-European Fluids Engineering Conference, Montreal, QC, Canada, 14–18 July 2002. [Google Scholar]
- Liu, J.; Li, Z.; Wang, L.; Jiao, L. Numerical simulation of the transient flow in a radial flow pump during stopping period. J. Fluids Eng. 2011, 133, 111101. [Google Scholar] [CrossRef]
- Walseth, E.C.; Nielsen, T.K.; Svingen, B. Measuring the dynamic characteristics of a low specific speed pump-turbine model. Energies 2016, 9, 199. [Google Scholar] [CrossRef]
- Grover, R.B.; Koranne, S.M. Analysis of pump start-up transients. Nucl. Eng. Des. 1981, 67, 137–141. [Google Scholar] [CrossRef]
- Tsukamoto, H.; Ohashi, H. Transient characteristics of a centrifugal pump during starting period. J. Fluids Eng. 1982, 104, 6–13. [Google Scholar] [CrossRef]
- Tsukamoto, H.; Matsunaga, S.; Yoneda, H.; Hata, S. Transient characteristics of a centrifugal pump during stopping period. J. Fluids Eng. 1986, 108, 392–399. [Google Scholar] [CrossRef]
- Thanapandi, P.; Prasad, R. A quasi-steady performance prediction model for dynamic characteristics of a volute pump. Proc. Inst. Mech. Eng. Part A J. Power Energy 1994, 208, 47–58. [Google Scholar] [CrossRef]
- Li, Z.; Wu, D.; Wang, L.; Huang, B. Numerical simulation of the transient flow in a centrifugal pump during starting period. J. Fluids Eng. 2010, 132, 081102. [Google Scholar] [CrossRef]
- Ma, X.D.; Li, Z.F.; Wang, L.Q. Theoretical study of a mixed pump in startup process. In Proceedings of the 26th IAHR Symposium on Hydraulic Machinery and Systems, Beijing, China, 19–23 August 2012. [Google Scholar]
- Dazin, A.; Caignaert, G.; Bois, G. Transient behavior of turbomachineries: Applications to radial flow pump startups. J. Fluids Eng. 2007, 129, 1436–1444. [Google Scholar] [CrossRef]
- Ismaier, A.; Schlücker, E. Fluid dynamic interaction between water hammer and centrifugal pumps. Nucl. Eng. Des. 2009, 239, 3151–3154. [Google Scholar] [CrossRef]
- Wu, D.Z.; Wu, P.; Yang, S.; Wang, L.; Liu, J. Transient characteristics of a close-loop pipe system during pump stopping periods. J. Press. Vessel. Technol. 2014, 136, 021301. [Google Scholar] [CrossRef]
- Liu, J.; Liu, S.; Sun, Y.; Wang, Z.; Yang, W. Three-dimensional flow simulation of transient power interruption process of a prototype pump-turbine at pump mode. J. Mech. Sci. Technol. 2013, 27, 1305–1312. [Google Scholar] [CrossRef]
- Widmer, C.; Staubli, T.; Ledergerber, N. Unstable characteristics and rotating stall in turbine brake operation of pump-turbines. J. Fluids Eng. 2011, 133, 041101. [Google Scholar] [CrossRef]
- Li, D.; Wang, H.; Li, Z.; Wang, L.; Yang, S. Transient characteristics during the closure of guide vanes in a pump-turbine in pump mode. Renew. Energy 2018, 118, 973–983. [Google Scholar] [CrossRef]


Disclaimer/Publisher’s Note: The statements, opinions and data contained in all publications are solely those of the individual author(s) and contributor(s) and not of MDPI and/or the editor(s). MDPI and/or the editor(s) disclaim responsibility for any injury to people or property resulting from any ideas, methods, instructions or products referred to in the content. |
© 2025 by the authors. Licensee MDPI, Basel, Switzerland. This article is an open access article distributed under the terms and conditions of the Creative Commons Attribution (CC BY) license (https://creativecommons.org/licenses/by/4.0/).