
Stabilization of Sandy Soil Against Internal Erosion Using Fly Ash with Alkali-Activated Binder


Abstract
1. Introduction
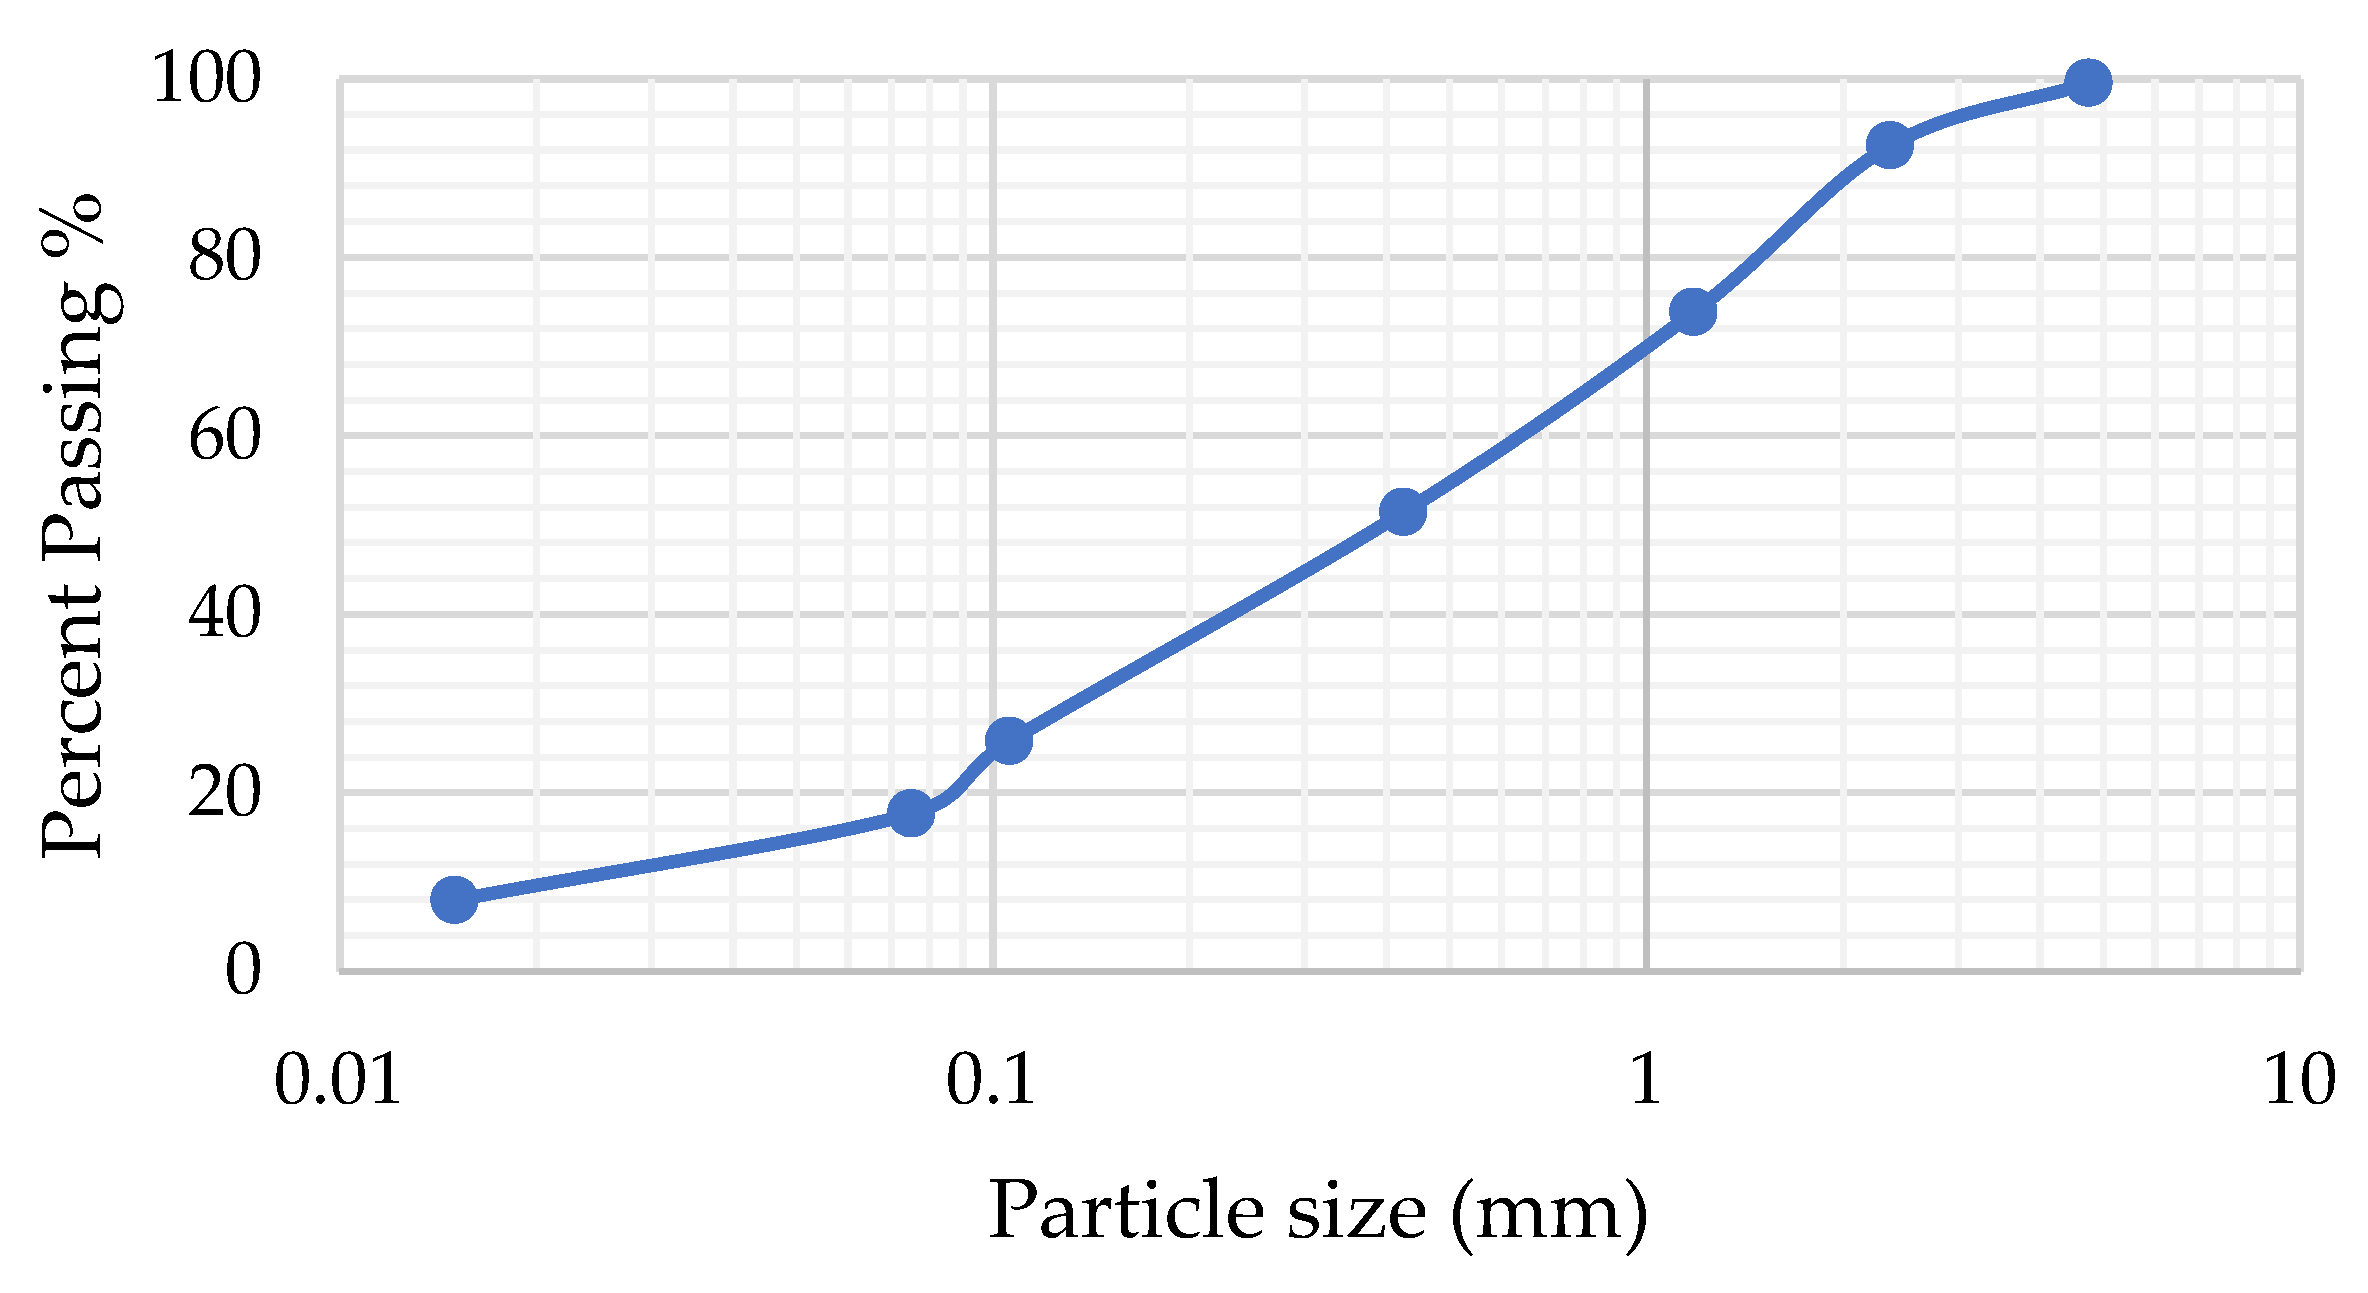
2. Methodology
2.1. Compaction Test for Sand Mixed with Fly Ash Without NaOH
2.2. Comapaction Test for Sand Mixed with Fly Ash and Water-NaOH Solution
2.3. Hole Erosion Test
2.4. Sample Preparation
2.5. Procedure of Calculating Erosion Rate Index and Critical Shear
- ρw = water density used as eroding fluid, kg/m3
- g = gravitational acceleration, m/s2
- s = hydraulic gradient of the soil specimen in standard HET
- φ = diameter
- Q = rate of flow
- S =
- τt = hydraulic shear stress along with the hole/slot at time t
- Ce = coefficient of soil erosion
- τc = critical shear stress
3. Results and Discussion
3.1. Effect of Fly Ash and Fly Ash with Water Containing NaOH Solution on the Maximum Dry Unit Weight
3.2. Stabilizing Sandy Soil Against Internal Erosion Using Fly Ash
3.2.1. The Effect Curing Time on the Diameter of the Erosion Hole at Different Percentages of FA
3.2.2. The Effect of Fly on Critical Shear Stress with Sand Mixed with Fly Ash
3.2.3. The Effect of Fly Ash and Curing Time on Erosion Rate Index
3.2.4. The Relationship Between Final Diameter and Erosion Rate Index
3.3. Stabilizing Sandy Soil Against Internal Erosion Using Fly Ash Mixed with Sodium Hydroxide (NaOH)
3.3.1. The Effect of Fly Ash Mixed with NaOH and Curing Time on the Diameter of Hole
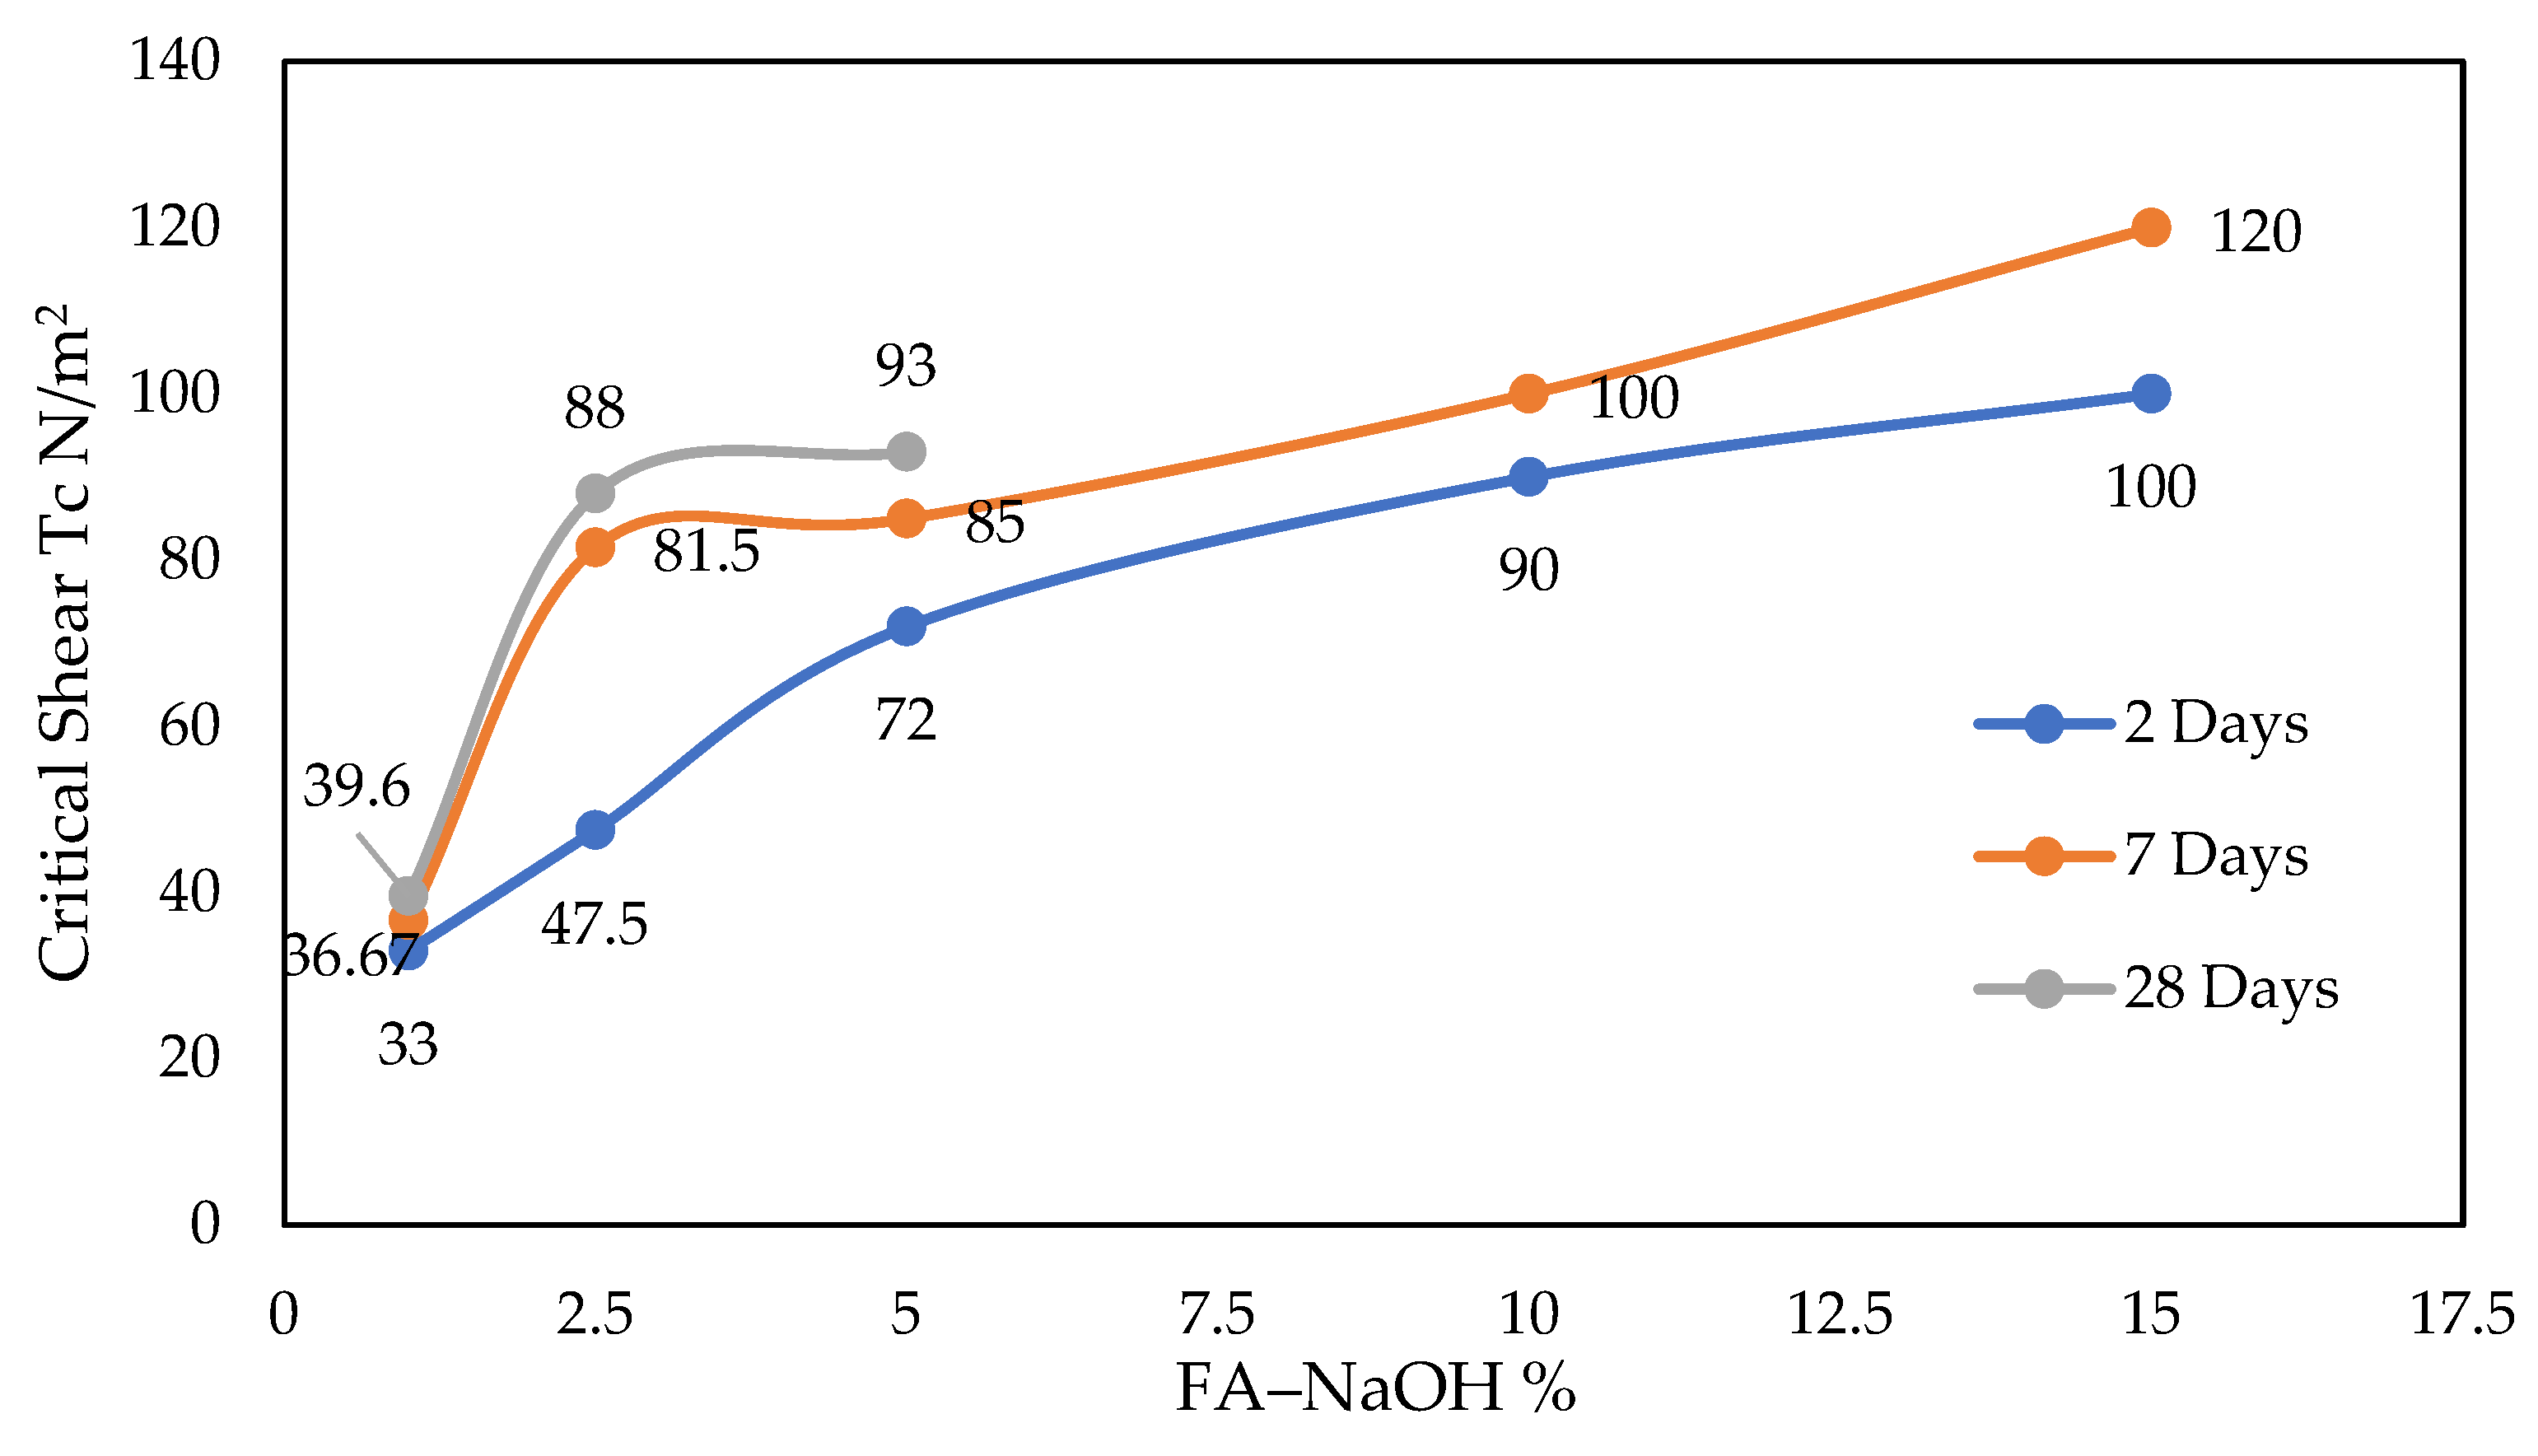
3.3.2. The Effect of Fly Ash Mixed with NaOH and Curing Time on the Critical Shear Stress
3.3.3. The Effect of Fly Ash Mixed with NaOH and Curing Time on Erosion Rate Index
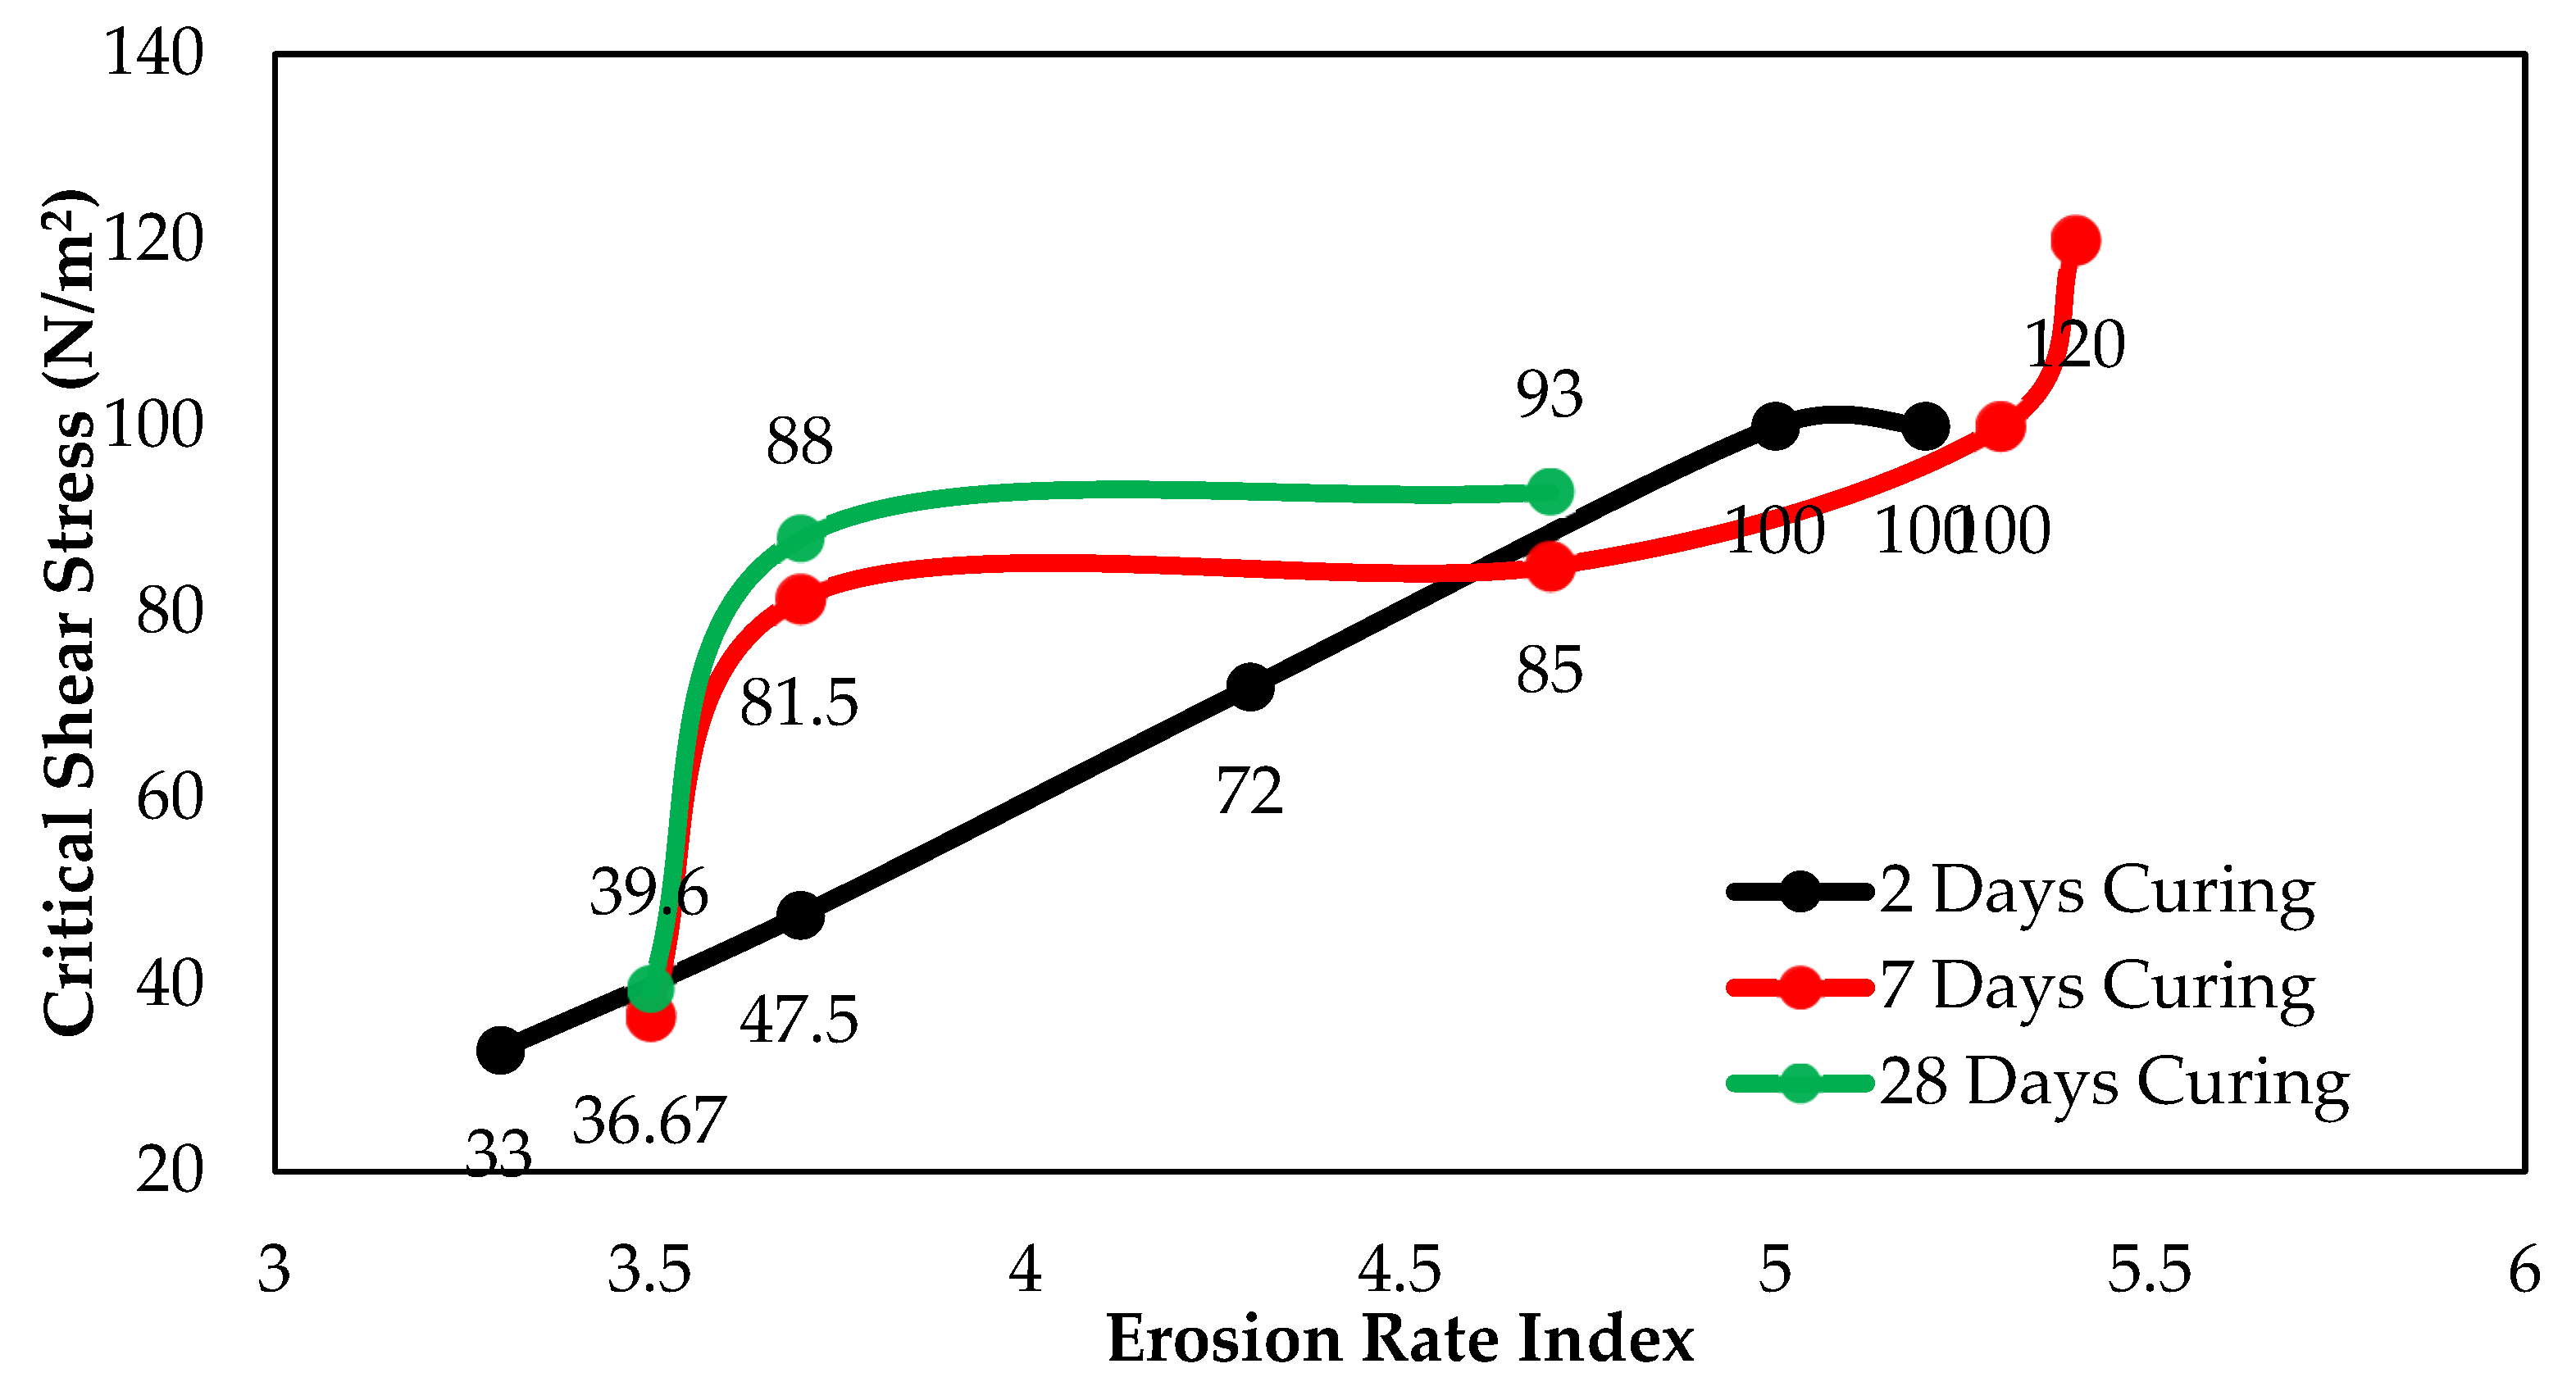
3.3.4. Erosion Rate Index and Critical Shear Stress
4. Conclusions
- Fly ash has a small effect on stabilizing sandy soil against internal erosion. Testing results showed that the erosion rate index increased FA content by up to 5%. However, when fly ash content increased beyond 5%, erosion rate index decreased, and the soil became more susceptible to erosion. Additionally, curing time had minimal impact on erosion resistance, with only a modest increase in the erosion rate index observed at 28 days.
- Fly ash–NaOH mixtures increased the soil maximum dry density. It was found that at 10–15% of fly ash–NaOH was the optimum value that provided the highest stability against internal erosion. Beyond this range, the dry density started to decrease, likely due to the presence of excess fly ash that did not fully react with the NaOH solution.
- Curing time had a noticeable effect when using FA–NaOH mixtures. The erosion rate index improved with longer curing periods, and the best result was obtained at 7 days of curing, which provided the most effective balance between soil strength and resistance to erosion.
- The addition of both fly ash and fly ash–NaOH mixtures increased the critical shear stress of the soil, with the fly ash–NaOH combination showing a more pronounced effect, indicating enhanced resistance to hydraulic forces responsible for initiating internal erosion.
- The FA is not effective for use with clay soil alone and activated binder should be added to FA to be effective in clay soil stabilization.
Author Contributions
Funding
Data Availability Statement
Acknowledgments
Conflicts of Interest
References
- Chen, S.-H. Hydraulic Structures; Springer: Berlin/Heidelberg, Germany, 2015. [Google Scholar]
- Foster, M.; Fell, R.; Spannagle, M. A method for assessing the relative likelihood of failure of embankment dams by piping. Can. Geotech. J. 2000, 37, 1025–1061. [Google Scholar] [CrossRef]
- Robbins, B.A.; Griffiths, D.V. Internal erosion of embankments: A review and appraisal. In Proceedings of the Rocky Mountain Geo-Conference, Golden, CO, USA, 2 November 2018; American Society of Civil Engineers: Reston, VA, USA, 2018; pp. 61–75. [Google Scholar]
- UC Davis’ Department of Civil and Environmental Engineering, ‘UCDAVIS Civil and Environmental Engineering’. Available online: https://research.engineering.ucdavis.edu/gpa/erosion-piping/piping-in-embankment-dams/ (accessed on 22 March 2022).
- Fell, R.; Wan, C.F.; Cyganiewicz, J.; Foster, M. Time for development of internal erosion and piping in embankment dams. J. Geotech. Geoenviron. Eng. 2003, 129, 307–314. [Google Scholar] [CrossRef]
- Banu, S.; Attom, M.; Abed, F.; Vandanapu, R.; Astillo, P.V.; Al-Lozi, N.; Khalil, A. Numerical analysis of the ultimate bearing capacity of strip footing constructed on sand-over-clay sediment. Buildings 2024, 14, 1164. [Google Scholar] [CrossRef]
- Dang, C.C.; Dang, L.C.; Khabbaz, H.; Sheng, D. Numerical study on deformation characteristics of fibre-reinforced load-transfer platform and columns-supported embankments. Can. Geotech. J. 2021, 58, 328–350. [Google Scholar] [CrossRef]
- Khalil, A.; Khan, Z.; Attom, M.; Khalafalla, O. Evaluation of Ground Improvement with Dynamic Replacement and Rapid Impact Compaction of an Artificial Island in the UAE—A Case Study. In Proceedings of the Geo-Congress 2024, Vancouver, BC, Canada, 25–28 February 2024; pp. 116–125. [Google Scholar]
- Pandey, S.; Kumari, N. Utilisation of agricultural waste biopolymer for soil erosion management. Role Green Chem. Ecosyst. Restor. Achieve Environ. Sustain. 2024, 236, 249–260. [Google Scholar]
- Briaud, J.-L. Case histories in soil and rock erosion: Woodrow wilson bridge, brazos river meander, normandy cliffs, and new orleans levees. J. Geotech. Geoenviron. Eng. 2008, 134, 1425–1447. [Google Scholar] [CrossRef]
- Sherard, J.L.; Dunnigan, L.P.; Decker, R.S.; Steele, E.F. Pinhole test for identifying dispersive soils. J. Geotech. Eng. Div. 1976, 102, 69–85. [Google Scholar] [CrossRef]
- Ke, L.; Takahashi, A. Influence of internal erosion on deformation and strength of gap-graded non-cohesive soil. In Proceedings of the Sixth International Conference on Scour and Erosion, Paris, France, 27 August–1 September 2012; pp. 847–854. [Google Scholar]
- Tomlinson, S.S.; Vaid, Y.P. Seepage forces and confining pressure effects on piping erosion. Can. Geotech. J. 2000, 37, 1–13. [Google Scholar] [CrossRef]
- Lüthi, M. A Modified Hole Erosion Test (HET-P) to Study Erosion Characteristics of Soil. Master’s Thesis, University of British Columbia, Vancouver, BC, Canada, 2011. [Google Scholar]
- Flores-Berrones, R.; Ramírez-Reynaga, M.; Macari, E.J. Internal erosion and rehabilitation of an earth-rock dam. J. Geotech. Geoenviron. Eng. 2011, 137, 150–160. [Google Scholar] [CrossRef]
- Attom, M.F.; Vandanapu, R.; Khan, Z.; Yamin, M.; Astillo, P.V.; Eltayeb, A.; Khalil, A. Prediction of internal erosion parameters of clay soils using initial physical properties. Water 2024, 16, 232. [Google Scholar] [CrossRef]
- Archibong, G.A.; Sunday, E.U.; Akudike, J.C.; Okeke, O.C.; Amadi, C. A review of the principles and methods of soil stabilization. Int. J. Adv. Acad. Res. | Sci. 2020, 6, 2488–9849. [Google Scholar]
- Banu, S.A.; Attom, M.F. Effect of curing time on lime-stabilized sandy soil against internal erosion. Geosciences 2023, 13, 102. [Google Scholar] [CrossRef]
- Banu, S.; Attom, M. Internal Erosion Stabilization of Cohesionless Soil Using Lime. Water 2023, 15, 1992. [Google Scholar] [CrossRef]
- Firoozi, A.A.; Olgun, C.G.; Firoozi, A.A.; Baghini, M.S. Fundamentals of soil stabilization. Int. J. Geo-Eng. 2017, 8, 26. [Google Scholar] [CrossRef]
- Negi, A.S.; Faizan, M.; Siddharth, D.P.; Singh, R. Soil stabilization using lime. Int. J. Innov. Res. Sci. Eng. Technol. 2013, 2, 448–453. [Google Scholar]
- Andavan, S.; Kumar, B.M. Case study on soil stabilization by using bitumen emulsions–A review. Mater. Today Proc. 2020, 22, 1200–1202. [Google Scholar] [CrossRef]
- Matthew, A.G.; Paul, A.S. Soil stabilization using Bitumen emulsion and cement combination as additive. J. Earth Sci. Eng. 2018, 8, 66–74. [Google Scholar]
- Afrin, H. A review on different types soil stabilization techniques. Int. J. Transp. Eng. Technol. 2017, 3, 19–24. [Google Scholar] [CrossRef]
- Nayem, N.H. Enhancement of Soil Characteristics Using Different Stabilization Techniques. J. Civ. Constr. Environ. Eng. 2023, 8, 71–79. [Google Scholar]
- Saravanan, R.; Murthi, P.; Poongodi, K.; Raju, A. A study on the effect of waste plastic strips in the stabilization of clay soil. In Proceedings of the IOP Conference Series: Materials Science and Engineering, Warangal, India, 9–10 October 2020; IOP Publishing: Bristol, UK, 2020; p. 032062. [Google Scholar]
- Kumari, D.; Xiang, W.-N. Review on biologically based grout material to prevent soil liquefaction for ground improvement. Int. J. Geotech. Eng. 2019, 13, 48–53. [Google Scholar] [CrossRef]
- Bhuvaneshwari, S.; Robinson, R.G.; Gandhi, S.R. Stabilization of expansive soils using fly ash. Fly Ash India 2005, 8, 1–10. [Google Scholar]
- Attom, M.; Mortula, M.M.; Munjed, A. Shear strength stabilization using burned sludge ash. Int. J. Adv. Mech. Civ. Eng. 2017, 4, 42–45. [Google Scholar]
- Ai-sharif, M.M.; Attom, M.F. A geoenvironmental application of burned wastewater sludge ash in soil stabilization. Env. Earth Sci. 2014, 71, 2453–2463. [Google Scholar] [CrossRef]
- Patil, S.C.; Mathada, D.V.S.; Bharamagoud, B. Comparative study on black cotton soil stabilization by using lime and sisal fiber. Int. J. Innov. Res. Sci. Technol. 2018, 5, 109–115. [Google Scholar]
- Zafar, T.; Ansari, M.A.; Husain, A. Soil stabilization by reinforcing natural and synthetic fibers–A state of the art review. Mater. Today Proc. 2023. [Google Scholar] [CrossRef]
- Amena, S.; Chakeri, D. A study on the effects of plastic waste strips and lime on strength characteristics of expansive soil. Adv. Civ. Eng. 2022, 2022, 6952525. [Google Scholar] [CrossRef]
- Radwan, M.K.H.; Lee, F.W.; Woon, Y.B.; Yew, M.K.; Mo, K.H.; Wai, S.H. A study of the strength performance of peat soil: A modified cement-based stabilization agent using fly ash and polypropylene fiber. Polymers 2021, 13, 4059. [Google Scholar] [CrossRef]
- Hemanth, T.R.S.S.; Sharma, V. Strength and compaction behavior of copper slag stabilized soil. Mater Today Proc. 2023, 93, 505–509. [Google Scholar] [CrossRef]
- Hanson, G.J. Development of a jet index to characterize erosion resistance of soils in earthen spillways. Trans. ASAE 1991, 34, 2015–2020. [Google Scholar] [CrossRef]
- Khalil, A.; Khan, Z.; Attom, M.; Fattah, K.; Ali, T.; Mortula, M. Continuous Evaluation of Shear Wave Velocity from Bender Elements during Monotonic Triaxial Loading. Materials 2023, 16, 766. [Google Scholar] [CrossRef]
- Amiralian, S.; Chegenizadeh, A.; Nikraz, H. A review on the lime and fly ash application in soil stabilization. Int. J. Biol. Ecol. Environ. Sci. 2012, 1, 124–126. [Google Scholar]
- Mateos, M. Stabilization of soils with fly ash alone. Highw. Res. Rec. 1964, 52, 59–65. [Google Scholar]
- Mahvash, S.; López-Querol, S.; Bahadori-Jahromi, A. Effect of class F fly ash on fine sand compaction through soil stabilization. Heliyon 2017, 3, e00274. [Google Scholar] [CrossRef]
- Nath, B.D.; Molla, M.K.A.; Sarkar, G. Study on strength behavior of organic soil stabilized with fly ash. Int. Sch. Res. Not. 2017, 2017, 5786541. [Google Scholar] [CrossRef]
- Dickens, M.M. Organisation for Economic Co-operation and Development; OECD: Paris, France, 2006. [Google Scholar]
- Basu, M.; Pande, M.; Bhadoria, P.B.S.; Mahapatra, S.C. Potential fly-ash utilization in agriculture: A global review. Prog. Nat. Sci. 2009, 19, 1173–1186. [Google Scholar] [CrossRef]
- Moore, W.L.; Masch, F.D. Experiments on the scour resistance of cohesive sediments. J. Geophys. Res. 1962, 67, 1437–1446. [Google Scholar] [CrossRef]
- Wan, C.F.; Fell, R. Investigation of rate of erosion of soils in embankment dams. J. Geotech. Geoenviron. Eng. 2004, 130, 373–380. [Google Scholar] [CrossRef]
- Farrar, J.A.; Torres, R.L.; Erdogan, Z. Bureau of reclamation erosion testing for evaluation of piping and internal erosion of dams. In Proceedings of the Geotechnics of soil Erosion, Denver, CO, USA, 18 February 2007; pp. 1–10. [Google Scholar]
- Coudert, E.; Deneele, D.; Russo, G.; Vitale, E.; Tarantino, A. Microstructural evolution and mechanical behaviour of alkali activated fly ash binder treated clay. Constr. Build. Mater. 2021, 285, 122917. [Google Scholar] [CrossRef]
- Wang, H.; Liu, T.; Yan, C.; Wang, J. Expansive soil stabilization using alkali-activated fly ash. Processes 2023, 11, 1550. [Google Scholar] [CrossRef]
- Vitale, E.; Marocco, A.; Khatib, M.; Russo, G. Hydro-mechanical behaviour of alkali-activated binder treated soil. In Proceedings of the E3S Web of Conferences, Kenitra, Morocco, 25–27 December 2020; EDP Sciences: Les Ulis, France, 2020; p. 06003. [Google Scholar]
- Coudert, E.; Paris, M.; Deneele, D.; Russo, G.; Tarantino, A. Use of alkali activated high-calcium fly ash binder for kaolin clay soil stabilisation: Physicochemical evolution. Constr. Build. Mater. 2019, 201, 539–552. [Google Scholar] [CrossRef]
- Zuaiter, M.; Khalil, A.; Elkafrawy, M.; Hawileh, R.; AlHamaydeh, M.; Ayman, A.; Kim, T.-Y. Effect of blending GGBS and silica fume on the mechanical properties of geopolymer concrete. Sci. Rep. 2025, 15, 9091. [Google Scholar] [CrossRef] [PubMed]
- ASTM D6913/D6913M-17; Standard Test Methods for Particle-Size Distribution (Gradation) of Soils Using Sieve Analysis. ASTM International: West Conshohocken, PA, USA, 2017.
- ASTM D854-22; Standard Test Methods for Specific Gravity of Soil Solids by Water Pycnometer. ASTM International: West Conshohocken, PA, USA, 2022.
- ASTM D698-23; Standard Test Methods for Laboratory Compaction Characteristics of Soil Using Standard Effort (12,400 ft-lbf/ft3 or 600 kN-m/m3). ASTM International: West Conshohocken, PA, USA, 2023.


| Group Number | Erosion Rate Index | Description |
|---|---|---|
| 1 | <2 | Extremely rapid |
| 2 | 2–3 | Very rapid |
| 3 | 3–4 | Moderately rapid |
| 4 | 4–5 | Moderately slow |
| 5 | 5–6 | Very slow |
| 6 | >6 | Extremely slow |
| Percent of Fly Ash | Erosion Parameter | Curing Time | ||
|---|---|---|---|---|
| Two Days | Seven Days | One Month | ||
| 0% | IHET | 3.3 | - | - |
| τC | 28 | - | - | |
| ϕf (cm) | 2.4 | - | - | |
| 2.5% | IHET | 3.3 | 4.3 | 4.4 |
| τC | 38 | 58 | 60 | |
| ϕf (cm) | 2 | 1.9 | 1.8 | |
| 5% | IHET | 4.4 | 4.4 | 4.5 |
| τC | 57.5 | 60 | 66.7 | |
| ϕf (cm) | 1.8 | 1.7 | 1.5 | |
| 10% | IHET | 4.15 | 4 | 4.2 |
| τC | 66.7 | 67 | 75 | |
| ϕf (cm) | 1.8 | 1.8 | 1.7 | |
| 15% | IHET | 4.1 | 4.1 | 4.15 |
| τC | 61 | 55 | 29 | |
| ϕf (cm) | 2.7 | 2.6 | 2.3 | |
| 20% | IHET | 3.7 | 3.7 | 3.7 |
| τC | 21 | 23 | 20 | |
| ϕf (cm) | 3.3 | 2.7 | 2.5 | |
| 25% | IHET | 3.7 | 3.7 | 3.7 |
| τC | 5 | 10 | 17 | |
| ϕf (cm) | 3.3 | 2.9 | 2.6 | |
| % FA | ϕf (cm) | τC | IHET | Description of Erosion |
|---|---|---|---|---|
| 2.5 | 1.8 | 60 | 4.4 | Moderately slow |
| 5 | 1.5 | 66.6 | 4.5 | Moderately slow |
| 10 | 1.7 | 75 | 4.2 | Moderately slow |
| 15 | 2.3 | 35 | 4.15 | Moderately slow |
| 20 | 2.5 | 20 | 3.7 | Moderately rapid |
| 25 | 2.6 | 17 | 3.7 | Moderately rapid |
| Fly Ash % | Parameters | Curing Time | ||
|---|---|---|---|---|
| Two Days | Seven Days | 28 Days | ||
| 1% | IHET | 3.3 | 3.5 | 3.5 |
| τC | 33 | 36.7 | 39.6 | |
| ϕf (cm) | 2.3 | 2.1 | 2 | |
| 2.5% | IHET | 3.7 | 3.7 | 3.7 |
| τC | 47.5 | 81.5 | 88 | |
| ϕf (cm) | 2.1 | 2 | 2 | |
| 5% | IHET | 4.3 | 4.7 | 4.7 |
| τC | 72 | 85 | 93 | |
| ϕf (cm) | 1.8 | 1.5 | 1.5 | |
| 10% | IHET | 5 | 5.3 | - |
| τC | 90 | 100 | - | |
| ϕf (cm) | 0.7 | 0.7 | - | |
| 15% | IHET | 5.2 | 5.4 | - |
| τC | 100 | 120 | - | |
| ϕf (cm) | 0.7 | 0.7 | - | |
| % FA | ϕf (cm) | τC | IHET | Description of Erosion |
|---|---|---|---|---|
| 1 | 2.3 | 33 | 3.3 | Moderately rapid |
| 2.5 | 2.1 | 47.5 | 3.7 | Moderately slow |
| 5 | 1.8 | 72 | 4.3 | Moderately slow |
| 10 | 0.7 | 90 | 5 | Moderately slow |
| 15 | 0.7 | 100 | 5.2 | Very slow |
Disclaimer/Publisher’s Note: The statements, opinions and data contained in all publications are solely those of the individual author(s) and contributor(s) and not of MDPI and/or the editor(s). MDPI and/or the editor(s) disclaim responsibility for any injury to people or property resulting from any ideas, methods, instructions or products referred to in the content. |
© 2025 by the authors. Licensee MDPI, Basel, Switzerland. This article is an open access article distributed under the terms and conditions of the Creative Commons Attribution (CC BY) license (https://creativecommons.org/licenses/by/4.0/).
Share and Cite
Almasaeid, M.; Attom, M.; El-Emam, M.; Arab, M.G. Stabilization of Sandy Soil Against Internal Erosion Using Fly Ash with Alkali-Activated Binder. Water 2025, 17, 1552. https://doi.org/10.3390/w17101552
Almasaeid M, Attom M, El-Emam M, Arab MG. Stabilization of Sandy Soil Against Internal Erosion Using Fly Ash with Alkali-Activated Binder. Water. 2025; 17(10):1552. https://doi.org/10.3390/w17101552
Chicago/Turabian StyleAlmasaeid, Mohammad, Mousa Attom, Magdi El-Emam, and Mohamad G. Arab. 2025. "Stabilization of Sandy Soil Against Internal Erosion Using Fly Ash with Alkali-Activated Binder" Water 17, no. 10: 1552. https://doi.org/10.3390/w17101552
APA StyleAlmasaeid, M., Attom, M., El-Emam, M., & Arab, M. G. (2025). Stabilization of Sandy Soil Against Internal Erosion Using Fly Ash with Alkali-Activated Binder. Water, 17(10), 1552. https://doi.org/10.3390/w17101552