


Abstract
An analysis of 17 Romanian cities’ Urban General Plans showed that urban planning documents do not satisfactorily rely on groundwater information. The associated hydrogeological supporting studies include only general recommendations. However, they should include specifications to improve water-balance and detail the need to implement monitoring systems to monitor groundwater levels. The studies do not recommend special construction measures to be implemented for future infrastructure elements and do not include maps delimiting the particular geotechnical and hydrogeological characteristics. A study conducted on an urban river corridor using satellite remote sensing and a methodology characterizing the chosen zone clearly shows a major concordance between the groundwater level and vertical displacements. In addition, the presence of urban anthropogenic strata associated with the groundwater level fluctuations showed amplified vertical displacements of the ground when compared to the areas where the natural deposits exist. The methodology combines subsidence occurrence, land-cover changes, hydrogeological, geological, and hydrological characteristics, climatic aspects, the location, the extension of old quarries, and the last 100 years of topographical changes. These observations emphasize the need for accurate studies to properly discriminate between phenomena and processes generating subsidence, which must be used systematically to support the general urban plans of cities as the documentation of future developments.
1. Introduction
Urban planners, innovators, and researchers are increasingly working on sustainable and smart initiatives for urban transformation [1]. Various perspectives and disciplines related to radical change towards sustainable and smart urban systems are being integrated into urban plans and strategies. Despite the growing body of evidence highlighting the importance of groundwater to the support of urban living, the impact of urbanism on natural groundwater systems is rarely considered in city systems planning [2], even in such cases where groundwater dynamics could modify the buildings structural behavior. Discrepancies in communication between the scientific community and city administrations add to the difficulties in addressing urban resilience and hydrogeology issues. Reliable subsurface management must be based on relevant knowledge and an understanding of the phenomena, processes, and data, which must be accessible, as well as knowledge of urban planning procedures to minimize the impact of urban developments on the water cycle. Experts should use robust datasets on urban fabric, infrastructure networks, groundwater, and geothermal energy systems at the urban scale [3].
The influence of urban planning on hydrology has been explored by Carneiro et al. [4]. The authors [4] identify the need for building accurate hydrogeological models that can be used as tools for urban planning decisions. These models must be based on accurate geological modeling which takes into account both vertical and lateral facies variations. Consequently, accurate local studies are needed to characterize hydraulically anthropogenic heterogeneous deposits and embankments. The models should englobe the influence of the underground structures and consider the drains, dewatering systems, and the losses from the water supply transportation pipes. In Canada and the United States, the required level of groundwater information for land use planning purposes has been described by Roxane et al. [5], and demonstrates that the centralization of groundwater data leads to an increased accessibility for land planners. The paper also confirmed the existing gap between groundwater information production and regional planning. The urgent need to guide urban planners on how to manage urban development with minimal damage to groundwater resources has also been demonstrated in several works [6,7]. Carmon et al. [6] provided solutions on how to protect groundwater for the development of water-sensitive urban planning. The paper highlighted the effects of urban development on the quantity and quality of rainwater that infiltrates into the soil on its way to recharge the aquifer. The authors analyzed the effect of urban development on runoff and infiltration processes, focusing on the effect of certain patterns of urban development and identifying options to mitigate the negative aspects through relatively simple and inexpensive means. Components of urban planning which influence runoff and infiltration were presented. As an aid to understanding the urbanization process and to the designing of policies and regulations, Patra et al. [7] studied the impacts of urbanization on land cover changes and its probable implications for the local climate and groundwater level. The authors pointed out that the increase in the urban built-up area over the last two decades led to fluctuations of the groundwater level in the Howrah Municipal Corporation (HMC) area of the Indian state of West Bengal. In the city of Erbil, in the Kurdistan Region of Iraq, Hameed et al. [8] identified a significant correlation between urbanization areas and groundwater levels. As the urban expansion increased by 278% between 2004 and 2014, a decline in groundwater levels was detected in the study area [8].
A study focusing [9] on the situation in the coastal peatlands of Netherlands detailed where careful land use planning was adopted with special attention paid to groundwater. This was due to the long history of subsidence followed by adaptation strategies over a period of more than nine centuries.
Focusing the use of satellite remote sensing techniques, another study [10] proposed the use of the satellite radar interferometry system InSAR to define potential ground fractures linked to aquifer system compaction, in Toluca Valley, Mexico. The ground fractures map was validated through a field campaign. The authors highlighted the great benefit of this map to providing operational support to urban planning. It was suggested that the ground fracture mapping shows a higher reliability when derived from InSAR than solely based on field observations.
The long-term urban development plan established in 2011 in Hanoi, Vietnam (Hanoi Master Plan to year 2030 and vision to 2050), with the purpose of a more sustainable development of the city, considers various environmental aspects, such as soil pollution, air quality, and water quality [11]. As groundwater is one of its main water supply resources, the continuous rapid urbanization of Hanoi city since the 1990s has led to the acceleration of groundwater withdrawal and the emergence of land subsidence [12]. Several other studies were carried out using satellite radar interferometry for land subsidence monitoring since 2007 [12,13,14], where the authors mention numerous foundation failures of different constructions in the 2000s [12]. The authors highlight the crucial role that a knowledge of surface deformation plays for urban planning to minimize the severe influences of surface subsidence [14].
The continuous monitoring of land subsidence is recognized as a critical instrument for the detection of potential hazards and for the designing of compensation strategies and urban planning activities, as in the case of Beijing (China) [15,16].
Furthermore, the lack of accurate data on urban groundwater represents a major problem in many cities and metropolitan areas, and more aspects should be addressed as mentioned below. The first aspect is the reduced number of monitoring wells for a certain urban area. This was mentioned in the scientific literature for Mexico City [10], Hanoi city [14], Lisbon, Portugal [17], Merton area, London [18], and Glasgow, UK [3]. The second aspect arises from the unknown number of users, wells, and corresponding pumping rates, as mentioned in [19] in a study for Gioia Tauro, Italy, in [20] for several Indonesian urban areas including Jakarta, and in [9] for Ho-Chi-Minh City (Vietnam). Management problems [21] and the issue of proprietary data production might additionally lead to a lack of data accuracy, as stated in [22] for several urban areas in the USA.
The connection between urban planning/city development and subsurface hydrology is therefore a work in progress, and our study undertakes an initial step to understanding this connection from a multi-perspective approach. Our study brings into discussion the necessity of hydrogeological data to the documentation of city development (buildings and infrastructure) as a complete and coherent picture of the underground environment’s behavior with respect to supporting the healthy evolution of cities.
Objectives of the Paper
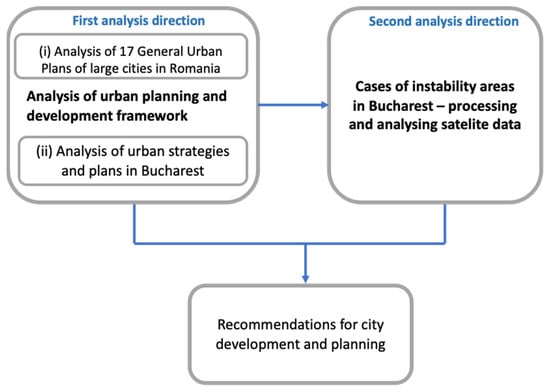
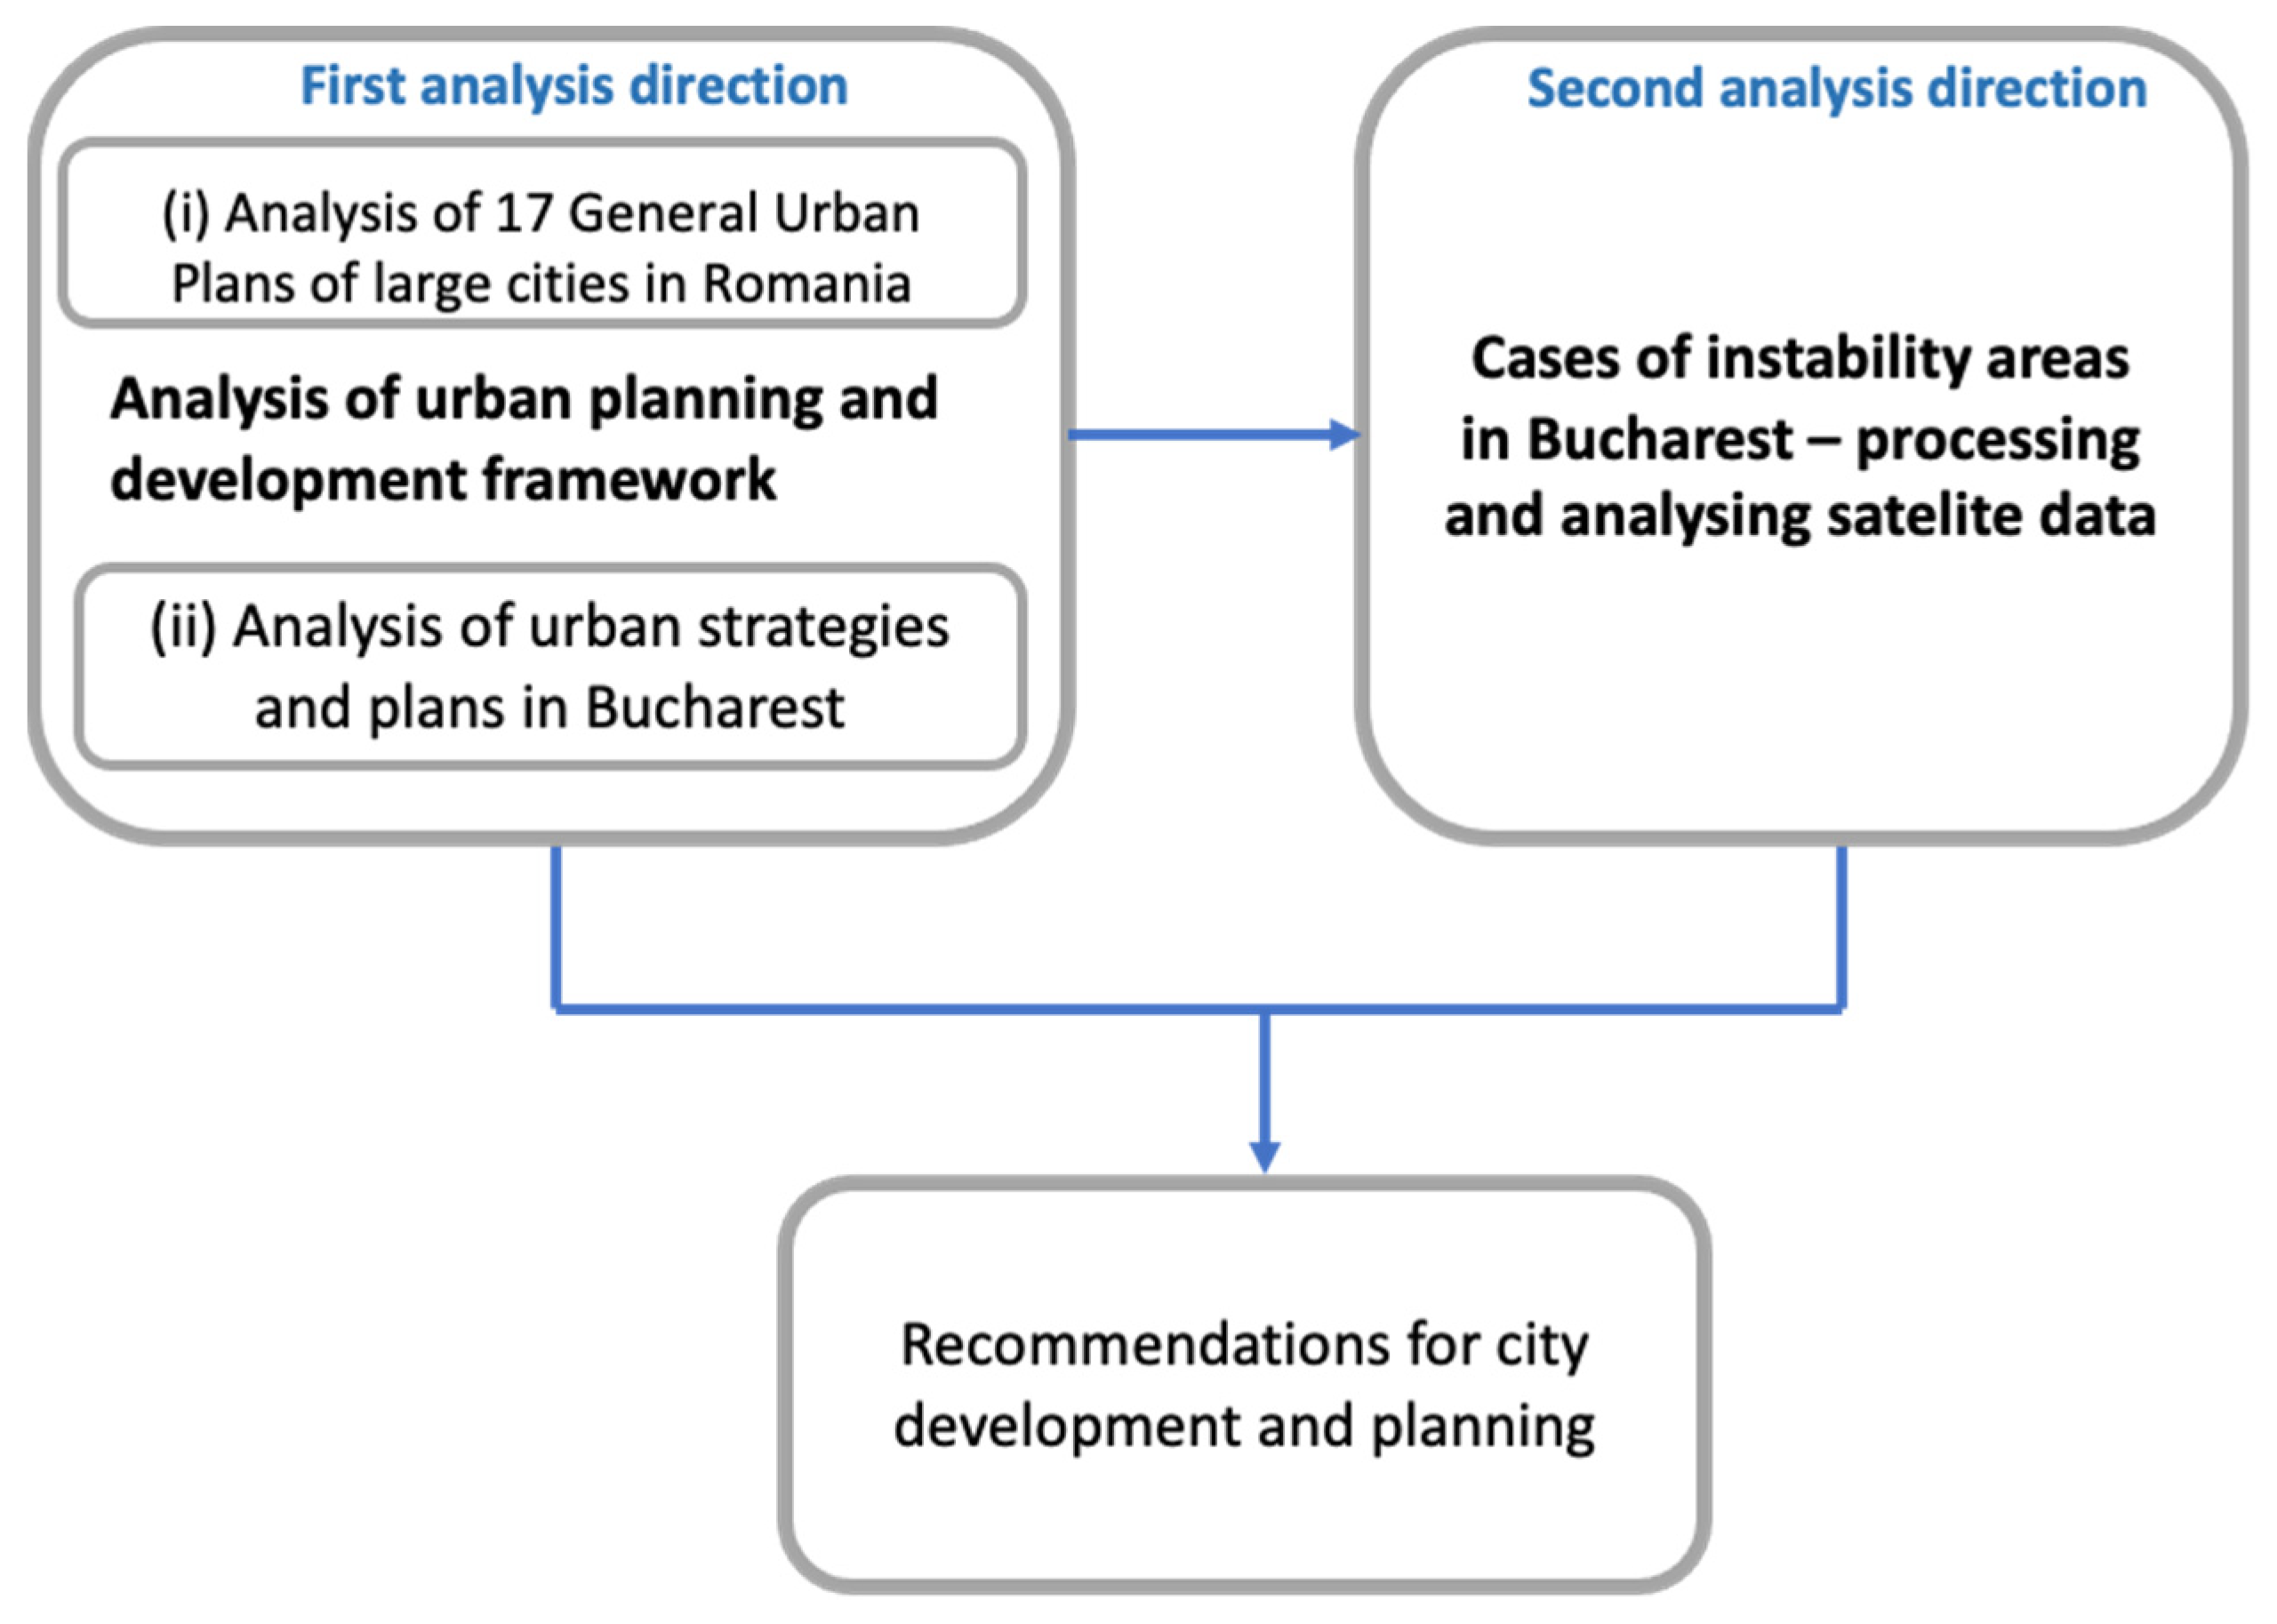
The first interdisciplinary exploratory study on the connection between urban planning, urban development, and urban subsurface hydrology in Romania is provided (Figure 1). Three research objectives are proposed: (1) analyze the urban plans in 17 large cities in Romania to examine the urban strategic and planning frameworks and thus understand the connection between the cities’ development and urban groundwater; (2) analyze the land instability map of Bucharest to discern the role groundwater plays in main subsidence triggering factors; (3) discuss the results obtained from the previous objectives and formulate recommendations for the local and national authorities, urban planners, and water companies.
Figure 1.
Research methodology for exploring the connection between urban development and urban subsurface hydrology. Source: elaborated by the authors.
2. Exploring the Connection between Urban Development and Urban Subsurface Hydrology
The direction of the first analysis includes two steps outlined in Figure 1: (i) an analysis of the urban planning documents and support studies for 17 large cities in Romania, exploring the reliance of the General Urban Plan (GUP) on groundwater documentation; (ii) the analysis of strategic documentation [23] for the city of Bucharest, namely the Integrated Urban Development Strategy for Bucharest (strategy for absorbing EU funds, elaborated in 2021) and of the strategic concept for Bucharest 2030 (elaborated in 2011); in addition, the analysis of urban planning documentation, namely the current general urban plan (drafted in 1998, with extended validity until the new GUP is completed).
Based on the land instability map of Bucharest, the second direction presented in Figure 1 focuses on discerning the role of groundwater within the main subsidence triggering factors and analyzing its relation to the urban planning framework. By monitoring vertical ground displacement it is possible to indirectly estimate the generated subsidence phenomena, with one of the most important of these phenomena being related to the dynamics of urban groundwater. The recent method for monitoring urban subsidence is the satellite remote sensing technique that uses Persistent Scatterer Interferometry (PSI), which allows for vertical ground displacements to be determined to the millimeter order [24] by measurements made along the Line of Sight (LoS) of the satellite [25]. PSI is a radar-based technique from the Interferometric Synthetic Aperture Radar (InSAR) family [26]. The InSAR operates by generating an interferometric pair using two radar scenes, acquired approximately from the same look angle, and over the same area, at different times [27]. If more interferograms are generated, their phase difference is used for estimating the displacements in the monitored area along the Line of Sight (LoS) of the satellite [28]. Considering the available radar data and the particularities of the studied area, different methods are used for estimating the vertical ground displacements from LoS displacements. For the PSI technique, the ground displacements are determined in temporally stable highly reflective ground features known as persistent scatterers (PS) [25] using multiple SAR interferograms generated from a time series of satellite radar data. The main advantages of the SAR techniques consist of its large area monitoring capability and high temporal resolution [27]. As an example, Sentinel-1, the current European SAR missions, provides a large amount of satellite data and has a revisit time of 6 days when both satellites of the constellation are considered. The Sentinel-1 Interferometric Wide Swath (IW) products, which are used for PSI, have a swath of 250 km, [29] facilitating an analysis at city level, or even at regional level. One disadvantage of the SAR technique is represented by the temporal and spatial decorrelation, which leads to a lack of ground displacement information for land surfaces covered with vegetation or for areas where land changes occur during the studied time interval [30].
2.1. Current Urban Planning and Development Framework
Romanian legislation requires localities to have a General Urban Plan (GUP) that has a directive character and includes operational regulations, thus being the legal support for the implementation of development programs and actions [23]. A GUP includes several written documents such as a summary report, a general report (the main results of the studies justifying the chosen solutions), local planning regulations, and graphic representations: the city or commune plan, an analysis illustrating the identified dysfunctions, planning regulations and zoning, the land ownership, and the legal circulation of land. Geotechnical or sometimes hydrogeological studies are part of the support studies.
A GUP follows the structure of a guide approved by a Ministerial Order. This indicates that the content and topics covered by the support studies must be decided by the contracted service provider along with the municipality. However, by default, some sections are considered mandatory, optional, or non-required, depending on the locality category.
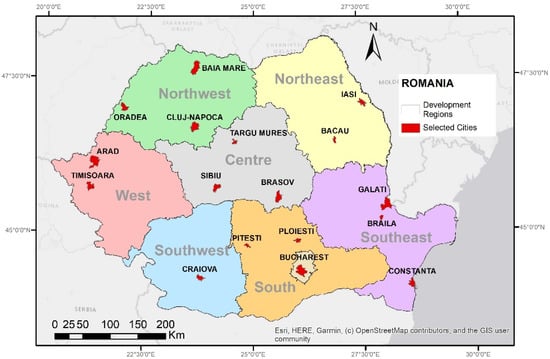
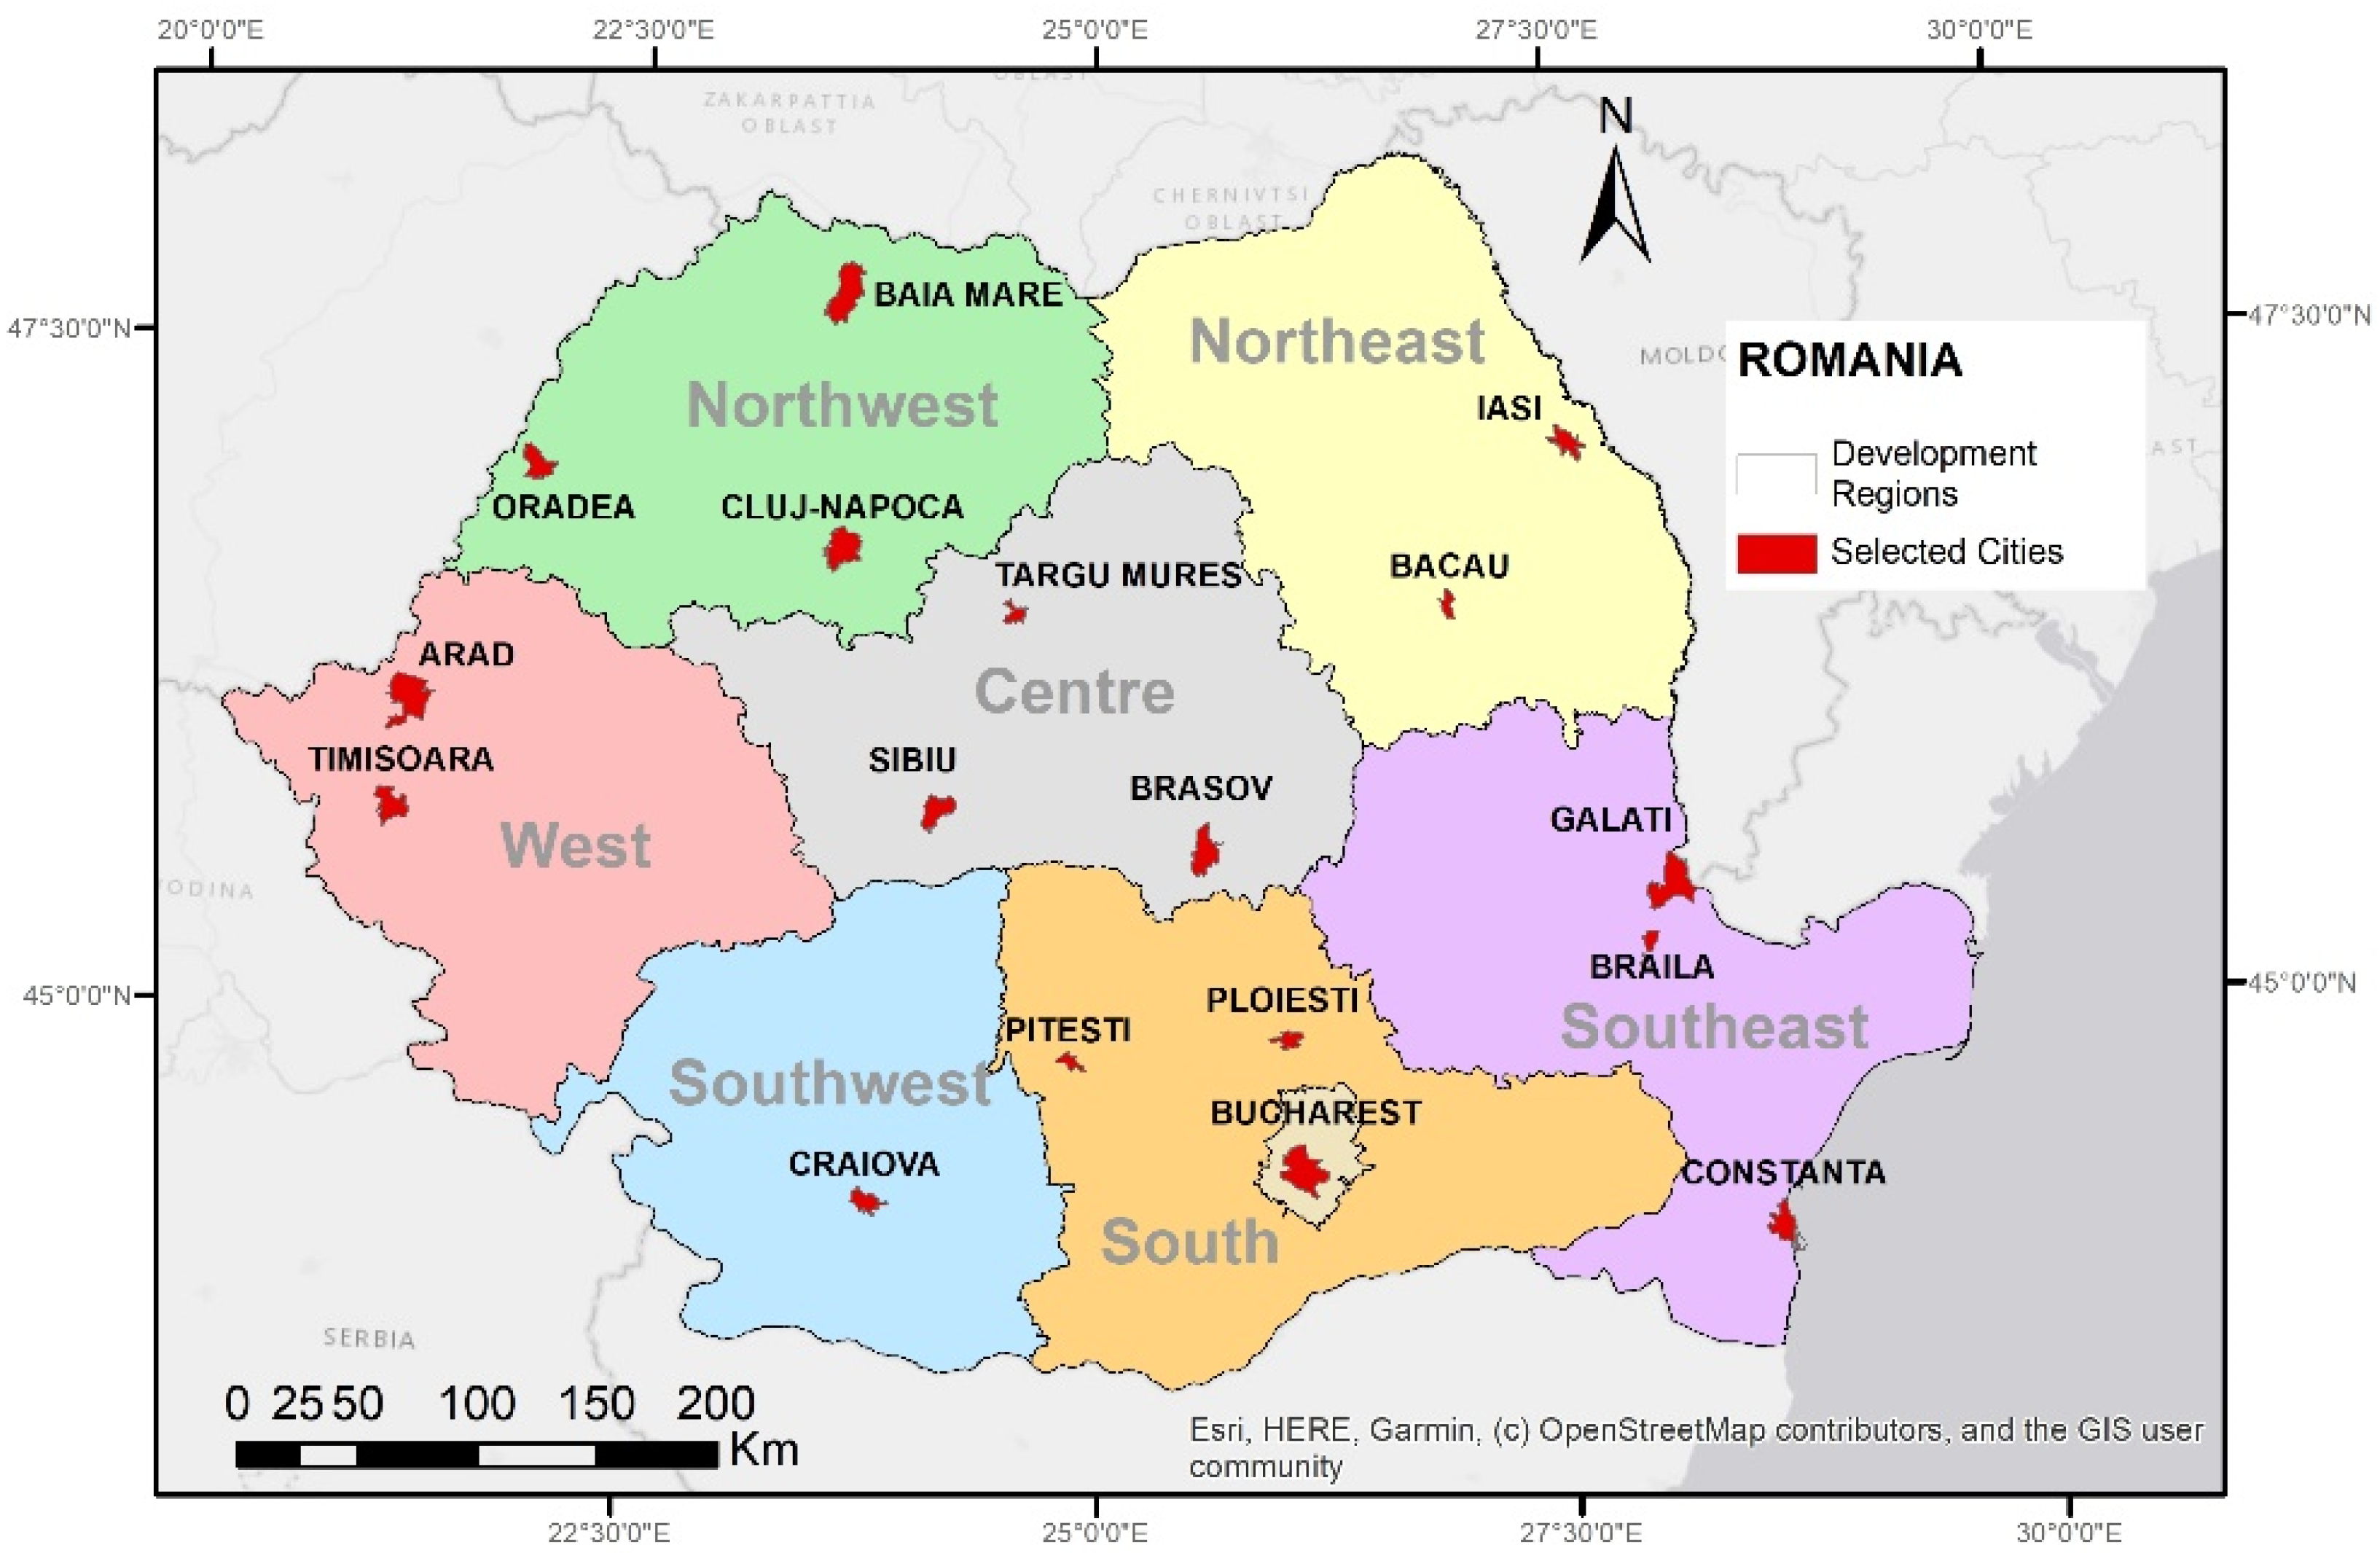
An amount of 17 large cities (Figure 2) with more than 170,000 inhabitants have been selected (Table 1). It has been examined whether or not groundwater characteristics are considered in their General Urban Plans.
Figure 2.
The location of the chosen 17 cities on the Romanian map. Map generated in Esri® ArcMap™ 10.3. Base map source: ESRI. Source: elaborated by the authors.
Table 1.
Summary of the selection criteria.
The selection criteria included: the region (minimum one town in each existing development region), the number of inhabitants (2019 as the year of reference) according to the National Institute of Statistics, the population density (more than 3000 inhabitants/sq km), and the year the GUP had been finalized (before 2000, between 2010–2015, and after 2015).
2.2. Land Instability in Bucharest City
Located in southeastern Romania, with an area of approximately 240 km2 and a population of over 2.1 million inhabitants [31], Bucharest is crossed by two rivers: the Dâmbovița and Colentina. The first is extensively canalized and the second was reshaped at the beginning of the 20th century in a series of chained lakes [32], which have a direct hydraulic connection to the shallow aquifer.
Bucharest is a dynamic city with an expanding population and surface coverage, and thus its infrastructure shows considerable development and subsurface changes. Aspects of urban development in connection to groundwater dynamics have been highlighted. Two parallel directions of study have followed: the examination of the current urban development and planning framework and a land instability analysis (Figure 1).
Considering the particularities of the subsidence phenomena, two time periods have been considered, for which data sets from two European satellite radar missions were available. Thus, for the 2004–2010 period, data from the ENVISAT ASAR mission have been used and processed using the Persistent Scatterer Interferometry (PSI) technique. For the 2014–2018 period, data from the current European radar mission (Sentinel-1) has been used. Maps of the vertical displacements of the terrain for the entire urban area were generated using these data sets for the two time intervals mentioned above. The consistency of the results for the two time intervals has been observed by analyzing two corresponding land displacement maps. Numerous areas of instability that were identified on the land displacements map for the 2004–2010 interval show the same trends as for the 2014–2018 interval. Alongside the PSI technique, a land surface change detection technique was used for a better interpretation of the changes and displacements at the land’s surface level. A new cartographic product has been obtained through combining the map of the vertical land displacements with the surface terrain change detection map [28]. Therefore, the potential areas that locate the source of vertical displacements have been established accurately.
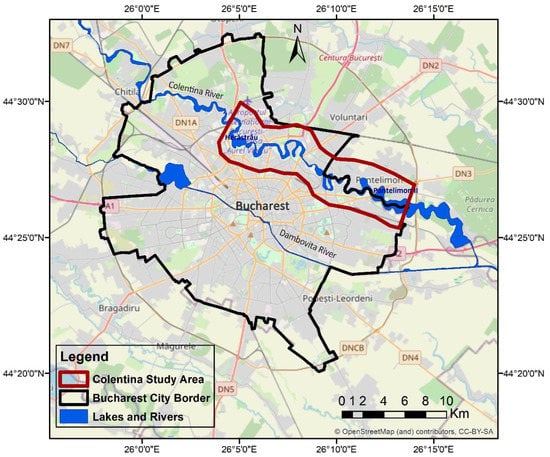
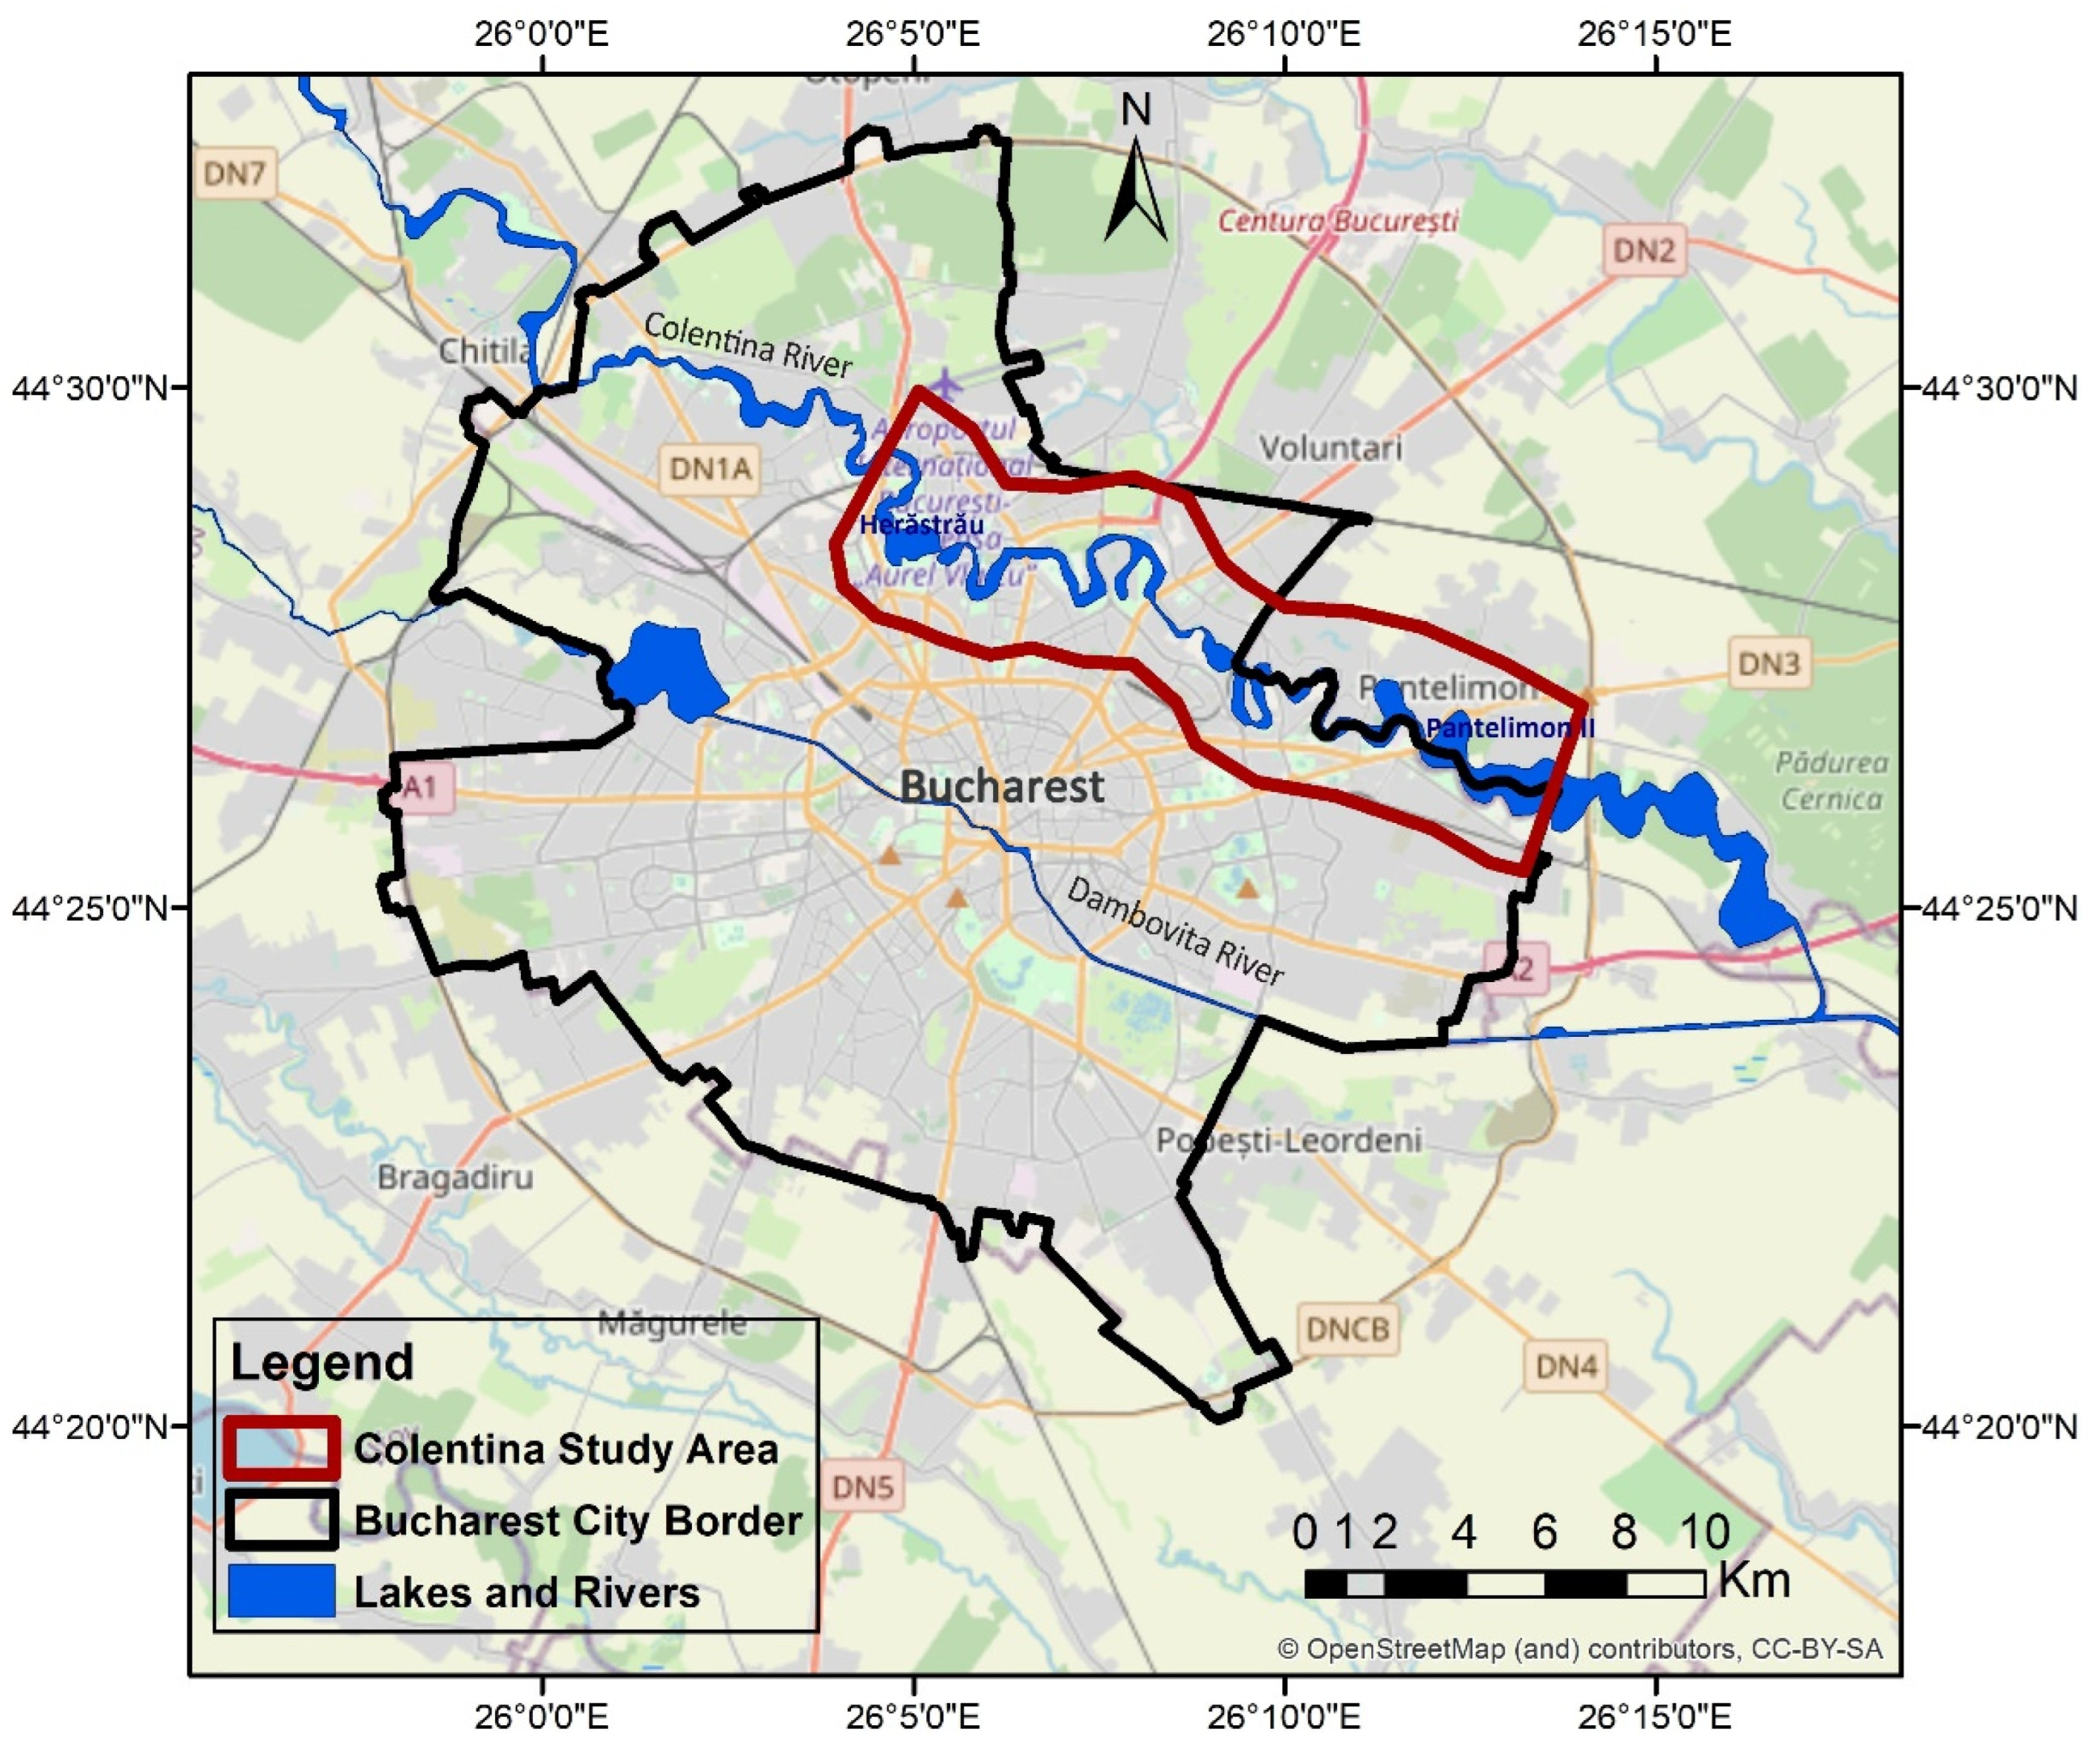
The chosen area is located along the Colentina River corridor (Figure 3). For the 2014–2018 period, a methodology to characterize the area has been proposed. It considers specific elements of the studied area, such as: subsidence occurrence; land-cover changes; hydrogeological, geological, and hydrological characteristics; the history of the study area (considering the location and the extension of old quarries for building materials); the last 100 years of topographical changes to the Colentina River chained lakes; and climatic aspects.
Figure 3.
Colentina River corridor study area. Map generated in Esri® ArcMap™ 10.3. Base map source: OpenStreetMap. Source: elaborated by the authors.
Short Overview of the Processing and Analysis of Satellite Data for Identification and an Outline of the Main Subsidence Triggering Factors
To generate the PSI maps for the 2004–2010 and 2014–2018 time intervals, two different data sets and methodologies were used. Based on the data coming from the radar European mission ENVISAT ASAR, a land displacement map was generated for the June 2004–July 2010 time interval using the ENVI SARScape software (ENVI SARScape version 5.5, L3Harris, purchased from ESRI Romania (Bucharest)-authorised distributor of Harris Geospatial products (ENVI and SARScape) for Romania) for data processing [33] and by applying the PSI technique. ENVISAT ASAR data are available in the archive of the European Space Agency (ESA) along with data from other historical missions of ESA [34]. For this study, some of the SAR ENVISAT ASAR data used for processing was purchased through the ESA C1P 6050 proposal, using the Romanian Space Agency as coordinator.
The main PSI processing steps for the ENVISAT ASAR data in ENVI SARScape include [33]:
- ENVISAT ASAR images were imported to ENVI SARScape;
- Application of the Orbit File: precise orbit files were downloaded from ESA archive while the SAR images were downloaded;
- Connection Graph Generation: the SAR pair combination (Master and Slaves) are defined together with the connection network, used for the generation of the multiple differential interferograms. The Master image that was used was from 24 February 2007;
- Area of Interest Definition: Bucharest city;
- Interferometric process, including the coregistration, interferogram generation, and the flattening and Amplitude dispersion index. Here, the digital elevation model (DEM) is specified. The STRM-3 v4 DEM was used for this processing;
- Inversion: First Step—estimation of the first model inversion to derive the residual height and the displacement velocity;
- Inversion: Second Step—estimation of the atmospheric phase components, considering the first linear model product coming from the previous step;
- Geocoding—the PS products are geocoded, and the displacements can be displayed.
During satellite data processing, the baseline was considered between the master and the slave scenes to have values lower than 300 m. The coherence threshold established for the ENVISAT ASAR data series is 0.8.
For 2014–2018 surface displacements in Bucharest, data from the SAR Sentinel-1 sensor have been used. The data that were used, available on the “Copernicus Open Access Hub” website [35], cover the period between October 2014–April 2018 and consider acquisitions from both a descending (109D) and an ascending orbit (131A). The PSI maps for both ascending and descending orbits were produced by the Norwegian Geological Survey within the Norwegian Ground Motion Service [36], by applying the classic PSI technique. The PSI processing of the Sentinel-1 data was carried out as an activity within the INXCES-INnovations for eXtreme Climatic EventS project [37].
Based on the ascending and descending PSI maps, where the land displacements are measured along the Line of Sight (LoS), a PSI map of vertical displacements was computed considering the methodology described in [38].
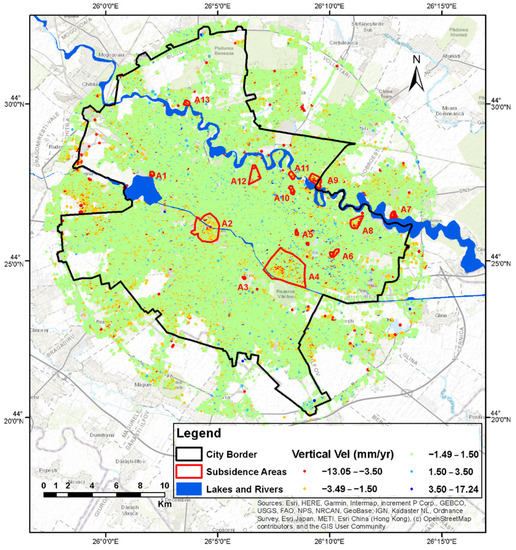
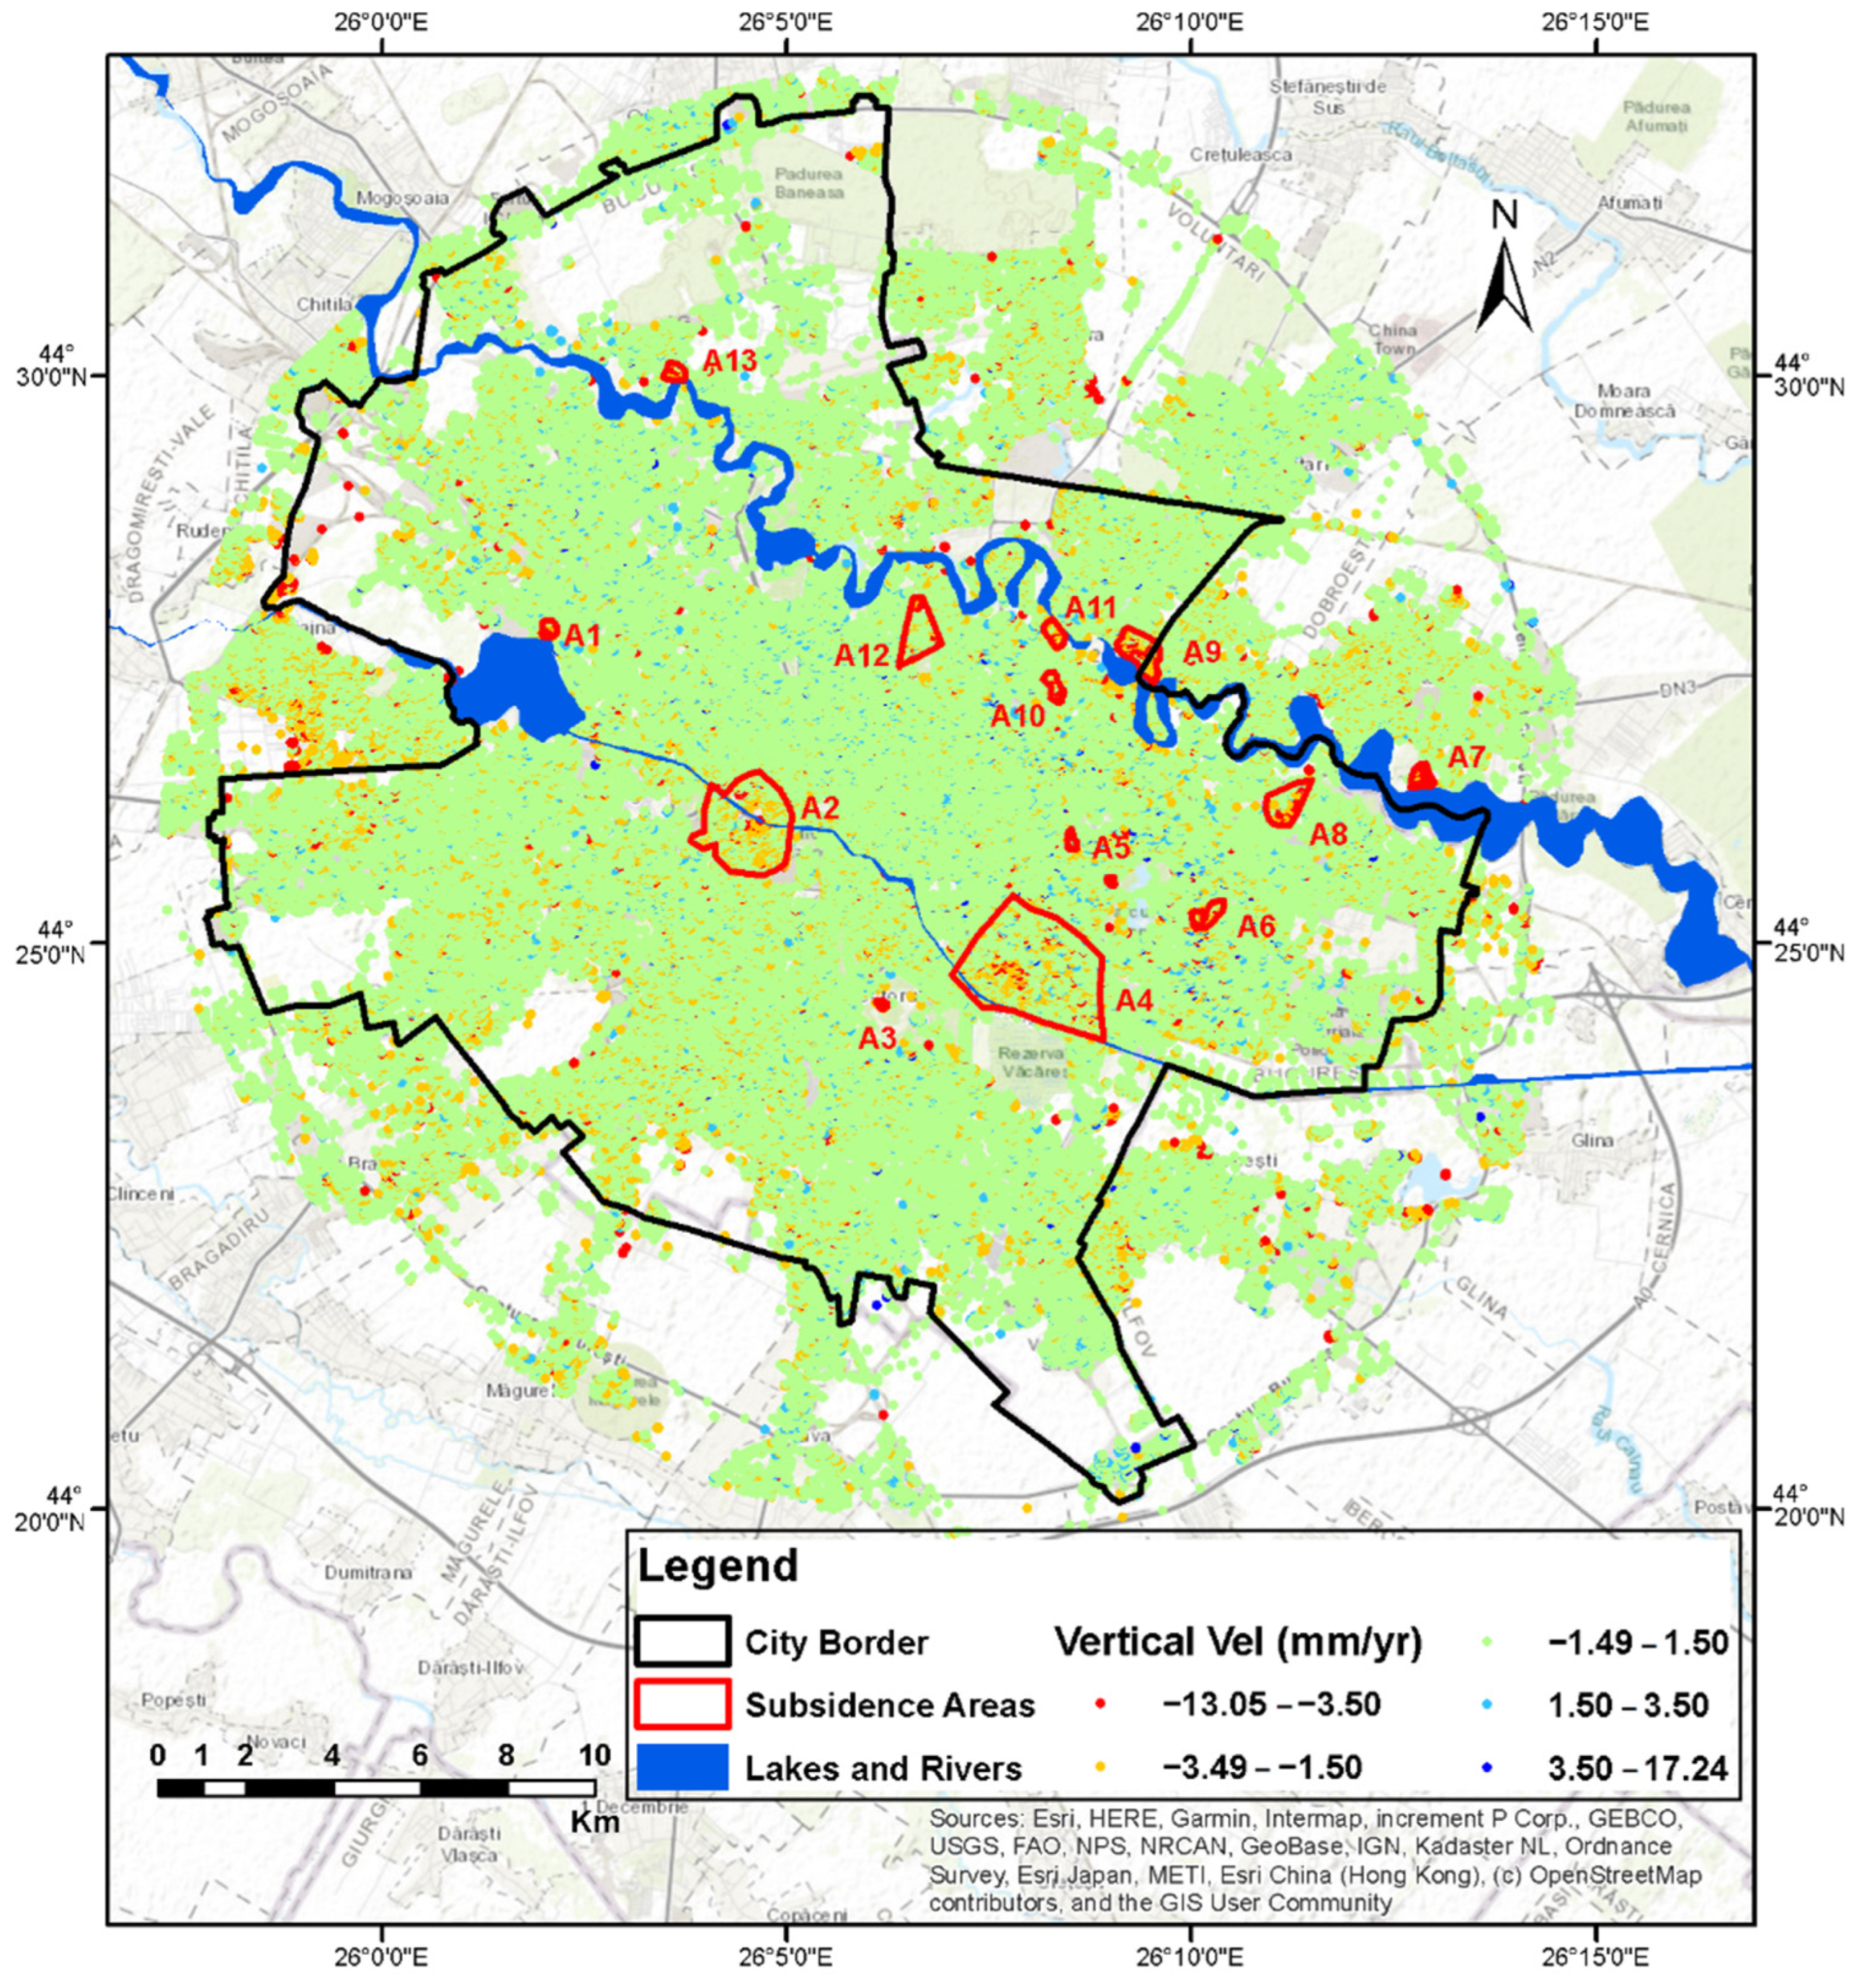
Several areas showing subsidence on the PSI map have been outlined: even the general trend of the city of Bucharest for the period 2014–2018 showed stability. Most of these areas are located along the corridors of each the two rivers crossing the city. Figure 4 illustrates the PSI map of vertical land displacements obtained using Sentinel-1 images. They are classified according to several criteria, depending on the main triggering factor, as it is shown in Table 2.
Figure 4.
PSI map of vertical land displacements in Bucharest city (obtained from Sentinel-1 images) and the identified subsidence areas (modified after [38]). Map generated in Esri® ArcMap™ 10.3. Source: elaborated by the authors.
Table 2.
Areas with identified displacements (modified after [28]).
To understand main the phenomena and processes that take place along the Colentina River corridor, several types of data sources were used. These include data describing natural environment of the area, geographical and urban conditions, and hydrogeological, hydrological, and geotechnics information. Table 3 mentions data types and information along with their sources used in the analysis.
Table 3.
Data types and sources (modified after [28]).
In addition to the SAR products used for radar interferometry, which use phase information, SAR images also contain amplitude information that can be used for other types of analysis. Thus, through the Interferometric Wide Swath (IW) mode of operation, in addition to the SLC (Single Look Complex) products used for interferometry, Sentinel-1 sensors provide GRD (Ground Range Detected) products. By using this type of product, it is possible to analyze the land-cover surface changes between the times of acquisition of the first image and second images. For consistency with previous land displacement analyzes, in which Sentinel-1 SLC data were acquired between October 2014 and April 2018, two Sentinel-1 GRD images were used to detect changes: the first from 25 October 2014, and the second from 25 April 2018 [38]. The data were downloaded free of charge from the Copernicus Open Access Hub [35].
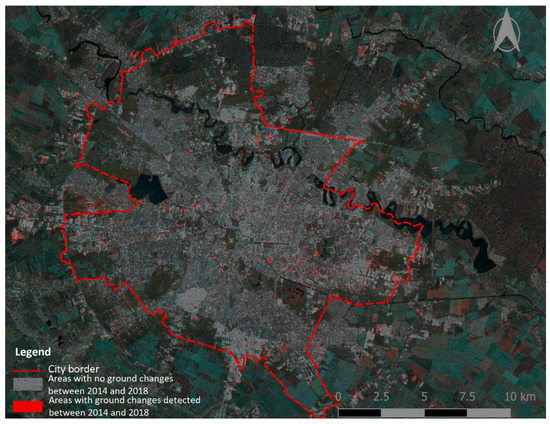
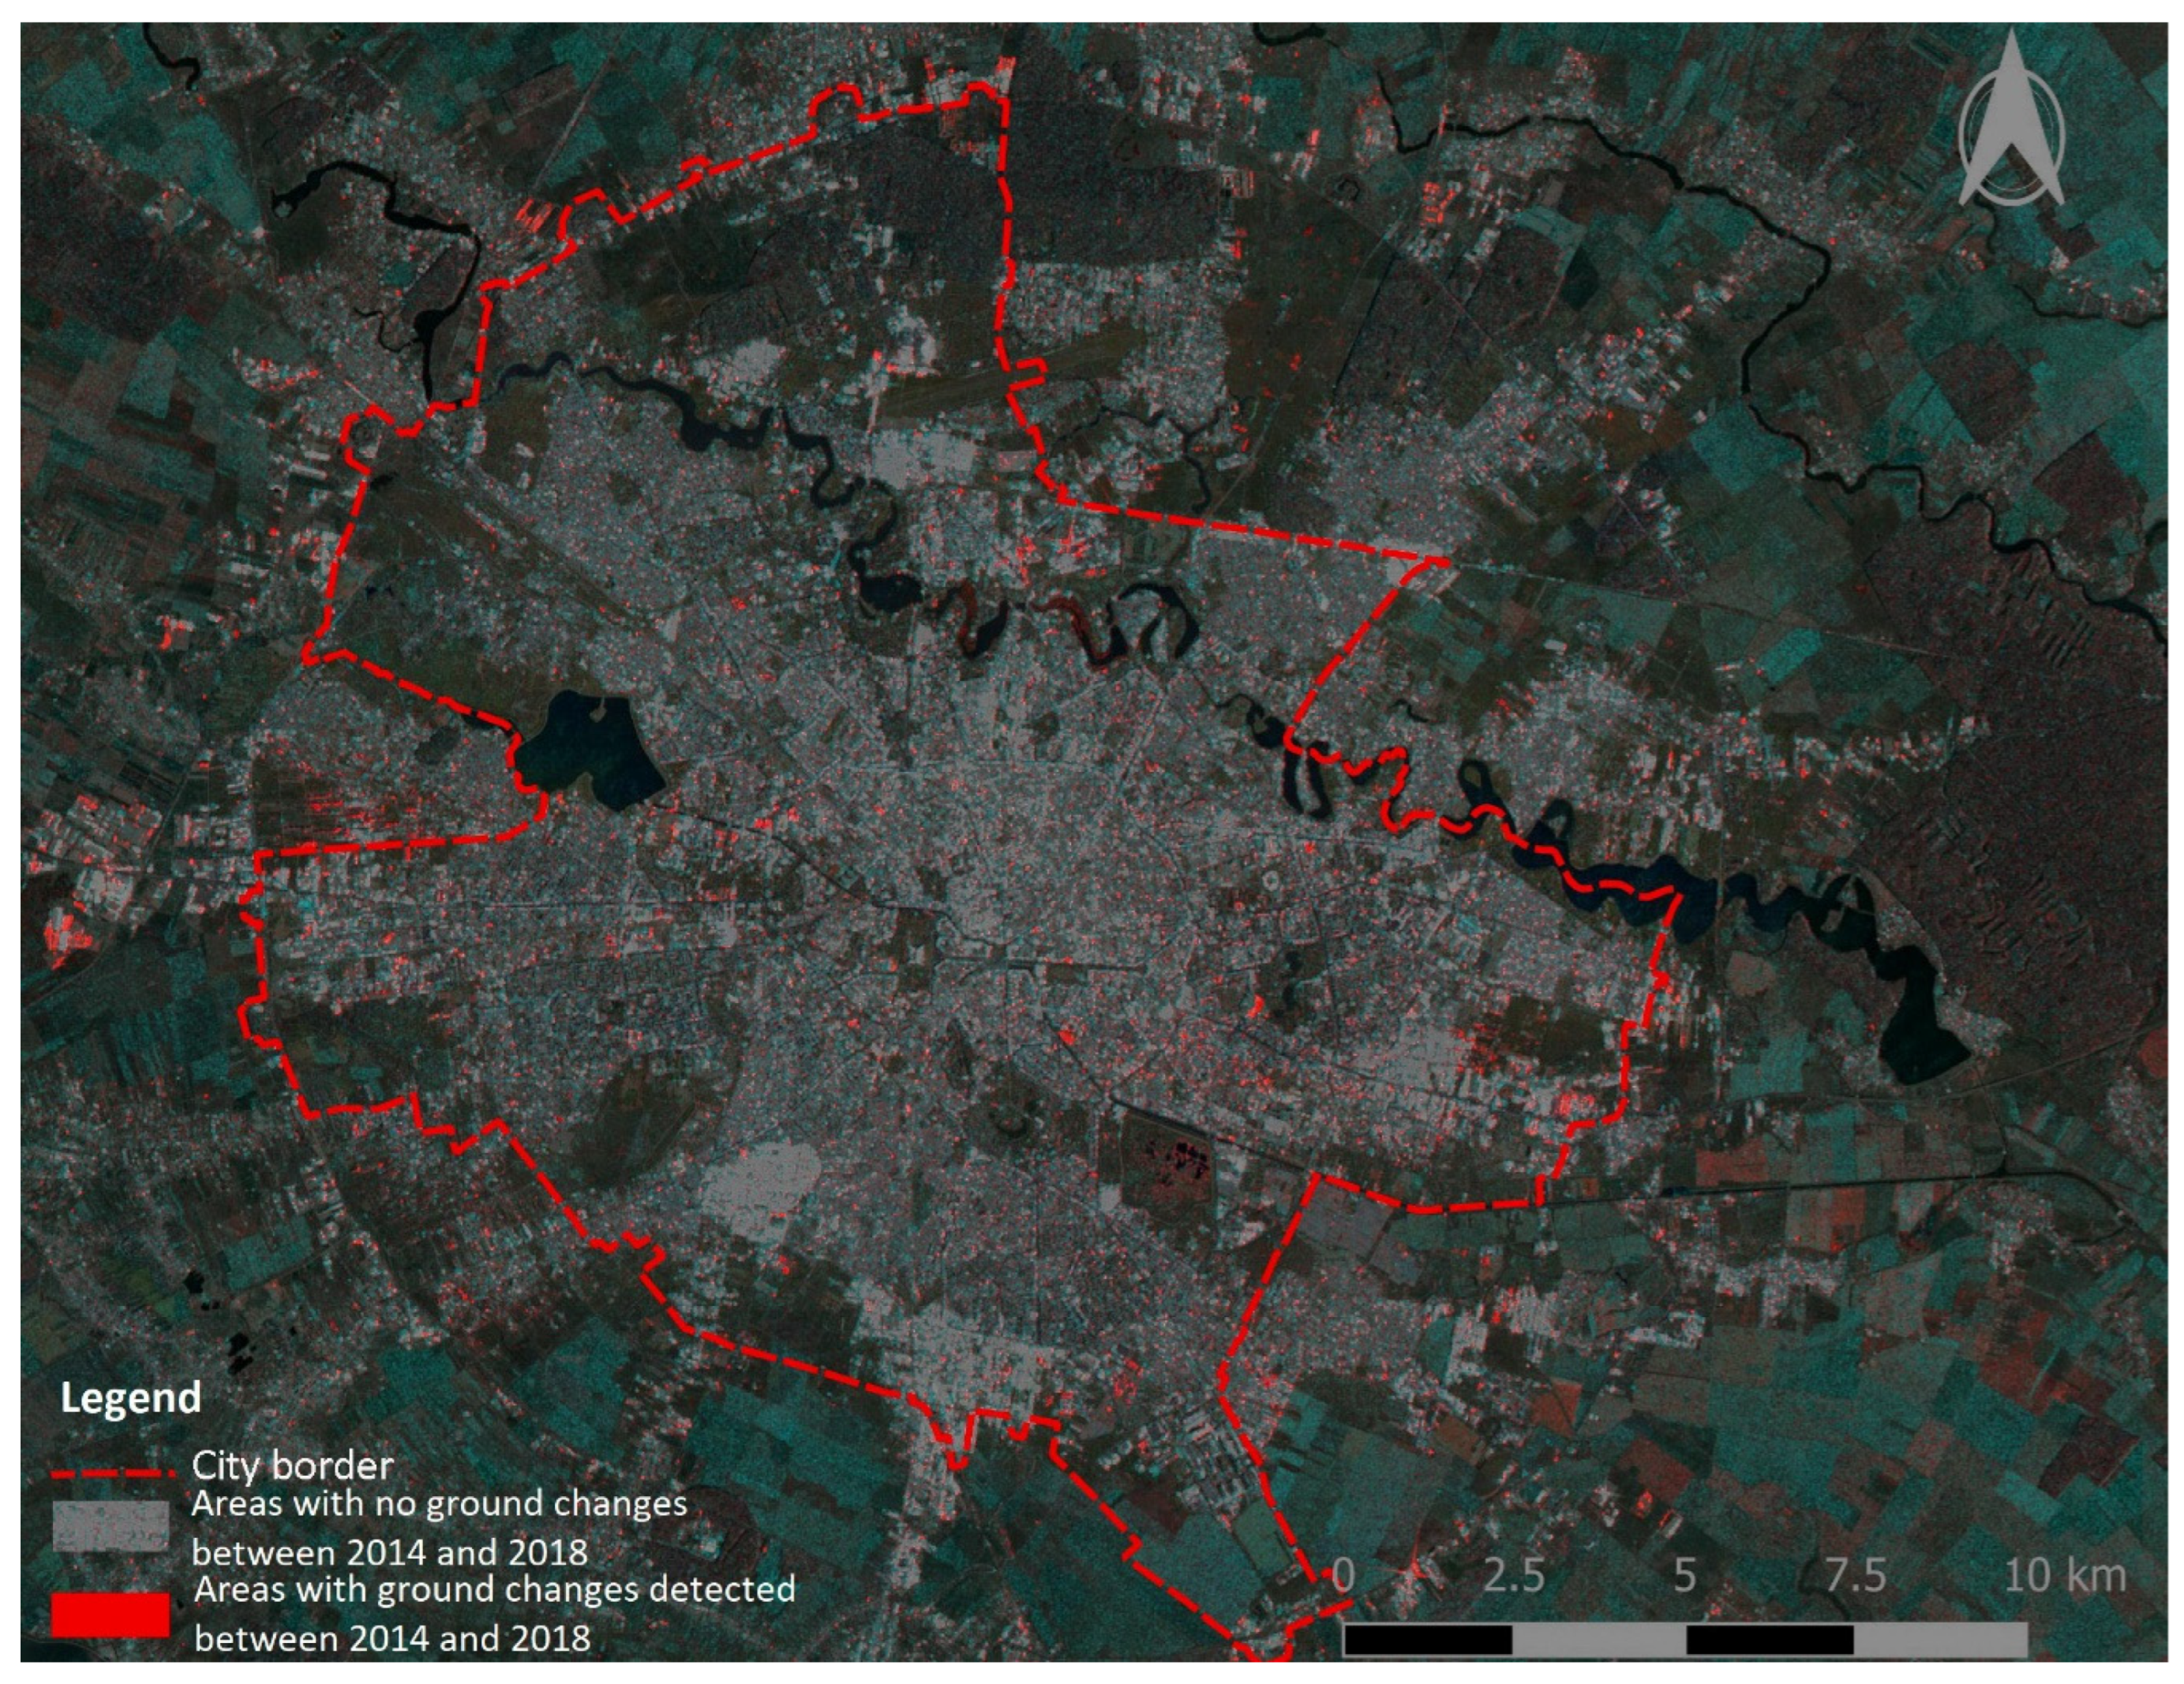
Figure 5 shows the land-cover changes detection map generated for Bucharest. The areas where changes occurred in 2018 in respect to 2014 are marked in red. Areas where no changes occurred between the two moments of time are symbolized in gray tones. Water bodies have a high reflectivity, and the backscatter towards the radar is low; therefore, the lakes and rivers appear dark on the map. Ground changes are encountered mainly in areas where new residences (e.g., the western border of Bucharest city) or commercial centers are built. More details on the methodology and change detection trends in Bucharest city, considering the 2014–2018 time interval, are presented in [43].
Figure 5.
Detection map of land surface changes for Bucharest (2014–2018), obtained from Sentinel-1 GRD images (modified after [28]). Gray tones symbolize areas where no changes were detected between 2014 and 2018. Areas where ground changes occurred between 2014 and 2018 are symbolized in red. Water bodies are shown on the map in dark tones. Map generated using ESA SNAP (Sentinel Application Platform) and QGIS open-source software. Source: elaborated by the authors.
3. Discussion of Urban Planning and Subsidence
3.1. Analysis of the Current Urban Planning and Development Plans in Romania
The analysis performed by the authors on the urban planning and development documentation emphasizes that groundwater information is not regularly mentioned in the urban planning documentation of the 17 cities [44,45,46,47,48,49,50,51,52,53,54,55,56,57,58,59,60]. According to the Romanian legislation, the plans are based on support studies, but only the main planner decides which studies are required. The information from the support studies is incorporated into the general report. Only in some cases such as Iasi, Braila, Bacau, Ploiesti, and Pitesti [44,45,48,50] do the plans include geotechnical or hydrogeological analysis. In some cases, even if these studies include the hydrological component, they only refer to surface water (for example, the city of Bacau [45]), thus outlining the areas that are unsuitable for construction due to the risk of floods or erosion.
In other cases, for example the city of Pitesti [50], the local planning regulation accompanying the plan, which takes the information from the support study, provides measures to encourage building on difficult foundation sites. For example, underground parking areas are allowed to be built if the beneficiary can prove that the terrain has difficult foundation conditions, including high groundwater levels. The proof is presented by the significant comparative costs estimated for both underground and surface options, supported by geotechnical or hydrogeological studies.
In some cases, for example the Manta Roșie district of Iasi city (where new high buildings have been constructed) [44], although the problem of a high groundwater level flooding the cellars of old houses is acknowledged in the general report of the urban planning documentation, the associated regulation does not prescribe specific construction restrictions nor recommend specific measures to improve the urban hydrogeological conditions. Although recently elaborated, other general urban plans for the cities of Braila, Galati, Timisoara, and Sibiu [47,48,52,58] incorporate only generic statements of the current legislation (General Urban Planning Regulation adopted by Government Decision 525/1996, updated in 2002), namely that, in the “constructions are allowed in the buffer protection zone of the rail transport infrastructure if all measures triggering landslides, subsidence, or altering the groundwater table, are provided”.
For Bucharest, the analysis of the studied strategies and General Urban Plan [60,61,62] concluded that information related to groundwater is not considered.
3.2. Analysis of the Subsidence Trigerring Factors in Colentina River Corridor
The study area has been defined by using a buffer zone of 1 km on both banks of the Colentina River. It starts from the northwest area of Bucharest, from the entrance to Herăstrău Lake, and ends at the exit of Pantelimon II Lake, in the southeastern part of the municipality (Figure 3).
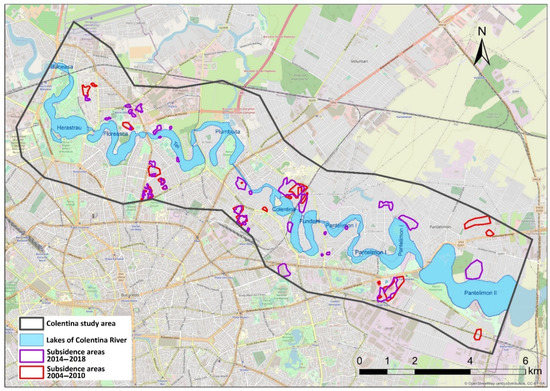
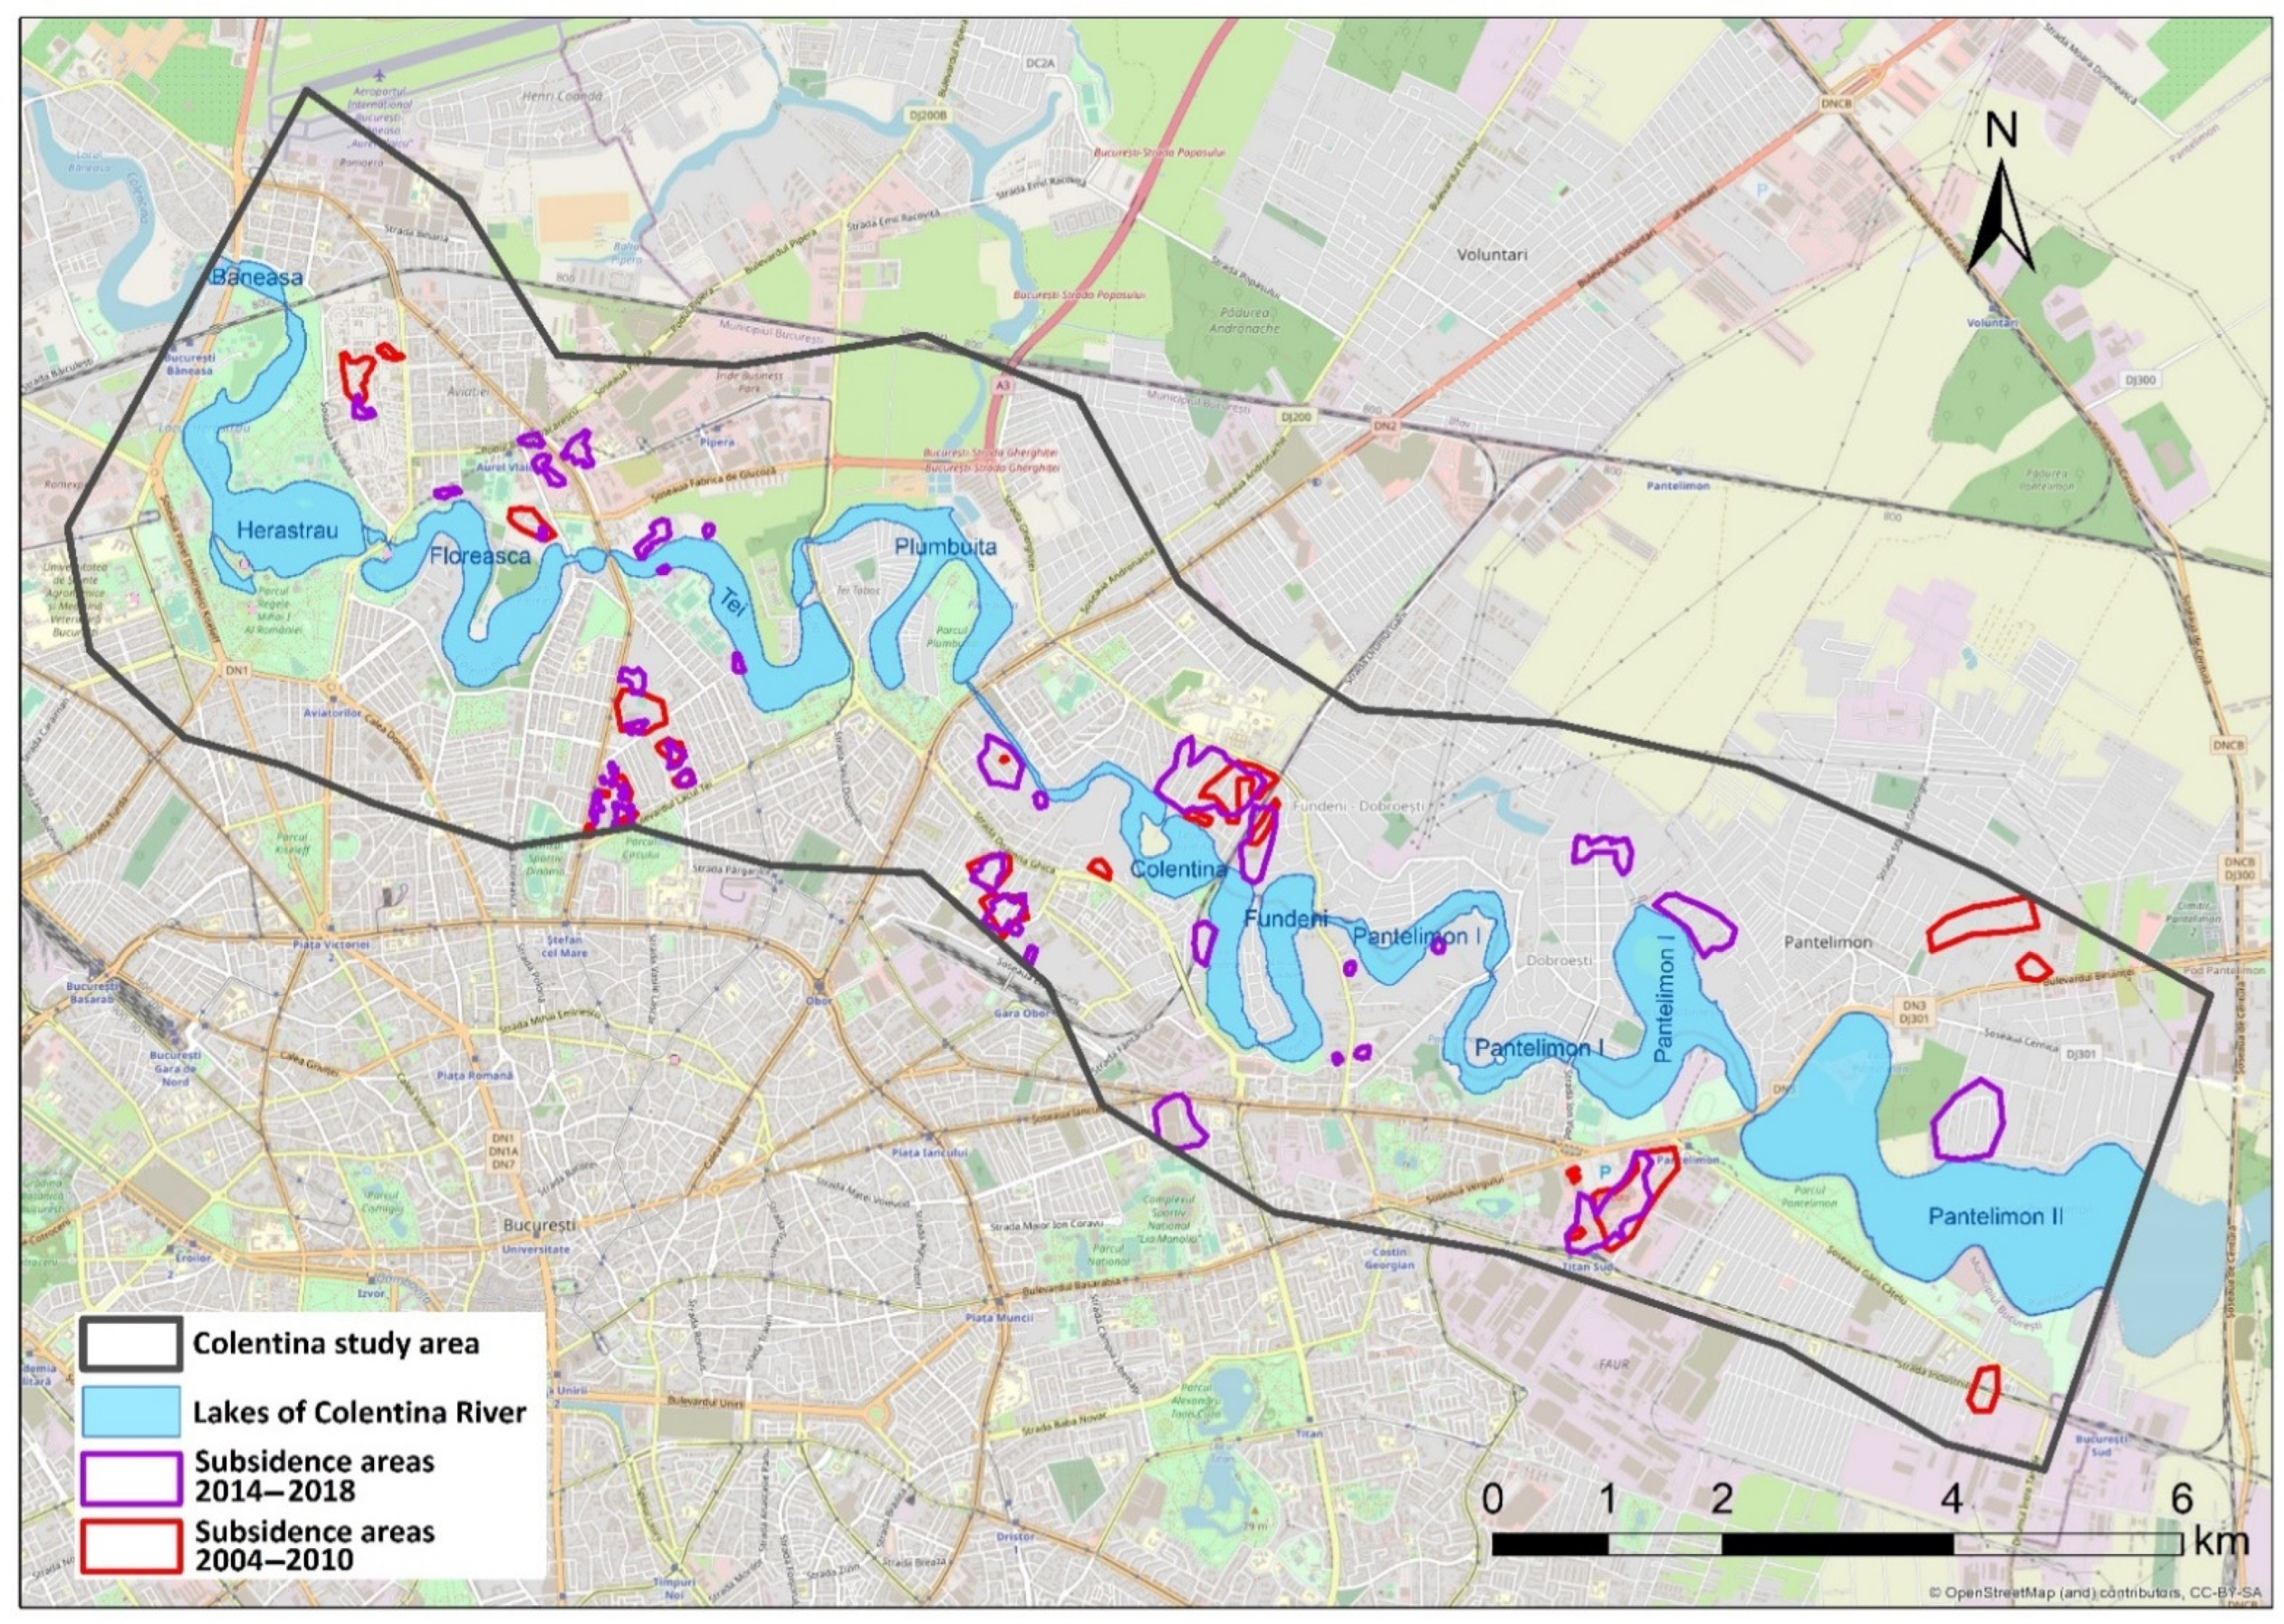
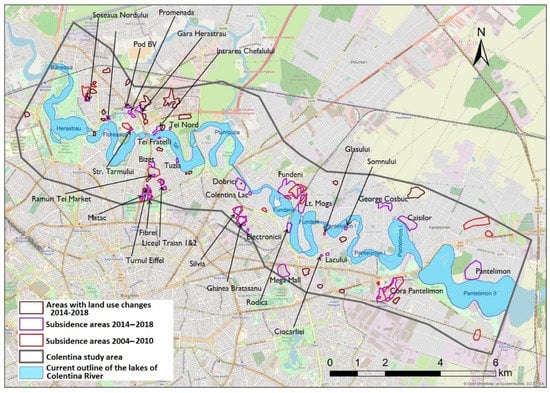
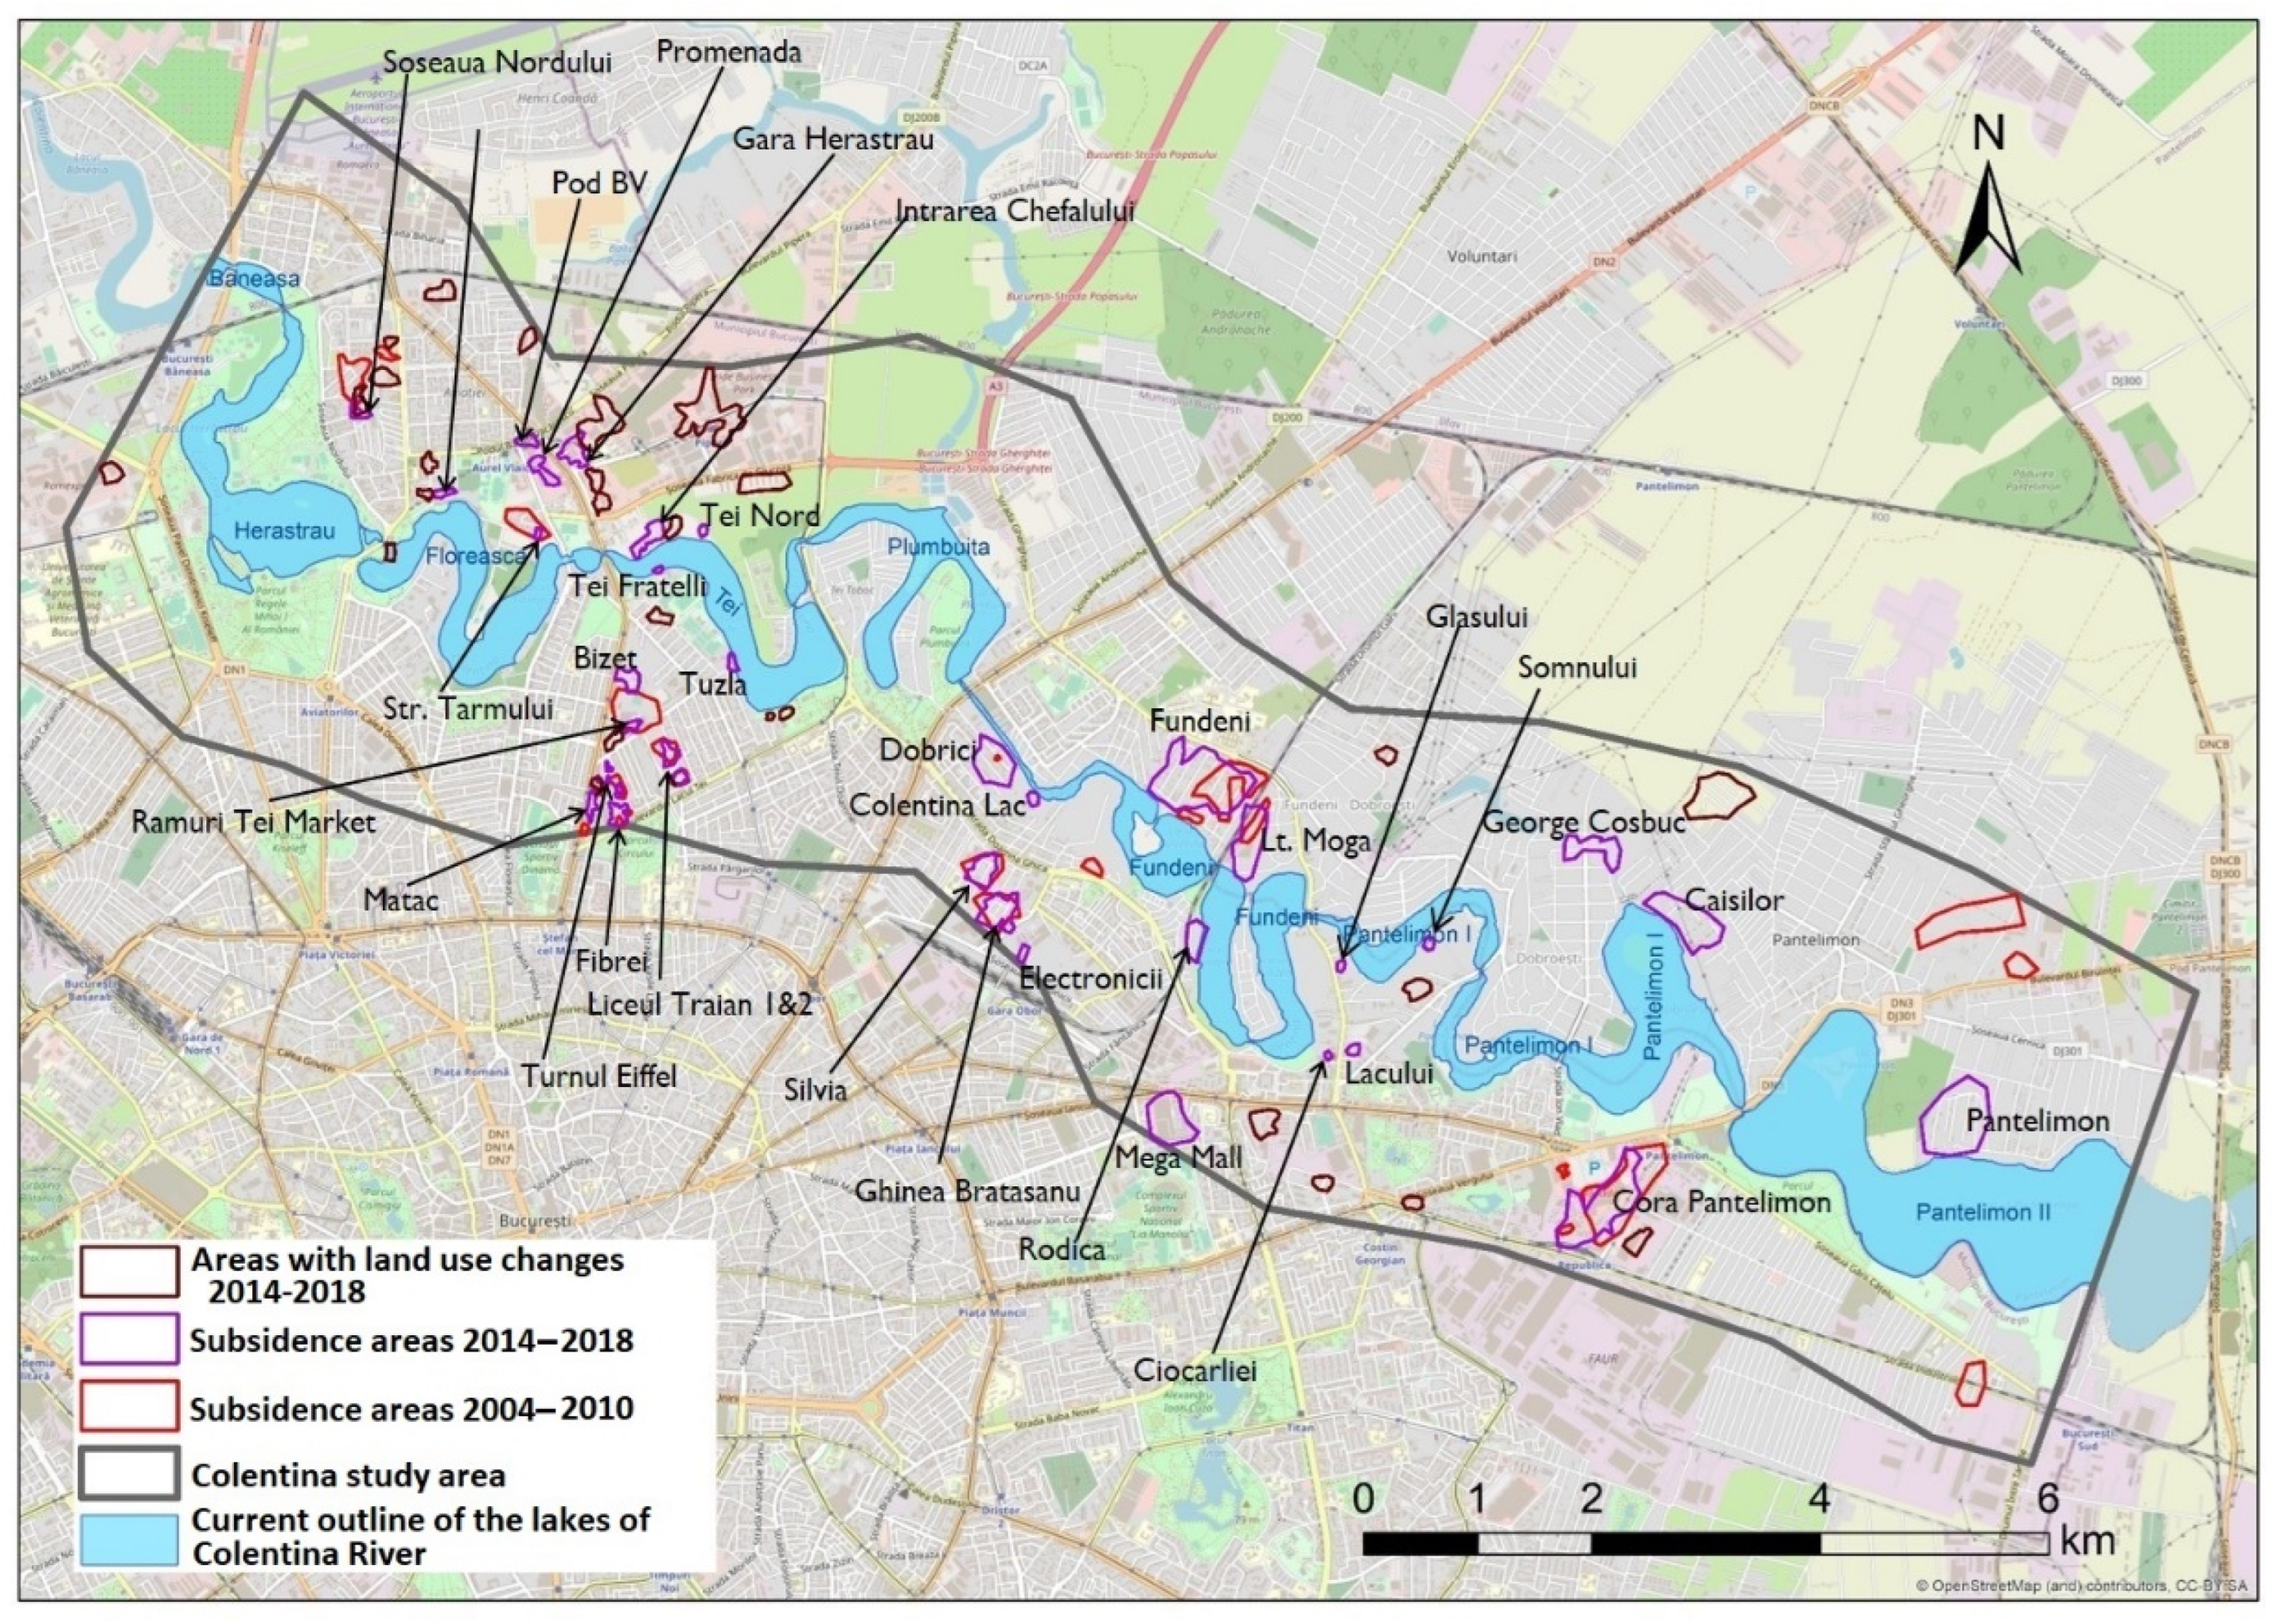
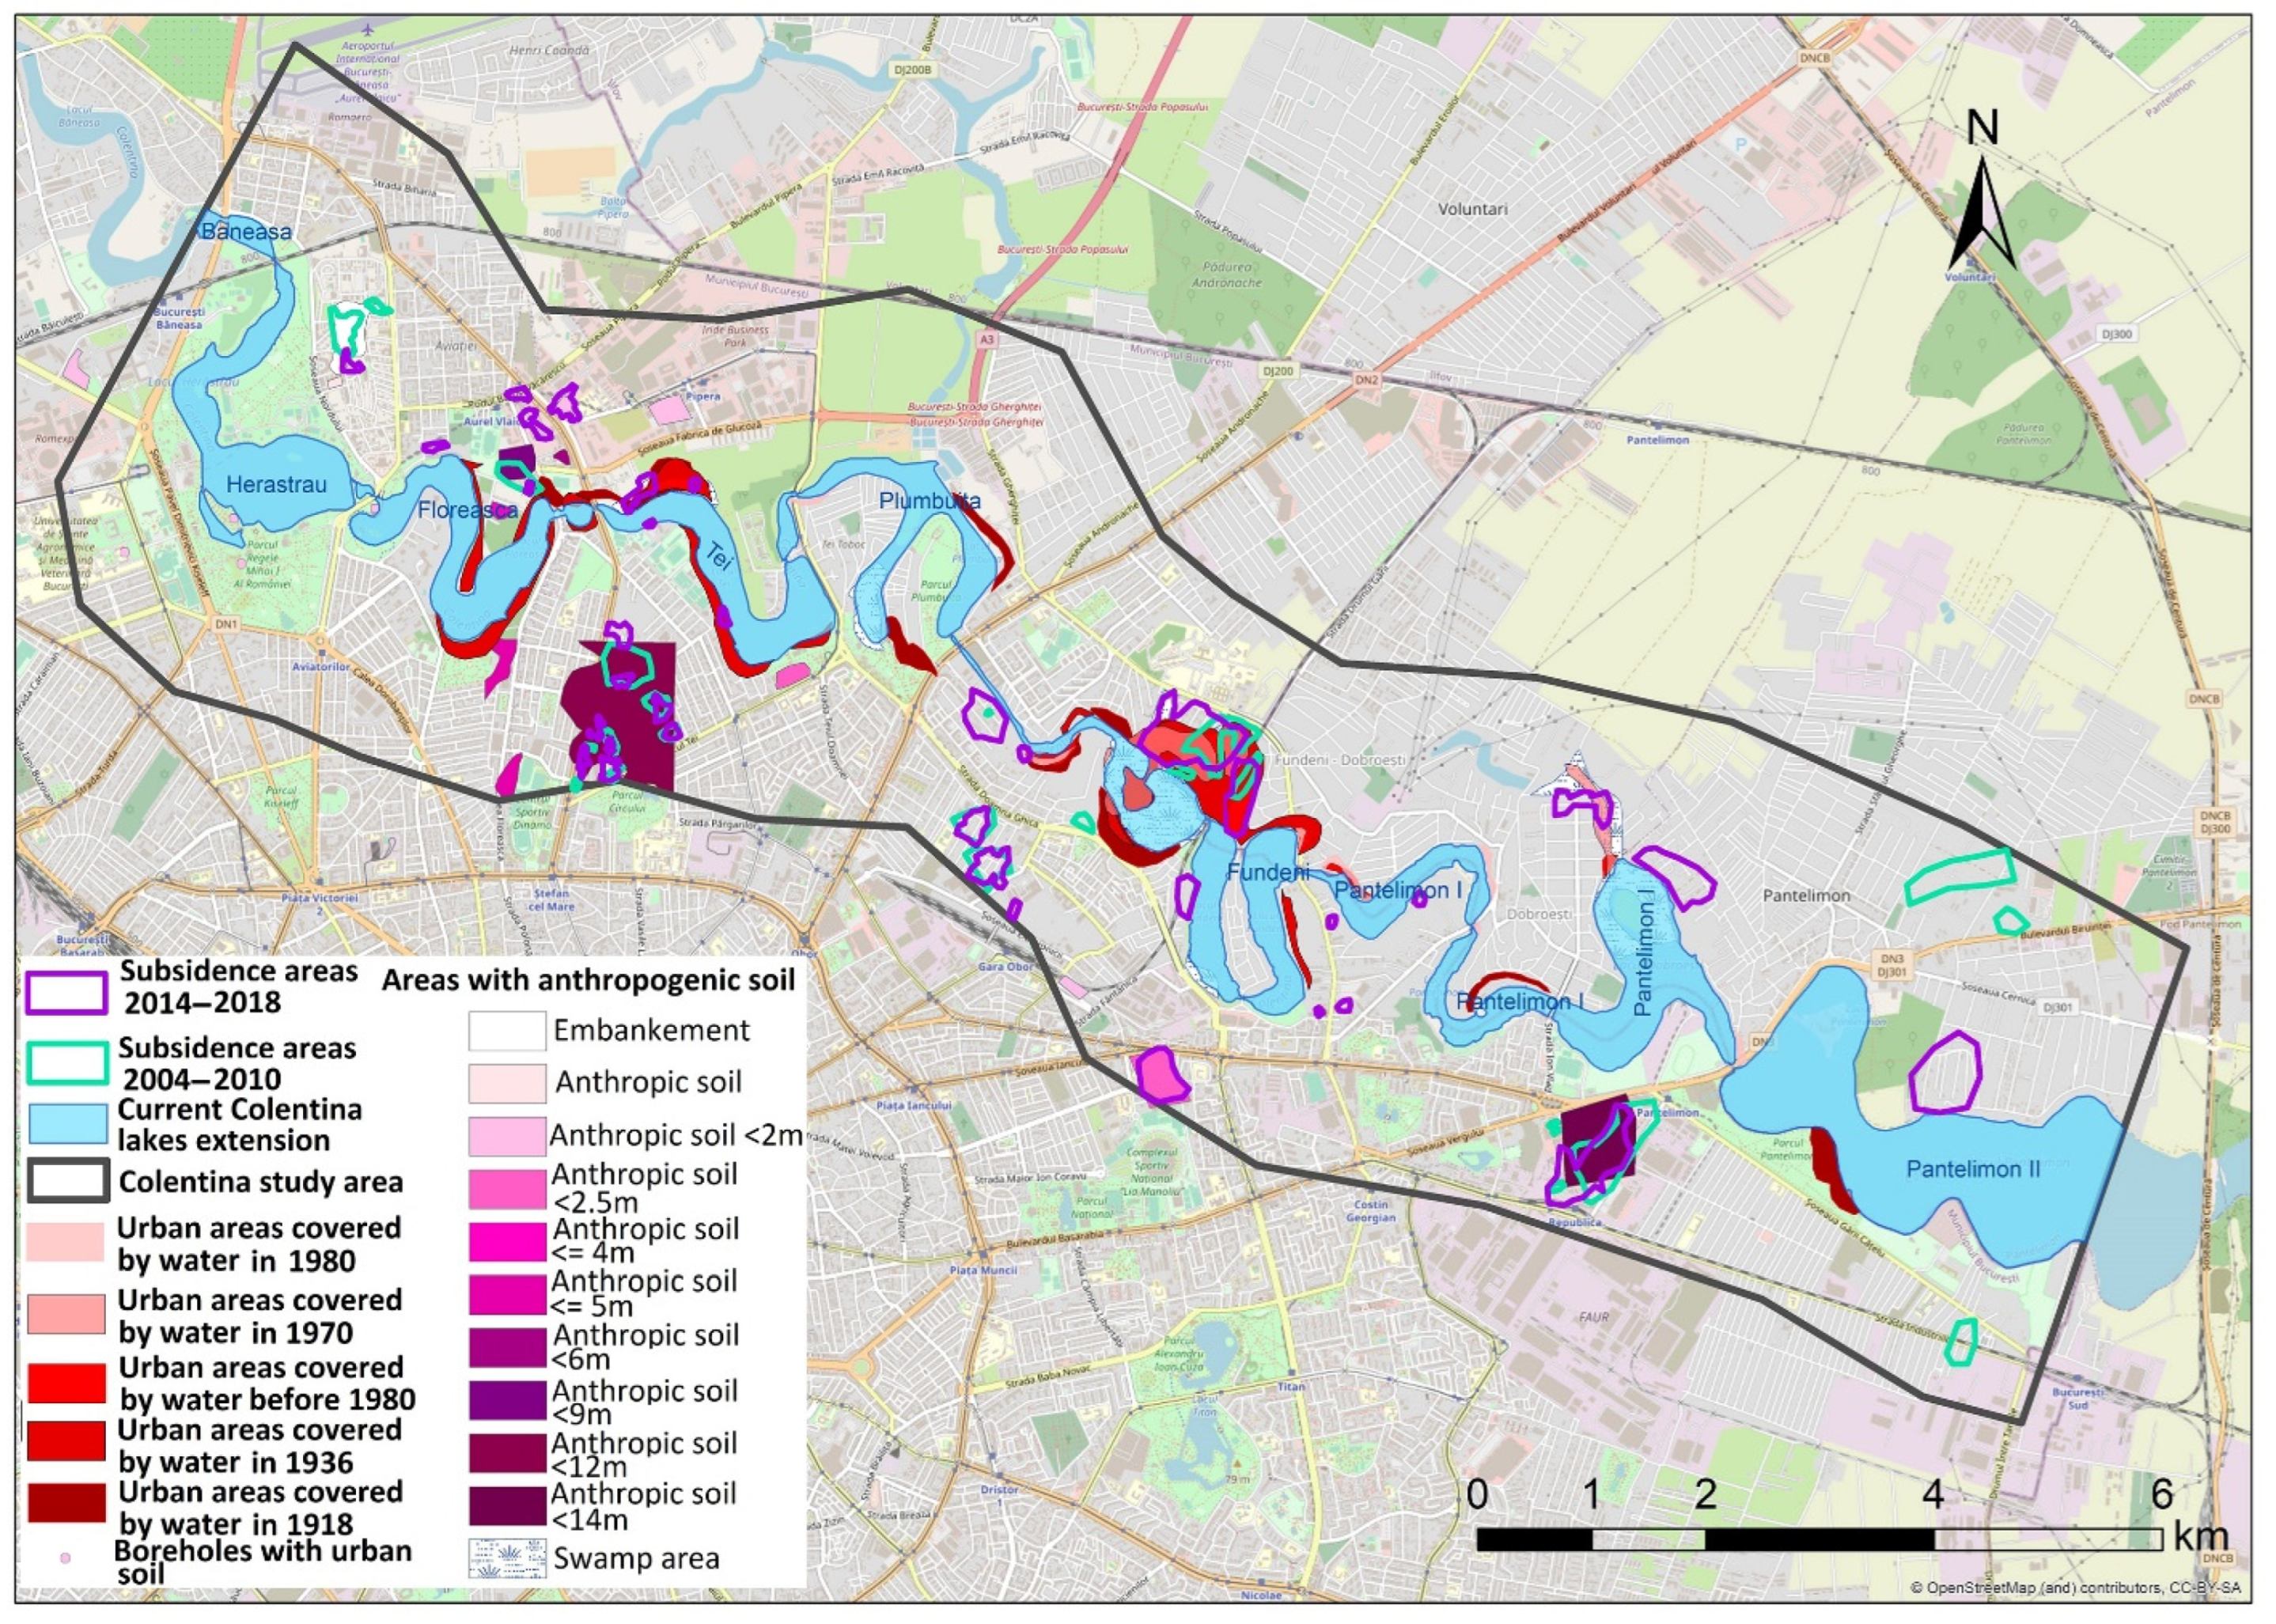
Based on the vertical displacement PSI maps of the land surface for the 2004–2010 and 2014–2018 intervals, it was possible to analyze the evolution of vertical displacements in the Colentina study area. Figure 6 shows the evolution of the terrain instability in the studied area. The areas that presented subsidence during the period from 2004–2010 are highlighted in red. Areas with negative vertical displacements during the period from 2014–2018 are outlined in purple [28]. In most of the cases, in the immediate vicinity, the areas overlap during the two time intervals. This is the case for the areas situated on the right shore of the Tei, Colentina, and Pantelimon I Lakes, as well as some of those situated on the left shore of Floreasca and Colentina Lakes. For the subsidence areas situated on the right shore of Tei Lake, a detailed study is presented in [38], the main factors involved in the ground displacement process being the presence of a thick anthropic soil, the dynamics of the water supply losses in the area from 2006 to 2014, and the decrease in the area groundwater hydraulic head. For the 2014–2018 period, there are several areas showing subsidence without having a correspondent to the previous period from 2004–2010. These new subsidence areas occurred due to construction work extensions in areas where other categories of use were previously involved (e.g., the pasture area replaced by residential area in the area situated on the left shore of Pantelimon II Lake; the industrial area replaced by a commercial center in the area situated on the right shore of Fundeni Lake, near the border of the study area). The current extension of the lakes has been delineated using Open Street Map data [63].
Figure 6.
Subsidence areas in the Colentina River buffer zone, for the time intervals 2004–2010 and 2014–2018 [28]. Map generated in Esri® ArcMap™ 10.3. Base map source: OpenStreetMap. Source: elaborated by the authors.
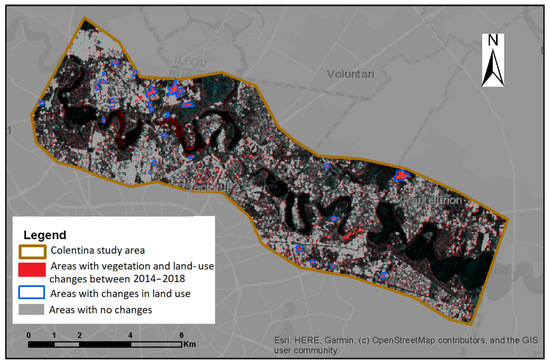
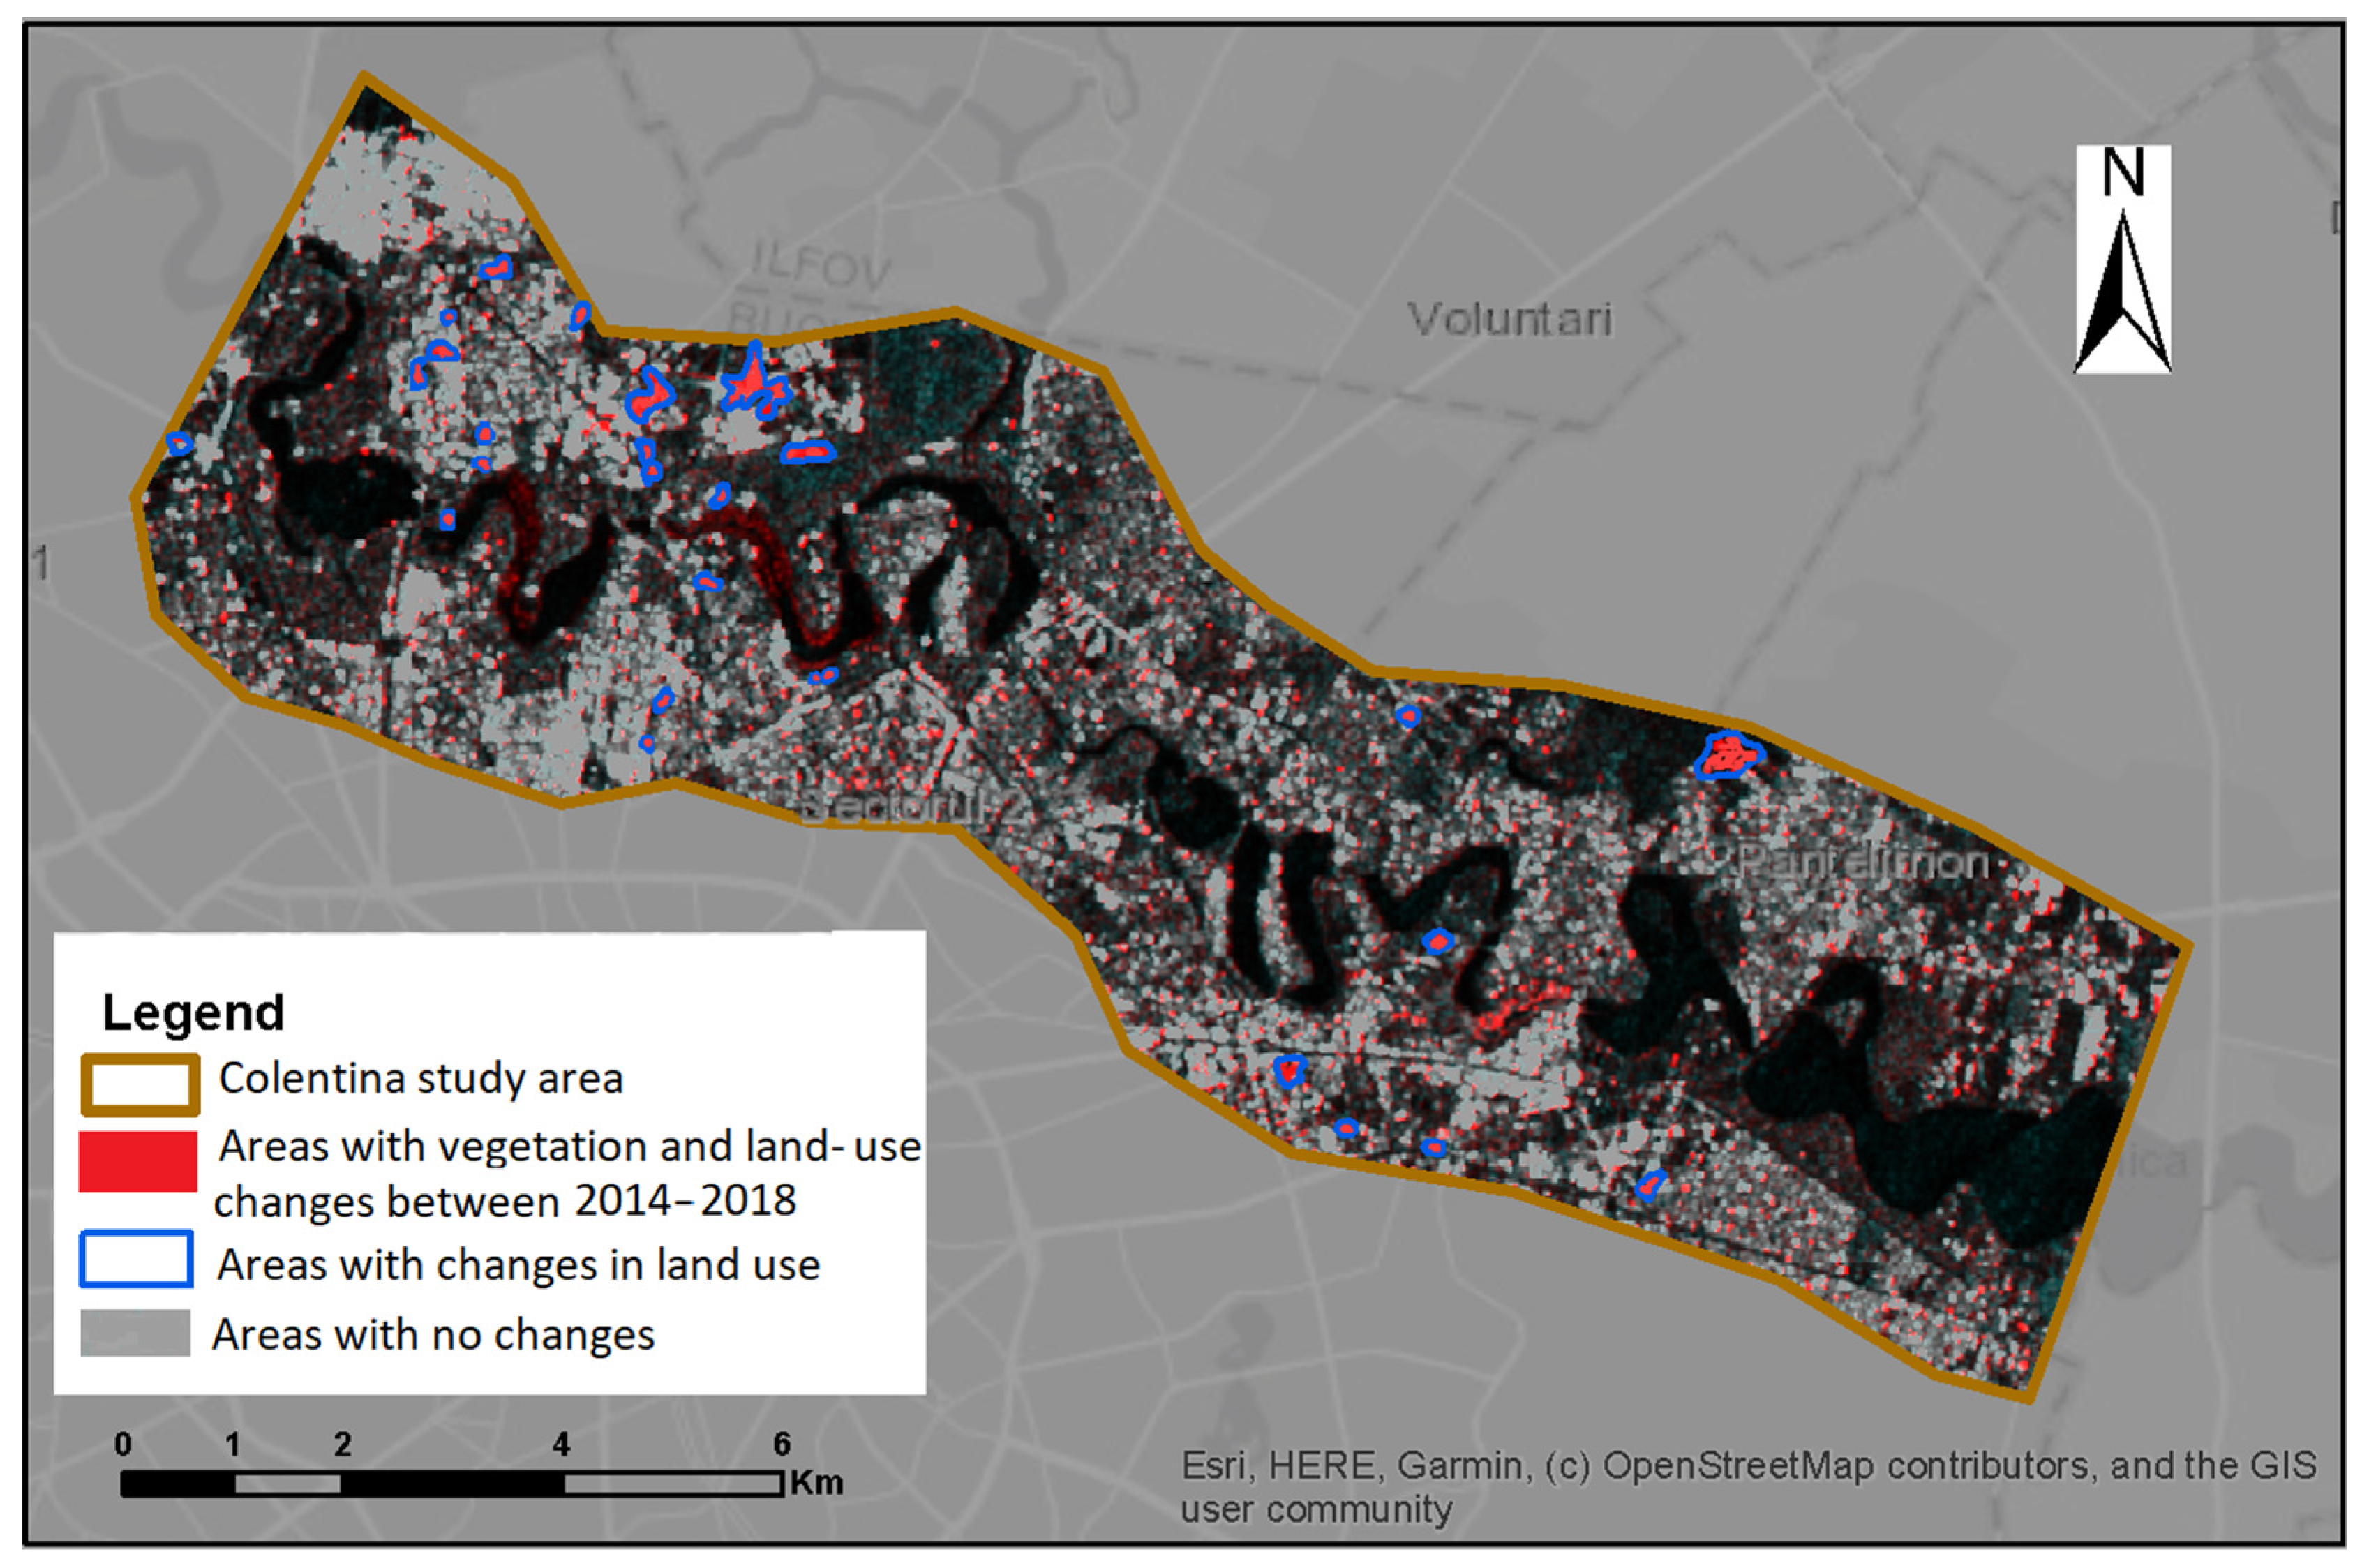
From the land-cover change detection map generated from Sentinel-1 GRD data for the Colentina River buffer zone, the areas where land use changes occurred during 2014–2018 have been identified. Figure 7 shows the map for determining the land-cover changes, along with these areas. The identified areas are marked in blue.
Figure 7.
Land-cover changes for the Colentina River buffer zone modified after [28]. Map generated in Esri® ArcMap™ 10.3. Base map source: ESRI. Source: elaborated by the authors.
These areas include:
- Areas covered with vegetation in 2014 on which high buildings (residential complexes) were built until 2018;
- Areas covered with vegetation in 2014, which were transformed into residential districts with houses until 2018;
- Areas where infrastructure elements have been developed (e.g., parking extensions, construction of new parking lots for already built buildings);
- Areas with buildings that have been demolished and where new buildings have been built;
- Areas covered with construction sites where the works were completed by 2018 [28].
Figure 8 shows the areas with land-cover changes during 2014–2018 (marked in brown) as well as the areas showing vertical displacement during the two studied time intervals, 2004–2010 (red color) and 2014–2018 (purple). Some areas with land-cover changes are independent of areas with subsidence or uplift. However, it is evident that there are also areas where the two types of phenomena occur in the immediate vicinity. In many cases, this happens due to the extension of construction work into distinct residential areas. The combined analysis of the two types of phenomena can help when looking for the factors generating subsidence and their localization. As an example, for the Intrarea Chefalului area, situated on the left shore of Tei Lake, near the area indicating subsidence, on the northeast, there is an area where changes were detected. The values of negative subsidence are higher on the border of the two types of areas. From the other available information, it was evident that in the area with land changes detected, construction work took place and was finalized in mid-2019. This work can contribute to the ground displacement values in the neighboring area.
Figure 8.
Areas showing land-cover changes and vertical displacements for the periods 2004–2010 and 2014–2018. Map generated in Esri® ArcMap™ 10.3. Base map source: OpenStreetMap. Source: elaborated by the authors.
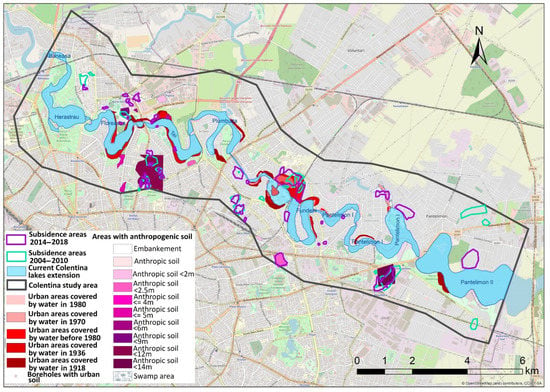
The map presented by Figure 9 brings together both areas with potential instability and areas showing land-cover changes, and areas with negative vertical displacements determined from PSI maps generated from Sentinel-1 data for 2014–2018 and ENVISAT ASAR data for 2004–2010. Most of the subsidence areas, both for the 2004–2010 and 2014–2018 periods, are in regions that have been determined to have the potential for instability, generated by construction activity and outlined by the land-cover changes or historical activities in terms of quarries for building materials or similar. In the vicinity of the lakes of Colentina, an important land-cover change yet to be mentioned is the drainage of some areas which in the past were part of the lakes of Colentina and are now urban areas. These are highlighted in shades of red in Figure 9. In some areas (e.g., the embankment zone of Șoseaua Nordului), partial stabilization of the area could occurred between the analyzed time intervals due to the interruption of the construction works or by completion of the buildings settlement processes.
Figure 9.
Areas showing subsidence and instability potential. Map generated in Esri® ArcMap™ 10.3. Base map source: OpenStreetMap. Source: elaborated by the authors.
Four of the 37 instability areas are further discussed, namely Promenada, Pod BV, Gara Herastrau, and Soseaua Nordului. Table 4 provides the processed information used in the analysis: the name of the area; Sentinel-1 orbit used to generate the PSI map; the behavior of the area during the period 2004–2010; the average annual velocity along the line of sight (LOS); the distance between the centroid of the area and the lakes; the presence of anthropogenic soil and its thickness; the thickness of the loess layer; the previous area situation (water or swamp cover identified in the historical maps); the presence of a career of construction materials used in the past; the geology of the area; the monitoring of borehole locations nearby each area; the depth of the shallow aquifer strata (Colentina gravels); the depth of the water table of the shallow aquifer (unconfined). Changes of the shallow aquifer groundwater hydraulic head matches the chained lake’s water level variation as their bed shows a direct hydraulic connection to the shallow aquifer.
Table 4.
Processed information for Promenada, Pod BV, Gara Herastrau, and Soseaua Nordului areas. Used data sources [28,38,41,64].
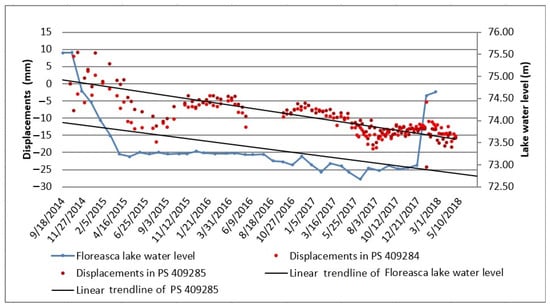
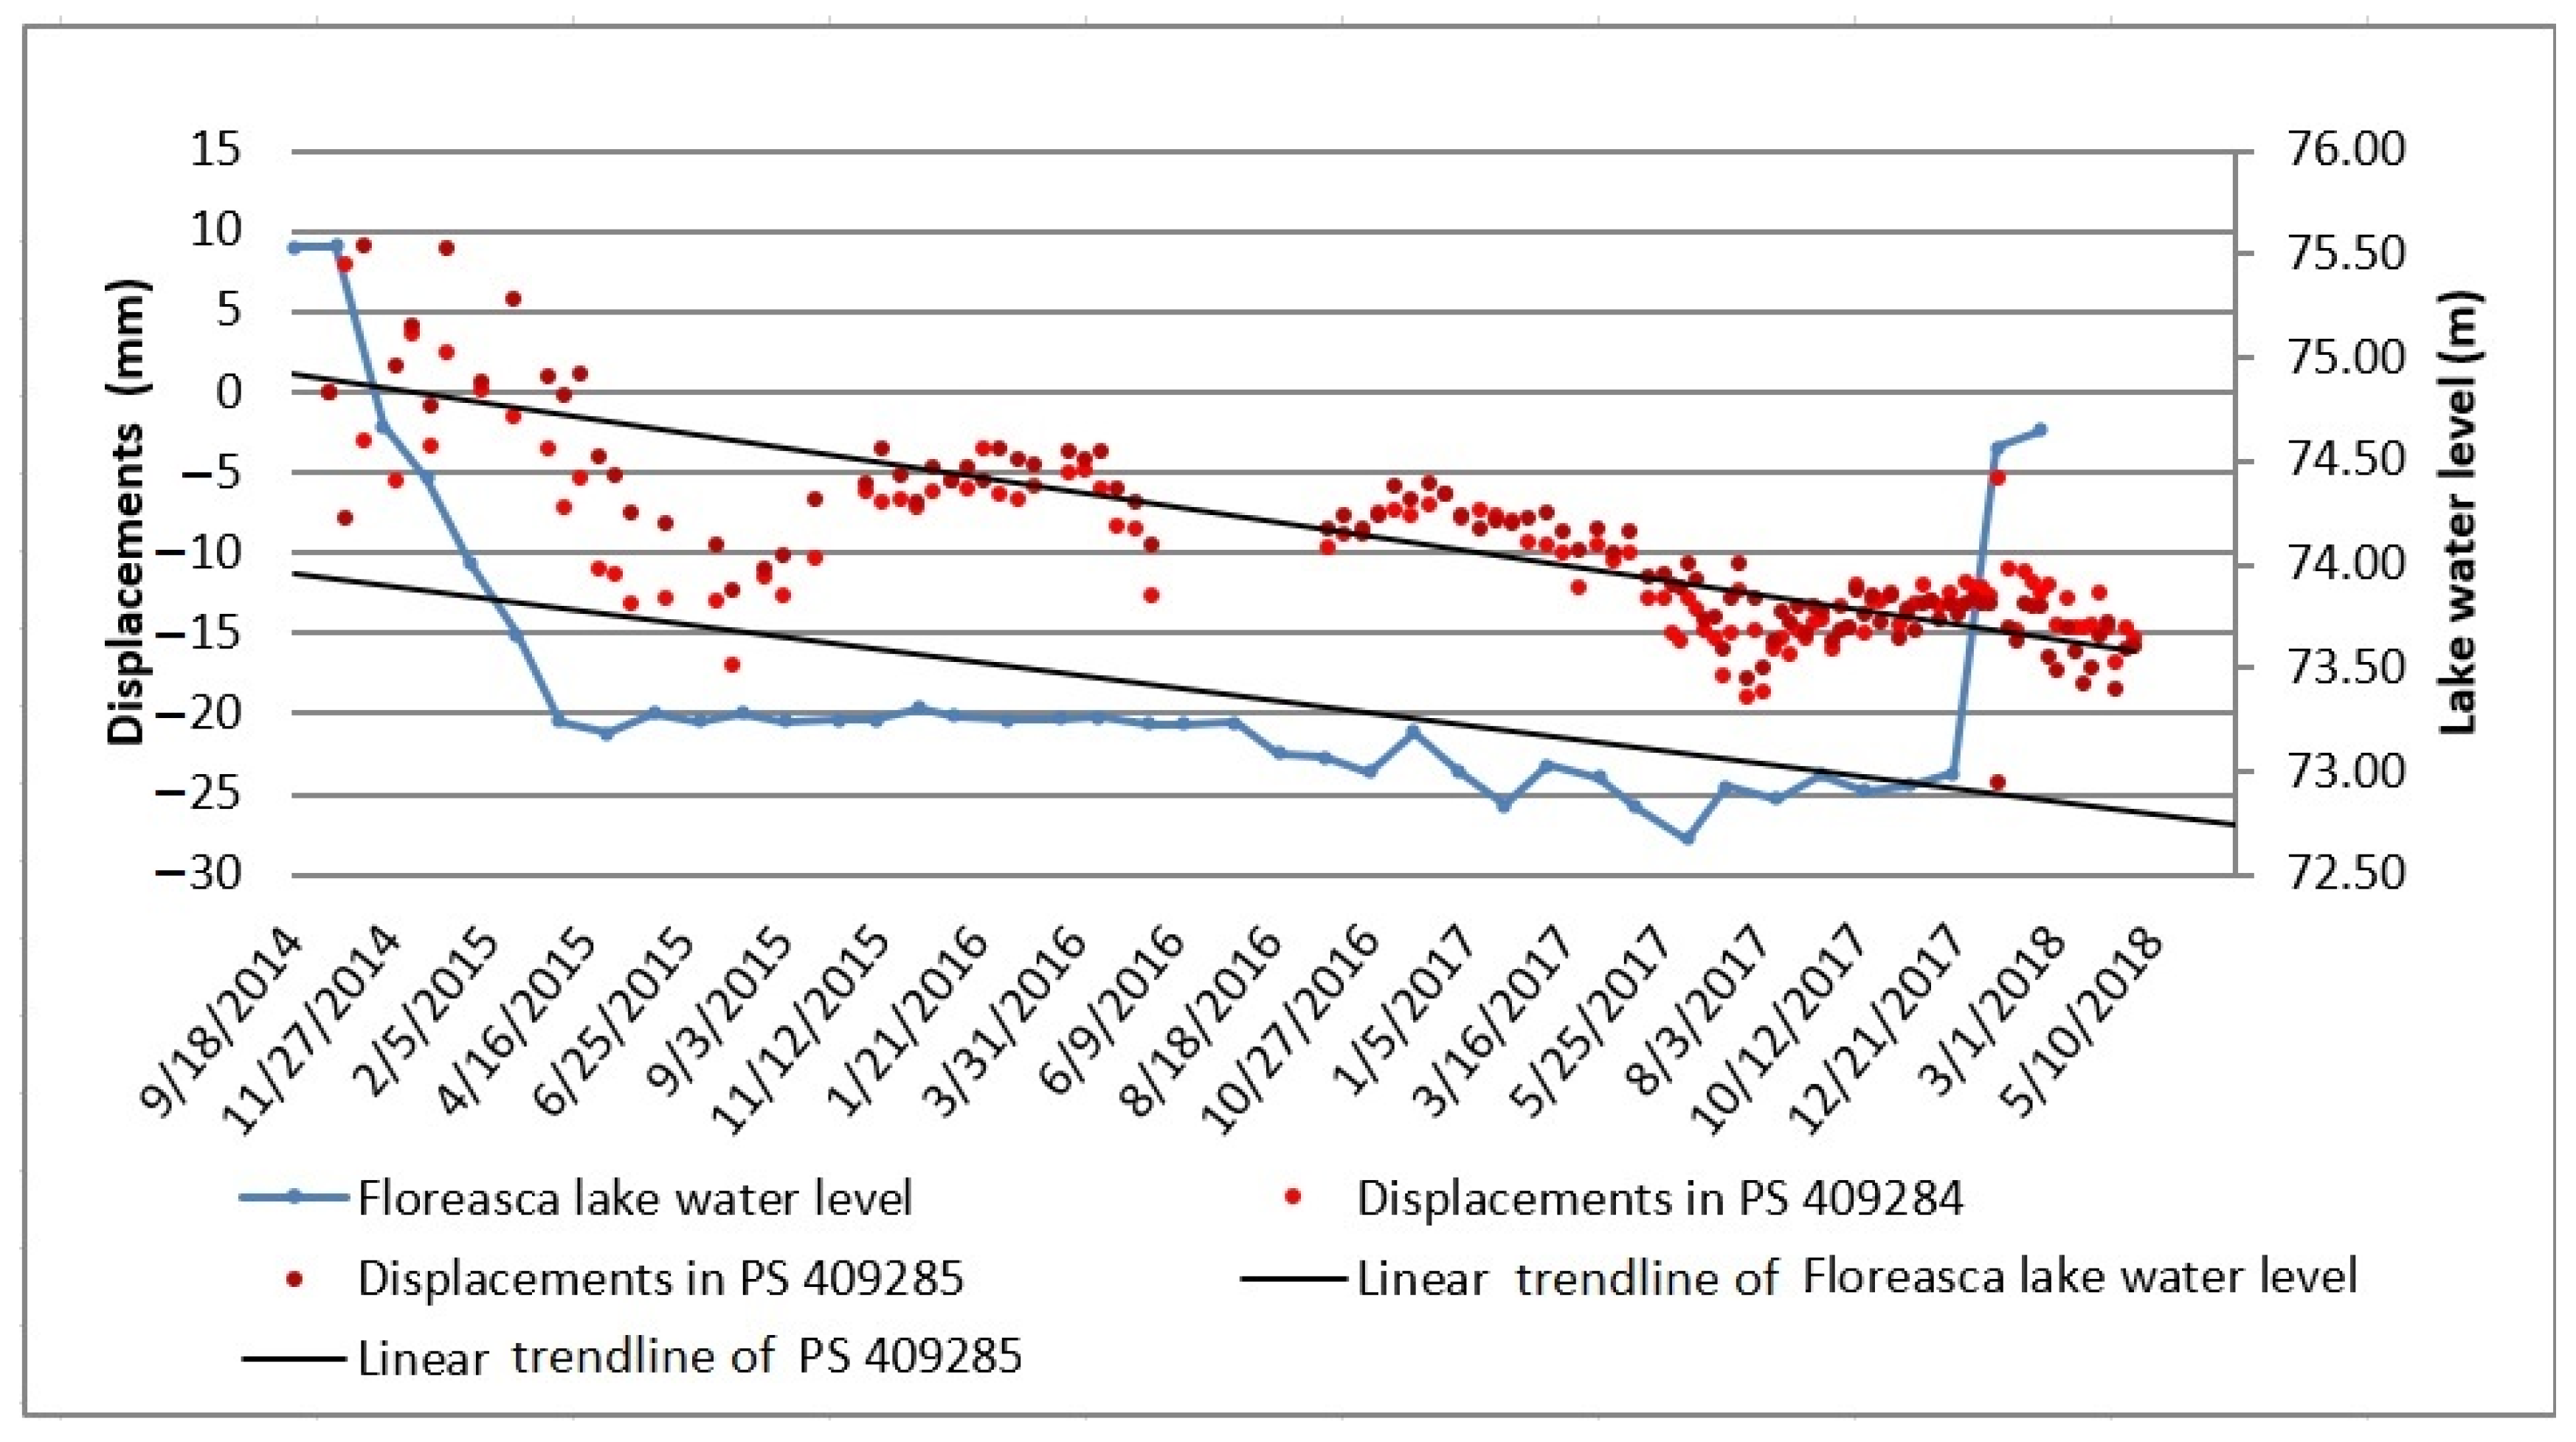
Located on the left bank of Lake Floreasca, at a distance of over 500 m, the areas Promenada, Pod BV, and Gara Herastrau (Figure 8) are characterized by the presence of anthropogenic deposits or as being used as the location for previous construction materials quarries. The construction work that carried on during the period preceding the 2014–2018 interval in these areas as well as in neighboring ones represent the identified land-cover changes. Most of these land-cover changes are related to the construction of high office buildings. Table 4 shows the comparison between the evolution of the water level in the Floreasca Lake and the evolution of the values of the vertical terrain displacement. Even for both, there is a general downward trend during the period when the water level of the Floreasca Lake decreased at a sharp pace; a steeper downward trend for vertical terrain displacements has been registered (Figure 10). Therefore, when the lake’s water level decreased 2 m from November 2014 to April 2016, a negative displacement of more than 20 mm occurred at the ground surface. An offset of a few months can be observed between the water level and ground displacement trends. This is due to the different behavior of the surface water and of the groundwater. Considering the linear trendline for Floreasca Lake and for the ground displacements, for medium decrease of 1.5 m in the water lake, 15 mm of subsidence is registered.
Figure 10.
Comparison between the Floreasca Lake water level and the evolution of the land vertical displacements in the Gara Herăstrău area. Source: elaborated by the authors.
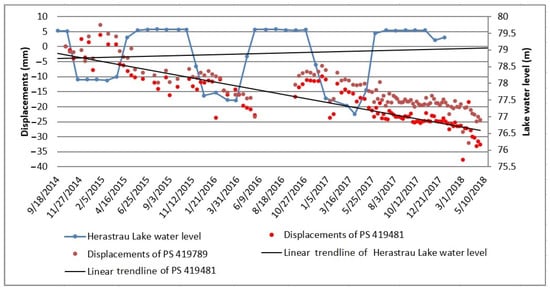
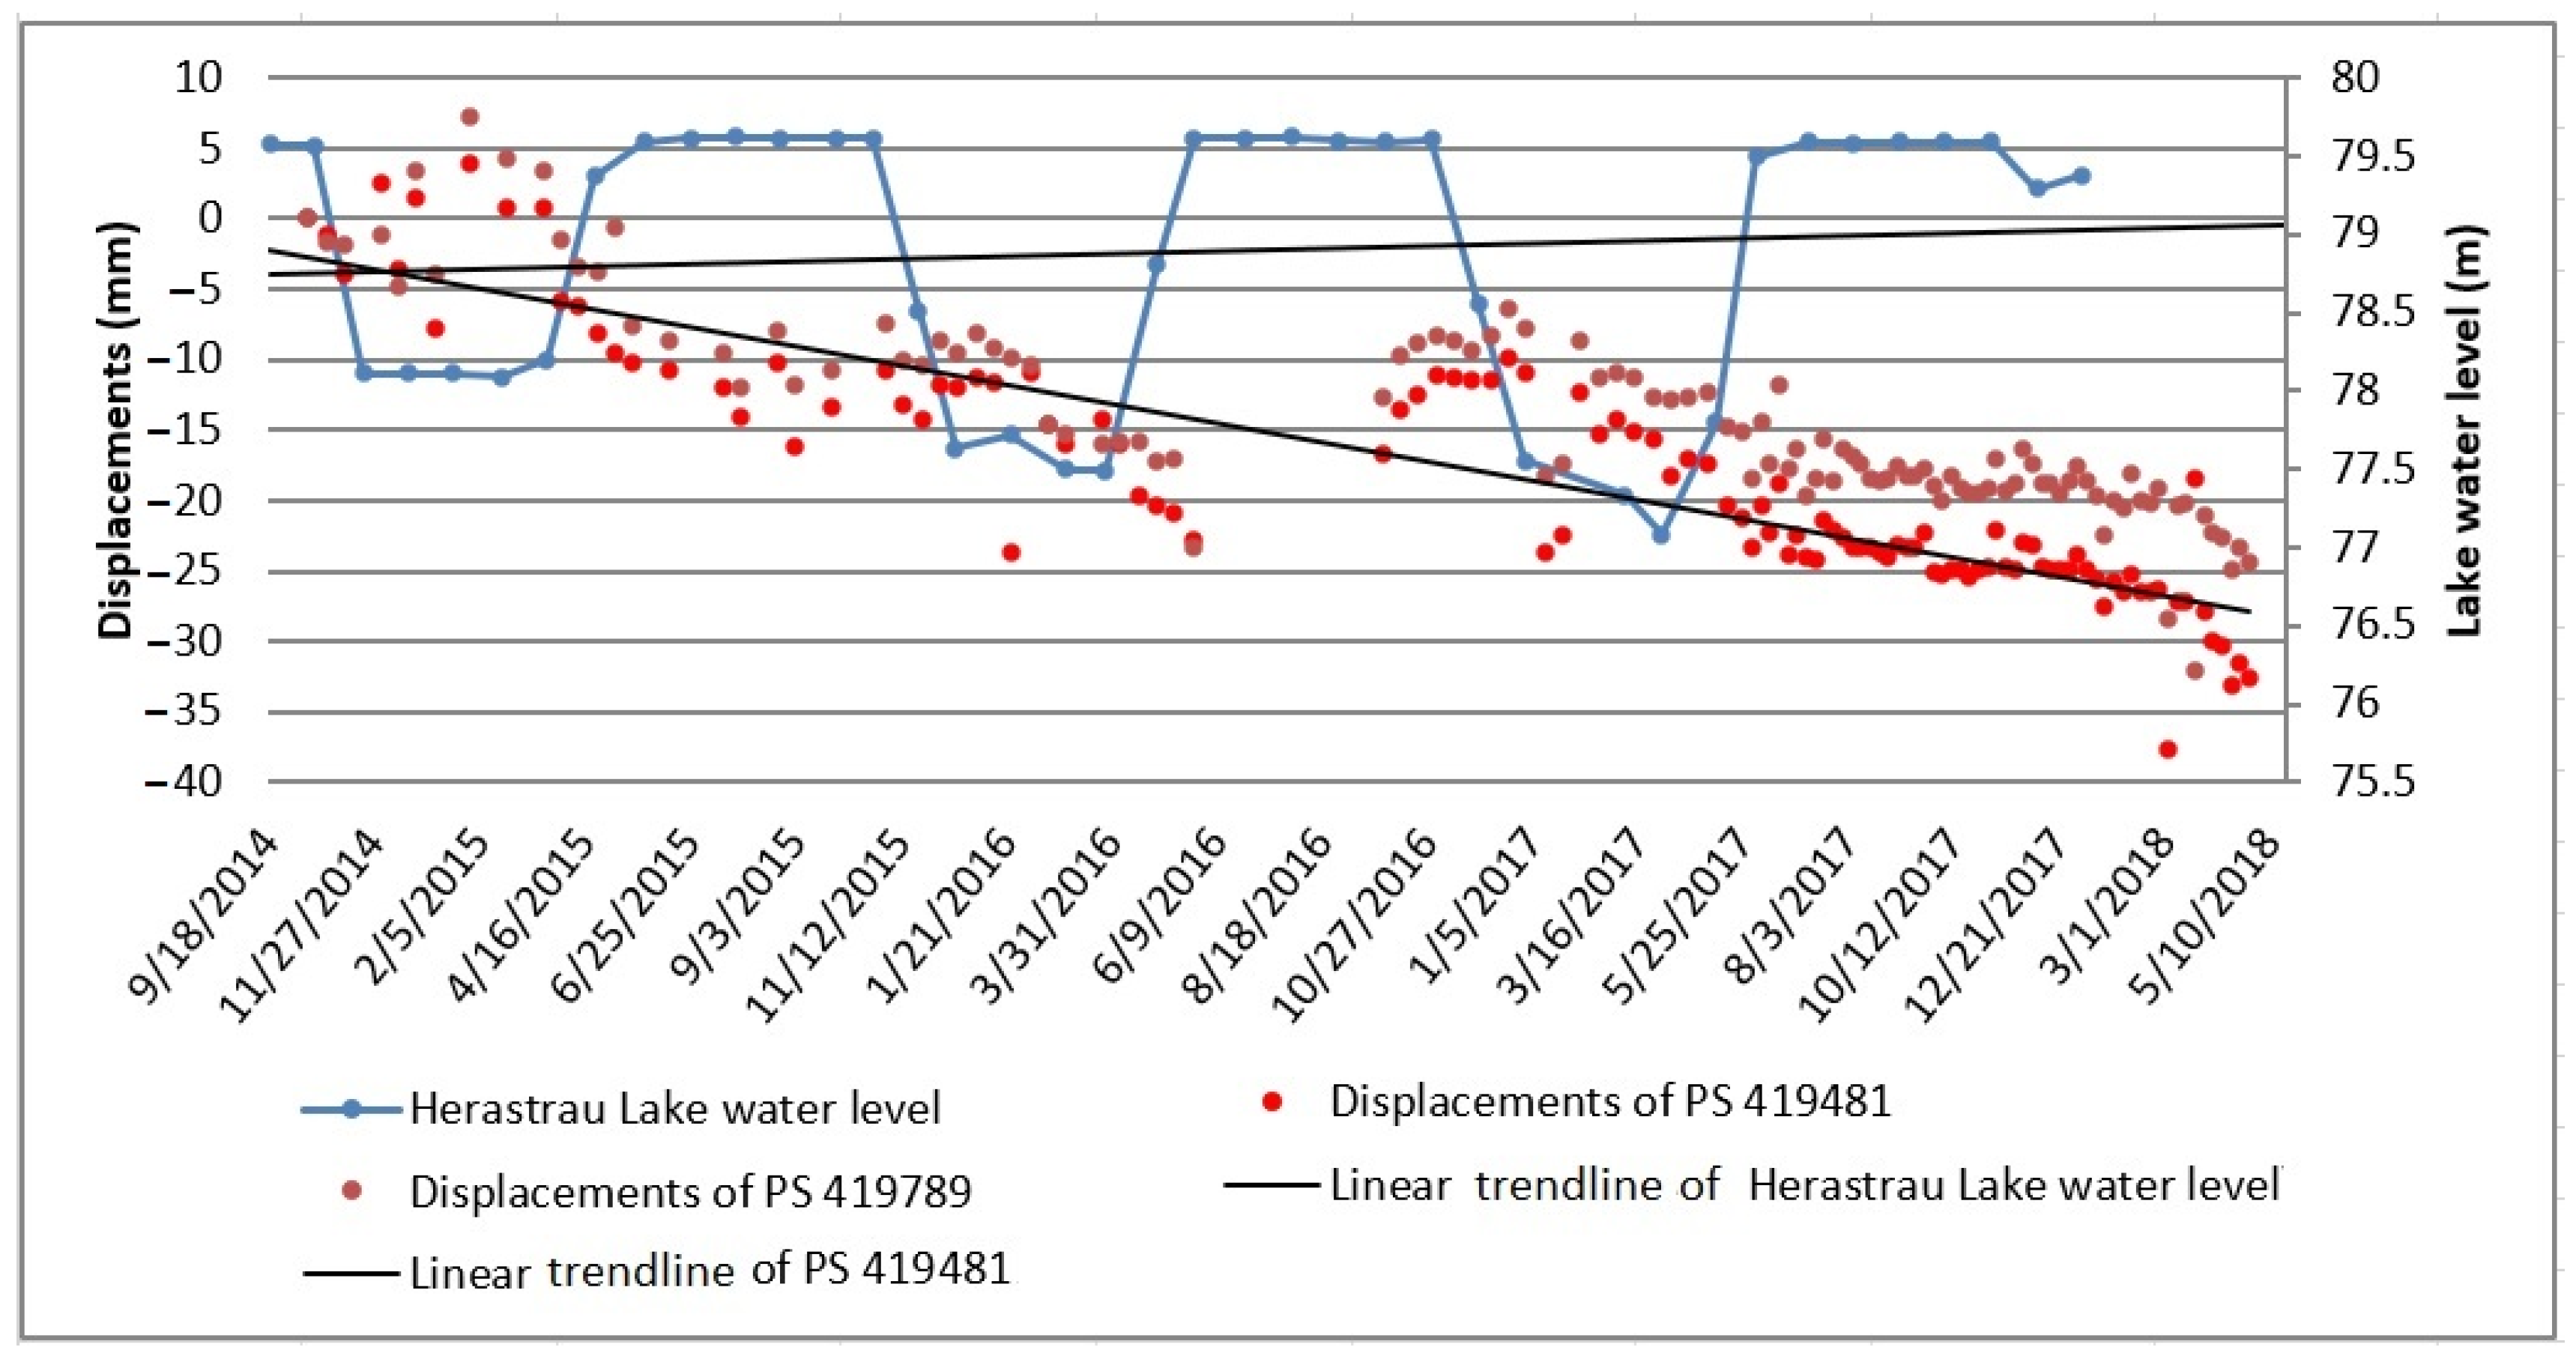
The Soseaua Nordului area has similar characteristics to the aforementioned ones, more precisely, it has neighboring areas with anthropogenic deposits and areas with land-cover changes in the vicinity due to construction activity. The main difference is that the construction work in the Soseaua Nordului area includes office buildings along with apartment buildings. A peculiarity of the area is the fact that it was partially affected by land displacements during 2004–2010. Figure 11 shows the comparison between the evolution of Herastrau Lake water level and the land displacement trend of this area. Herastrau Lake is the only lake of Colentina River where the water level increases periodically (controlled). It is evident that there is a slight reverse correspondence between the two data series. Although the general trend of the vertical displacements shows subsidence, during the periods when the lake water level registers minimum values, the values of the terrain surface displacements have a slight ascending trend followed by a descending trend. During periods when the lake water level has maximum values, the terrain surface shows a descending trend followed by a slight rising trend.
Figure 11.
Comparison between the Herăstrău Lake water level and the evolution of the land vertical displacements in Soseaua Nordului area. Source: elaborated by the authors.
The obtained results show a major concordance between the water level of the lakes and the vertical displacements of the surrounding areas, both with decreasing tendencies, in the context of a strong hydraulic connection between the Colentina riverbed and the shallow aquifer strata. The presence of anthropogenic deposits associated with groundwater fluctuations showed amplified ground vertical displacements, compared to the areas where natural deposits exist. Another association that can produce land movements is provided by the presence of marshy soils as a base layer for heterogeneous anthropogenic deposits. In all the areas mentioned above, these observations lead to the necessity for further local studies [65] in order to properly discriminate between the phenomena and processes generating subsidence. Civil engineers and urban planners should use these studies to further investigate local geology and possible anthropogenic strata, the ground geotechnical properties, and the local hydrogeological settings. These studies, providing an accurate overview of the ground conditions, should be included as support for the general urban plans of the cities, documenting future developments.
4. Conclusions and Recommendations
The analysis of the support studies of the Urban General Plans for 17 Romanian cities showed that urban planning documents do not sufficiently rely on groundwater information. Corresponding hydrogeological studies include only general recommendations, and these do not include specifications targeting reliable water-balance preservation or detailing the necessity of implementing monitoring systems to survey groundwater levels. These do not recommend either special constructive measures to be implemented for future infrastructure elements and do not include maps delineating particular geotechnical and hydrogeological characteristics.
The analysis of Bucharest clearly shows that anthropogenic influences severely alter the water cycle in urban areas. The change in the water cycle induced by urban areas directly affects the groundwater level. Increasing groundwater levels can lead to flooding while lowering groundwater levels can lead to subsidence.
The construction of high-rise offices or residential buildings, made in several locations in the Colentina study area, create basements on several levels, which makes the extension of the buildings exceed 10 m in depth. This leads to the use of dewatering systems required to locally reduce the hydraulic head of the shallow aquifer to ease the construction work and later allow for the optimal use of the basements. In the case of the intensive development of the subsurface constructions, the associated procedures of lowering or raising the groundwater level would have a strong impact on the neighboring infrastructure elements or networks. Depending on the pumped volume of the groundwater, this operation can have effects on the aquifer dynamics and can lead to displacement of the land surface, water level decrease in neighboring lakes, and the instability of infrastructure elements or changes of their hydraulic interaction.
The vertical displacement of the earth’s surface generally has a combined cause, involving problems of geotechnics, hydrology, hydrogeology, and geological aspects. Since elements in urban areas both underground and aboveground are exposed to more factors than in the extra-urban area, it is very difficult to accurately identify the causes and effects of certain phenomena that occur. The historical component of this problem is that in the past various works were carried out without keeping coherent and concrete records of the work process. In the rare cases where this information exists, it is not sufficiently detailed.
Increasing awareness of the strong linkage between urban development and groundwater is necessary for urban planners and decision makers because of the urgent need for applying coherent and correct city guidelines that consider both aboveground and underground development, including groundwater management.
Accurate analysis of urban groundwater should be performed with two considerations: (1) the resilience of city development, and (2) groundwater resource protection. The first consideration focuses on the unfailing development of city infrastructure in terms of its ecological resilience as well as land stability, preventing the delay of construction projects and cost overrun, and of subsequent damage to urban infrastructure [3]. The second consideration emphasizes the qualitative and quantitative protection of the entire aquifer system the city is laying on.
Underground city management could be performed by implementing a service within the municipalities in charge of data and decision-making concerning geology, groundwater, and the subsurface infrastructure elements and networks. This management should directly cooperate with the main actors represented by the city institutions and professional groups. This inter-institutional framework should regroup the (a) public administration including the municipality’s environmental department; the institutions in charge of underground transportation networks, utility operators, the management of Lakes and Parks, and others; (b) urban planners; (c) water operators and infrastructure developers—those who make underground constructions: subways, railways, warehouses, buildings with deep foundations; and (d) academic research centers.
The directions that should be followed are: (1) The development of a guide for urban hydrology data to be collected and used in urban planning; (2) defining a pallet of constructive solutions to allow a steady urban water cycle, for example, measures to allow aquifers to recharge or reduce the barrier effect; (3) integrating urban hydrogeology technical guides in the cities’ urban planning documents, thus focusing the low impact development in terms of minimizing the hydrological urban balance disruption.
As future research continues, it must be mentioned that even if the time interval in which the subsidence analyses are performed is relevant (a period of four years), the follow-up over a longer period may allow for a broader analysis. This will facilitate a more accurate identification of the subsidence triggers which are mainly related to geotechnical, hydrogeological, or geological data. Although the time frame is relevant, the consistency of the analyses may be affected by the heterogeneity of the data acquisition intervals, which differ for each data set. In the case of climate and satellite data there are daily or a few days’ step measurements, however, in the case of the hydraulic head measurements performed for this case study, measurements were at longer intervals. By improving the hydraulic head data acquisition system, a coherent overlap with other types of data can be obtained.
Author Contributions
Conceptualization, O.L. and C.R.G.; methodology, A.R., O.L. and C.R.G.; software, A.R.; validation, O.L. and C.R.G.; formal analysis, A.R., O.L. and C.R.G.; investigation, A.R., O.L. and C.R.G.; resources, A.R., O.L. and C.R.G.; data curation, A.R. and O.L.; writing—original draft preparation, A.R. and O.L.; writing—review and editing, A.R., O.L. and C.R.G.; visualization, A.R., O.L. and C.R.G.; supervision, C.R.G.; project administration, C.R.G. All authors have read and agreed to the published version of the manuscript.
Funding
The PSI processing of Sentinel-1 data is part of the INXCES (INnovations for eXtreme Climatic EventS, https://inxces.eu/) project 2016–2019 funded by WaterJPI WaterWorks 2014. It was partly funded by the Romanian National Authority for Scientific Research and Innovation, CCCDI-UEFISCDI grant number 48/2013 Cofound-202-INXCES, with PNCDI III. A part of the SAR ENVISAT ASAR data used for processing was purchased through the ESA C1P 6050 proposal, having Romanian Space Agency as coordinator.
Institutional Review Board Statement
Not applicable.
Informed Consent Statement
Not applicable.
Data Availability Statement
Not applicable.
Conflicts of Interest
The authors declare no conflict of interest.
References
- Hölscher, K.; Frantzeskaki, N. Perspectives on urban transformation research: Transformations in, of, and by cities. Urban Transform. 2021, 3, 2. [Google Scholar] [CrossRef] [Scilit]
- Bricker, S.H.; Banks, V.J.; Galik, G.; Tapete, D.; Jones, R. Accounting for groundwater in future city visions. Land Use Policy 2017, 69, 618–630. [Google Scholar] [CrossRef] [Scilit]
- Foster, S.; Gogu, R.; Gathu, J. Urban groundwater-mobilizing stakeholders to improve monitoring. Source 2019, 2019, 58–62. [Google Scholar]
- Carneiro, J.; Carvalho, J.M. Groundwater modelling as an urban planning tool: Issues raised by a small-scale model. Geol. Soc. Spec. Publ. 2010, 43, 157–170. [Google Scholar] [CrossRef] [Scilit]
- Roxane, L.; Lebel, A.; Joerin, F.; Rodriguez, M.J. Integration of groundwater information into decision making for regional planning: A portrait for North America. J. Environ. Manag. 2013, 114, 496–504. [Google Scholar] [CrossRef] [Scilit]
- Carmon, N.; Shamir, U.; Meiron-Pistiner, S. Water-sensitive Urban Planning: Protecting Groundwater. J. Environ. Plan. Manag. 1997, 40, 413–434. [Google Scholar] [CrossRef] [Scilit]
- Patra, S.; Sahoo, S.; Mishra, P.; Mahapatra, S.C. Impacts of urbanization on land use/cover changes and its probable implications on local climate and groundwater level. J. Urban Manag. 2018, 7, 70–84. [Google Scholar] [CrossRef] [Scilit]
- Hameed, H.M.; Faqe, G.R.; Qurtas, S.S.; Hashemi, H. Impact of Urban Growth on Groundwater Levels using Remote Sensing—Case study: Erbil City, Kurdistan Region of Iraq. J. Nat. Sci. Res. 2015, 5, 72–84. [Google Scholar]
- Erkens, G.; Bucx, T.; Dam, R.; de Lange, G.; Lambert, J. Sinking coastal cities. Proc. IAHS 2015, 372, 189–198. [Google Scholar] [CrossRef] [Scilit]
- Castellazzi, P.; Garfias, J.; Martel, R.; Brouard, C.; Rivera, A. InSAR to support sustainable urbanization over compacting aquifers: The case of Toluca Valley, Mexico. Int. J. Appl. Earth Obs. Geoinf. 2017, 63, 33–44. [Google Scholar] [CrossRef] [Scilit]
- Kubota, T.; Lee, H.S.; Trihamdani, A.R.; Phuong, T.T.T.; Tanaka, T.; Matsuo, K. Impacts of land use changes from the Hanoi Master Plan 2030 on urban heat islands: Part 1. Cooling effects of proposed green strategies. Sustain. Cities Soc. 2017, 32, 295–317. [Google Scholar] [CrossRef] [Scilit]
- Dang, V.K.; Doubre, C.; Weber, C.; Gourmelen, N.; Masson, F. Recent land subsidence caused by the rapid urban development in the Hanoi region (Vietnam) using ALOS InSAR data. Nat. Hazards Earth Syst. Sci. 2014, 14, 657–674. [Google Scholar] [CrossRef] [Scilit]
- Nguyen, M.; Chang, C.P.; Tseng, K.H. Using Sentinel-1 Tops SAR and SBAS for land subsidence monitoring in Hanoi, Vietnam. In Proceedings of the International Symposium on Remote Sensing, Pyeongchang, Korea, 9–11 May 2018. [Google Scholar]
- Luyen, K.B.; Le, P.V.V.; Dao, P.D.; Nguyen, Q.L.; Hai, V.P.; Hong, H.T.; Xie, L. Recent land deformation detected by Sentinel-1A InSAR data (2016–2020) over Hanoi, Vietnam, and the relationship with groundwater level change. GIsci Remote Sens. 2021, 58, 161–179. [Google Scholar] [CrossRef] [Scilit]
- Chen, M.; Tomás, R.; Li, Z.; Motagh, M.; Li, T.; Hu, L.; Gong, H.; Li, X.; Yu, J.; Gong, X. Imaging Land Subsidence Induced by Groundwater Extraction in Beijing (China) Using Satellite Radar Interferometry. Remote Sens. 2016, 8, 468. [Google Scholar] [CrossRef] [Scilit]
- Deng, Z.; Ke, Y.; Gong, H.; Li, X.; Li, Z. Land subsidence prediction in Beijing based on PS-InSAR technique and improved Grey-Markov model. GIsci. Remote Sens. 2017, 54, 797–818. [Google Scholar] [CrossRef] [Scilit]
- Heleno, S.I.N.; Oliveira, L.G.S.; Henriques, M.J.; Palcao, A.P.; Lima, J.N.P.; Cooksley, G.; Ferretti, A.; Lobo-Ferreira, J.P.; Fonseca, J.F.B.D. Persistent Scatterers Interferometry detects and measures ground subsidence. Remote Sens. Environ. 2011, 115, 2152–2167. [Google Scholar] [CrossRef] [Scilit]
- Aldiss, D.; Burke, H.; Chacksfield, B.; Bingley, R.; Teferle, N.; Williams, S.; Blackman, D.; Burren, R.; Press, N. Geological interpretation of current subsidence and uplift in the London area, UK, as shown by high precision satellite-based surveying. Proc. Geol. Assoc. 2014, 125, 1–13. [Google Scholar] [CrossRef] [Scilit]
- Righini, G.; Raspini, F.; Moretti, S.; Cigna, F. Unsustainable Use of Groundwater Resources in Agricultural and Urban Areas: A Persistent Scatterer Study of Land Subsidence at the Basin Scale. WIT Trans. Ecol. Environ. 2011, 144, 81–92. [Google Scholar] [CrossRef] [Scilit]
- Chaussard, E.; Amelung, F.; Abidin, H.; Hong, S.H. Sinking cities in Indonesia: ALOS PALSAR detects rapid subsidence due to groundwater and gas extraction. Remote Sens. Environ. 2013, 128, 150–161. [Google Scholar] [CrossRef] [Scilit]
- Ruiz-Constan, A.; Ruiz-Armenteros, A.M.; Lamas-Fernandez, F.; Martos-Rosillo, S.; Delgado, J.M.; Bekaert, D.P.S.; Sousa, J.J.; Gil, A.; Cuenca, M.C.; Hanssen, R.; et al. Multi-temporal InSAR evidence of ground subsidence induced by groundwater withdrawal: The Montellano aquifer (SW Spain). Environ. Earth Sci. 2016, 75, 242. [Google Scholar] [CrossRef] [Scilit]
- Semple, A.; Pritchard, M.; Lohman, R. An Incomplete Inventory of Suspected Human-Induced Surface Deformation in North America Detected by Satellite Interferometric Synthetic-Aperture Radar. Remote Sens. 2017, 9, 1296. [Google Scholar] [CrossRef] [Scilit]
- Luca, O.; Gaman, F.; Răuță, E. Towards a National Harmonized Framework for Urban Plans and Strategies in Romania. Sustainability 2021, 13, 1930. [Google Scholar] [CrossRef] [Scilit]
- Ferretti, A.; Prati, C.; Rocca, F. Permanent Scatterers in SAR Interferometry. IEEE Trans. Geosci. Remote. Sens. 2001, 39, 8–20. [Google Scholar] [CrossRef] [Scilit]
- Galloway, D.L.; Hoffman, J. The application of the satellite differential SAR interferometry-derived ground displacements in hydrogeology. Hydrogeol. J. 2006, 15, 133–154. [Google Scholar] [CrossRef] [Scilit]
- Crosetto, M.; Monserrat, O.; Cuevas-Gonzales, M.; Devanthery, N.; Crippa, B. Persistent Scatter Interferometry: A Review. ISPRS J. Photogramm. Remote Sens. 2016, 115, 78–89. [Google Scholar] [CrossRef] [Scilit]
- Radutu, A.; Nedelcu, I.; Gogu, C. An overview of ground surface displacements generated by groundwater dynamics, revealed by InSAR techniques. Procedia Eng. 2017, 209, 119–126. [Google Scholar] [CrossRef] [Scilit]
- Radutu, A. Use of Remote Sensing Techniques for Monitoring the Dynamics of Urban Groundwater. Ph.D. Thesis, Technical University of Civil Engineering Bucharest, Bucharest, Romania, 2021. [Google Scholar]
- European Space Agency, Sentinel Online, Interferometric Wide Swath. Available online: https://sentinelesa.int/web/sentinel/user-guides/sentinel-1-sar/acquisition-modes/interferometric-wide-swath (accessed on 28 April 2020).
- Ferretti, A.; Fumagalli, A.; Novali, F.; Prati, C.; Rocca, F.; Rucci, A. A New Algorithm for Processing Interferometric Data-Stacks: SqueeSAR. IEEE Trans. Geosci. Remote Sens. 2011, 49, 3460–3470. [Google Scholar] [CrossRef] [Scilit]
- INS-Direcția Regională de Statistică a Municipiului București. Available online: http://www.bucuresti.insse.ro/despre-bucuresti/ (accessed on 20 July 2019).
- Gaitanaru, S.D.; Gogu, R.; Boukhemacha, M.A.; Litescu, L.; Zaharia, V.; Moldovan, A.; Mihailovici, M. Bucharest city urban groundwater monitoring system. Procedia Eng. 2017, 209, 143–147. [Google Scholar] [CrossRef] [Scilit]
- L3Harris Geospatial. ENVI SARscape. Available online: https://www.l3harrisgeospatial.com/Software-Technology/ENVI-SARscape (accessed on 14 March 2022).
- ESA. Earth Online. Available online: https://earth.esa.int (accessed on 17 July 2020).
- Copernicus Open Access Hub. Available online: https://scihub.copernicus.eu (accessed on 14 March 2022).
- Dehls, J.F.; Larsen, Y.; Marinkovic, P.; Lauknes, T.R.; Stodle, D.; Moldestad, D.A. INSAR.NO: A National InSAR Deformation Mapping/Monitoring Service in Norway-From Concept to Operations. In Proceedings of the IGARSS 2019-IEEE International Geoscience and Remote Sensing Symposium, Yokohama, Japan, 28 July–2 August 2019; IEEE: Piscataway, NJ, USA; pp. 5461–5464. [Google Scholar] [CrossRef] [Scilit]
- INnovations for eXtreme Climatic Events Project. Available online: https://inxces.eu/ (accessed on 14 March 2022).
- Radutu, A.; Venvik, G.; Ghibus, T.; Gogu, C.R. Sentinel-1 Data for Underground Processes Recognition in Bucharest City, Romania. Remote Sens. 2020, 12, 4054. [Google Scholar] [CrossRef] [Scilit]
- Lacatusu, R.; Anastasiu, N.; Popescu, M.; Enciu, P. Geo-Atlasul Municipiului București; Estfalia Publishing House: Bucharest, Romania, 2008. [Google Scholar]
- Copernicus Space Component Data Access. Available online: https://spacedata.copernicus.eu/web/cscda/dataset-details?articleId=394198 (accessed on 21 April 2021).
- Boukhemacha, M.A.; Gogu, R.C.; Serpescu, I.; Gaitanaru, D.; Bica, I. A hydrogeological conceptual approach to study urban groundwater flow in Bucharest city, Romania. Hydrogeol. J. 2015, 23, 437–450. [Google Scholar] [CrossRef] [Scilit]
- National Institute of Statistics. Romanian Statistical Yearbook. Available online: https://insse.ro/cms/ro/tags/anuarul-statistic-al-romaniei (accessed on 1 March 2021).
- Radutu, A.; Vlad Sandru, M.I.; Nedelcu, I.; Poenaru, V. Change detection trends in urban areas with remote sensing and socio-economic diagnosis in Bucharest city. In Proceedings of the 21st International Multidisciplinary Scientific GeoConference SGEM 2021, Albena, Bulgaria, 14–22 August 2021; STEF92 Technology: Sofia, Bulgaria; pp. 255–266. [Google Scholar] [CrossRef] [Scilit]
- Iași General Urban Plan. Available online: http://www.primaria-iasi.ro/portal-primaria-municipiului-iasi/pug/10452/dezvoltare-urbana (accessed on 14 February 2022).
- Bacau General Urban Plan. Available online: http://arhiva.municipiulbacau.ro/subpagini_fisiere/RLU_BACAU_2012.pdf (accessed on 14 February 2022).
- Constanța General Urban Plan. Available online: http://www.primaria-constanta.ro/primarie/urbanism/regulamentul-local-de-urbanism (accessed on 14 February 2022).
- Galati General Urban Plan. Available online: https://ro.scribd.com/document/510417220/RLU-PUG-GALATI (accessed on 14 February 2022).
- Braila General Urban Plan. Available online: http://www.primariabr.ro/directii-proprii-2/directia-arhitect-sef/pug (accessed on 15 February 2022).
- Ploiesti General Urban Plan. Available online: http://www.ploiesti.ro/18.02.2015.php (accessed on 15 February 2022).
- Pitesti General Urban Plan. Available online: https://www.primariapitesti.ro/pug-p762 (accessed on 31 January 2022).
- Craiova General Urban Plan. Available online: https://www.primariacraiova.ro/pozearticole/userfiles/files/01/17929.pdf (accessed on 31 January 2022).
- Timisoara General Urban Plan. Available online: https://www.primariatm.ro/urbanism/planuri-urbanistice/planuri-urbanistice-aprobate/pug/ (accessed on 31 January 2022).
- Arad General Urban Plan. Available online: https://portal1.primariaarad.ro/info.php?page=/temp/PUG-2015/index_PUG_Arad2015.html&newlang=ron&theme=th1-ron (accessed on 31 January 2022).
- Cluj Napoca General Urban Plan. Available online: https://gis.primariaclujnapoca.ro/Public/ (accessed on 26 January 2022).
- Oradea General Urban Plan. Available online: https://www.oradea.ro/subpagina/plan-urbanistic-general (accessed on 26 January 2022).
- Baia Mare General Urban Plan. Available online: https://www.baiamare.ro/ro/Servicii-publice/Serviciul-Dezvoltare-Urbana-si-Amenajarea-Teritoriului/Regulamentul-Local-de-Urbanism-(R.L.U)-si-Planul-Urbanistic-General-(P.U.G.)—Aprobat-cu-HCL-3491999/ (accessed on 26 January 2022).
- Brasov General Urban Plan. Available online: https://visumbrasov.org/planul-urbanistic-general-al-municipiului-brasov-varianta-iii/ (accessed on 26 January 2022).
- Sibiu General Urban Plan. Available online: https://sibiu.ro/primaria/urbanism/pug-municipiul-sibiu-aprobat-cu-hcl-165-28.04.2011 (accessed on 26 January 2022).
- Targu Mures General Urban Plan. Available online: https://www.tirgumures.ro/index.php?option=com_content&view=article&id=197&Itemid=196&lang=ro (accessed on 2 March 2022).
- Bucharest General Urban Plan. Available online: https://www2.pmb.ro/servicii/urbanism/pug/pug.php (accessed on 17 January 2022).
- Bucharest Urban Concept 2035. Available online: https://issuu.com/almihai/docs/concept_strategic_bucuresti_2035 (accessed on 17 January 2022).
- Integrated Urban Development Strategy. Available online: https://estibucuresti.org/sidu (accessed on 17 January 2022).
- Open Street Map. Available online: https://www.openstreetmap.org (accessed on 21 April 2021).
- Gogu, C.R.; Gaitanaru, D.; Boukhemacha, M.A.; Serpescu, I.; Litescu, L.; Zaharia, V.; Moldovan, A.; Mihailovici, M.J. Urban Hydrogeology studies in Bucharest City, Romania. Procedia Eng. 2017, 209, 135–142. [Google Scholar] [CrossRef] [Scilit]
- Lyu, H.M.; Shen, S.L.; Wu, Y.X.; Zhou, A.N. Calculation of groundwater head distribution with a close barrier during excavation dewatering in confined aquifer. Geosci. Front. 2021, 12, 791–803. [Google Scholar] [CrossRef] [Scilit]

Publisher’s Note: MDPI stays neutral with regard to jurisdictional claims in published maps and institutional affiliations. |
© 2022 by the authors. Licensee MDPI, Basel, Switzerland. This article is an open access article distributed under the terms and conditions of the Creative Commons Attribution (CC BY) license (https://creativecommons.org/licenses/by/4.0/).