Abstract
A field experiment was conducted to test the suitability of growing sunflower under mulched drip irrigation with saline water in the HID (Hetao Irrigation District), North China. The experiment included five planting densities in which the plant spacing was 30, 35, 40, 45, and 50 cm with the same spacing (50 cm) between rows. The results indicated that mulched drip irrigation with saline water was more water-saving than traditional ground irrigation using fresh water, while the irrigation quota increased with the increase of planting density. Little difference of soil salinization was found for the treatments in the 50–100 cm soil layer, which indicated that additional measures should be taken for salt balance with saline water irrigation. The height and leaf area index (LAI) of sunflower increased in response to the increase of plant density, and the head dry matter transferred to the stem at plant densities higher than 47,619 plants/hm2. Though the grain weight and 1000-seed weight decreased with increasing plant density, the achene yield and biomass production increased. This research suggests that a plant spacing of 35 cm with 50 cm of row spacing is more suitable for sunflower mulched drip irrigation with saline water at concentrations of 3.0 g∙L−1.
1. Introduction
The HID (Hetao Irrigation District), the important base of grain and oil in North China, is suffering from a serious water shortage. Due to the little precipitation (about 160 mm per year) and strong evaporation (about 2100 mm per year), agricultural water was mainly drawn from the Yellow River by canals. According to the plan created by the Yellow River Water Conservancy Commission in 2010 [1], which reduced the allocated water for HID from 5.2 to 4.0 billion m3 per year, causing discrepancies between the supply and demand of irrigation water to stand out, and restricting the sustainable development of agriculture in HID. The available fresh water is in short supply, and the water productivity is still low as a result of the irrational cultivation patterns of crops. Therefore, the efficient utilization of limited water resources and improved water productivity are needed for food production in HID.
To improve the water use efficiency, adopting a rational planting density is an effective agronomic measure [2]. Planting density, which can be maintained by adjusting row spacing and plant spacing, is a strong determinant of yield in various crops, including sunflower, since there is no option for filling the space between plants by branching and tillering [3]; thus, a suitable plant density may help in making full use of the entire renewable resource and promoting the harmonious development of crop populations and individuals. Researchers have indicated that differences in distance between rows and plants influenced the spatial distribution of roots and soil water contents [4]. Additionally, plant density can affect plant response to light by affecting the LAI (leaf area index)—the higher the plant density, the greater the received light rate for photosynthesis. However, with plant density increases, the competition for light between plant increases, which result in the decrease in vegetative and reproductive plasticity of plant [5], while a lower plant density, results in a decreased absorption of light by the plants, as well as decrease in crop yield per unit area [6,7]. Theoretical research and practical experience have shown that the high yield per unit area is usually associated with low competitiveness among plants [8,9], while head diameter, plant biomass, 100-seed weight, seed yield per plant, non-saturated fatty acids, and seed oil percentage decreased with an increase in plant density [10].
Since the fresh water for agricultural practices in arid and semi-arid regions is limited, the utilization of alternative waters, including brackish water, is necessary [11]. There is an abundant storage of shallow saline ground water in HID, and the available shallow saline ground water (with salt concentrations at 2.0–5.0 g/L) is estimated to be 0.721 billion m3. A large number of studies have been conducted in HID for saline water mulched drip irrigation, SMP (soil matric potential), which was measured 0.2 m underneath the emitters, was used to trigger irrigation [12,13,14]. Furthermore, the effects of saline water irrigation on crop growth and soil salt have been investigated.
Generally, studies regarding the effects of plant density have focused on plant vegetative and reproductive plasticity, where most of the irrigation methods have involved ground irrigation with fresh water. However, the impact of plant density on crop water consumption and soil salt may have differences when using saline water and, moreover, the information on crop growth, crop yields, and the soil salt accumulation in response to plant populations under saline water mulched drip irrigation is still limited. Thus, a field experiment was conducted in HID from 2016 to 2017 to evaluate the effects of plant density on irrigation schedule, growth indexes, yield attributes, and soil salt accumulation under mulched drip irrigation with shallow saline water.
2. Materials and Methods
2.1. Experimental Site
Field experiments were carried out in the Agricultural Experimental Station of Inner Mongolia Agricultural University, Hetao Irrigation District, Bayan Nur (107°18′ E, 40°41′ N), which is located in the south of Linhe city, north of Yellow River (Figure 1). The study area is a typical temperate continental climate characterized by drought and high temperatures in summer, and is snowless and cold in winter. The annual average precipitation and evaporation in the region is 141.2 and 2306.5 mm, respectively. Since the main light energy, heat energy, and precipitation all occur in the same period, HID is relatively suitable for the development of agriculture.
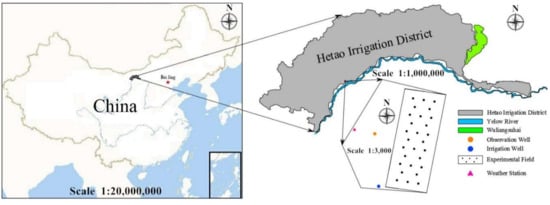
Figure 1.
Schematic of the experimental field location.
The field soil (100 cm underneath the surface) can be divided into three layers according to the international soil texture classification system, moreover, the soil texture of the study area is sandy loam in 0–60 cm, sand in 60–80 cm, and middle loam in 80–100 cm; the soil physical properties and nutrient contents are shown in Table 1 and Table 2, respectively. The field capacity and the average soil salinity of the 0–20 cm layer was 28.50% and 1.50 g∙kg−1, respectively.

Table 1.
Soil physical properties in the experimental area.
Table 2.
Soil nutrient content in the experimental area.
The buried groundwater depth in the research area during the growth period of sunflower is 1.85–3.68 m, the average value is 2.80 m, and the detailed variations are shown in Figure 2. The maximum buried depth appeared in mid-June, while the minimum value appeared in early July, and groundwater had a certain impact on sunflower growth, which lasted about 50 days from July. As the main resource of traditional ground irrigation, the Yellow River water generally has annual average salinity of 0.505 g∙L−1, while the shallow ground water has an annual average salinity of 3.14g∙L−1, which is suitable for farmland irrigation [13]. The main composition and characteristics of local shallow groundwater and Yellow River water are shown in Table 3, and the precipitation during sunflower growth period in 2016 and 2017 is shown in Figure 3.
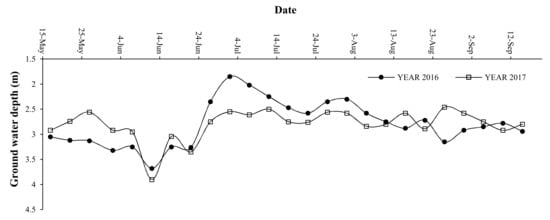
Figure 2.
The changes of groundwater depth in sunflower growth period.
Table 3.
The main compositions and features of water.
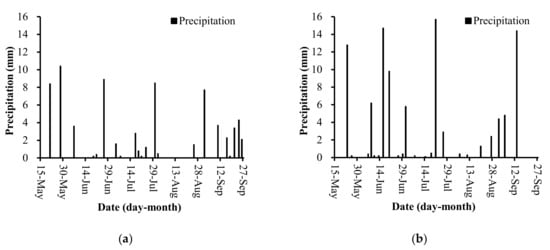
Figure 3.
The precipitation during sunflower growth period. (a) Precipitation during sunflower growth period in 2016; (b) Precipitation during sunflower growth period in 2017.
2.2. Experimental Design and Field Management
Sunflower (edible sunflower, Haofeng 6601 hybrid) was selected as the test crop in the present experiment, while the field experiment was conducted with five plant densities of D1, D2, D3, D4, and D5. The geometric distribution for representing the designed plant densities was carried out by adjusting the spacing of five plants (50, 45, 40, 35, and 30 cm) with the same row spacing of 50 cm for each treatment, as follows: 50 × 50 cm2, 45 × 50 cm2, 40 × 50 cm2, 35 × 50 cm2, 30 × 50 cm2, respectively. Sixty beds were divided into five plots for each treatment, where each plot occupied an area of 300 m2 (width 12 m × length 25 m). A drip irrigation system mulched with white plastic film (thickness, 0.01 mm; width, 900 mm) was used to deliver the irrigation water while each drip submain unit consisted of ten beds accompanied by a water meter installed at the inlet of the submain to measure the irrigated water amount. Drip tubes with 0.3 m emitter intervals were located in the center of each bed to apply the irrigation water (Figure 4).
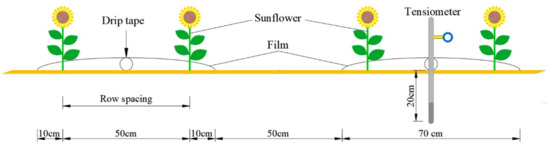
Figure 4.
The experimental schematic diagram for the sunflower crop.
2.3. Field Management
Pre-sowing irrigation with fresh water of 135 mm was conducted in spring to leach the accumulated soil salt [15]. Sunflower was sown on 28 May 2016 and 20 May 2017, followed by immediate irrigation with fresh water of 20 mm depth for all treatment plots, to ensure better germination before maize emerged. The emergence rate was counted immediately after germination, and the gaps were then transplanted to the designed density. As extensive research has indicated, the SMP measured at a depth of 20 cm immediately under the drip emitter by tensiometers can be used as an indicator for drip irrigation [16,17,18]. An irrigation of 20 mm with local shallow ground saline water was only applied when the vacuum gauge dropped to the designed lower thresholds. Based on the irrigation management indicated by Yun Wenli et al. (2014) [19], the target SMP for all treatments were designed with the same value, which was −30 kPa from sowing to bud stage, and −15 kPa from the bud stage to the one week after flowering, while −30 kPa was applied from one week after flowering to maturation.
Diammonium phosphate at 450 kg∙hm−2 and potassium sulfate at 90 kg∙hm−2 were applied as base fertilization before film mulching, and the dressing was supplied with urea (46% N) of 450 kg∙hm−2 by mixing it with irrigation water at a concentration of 30% (w/w). The topdressing time and other agronomic practices were the same as for traditional sunflower planting.
2.4. Observation and Equipment
2.4.1. Meteorological Observation
During the growth period of sunflower, an automatic weather station (YM-03A, Hebei Handan Co.) was set up 35 m away from the experimental field to observe the corresponding rainfall, wind speed, photosynthetic active radiation, solar total radiation, relative humidity, maximum temperature, minimum temperature, and atmospheric pressure, while the time interval was 0.5 h.
2.4.2. SMP Measurement
A vacuum gauge tensiometer was installed at 20 cm depth immediately under the emitters for SMP monitoring and irrigation in each plot. The tensiometers were observed three times a day at 8:00, 12:00, and 18:00 during the whole growth period of sunflower.
2.4.3. Soil Salinity
Soil samples were obtained from each plot with an auger (2.0 cm in diameter and 15 cm high) before planting every 15 days from sowing to harvest in each plot in 2016 and 2017, and additional measurements were taken before and after each irrigation event. The samples were obtained 0 and 60 cm horizontally away from the emitters with at 10 cm depth intervals. Three replicate soil samples per treatment were combined into a single sample for analyzing the soil salinity. All samples were air-dried, ground, and passed through a 1 mm sieve, soil leachates were prepared at a soil-to-water ratio of 1:5, and soil salinity was estimated by electrical conductivity EC1:5 using a conductivity meter (DDS-11A, REX, Shanghai optical instrument factory, Shanghai, China).
Soil salt concentration can be calculated by the electrical conductivity using the following equation [20,21]:
where Y is salt concentration (%) and is the electrical conductivity (dS/m).
2.4.4. Plant Growth
Five representative plants were continuously and randomly selected, and then marked in each plot to measure leaf area index (LAI) every day at flowering stage; height and stem diameter were measured at the end of maturation stage for the marked plants; additionally, sunflower capitulum diameter was measured at 10-day intervals from the bud stage to harvest. At the end of the maturation stage, the five marked sunflowers were separated into parts for treatment, and then dried in a constant temperature oven at 75 °C until constant weight for the following dry matter: leaf, handle, stalk, and head.
Sunflowers were harvested on 28 September 2016 and 21 September 2017, and the number of achenes per plant, number of full achenes per head, yield of seeds per plant, yield of full seeds per head, weight of 1000 achenes, and biomass production were measured for the marked sunflowers corresponding to the different plant densities. The clean achene yield for each plot was determined according to weight after threshing and air drying.
2.4.5. Statistical Analysis
The soil salt accumulation, plant characteristics, yield compositions were analyzed using Excel 2016 and SPSS 20.0. The single-factor analysis of variance (ANOVA) and multiple comparisons were done to assess significance between the treatments using the least-significant difference (LSD) test in SPSS 20.0, and the analysis was performed at α = 0.05 level of significance.
3. Results
3.1. Irrigation
Sunflower is traditionally planted with mulched film at an average planting density of 34,500 plants/hm2, while the crop is irrigated with drawing water from the Yellow River. The sunflower was normally irrigated three times (irrigation water for 4500 m3∙hm−2 in total).
Different planting densities during the sunflower growth period result in different leaf area indexes, which lead to differences in crop water consumption. According to the vegetative character of sunflower, the whole growth period can be divided into five stages, that is, sowing–germinating stage, germinating–budding stage, budding–flowering stage, flowering–milking stage, and milking–dough stage. The irrigation times and the amount of applied water for each treatment in 2016 and 2017 are shown in Table 4 and Table 5.
Table 4.
The irrigation schedule for different planting densities in 2016.
Table 5.
The irrigation schedule for different planting densities in 2017.
The consumed shallow ground saline water ranges from 375.00 to 455.00 mm, accompanied by plant densities that varied from 33,333 to 55,556 plants/hm2 (Table 4 and Table 5). The irrigation quota increased with the increasing of plant density, while the increased water was mainly consumed by plants at the budding–milking stage. On the one hand, the leaf area of the upper canopy, which can receive solar radiation, increased with the increase of sunflower planting density, which gave rise to the increasing amount of photosynthetically active radiation, which is also associated with crop transpiration [22,23]. On the other hand, the increase of plant spacing caused a corresponding increase in the water needed for transpiration, plant tissues, and the organs of sunflower.
Though the plant density for D3, D4, and D5 is higher than that of D1 and D2, the water consumed in D3, D4, and D5 treatments was lower than that of D1 and D2 treatments at the germinating–budding stage, which indicated that the transpiration of crops was far less than the corresponding soil evaporation at the germinating–budding stage, and the vaporization loss of soil moisture increased soil evaporation, while higher evapotranspiration rates and more irrigation water was consumed at lower plant densities. The variation of irrigation quota and irrigation times with plant density was similar in 2016 and 2017, while the water irrigation at flowering–milking stage was higher in 2016 than in 2017, which can be attributed to the large precipitation on 21 July 2017.
3.2. Soil Salt Accumulation
Different plant densities usually lead to differences in soil evaporation and crop transpiration, which may cause differences in soil salt accumulation. As Safahani Langeroodi et al. (2014) have indicated [24], sunflower usually extracts most of the soil water from the surface 0–50 cm soil layer and, in this paper, the 0–50 cm soil layer in film was considered as the main root zone. Soil salinity in 2017 was selected as an example to illustrate the variation of soil salinity and soil salt accumulation, and the details are shown in Figure 5, Figure 6, Figure 7 and Figure 8.
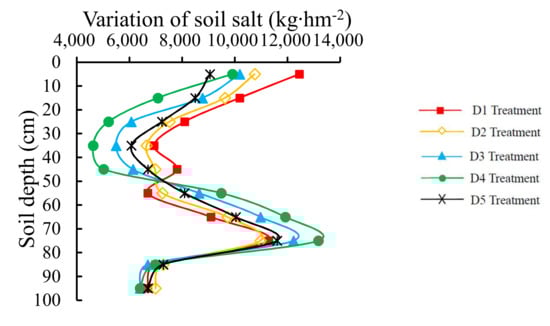
Figure 5.
Variation of soil salinity inside the film.
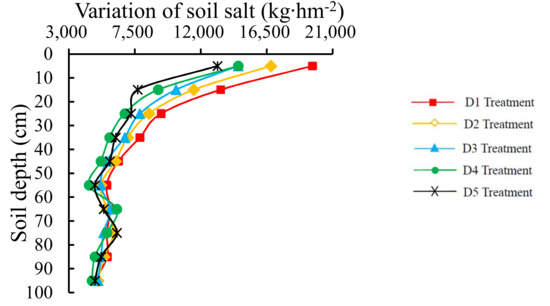
Figure 6.
Variation of soil salinity outside the film.
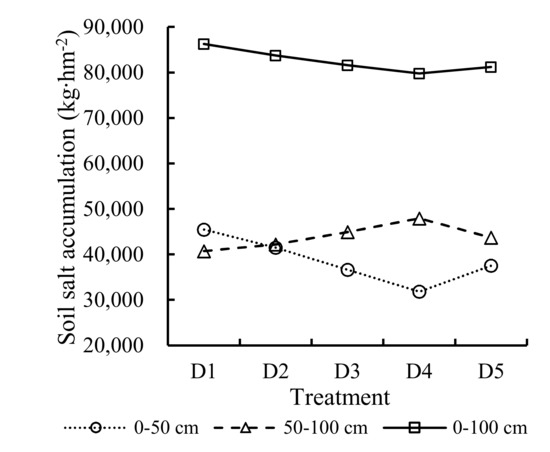
Figure 7.
Soil salt accumulation inside the film in 2017.
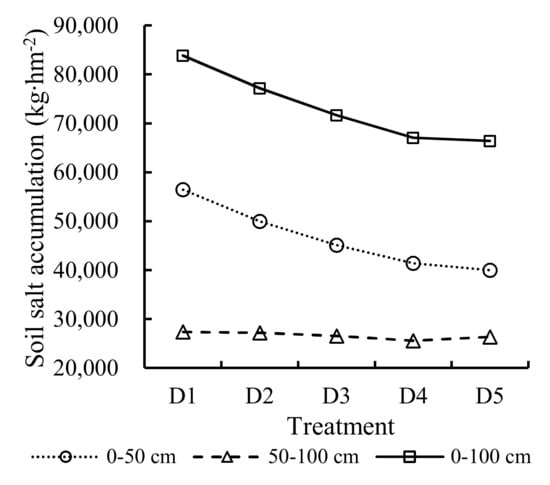
Figure 8.
Soil salt accumulation outside the film in 2017.
Potentially affected by irrigation leaching, crop water uptake, and the salt-carrying effects of irrigation water, the soil salinity between different treatments showed obvious differences (Figure 5 and Figure 6). The soil layers for all treatments in the film were salinized, which indicated that the influence of crop water uptake and the salt-carrying effects of irrigation water were stronger than the irrigation leaching effect under the designed irrigation schedule, while the accumulation of soil salt in soil layers decreased first and then increased with the increase of soil depth. Moreover, the inflection points for variation curves between soil salinity and soil depth were at 30–40 cm and 70–80 cm underneath the surface. Additionally, the accumulated salt in the top soil for D5 treatment was the lowest in the designed treatments, while the corresponding salinization for D1 treatment was the highest. Furthermore, the accumulated soil salt in the main root zone of sunflower for treatments follow the rule of D1 > D2 > D5 > D3 > D4. According to the fact that soil salt accumulated in the sunflower main root zone, the superiority of the planting pattern with 50 cm row spacing and 35 cm plant spacing was suggested to be better for crop, due to the lower soil salt content in 0–50 cm.
As influenced by soil evaporation, the soil salt accumulated between neighboring films, moreover, the variation of soil salinity decreased with an increase in soil depth (Figure 7 and Figure 8). In particular, the soil salt accumulated sharply in 0–20 cm, while at harvest stage of sunflower, the accumulated soil salinity in 0–20cm for the five treatments D1, D2, D3, D4, and D5 was 28.44, 24.43, 21.46, 20.42, 17.97 g∙kg−1, respectively. Meanwhile, the varied soil salt content in 20–100 cm for the designed treatments, D1, D2, D3, D4, and D5, was 10.65, 10.21, 9.77, 9.03, 9.51 g∙kg−1, respectively, which indicated that, due to the capillary force, deep soil salt moved upward with soil moisture, and soil salt remained after top soil moisture evaporation. Furthermore, the accumulated soil salt had little difference for the designed densities at 50–100 cm.
Soil salt accumulated in 0–100 cm layer during the growth period of sunflower. The measure of increasing plant density by reducing plant spacing can decrease the trend of topsoil salinization to a certain extent. However, the soil salinity cannot be regulated effectively through only increasing plant density, and additional measures, such as supplementary irrigation, should be taken to decrease the soil salt content for the sustainable development of agriculture in HID.
3.3. Plant Vegetative Indexes
Morphological traits, such as LAI, plant height, stem thickness, and flower diameter are the main vegetative indexes of sunflower, while the planting density usually influenced the morphological traits resulting from differences in sunflower assimilation. The plant height, stem thickness, and flower diameter of sunflower generally reach their maximum value at the mature stage; thus, the maximum morphological indexes of sunflower at the mature stage are listed in Table 6, and the variation of LAI during the sunflower growth periods in 2016 and 2017 are shown in Figure 9 and Figure 10.
Table 6.
Maximum morphological index of sunflower.
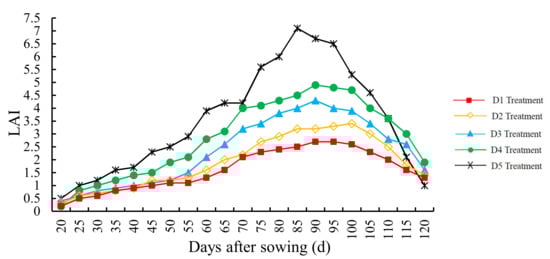
Figure 9.
Variation of leaf area index (LAI) during the sunflower growth period in 2016.
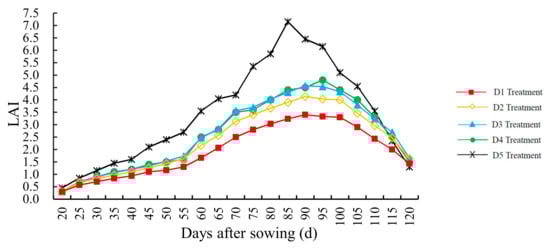
Figure 10.
Variation of LAI during the sunflower growth period in 2017.
The maximum stem thickness and flower diameter were obtained for plants at a spacing of 50 cm, while the plant height reached its highest value at a plant spacing of 30 cm (Table 6). Accompanied by an increase in plant density, the maximum value of stem thickness and flower diameter decreased, while the maximum value of plant height increased, which was in agreement with the research of Xiao el al (2006) [25], who indicated that the average plant height increased with an increase in plant density (lower than 16 plants/m2). However, there was no significant difference between the designed treatments on the maximum value of plant height, stem thickness, and head diameter. The results suggested that the higher plant density may result in taller plants, smaller sunflower heads, and thinner crops.
The variation of LAI with time after sowing for all treatments were approximate dynamic parabola curves (Figure 9 and Figure 10), which slowly increased with time at the seedling stage, and then rose sharply when the sunflower budded, and then reached a maximum value at peak flowering period; he LAI then decreased rapidly with time. There was little difference for the treatments at seedling stage, while the diversity increased after budding, and the most significant differences appeared during the peak flowering period, and then diminished. The LAI of sunflower generally decreased with an increase of plant density during the whole growth period, while the LAI of higher plant densities decreased more sharply at the latter stage. The results indicate that the effect of population on leaf area was significant at the early growth stage of sunflower, while the effect of plant density on a single plant increased with the growth of plants. The leaf area per plant decreased with the increase of plant density, while smaller plant spacing usually resulted in canopy closure and severe shading, which generally caused premature withering of the bottom leaves. As the LAI of sunflower has effects on the process of photosynthesis, transpiration, and dry matter accumulation, measures such as plant density regulation should be taken to obtain the maximum light interception for the highest growth rate of sunflower [26,27].
3.4. Distribution and Transference of Sunflower Dry Matter
Sunflower usually strides into reproductive growth from vegetative growth at the budding–flowering stage, and the corresponding distribution and transference of dry matter generally respond differently to plant density; the dry matter for treatments is listed in Table 7.
Table 7.
The account of dry matter per plant of sunflower.
Biomass accumulation and allocation in reproductive structures usually have an important influence on achene yield. During the growth period, the dry matter accumulation increased with the increase of plant density, while there was no significant difference in dry matter accumulation per plant before budding for treatments. Meanwhile, the accumulation of dry matter per plant decreased with the increase of plant density after budding (Table 7). The increasing rate of dry matter accumulation increased with the plant density at first, but then decreased as plant densities higher than the threshold value, which indicated that the effect of individual plants increased continuously. The dry matter of each organ per plant decreased with an increase in plant density. The proportion of dry matter for each organ per plant was head > stem > grain > leaf > handle when the plant density of sunflower was less than 47,619 plants/hm2, while the proportion of dry matter for each organ per plant was stem > head > grain > leaf > handle, when the plant density of sunflower was higher than 47,619 plants/hm2, which indicated that the dry matter of sunflower was gradually transferred to stem with increasing plant density.
3.5. Yield Attributes of Sunflower
Responses of sunflower yield attributes, such as full grain weight per head and 1000-seed weight, to plant density in 2016 and 2017 are respectively listed in Table 8 and Table 9.
Table 8.
Yield attributes in 2016.
Table 9.
Yield attributes in 2017.
Full grain number per head decreased significantly with increasing plant density, which responded to the decreasing rate of fructification by pollination, due to the increasing plant density (Table 8 and Table 9). Additionally, the full grain weight per head and 1000-seed weight decreased significantly due to the interplant nutrient competition. The grain number per head and grain weight per head were significantly reduced with an increase of plant density, consistent with the full grain number per head. The achene yield and biomass production increased significantly with increasing plant density, which indicated that the effect of 1000-seed weight on sunflower yield was lower than the influence of the population, in contrast to the studies of Diepenbrock et al. (2001) and Nel et al. (2000) [28,29]. In that study, the authors proposed that the effect of single plants was due to the predominance of yield under low plant density, and that single plant efficiency was reduced with by increases in plant density, due to yield attributes; however, due to the compensation effect of the population, the yield of sunflower also increased. Though the IWUE (Irrigation Water Use Efficiency) decreased with an increase in plant density, there was no significant difference in the economic coefficient between treatments, which implied that the proportion of economic output to biological production had no obvious relationship with planting density. Generally, based on the perspective of maximum production per unit area of farmland, the appropriate plant space was 30 cm.
4. Discussion and Conclusions
To rationally make use of saline water and promote the coordination of population and individual effects on sunflower for higher yield, the present paper focused on the irrigation schedule of saline water irrigation, soil salt accumulation, vegetative indexes, distribution of dry matter, and yield attributes of sunflower.
Mulched drip irrigation with saline water (irrigation amount ranges from 240 to 320 mm) was water-saving when compared with traditional ground irrigation (with a typical average irrigation quota of 450 mm), the irrigation quota increased with an increase in plant density under the designed irrigation mode, and the main difference in consumed water for different plant densities was prominent at the budding–milking stage, when sunflower had a high growth rate.
Soil salt accumulated for all plant densities under the designed mulched drip irrigation. Moreover, the accumulated soil salt was concentrated in the 20 cm of topsoil, while little difference was found for treatments in the 50–100 cm soil layer. Increasing plant density by reducing plant spacing can decrease the trend of topsoil salinization to a certain extent, however, only increasing the plant density can hardly regulate the soil salinity effectively, and additional measures should be taken for the sustainable cultivation of farmland in HID.
Due to the interplant competition for resources such as nutrient, water, sunshine, etc., the maximum diameter of stem and head both decreased with an increase in plant density, while the height of the plant increased with increasing sunflower density.
LAI varied with time for all treatments in as a dynamic parabola curve, while the maximum value was obtained at peak flowering period. The LAI response increased with increasing plant density, which indicated that the effect of population on leaf area was significant. Generally, an appropriate plant density should be cultivated to obtain maximum light interception for the high production of sunflower.
The dry matter was mainly concentrated in stem and head, and decreased with increasing plant density for all aboveground organs. Furthermore, the dry matter of head was gradually transferred to the stem at a plant density of sunflower higher than 47,619 plants/hm2.
Though the grain weight and 1000-seed weight decreased with increasing plant density, the achene yield and biomass production increased with the increasing plant density due to the influence of the population.
With the aim of high IWUE, little soil salinization, and high production per unit area of cultivated land, the D4 treatment with a plant spacing of 35 cm proved to be optimal for sunflower cultivation.
Author Contributions
Conceptualization, J.L. and Z.Q.; Data curation, Z.Q.; Formal analysis, J.L.; Funding acquisition, Z.Q.; Investigation, J.L.; Methodology, Z.Q.; Project administration, J.C.; Resources, B.Y.; Software, J.L.; Validation, J.L., Z.Q. and J.C.; Visualization, Y.H.; Writing—original draft, J.L.; Writing—review & editing, Z.Q.
Funding
This research was funded by “The National Key Research and Development Program of China”, grant number “2016YFC0501301”; “the Fundamental Research Funds for the Central Universities”, grant number “2019B70314”; “Postgraduate Research & Practice Innovation Program of Jiangsu Province”, grant number “SJKY19_0484” and “The National Science Foundation Project”, grant number “41761050”.
Acknowledgments
We are grateful to Pingru He for her constructive comments during the review process. We also thank Bin Du for his help in the field.
Conflicts of Interest
The authors declare no conflict of interest.
References
- Xu, X.; Huang, G.H.; Qu, Z.Y.; Pereira, L.S. Assessing the groundwater dynamics and impacts of water saving in the Hetao Irrigation District, Yellow River Basin. Agric. Water Manag. 2010, 98, 301–313. [Google Scholar] [CrossRef]
- Debaeke, P.; Aboudrare, A. Adaptation of crop management to water-limited environments. Eur. J. Agron. 2004, 21, 433–446. [Google Scholar] [CrossRef]
- Pereira, M.L.; Hall, A.J. Sunflower oil yield responses to plant population and row spacing: Vegetative and reproductive plasticity. Field Crops Res. 2019, 230, 17–30. [Google Scholar] [CrossRef]
- Cucci, G.; Lacolla, G.; Caranfa, G. Spatial distribution of roots and cracks in soils cultivated with sunflower. Arch. Agron. Soil Sci. 2017, 64, 13–24. [Google Scholar] [CrossRef]
- Soleymani, A. Light response of sunflower and canola as affected by plant density, plant genotype and N fertilization. J. Photochem. Photobiol. B Biol. 2017, 173, 580–588. [Google Scholar] [CrossRef] [PubMed]
- Kemanian, A.R.; Stöckle, C.O.; Huggins, D.R. Variability of barley radiation-use efficiency. Crop Sci. 2004, 44, 1662–1672. [Google Scholar] [CrossRef]
- Ali, A.; Ahmad, A.; Khaliq, T.; Ali, A.; Ahmad, M. Nitrogen nutrition and planting density effects on sunflower growth and yield: A review. Pak. J. Nutr. 2013, 12, 1024–1035. [Google Scholar]
- Allam, A.Y.; El-Nagar, G.R.; Galal, A.H. Response of two sunflower hybrids to planting dates and densities. Acta Agron. Hung. 2002, 51, 25–35. [Google Scholar] [CrossRef]
- Barros, J.F.C.; de Carvalho, M.; Basch, G. Response of sunflower (Helianthus annuuss L.) to sowing date and plant density under Mediterranean conditions. Eur. J. Agron. 2004, 21, 347–356. [Google Scholar] [CrossRef]
- Ibrahim, H.M. Response of some sunflower hybrids to different levels of plant density. APCBEE Procedia 2012, 4, 175–182. [Google Scholar] [CrossRef]
- Jonatas, R.L.R.; Miguel, F.N.; Nildo da, S.D.; Osvaldo Nogueira de, S.N.; Adriana, A.D.; Raniere Barbosa de, L. Hydroponic cultivation of coriander using saline waste. IRRIGA 2013, 18, 624–634. [Google Scholar] [CrossRef]
- Tang, X.N.; Yang, S.Q.; Su, R.D.; Liu, R.M.; Chang, C.L. Light-saline water use pattern simulation for Lycium chinese and environmental prediction in Hetao Irrigation District Inner Mongolia. Water Sav. Irrig. 2015, 5, 52–56. [Google Scholar]
- Li, J.G.; Qu, Z.Y.; Huang, Y.P.; Ren, Z.S.; Wang, F. Effects of control lower limit of saline water mulched drip irrigation on water salt movement and corn yield in saline soil. J. Soil Water Conserv. 2017, 31, 217–223. [Google Scholar] [CrossRef]
- Zhangzhong, L.; Yang, P.; Zheng, W.; Wang, C.; Zhang, C.; Niu, M. Effects of drip irrigation models on chemical clogging under saline water use in Hetao District, China. Water 2018, 10, 345. [Google Scholar] [CrossRef]
- Xu, Z.; Shi, H.B.; Li, X.Y.; Zheng, Q.; Ni, D.N.; Liu, M.H. Dynamic of biomass, yield and their components of sunflowers under different irrigation modes. J. Irrig. Drain. 2017, 36, 20–25. [Google Scholar] [CrossRef]
- Kang, Y.H.; Wang, F.X.; Liu, H.J.; Yuan, B.Z. Potato evapotranspiration and yield under different drip irrigation regimes. Irrig. Sci. 2004, 23, 133–143. [Google Scholar] [CrossRef]
- Wang, R.S.; Kang, Y.H.; Wan, S.Q.; Hu, W.; Liu, S.P.; Liu, S.H. Salt distribution and the growth of cotton under different drip irrigation regimes in a saline area. Agric. Water Manag. 2011, 100, 58–69. [Google Scholar] [CrossRef]
- Wan, S.Q.; Jiao, Y.P.; Kang, Y.H.; Hu, W.; Jiang, S.F.; Tan, J.L.; Liu, W. Drip irrigation for waxy corn (Zea mays L.var. certain Kulesh) for production in highly saline conditions. Agric. Water Manag. 2012, 104, 210–220. [Google Scholar] [CrossRef]
- Yun, W.L.; Li, J.J.; Hou, Q. Effect of soil moisture on the growth of sunflower. Agric. Res. Arid Areas 2014, 32, 186–190. [Google Scholar]
- Sun, G.F.; Qu, Z.Y.; Du, B.; Ren, Z.S.; Li, J.G. Effects of different irrigation modes on soil temperature and salinity in inner Mongolia Hetao Irrigation District. Water Sav. Irrig. 2016, 2, 28–31. [Google Scholar]
- Sun, G.F.; Qu, Z.Y.; Du, B.; Ren, Z.S.; Liu, A.Q. Water-heat-salt effects of mulched drip irrigation maize different irrigation scheduling in Hetao Irrigation District. Trans. Chin. Soc. Agric. Eng. 2017, 33, 144–152. [Google Scholar] [CrossRef]
- Papadopoulos, A.P.; Pararajasingham, S. The influence of plant spacing on light interception and use in greenhouse tomato (Lycopersicon esculentum Mill.): A review. Sci. Hortic. 1997, 69, 1–29. [Google Scholar] [CrossRef]
- Sharratt, B.S.; McWilliams, D.A. Microclimatic and rooting characteristics of narrow-row versus conventional-row corn. Agron. J. 2005, 97, 1129–1135. [Google Scholar] [CrossRef]
- Safahani Langeroodi, A.R.; Kamkar, B.; Teixeira da Silva, J.A.; Ataei, M. Response of sunflower cultivars to deficit irrigation. Helia 2014, 37, 37–58. [Google Scholar] [CrossRef]
- Xiao, S.; Chen, S.Y.; Zhao, L.Q.; Wang, G. Density effects on plant height, growth and inequality in sunflower population. J. Integr. Plant Biol. 2006, 48, 513–519. [Google Scholar] [CrossRef]
- Bavec, F.; Bavec, M. Effects of plant population on leaf area index, cob characteristics and grain yield of early maturing maize cultivars (FAO100-400). Eur. J. Agron. 2002, 16, 151–159. [Google Scholar] [CrossRef]
- Stewart, D.W.; Dwyer, L.M. Mathematical characterization of leaf shape and area of maize hybrids. Crop Sci. 1999, 3, 422–427. [Google Scholar] [CrossRef]
- Diepenbrock, W.; Long, M.; Feil, B. Yield and quality of sunflower as affected by row orientation, row spacing and plant density. Die Bodenkultur 2001, 52, 29–36. [Google Scholar]
- Nel, A.A.; Loubser, H.L.; Hammes, P.S. The effect of plant population on the quality of sunflower seed for processing. S. Afr. J. Plant Soil 2000, 17, 6–9. [Google Scholar] [CrossRef][Green Version]
© 2019 by the authors. Licensee MDPI, Basel, Switzerland. This article is an open access article distributed under the terms and conditions of the Creative Commons Attribution (CC BY) license (http://creativecommons.org/licenses/by/4.0/).