Are Groundwater Monitoring Networks Economical? Cost-Benefit Analysis on the Long-Term Groundwater Supply Project of South Korea


Abstract
:1. Introduction
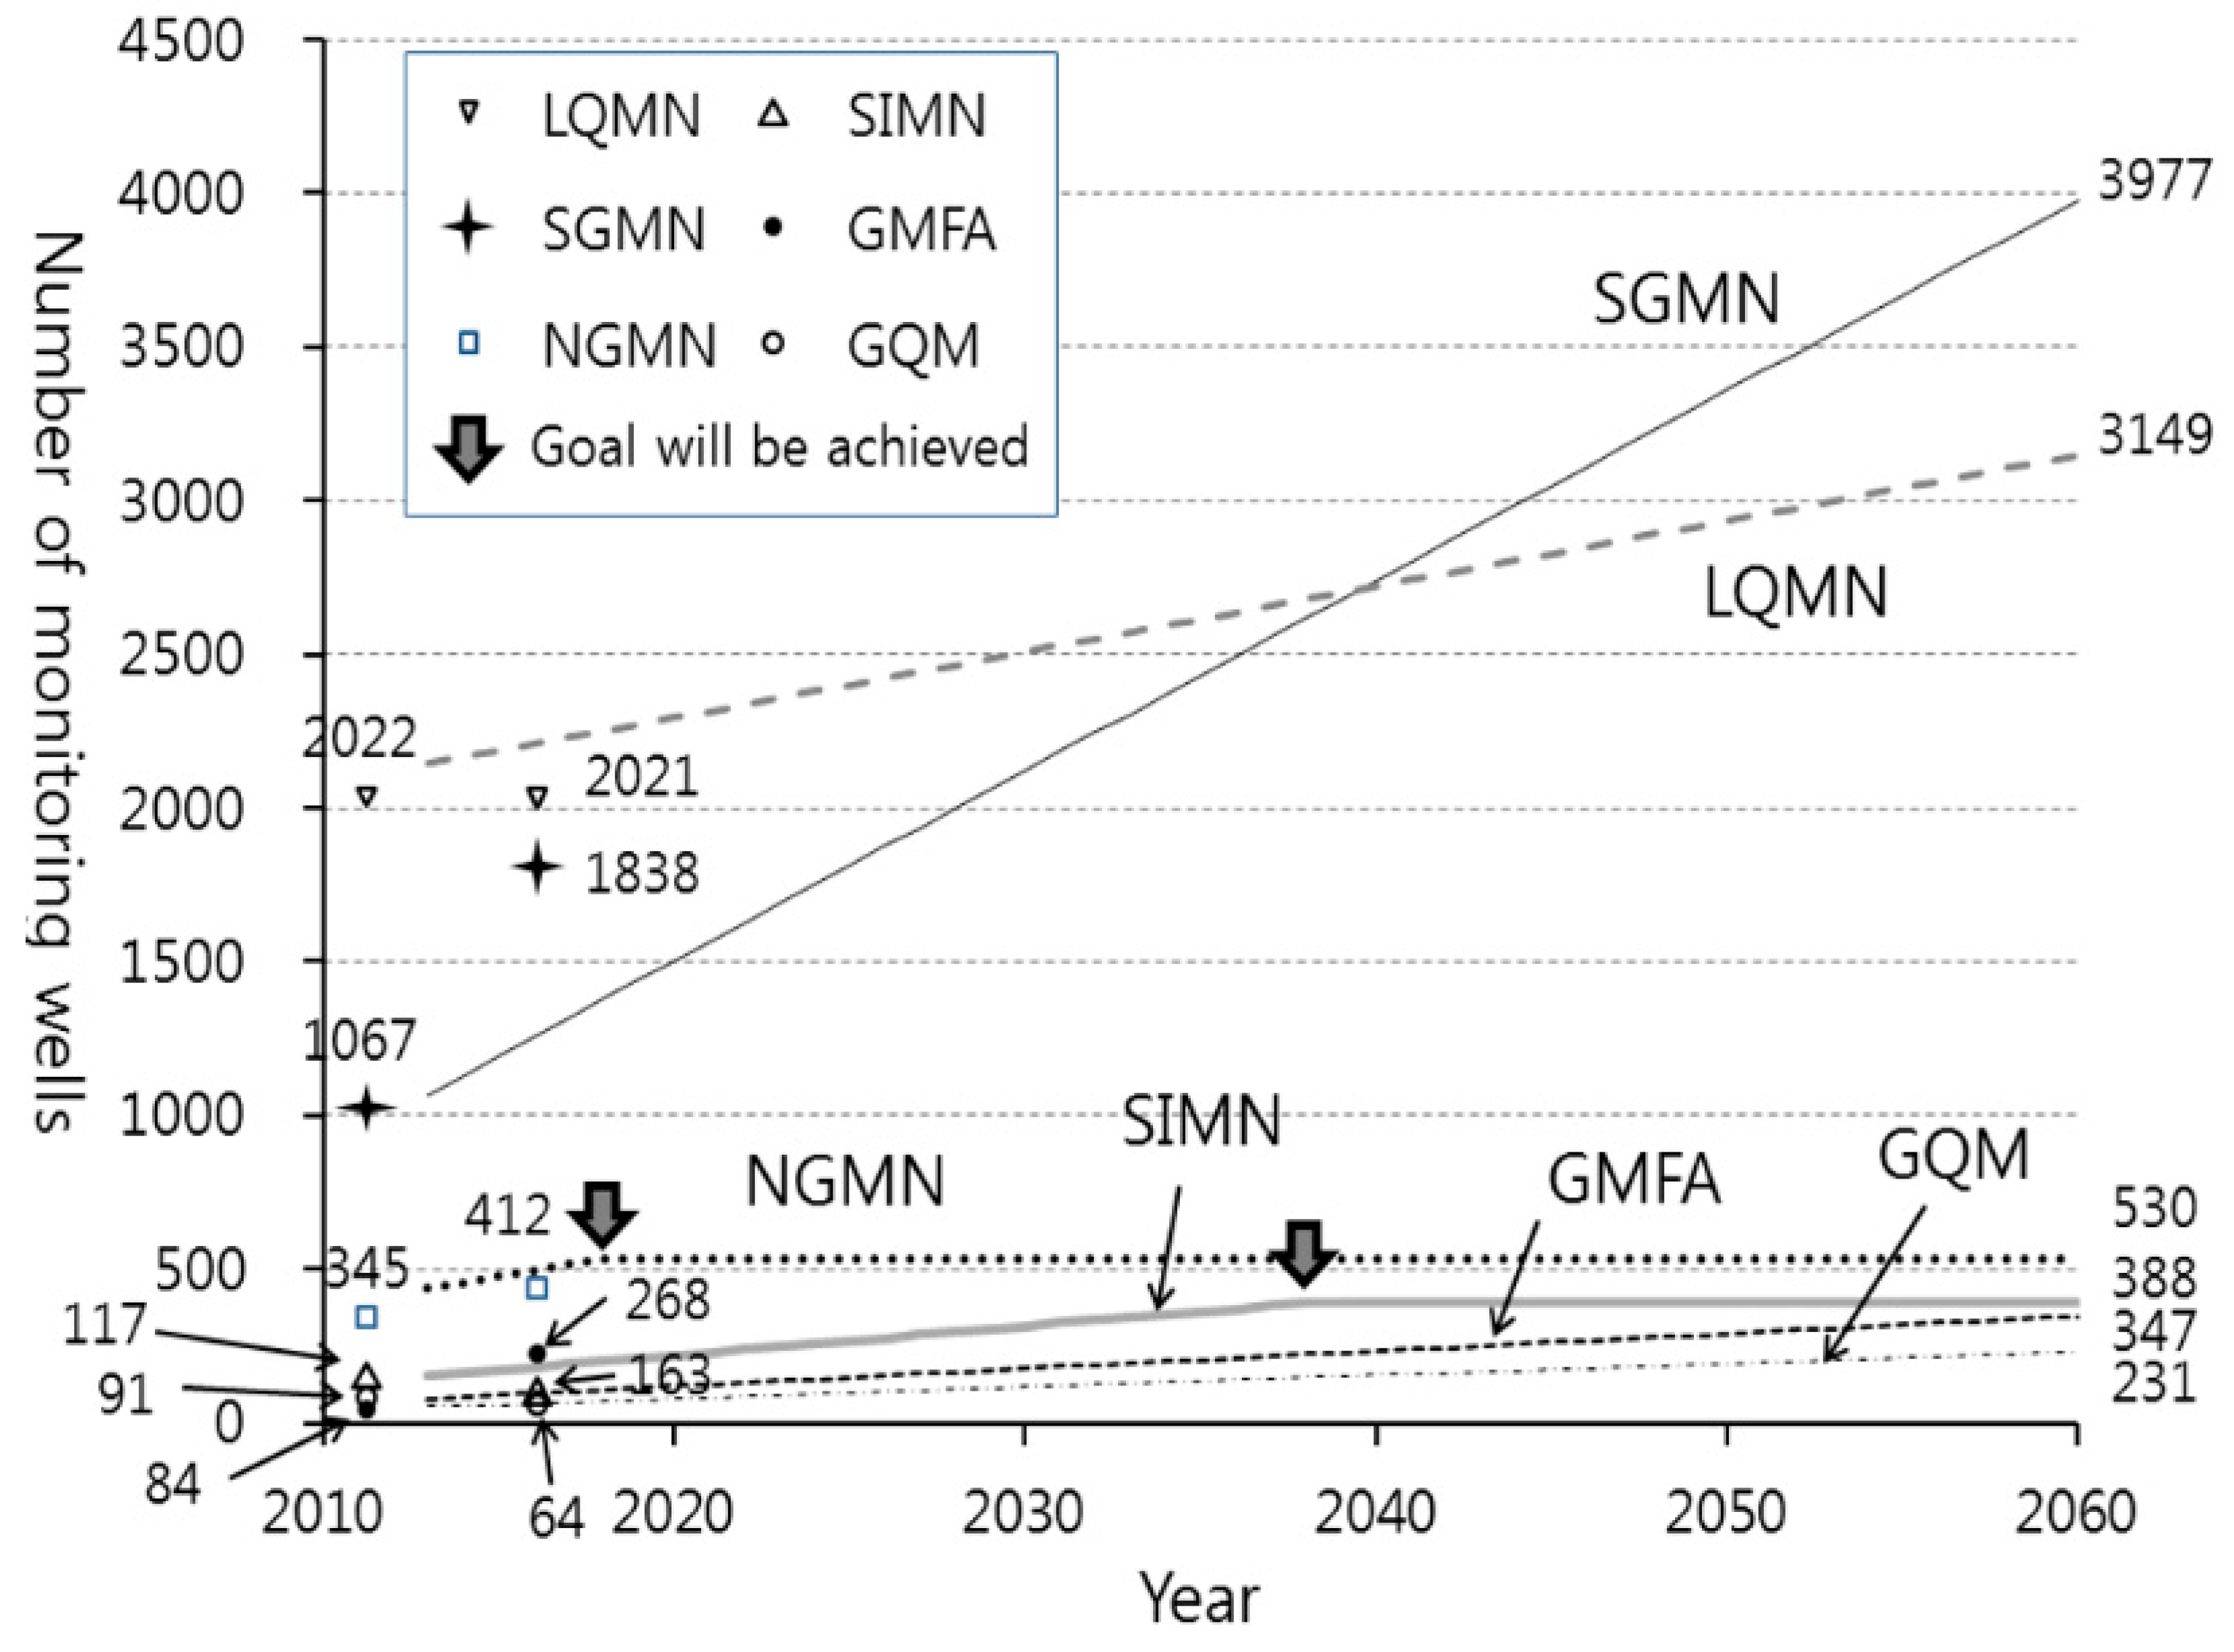
1.1. Groundwater Monitoring Networks: Current Facts and Plans
1.2. Literature Review
2. Research Methods
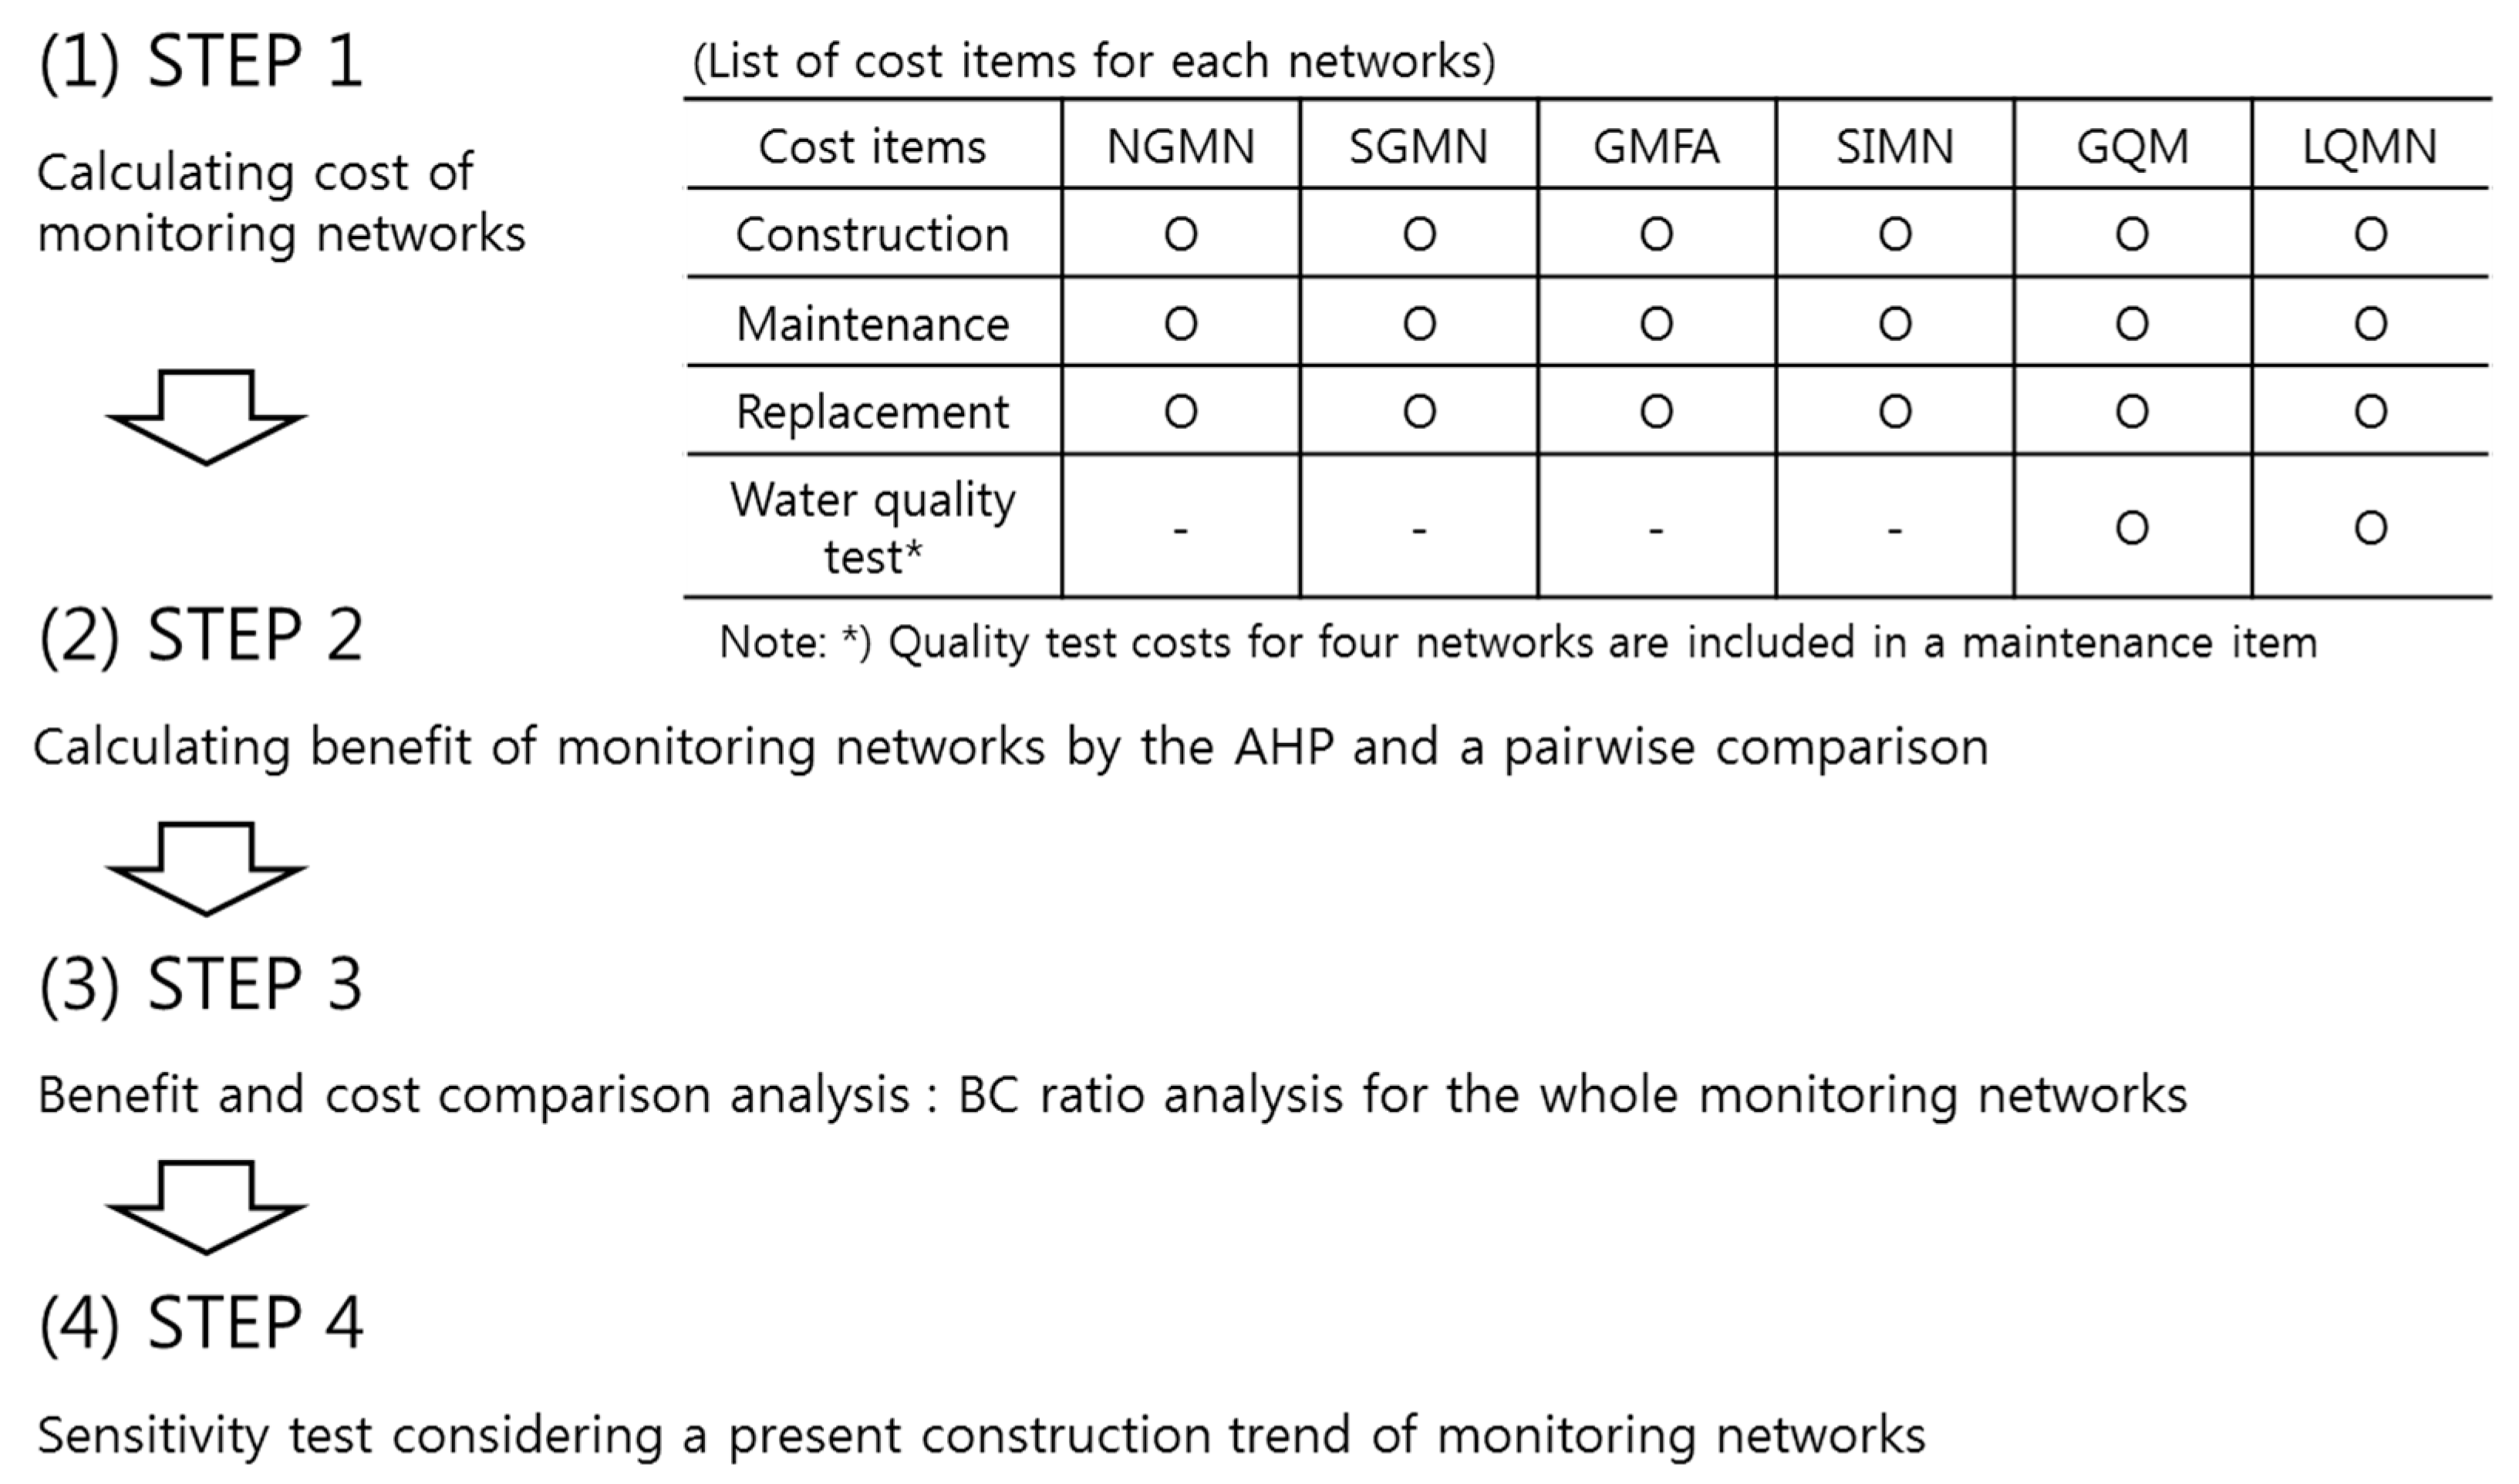
2.1. Research Process
2.2. Cost–Benefit Analysis
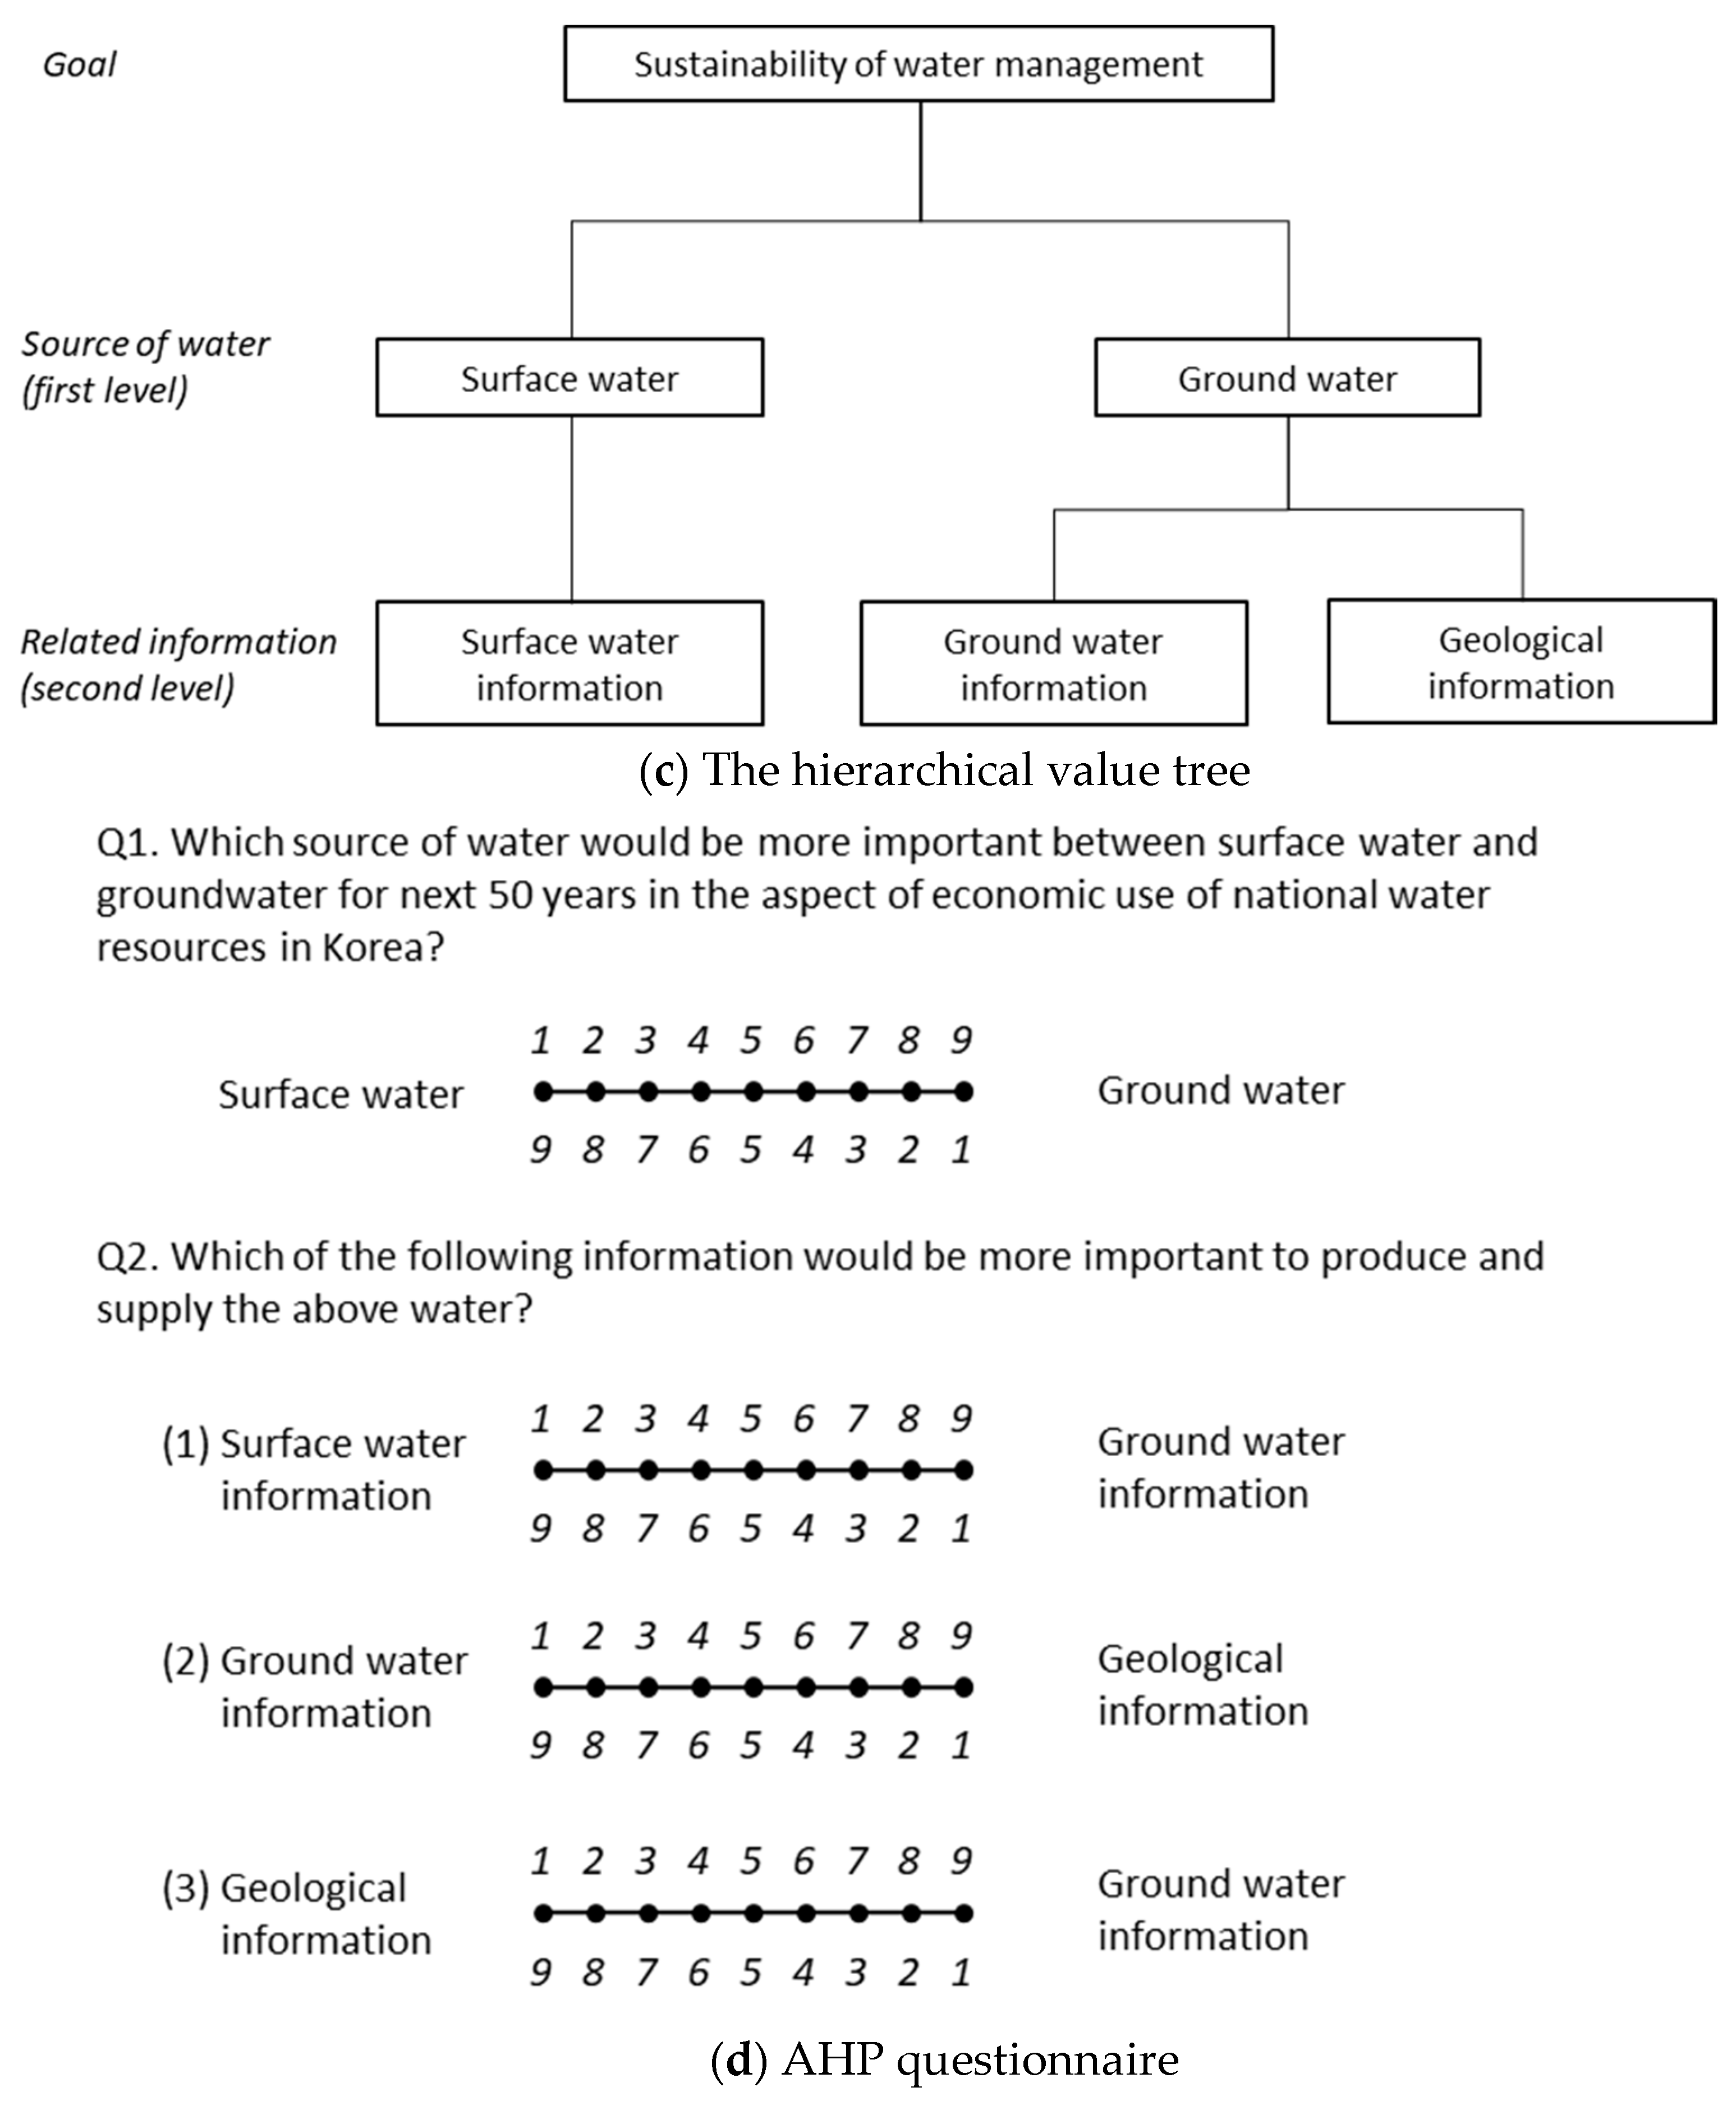
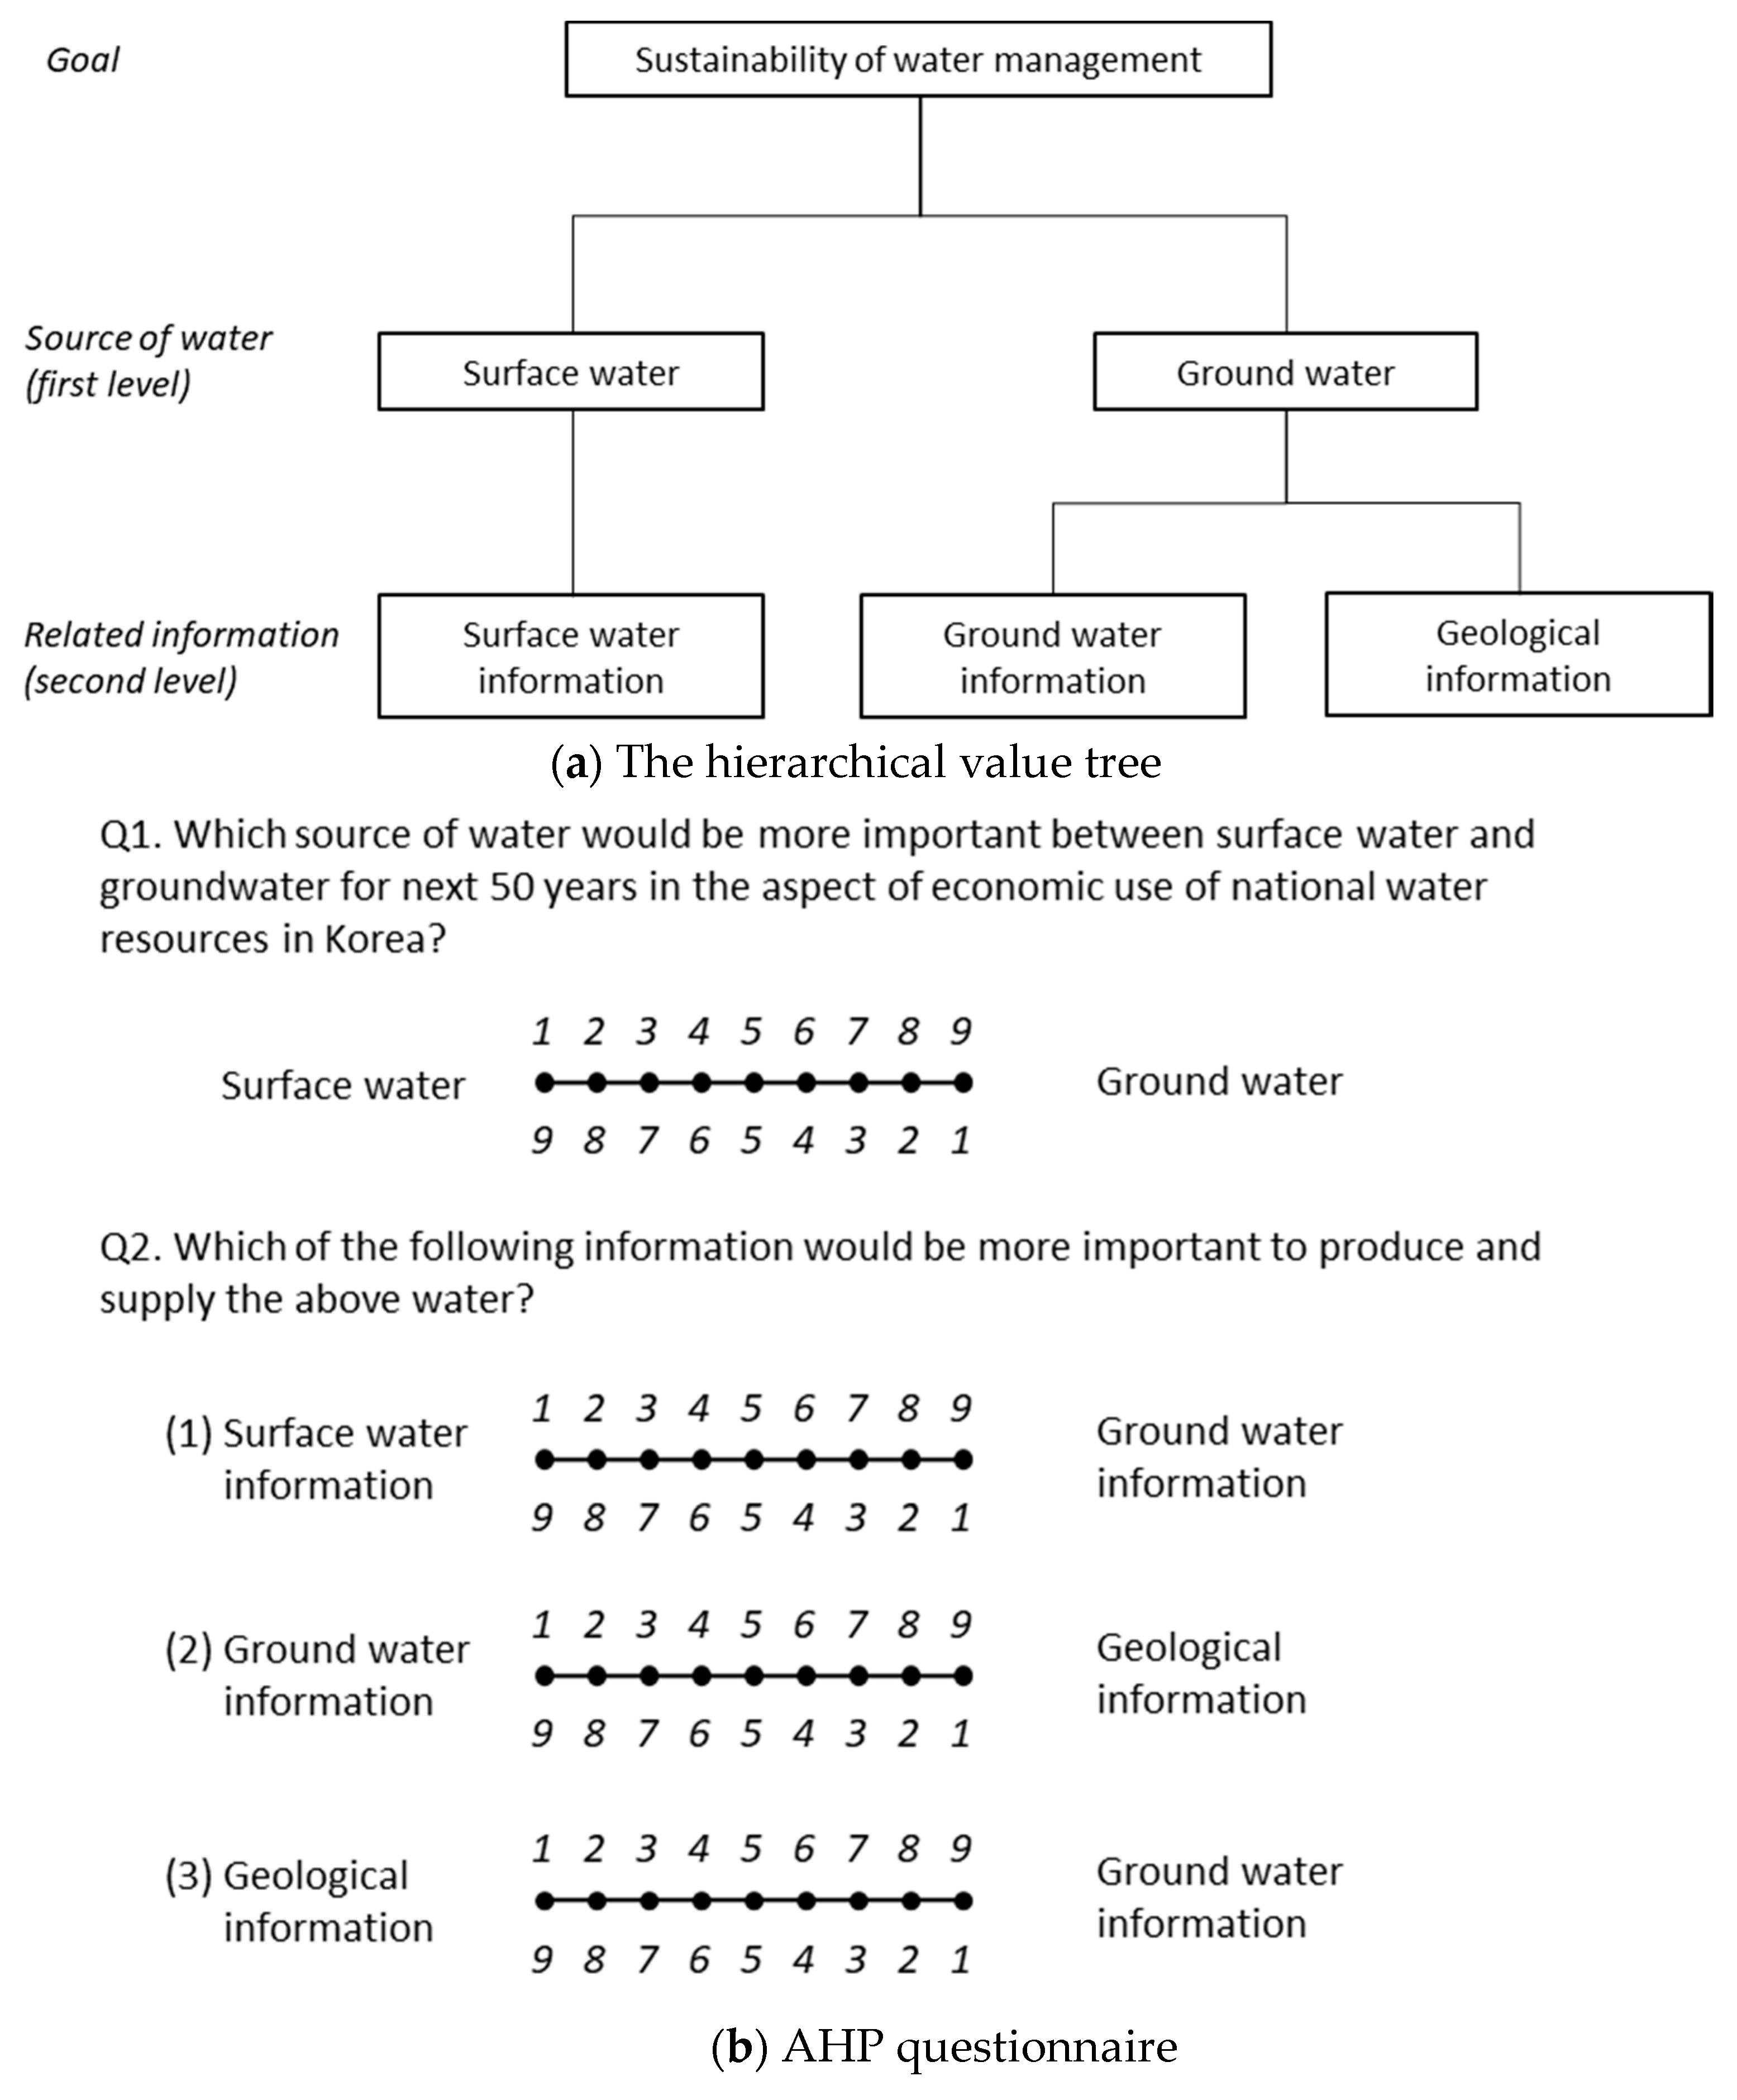
2.3. Analytic Hierarchy Process and Pairwise Comparison
3. Cost and Benefit of Groundwater Monitoring Networks
3.1. Cost
3.2. Benefits
4. Results and Sensitivity Test
5. Conclusions and Discussion
Author Contributions
Funding
Conflicts of Interest
Appendix A

| Year | NGMN | Construction | Installation | Service | Replacement | GDP Deflator * | Discount Rate * | |||
|---|---|---|---|---|---|---|---|---|---|---|
| Plan | Cost | Number of RTU | RTU | Battery | ||||||
| 2011 | 345 | 10 | 399,650 | 111,818 | 1,858,274 | 44 | 154,736 | 4886 | 101.8 | 6.5% |
| 2012 | 355 | 10 | 382,609 | 111,818 | 1,637,538 | 40 | 145,920 | 4608 | 105.6 | |
| 2013 | 365 | 10 | 390,846 | 111,818 | 1,657,199 | 52 | 194,007 | 6127 | 108.0 | |
| 2014 | 386 | 21 | 895,369 | 254,610 | 2,215,742 | 85 | 322,744 | 10,192 | 110.4 | |
| 2015 | 406 | 21 | 914,834 | 260,145 | 2,466,026 | 66 | 255,723 | 8075 | 112.8 | |
| 2016 | 427 | 21 | 934,298 | 265,680 | 2,730,069 | 58 | 229,327 | 7242 | 115.2 | |
| 2017 | 448 | 21 | 953,763 | 271,215 | 3,007,910 | 41 | 165,041 | 5212 | 117.6 | |
| 2018 | 468 | 21 | 973,227 | 276,750 | 3,299,584 | 43 | 176,700 | 5580 | 120.0 | |
| 2019 | 489 | 21 | 992,692 | 282,285 | 3,605,124 | 62 | 260,573 | 8229 | 122.4 | |
| 2020 | 509 | 21 | 1,012,157 | 287,820 | 3,947,797 | 65 | 278,616 | 8798 | 124.8 | |
| 2021 | 530 | 21 | 1,031,621 | 293,355 | 4,283,300 | 61 | 266,397 | 8413 | 127.2 | |
| 2022 | 530 | 4,283,300 | 52 | 232,809 | 7352 | 129.6 | ||||
| 2023 | 530 | 4,283,300 | 85 | 385,890 | 12,186 | 132.0 | ||||
| 2024 | 530 | 4,283,300 | 66 | 304,691 | 9622 | 134.4 | ||||
| 2025 | 530 | 4,283,300 | 58 | 272,325 | 8600 | 136.8 | ||||
| 2026 | 530 | 4,283,300 | 41 | 195,355 | 6169 | 139.2 | ||||
| 2027 | 530 | 4,283,300 | 43 | 208,506 | 6584 | 141.6 | ||||
| 2028 | 530 | 4,283,300 | 62 | 306,556 | 9681 | 144.0 | ||||
| 2029 | 530 | 4,283,300 | 65 | 326,838 | 10,321 | 146.4 | ||||
| 2030 | 530 | 4,283,300 | 61 | 311,635 | 9841 | 148.8 | ||||
| 2031 | 530 | 4,283,300 | 52 | 271,610 | 8577 | 151.2 | ||||
| 2032 | 530 | 4,283,300 | 85 | 449,328 | 14,189 | 153.7 | ||||
| 2033 | 530 | 4,283,300 | 66 | 353,886 | 11,175 | 156.1 | ||||
| 2034 | 530 | 4,283,300 | 58 | 315,523 | 9964 | 158.5 | ||||
| 2035 | 530 | 4,283,300 | 41 | 225,809 | 7131 | 160.9 | ||||
| 2036 | 530 | 4,283,300 | 43 | 240,459 | 7593 | 163.3 | ||||
| 2037 | 530 | 4,283,300 | 62 | 352,753 | 11,140 | 165.7 | ||||
| 2038 | 530 | 4,283,300 | 65 | 375,283 | 11,851 | 168.1 | ||||
| 2039 | 530 | 4,283,300 | 61 | 357,081 | 11,276 | 170.5 | ||||
| 2040 | 530 | 4,283,300 | 52 | 310,591 | 9808 | 172.9 | ||||
| 2041 | 530 | 4,283,300 | 85 | 512,474 | 16,183 | 175.3 | 5.0% | |||
| 2042 | 530 | 4,283,300 | 66 | 402,854 | 12,722 | 177.7 | ||||
| 2043 | 530 | 4,283,300 | 58 | 358,522 | 11,322 | 180.1 | ||||
| 2044 | 530 | 4,283,300 | 41 | 256,122 | 8088 | 182.5 | ||||
| 2045 | 530 | 4,283,300 | 43 | 272,265 | 8598 | 184.9 | ||||
| 2046 | 530 | 4,283,300 | 62 | 398,736 | 12,592 | 187.3 | ||||
| 2047 | 530 | 4,283,300 | 65 | 423,505 | 13,374 | 189.7 | ||||
| 2048 | 530 | 4,283,300 | 61 | 402,319 | 12,705 | 192.1 | ||||
| 2049 | 530 | 4,283,300 | 37 | 248,606 | 7851 | 194.5 | ||||
| 2050 | 530 | 4,283,300 | 48 | 323,945 | 10,230 | 196.9 | ||||
| 2051 | 530 | 4,283,300 | 21 | 142,001 | 4484 | 199.3 | ||||
| 2052 | 530 | 4,283,300 | 21 | 143,711 | 4538 | 201.7 | ||||
| 2053 | 530 | 4,283,300 | 21 | 145,493 | 4595 | 204.2 | ||||
| 2054 | 530 | 4,283,300 | 28 | 197,162 | 6226 | 206.6 | ||||
| 2055 | 530 | 4,283,300 | 29 | 206,673 | 6527 | 209.0 | ||||
| 2056 | 530 | 4,283,300 | 31 | 223,652 | 7063 | 211.4 | ||||
| 2057 | 530 | 4,283,300 | 31 | 226,191 | 7143 | 213.8 | ||||
| 2058 | 530 | 4,283,300 | 10 | 74,687 | 2359 | 216.2 | ||||
| 2059 | 530 | 4,283,300 | 21 | 155,753 | 4919 | 218.6 | ||||
| 2060 | 530 | 4,283,300 | 21 | 157,463 | 4973 | 221.0 | ||||
| Year | SGMN | Construction & Installation | Service | Replacement | GDP | Discount Rate | ||||
|---|---|---|---|---|---|---|---|---|---|---|
| Nation Total | Plan | Manual | Automatic | RTU | Manual | Automatic | ||||
| 2011 | 1067 | 0 | - | - | - | 513,752 | 871,631 | 2283 | 101.8 | 6.5% |
| 2012 | 3079 | 447 | 31,941 | 6,613,380 | 45,326 | 756,016 | 1,282,655 | 2368 | 105.6 | |
| 2013 | 5092 | 447 | 32,667 | 6,763,684 | 46,356 | 1,001,354 | 1,698,896 | 2422 | 108.0 | |
| 2014 | 7106 | 447 | 33,393 | 6,913,989 | 47,386 | 1,256,833 | 2,132,340 | 2476 | 110.4 | |
| 2015 | 9121 | 447 | 34,119 | 7,064,293 | 48,416 | 1,522,452 | 2,582,989 | 2529 | 112.8 | |
| 2016 | 11137 | 447 | 34,845 | 7,214,597 | 49,446 | 1,798,211 | 3,050,842 | 2583 | 115.2 | |
| 2017 | 13154 | 447 | 35,571 | 7,364,901 | 50,476 | 2,084,111 | 3,535,899 | 2637 | 117.6 | |
| 2018 | 15172 | 447 | 36,297 | 7,515,205 | 51,506 | 2,380,151 | 4,038,160 | 2691 | 120.0 | |
| 2019 | 17191 | 447 | 37,023 | 7,665,509 | 52,537 | 2,686,331 | 4,557,624 | 2745 | 122.4 | |
| 2020 | 19211 | 447 | 37,749 | 7,815,813 | 53,567 | 3,002,651 | 5,094,293 | 2799 | 124.8 | |
| 2021 | 21232 | 447 | 38,475 | 7,966,117 | 54,597 | 3,329,112 | 5,648,166 | 2852 | 127.2 | |
| 2022 | 23254 | 447 | 39,201 | 8,116,421 | 55,627 | 3,665,713 | 6,219,242 | 2906 | 129.6 | |
| 2023 | 25277 | 447 | 39,927 | 8,266,725 | 56,657 | 4,012,454 | 6,807,523 | 2960 | 132.0 | |
| 2024 | 27301 | 447 | 40,653 | 8,417,029 | 57,687 | 4,369,336 | 7,413,008 | 3014 | 134.4 | |
| 2025 | 29326 | 447 | 41,379 | 8,567,334 | 58,717 | 4,736,358 | 8,035,696 | 3068 | 136.8 | |
| 2026 | 31352 | 447 | 42,104 | 8,717,638 | 59,748 | 5,113,520 | 8,675,589 | 3121 | 139.2 | |
| 2027 | 33379 | 447 | 42,830 | 8,867,942 | 60,778 | 5,500,822 | 9,332,685 | 3175 | 141.6 | |
| 2028 | 35407 | 447 | 43,556 | 9,018,246 | 61,808 | 5,898,265 | 10,006,986 | 3229 | 144.0 | |
| 2029 | 37436 | 447 | 44,282 | 9,168,550 | 62,838 | 6,305,848 | 10,698,491 | 3283 | 146.4 | |
| 2030 | 39466 | 447 | 45,008 | 9,318,854 | 63,868 | 6723571 | 1,1407,199 | 3337 | 148.8 | |
| 2031 | 41497 | 447 | 45,734 | 9,469,158 | 64,898 | 7,151,435 | 12,133,112 | 3391 | 151.2 | |
| 2032 | 7,269,679 | 12,333,725 | 3447 | 153.7 | ||||||
| 2033 | 7,383,194 | 12,526,314 | 3500 | 156.1 | ||||||
| 2034 | 7,496,709 | 12,718,903 | 3554 | 158.5 | ||||||
| 2035 | 7,610,224 | 12,911,493 | 3608 | 160.9 | ||||||
| 2036 | 7,723,739 | 13,104,082 | 3662 | 163.3 | ||||||
| 2037 | 7,837,254 | 13,296,671 | 3716 | 165.7 | ||||||
| 2038 | 7,950,768 | 13,489,260 | 3770 | 168.1 | ||||||
| 2039 | 8,064,283 | 13,681,849 | 3823 | 170.5 | ||||||
| 2040 | 8,177,798 | 13,874,438 | 3877 | 172.9 | ||||||
| 2041 | 8,291,313 | 14,067,027 | 3931 | 175.3 | 5.0% | |||||
| 2042 | 8,404,828 | 14,259,616 | 3985 | 177.7 | ||||||
| 2043 | 8,518,343 | 14,452,205 | 4039 | 180.1 | ||||||
| 2044 | 8,631,857 | 14,644,794 | 4092 | 182.5 | ||||||
| 2045 | 8,745,372 | 14,837,383 | 4146 | 184.9 | ||||||
| 2046 | 8,858,887 | 15,029,972 | 4200 | 187.3 | ||||||
| 2047 | 8,972,402 | 15,222,561 | 4254 | 189.7 | ||||||
| 2048 | 9,085,917 | 15,415,150 | 4308 | 192.1 | ||||||
| 2049 | 9,199,432 | 15,607,740 | 4362 | 194.5 | ||||||
| 2050 | 9,312,946 | 15,800,329 | 4415 | 196.9 | ||||||
| 2051 | 9,426,461 | 15,992,918 | 4469 | 199.3 | ||||||
| 2052 | 9,539,976 | 16,185,507 | 4523 | 201.7 | ||||||
| 2053 | 9,658,221 | 16,386,120 | 4579 | 204.2 | ||||||
| 2054 | 9,771,736 | 16,578,709 | 4633 | 206.6 | ||||||
| 2055 | 9,885,250 | 16,771,299 | 4687 | 209.0 | ||||||
| 2056 | 9,998,765 | 16,963,888 | 4740 | 211.4 | ||||||
| 2057 | 10,112,280 | 17,156,477 | 4794 | 213.8 | ||||||
| 2058 | 10,225,795 | 17,349,066 | 4848 | 216.2 | ||||||
| 2059 | 10,339,310 | 17,541,655 | 4902 | 218.6 | ||||||
| 2060 | 10,452,825 | 17,734,244 | 4956 | 221.0 | ||||||
| Year | GMFA | Construction | Installation | Service | Replacement | GDP Deflator | Discount Rate | ||
|---|---|---|---|---|---|---|---|---|---|
| Plan | Cost | Device | Battery | ||||||
| 2011 | 84 | 13 | 520,392 | 9,967 | 387,474 | 59,784 | 1888 | 101.8 | 6.5% |
| 2012 | 107 | 23 | 955,061 | 10,339 | 485,809 | 83,904 | 2650 | 105.6 | |
| 2013 | 212 | 105 | 4,469,768 | 10,574 | 1,219,556 | 418,795 | 13,225 | 108 | |
| 2014 | 318 | 105 | 4,569,096 | 10,809 | 1,927,294 | 450,984 | 14,242 | 110.4 | |
| 2015 | 423 | 105 | 4,668,425 | 11,044 | 2,703,688 | 452,995 | 14,305 | 112.8 | |
| 2016 | 528 | 105 | 4,767,753 | 11,279 | 3,548,998 | 458,653 | 14,484 | 115.2 | |
| 2017 | 633 | 105 | 4,867,081 | 11,514 | 4,463,469 | 480,396 | 15,170 | 117.6 | |
| 2018 | 739 | 105 | 4,966,409 | 11,749 | 5,447,333 | 490,200 | 15,480 | 120.0 | |
| 2019 | 844 | 105 | 5,065,737 | 11,984 | 6,539,296 | 516,917 | 16,324 | 122.4 | |
| 2020 | 949 | 105 | 5,165,066 | 12,219 | 7,669,532 | 552,921 | 17,461 | 124.8 | |
| 2021 | 1056 | 107 | 5,351,925 | 12,454 | 8,534,273 | 963,424 | 30,424 | 127.2 | |
| 2022 | 1056 | 8,534,273 | 529,416 | 16,718 | 129.6 | ||||
| 2023 | 1056 | 8,534,273 | 530,100 | 16,740 | 132.0 | ||||
| 2024 | 1056 | 8,534,273 | 535,095 | 16,898 | 134.4 | ||||
| 2025 | 1056 | 8,534,273 | 558,828 | 17,647 | 136.8 | ||||
| 2026 | 1056 | 8,534,273 | 568,632 | 17,957 | 139.2 | ||||
| 2027 | 1056 | 8,534,273 | 598,003 | 18,884 | 141.6 | ||||
| 2028 | 1056 | 8,534,273 | 637,985 | 20,147 | 144.0 | ||||
| 2029 | 1056 | 8,534,273 | 1,108,847 | 35,016 | 146.4 | ||||
| 2030 | 1056 | 8,534,273 | 607,848 | 19,195 | 148.8 | ||||
| 2031 | 1056 | 8,534,273 | 607,205 | 19,175 | 151.2 | ||||
| 2032 | 1056 | 8,534,273 | 611,936 | 19,324 | 153.7 | ||||
| 2033 | 1056 | 8,534,273 | 637,669 | 20,137 | 156.1 | ||||
| 2034 | 1056 | 8,534,273 | 647,473 | 20,447 | 158.5 | ||||
| 2035 | 1056 | 8,534,273 | 679,510 | 21,458 | 160.9 | ||||
| 2036 | 1056 | 8,534,273 | 723,493 | 22,847 | 163.3 | ||||
| 2037 | 1056 | 8,534,273 | 1,255,027 | 39,632 | 165.7 | ||||
| 2038 | 1056 | 8,534,273 | 686,689 | 21,685 | 168.1 | ||||
| 2039 | 1056 | 8,534,273 | 684,713 | 21,623 | 170.5 | ||||
| 2040 | 1056 | 8,534,273 | 688,378 | 21,738 | 172.9 | ||||
| 2041 | 1056 | 8,534,273 | 716,101 | 22,614 | 175.3 | 5.0% | |||
| 2042 | 1056 | 8,534,273 | 725,905 | 22,923 | 177.7 | ||||
| 2043 | 1056 | 8,534,273 | 760,595 | 24,019 | 180.1 | ||||
| 2044 | 1056 | 8,534,273 | 808,558 | 25,533 | 182.5 | ||||
| 2045 | 1056 | 8,534,273 | 1,400,449 | 44,225 | 184.9 | ||||
| 2046 | 1056 | 8,534,273 | 765,121 | 24,162 | 187.3 | ||||
| 2047 | 1056 | 8,534,273 | 761,818 | 24,057 | 189.7 | ||||
| 2048 | 1056 | 8,534,273 | 764,820 | 24,152 | 192.1 | ||||
| 2049 | 1056 | 8,534,273 | 794,533 | 25,091 | 194.5 | ||||
| 2050 | 1056 | 8,534,273 | 790,733 | 24,971 | 196.9 | ||||
| 2051 | 1056 | 8,534,273 | 814,141 | 25,710 | 199.3 | ||||
| 2052 | 1056 | 8,534,273 | 893,623 | 28,220 | 201.7 | ||||
| 2053 | 1056 | 8,534,273 | 1,497,250 | 47,282 | 204.2 | ||||
| 2054 | 1056 | 8,534,273 | 751,179 | 23,721 | 206.6 | ||||
| 2055 | 1056 | 8,534,273 | 759,905 | 23,997 | 209.0 | ||||
| 2056 | 1056 | 8,534,273 | 768,631 | 24,273 | 211.4 | ||||
| 2057 | 1056 | 8,534,273 | 777,357 | 24,548 | 213.8 | ||||
| 2058 | 1056 | 8,534,273 | 786,084 | 24,824 | 216.2 | ||||
| 2059 | 1056 | 8,534,273 | 794,810 | 25,099 | 218.6 | ||||
| 2060 | 1056 | 8,534,273 | 803,536 | 25,375 | 221.0 | ||||
| Year | SIMN | Construction | Installation | Service | Replacement | GDP Deflator | Discount Rate | ||
|---|---|---|---|---|---|---|---|---|---|
| Plan | Cost | Device | Battery | ||||||
| 2011 | 117 | 8 | 336,253 | 83,724 | 78,890 | 58,114 | 1835 | 101.8 | 6.5% |
| 2012 | 127 | 10 | 415,244 | 103,392 | 608,905 | 66,120 | 2088 | 105.6 | |
| 2013 | 136 | 9 | 382,213 | 95,168 | 843,950 | 63,892 | 2018 | 108.0 | |
| 2014 | 168 | 32 | 1,367,473 | 340,489 | 1,122,504 | 151,123 | 4772 | 110.4 | |
| 2015 | 199 | 32 | 1,397,201 | 347,891 | 1,435,606 | 161,714 | 5107 | 112.8 | |
| 2016 | 231 | 32 | 1,426,928 | 355,293 | 1,784,823 | 191,122 | 6035 | 115.2 | |
| 2017 | 262 | 32 | 1,456,656 | 362,694 | 2,171,731 | 195,104 | 6161 | 117.6 | |
| 2018 | 294 | 32 | 1,486,384 | 370,096 | 2,597,902 | 199,085 | 6287 | 120.0 | |
| 2019 | 325 | 32 | 1,516,111 | 377,498 | 3,083,060 | 203,067 | 6413 | 122.4 | |
| 2020 | 357 | 32 | 1,545,839 | 384,900 | 3,595,645 | 207,049 | 6538 | 124.8 | |
| 2021 | 388 | 32 | 1,575,567 | 392,302 | 3,988,609 | 218,061 | 6886 | 127.2 | |
| 2022 | 388 | 4,063,866 | 76,670 | 2421 | 129.6 | ||||
| 2023 | 388 | 4,139,123 | 180,690 | 5706 | 132.0 | ||||
| 2024 | 388 | 4,214,379 | 192,681 | 6085 | 134.4 | ||||
| 2025 | 388 | 4,289,636 | 226,957 | 7167 | 136.8 | ||||
| 2026 | 388 | 4,364,893 | 230,939 | 7293 | 139.2 | ||||
| 2027 | 388 | 4,440,150 | 234,921 | 7419 | 141.6 | ||||
| 2028 | 388 | 4,515,406 | 238,903 | 7544 | 144.0 | ||||
| 2029 | 388 | 4,590,663 | 242,884 | 7670 | 146.4 | ||||
| 2030 | 388 | 4,665,920 | 255,091 | 8055 | 148.8 | ||||
| 2031 | 388 | 4,741,177 | 89,449 | 2825 | 151.2 | ||||
| 2032 | 388 | 4,819,569 | 210,394 | 6644 | 153.7 | ||||
| 2033 | 388 | 4,894,826 | 223,791 | 7067 | 156.1 | ||||
| 2034 | 388 | 4,970,083 | 262,959 | 8304 | 158.5 | ||||
| 2035 | 388 | 5,045,340 | 266,940 | 8430 | 160.9 | ||||
| 2036 | 388 | 5,120,596 | 270,922 | 8555 | 163.3 | ||||
| 2037 | 388 | 5,195,853 | 274,904 | 8681 | 165.7 | ||||
| 2038 | 388 | 5,271,110 | 278,886 | 8807 | 168.1 | ||||
| 2039 | 388 | 5,346,367 | 292,291 | 9230 | 170.5 | ||||
| 2040 | 388 | 5,421,623 | 102,286 | 3230 | 172.9 | ||||
| 2041 | 388 | 5,496,880 | 239,962 | 7578 | 175.3 | 5.0% | |||
| 2042 | 388 | 5,572,137 | 254,757 | 8045 | 177.7 | ||||
| 2043 | 388 | 5,647,394 | 298,794 | 9436 | 180.1 | ||||
| 2044 | 388 | 5,722,651 | 302,776 | 9561 | 182.5 | ||||
| 2045 | 388 | 5,797,907 | 306,758 | 9687 | 184.9 | ||||
| 2046 | 388 | 5,873,164 | 310,739 | 9813 | 187.3 | ||||
| 2047 | 388 | 5,948,421 | 314,721 | 9939 | 189.7 | ||||
| 2048 | 388 | 6,023,678 | 329,321 | 10400 | 192.1 | ||||
| 2049 | 388 | 6,098,934 | 115,064 | 3634 | 194.5 | ||||
| 2050 | 388 | 6,174,191 | 269,529 | 8511 | 196.9 | ||||
| 2051 | 388 | 6,249,448 | 285,724 | 9023 | 199.3 | ||||
| 2052 | 388 | 6,324,705 | 278,016 | 8779 | 201.7 | ||||
| 2053 | 388 | 6,403,097 | 281,462 | 8888 | 204.2 | ||||
| 2054 | 388 | 6,478,354 | 284,770 | 8993 | 206.6 | ||||
| 2055 | 388 | 6,553,611 | 288,078 | 9097 | 209.0 | ||||
| 2056 | 388 | 6,628,868 | 291,386 | 9202 | 211.4 | ||||
| 2057 | 388 | 6,704,124 | 306,511 | 9679 | 213.8 | ||||
| 2058 | 388 | 6,779,381 | 67,219 | 2123 | 216.2 | ||||
| 2059 | 388 | 6,854,638 | 237,877 | 7512 | 218.6 | ||||
| 2060 | 388 | 6,929,895 | 240,488 | 7594 | 221.0 | ||||
| Year | GQM | Construction | Service | Replacement | Water Sample | GDP Deflator | Discount Rate | |||||||
|---|---|---|---|---|---|---|---|---|---|---|---|---|---|---|
| TOTAL | GQMN | GPMN | GQMN | GPMN | GQMN Labor | GQMN Travel | GPMN Labor | GPMN Travel | Fee | Labor | ||||
| 2011 | 91 | 58 | 33 | 4,568,141 | 95,794 | 7872 | 14,348 | 498 | 907 | 2165 | 100,539 | 5328 | 101.8 | 6.5% |
| 2012 | 111 | 72 | 39 | 5,882,476 | 117,437 | 10,137 | 18,476 | 610 | 1112 | 2788 | 128,860 | 6,741 | 105.6 | |
| 2013 | 273 | 139 | 134 | 11,581,125 | 412,364 | 19,958 | 36,374 | 2142 | 3905 | 5488 | 272,267 | 16,926 | 108.0 | |
| 2014 | 363 | 205 | 158 | 17,527,106 | 497,554 | 30,205 | 55,049 | 2585 | 4711 | 8306 | 399,081 | 23,064 | 110.4 | |
| 2015 | 454 | 272 | 182 | 23,737,872 | 585,406 | 40,908 | 74,556 | 3041 | 5543 | 11,249 | 531,427 | 29,453 | 112.8 | |
| 2016 | 540 | 305 | 235 | 27,148,520 | 773,278 | 46,786 | 85,269 | 4017 | 7322 | 12,866 | 618,421 | 35,777 | 115.2 | |
| 2017 | 626 | 337 | 289 | 30,680,234 | 968,459 | 52,872 | 96,361 | 5031 | 9170 | 14,539 | 708,568 | 42,339 | 117.6 | |
| 2018 | 712 | 370 | 342 | 34,333,014 | 1,170,949 | 59,167 | 107,834 | 6083 | 11,087 | 16,270 | 801,869 | 49,138 | 120.0 | |
| 2019 | 798 | 402 | 396 | 38,106,860 | 1,380,748 | 65,670 | 119,687 | 7173 | 13,074 | 18,059 | 898,323 | 56,175 | 122.4 | |
| 2020 | 884 | 435 | 449 | 42,001,772 | 1,597,856 | 72,383 | 131,920 | 8,301 | 15,130 | 19,904 | 997,932 | 63,449 | 124.8 | |
| 2021 | 1149 | 566 | 584 | 55,662,190 | 2,117,522 | 95,924 | 174,825 | 11,001 | 20,050 | 26,378 | 1,322,492 | 84,085 | 127.2 | |
| 2022 | 1415 | 696 | 719 | 69,807,614 | 2,655,638 | 120,301 | 219,253 | 13,797 | 25,145 | 33,081 | 1,658,576 | 105,453 | 129.6 | |
| 2023 | 1680 | 827 | 853 | 84,438,046 | 3,212,205 | 145,514 | 265,204 | 16,688 | 30,415 | 40,015 | 2,006,183 | 127,554 | 132.0 | |
| 2024 | 1946 | 957 | 988 | 99,553,485 | 3,787,222 | 171,563 | 312,679 | 19,676 | 35,860 | 47,178 | 2,365,313 | 150,387 | 134.4 | |
| 2025 | 2211 | 1088 | 1123 | 115,153,931 | 4,380,690 | 198,448 | 361,677 | 22,759 | 41,479 | 54,571 | 2,735,967 | 173,953 | 136.8 | |
| 2026 | 2463 | 1131 | 1331 | 121,848,218 | 5,283,957 | 209,984 | 382,703 | 27,452 | 50,032 | 57,743 | 2,961,519 | 197,147 | 139.2 | |
| 2027 | 2714 | 1175 | 1539 | 128,703,680 | 6,215,720 | 221,798 | 404,235 | 32,293 | 58,854 | 60,992 | 3,193,193 | 221,036 | 141.6 | |
| 2028 | 2966 | 1218 | 1748 | 135,720,316 | 7,175,980 | 233,890 | 426,273 | 37,281 | 67,947 | 64,317 | 3,430,989 | 245,619 | 144.0 | |
| 2029 | 3217 | 1262 | 1956 | 142,898,125 | 8,164,737 | 246,260 | 448,817 | 42,418 | 77,309 | 67,719 | 3,674,908 | 270,897 | 146.4 | |
| 2030 | 3469 | 1305 | 2164 | 150,237,109 | 9,181,992 | 258,907 | 471,867 | 47,703 | 86,941 | 71,196 | 3,924,950 | 296,869 | 148.8 | |
| 2031 | 3469 | 1305 | 2164 | 263,083 | 479,478 | 48,473 | 88,343 | 72,345 | 3,988,255 | 301,657 | 151.2 | |||
| 2032 | 3469 | 1305 | 2164 | 267,433 | 487,406 | 49,274 | 89,804 | 73,541 | 4,054,199 | 306,645 | 153.7 | |||
| 2033 | 3469 | 1305 | 2164 | 271,609 | 495,017 | 50,044 | 91,206 | 74,689 | 4,117,504 | 311,433 | 156.1 | |||
| 2034 | 3469 | 1305 | 2164 | 275,785 | 502,627 | 50,813 | 92,608 | 75,838 | 4,180,810 | 316,222 | 158.5 | |||
| 2035 | 3469 | 1305 | 2164 | 279,961 | 510,238 | 51,582 | 94,011 | 76,986 | 4,244,116 | 321,010 | 160.9 | |||
| 2036 | 3469 | 1305 | 2164 | 284,137 | 517,849 | 52,352 | 95,413 | 78,134 | 4,307,421 | 325,798 | 163.3 | |||
| 2037 | 3469 | 1305 | 2164 | 288,313 | 525,460 | 53,121 | 96,815 | 79,283 | 4,370,727 | 330,586 | 165.7 | |||
| 2038 | 3469 | 1305 | 2164 | 292,489 | 533,070 | 53,891 | 98,217 | 80,431 | 4,434,033 | 335,374 | 168.1 | |||
| 2039 | 3469 | 1305 | 2164 | 296,665 | 540,681 | 54,660 | 99,620 | 81,579 | 4,497,338 | 340,163 | 170.5 | |||
| 2040 | 3469 | 1305 | 2164 | 300,841 | 548,292 | 55,429 | 101,022 | 82,728 | 4,560,644 | 344,951 | 172.9 | |||
| 2041 | 3469 | 1305 | 2164 | 305,016 | 555,903 | 56,199 | 102,424 | 83,876 | 4,623,950 | 349,739 | 175.3 | 5.0% | ||
| 2042 | 3469 | 1305 | 2164 | 309,192 | 563,513 | 56,968 | 103,827 | 85,024 | 4,687,255 | 354,527 | 177.7 | |||
| 2043 | 3469 | 1305 | 2164 | 313,368 | 571,124 | 57,738 | 105,229 | 86,173 | 4,750,561 | 359,315 | 180.1 | |||
| 2044 | 3469 | 1305 | 2164 | 317,544 | 578,735 | 58,507 | 106,631 | 87,321 | 4,813,866 | 364,104 | 182.5 | |||
| 2045 | 3469 | 1305 | 2164 | 321,720 | 586,346 | 59,276 | 108,033 | 88,469 | 4,877,172 | 368,892 | 184.9 | |||
| 2046 | 3469 | 1305 | 2164 | 325,896 | 593,956 | 60,046 | 109,436 | 89,618 | 4,940,478 | 373,680 | 187.3 | |||
| 2047 | 3469 | 1305 | 2164 | 330,072 | 601,567 | 60,815 | 110,838 | 90,766 | 5,003,783 | 378,468 | 189.7 | |||
| 2048 | 3469 | 1305 | 2164 | 334,248 | 609,178 | 61,585 | 112,240 | 91,914 | 5,067,089 | 383,256 | 192.1 | |||
| 2049 | 3469 | 1305 | 2164 | 338,424 | 616,789 | 62,354 | 113,642 | 93,063 | 5,130,395 | 388,045 | 194.5 | |||
| 2050 | 3469 | 1305 | 2164 | 342,600 | 624,399 | 63,124 | 115,045 | 94,211 | 5,193,700 | 392,833 | 196.9 | |||
| 2051 | 3469 | 1305 | 2164 | 346,776 | 632,010 | 63,893 | 116,447 | 95,359 | 5,257,006 | 397,621 | 199.3 | |||
| 2052 | 3469 | 1305 | 2164 | 350,952 | 639,621 | 64,662 | 117,849 | 96,508 | 5,320,312 | 402,409 | 201.7 | |||
| 2053 | 3469 | 1305 | 2164 | 355,302 | 647,549 | 65,464 | 119,310 | 97,704 | 5,386,255 | 407,397 | 204.2 | |||
| 2054 | 3469 | 1305 | 2164 | 359,477 | 655,160 | 66,233 | 120,712 | 98,852 | 5,449,561 | 412,185 | 206.6 | |||
| 2055 | 3469 | 1305 | 2164 | 363,653 | 662,770 | 67,003 | 122,115 | 100,000 | 5,512,866 | 416,973 | 209.0 | |||
| 2056 | 3469 | 1305 | 2164 | 367,829 | 670,381 | 67,772 | 123,517 | 101,149 | 5,576,172 | 421,762 | 211.4 | |||
| 2057 | 3469 | 1305 | 2164 | 372,005 | 677,992 | 68,541 | 124,919 | 102,297 | 5,639,478 | 426,550 | 213.8 | |||
| 2058 | 3469 | 1305 | 2164 | 376,181 | 685,603 | 69,311 | 126,321 | 103,445 | 5,702,783 | 431,338 | 216.2 | |||
| 2059 | 3469 | 1305 | 2164 | 380,357 | 693,213 | 70,080 | 127,724 | 104,594 | 5,766,089 | 436,126 | 218.6 | |||
| 2060 | 3469 | 1305 | 2164 | 384,533 | 700,824 | 70,850 | 129,126 | 105,742 | 5,829,394 | 440,915 | 221.0 | |||
| Year | LQMN | Construction | Service | Replacement | Water Sample | GDP Deflator | Discount Rate | |||
|---|---|---|---|---|---|---|---|---|---|---|
| Nation Total | Plan | Cost | Labor | Travel | Fee | Labor | ||||
| 2011 | 2022 | 346,890 | 91,483 | 166,730 | 65,932 | 257,861 | 103,812 | 101.8 | 6.5% | |
| 2012 | 2142 | 120 | 359,839 | 100,506 | 183,175 | 72,435 | 283,295 | 114,052 | 105.6 | |
| 2013 | 2261 | 120 | 368,017 | 108,526 | 197,792 | 78,215 | 305,901 | 123,153 | 108.0 | |
| 2014 | 2381 | 120 | 376,196 | 116,801 | 212,874 | 84,179 | 329,226 | 132,543 | 110.4 | |
| 2015 | 2500 | 120 | 4,020,646 | 125,331 | 228,420 | 90,327 | 353,269 | 142,223 | 112.8 | |
| 2016 | 3750 | 1250 | 4,106,191 | 191,997 | 349,920 | 138,373 | 541,178 | 217,873 | 115.2 | |
| 2017 | 5000 | 1250 | 5,588,983 | 261,329 | 476,280 | 188,340 | 736,604 | 296,549 | 117.6 | |
| 2018 | 6667 | 1667 | 5,703,044 | 355,549 | 648,000 | 256,245 | 1,002,182 | 403,468 | 120.0 | |
| 2019 | 8333 | 1667 | 5,817,105 | 453,325 | 826,200 | 326,713 | 1,277,782 | 514,422 | 122.4 | |
| 2020 | 10,000 | 1667 | 7,117,398 | 554,657 | 1,010,880 | 399,743 | 1,563,404 | 629,410 | 124.8 | |
| 2021 | 12,000 | 2000 | 7,254,272 | 678,388 | 1,236,384 | 488,916 | 1,912,163 | 769,817 | 127.2 | |
| 2022 | 14,000 | 2000 | 7,391,145 | 806,385 | 1,469,664 | 581,165 | 2,272,948 | 915,066 | 129.6 | |
| 2023 | 16,000 | 2000 | 7,528,018 | 938,650 | 1,710,720 | 676,488 | 2,645,760 | 1,065,156 | 132.0 | |
| 2024 | 18,000 | 2000 | 7,664,891 | 1,075,180 | 1,959,552 | 774,886 | 3,030,598 | 1,220,088 | 134.4 | |
| 2025 | 20,000 | 2000 | 10,142,293 | 1,215,978 | 2,216,160 | 876,359 | 3,427,462 | 1,379,861 | 136.8 | |
| 2026 | 22,600 | 2600 | 10,320,228 | 1,398,161 | 2,548,195 | 1,007,659 | 3,940,980 | 1,586,598 | 139.2 | |
| 2027 | 25,200 | 2600 | 10,498,163 | 1,585,891 | 2,890,339 | 1,142,957 | 4,470,132 | 1,799,630 | 141.6 | |
| 2028 | 27,800 | 2600 | 10,676,098 | 1,779,168 | 3,242,592 | 1,282,252 | 5,014,918 | 2,018,955 | 144.0 | |
| 2029 | 30,400 | 2600 | 10,854,033 | 1,977,991 | 3,604,954 | 1,425,545 | 5,575,338 | 2,244,574 | 146.4 | |
| 2030 | 33,000 | 2600 | 11,031,968 | 2,182,360 | 3,977,424 | 1,572,834 | 6,151,392 | 2,476,488 | 148.8 | |
| 2031 | 33,000 | 2,217,560 | 4,041,576 | 1,598,203 | 6,250,608 | 2,516,431 | 151.2 | |||
| 2032 | 33,000 | 2,254,226 | 4,108,401 | 1,624,628 | 6,353,958 | 2,558,039 | 153.7 | |||
| 2033 | 33,000 | 2,289,425 | 4,172,553 | 1,649,996 | 6,453,174 | 2,597,982 | 156.1 | |||
| 2034 | 33,000 | 2,324,624 | 4,236,705 | 1,675,365 | 6,552,390 | 2,637,926 | 158.5 | |||
| 2035 | 33,000 | 2,359,824 | 4,300,857 | 1,700,733 | 6,651,606 | 2,677,869 | 160.9 | |||
| 2036 | 33,000 | 2,395,023 | 4,365,009 | 1,726,101 | 6,750,822 | 2,717,812 | 163.3 | |||
| 2037 | 33,000 | 2,430,222 | 4,429,161 | 1,751,469 | 6,850,038 | 2,757,756 | 165.7 | |||
| 2038 | 33,000 | 2,465,422 | 4,493,313 | 1,776,838 | 6,949,254 | 2,797,699 | 168.1 | |||
| 2039 | 33,000 | 2,500,621 | 4,557,465 | 1,802,206 | 7,048,470 | 2,837,642 | 170.5 | |||
| 2040 | 33,000 | 2,535,821 | 4,621,617 | 1,827,574 | 7,147,686 | 2,877,586 | 172.9 | |||
| 2041 | 33,000 | 2,571,020 | 4,685,769 | 1,852,943 | 7,246,902 | 2,917,529 | 175.3 | 5.0% | ||
| 2042 | 33,000 | 2,606,219 | 4,749,921 | 1,878,311 | 7,346,118 | 2,957,472 | 177.7 | |||
| 2043 | 33,000 | 2,641,419 | 4,814,073 | 1,903,679 | 7,445,334 | 2,997,416 | 180.1 | |||
| 2044 | 33,000 | 2,676,618 | 4,878,225 | 1,929,048 | 7,544,550 | 3,037,359 | 182.5 | |||
| 2045 | 33,000 | 2,711,817 | 4,942,377 | 1,954,416 | 7,643,766 | 3,077,303 | 184.9 | |||
| 2046 | 33,000 | 2,747,017 | 5,006,529 | 1,979,784 | 7,742,982 | 3,117,246 | 187.3 | |||
| 2047 | 33,000 | 2,782,216 | 5,070,681 | 2,005,152 | 7,842,198 | 3,157,189 | 189.7 | |||
| 2048 | 33,000 | 2,817,415 | 5,134,833 | 2,030,521 | 7,941,414 | 3,197,133 | 192.1 | |||
| 2049 | 33,000 | 2,852,615 | 5,198,985 | 2,055,889 | 8,040,630 | 3,237,076 | 194.5 | |||
| 2050 | 33,000 | 2,887,814 | 5,263,137 | 2,081,257 | 8,139,846 | 3,277,019 | 196.9 | |||
| 2051 | 33,000 | 2,923,014 | 5,327,289 | 2,106,626 | 8,239,062 | 3,316,963 | 199.3 | |||
| 2052 | 33,000 | 2,958,213 | 5,391,441 | 2,131,994 | 8,338,278 | 3,356,906 | 201.7 | |||
| 2053 | 33,000 | 2,994,879 | 5,458,266 | 2,158,419 | 8,441,628 | 3,398,514 | 204.2 | |||
| 2054 | 33,000 | 3,030,078 | 5,522,418 | 2,183,788 | 8,540,844 | 3,438,457 | 206.6 | |||
| 2055 | 33,000 | 3,065,278 | 5,586,570 | 2,209,156 | 8,640,060 | 3,478,400 | 209.0 | |||
| 2056 | 33,000 | 3,100,477 | 5,650,722 | 2,234,524 | 8,739,276 | 3,518,344 | 211.4 | |||
| 2057 | 33,000 | 3,135,676 | 5,714,874 | 2,259,892 | 8,838,492 | 3,558,287 | 213.8 | |||
| 2058 | 33,000 | 3,170,876 | 5,779,026 | 2,285,261 | 8,937,708 | 3,598,230 | 216.2 | |||
| 2059 | 33,000 | 3,206,075 | 5,843,178 | 2,310,629 | 9,036,924 | 3,638,174 | 218.6 | |||
| 2060 | 33,000 | 3,241,274 | 5,907,330 | 2,335,997 | 9,136,140 | 3,678,117 | 221.0 | |||
Appendix B
| Year | NGMN | SGMN | GMFN | QMN | LQMN | SIMN |
|---|---|---|---|---|---|---|
| 2010 | 335 | 1067 | 71 | 58 | 2022 | 136 |
| 2011 | 348 | 1067 | 84 | 91 | 2022 | 134 |
| 2012 | 414 | 1008 | 107 | 48 | 2123 | 143 |
| 2013 | 435 | 1069 | 79 | 52 | 2144 | 153 |
| 2014 | 455 | 1131 | 85 | 55 | 2166 | 162 |
| 2015 | 476 | 1193 | 91 | 59 | 2187 | 172 |
| 2016 | 496 | 1255 | 97 | 63 | 2209 | 181 |
| 2017 | 517 | 1317 | 102 | 67 | 2230 | 191 |
| 2018 | 530 | 1379 | 108 | 71 | 2251 | 200 |
| 2019 | 530 | 1441 | 114 | 74 | 2273 | 210 |
| 2020 | 530 | 1503 | 119 | 78 | 2294 | 219 |
| 2021 | 530 | 1564 | 125 | 82 | 2315 | 229 |
| 2022 | 530 | 1626 | 131 | 86 | 2337 | 238 |
| 2023 | 530 | 1688 | 136 | 90 | 2358 | 248 |
| 2024 | 530 | 1750 | 142 | 94 | 2380 | 257 |
| 2025 | 530 | 1812 | 148 | 97 | 2401 | 267 |
| 2026 | 530 | 1874 | 153 | 101 | 2422 | 276 |
| 2027 | 530 | 1936 | 159 | 105 | 2444 | 286 |
| 2028 | 530 | 1997 | 165 | 109 | 2465 | 295 |
| 2029 | 530 | 2059 | 170 | 113 | 2486 | 305 |
| 2030 | 530 | 2121 | 176 | 116 | 2508 | 314 |
| 2031 | 530 | 2183 | 182 | 120 | 2529 | 324 |
| 2032 | 530 | 2245 | 187 | 124 | 2550 | 333 |
| 2033 | 530 | 2307 | 193 | 128 | 2572 | 343 |
| 2034 | 530 | 2369 | 199 | 132 | 2593 | 352 |
| 2035 | 530 | 2431 | 205 | 135 | 2615 | 362 |
| 2036 | 530 | 2492 | 210 | 139 | 2636 | 371 |
| 2037 | 530 | 2554 | 216 | 143 | 2657 | 381 |
| 2038 | 530 | 2616 | 222 | 147 | 2679 | 388 |
| 2039 | 530 | 2678 | 227 | 151 | 2700 | 388 |
| 2040 | 530 | 2740 | 233 | 155 | 2721 | 388 |
| 2041 | 530 | 2802 | 239 | 158 | 2743 | 388 |
| 2042 | 530 | 2864 | 244 | 162 | 2764 | 388 |
| 2043 | 530 | 2925 | 250 | 166 | 2786 | 388 |
| 2044 | 530 | 2987 | 256 | 170 | 2807 | 388 |
| 2045 | 530 | 3049 | 261 | 174 | 2828 | 388 |
| 2046 | 530 | 3111 | 267 | 177 | 2850 | 388 |
| 2047 | 530 | 3173 | 273 | 181 | 2871 | 388 |
| 2048 | 530 | 3235 | 278 | 185 | 2892 | 388 |
| 2049 | 530 | 3297 | 284 | 189 | 2914 | 388 |
| 2050 | 530 | 3359 | 290 | 193 | 2935 | 388 |
| 2051 | 530 | 3420 | 295 | 196 | 2957 | 388 |
| 2052 | 530 | 3482 | 301 | 200 | 2978 | 388 |
| 2053 | 530 | 3544 | 307 | 204 | 2999 | 388 |
| 2054 | 530 | 3606 | 313 | 208 | 3021 | 388 |
| 2055 | 530 | 3668 | 318 | 212 | 3042 | 388 |
| 2056 | 530 | 3730 | 324 | 216 | 3063 | 388 |
| 2057 | 530 | 3792 | 330 | 219 | 3085 | 388 |
| 2058 | 530 | 3853 | 335 | 223 | 3106 | 388 |
| 2059 | 530 | 3915 | 341 | 227 | 3127 | 388 |
| 2060 | 530 | 3977 | 347 | 231 | 3149 | 388 |
References
- United Nations University. Global Water Crisis: The Facts; Institute for Water, Environment and Health: Hamilton, ON, Canada, 2017. [Google Scholar]
- World Bank Group. High and Dry: Climate Change, Water, and the Economy; World Bank: Washington, DC, USA, 2016; Available online: http://documents.worldbank.org/curated/en/862571468196731247/High-and-dry-climate-change-water-and-the-economy (accessed on 10 February 2019).
- Khair, S.M.; Mushtaq, S.; Kathryn, R.S. Groundwater Governance in a Water-starved Country: Public Policy, Farmers’ Perceptions, and Drivers of Tubewell Adoption in Balochistan, Pakistan. Groundwater 2015, 53, 626–637. [Google Scholar] [CrossRef] [PubMed]
- Environment Agency. Using Science to Create a Better Place: Assessing the Value of Groundwater; Science Report—SC040016/SR1; Environment Agency: Bristol, UK, 2007.
- Livingston, M.L.; Garrido, A. Entering the Policy Debate: An Economic Evaluation of Groundwater Policy in Flux. Water Resour. Res. 2004, 40. [Google Scholar] [CrossRef]
- Ma, F.; Gao, H.; Eneji, A.E.; Jin, Z.; Han, L.; Liu, J. An Economic Valuation of Groundwater Management for Agriculture in Luancheng County, North China. Agric. Water Manag. 2016, 163, 28–36. [Google Scholar] [CrossRef]
- Ward, F.A. Cost-benefit and Water Resources Policy: A Survey. Water Policy 2012, 14, 250. [Google Scholar] [CrossRef]
- Ministry of Land, Infrastructure and Transport (MLIT). Basic Plan for National Groundwater Management (2012–2021); MLIT: Seoul, Korea, 2012; Available online: http://cleangwater.cafe24.com/gwatersystem.pdf (accessed on 10 February 2019).
- Lee, J.Y.; Kwon, K.D. Current Status of Groundwater Monitoring Networks in Korea. Water 2016, 8, 168. [Google Scholar] [CrossRef]
- Lee, J.Y.; Yi, M.J.; Yoo, Y.K.; Ahn, K.H.; Kim, G.B.; Won, J.H. A Review of the National Groundwater Monitoring Network in Korea. Hydrol. Process. 2007, 21, 907. [Google Scholar] [CrossRef]
- Ministry of Land, Transport and Maritime Affairs (MLTM). Basic Plan for National Groundwater Management, 1st ed.; MLTM: Seoul, Korea, 1996; Available online: http://www.riss.kr/search/detail/DetailView.do?p_mat_type=695c7ada7e580906&control_no=a450fd6bc18614a4#redirect (accessed on 9 March 2019).
- Ellison, R.A.; Calow, R.C. The Economic Value of BGS Geological Mapping in the UK; British Geological Survey: Nottingham, UK, 1996.
- Reedman, A.J.; Calow, R.; Johnson, C.C.; Piper, D.P.; Bate, D.G. The Value of Geoscience Information in Less Developed Countries; Research Report CR/02/087N; British Geological Survey: Nottingham, UK, 2002.
- Bernknopf, R.L.; Brookshire, D.S.; McKee, M.J.; Soller, D.R.; Sutter, J.F.; Matti, J.C.; Campbell, R.H. Societal Value of Geologic Maps; U.S. Geological Survey Circular 1111; U.S. Geological Survey: Reston, VA, USA, 1996; pp. 19–41.
- Bernknopf, R.L.; Brookshire, D.S.; McKee, M.J.; Soller, D.R. Estimating the Social Value of Geologic Map Information: A Regulatory Application. J. Environ. Econ. Manag. 1996, 32, 204–218. [Google Scholar] [CrossRef]
- Halsing, D.; Theissen, K.; Bernknopf, R.L. A Cost-Benefit Analysis of the National Map; U.S. Geological Survey Circular No. 1271; U.S. Department of the Interior: Washington, DC, USA, 2004.
- Kim, D.H.; Lee, K.H.; Kim, J.W.; Ahn, E.Y. Cost/benefit Analysis of Korean Geological Maps Applying the BGS Method. J. Korean Inst. Miner. Energy Resour. Eng. 2006, 43, 13. [Google Scholar]
- Hamilton, B.A. Geospatial Interoperability Return on Investment Study; National Aeronautics and Space Administration Geospatial Interoperability Office: Greenbelt, MD, USA, 2005.
- Tsangaratos, P.; Koumantakis, I. The Value of Geological Data, Information and Knowledge in Producing Landslide Susceptibility Maps. Bull. Geol. Soc. Greece XLVII 2013, 3, 1529. [Google Scholar] [CrossRef]
- Bhagwat, S.B.; Berg, R.C. Benefits and Costs of Geologic Mapping Programs in Illinois: Case Study of Boone and Winnebago Counties and Its Statewide Applicability; Circular No. 549; Illinois State Geological Survey: Champaign, IL, USA, 1991. [Google Scholar]
- Boyle, K.J.; Bergstrom, J.C.; Job, C.; Kealy, M.J.; Bergman, R.; Ankrah, R.; Ali, G.; Alsadek, J.; Ballard, G.; Daub, V.; et al. A Framework for Measuring the Economic Benefits of Ground Water; Paper Number EE-0259; United States Environmental Protection Agency: Washington, DC, USA, 1995.
- Bhagwat, S.B.; Ipe, V.C. Economic Benefits of Detailed Geologic Mapping to Kentucky; Special Report No. 3; Illinois State Geological Survey: Champaign, IL, USA, 2000. [Google Scholar]
- Bouma, J.A.; van der Woerd, H.J.; Kuik, O.J. Assessing the Value of Information for Water Quality Management in the North Sea. J. Environ. Manag. 2009, 90, 1280–1288. [Google Scholar] [CrossRef] [PubMed]
- Castelein, W.T.; Bregt, A.K.; Pluijmers, Y. The Economic Value of the Dutch Geo-information Sector. Int. J. Spat. Data Infrastruct. Res. 2010, 5, 58. [Google Scholar]
- Martinez-Paz, P.A. Environmental Cost of Groundwater: A Contingent Valuation Approach. Int. J. Environ. Res. 2011, 45, 3. [Google Scholar] [CrossRef]
- Korea Development Institute (KDI). National Standard Guideline of a Feasibility Study of Water Resources Project; KDI: Seoul, Korea, 2008; Available online: http://webcache.googleusercontent.com/search?q=cache:fSKf0nSVF2QJ:pimac.kdi.re.kr/guide/rguide_list.jsp+&cd=1&hl=ko&ct=clnk&gl=kr (accessed on 10 February 2019).
- Kallas, Z.; Gomez-Limon, J.A.; Hurle, J.B. Decomposing the Value of Agricultural Multifunctionality: Combining Contingent Valuation and the Analytical Hierarchy Process. J. Agric. Econ. 2007, 58, 218–241. [Google Scholar] [CrossRef]
- Martinez-Paz, J.; Almansa, C.; Casasnovas, V.; Colino, J. Pooling Expert Opinion on Environmental Discounting: An International Delphi Survey. Conserv. Soc. 2016, 14, 243–253. [Google Scholar] [CrossRef]
- Kim, G.B.; Ahn, J.S.; Marui, A. Analytic Hierarchy Models for Regional Groundwater Monitoring Well Allocation in Southeast Asian Countries and South Korea. Environ. Earth Sci. 2009, 59, 325. [Google Scholar] [CrossRef]
- Saaty, T.L. The Analytic Hierarchy Process; Mcgraw-Hill: New York, NY, USA, 1980. [Google Scholar]
- Saaty, T.L. How to Make a Decision: The Analytic Hierarchy Process. Eur. J. Oper. Res. 1990, 48, 9–26. [Google Scholar] [CrossRef]
- Saaty, T.L. Decision Making for Readers: The Analytic Hierarchy Process for Decisions in a Complex World, 3rd ed.; RWS Publications: Pittsburgh, PA, USA, 1999. [Google Scholar]
- Saaty, T.L. Relative Measurement and Its Generalization in Decision Making Why Pairwise Comparisons are Central Mathematics for the Measurement of Intangible Factors the Analytic Hierarchy/Network Process. Rev. R. Acad. Cienc. Ser. A Mater. 2008, 102, 251–318. [Google Scholar] [CrossRef]
- Marcouiller, D.; Coggins, S. The Economic Value of Water: An Introduction; University of Wisconsin-Extension Publication G-3698-1; University of Wisconsin-Extension: Madison, WI, USA, 1999. [Google Scholar]
- Ryoo, S.B. On the Etymology and Definition of Changma. Atmosphere 2001, 11, 6–12. [Google Scholar]
- Bates, B.; Kundzewicz, Z.W.; Wu, S.; Palutikof, J. (Eds.) Climate Change and Water, Intergovernmental Panel on Climate Change; IPCC Technical Paper; IPCC: Geneva, Switzerland, 2008; Available online: http://www.taccire.suanet.ac.tz:8080/xmlui/bitstream/handle/123456789/552/climate-change-water-en.pdf?sequence=1 (accessed on 17 March 2019).


| Main Method | Study (Institution) | Case | Empirical Result |
|---|---|---|---|
| Anecdotal and Formal Cost-benefit (Cost-effectiveness) Approach | Ellison and Calow (1996) (BGS) [12] | Evaluates the impacts of information gained through geological mapping projects in the UK. | The annual national baseline value of mapping of the UK is £18.9 million. (B/C = 5.906) |
| Bernknopf et al. (1996a) (USGS) [14] | Details the rigorous development of an economic model for valuing geologic map information. | The expected net benefit for the 1:100,000-scale Loudoun County geologic map ranges from $1.28 million to $3.50 million. | |
| Bernknopf et al. (1996b) [15] | Estimates the economic value of applying geologic map information to siting a waste disposal facility in Loudoun County. | The total benefit of the improved geologic map is approximately $1.5 million. The expected net benefit from use of the 1:100,000 scale map is $0.34 million. | |
| Reedman et al. (2002) (BGS) [13] | Contains an evaluation and quantification of the net benefits of different levels of detail and improvements in interpretive models contained on geologic maps. | Various results by Bolivia, Indonesia, Peru, Zimbabwe, and Nigeria. | |
| Halsing et al. (2004) (USGS) [16] | Assesses the costs and benefits of the national map and to estimate its net present benefit to society. | The national map has a net present value of benefits of $2.05 billion with a standard deviation of $490 million over 30 years. | |
| Kim et al. (2006) [17] | Applies the BGS model (1996) to estimate costs and benefits of the Korean geologic mapping program. | The total benefits ranges from 973 billion Won to 1330 billion Won. The costs were 82 billion Won for 40 years. | |
| Analytical Hierarchy Process (Expert-based) | Booz Allen Hamilton (2005) [18] | Measures the value of geospatial interoperability standards in accessing NASA’s scientific information. | Opening geospatial standards had a risk-adjusted ROI of 119.0% which can be interpreted as for every $1 spent, $1.10 is saved. |
| Tsangaratos and Koumantakis (2013) [19] | Illustrates the value of geological data and information used to produce landslide susceptibility maps in Greece. | Calculates weight of coefficient of each factor representing the estimation of landslide susceptibility. | |
| Willingness-To-Pay | Bhagwat and Berg (1991) (Illinois State Geological Survey) [20] | Estimate the benefits and costs of geologic mapping conducted in 1980 in Illinois from interviewing with 36 individuals. | According to the most conservative projection, B/C ratio is 0.5 to 1.1. |
| US Environmental Protection Agency (1995) [21] | Shows an empirical technique estimating changes in economic value associated with changes in groundwater services. | n.a. | |
| Bhagwat and Ipe (2000) (Illinois State Geological Survey) [22] | Estimates the value of the geological quadrangle maps (1:24,000-scale) in Kentucky. | The average willingness to pay (WTP) was reported to be $342 per map. The value of the map was at least 25 to 38 times higher than the cost of the mapping program. | |
| Expected Utility Theorem | Bouma et al. (2009) [23] | Analyses the added value of an extended satellite monitoring system for the management of eutrophication, potentially harmful algal blooms and suspended sediment and turbidity in the North Sea. | The value of information is estimated to be €74,000 per week and the costs of the new system are only €50,000 per week. |
| Castelein et al. (2010) [24] | Defines the geo-information sector and estimate its economic value in terms of turnover, employment, activities and the market in Netherlands. | The total economic value of the Dutch geo-information sector was estimated at €1.4 billion which takes a share of 0.23% in the Dutch economy. |
| Evaluation Criteria | A Criteria | B Criteria | C Criteria | Geometric Mean | Weights |
|---|---|---|---|---|---|
| A criteria | 1 | = GM1 | GM1/SumGM | ||
| B criteria | 1 | = GM2 | GM2/SumGM | ||
| C criteria | 1 | = GM3 | GM3/SumGM | ||
| Total | GM1 + GM2 + GM3 = SumGM |
| Indicators | Surface Water | Groundwater | Geology ** |
|---|---|---|---|
| Policy aspect |
|
|
|
| Economic aspect |
|
|
|
| User aspect |
|
|
|
| Others |
|
|
| Type of Network | Items and Unit Costs (unit: USD/single well) | Remarks |
|---|---|---|
| NGMN |
|
|
| SGMN |
|
|
| GMFA |
|
|
| SIMN |
|
|
| GQM |
|
|
| LQMN |
|
|
| Type | Construction, Installation, & Well Replacement | Maintenance & Service | Device Replacement | Water Sample Test * | Total | |
|---|---|---|---|---|---|---|
| NGMN | 7,528,404 | 70,758,976 | 3,908,395 | - | 82,195,775 | |
| SGMN | Manual | 386,490 | 61,253,235 | 17,619 | - | 246,177,391 |
| Automatic | 80,570,577 | 103,922,130 | 27,340 | - | ||
| GMFA | 37,086,424 | 126,068,647 | 8,140,240 | - | 171,295,311 | |
| SIMN | 10,449,325 | 48,662,609 | 2,716,363 | - | 61,828,297 | |
| GQM | Quality (GQMN) | 63,072,618 | 6,109,509 | 595,225 | 33,989,889 | 108,164,812 |
| Pollution (GPMN) | 3,427,972 | 969,599 | ||||
| LQMN | 52,744,882 | 15,300,180 | 3,906,735 | 51,989,311 | 123,941,108 | |
| Total | 793,602,694 | |||||
| Item | Surface Water Information/Groundwater Information | Surface Water Information/Geological Information | Groundwater Information/Geological Information |
|---|---|---|---|
| Value | 0.72 | 2.37 | 2.39 |
| Benefit Sector | BGS’s Benefit Items and Key Statistics (USD) | BGS’s Contribution Rate | Annual Benefit (USD) | Percentage of Annual Benefit |
|---|---|---|---|---|
| Mineral Product & Management |
| 0.15% | 4,741,818 | 8.4 |
| Waste Facility Construction |
| 5% | 1,636,364 | 2.9 |
| Environmental Impact Assessment |
| 5% | 1,340,909 | 2.3 |
| Groundwater Development & Management |
| 5% | 13,636,364 | 24.0 |
| Regional Development |
| £1500 per local government | 171,818 | 0.3 |
| Coastal Management |
| 0.05% | 103,636 | 0.2 |
| Social Infrastructure |
| 0.25% | 35,000,000 | 62.0 |
| Total Annual Benefit | 56,630,909 | 100.0 | ||
| Scenarios | Benefit (1000 USD) | Cost (1000 USD) | B/C Ratio |
|---|---|---|---|
| Groundwater project | 2,314,782 | 793,602 | 2917 |
| Past trend | 412,031 | 265,642 | 1551 |
© 2019 by the authors. Licensee MDPI, Basel, Switzerland. This article is an open access article distributed under the terms and conditions of the Creative Commons Attribution (CC BY) license (http://creativecommons.org/licenses/by/4.0/).
Share and Cite
Kim, S.G.; Kim, G.-B. Are Groundwater Monitoring Networks Economical? Cost-Benefit Analysis on the Long-Term Groundwater Supply Project of South Korea. Water 2019, 11, 753. https://doi.org/10.3390/w11040753
Kim SG, Kim G-B. Are Groundwater Monitoring Networks Economical? Cost-Benefit Analysis on the Long-Term Groundwater Supply Project of South Korea. Water. 2019; 11(4):753. https://doi.org/10.3390/w11040753
Chicago/Turabian StyleKim, Sun G., and Gyoo-Bum Kim. 2019. "Are Groundwater Monitoring Networks Economical? Cost-Benefit Analysis on the Long-Term Groundwater Supply Project of South Korea" Water 11, no. 4: 753. https://doi.org/10.3390/w11040753
APA StyleKim, S. G., & Kim, G.-B. (2019). Are Groundwater Monitoring Networks Economical? Cost-Benefit Analysis on the Long-Term Groundwater Supply Project of South Korea. Water, 11(4), 753. https://doi.org/10.3390/w11040753