Residential Flood Loss Assessment and Risk Mapping from High-Resolution Simulation


 , ,
, ,
Abstract
:1. Introduction
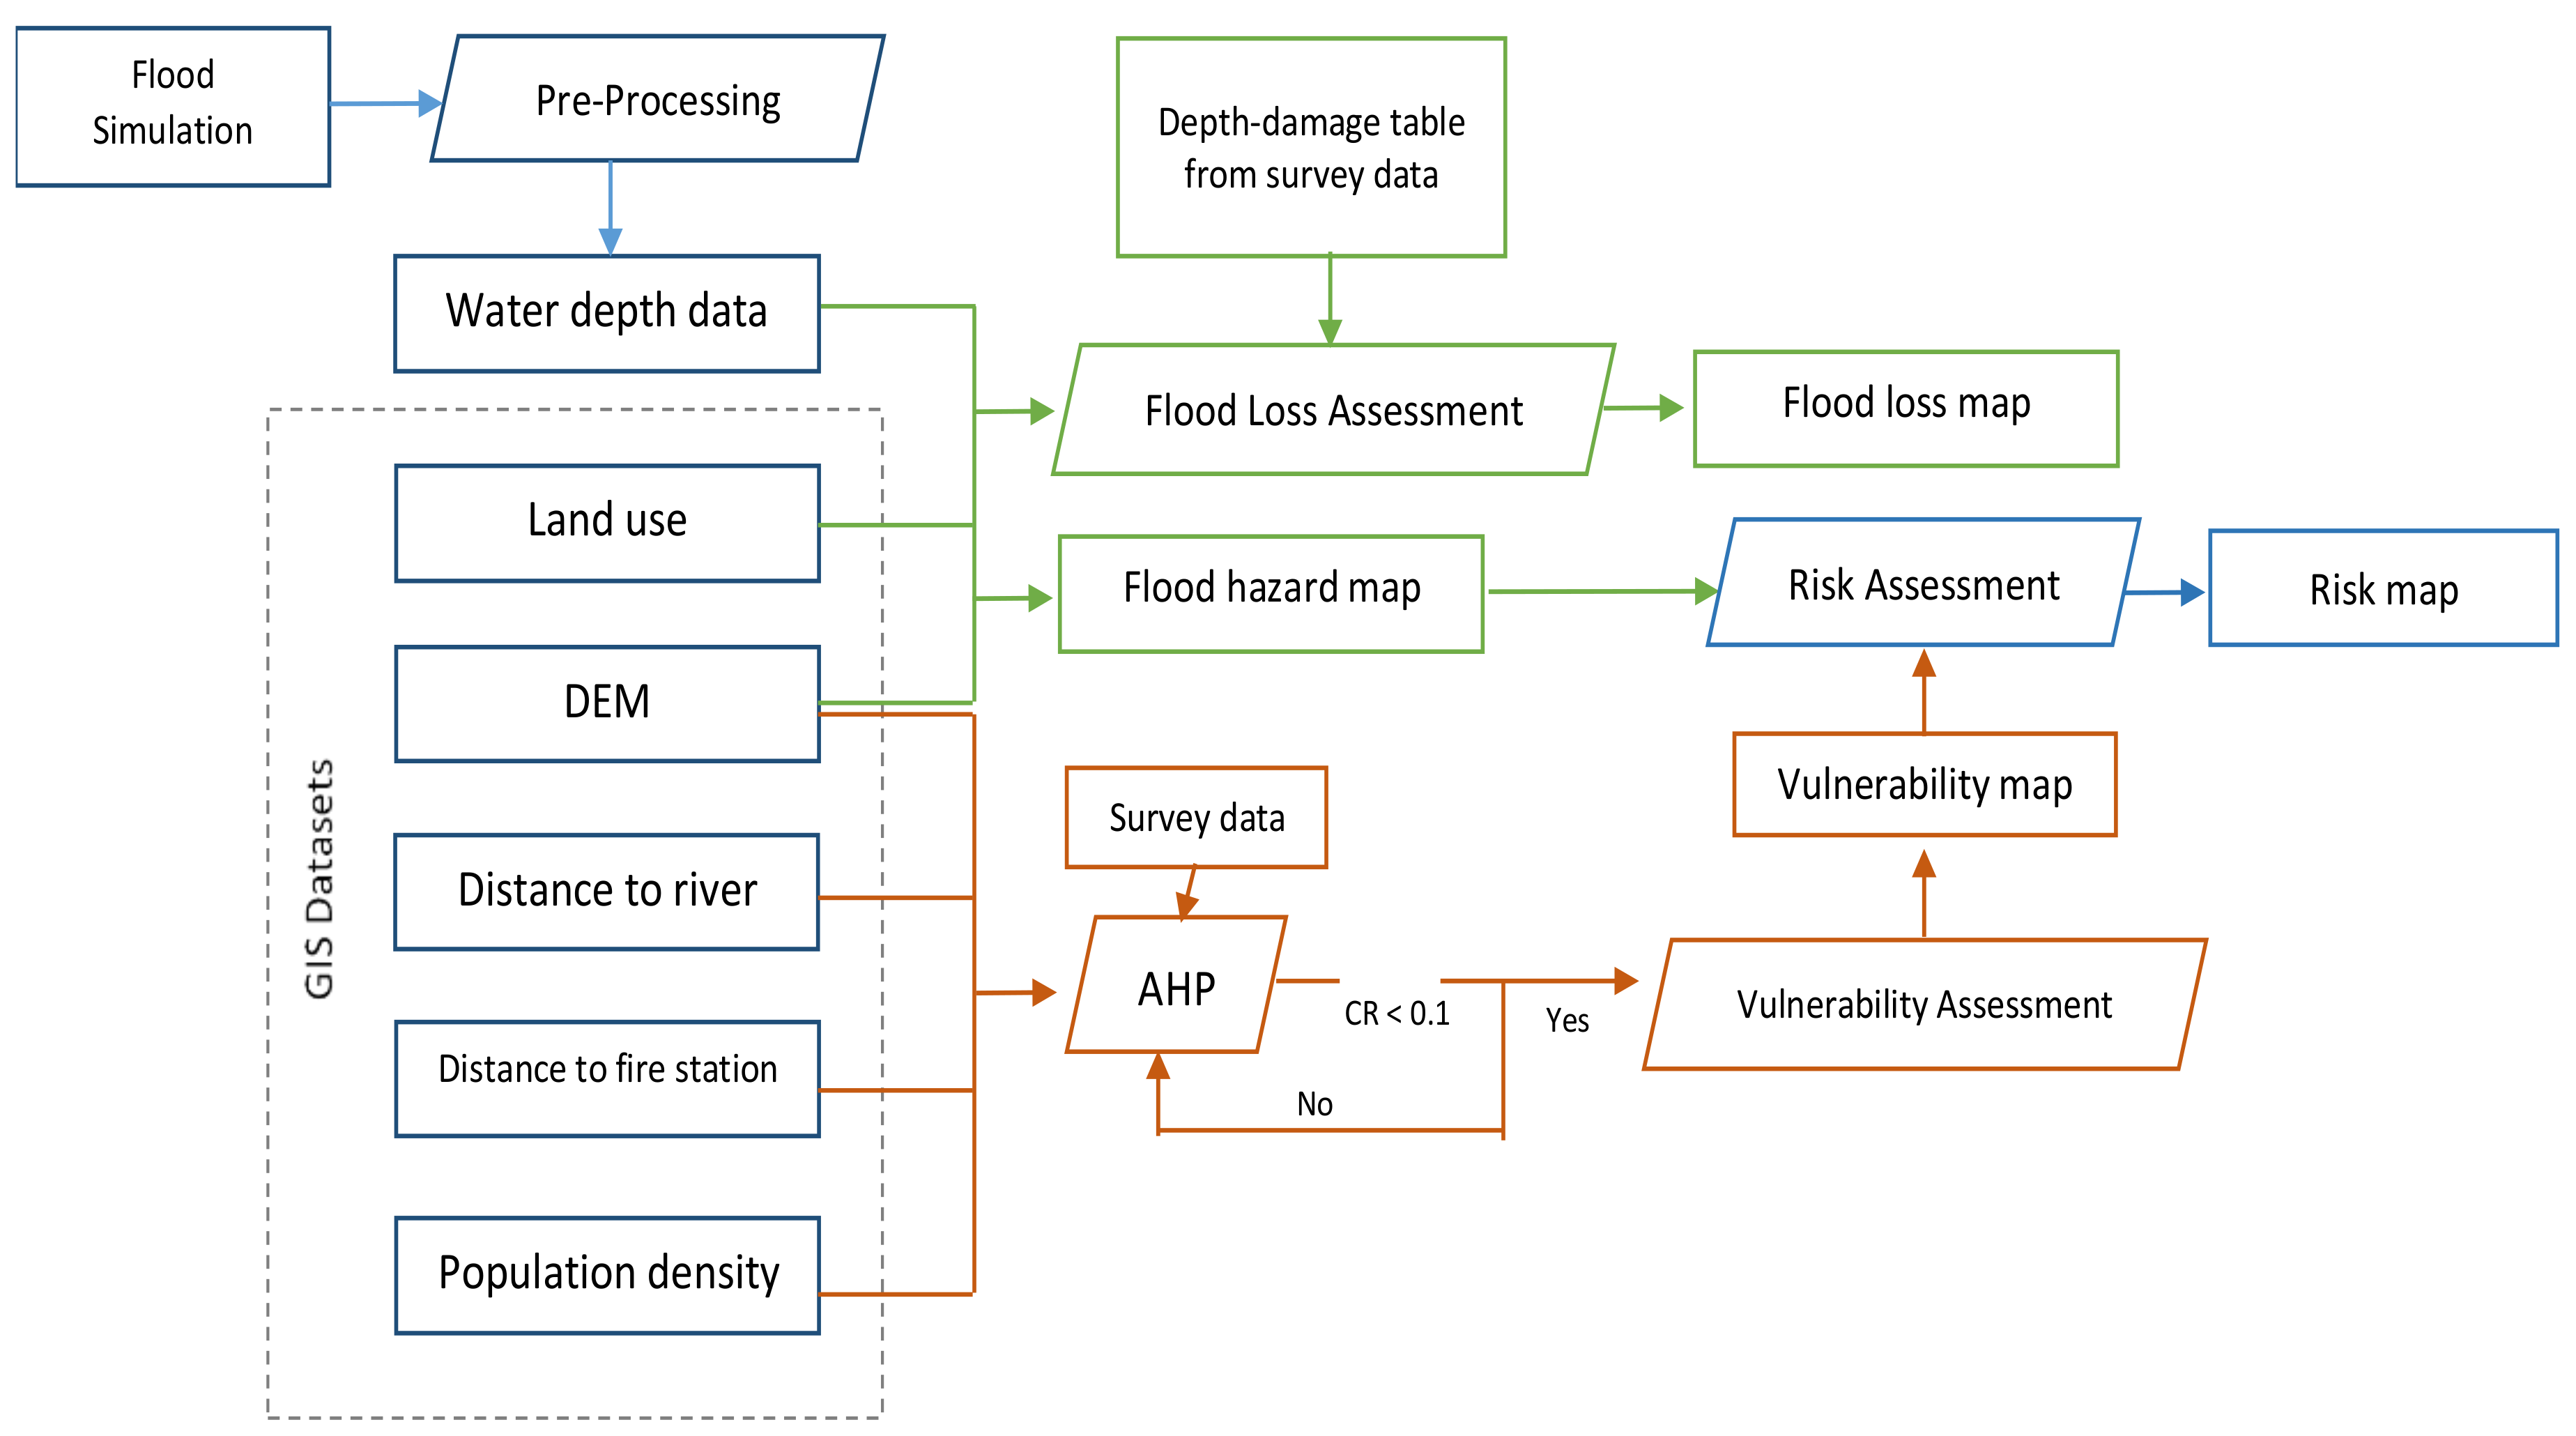
2. Datasets and Methods
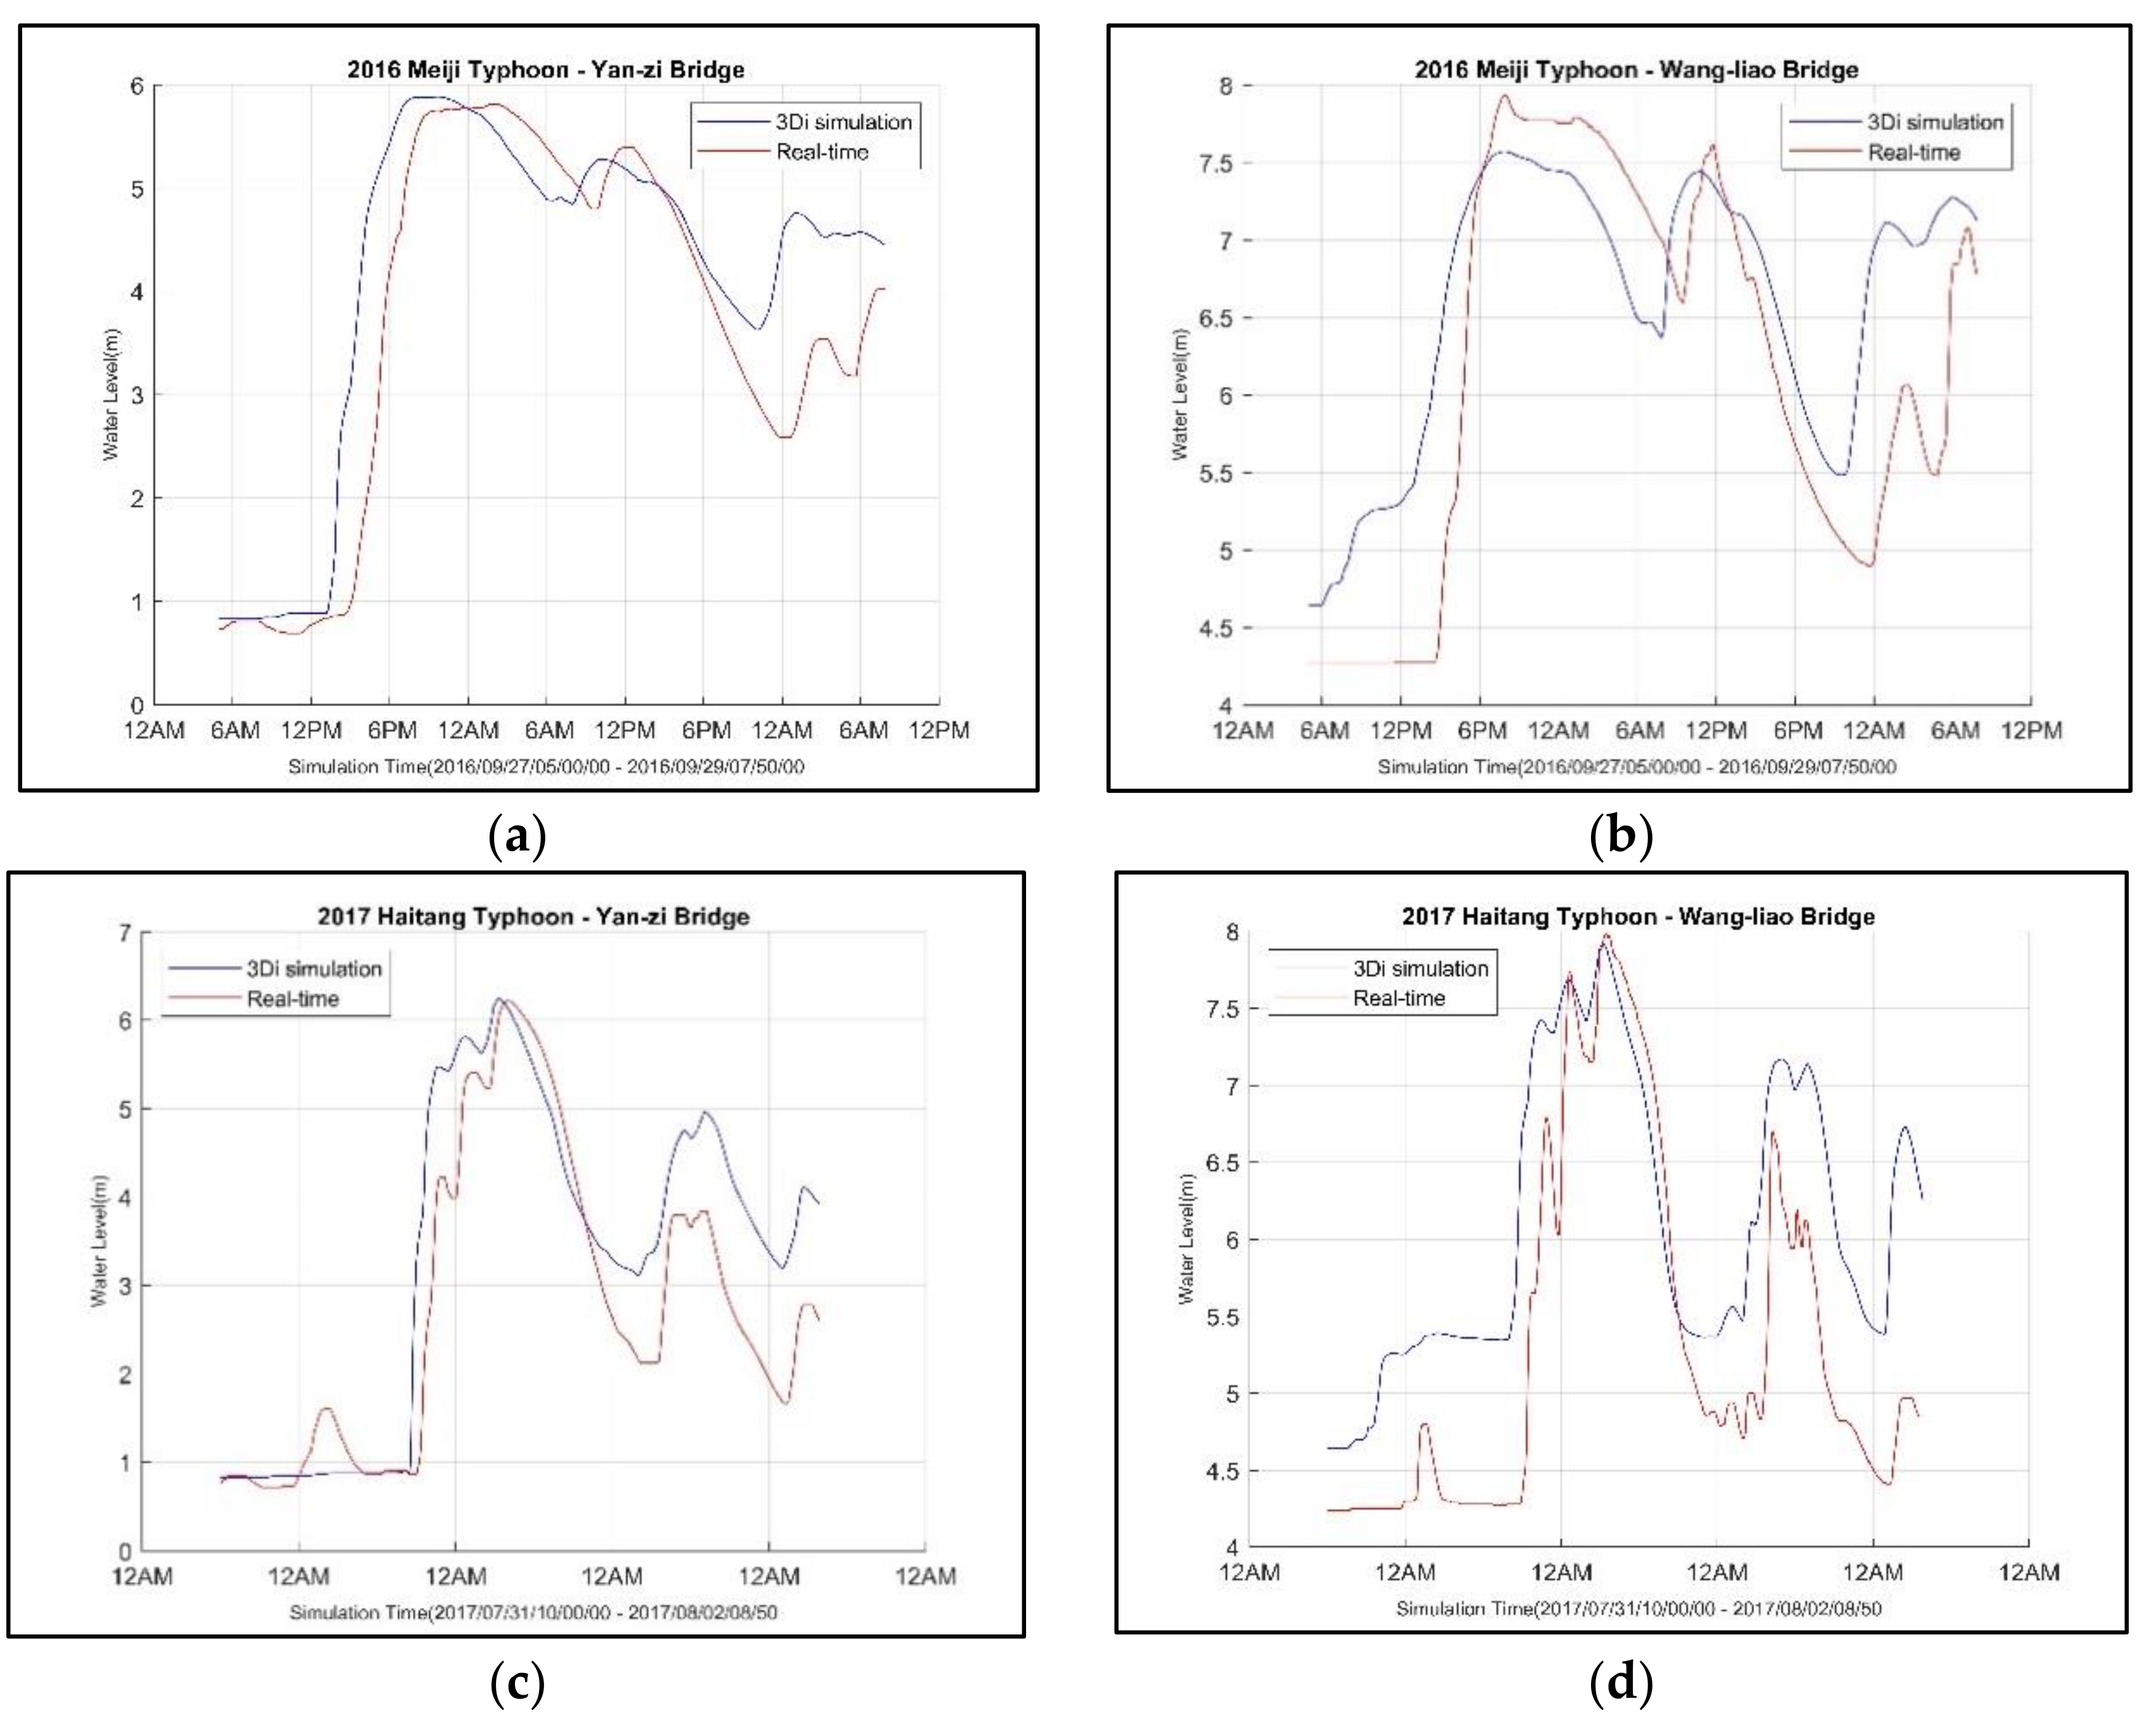
2.1. Flood Model
2.2. Loss Assessment
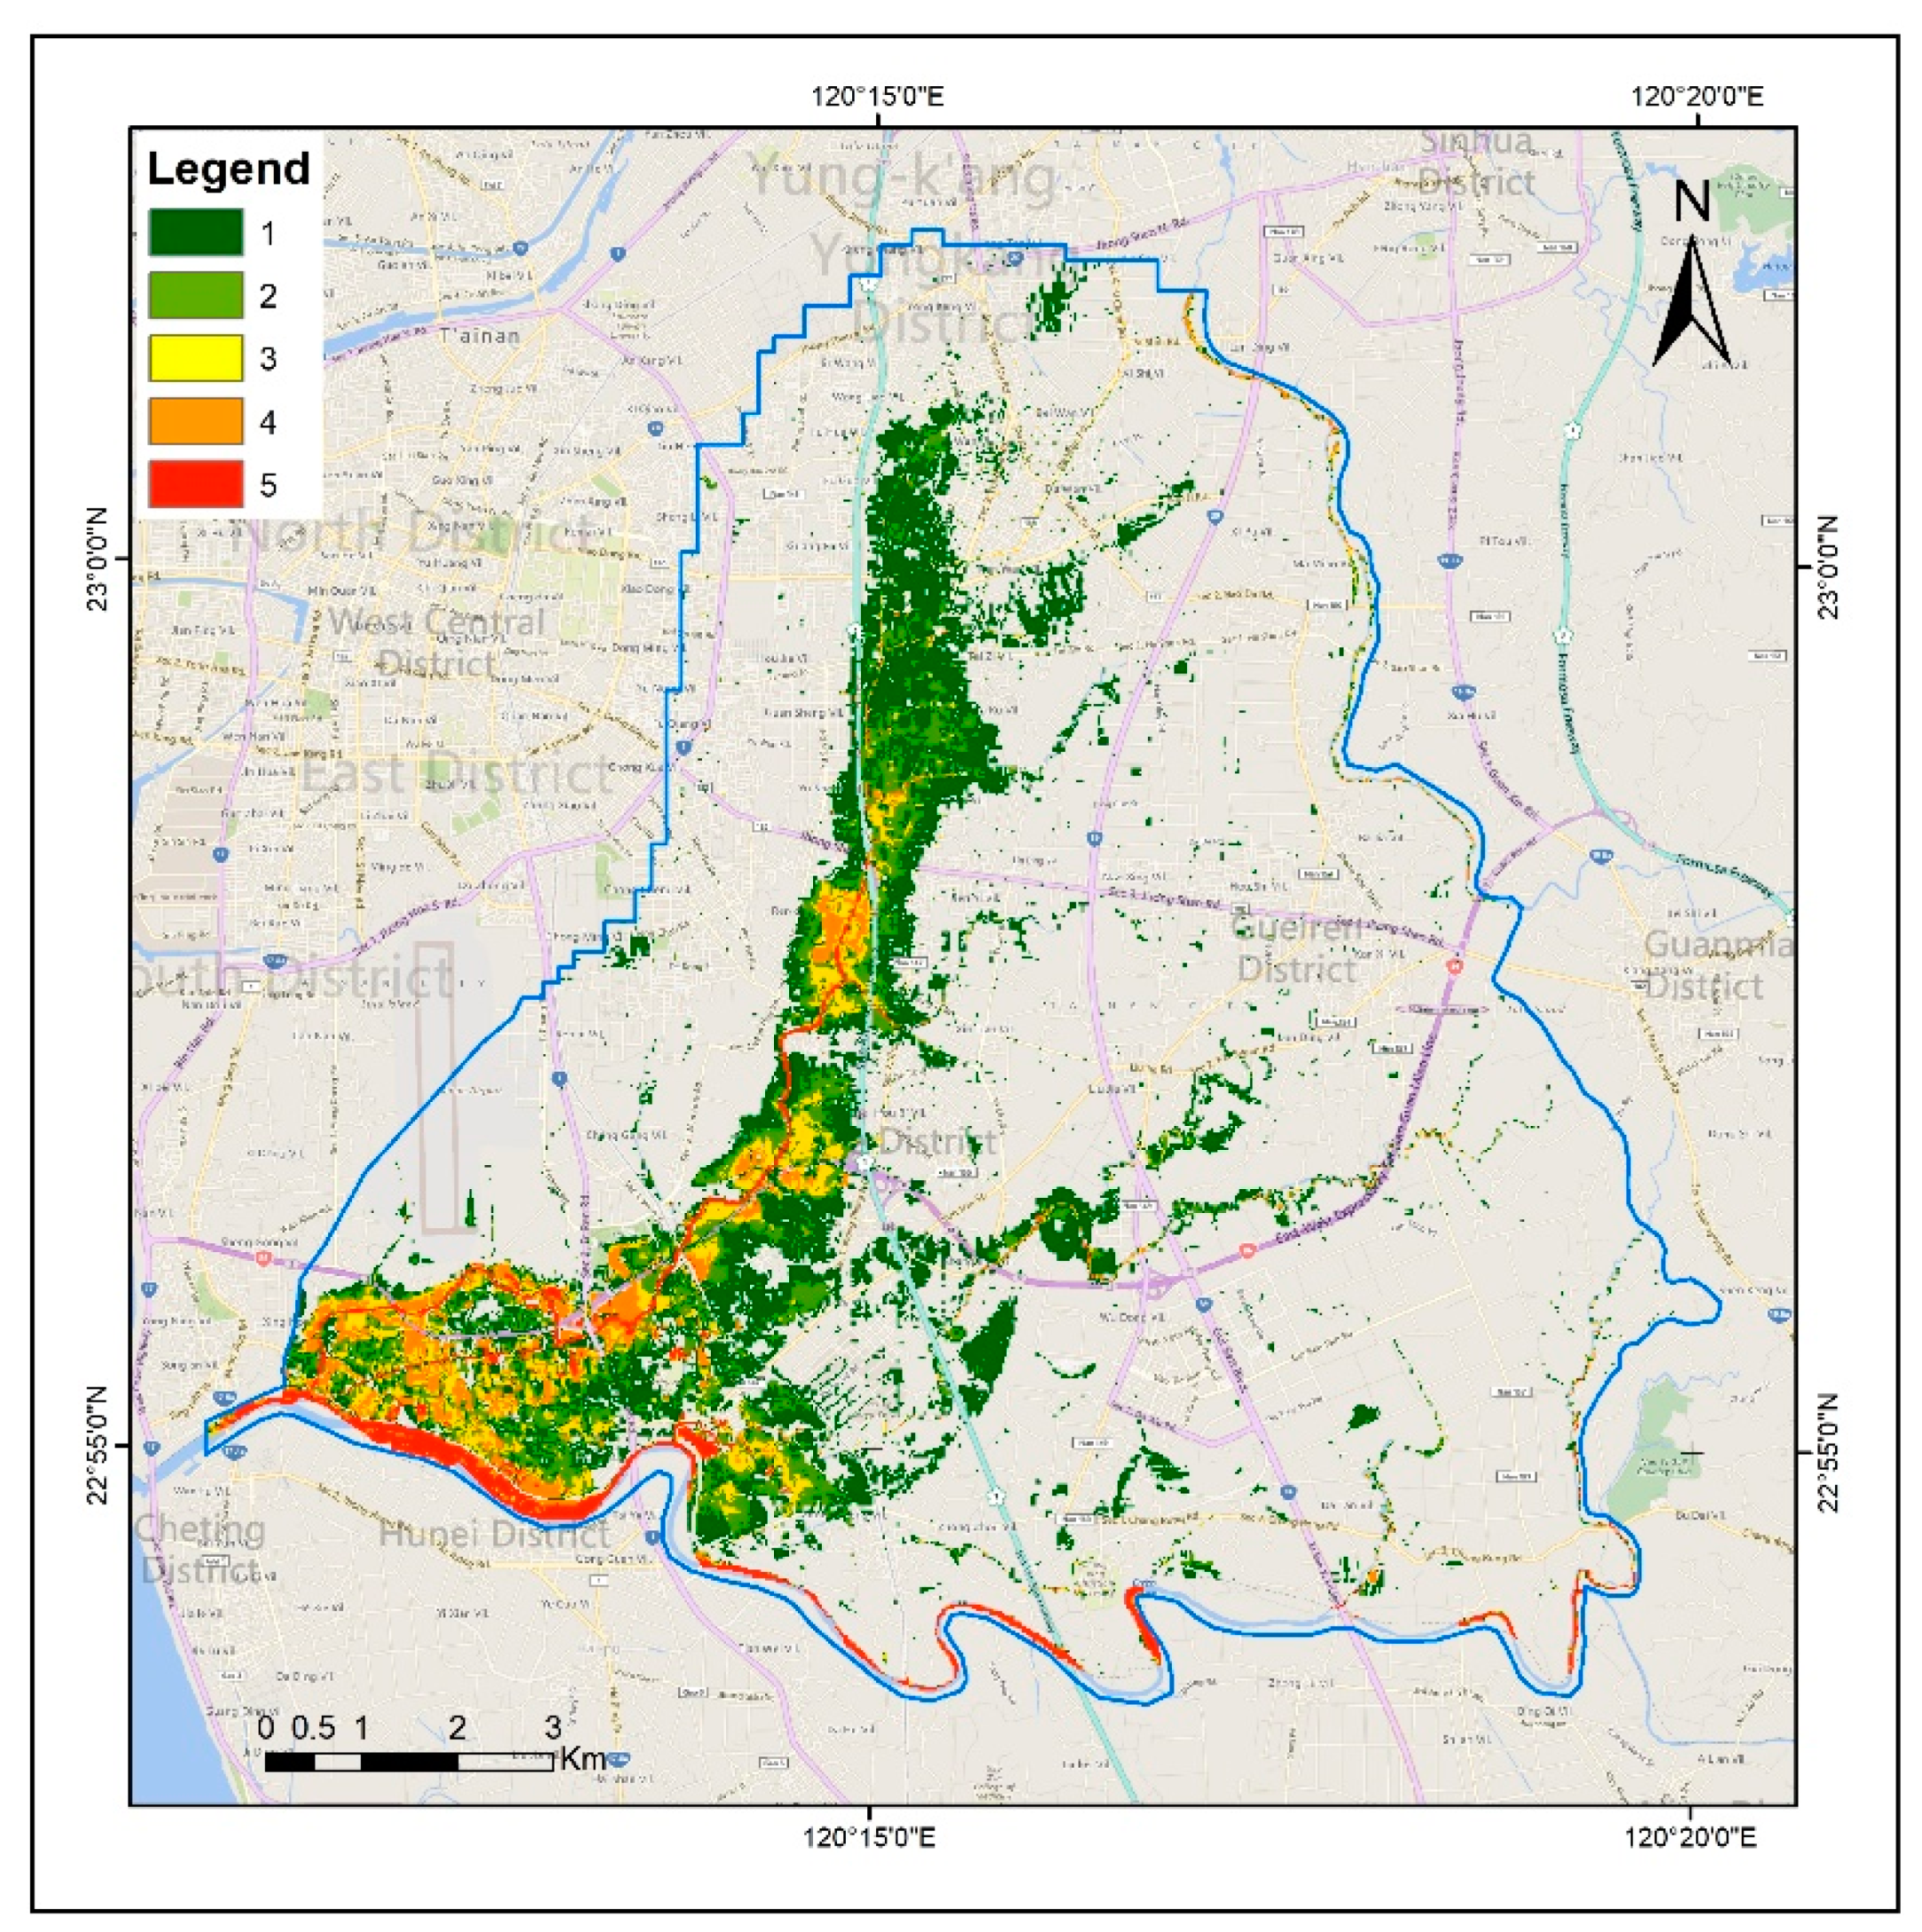
2.3. Risk Assessment
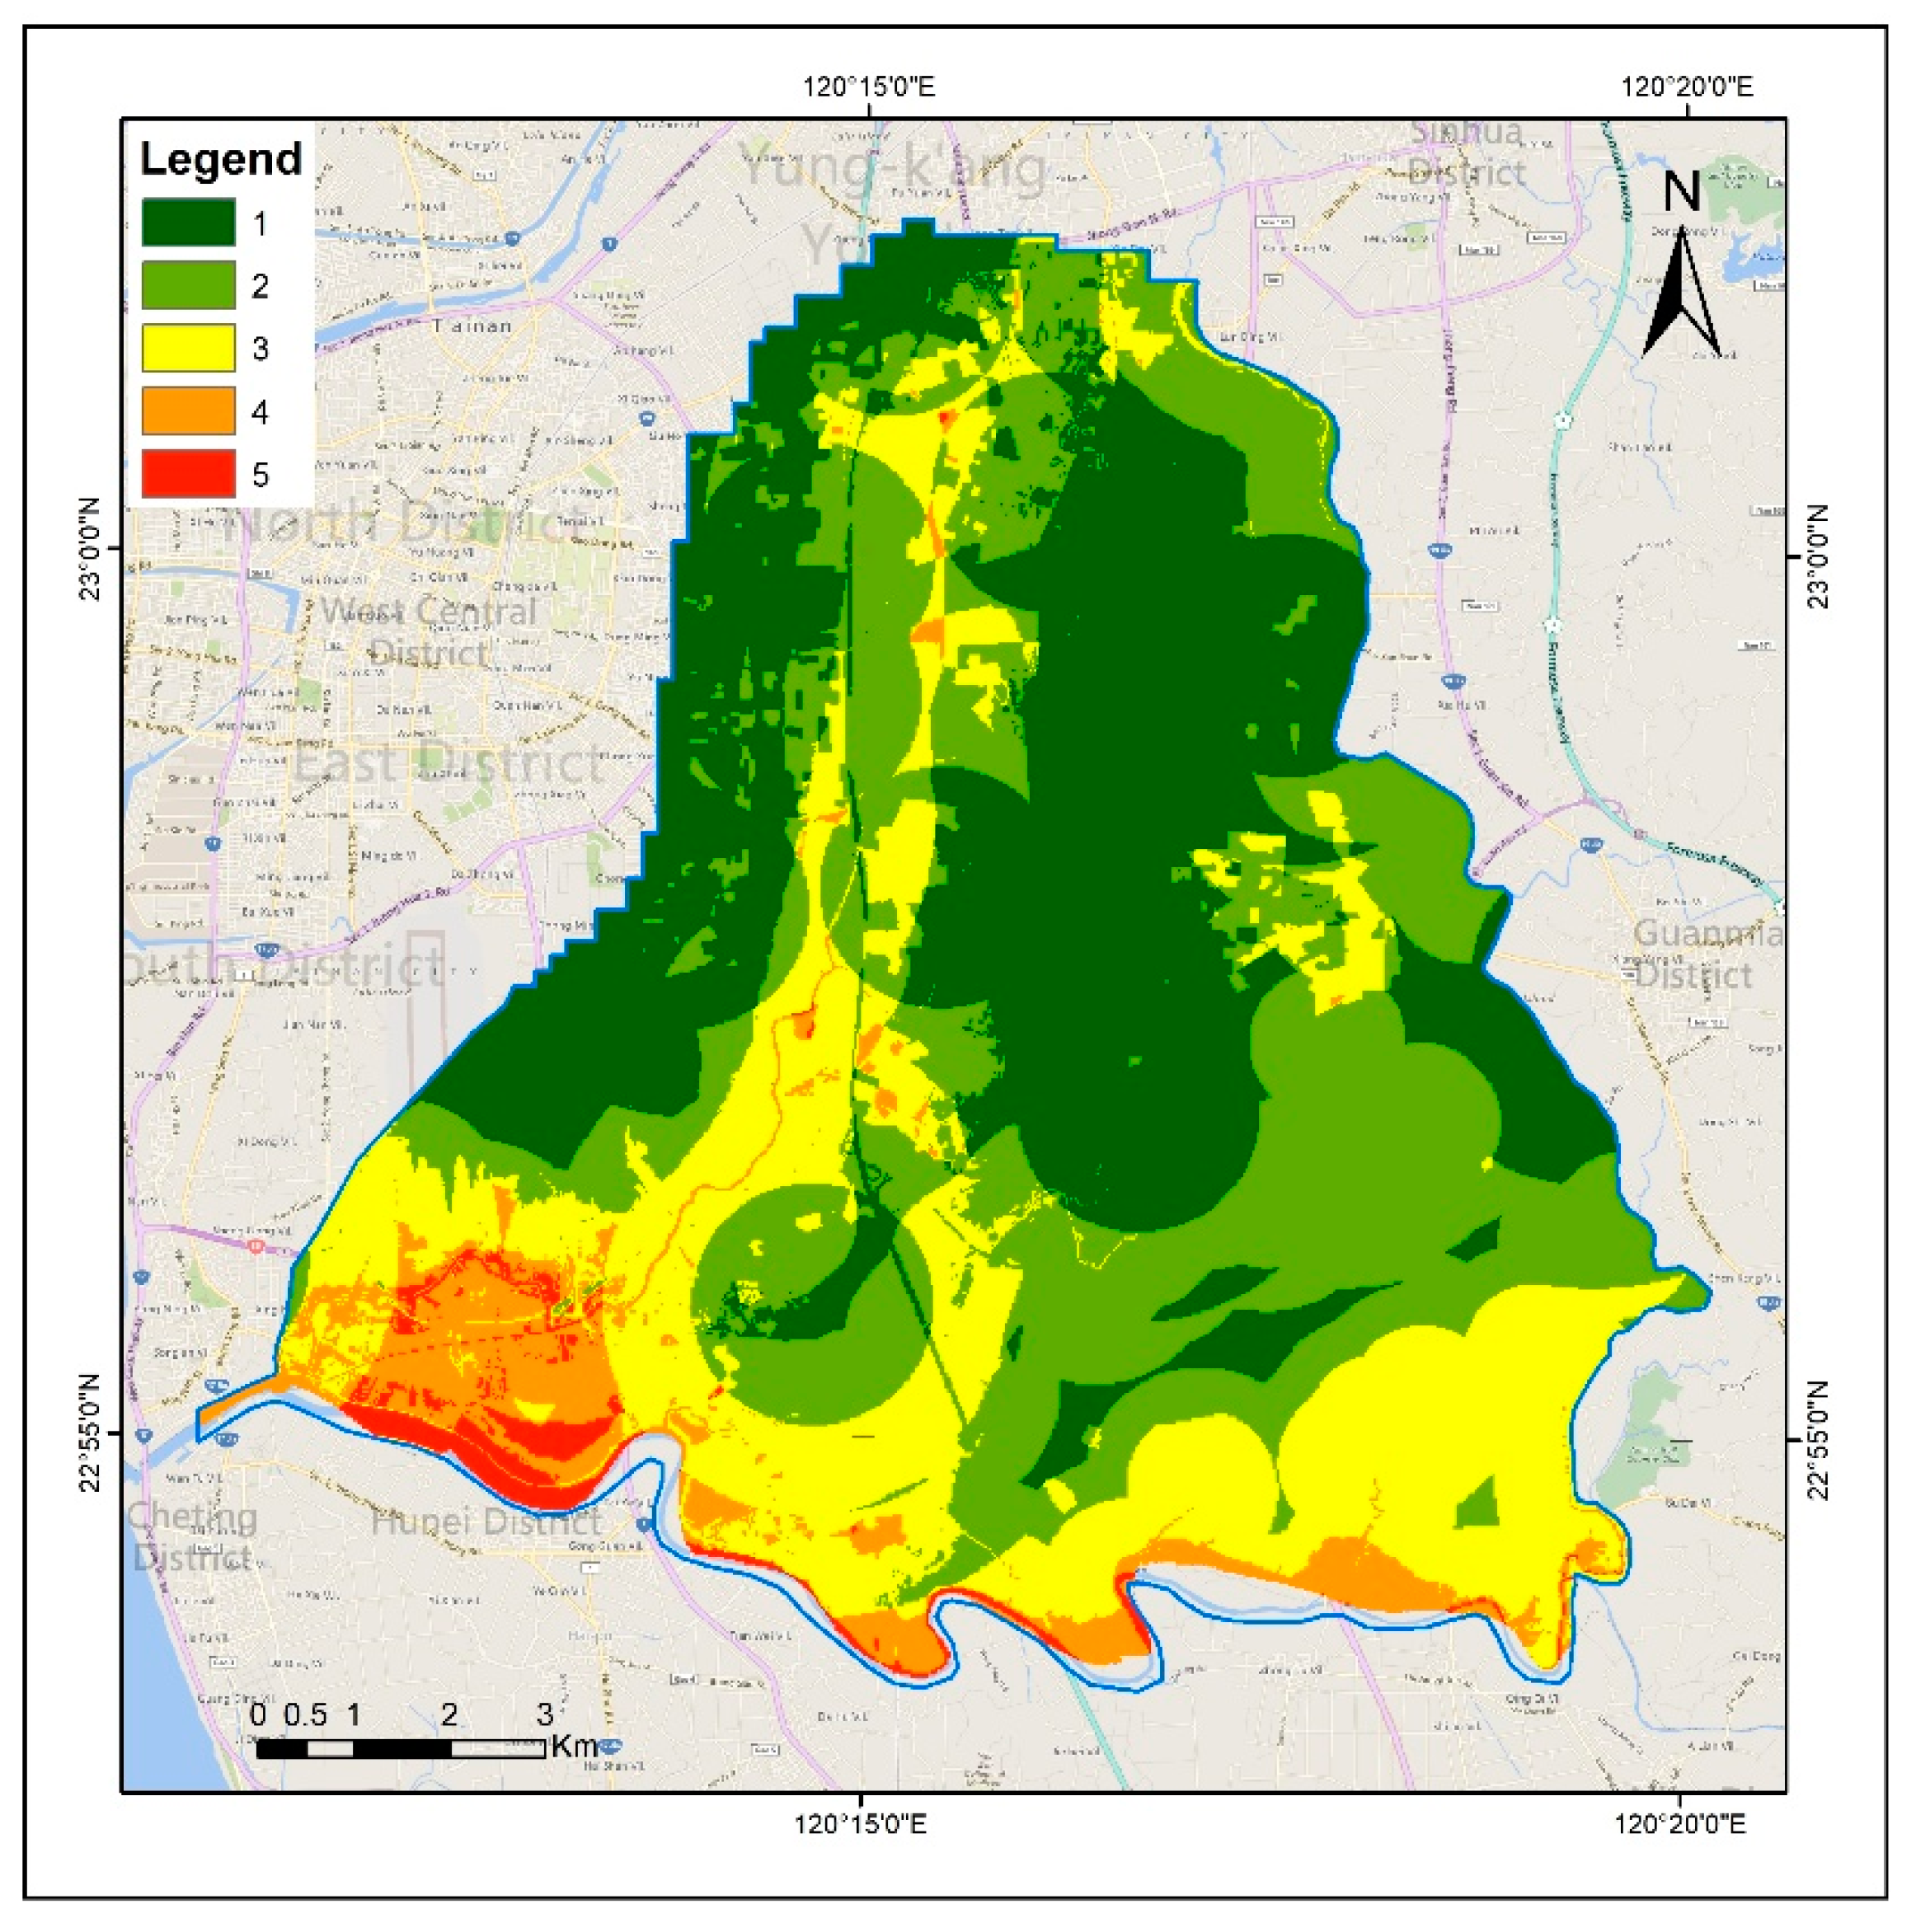
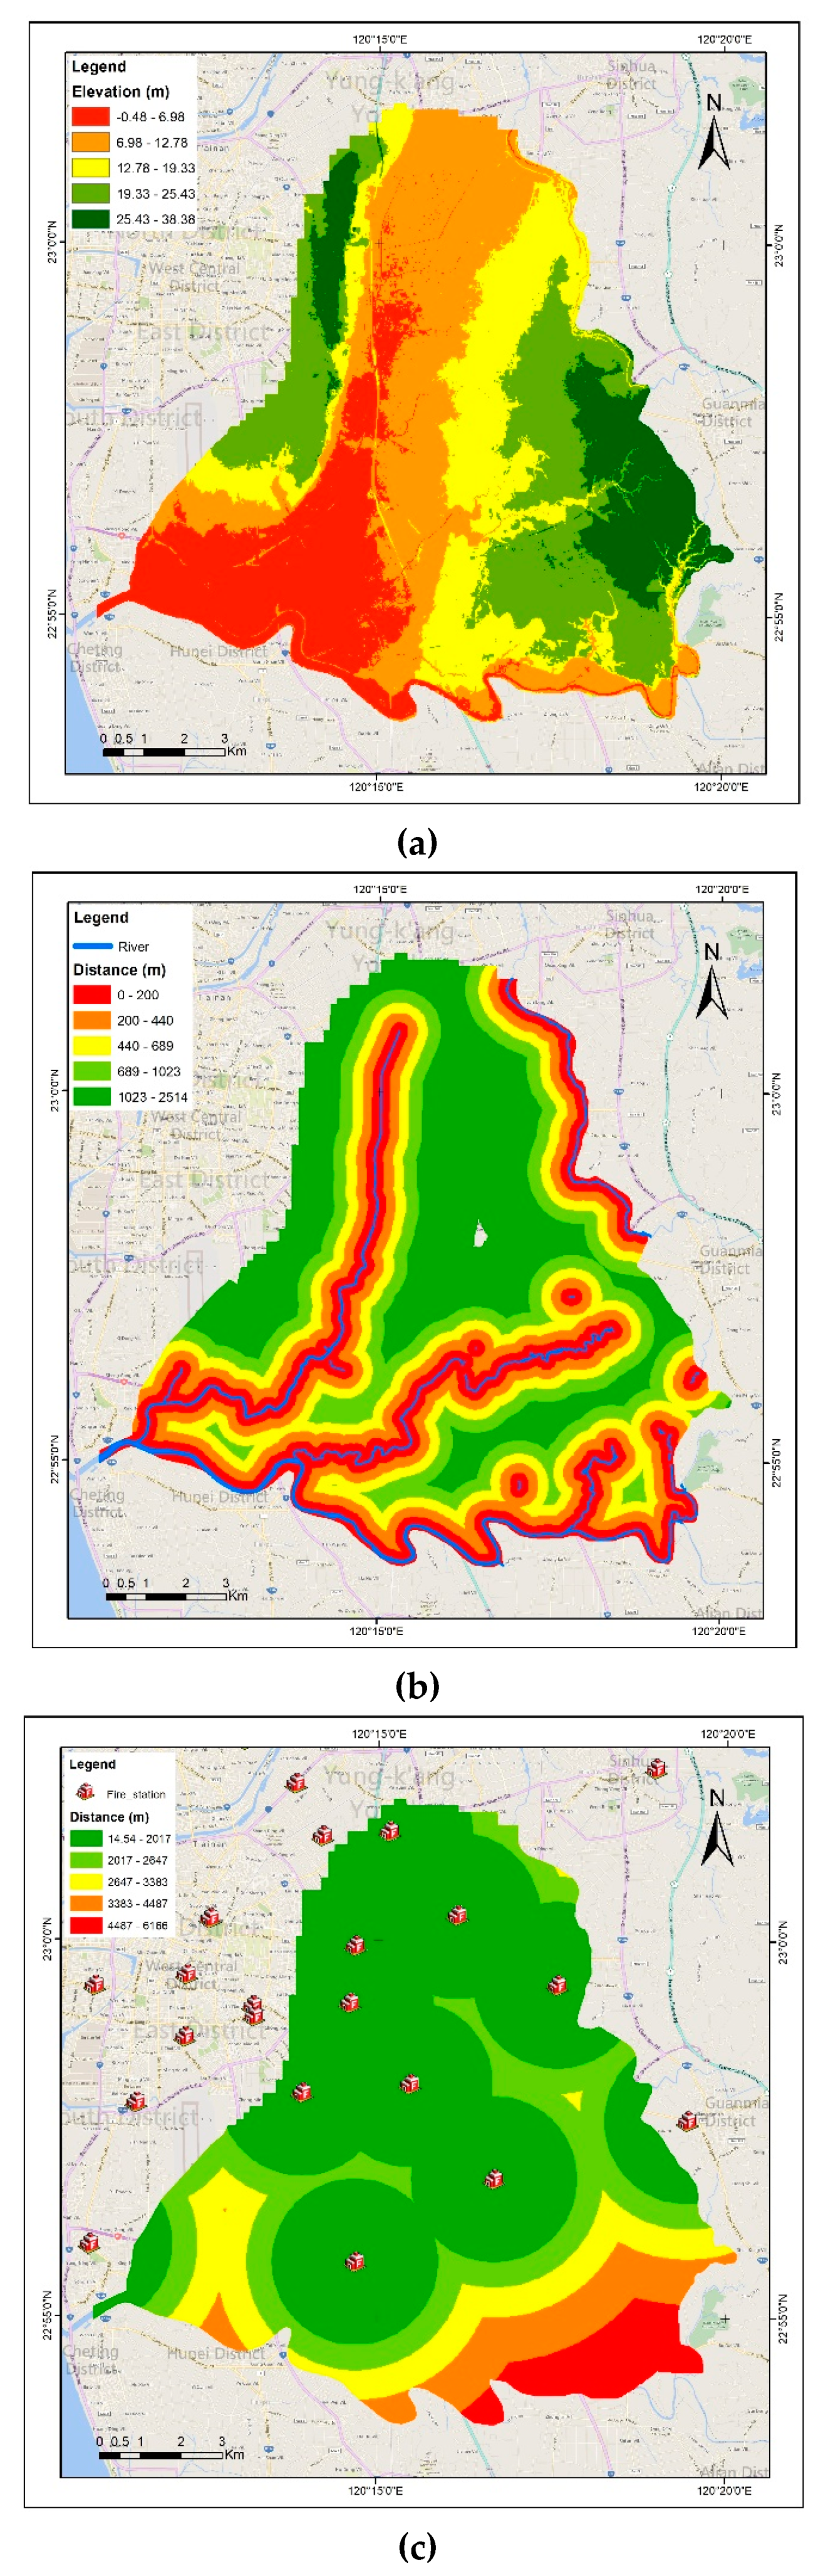
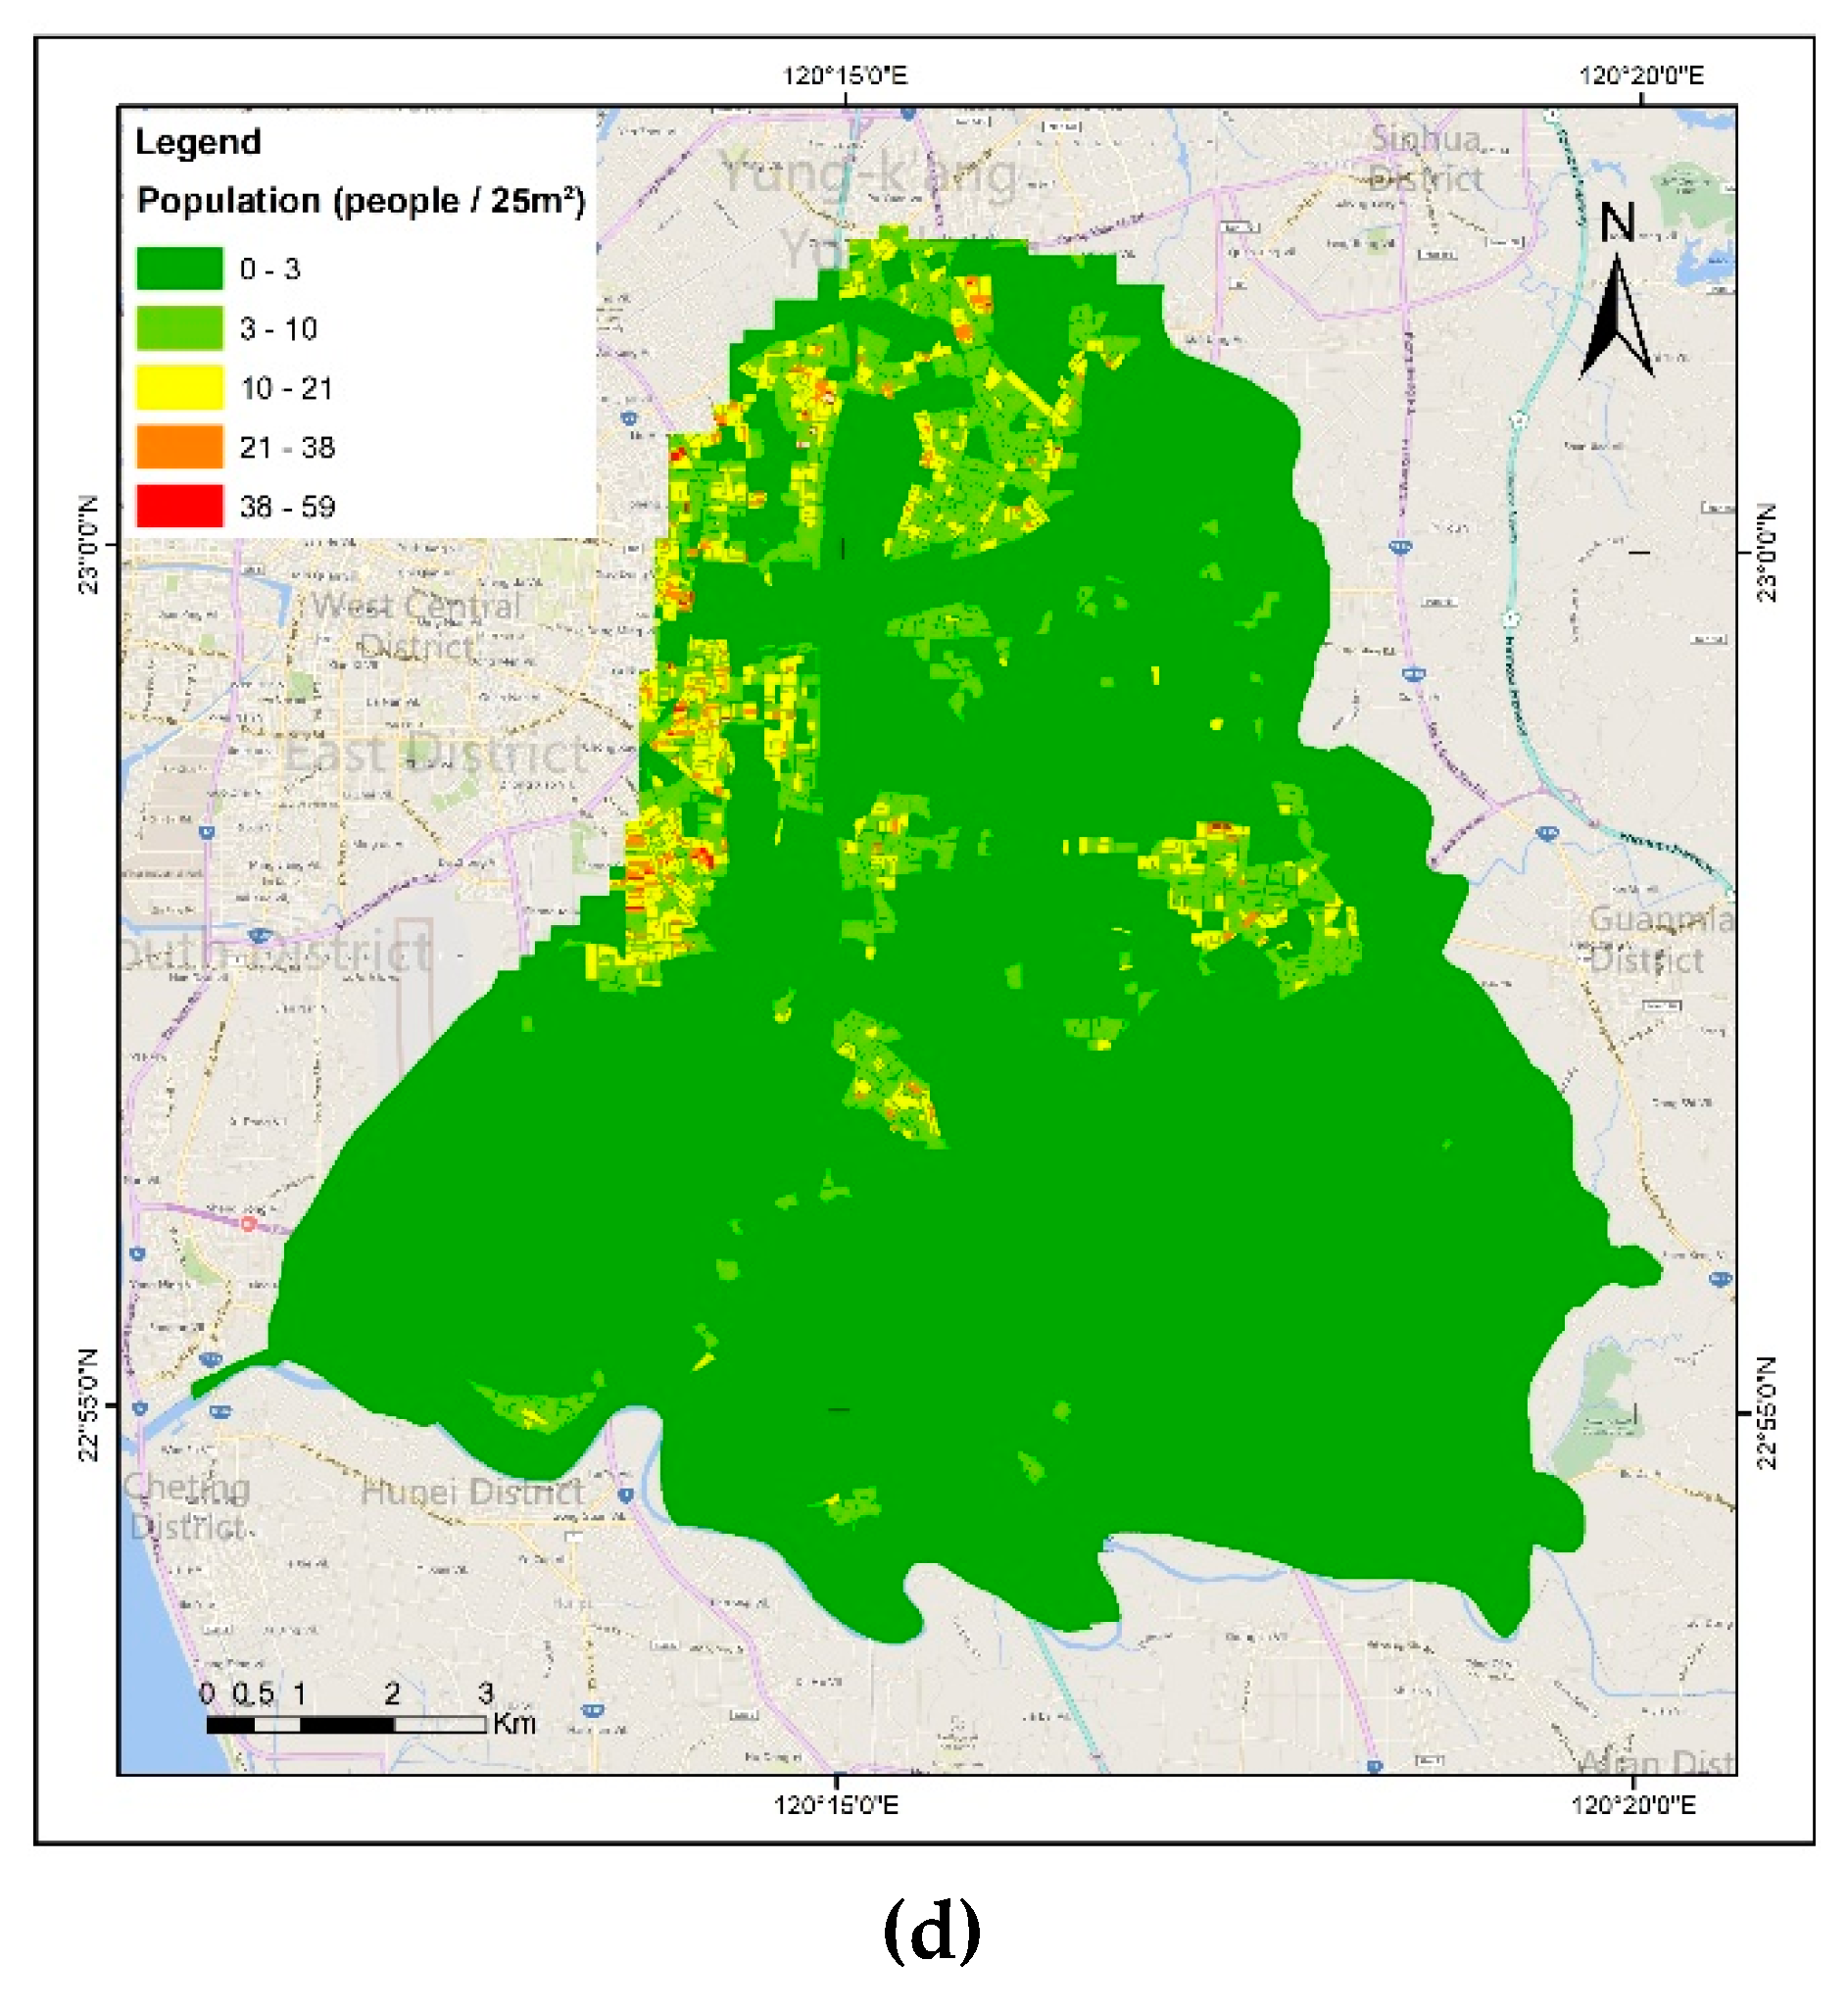
2.4. Vulnerability Assessment
2.5. AHP for Vulnerability Weight
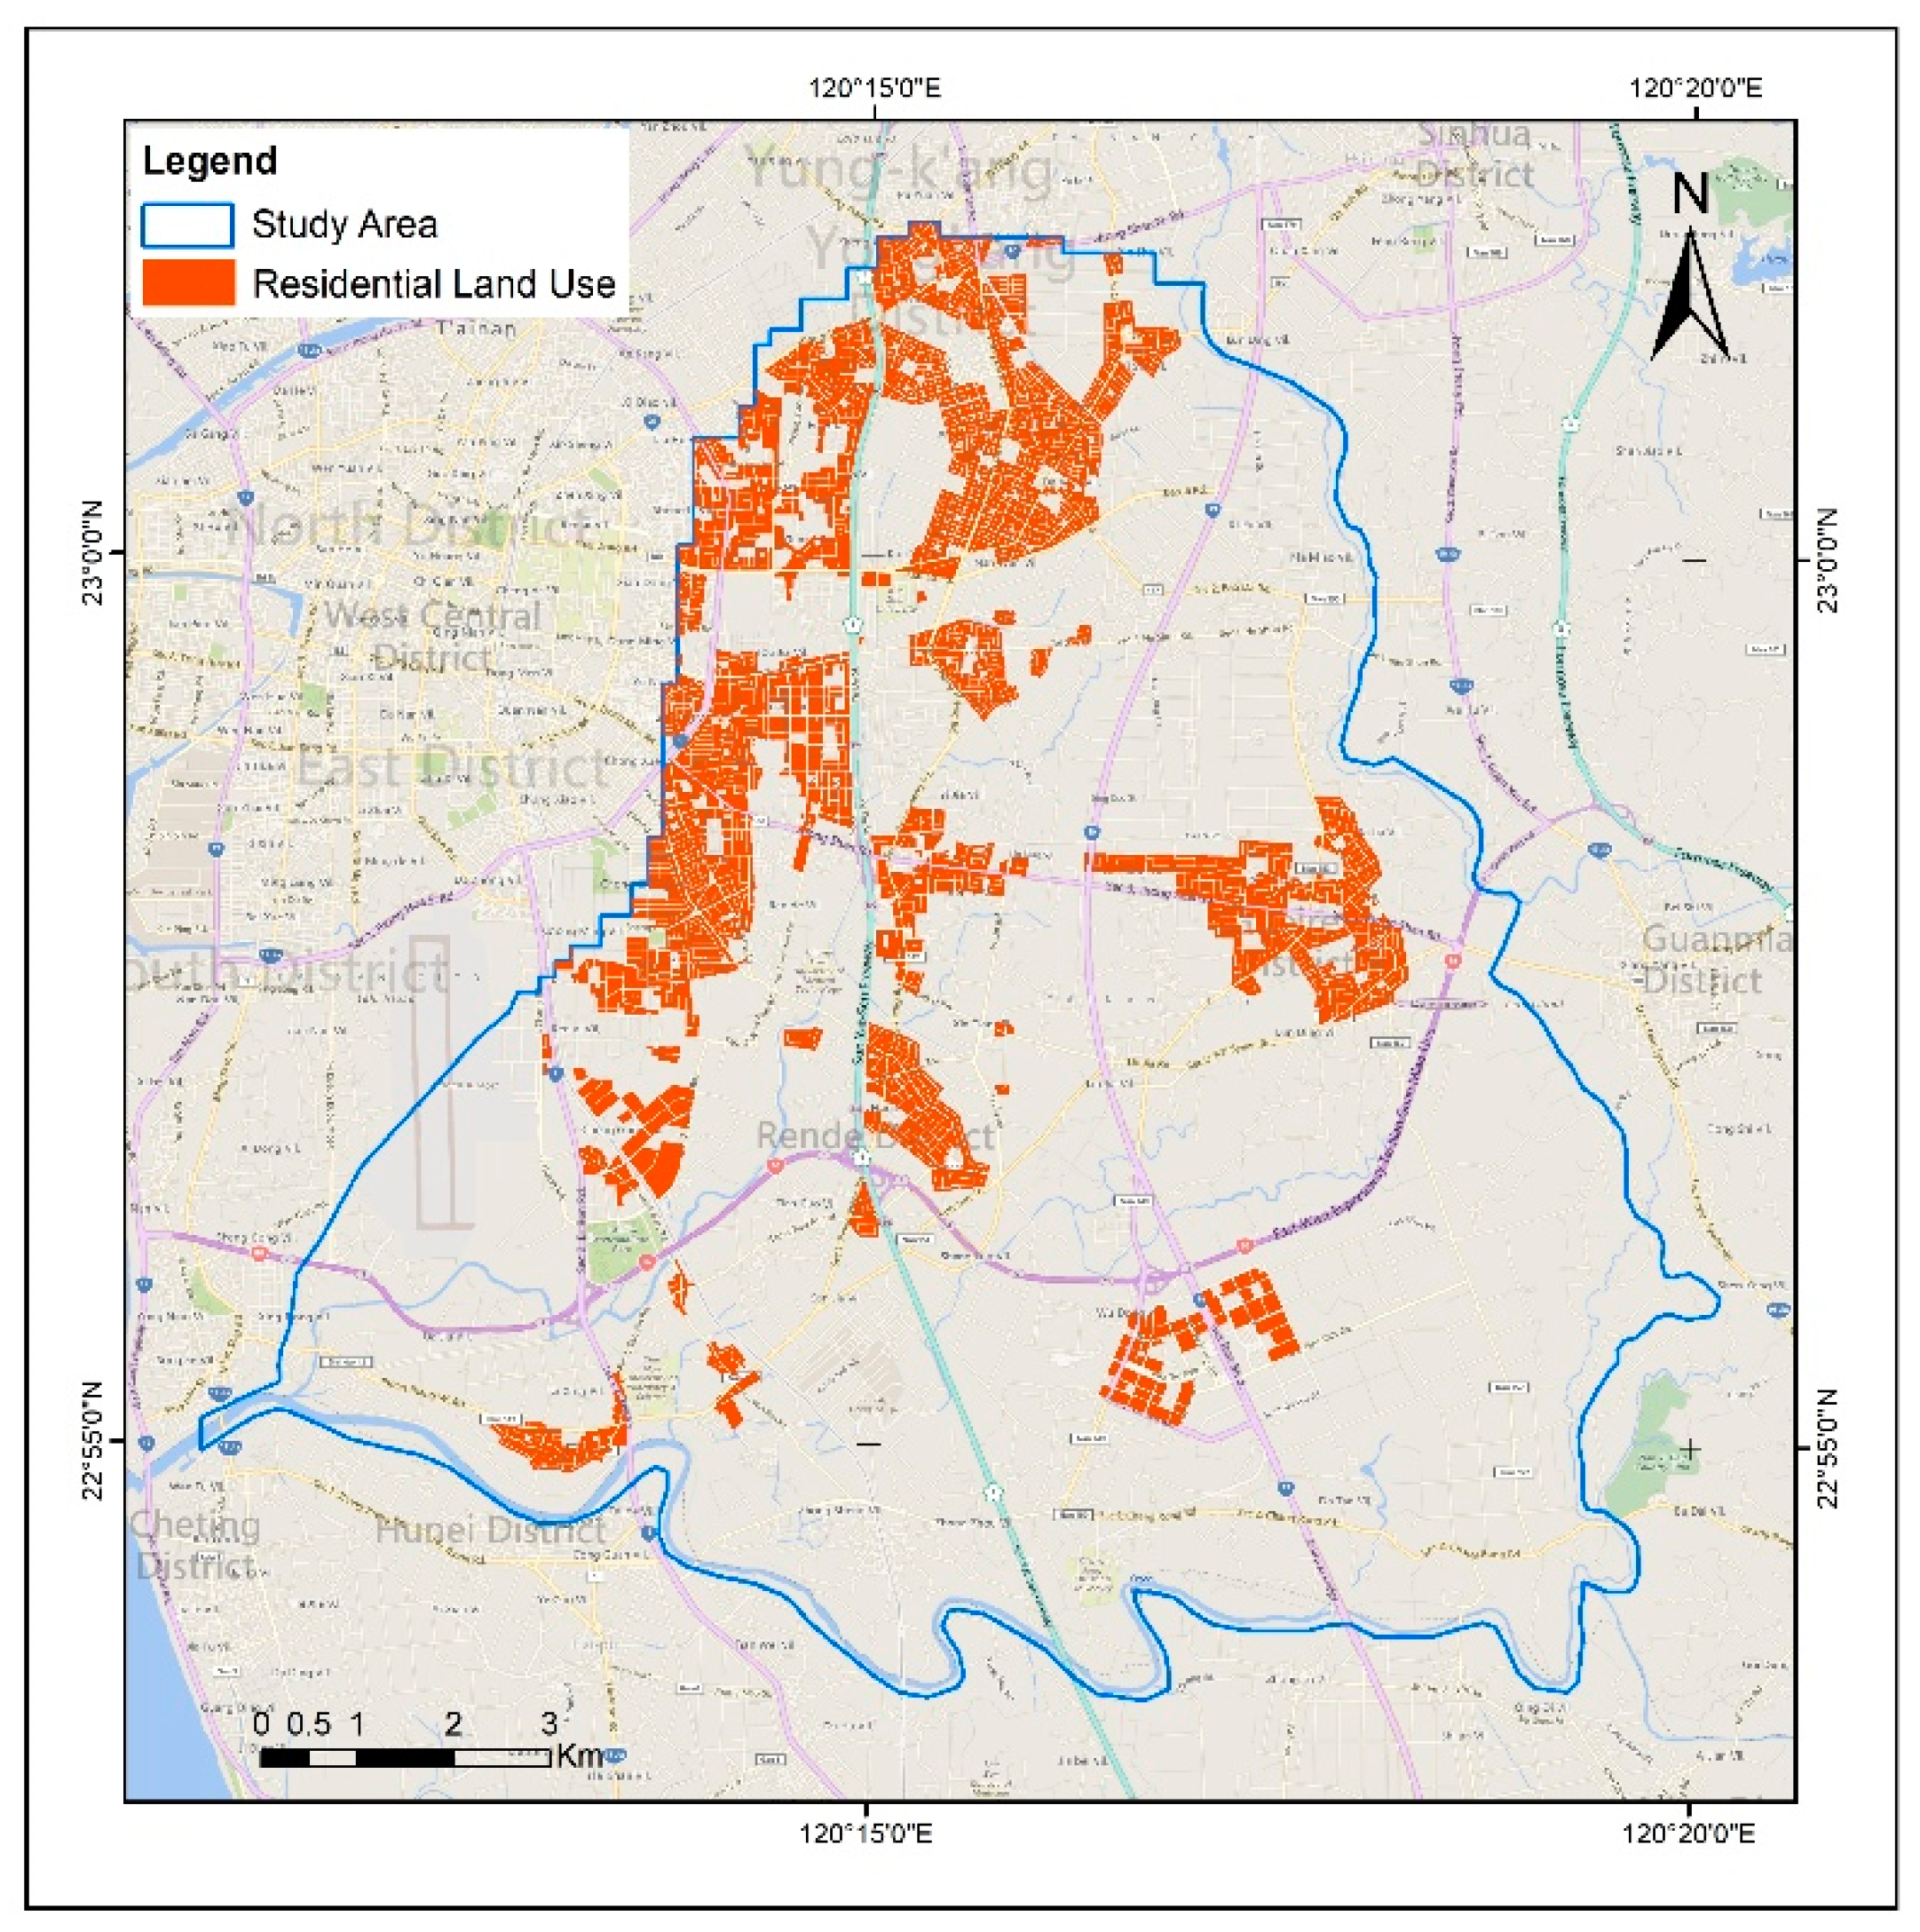
2.6. Study Area
3. Result and Discussion
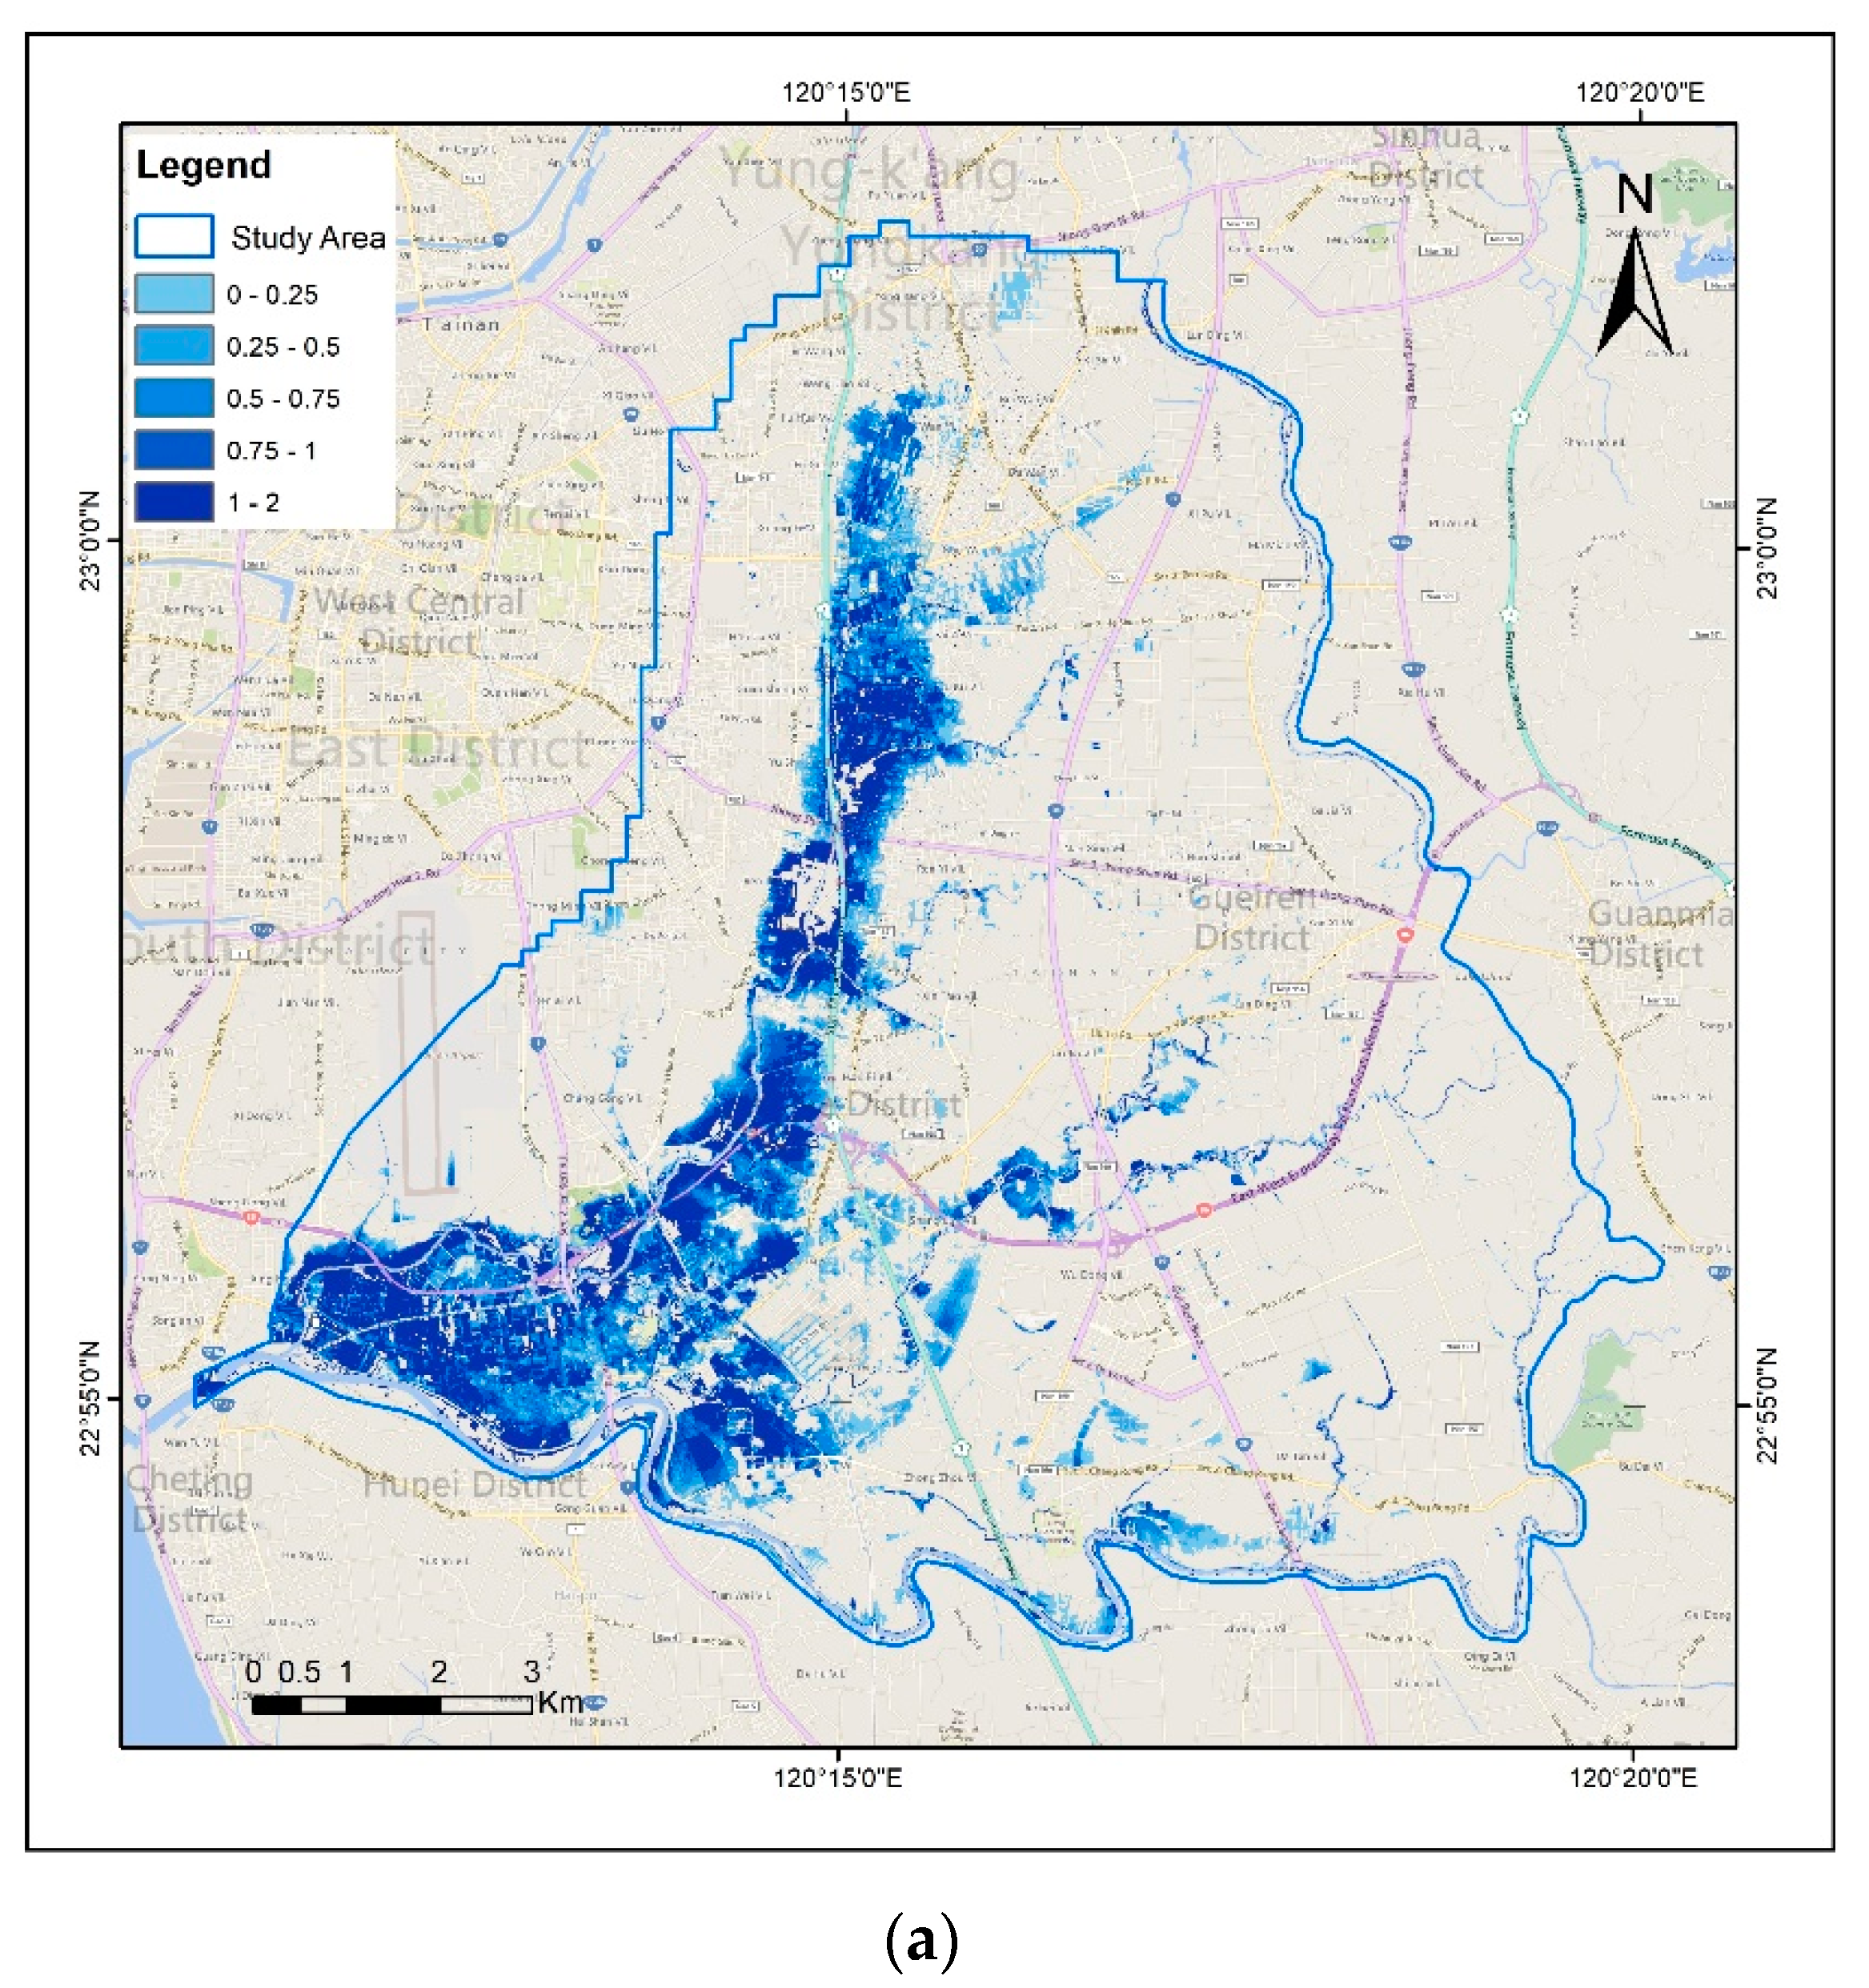
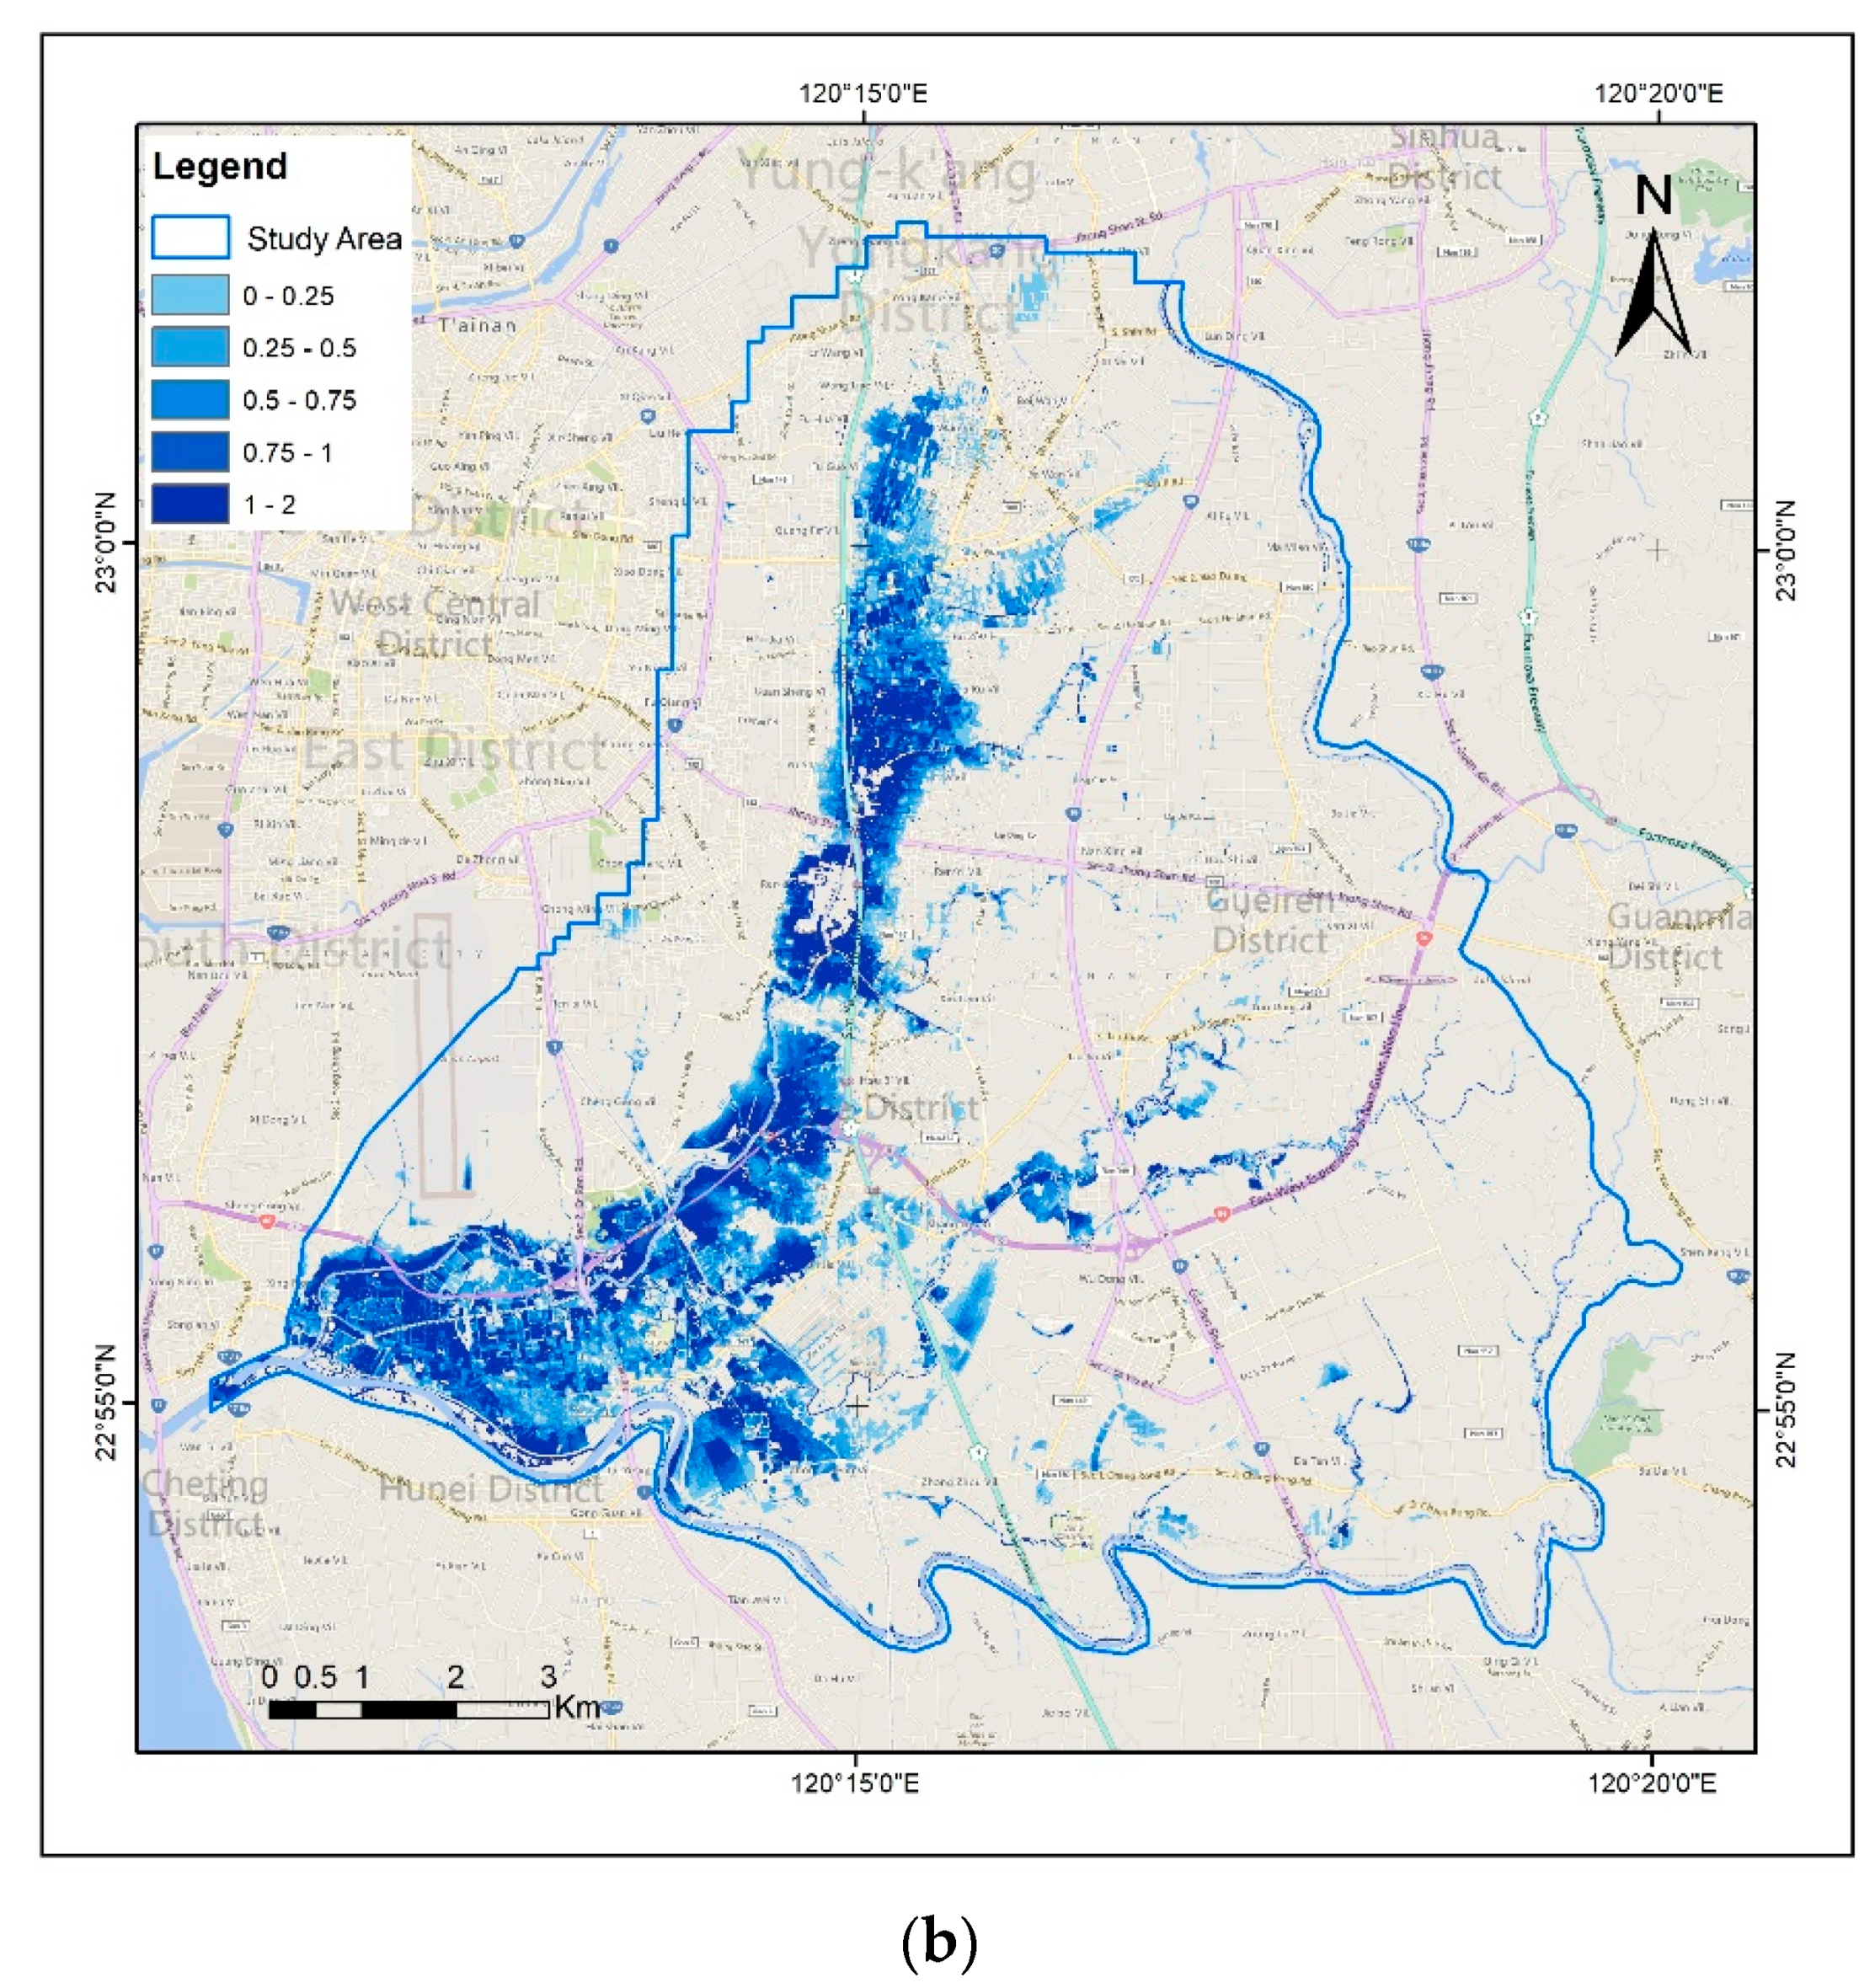
3.1. Flood Hazard Map, Depth-Damage Table, and Vulnerability Weight by AHP
3.2. Flood Loss Comparison Using Different Resolutions
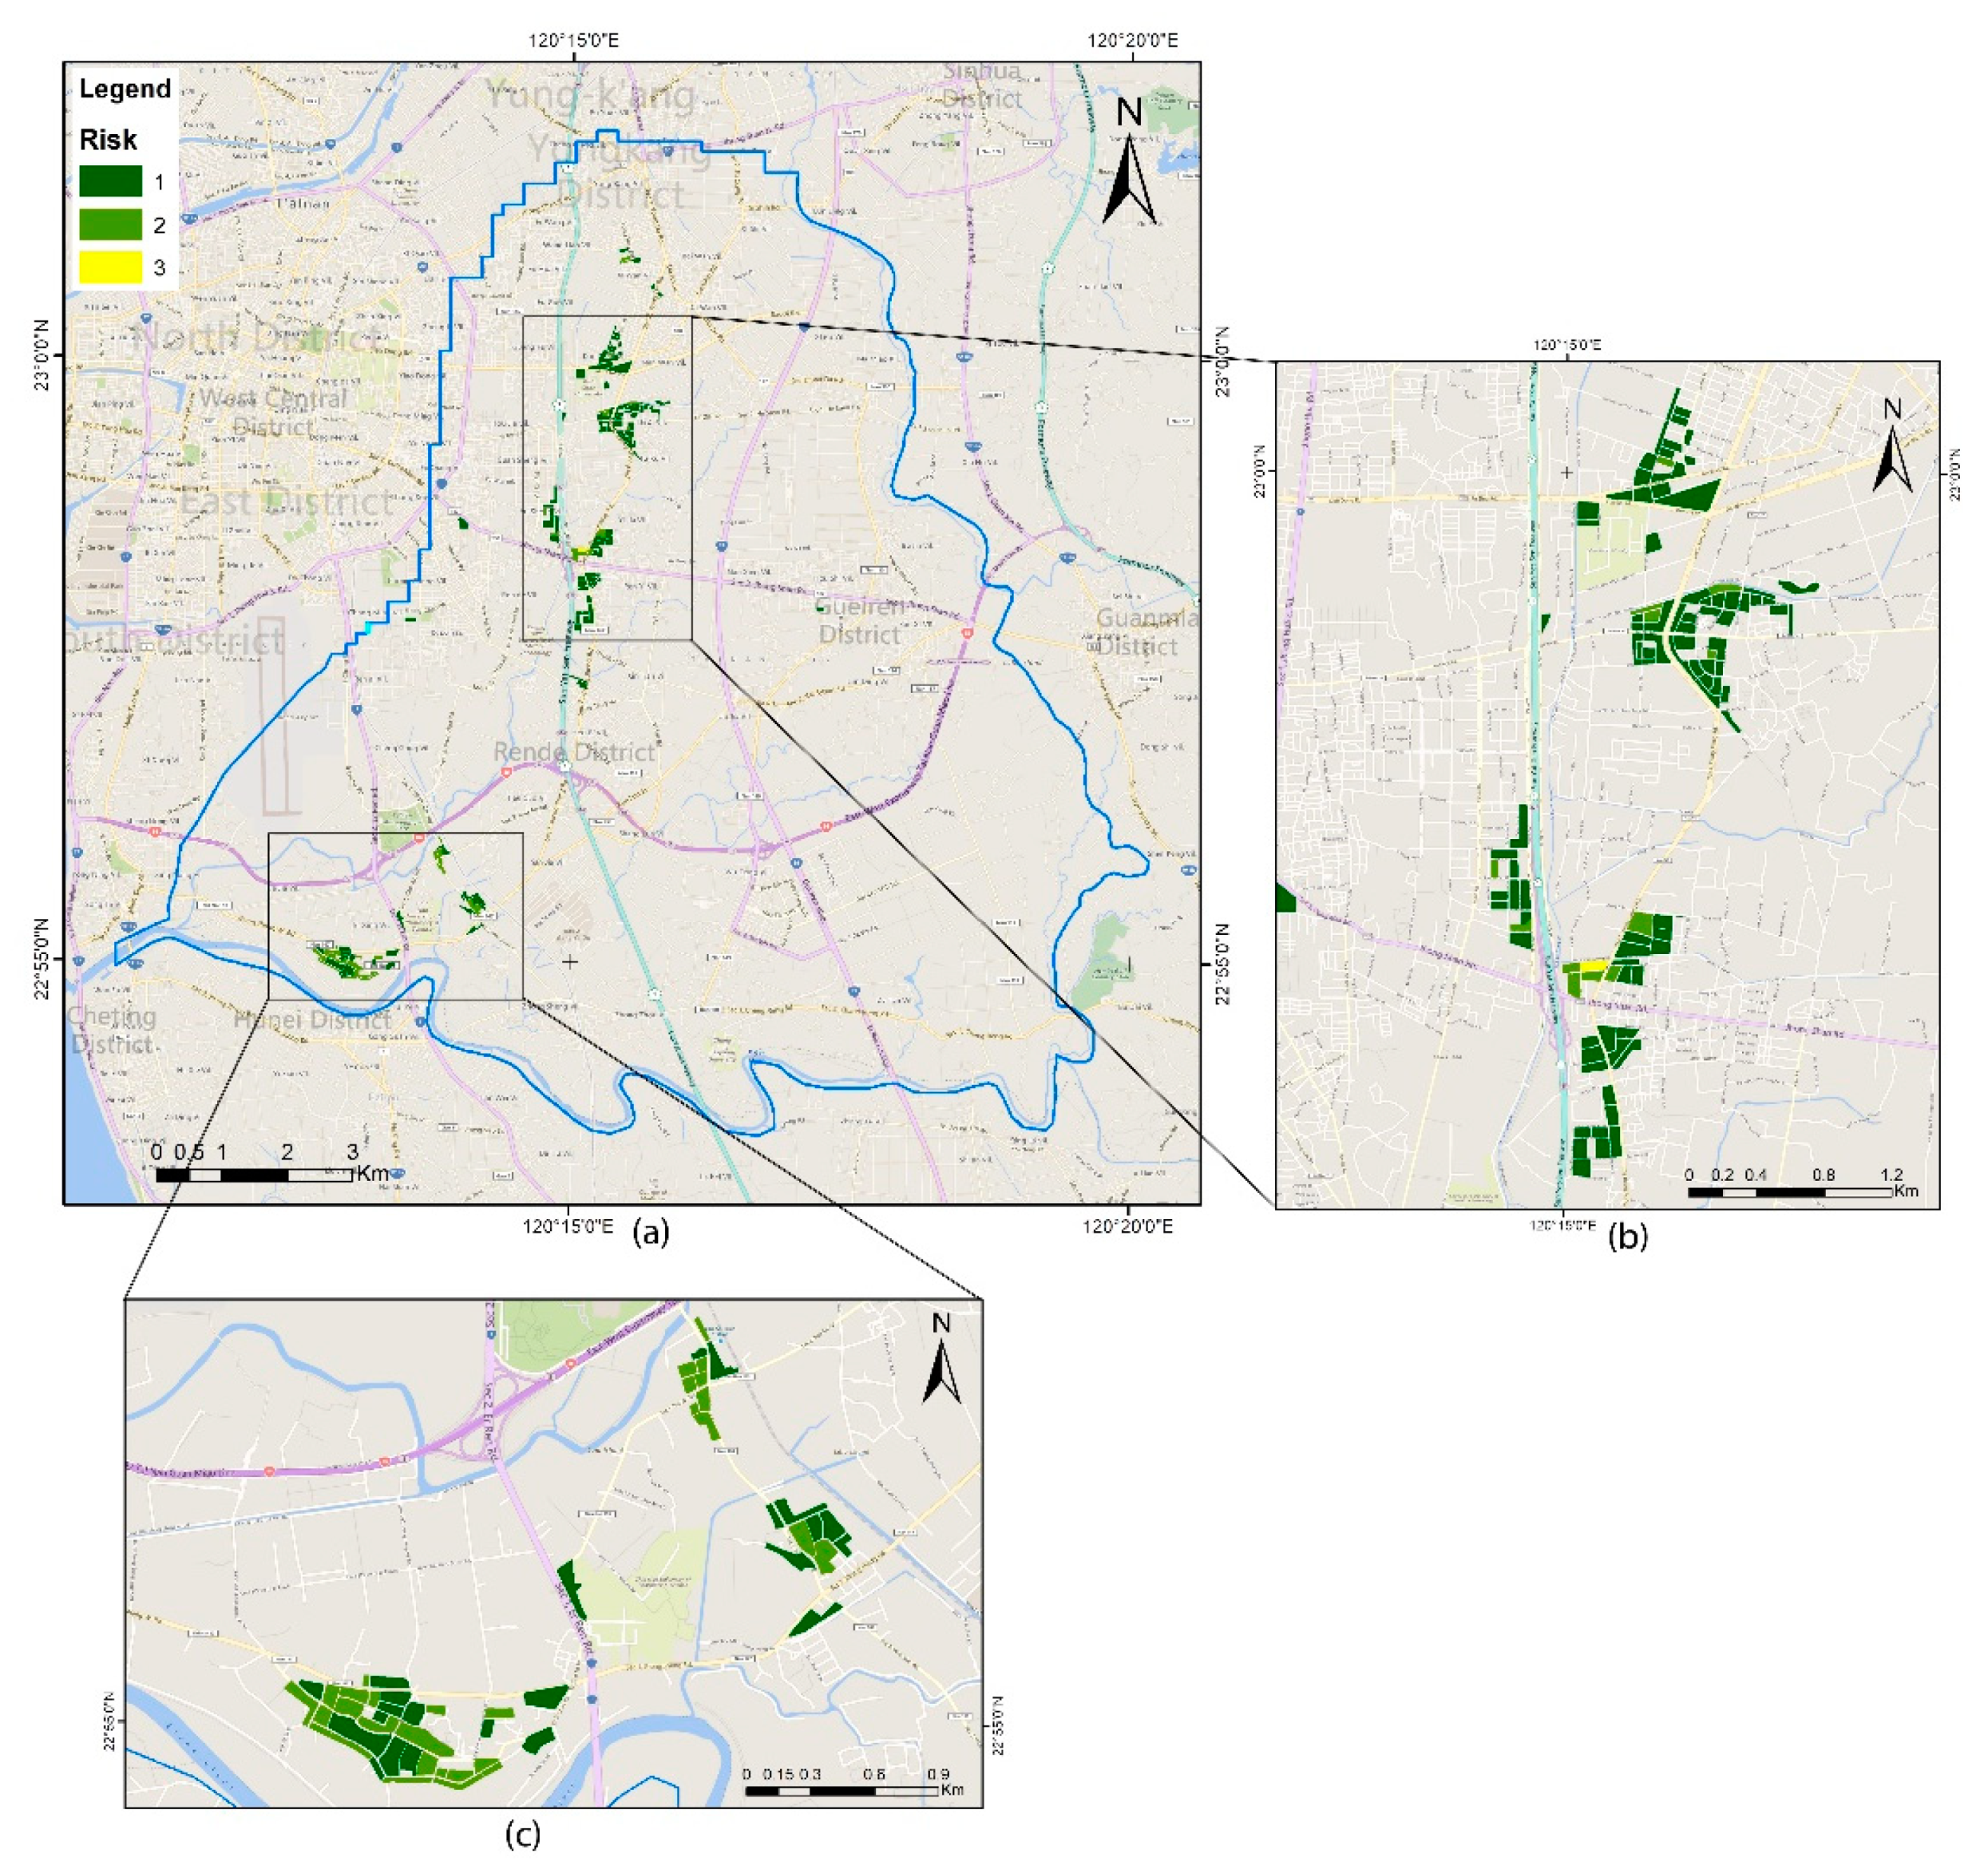
3.3. Vulnerability and Risk Maps
4. Conclusions
Author Contributions
Funding
Acknowledgments
Conflicts of Interest
References
- Teng, W.-H.; Hsu, M.-H.; Wu, C.-H.; Chen, A.S. Impact of Flood Disasters on Taiwan in the Last Quarter Century. Nat. Hazards 2006, 37, 191–207. [Google Scholar] [CrossRef]
- Eves, C. The long-term impact of flooding on residential property values. Prop. Manag. 2002, 20, 214–227. [Google Scholar] [CrossRef]
- Li, K.; Wu, S.; Dai, E.; Xu, Z. Flood loss analysis and quantitative risk assessment in China. Nat. Hazards 2012, 63, 737–760. [Google Scholar] [CrossRef]
- Eleuterio, J.; Martinez, D.; Rozan, A. Developing a GIS tool to assess potential damage of future floods. WIT Trans. Inf. Commun. Technol. 2010, 43, 381–392. [Google Scholar]
- Velasco, M.; Cabello, À.; Russo, B. Flood damage assessment in urban areas. Application to the Raval district of Barcelona using synthetic depth damage curves. Urban Water J. 2016, 13, 426–440. [Google Scholar] [CrossRef]
- Penning-Rowsell, E.; Johnson, C.; Tunstall, S.; Tapsell, S.; Morris, J.; Chatterton, J.; Green, C. The Benefits of Flood and Coastal Risk Management: A Manual of Assessment Techniques; The Multi-Coloured Manual; Flood Hazard Research Centre, Middlesex University: London, UK, 2005. [Google Scholar]
- Pedrono, M.; Locatelli, B.; Ezzine-de-Blas, D.; Pesche, D.; Morand, S.; Binot, A. Impact of Climate Change on Ecosystem Services. Climate Change and Agriculture Worldwide; Springer: Berlin/Heidelberg, Germany, 2016; pp. 251–261. [Google Scholar]
- Naso, S.; Chen, A.S.; Aronica, G.T.; Djordjević, S. A novel approach to flood risk assessment: The Exposure-Vulnerability matrices. E3S Web Conf. 2016, 7, 08007. [Google Scholar] [CrossRef]
- Shen, D.; Wang, J.; Cheng, X.; Rui, Y.; Ye, S. Integration of 2-D hydraulic model and high-resolution lidar-derived DEM for floodplain flow modeling. Hydrol. Earth Syst. Sci. 2015, 19, 3605–3616. [Google Scholar] [CrossRef]
- Yang, S.-Y.; Chan, M.-H.; Chang, C.-H.; Chang, L.-F. The Damage Assessment of Flood Risk Transfer Effect on Surrounding Areas Arising from the Land Development in Tainan, Taiwan. Water 2018, 10, 473. [Google Scholar] [CrossRef]
- Dahm, R.; Hsu, C.-T.; Lien, H.-C.; Chang, C.-H.; Prinsen, G. (Eds.) Next generation flood modelling using 3Di: A case study in Taiwan. In Proceedings of the DSD International Conference, Hongkong, China, 12–14 November 2014. [Google Scholar]
- Stelling, G.S. Quadtree flood simulations with sub-grid digital elevation models. Proc. Inst. Civ. Eng. 2012, 165, 567–580. [Google Scholar]
- Meesuk, V. Point Cloud Data Fusion for Enhancing 2D Urban Flood Modelling; CRC Press: Boca Raton, FL, USA, 2017. [Google Scholar]
- Merz, B.; Hall, J.; Disse, M.; Schumann, A. Fluvial flood risk management in a changing world. Nat. Hazards Earth Syst. Sci. 2010, 10, 509–527. [Google Scholar] [CrossRef]
- Birkmann, J. Measuring Vulnerability to Natural Hazards: Towards Disaster Resilient Societies; United Nations University: New York, NY, USA, 2006. [Google Scholar]
- Roy, P.S. Flood risk assessment using multi-criteria analysis: A case study from Kopili River Basin, Assam, India. Geomat. Nat. Hazards Risk. 2018, 9, 79–93. [Google Scholar]
- Karmakar, S.; Simonovic, S.P.; Peck, A.; Black, J. An Information System for Risk-Vulnerability Assessment to Flood. J. Geogr. Inf. Syst. 2010, 2, 129–146. [Google Scholar] [CrossRef]
- Saaty, T.L. A scaling method for priorities in hierarchical structures. J. Math. Psychol. 1977, 15, 234–281. [Google Scholar] [CrossRef]
- Goepel, K.D. A New AHP Excel Template with Multiple Inputs. 2013. Available online: http://bpmsg.com (accessed on 20 April 2018).
- Nasiri, H.; Yusof, M.J.M.; Ali, T.A.M. An overview to flood vulnerability assessment methods. Sustain. Resour. Manag. 2016, 2, 331–336. [Google Scholar] [CrossRef]
- Komolafe, A.; Herath, S.; Avtar, R. Sensitivity of flood damage estimation to spatial resolution. J. Flood Risk Manag. 2018, 11, S370–S381. [Google Scholar] [CrossRef]
- Chen, A.S.; Hammond, M.J.; Djordjević, S.; Butler, D.; Khan, D.M.; Veerbeek, W. From hazard to impact: Flood damage assessment tools for mega cities. Nat. Hazards 2016, 82, 857–890. [Google Scholar] [CrossRef]
- Bermúdez, M.; Zischg, A.P. Sensitivity of flood loss estimates to building representation and flow depth attribution methods in micro-scale flood modelling. Nat. Hazards 2018, 92, 1633–1648. [Google Scholar] [CrossRef]
- Ward, P.J.; De Moel, H.; Aerts, J.C.J.H. How are flood risk estimates affected by the choice of return-periods? Nat. Hazards Earth Syst. Sci. 2011, 11, 3181–3195. [Google Scholar] [CrossRef]
- Kobayashi, K.; Takara, K.; Sano, H.; Tsumori, H.; Sekii, K. A high-resolution large-scale flood hazard and economic risk model for the property loss insurance in Japan. J. Flood Risk Manag. 2016, 9, 136–153. [Google Scholar] [CrossRef]
- Collet, L.; Beevers, L.; Stewart, M.D. Decision-Making and Flood Risk Uncertainty: Statistical Data Set Analysis for Flood Risk Assessment. Water Resour. Res. 2018, 54, 7291–7308. [Google Scholar] [CrossRef]
- Wagenaar, D.J.; De Bruijn, K.M.; Bouwer, L.M.; De Moel, H. Uncertainty in flood damage estimates and its potential effect on investment decisions. Nat. Hazards Earth Syst. Sci. 2016, 16, 1–14. [Google Scholar] [CrossRef]
- Winter, B.; Schneeberger, K.; Huttenlau, M.; Stötter, J. Sources of uncertainty in a probabilistic flood risk model. Nat. Hazards 2018, 91, 431–446. [Google Scholar] [CrossRef]
- Lepeška, T. The impact of impervious surfaces on ecohydrology and health in urban ecosystems of Banská Bystrica (Slovakia). Soil Water Res. 2016, 11, 29–36. [Google Scholar] [CrossRef]


| Depth-Damage | Depth (m) | ||||
|---|---|---|---|---|---|
| <0.15 | 0.15–0.35 | 0.35–0.7 | 0.7–0.9 | ≥2 | |
| Damage (NTD/m²) | 0 | 242 | 1136 | 1623 | 3607 |
| AHP Factor | Elevation | Distance to River | Distance to Fire Station | Population Density |
|---|---|---|---|---|
| Weight | 0.202 | 0.271 | 0.217 | 0.310 |
| Flood Event | Different Resolutions | |||||
|---|---|---|---|---|---|---|
| 1 m | 5 m | 10 m | ||||
| Area (m²) | Residential Loss (NTD) | Area (m²) | Residential Loss (NTD) | Area (m²) | Residential Loss (NTD) | |
| Megi 2016 | 515,477 | 257,760,212 | 539,148 | 258,043,549 | 611,390 | 277,865,133 |
| Haitang 2017 | 330,025 | 137,362,931 | 335,488 | 134,118,030 | 414,167 | 152,810,339 |
| Flood Event | Residential Loss in Different Resolution (NTD) | ||
|---|---|---|---|
| 1 m | 5 m | 10 m | |
| Megi 2016 | 257,760,212 | 258,043,549 | 277,865,133 |
| Difference from 1 m resolution | 0.1% | 7.8% | |
| Haitang 2017 | 137,362,931 | 134,118,030 | 152,810,339 |
| Difference from 1 m resolution | −2.4% | 11.2% | |
© 2019 by the authors. Licensee MDPI, Basel, Switzerland. This article is an open access article distributed under the terms and conditions of the Creative Commons Attribution (CC BY) license (http://creativecommons.org/licenses/by/4.0/).
Share and Cite
Afifi, Z.; Chu, H.-J.; Kuo, Y.-L.; Hsu, Y.-C.; Wong, H.-K.; Zeeshan Ali, M. Residential Flood Loss Assessment and Risk Mapping from High-Resolution Simulation. Water 2019, 11, 751. https://doi.org/10.3390/w11040751
Afifi Z, Chu H-J, Kuo Y-L, Hsu Y-C, Wong H-K, Zeeshan Ali M. Residential Flood Loss Assessment and Risk Mapping from High-Resolution Simulation. Water. 2019; 11(4):751. https://doi.org/10.3390/w11040751
Chicago/Turabian StyleAfifi, Zulfahmi, Hone-Jay Chu, Yen-Lien Kuo, Yung-Chia Hsu, Hock-Kiet Wong, and Muhammad Zeeshan Ali. 2019. "Residential Flood Loss Assessment and Risk Mapping from High-Resolution Simulation" Water 11, no. 4: 751. https://doi.org/10.3390/w11040751
APA StyleAfifi, Z., Chu, H.-J., Kuo, Y.-L., Hsu, Y.-C., Wong, H.-K., & Zeeshan Ali, M. (2019). Residential Flood Loss Assessment and Risk Mapping from High-Resolution Simulation. Water, 11(4), 751. https://doi.org/10.3390/w11040751