


Abstract
Atmospheric aerosol absorption is a key parameter for assessing aerosol effects on air quality and climate, yet the comparability of absorption measurements obtained with attenuation-based and offline filter-based techniques remains uncertain under real-world conditions. This issue is particularly relevant in complex urban coastal environments, where aerosols are influenced by traffic, shipping, industrial emissions, and marine air masses. Here, we investigate this methodological comparability through a multi-wavelength field intercomparison of the AE33 Aethalometer with two independent filter-based techniques, the Multi-Wavelength Absorption Analyzer (MWAA) and the Broadband Light Analyzer of Complex Aerosols (BLAnCA), at the Multedo urban coastal site in Genoa, Italy. The three techniques showed strong correlations across the ultraviolet, visible, and near-infrared spectral regions (R2 = 0.93–0.99), with the closest agreement observed between MWAA and BLAnCA. AE33 reproduced the temporal variability in aerosol absorption well but systematically reported higher absorption coefficients than the two offline techniques, with differences of approximately 12–22% depending on wavelength. This systematic offset indicates that the default AE33 multiple-scattering correction may not fully represent the optical characteristics of the aerosol population sampled at this site. Absorption Ångström Exponent values derived independently from the three techniques remained close to unity, consistently suggesting a substantial influence of primary combustion emissions during the investigated campaign. Overall, the combined comparison of real-time and filter-based multi-wavelength techniques provides field-based evidence of their relative consistency and identifies a systematic AE33 bias that is relevant for improving the harmonization of aerosol absorption measurements in urban coastal monitoring environments.
1. Introduction
Atmospheric aerosols consist of solid or liquid particles suspended in the atmosphere, originating from a wide range of natural and anthropogenic sources [1]. Natural sources include dust, sea salt particles, volcanic emissions, and biogenic particles, whereas anthropogenic sources mainly include fossil fuel combustion, industrial activities, biomass burning, and vehicular traffic [2]. Atmospheric aerosols play a significant role in climate and air quality through their interactions with solar radiation, clouds, and atmospheric chemical processes [3]. Aerosols directly affect the radiative balance of the atmosphere by scattering and absorbing solar radiation, leading to either cooling or warming effects depending on their physical and chemical properties [4]. Despite significant advances in aerosol research, large uncertainties still affect estimates of aerosol radiative forcing in current climate assessments, mostly due to the complex and variable nature of aerosol optical properties [5].
Among atmospheric aerosols, particulate matter (PM) is of particular relevance because of its atmospheric lifetime, chemical reactivity, and impacts on climate and human health [6,7]. PM2.5 is especially relevant because its small aerodynamic diameter allows it to penetrate deeply into the respiratory system and to remain suspended long enough to undergo transport and atmospheric processing. Due to its small size, PM2.5 can travel over long distances and participate in various atmospheric processes. The optical properties of PM2.5 mainly depend on particle size, shape, refractive index, and mixing state [8,9]. These properties control how particles interact with light. In particular, the balance between light scattering and absorption determines whether aerosols have a cooling or warming effect on the atmosphere [10]. These effects are commonly described using parameters such as the scattering coefficient, absorption coefficient, and single-scattering albedo (SSA) [11,12].
A reliable characterization of aerosol optical properties requires the combined use of complementary measurement techniques, such as the CASS system (aethalometer AE33/AE36 coupled with TCA08) [13,14]. However, these instruments are normally limited in their spectral range. In contrast, filter-based methods, such as the Multi-Wavelength Absorption Analyzer and the Broadband Light Analyzer of Complex Aerosol, allow for detailed spectral analysis of aerosol absorption over a wider wavelength range [15,16]. Therefore, combining these real-time and offline techniques offers a more complete and consistent explanation of aerosol optical properties [17].
Despite the availability of these techniques, differences between measurement methods are still a challenge, especially at shorter wavelengths where filter loading effects and light scattering artifacts can affect absorption measurements [17]. These uncertainties can lead to variations between instruments and make data interpretation more difficult. Therefore, systematic comparison of different optical instruments under real atmospheric conditions is very important to improve measurement accuracy and to better understand aerosol optical properties.
This study aims to characterize PM2.5 and carbonaceous aerosols during the January–March 2025 field campaign at the Multedo coastal urban site. It also compares aerosol absorption coefficients measured by Aethalometer (AE33), Multi-Wavelength Absorption Analyzer (MWAA), and Broadband Light Analyzer of Complex Aerosols (BLAnCA) at ultraviolet, visible, and near-infrared wavelengths [18]. Another objective is to evaluate the agreement and differences among these techniques, with particular attention to the AE33 multiple-scattering correction factor (C-factor). Finally, this study discusses how these results can help improve the harmonization of aerosol absorption measurements in long-term monitoring networks.
2. Materials and Methods
2.1. Study Area
Ambient PM2.5 sampling was conducted at the ARPAL (Agenzia Regionale per la Protezione dell’Ambiente Ligure) air-quality-monitoring station “Genova–Ronchi”, located in the Multedo district of Genoa, Liguria, northwestern Italy (44.4255° N, 8.8260° E; 20 m above sea level). The station is part of the regional air-quality-monitoring network (RMQA) and is representative of a coastal urban–industrial environment.
The monitoring site is situated near the Port of Genoa and the Porto Petroli area, one of the largest petroleum storage and handling facilities in Italy. The surrounding area includes several potential anthropogenic emission sources, including maritime activities, road traffic, industrial operations, and residential emissions.
The proximity of the station to the Ligurian Sea further allows the influence of coastal meteorological conditions and marine air masses on aerosol properties to be evaluated. Previous measurements in the Genoa area showed that aerosol concentrations and composition are strongly affected by the interaction between local urban–industrial emissions, marine aerosol inputs, and regional transport processes, including advection from the Po Valley [19].
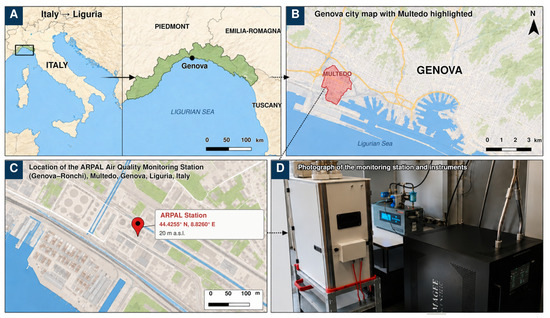
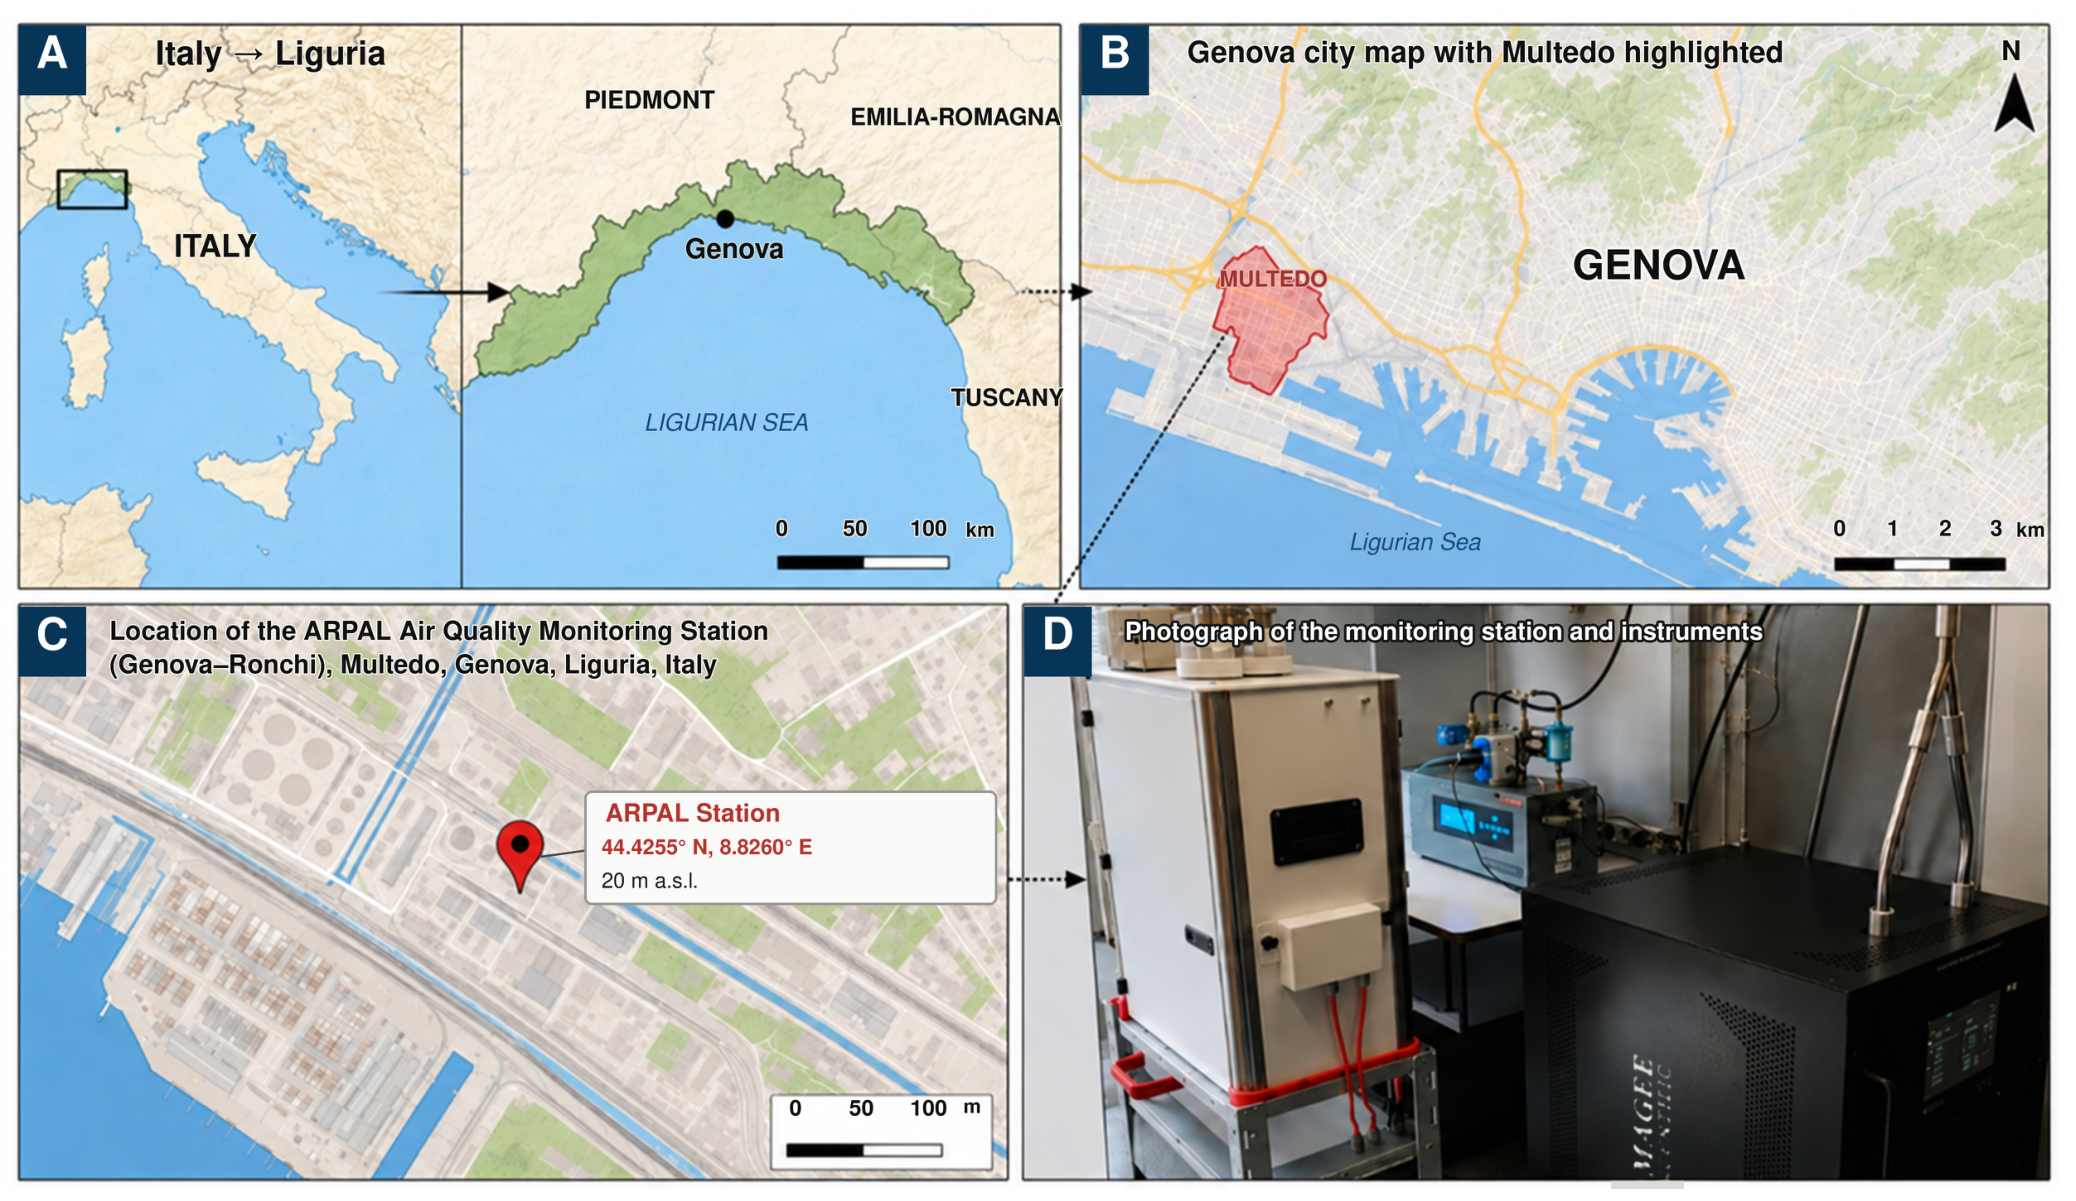
The field campaign was conducted from January to March 2025. During the campaign, the PM2.5 samples were collected on quartz-fiber filters for subsequent gravimetric and offline optical analyses. The location of the monitoring station and the sampling infrastructure are shown in Figure 1.
Figure 1.
Location of the ARPAL air quality monitoring station (Genova–Ronchi) in Multedo, Genoa, Liguria, Italy. Panel (A) shows the location of Liguria within Italy; Panel (B) identifies the Multedo district within the metropolitan area of Genoa; Panel (C) presents the exact location of the monitoring station (44.4255° N, 8.8260° E; 20 m a.s.l.); and Panel (D) shows a photograph of the monitoring station and sampling instruments used during the field campaign.
2.2. Experimental Setup
Ambient aerosol sampling was conducted using three parallel measurement systems installed at the ARPAL Genova–Ronchi monitoring station (Figure 1D). Each system was equipped with an independent sharp-cut PM2.5 cyclone inlet to ensure consistent aerodynamic size selection and to prevent interference among instruments.
The monitoring configuration consisted of: (i) a Carbonaceous Aerosol Sampling System (CASS) combining an Aethalometer AE33 (Magee Scientific, Ljubljana, Slovenia) and a Thermal Carbon Analyzer (TCA08) (Magee Scientific, Ljubljana, Slovenia) for continuous measurements of aerosol optical absorption and carbonaceous aerosol fractions, and (ii) filter-based PM2.5 sampler (Giano sequential sampler, Dado Lab, Milan, Italy), for offline gravimetric and optical analysis.
The AE33 Aethalometer operated at a flow rate of 5 L min−1, while the TCA08 Thermal Carbon Analyzer was operated at its standard flow rate of 1 m3 h−1 (16.7 L min−1).
The instrument measured aerosol attenuation at seven wavelengths (370, 470, 520, 590, 660, 880, and 950 nm). The corresponding default AE33 mass absorption cross-sections (MAC) were 18.47, 14.54, 13.14, 11.58, 10.35, 7.77, and 7.19 m2 g−1, respectively. Filter-loading effects were compensated using the built-in dual-spot algorithm, and the manufacturer-default multiple-scattering correction factor (C0 = 1.57), implemented in the standard AE33 data-processing procedure, was used in this study [13]. The eBC concentration at 880 nm, calculated using MAC = 7.77 m2 g−1, was used for the carbonaceous aerosol analysis described in Section 3.2.
The OC concentrations reported in this study were derived from the continuous CASS measurements. Total carbon (TC) was measured by the TCA08, whereas eBC was measured concurrently by the AE33; OC was subsequently obtained from the difference between TC and eBC. For the TCA08 thermal measurement, blank/background contributions are handled within the instrument analytical procedure [14].
Daily PM2.5 sampling was performed using the Giano sequential sampler. The standard sampling flow rate of 38.3 L min−1 was split between two parallel sampling lines: a quartz-fiber filter line and a Nucleopore filter line. Since the Nucleopore line was operated at 10 L min−1, the effective flow rate through the quartz-fiber filter line was 28.3 L min−1. This setup allowed for simultaneous particle collection on both filter types for subsequent analyses. Quartz-fiber filters were used for the determination of PM2.5 mass concentration, and aerosol optical properties through offline analyses, described in Section 2.5.
To ensure temporal consistency with the filter-based measurements, AE33 absorption coefficients were averaged over the same 24 h sampling intervals used for quartz-filter collection. For both measurement systems, the sampled air volumes were considered at the actual operating conditions, without conversion to standard temperature and pressure conditions. The AE33 and the filter sampler operated simultaneously within the same monitoring cabin and were therefore exposed to the same temperature and relative-humidity conditions. Consequently, no additional temperature or relative-humidity correction was applied before the 24 h comparison.
All sampling flow rates were calibrated before deployment and periodically verified throughout the campaign to ensure measurement accuracy and data quality. The use of independent inlets for each instrument minimized sampling artifacts and maintained stable operating conditions during the measurement period.
2.3. Real-Time Optical Measurements
For the optical intercomparison, AE33 absorption coefficients were reconstructed from the wavelength-resolved eBC concentrations exported by the instrument according to:
where eBCAE33(λ) is the equivalent black carbon concentration at wavelength λ and MACAE33(λ) is the corresponding wavelength-dependent mass absorption cross-section reported in Section 2.2.
babs,AE33(C0, λ) = eBCAE33(λ) × MACAE33(λ)
When eBC is expressed in ng m−3 and MAC in m2 g−1, the corresponding absorption coefficient is:
babs,AE33 [Mm−1] = eBCAE33 [ng m−3] × MACAE33 [m2 g−1]/1000
Since the exported eBC values were already obtained using the AE33 processing described above, no additional multiple-scattering correction was applied during this conversion [13].
2.4. Filter-Based Sampling and Gravimetric Analysis
PM2.5 samples were collected using a Giano sequential sampler (Dado Lab, Milan, Italy) equipped with a PM2.5 size-selective inlet. Sampling was performed on 47 mm quartz-fiber filters (Pall Tissuquartz™, 2500QAO-UP, Cytiva, Marlborough, MA, USA). The sampler operated at a nominal flow rate of 38.3 L min−1, and each sample was collected over a 24 h period. The total sampled air volume for each filter was obtained directly from the sampler records.
Before and after sampling, filters were conditioned under controlled temperature and relative humidity conditions (20 ± 1 °C and 50 ± 5% RH) and weighed using a microbalance (Sartorius MC5, Sartorius AG, Göttingen, Germany). Gravimetric determination of PM2.5 mass concentration was performed following the European reference method for PM2.5 measurements [20,21]. The PM2.5 mass concentration was calculated as follows:
where and represent the filter masses before and after sampling, respectively, and is the total sampled air volume recorded by the sampler. The uncertainty of PM2.5 mass concentration was estimated from filter weighing and sampled air volume uncertainties.
2.5. Offline Optical Analysis
Offline optical analyses were performed on the collected PM2.5 filter samples to investigate the light-absorption properties of carbonaceous aerosols. Aerosol absorption coefficients were measured using the Multi-Wavelength Absorption Analyzer (MWAA) (University of Genoa, Genoa, Italy), which determines aerosol absorption coefficients at five wavelengths (375, 407, 532, 635, and 850 nm). The MWAA measurements were used to derive optical parameters including black carbon concentration and the Absorption Ångström Exponent (AAE).
In addition, all 53 PM2.5 filter samples collected during the field campaign were analyzed using the BLAnCA (University of Genoa, Genoa, Italy). The instrument provides continuous absorption spectra over a broad wavelength range (350–1100 nm), allowing for a more detailed characterization of the spectral dependence of aerosol absorption.
The combined use of MWAA and BLAnCA provided complementary information on the optical properties of PM2.5 and enabled a comprehensive assessment of aerosol light absorption across both discrete and continuous wavelength ranges [15,22].
3. Results
3.1. PM2.5 Mass Concentrations
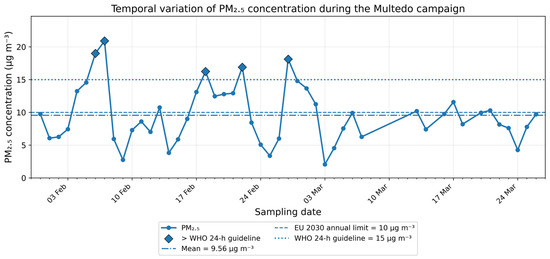
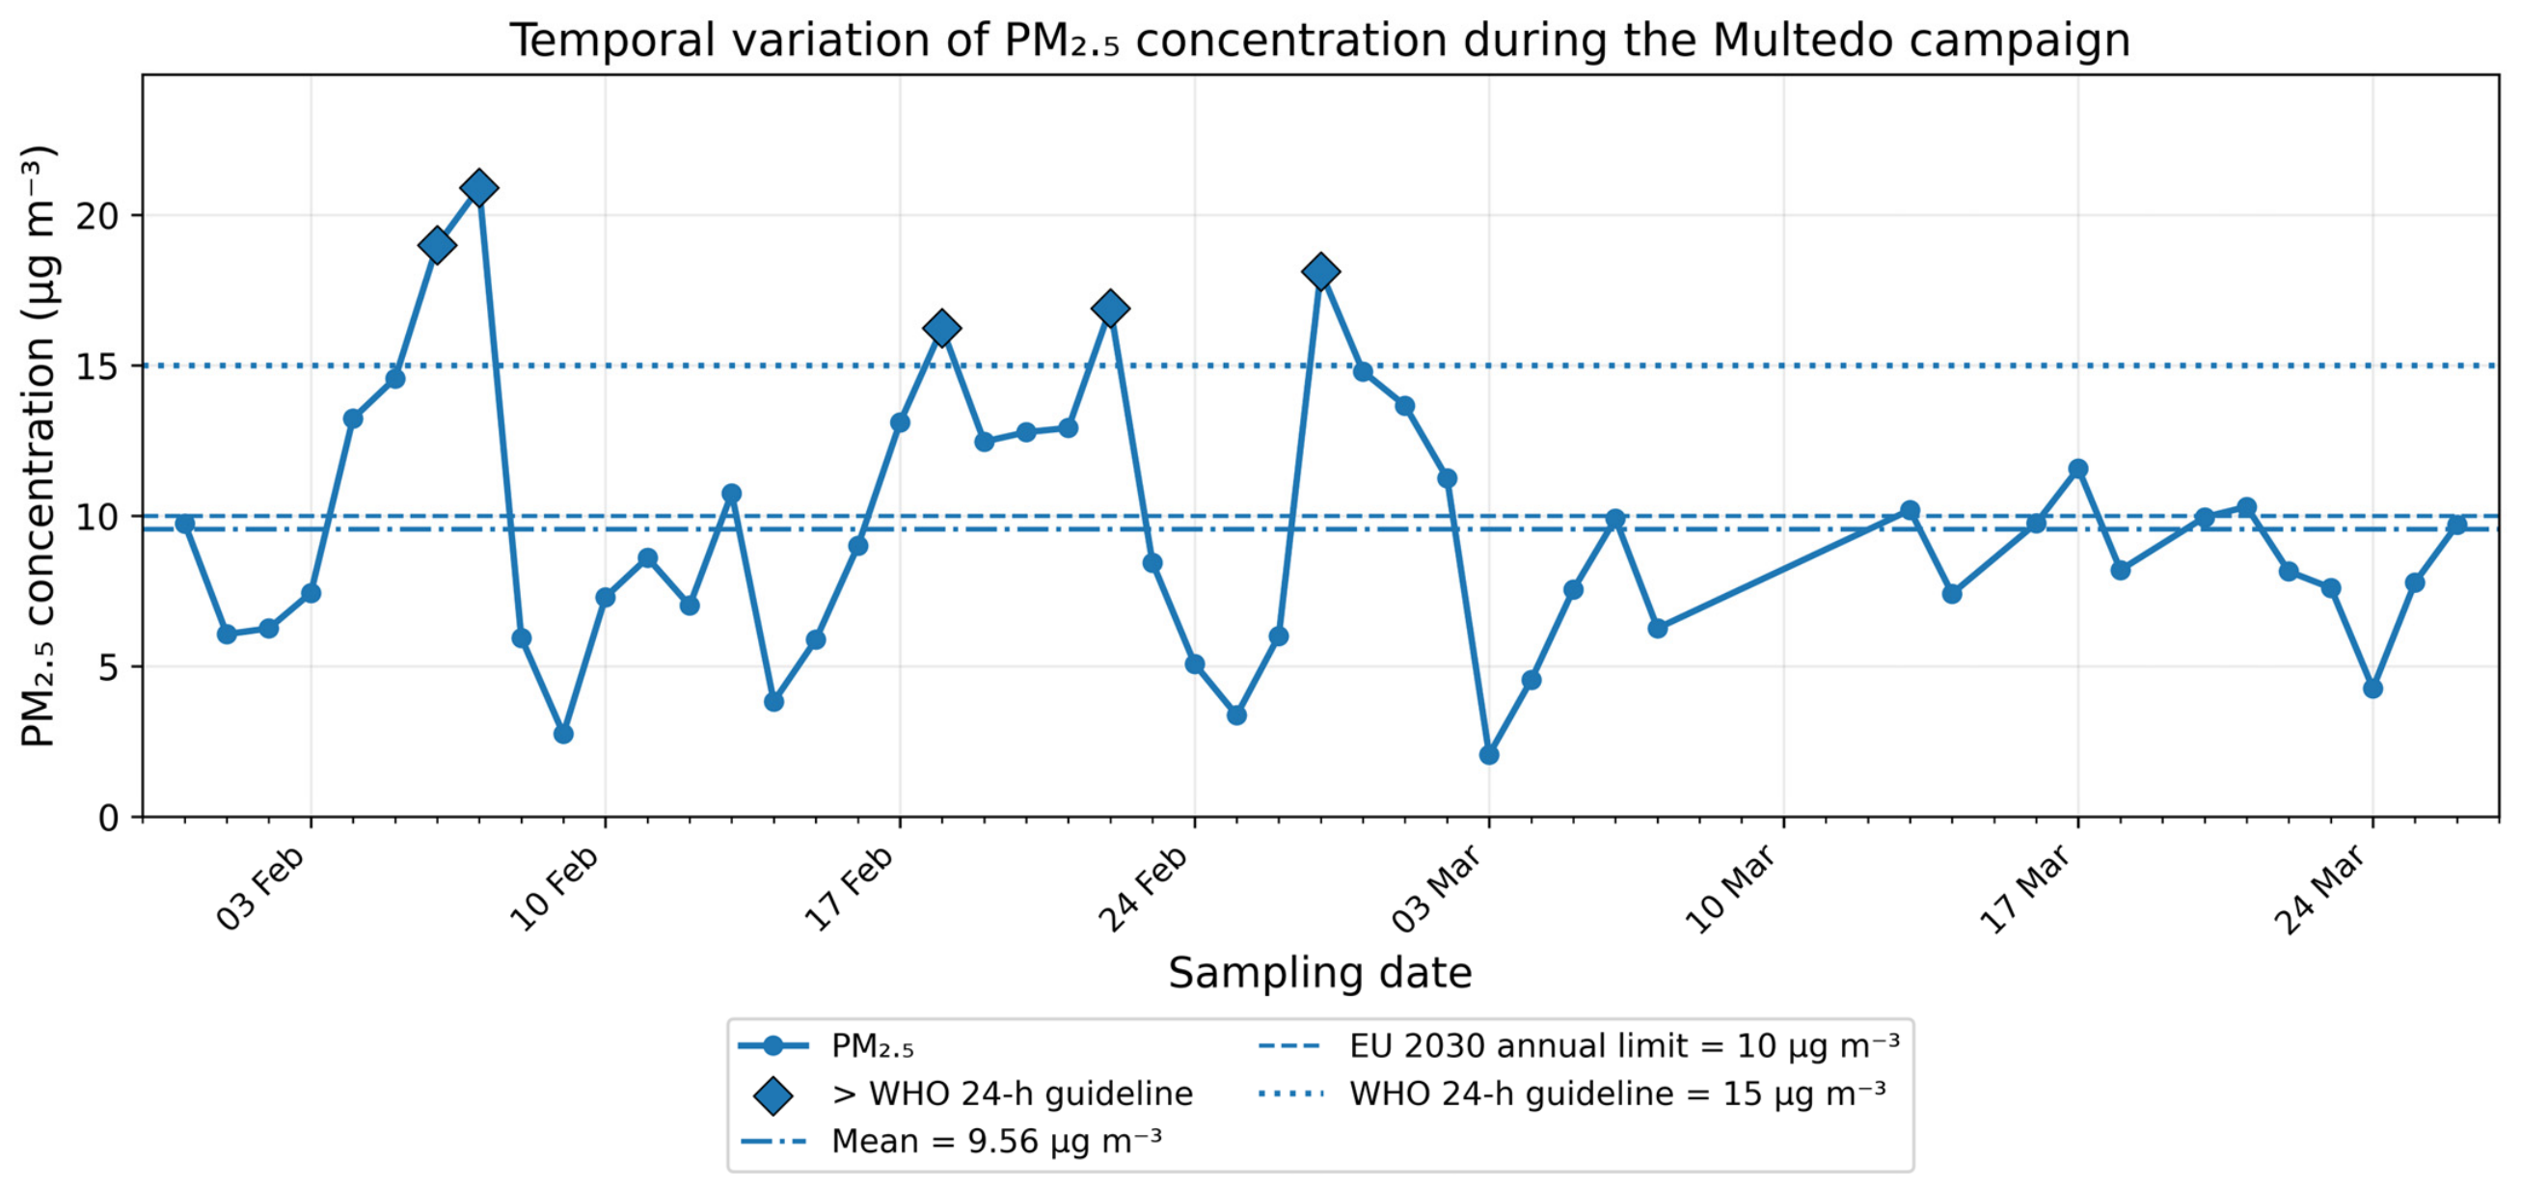
PM2.5 concentrations measured at the ARPAL monitoring station during the sampling campaign are summarized in Table 1, while their temporal evolution is presented in Figure 2. A total of 53 samples were collected between January and March 2025. PM2.5 concentrations ranged from 2.07 to 20.90 µg m−3, with a campaign-average concentration of 9.56 ± 4.33 µg m−3 and a median value of 8.80 µg m−3. The coefficient of variation (45.34%) indicates moderate temporal variability throughout the study period.
Table 1.
Descriptive statistics of PM2.5 concentrations (µg m−3) measured at the ARPAL Genova–Ronchi monitoring station during the sampling campaign.
Figure 2.
Time series of PM2.5 concentrations measured at the Multedo monitoring station (Genoa, Italy) during the January–March 2025 sampling campaign. Horizontal dashed lines represent the WHO 24 h guideline value (15 µg m−3) and the revised EU target value (10 µg m−3).
As shown in Figure 2, PM2.5 concentrations showed clear day-to-day fluctuations, with most values remaining below the WHO 24 h guideline value of 15 µg m−3 [23]. However, several episodes exceeded this threshold, particularly during late February and early March, possibly associated with enhanced local emissions and/or less favorable atmospheric dispersion conditions.
The average PM2.5 concentration during the study period was 9.56 ± 4.33 µg m−3. This value remained below the current WHO 24 h guideline for most sampling days. The revised European Union annual limit value of 10 µg m−3 is reported here only as a contextual reference and is not intended for direct comparison with the campaign-average concentration. [24]. The observed variability may reflect changes in local anthropogenic emissions and atmospheric dispersion conditions. Given the coastal location of the monitoring site, marine airflow from the Ligurian Sea may also contribute to pollutant dispersion and dilution.
The measured PM2.5 levels are comparable to those reported in previous studies conducted in the Genoa metropolitan area, where traffic and industrial activities were identified as major contributors to fine particulate matter concentrations [25,26]. Overall, the results indicate moderate PM2.5 levels during the January–March 2025 campaign at the Multedo site, providing an important context for interpreting the optical and carbonaceous aerosol properties discussed in the following sections.
3.2. Carbonaceous Aerosol Variability
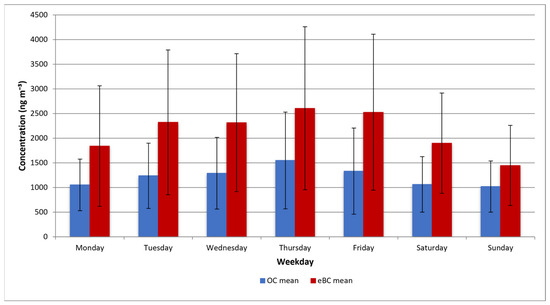
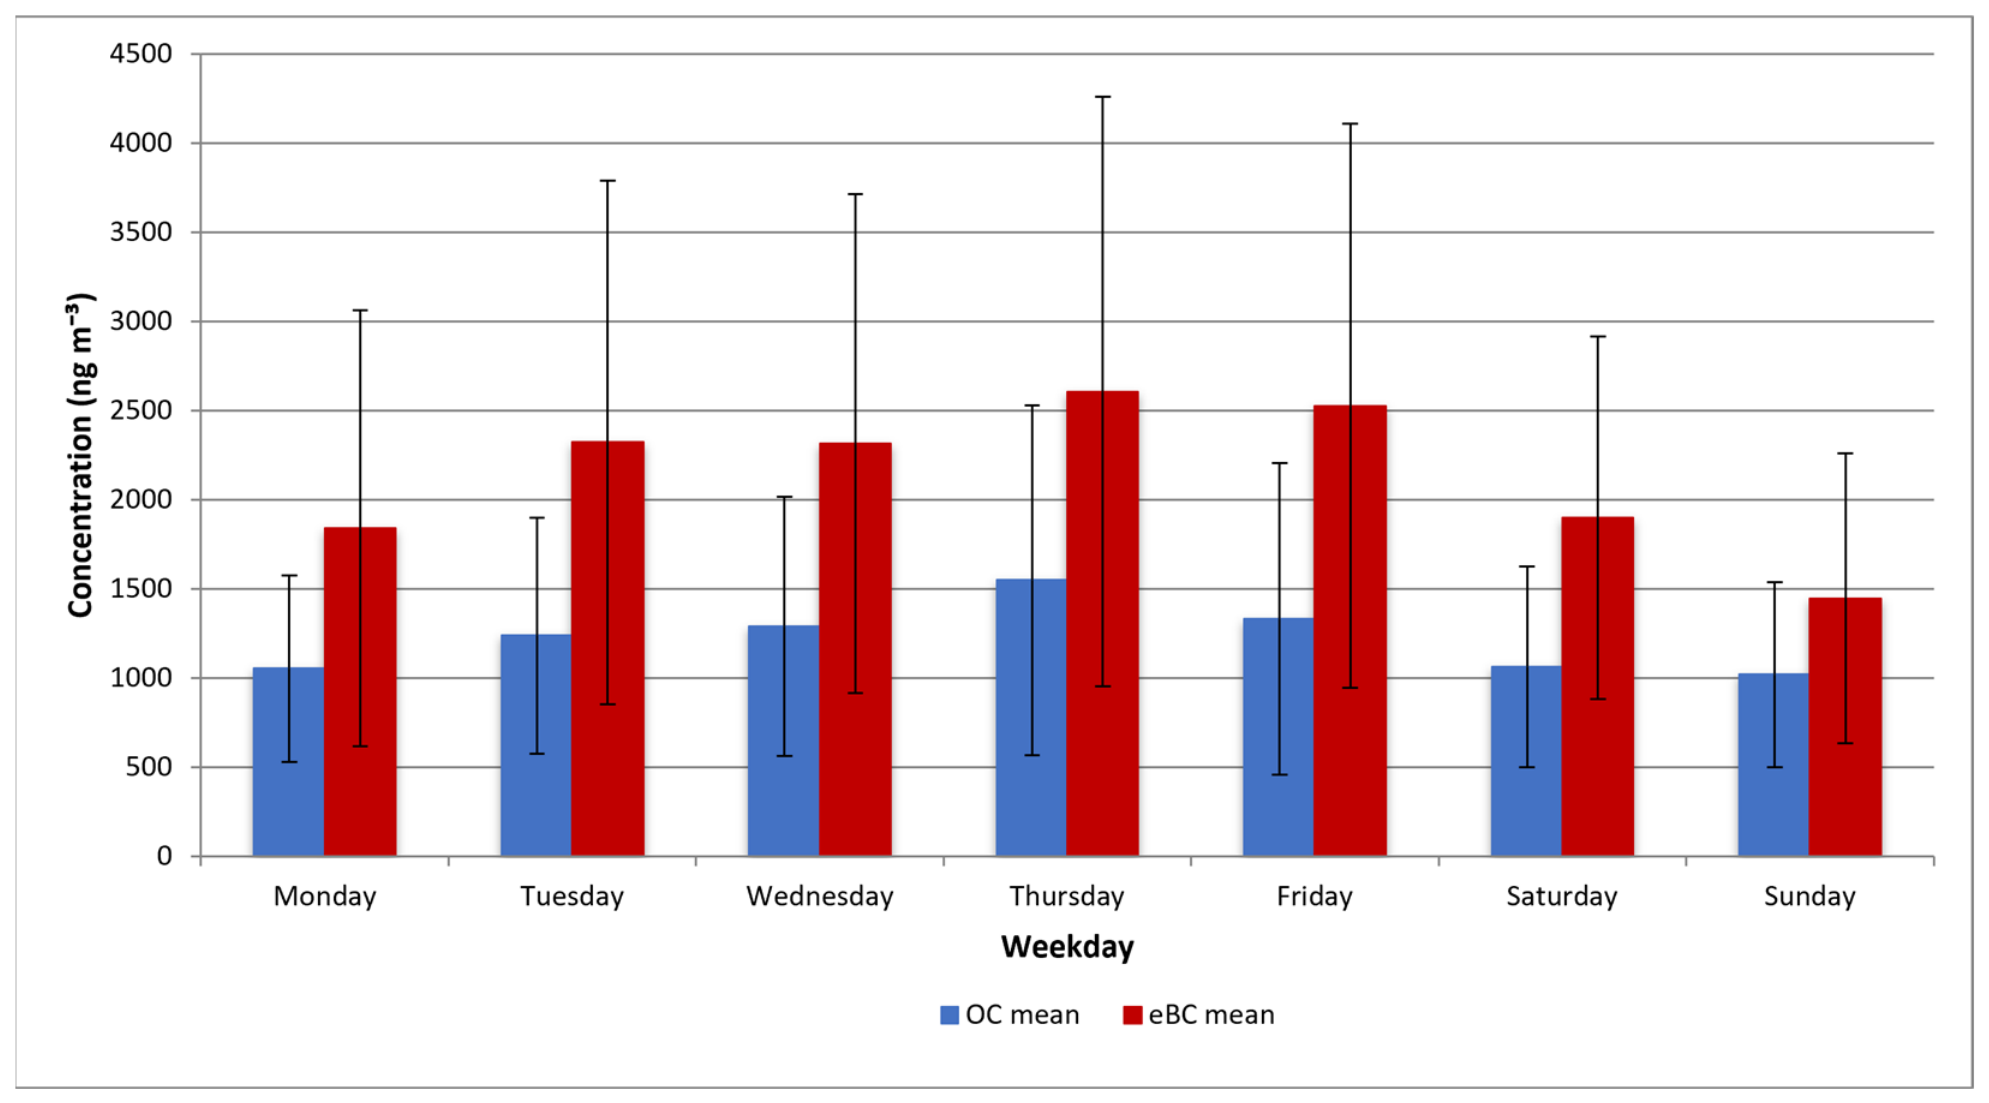
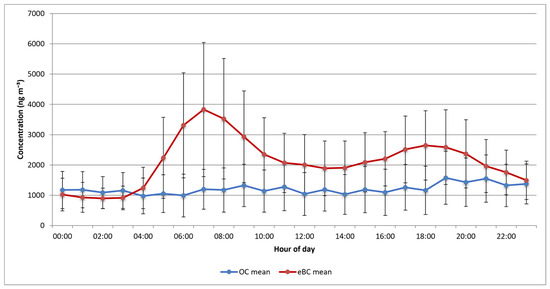
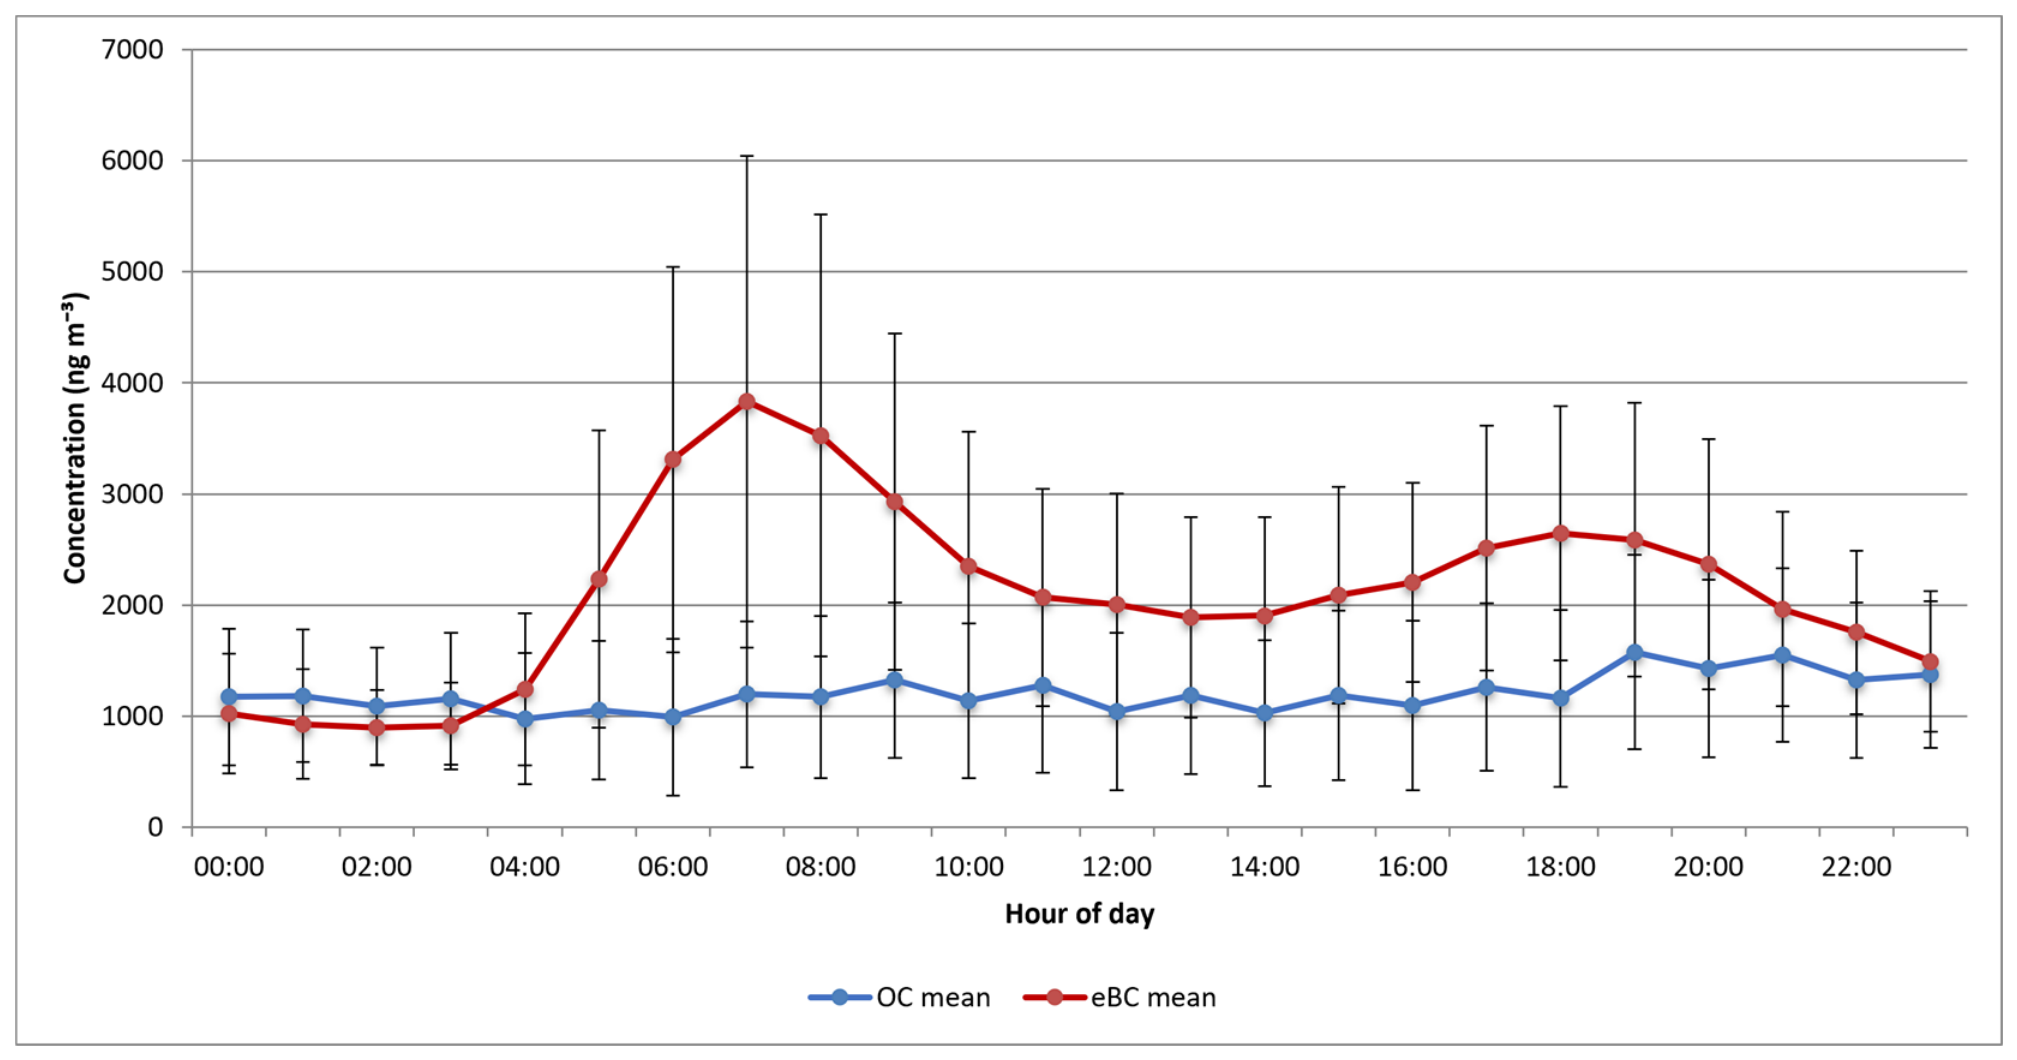
The temporal variability in carbonaceous aerosols at the ARPAL Genova–Ronchi monitoring station was investigated using organic carbon (OC) and equivalent black carbon (eBC) concentrations obtained from the CASS/TCA08 system. The eBC concentrations were derived from optical attenuation measurements using a mass absorption cross-section (MAC) of 7.77 m2 g−1 at 880 nm. Summary statistics are reported in Table 2, while the corresponding weekday and diurnal profiles are shown in Figure 3 and Figure 4.
Table 2.
Descriptive statistics of campaign-average OC, eBC and eBC/OC values.
Figure 3.
Weekday-average OC and eBC concentrations measured at the Multedo site. Error bars represent ±1 standard deviation calculated from hourly measurements for each weekday.
Figure 4.
Diurnal-average OC and eBC concentrations measured at the Multedo site. Error bars represent ±1 standard deviation calculated from hourly measurements for each hour of the day.
Throughout the campaign, eBC concentrations were consistently higher than OC concentrations in the average weekday and diurnal profiles, as Table 2 illustrates. The average concentrations for the week were 2136 ± 420 ng m−3 for eBC and 1220 ± 191 ng m−3 for OC; the equivalent values during the day were 2110 ± 802 ng m−3 and 1205 ± 160 ng m−3, respectively. For the weekday dataset and the diurnal dataset, the resulting eBC/OC ratios were 1.74 ± 0.16 and 1.77 ± 0.72, respectively.
The predominance of eBC over OC suggests an important contribution from fresh combustion emissions to the carbonaceous aerosol measured at the Multedo site. Elevated BC-to-OC ratios have been associated with combustion-related emissions, including traffic and shipping activities [27,28], while controlled combustion experiments have shown source-dependent differences in MAC values and light-absorption properties [29]. Considering the characteristics of the study area, road traffic, port activities, and emissions associated with the nearby Porto Petroli area represent plausible contributors to the observed carbonaceous aerosol. However, the available measurements do not allow the individual contributions of these sources to be quantitatively resolved.
The weekday profiles (Figure 3) showed lower values during the weekend, particularly on Sunday, and higher concentrations during working days. This temporal pattern is consistent with changes in anthropogenic activity, although the contribution of individual emission sources cannot be resolved from the available dataset. The diurnal profiles (Figure 4) also showed a pronounced morning eBC peak (3831 ng m−3 at 07:00 h), which may reflect the combined influence of enhanced morning combustion emissions and reduced atmospheric mixing. OC, in contrast, showed more moderate diurnal variability, indicating a more stable background contribution [30,31].
Although AAE values close to unity are generally consistent with fossil-fuel combustion, AAE alone cannot uniquely distinguish among specific combustion sources such as road traffic, diesel exhaust, shipping emissions, or other fossil-fuel-related activities. Therefore, the source interpretation presented in this study is based on the combined evaluation of the AAE, the eBC/OC ratio, and the characteristics of the sampling site, and should be regarded as a qualitative interpretation rather than definitive source apportionment. Additional chemical tracers, receptor modelling, or complementary meteorological analyses would be required for a more detailed discrimination of individual emission sources.
Overall, the elevated eBC concentrations, high eBC/OC ratios, clear weekday–weekend differences and pronounced morning peaks indicate that, during the investigated campaign, carbonaceous aerosol at the Multedo site was strongly influenced by fresh combustion emissions. However, the source interpretation presented here is qualitative and is based on the available optical and carbonaceous aerosol measurements together with the characteristics of the sampling site. Inorganic ion composition, source-specific chemical tracers, detailed wind-direction analyses, and backward-trajectory calculations were not available for the present study. Therefore, the individual contributions of traffic, shipping, industrial activities, marine aerosol, and regional transport cannot be quantitatively resolved from the present dataset.
3.3. Intercomparison of Absorption Measurements (AE33, MWAA, and BLAnCA)
3.3.1. Instrument Consistency Across the Spectral Range
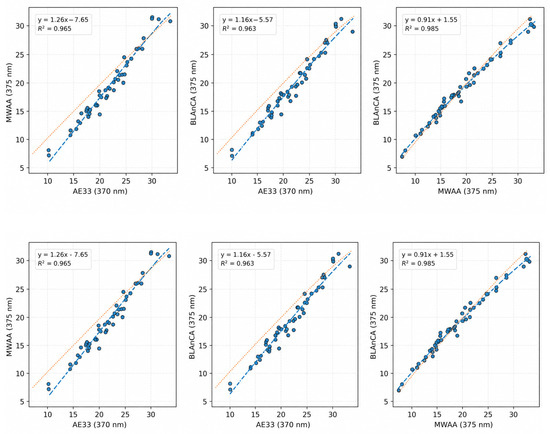
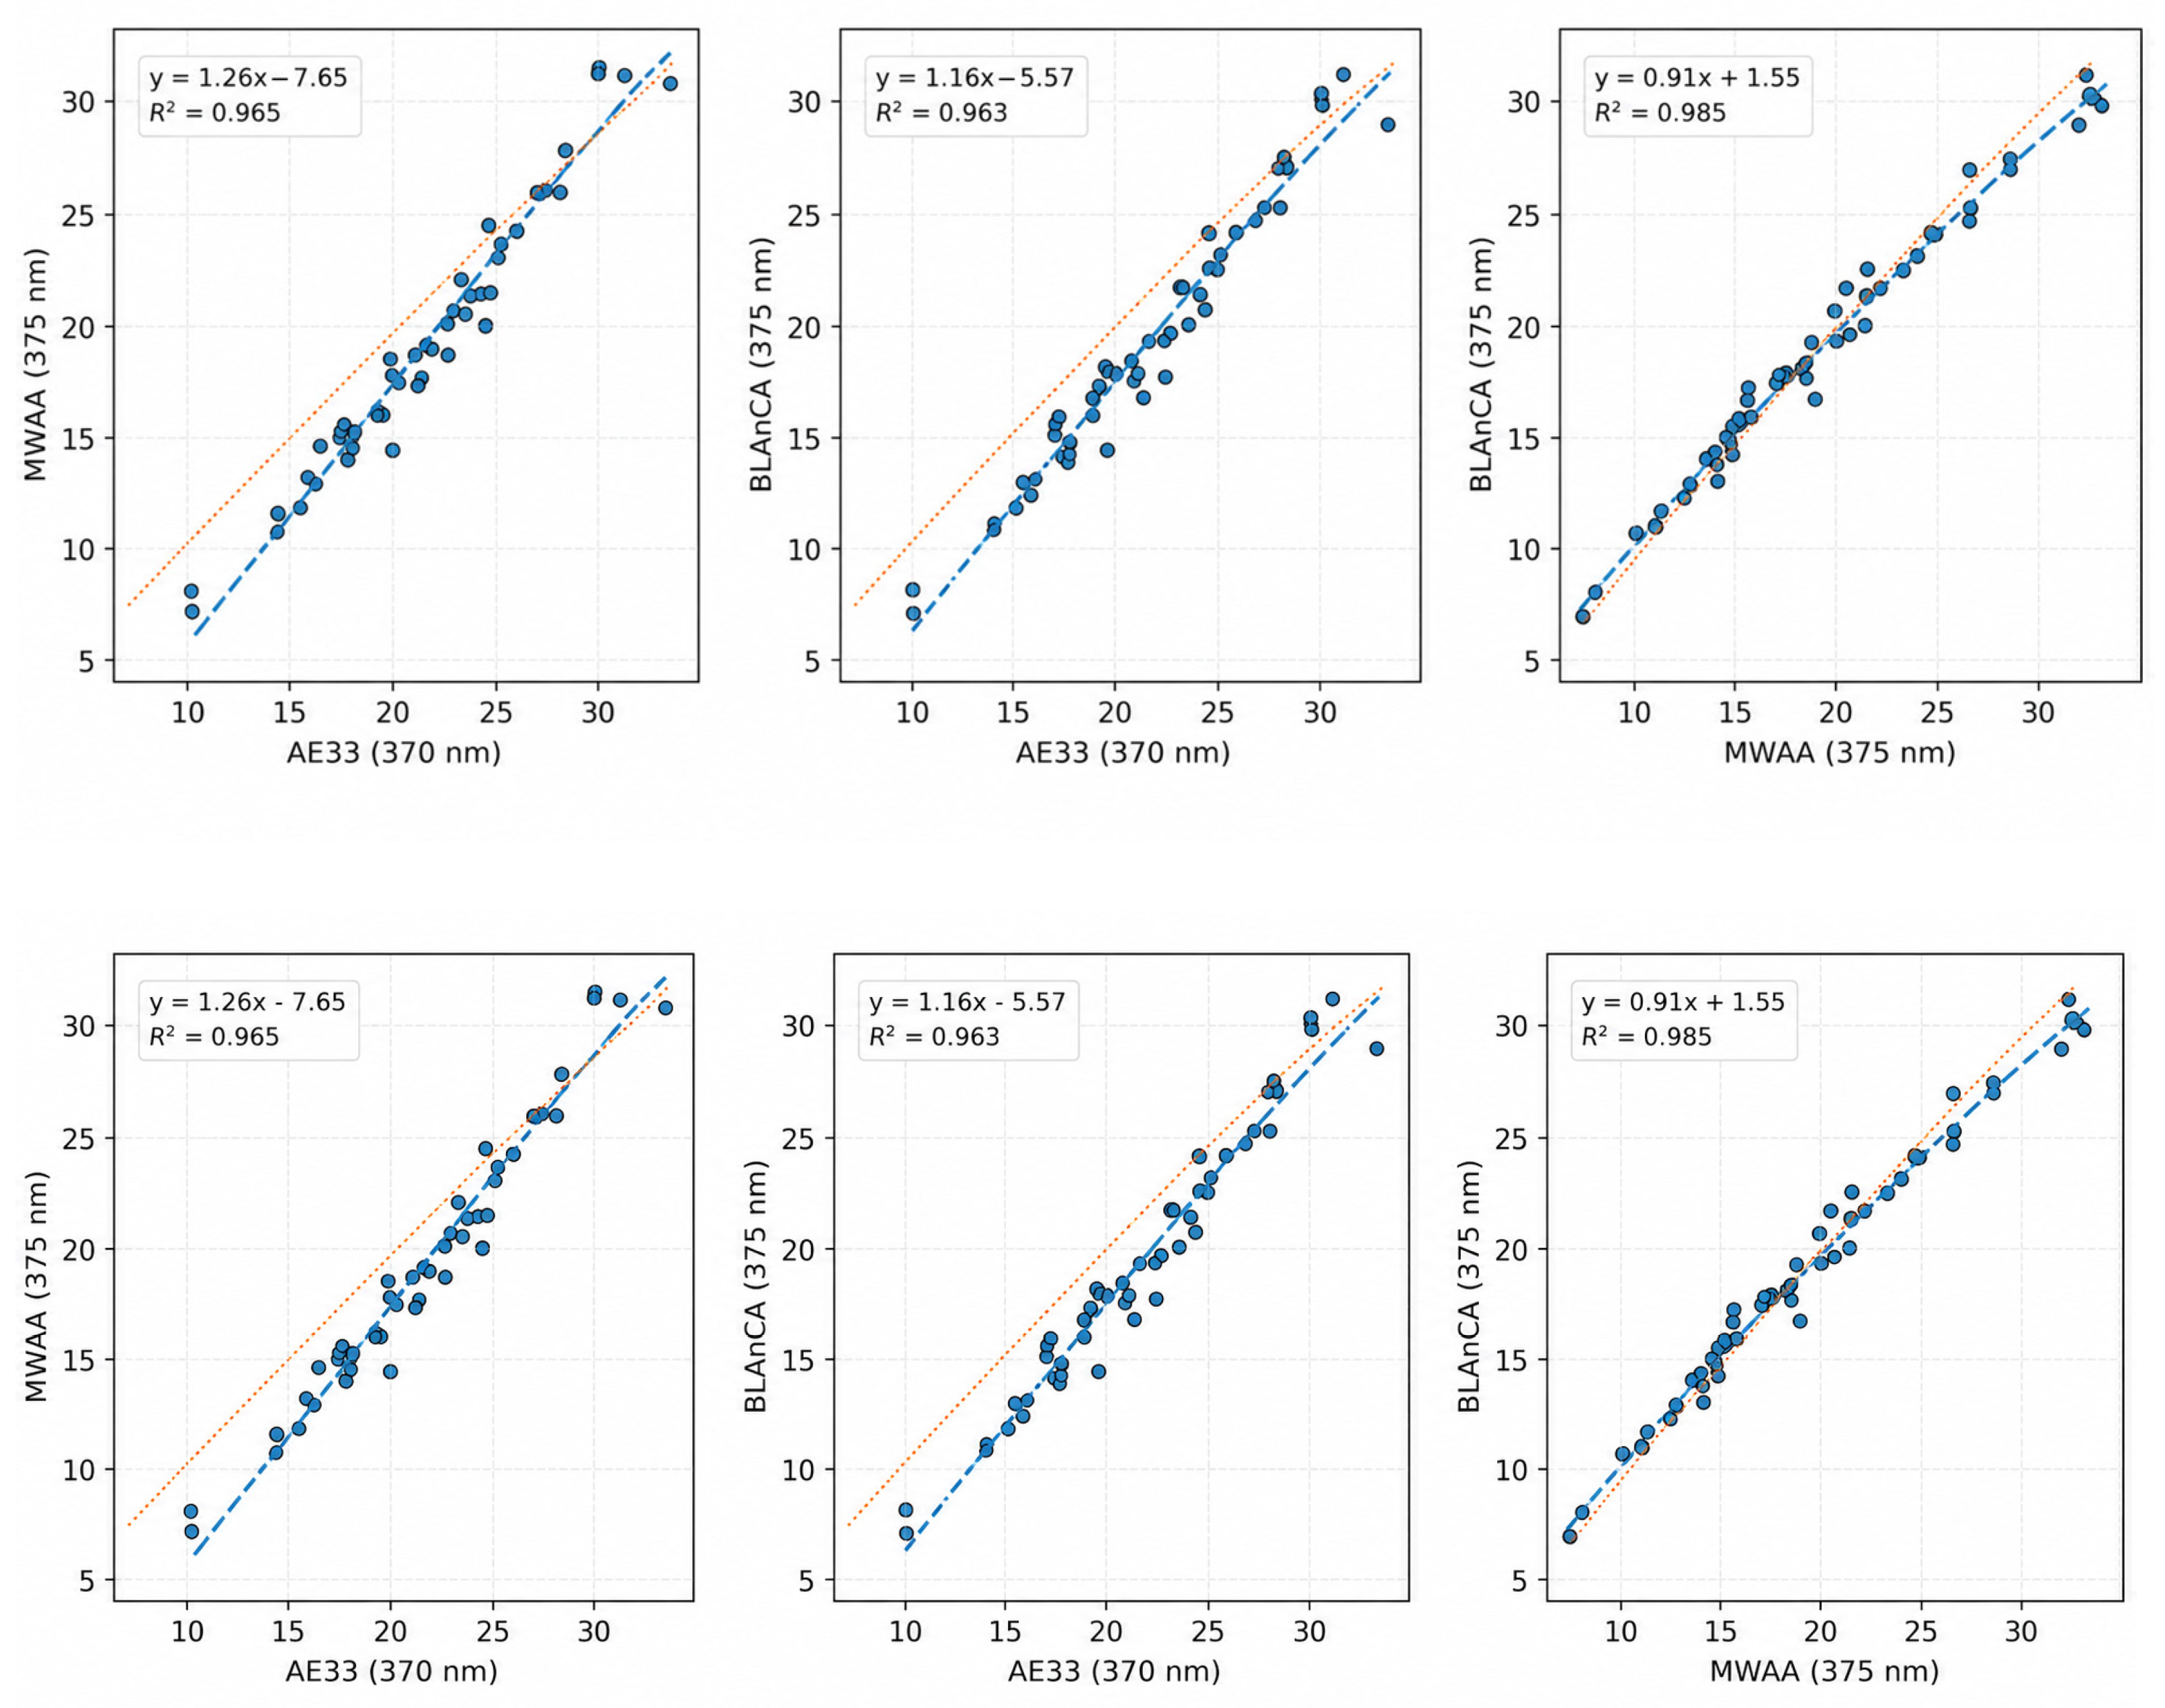
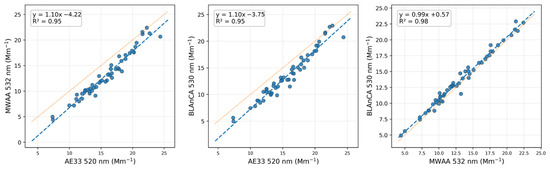
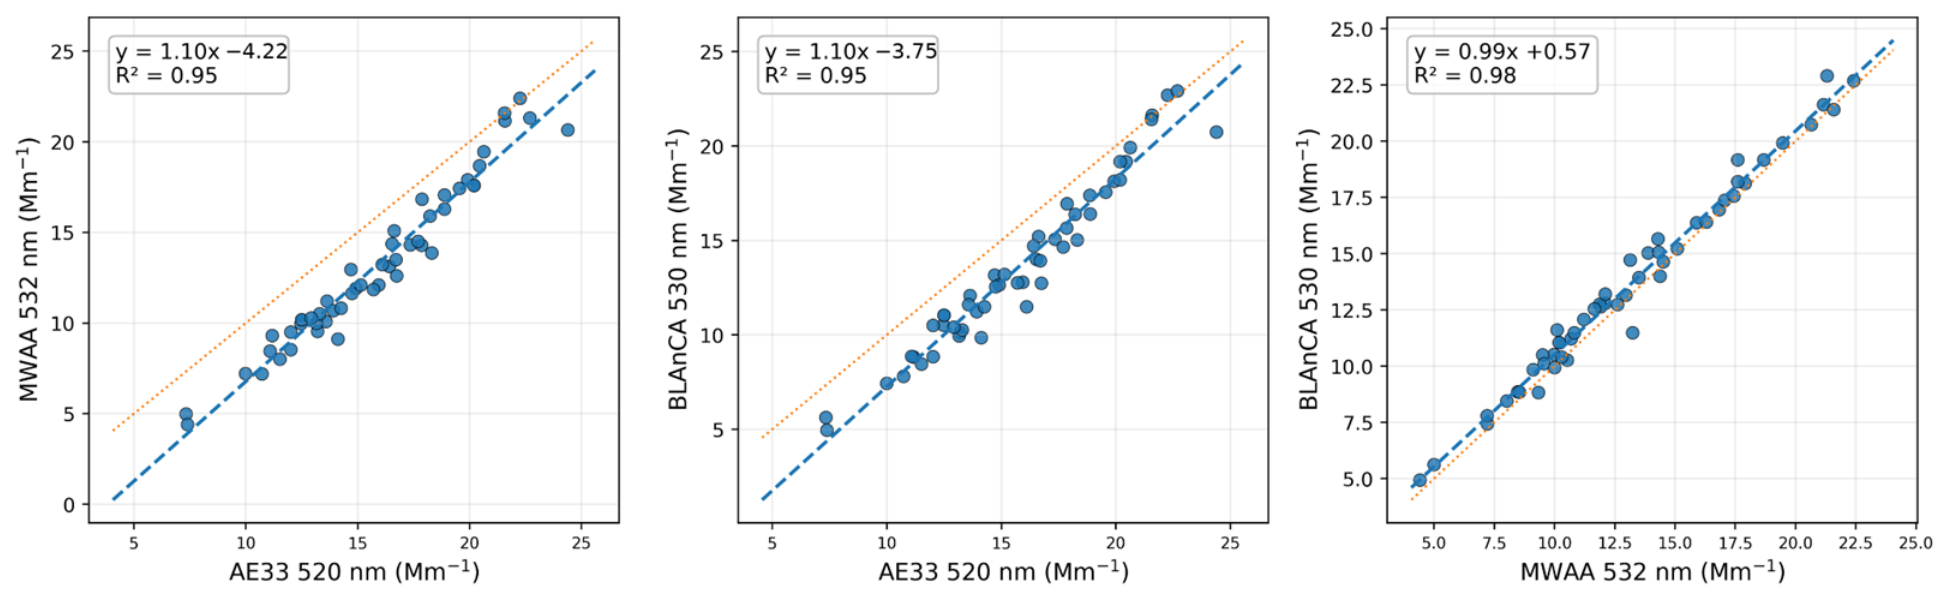
BLAnCA exhibited a high degree of consistency across the UV, visible, and near-infrared spectral regions. The strongest agreement was consistently observed between MWAA and BLAnCA, with coefficients of determination (R2) ranging from 0.98 to 0.99 (Figure 5, Figure 6 and Figure 7). The regression slopes remained close to unity (0.91–1.03), while the mean bias never exceeded 0.5 Mm−1, confirming the excellent consistency between the two independent filter-based methodologies.
Figure 5.
Absorption coefficients at UV measured by AE33, MWAA, and BLAnCA. Dashed lines represent linear regression fits and dotted lines indicate the 1:1 reference.
Figure 6.
Linear regression analyses for visible-wavelength absorption coefficients. Dotted lines represent 1:1 relationships; dashed lines represent fitted regressions.
Figure 7.
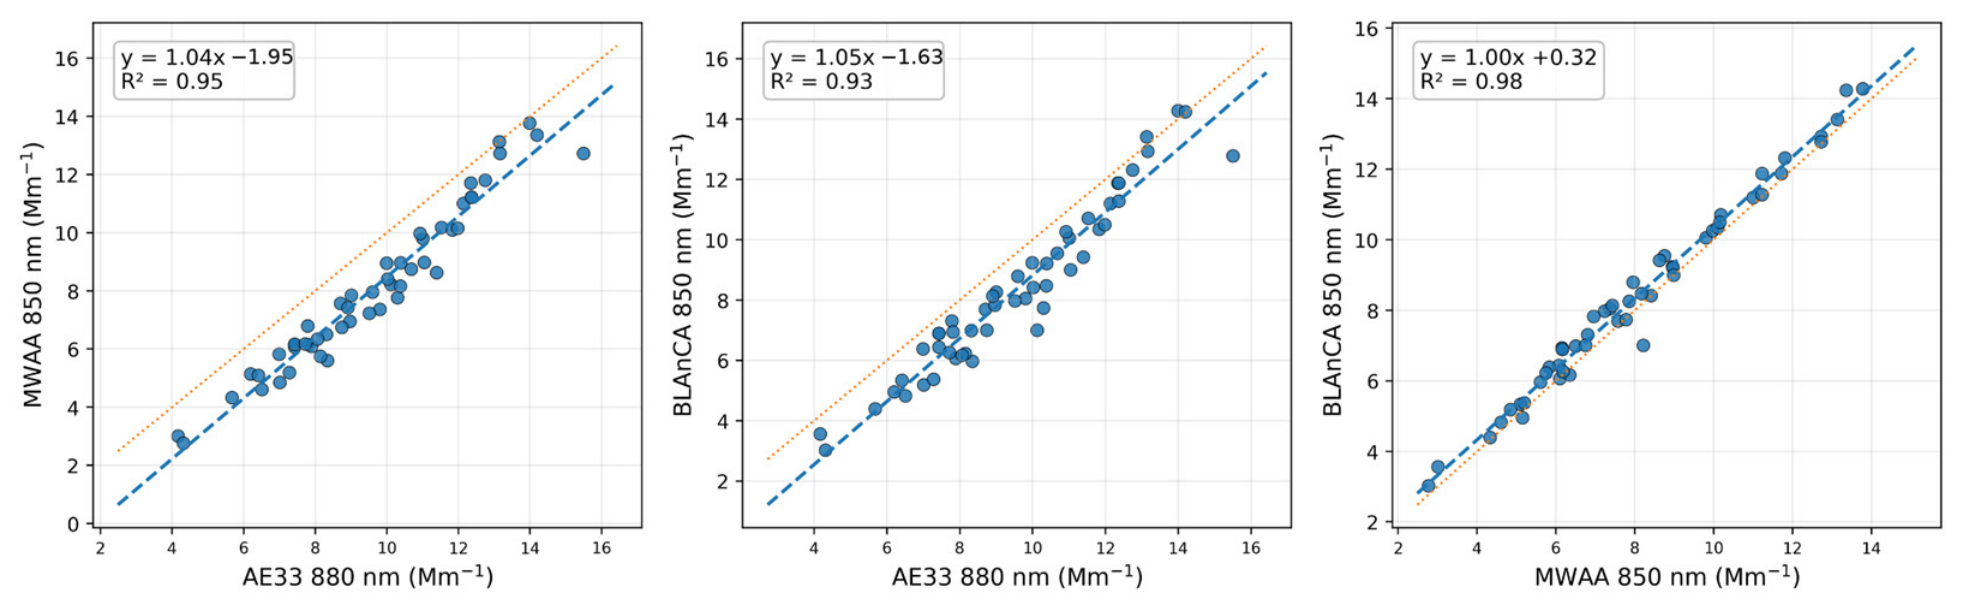
Linear regression and Pairwise scatterplots analyses for near-infrared absorption coefficients. Dotted lines represent 1:1 relationships; dashed lines represent fitted regressions.
MWAA and BLAnCA demonstrated (Figure 5) remarkable mutual agreement (R2 = 0.99) at UV wavelengths, and both instruments maintained a significant correlation with AE33 (R2 = 0.96–0.97). Similar performance was shown at visible wavelengths, where both methods maintained good correlations with AE33 (R2 ≈ 0.95) and the agreement between MWAA and BLAnCA remained remarkably high (R2 = 0.98).
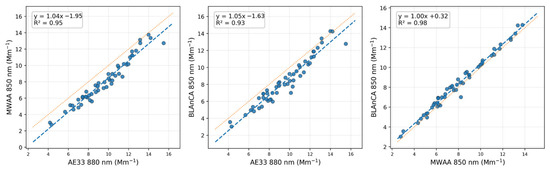
The near-infrared spectrum showed the same pattern. While AE33 maintained a strong correlation with both offline methods despite a systematic positive offset, MWAA and BLAnCA once more showed near-perfect agreement (R2 = 0.98).
Throughout the measured spectral range, AE33 consistently reported larger absorption coefficients than both MWAA and BLAnCA, despite the fact that all three instruments reproduced the temporal variability consistently. In the UV, visible, and near-infrared areas, the average absorption coefficients determined by AE33 were 21.52, 15.83, and 9.61 Mm−1, while the corresponding MWAA values were 19.22, 13.02, and 7.95 Mm−1. BLAnCA produced similar results. These variations show that AE33 absorption coefficients were around 12% higher in the UV region and 17–22% higher in the visible and near-infrared regions than those obtained by the offline approaches.
Because AE33 and MWAA operate at slightly different nominal wavelengths, the spectral-region comparisons involve nearby rather than identical wavelengths (370 vs. 375 nm, 520 vs. 532 nm, and 880 vs. 850 nm). The potential effect of these wavelength differences was evaluated using the power-law dependence of aerosol absorption. Using the campaign-average MWAA AAE of 1.10, the expected differences are approximately 1.5%, 2.6%, and 3.7% for the UV, visible, and NIR wavelength pairs, respectively. These differences are small compared with the 12–22% AE33 excess observed in the intercomparison and therefore do not affect the main conclusions, although they represent an additional source of uncertainty.
Although the AE33 provides measurements at much higher temporal resolution, the comparison was intentionally performed using 24 h AE33 averages matched to the corresponding filter-sampling periods. Short-term concentration peaks are therefore not resolved in this intercomparison, but they contribute to both the AE33 24 h average and the aerosol accumulated on the corresponding filter. Thus, temporal averaging minimizes differences specifically associated with the different time resolution of the techniques, although other instrument-specific effects may still contribute to the observed 12–22% offset. An hourly intercomparison could not be carried out because MWAA and BLAnCA provide only one integrated measurement for each 24 h filter sample.
To complement the correlation analysis, additional statistical agreement metrics were calculated for the three representative spectral regions (UV, Visible, and Near-Infrared). In addition to the coefficient of determination (R2), the Root Mean Square Error (RMSE) and Mean Absolute Error (MAE) were evaluated for each instrument pair. As summarized in Table 3, the lowest RMSE and MAE values were consistently observed for the MWAA–BLAnCA comparison, confirming the agreement between the two filter-based techniques. In contrast, comparisons involving AE33 exhibited larger errors, reflecting the systematically positive bias of the attenuation-based measurements relative to the filter-based methods, while still maintaining overall correlation.
Table 3.
Additional statistical metrics (RMSE and MAE) describing the agreement between AE33, MWAA, and BLAnCA for the three representative spectral regions used in this study.
3.3.2. Implications for the AE33 Multiple-Scattering Correction
To quantify the systematic difference between AE33 and MWAA, a wavelength-dependent harmonization parameter (H) was estimated using MWAA as the reference technique. H was defined as follows:
where babs,AE33(C0, λ) is the AE33 absorption coefficient obtained using the processing described in Section 2.2 and Section 2.3 and babs,MWAA(λ) is the corresponding MWAA absorption coefficient. Thus, H is not the simple AE33/MWAA ratio, but a harmonization parameter referenced to the default AE33 multiple-scattering correction (C0) [32].
H(λ) = C0 × babs,AE33(C0, λ)/babs,MWAA(λ)
A likely source of the observed discrepancies is the attenuation-to-absorption conversion applied in the AE33 data processing. Since the Aethalometer derives absorption coefficients from filter attenuation measurements, the retrieved absorption depends on the selected multiple-scattering correction factor (C). Consequently, an underestimated C value can lead to an overestimation of aerosol absorption. The resulting (H) values were 1.76, 1.91, and 1.90 for the UV, visible, and near-infrared regions, respectively (Table 4). All derived H values were higher than the default (C0 = 1.57). Since the attenuation-to-absorption conversion is inversely related to the multiple-scattering correction parameter, this indicates that a stronger correction would reduce the AE33-derived absorption coefficients, consistent with their systematic positive bias relative to MWAA and BLAnCA.
Table 4.
Comparison of campaign-average aerosol absorption coefficients, relative AE33 excess, and wavelength-dependent harmonization parameter (H), calculated as H(λ) = C0 × babs,AE33(C0, λ)/babs,MWAA(λ).
For AE33 absorption coefficients already obtained using C0, the equivalent multiplicative harmonization factor is:
yielding approximately 0.89, 0.82, and 0.83 in the UV, visible, and near-infrared regions, respectively.
fH(λ) = C0/H(λ)
Despite this systematic offset, AE33 reproduced the temporal variability measured by MWAA and BLAnCA well, as indicated by the high (R2) values across the spectral regions investigated. These results suggest that the default multiple-scattering correction may not fully account for the optical characteristics of the aerosol sampled at the Multedo site [32].
3.4. Spectral Dependence of Aerosol Absorption and Absorption Ångström Exponent (AAE)
The wavelength dependence of aerosol absorption was investigated using multi-wavelength measurements obtained from AE33, MWAA, and BLAnCA. For each technique, the spectral absorption coefficient was fitted using a power-law relationship, and the resulting Absorption Ångström Exponent (AAE) was used to characterize the dominant absorbing aerosol components. AAE is widely used as an indicator to distinguish black-carbon-dominated aerosols from particles exhibiting enhanced short-wavelength absorption, such as brown carbon and biomass-burning aerosols [33,34].
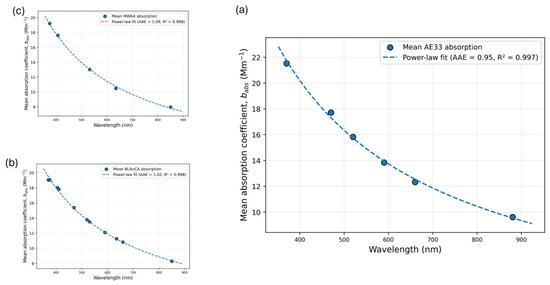
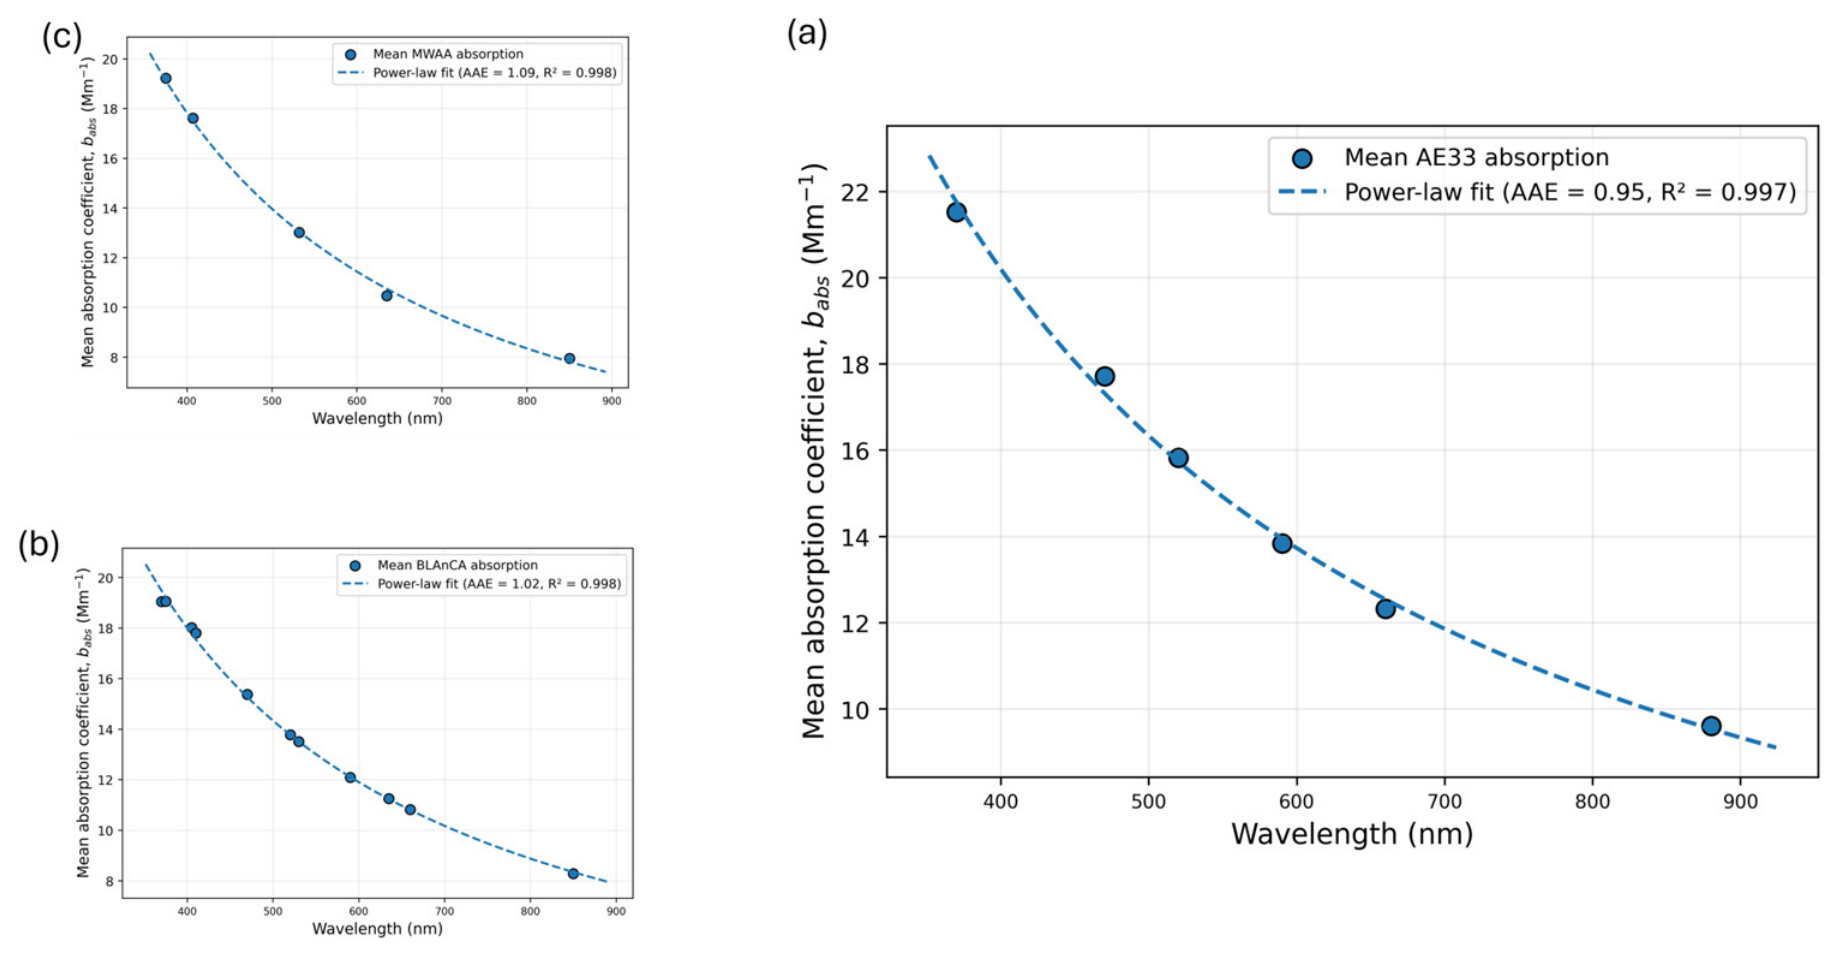
The mean absorption spectra derived from AE33, BLAnCA, and MWAA are presented in Figure 8a–c, respectively. All three instruments exhibited a consistent decrease in absorption with increasing wavelength and excellent power-law fit quality (mean R2 ≥ 0.997). Campaign-average AAE values were 0.96 ± 0.07, 1.03 ± 0.05, and 1.10 ± 0.05 for AE33, BLAnCA, and MWAA, respectively. Despite the different measurement principles and spectral ranges employed by the three techniques, the resulting AAE values remained remarkably consistent and close to unity.
Figure 8.
Mean aerosol absorption spectra and power-law fits derived from (a) AE33, (b) BLAnCA, and (c) MWAA measurements. The fitted AAE and R2 values are reported in each panel.
The corresponding AAE statistics are summarized in Table 5. The comparison of instrument-derived AAE values demonstrates strong agreement among the three techniques, with campaign-average values ranging from 0.96 to 1.10. Such values are characteristic of aerosol populations dominated by fossil-fuel combustion and black carbon, whereas substantially higher AAE values (>1.3–1.5) are commonly associated with biomass-burning emissions and brown carbon absorption. The absence of elevated AAE values, together with the monotonic spectral behaviour observed in all instruments, indicates that wavelength-dependent absorption by brown carbon was limited during the campaign.
Table 5.
Summary statistics of AAE derived from AE33, MWAA and BLAnCA.
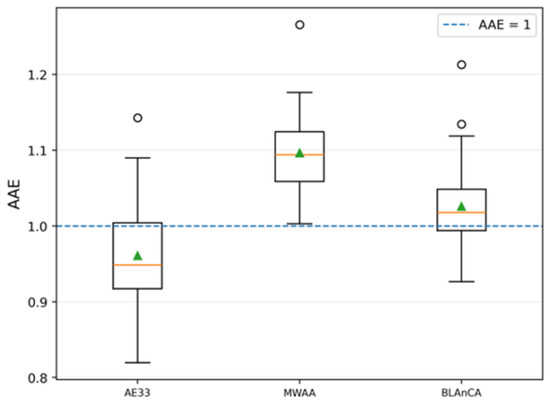
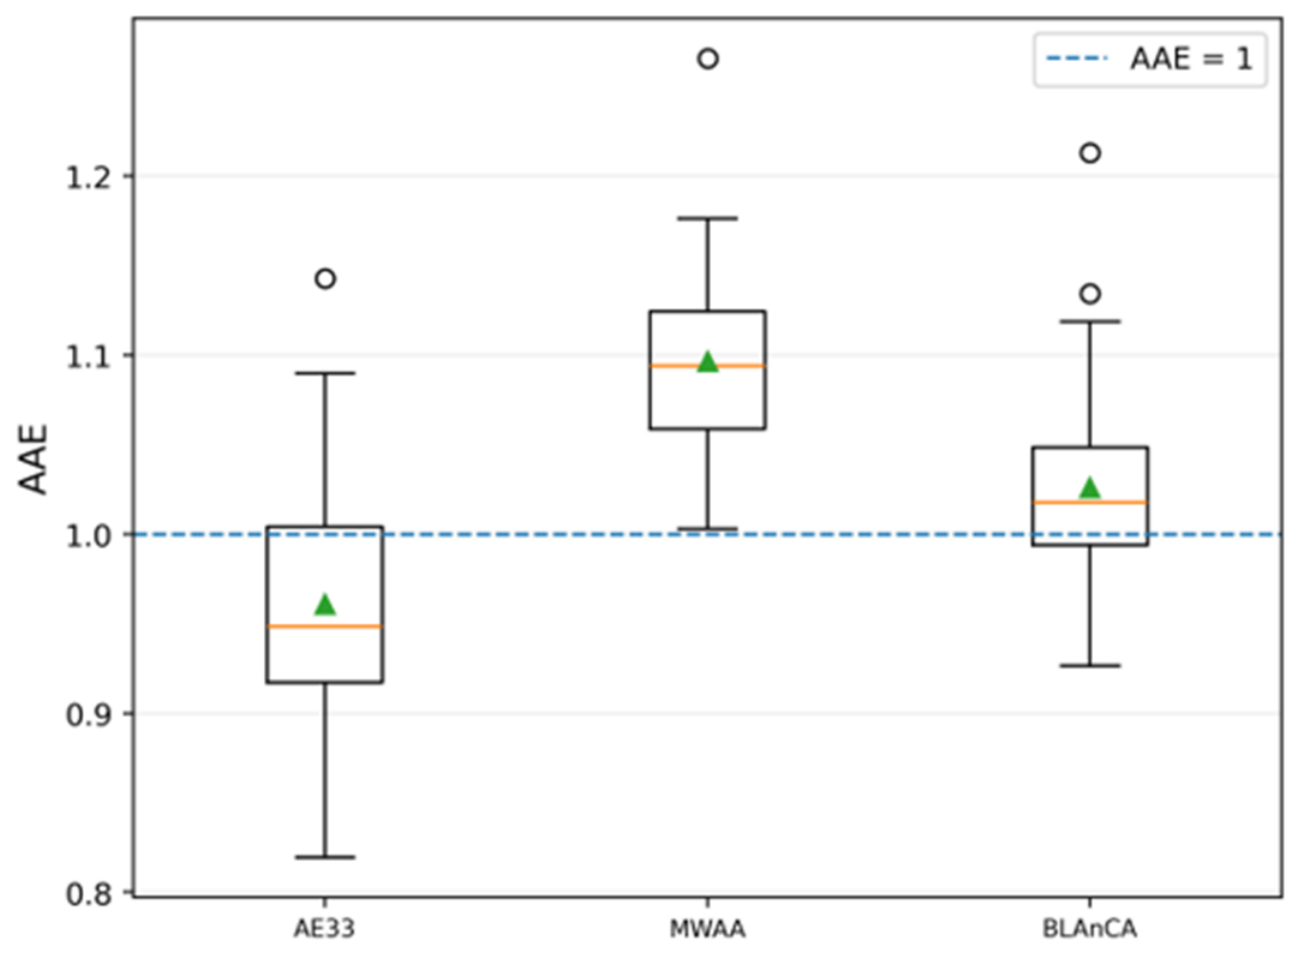
The distribution of AAE values obtained from the three techniques is compared in Figure 9. The boxplot illustrates the narrow spread of AAE values and the strong consistency among the instruments. Although MWAA yielded slightly higher AAE values than AE33 and BLAnCA, the observed differences remained small compared with the overall variability in the dataset.
Figure 9.
Boxplot comparison of AAE values derived from AE33, MWAA and BLAnCA. The dashed line represents AAE = 1.
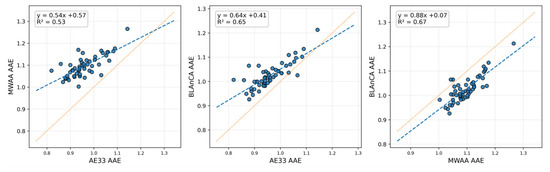
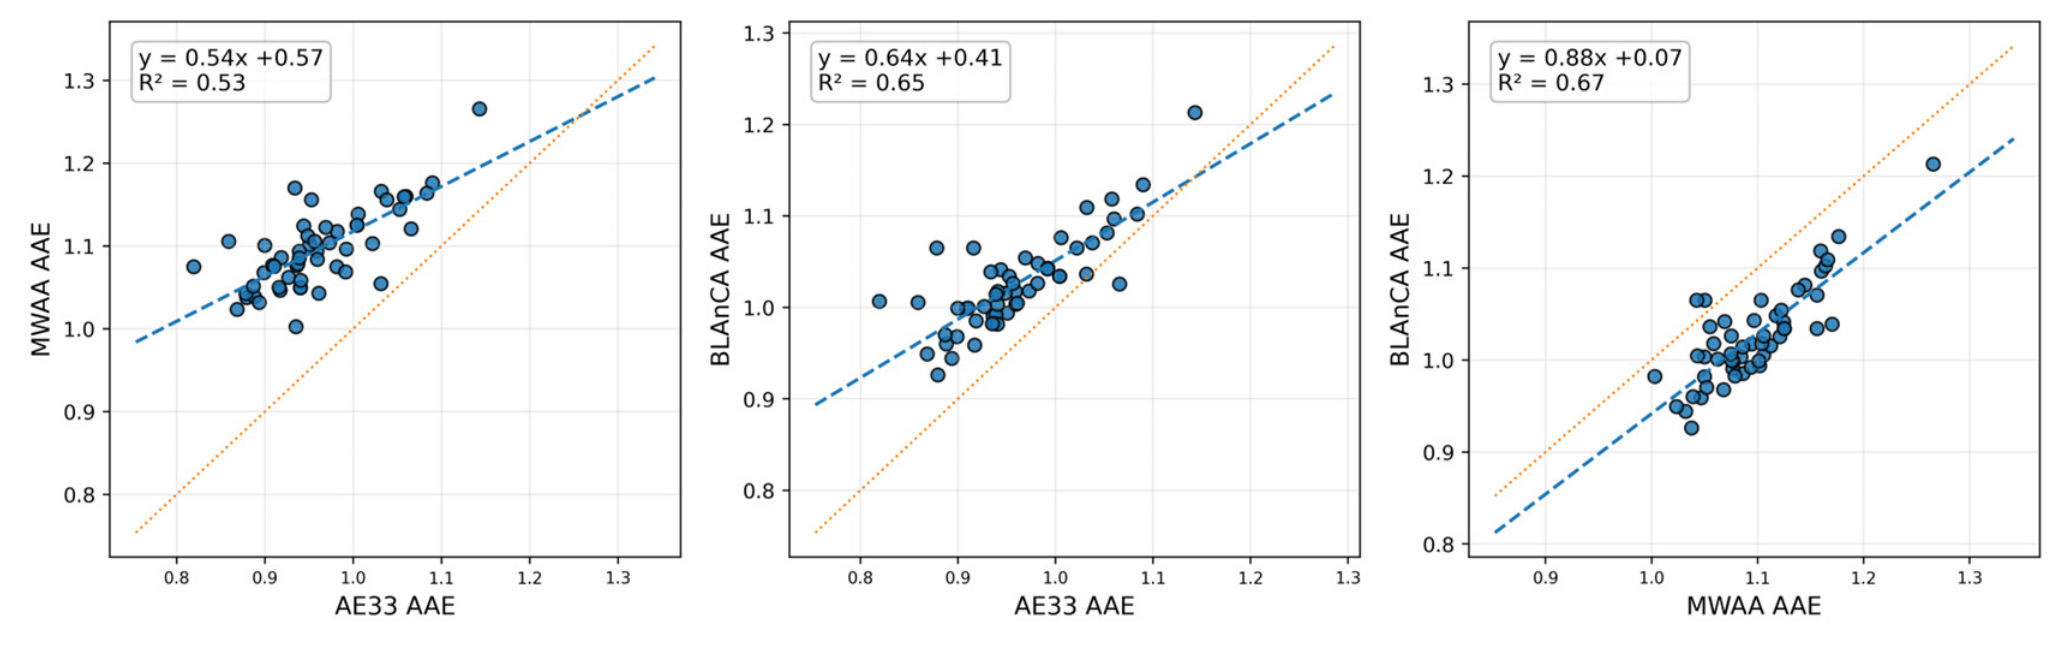
Further insight into the consistency among the techniques is provided by the pairwise AAE comparisons shown in Figure 10. Moderate-to-strong correlations were observed among all instrument pairs, with the strongest agreement obtained between MWAA and BLAnCA (R2 = 0.67). This behaviour is expected given the methodological similarity of the two offline optical techniques.
Figure 10.
Pairwise correlation plots among AE33, MWAA and BLAnCA derived AAE values. Dotted lines represent 1:1 relationships; dashed lines represent fitted regressions.
The pairwise agreement for AAE (R2 = 0.53–0.67) was weaker than that observed for the individual absorption coefficients (R2 = 0.93–0.99). This difference is expected because AAE is a derived spectral parameter obtained from the relative variation in absorption across multiple wavelengths. Therefore, small wavelength-specific measurement differences can propagate and become amplified in the fitted spectral slope, particularly when the absorption spectrum is relatively flat and the AAE values vary over a narrow range. Thus, the lower AAE correlations reflect the greater sensitivity of the spectral parameter derived to inter-instrument differences and measurement uncertainty rather than a lack of agreement in the underlying absorption measurements.
Overall, the convergence of AAE values derived from three independent measurement approaches provides strong evidence that aerosol absorption during the investigated campaign was dominated by black-carbon-containing combustion particles, with only a minor contribution from strongly wavelength-dependent brown carbon.
4. Conclusions
A comprehensive field campaign was conducted at the Multedo site (Genoa, Italy) to investigate PM2.5 concentrations and the optical properties of carbonaceous aerosols using a combination of real-time (AE33) and filter-based (MWAA and BLAnCA) optical techniques. The average PM2.5 concentration during the study period was 9.56 ± 4.33 µg m−3, with most measurements remaining below the WHO daily guideline value. Temporal variations reflected the influence of local anthropogenic emissions and the meteorological conditions encountered during the January–March 2025 campaign. Carbonaceous aerosol measurements revealed consistently higher eBC than OC concentrations, resulting in average eBC/OC ratios of approximately 1.7. Together with the weekday–weekend differences and the morning eBC peak, these results are consistent with an important contribution from fresh combustion emissions during the campaign. Road traffic, port-related activities, and the nearby Porto Petroli area represent plausible local contributors; however, their individual contributions cannot be resolved from the available dataset.
The intercomparison of aerosol absorption coefficients demonstrated excellent consistency among the three optical techniques. MWAA and BLAnCA showed near-perfect agreement across the UV, visible, and near-infrared spectral regions (R2 = 0.98–0.99), confirming the robustness of the two independent filter-based methodologies. Depending on wavelength, AE33 absorption coefficients exceeded MWAA and BLAnCA values by approximately 12–22%, with corresponding harmonization parameters (H) ranging from 1.76 to 1.91. The fact that these values were higher than the default C0 = 1.57 suggests that the standard multiple-scattering correction may not fully represent the optical characteristics of the aerosol sampled at the Multedo site.
The spectral dependence of aerosol absorption was characterized through the Absorption Ångström Exponent (AAE). Mean AAE values of 0.96 ± 0.07, 1.10 ± 0.05, and 1.03 ± 0.05 were obtained from AE33, MWAA, and BLAnCA, respectively. The close agreement among the three techniques and the consistently low AAE values indicate that, during the campaign, aerosol absorption was dominated by black-carbon-containing combustion particles, with only a limited contribution from strongly wavelength-dependent brown carbon. The present dataset covers only the January–March 2025 period and therefore does not capture the full seasonal variability in aerosol composition and optical properties at the Multedo site. Accordingly, the results should be interpreted as representative of the conditions encountered during this campaign rather than as an annual characterization of the site. Longer-term measurements covering different seasons would be required to assess the seasonal representativeness of these findings.
Overall, the results demonstrate the value of combining real-time and offline optical techniques for aerosol characterization. The excellent agreement between MWAA and BLAnCA, together with the systematic positive bias observed for AE33, highlights the importance of continued harmonization efforts and further evaluation of wavelength-dependent correction procedures for attenuation-based absorption measurements. These findings contribute to improving the comparability of aerosol absorption measurements and provide new insight into the optical properties of carbonaceous aerosols in urban coastal environments.
Author Contributions
M.I.: Conceptualization, methodology, formal analysis, data curation, visualization, interpretation of results, writing—original draft preparation, and writing—review and editing. M.C.B.: Field campaign coordination, sample collection, logistical support, and manuscript review. F.P.: methodology. M.B., E.G., F.M. and V.V.: Analytical support, scientific discussion, manuscript review, and editing. D.M. and P.P.: Supervision, project administration, scientific guidance, manuscript review, and editing. All authors have read and agreed to the published version of the manuscript.
Funding
This research has been supported by IR0000032–ITINERIS, Italian Integrated Environmental Research Infrastructures System (D.D. No. 130/2022—CUP B53C22002150006) funded by the EU (Next Generation EUPNRR, Mission 4 “Education and Research”, Component 2 “From research to business”, Investment 3.1, “Fund for the realisation of an integrated system of research and innovation infrastructures”), and Project 101131261—IRISCC (Integrated Research Infrastructure Services for Climate Change risks)—HORIZON-INFRA-2023-SERV-01.
Institutional Review Board Statement
Not applicable.
Informed Consent Statement
Not applicable.
Data Availability Statement
The data presented in this study are available from the corresponding author upon reasonable request.
Acknowledgments
The authors acknowledge the Department of Physics, University of Genoa, the National Institute for Nuclear Physics (INFN), and ARPAL Liguria for providing laboratory facilities, instrumentation, and technical support during the field campaign and subsequent analyses.
Conflicts of Interest
The authors declare no conflicts of interest.
References
- Shalini, V.; Gadag, G.; Kalburgi, P.V. Atmospheric Aerosols and their Effect on Human Health: A Review. Middle East J. Appl. Sci. Technol. 2023, 6, 1–10. [Google Scholar] [CrossRef] [Scilit]
- Peccarrisi, D.; Fragola, M.; Romano, S.; Fanigliulo, F.; Carbone, G.G.; Maruccio, L.; Contini, D.; Quarta, G.; Calcagnile, L. Characterization of atmospheric aerosol and its carbonaceous components at a central Mediterranean site: A multi-method approach using optical, physical, and isotopic techniques. Atmos. Environ. X 2025, 28, 100380. [Google Scholar] [CrossRef] [Scilit]
- Manavi, S.E.I.; Aktypis, A.; Siouti, E.; Skyllakou, K.; Myriokefalitakis, S.; Kanakidou, M.; Pandis, S.N. Atmospheric aerosol spatial variability: Impacts on air quality and climate change. One Earth 2025, 8, 101237. [Google Scholar] [CrossRef] [Scilit]
- Bellouin, N.; Quaas, J.; Gryspeerdt, E.; Kinne, S.; Stier, P.; Watson-Parris, D.; Boucher, O.; Carslaw, K.S.; Christensen, M.; Daniau, A.; et al. Bounding Global Aerosol Radiative Forcing of Climate Change. Rev. Geophys. 2020, 58, e2019RG000660. [Google Scholar] [CrossRef] [Scilit]
- Randall, D.; Boucher, O.; Artaxo, P.; Bretherton, C.; Feingold, G.; Forster, P.; Kerminen, V.M.; Kondo, Y.; Liao, H.; Lohmann, U.; et al. Clouds and Aerosols. In Climate Change 2013: The Physical Science Basis. Contribution of Working Group I to the Fifth Assessment Report of the Intergovernmental Panel on Climate Change; Cambridge University Press: Cambridge, UK, 2013. [Google Scholar]
- Lelieveld, J.; Evans, J.S.; Fnais, M.; Giannadaki, D.; Pozzer, A. The contribution of outdoor air pollution sources to premature mortality on a global scale. Nature 2015, 525, 367–371. [Google Scholar] [CrossRef] [Scilit]
- Putaud, J.P.; Van Dingenen, R.; Alastuey, A.; Bauer, H.; Birmili, W.; Cyrys, J.; Flentje, H.; Fuzzi, S.; Gehrig, R.; Hansson, H.; et al. A European aerosol phenomenology—3: Physical and chemical characteristics of particulate matter from 60 rural, urban, and kerbside sites across Europe. Atmos. Environ. 2010, 44, 1308–1320. [Google Scholar] [CrossRef] [Scilit]
- Yus-Díez, J.; Escribano, J.; Pandolfi, M.; Alastuey, A.; González-Flórez, C.; Gonzalez-Romero, A.; Ageitos, M.G.; Ivančič, M.; Klose, M.; Kandler, K.; et al. Optical Properties and Shape-Dependent Complex Refractive Index Retrievals of Freshly Emitted Saharan Dust. EGUsphere 2025, 2025, 1–32. [Google Scholar] [CrossRef] [Scilit]
- Romano, S.; Perrone, M.R.; Pavese, G.; Esposito, F.; Calvello, M. Optical properties of PM2.5 particles: Results from a monitoring campaign in southeastern Italy. Atmos. Environ. 2019, 203, 35–47. [Google Scholar] [CrossRef] [Scilit]
- Li, J.; Carlson, B.E.; Yung, Y.L.; Lv, D.; Hansen, J.; Penner, J.E.; Liao, H.; Ramaswamy, V.; Kahn, R.A.; Zhang, P.; et al. Scattering and absorbing aerosols in the climate system. Nat. Rev. Earth Environ. 2022, 3, 363–379. [Google Scholar] [CrossRef] [Scilit]
- Tian, P.; Yu, Z.; Cui, C.; Huang, J.; Kang, C.; Shi, J.; Cao, X.; Zhang, L. Atmospheric aerosol size distribution impacts radiative effects over the Himalayas via modulating aerosol single-scattering albedo. npj Clim. Atmos. Sci. 2023, 6, 54. [Google Scholar] [CrossRef]
- Moosmüller, H.; Chakrabarty, R.K.; Arnott, W.P. Aerosol light absorption and its measurement: A review. J. Quant. Spectrosc. Radiat. Transf. 2009, 110, 844–878. [Google Scholar] [CrossRef] [Scilit]
- Drinovec, L.; Močnik, G.; Zotter, P.; Prévôt, A.S.H.; Ruckstuhl, C.; Coz, E.; Rupakheti, M.; Sciare, J.; Müller, T.; Wiedensohler, A.; et al. The ‘dual-spot’ Aethalometer: An improved measurement of aerosol black carbon with real-time loading compensation. Atmos. Meas. Tech. 2015, 8, 1965–1979. [Google Scholar] [CrossRef] [Scilit]
- Rigler, M.; Drinovec, L.; Lavrič, G.; Vlachou, A.; Prévôt, A.S.H.; Jaffrezo, J.L.; Stavroulas, I.; Sciare, J.; Burger, J.; Kranjc, I.; et al. The new instrument using a TC–BC (total carbon–black carbon) method for the online measurement of carbonaceous aerosols. Atmos. Meas. Tech. 2020, 13, 4333–4351. [Google Scholar] [CrossRef] [Scilit]
- Massabò, D.; Caponi, L.; Bernardoni, V.; Bove, M.; Brotto, P.; Calzolai, G.; Cassola, F.; Chiari, M.; Fedi, M.; Fermo, P.; et al. Multi-wavelength optical determination of black and brown carbon in atmospheric aerosols. Atmos. Environ. 2015, 108, 1–12. [Google Scholar] [CrossRef] [Scilit]
- Isolabella, T.; Brunoldi, M.; Mazzei, F.; Parodi, F.; Prati, P.; Vernocchi, V.; Bernardoni, V.; Valli, G.; Vecchi, R.; Formenti, P.; et al. The broadband light analyzer of complex aerosol: Characterization and first applications. Atmos. Environ. 2025, 358, 121341. [Google Scholar] [CrossRef] [Scilit]
- Coen, M.C.; Weingartner, E.; Apituley, A.; Ceburnis, D.; Fierz-Schmidhauser, R.; Flentje, H.; Henzing, J.S.; Jennings, S.G.; Moerman, M.; Petzold, A.; et al. Minimizing light absorption measurement artifacts of the Aethalometer: Evaluation of five correction algorithms. Atmos. Meas. Tech. 2010, 3, 457–474. [Google Scholar] [CrossRef] [Scilit]
- Massabò, D.; Bernardoni, V.; Bove, M.; Brunengo, A.; Cuccia, E.; Piazzalunga, A.; Prati, P.; Valli, G.; Vecchi, R. A multi-wavelength optical set-up for the characterization of carbonaceous particulate matter. J. Aerosol Sci. 2013, 60, 34–46. [Google Scholar] [CrossRef] [Scilit]
- Marenco, F.; Mazzei, F.; Prati, P.; Gatti, M. Aerosol advection and sea salt events in Genoa, Italy, during the second half of 2005. Sci. Total Environ. 2007, 377, 396–406. [Google Scholar] [CrossRef] [Scilit]
- EN 12341:2014; Ambient Air—Standard Gravimetric Measurement Method for the Determination of the PM10 or PM2.5 Mass Concentration of Suspended Particulate Matter. European Committee for Standardization: Brussels, Belgium, 2014.
- Ministero dell’Ambiente e della Tutela del Territorio e del Mare. Italian Quality Assurance Procedure; Ministero dell’Ambiente e della Tutela del Territorio e del Mare: Rome, Italy, 2017. [Google Scholar]
- Bernardoni, V.; Pileci, R.E.; Caponi, L.; Massabò, D. The multi-wavelength absorption analyzer (MWAA) model as a tool for source and component apportionment based on aerosol absorption properties: Application to samples collected in different environments. Atmosphere 2017, 8, 218. [Google Scholar] [CrossRef] [Scilit]
- World Health Organization. WHO Global Air Quality Guidelines: Particulate Matter (PM2. 5 and PM10), Ozone, Nitrogen Dioxide, Sulfur Dioxide and Carbon Monoxide; World Health Organization: Geneva, Switzerland, 2021.
- European Parliament; Council of the European Union. Directive (EU) 2024/2881 on ambient air quality and cleaner air for Europe. Off. J. Eur. Union 2024, L2881, 1–70. Available online: https://eur-lex.europa.eu (accessed on 10 June 2026).
- Ariola, V.; D’alessandro, A.; Lucarelli, F.; Marcazzan, G.; Mazzei, F.; Nava, S.; Zucchiatti, A. Elemental characterization of PM10, PM2. 5 and PM1 in the town of Genoa (Italy). Chemosphere 2006, 62, 226–232. [Google Scholar] [CrossRef] [Scilit]
- Mazzei, F.; D’alessandro, A.; Lucarelli, F.; Nava, S.; Prati, P.; Valli, G.; Vecchi, R. Characterization of particulate matter sources in an urban environment. Sci. Total Environ. 2008, 401, 81–89. [Google Scholar] [CrossRef] [Scilit]
- Lack, D.A.; Corbett, J.J. Black carbon from ships: A review of the effects of ship speed, fuel quality and exhaust gas scrubbing. Atmos. Chem. Phys. 2012, 12, 3985–4000. [Google Scholar] [CrossRef] [Scilit]
- Sandradewi, J.; Prévôt, A.S.H.; Szidat, S.; Perron, N.; Alfarra, M.R.; Lanz, V.A.; Weingartner, E.; Baltensperger, U. Using aerosol light abosrption measurements for the quantitative determination of wood burning and traffic emission contribution to particulate matter. Environ. Sci. Technol. 2008, 42, 3316–3323. [Google Scholar] [CrossRef] [Scilit]
- Danelli, S.G.; Caponi, L.; Brunoldi, M.; De Camillis, M.; Massabò, D.; Mazzei, F.; Isolabella, T.; Pascarella, A.; Prati, P.; Santostefano, M.; et al. Measurement report: Investigation of optical properties of carbonaceous aerosols from the combustion of different fuels by an atmospheric simulation chamber. Atmos. Chem. Phys. 2025, 25, 9387–9401. [Google Scholar] [CrossRef] [Scilit]
- Bond, T.C.; Doherty, S.J.; Fahey, D.W.; Forster, P.M.; Berntsen, T.; DeAngelo, B.J.; Flanner, M.G.; Ghan, S.; Kärcher, B.; Koch, D.; et al. Bounding the role of black carbon in the climate system: A scientific assessment. J. Geophys. Res. Atmos. 2013, 118, 5380–5552. [Google Scholar] [CrossRef] [Scilit]
- Hallquist, M.; Wenger, J.C.; Baltensperger, U.; Rudich, Y.; Simpson, D.; Claeys, M.; Dommen, J.; Donahue, N.M.; George, C.; Goldstein, A.H.; et al. The formation, properties and impact of secondary organic aerosol: Current and emerging issues. Atmos. Chem. Phys. 2009, 9, 5155–5236. [Google Scholar] [CrossRef] [Scilit]
- Bernardoni, V.; Ferrero, L.; Bolzacchini, E.; Forello, A.C.; Gregorič, A.; Massabò, D.; Močnik, G.; Prati, P.; Rigler, M.; Santagostini, L.; et al. Determination of Aethalometer multiple-scattering enhancement parameters and impact on source apportionment during the winter 2017/18 EMEP/ACTRIS/COLOSSAL campaign in Milan. Atmos. Meas. Tech. 2021, 14, 2919–2940. [Google Scholar] [CrossRef] [Scilit]
- Lack, D.A.; Langridge, J.M. On the attribution of black and brown carbon light absorption using the Ångström exponent. Atmos. Chem. Phys. 2013, 13, 10535–10543. [Google Scholar] [CrossRef] [Scilit]
- Kirchstetter, T.W.; Novakov, T.; Hobbs, P.V. Evidence that the spectral dependence of light absorption by aerosols is affected by organic carbon. J. Geophys. Res. D Atmos. 2004, 109, D21208. [Google Scholar] [CrossRef] [Scilit]

Disclaimer/Publisher’s Note: The statements, opinions and data contained in all publications are solely those of the individual author(s) and contributor(s) and not of MDPI and/or the editor(s). MDPI and/or the editor(s) disclaim responsibility for any injury to people or property resulting from any ideas, methods, instructions or products referred to in the content. |
© 2026 by the authors. Licensee MDPI, Basel, Switzerland. This article is an open access article distributed under the terms and conditions of the Creative Commons Attribution (CC BY) license.