


Abstract
Understanding the physical mechanisms of compound hot-drought events (CHDEs) over the Yangtze River Basin (YRB) is essential for improving climate predictability. Using high-resolution observations and ERA5 reanalysis, this study conducted a three-dimensional comparative diagnosis of two spatially distinct CHDEs (August 2022 and 2019), deconstructing their circulation dynamics and thermodynamic budgets. Specifically, the 2022 basin-wide event was highly associated with La Niña and a negative Indian Ocean Dipole (NIOD). Anomalous latent heating in the tropical eastern Indian Ocean favored an extensive meridional Hadley circulation and a deep high-pressure belt, blocking southwest moisture transport. Thermodynamically, intense downward vertical motions produced severe descending adiabatic warming, which offset longwave radiational cooling and sustained anomalous heat accumulation throughout the deep troposphere. Conversely, the 2019 localized event occurred under a weak Central Pacific El Niño and a positive IOD. The anomalous tropical cooling weakened systematic subsidence and provided a favorable background for a Rossby wave train, featuring an offshore cyclone over the Western North Pacific that severed moisture pathways. Characterized by shallower vertical subsidence, the lack of a penetrative adiabatic heat source merely maintained a lower-level thermodynamic balance, confining extreme heat to the central–eastern YRB. Although superficially similar at the surface, these CHDEs are sustained by two distinct ocean–atmosphere interaction paradigms. Clarifying these dual paradigms provides a critical physical basis for improving sub-seasonal prediction.
1. Introduction
In the context of global warming, the frequency and intensity of extreme climate events have significantly increased [1]. The concurrent occurrence of extreme heat and persistent drought within the same spatiotemporal domain constitutes Compound Hot-Drought Events (CHDEs). Recent advances in event attribution studies emphasize that anthropogenically forced thermodynamic changes, superimposed on natural internal variability, have substantially amplified the probability of such compound extremes [2,3]. Compared to individual climate hazards, CHDEs exert more severe impacts on agricultural production, water resource security, and ecosystems [4,5]. The Yangtze River Basin (YRB) in China, located in the typical East Asian subtropical monsoon region with a dense population and concentrated industry and agriculture, has experienced multiple severe CHDEs during summer-to-autumn seasons in recent years [6,7,8,9,10]. Therefore, quantitatively characterizing the physical causes of typical cases during this specific period and elucidating the underlying atmospheric dynamical mechanisms is of significant value for improving the sub-seasonal predictability of such extremes in this region.
Large-scale atmospheric circulation anomalies serve as the direct dynamical basis for the formation and maintenance of CHDEs over the YRB [11,12]. Previous studies indicate that the adjustment and mutual coupling of the mid-to-upper tropospheric Western Pacific Subtropical High (WPSH) and the South Asian High (SAH) are critical causes initiating summer-to-autumn extreme anomalies in this region [13,14,15]. Within the classical theoretical framework, when these high-pressure systems form a deep superposition and maintain persistent control, the adiabatic compression warming associated with descending airflows is considered the core mechanism sustaining regional extreme heat [16]. Furthermore, the recent literature highlights the critical role of land–atmosphere coupling in exacerbating these extremes. Specifically, prolonged precipitation deficits deplete soil moisture, which in turn limits latent heat cooling and amplifies sensible heat flux, creating a soil moisture–temperature positive feedback that locally intensifies the heatwave [17,18]. However, recent CHDEs exhibit remarkable spatial heterogeneity in their centres and intensity distributions [18,19], suggesting that single high-pressure system control and subsidence adiabatic warming cannot fully account for their actual thermodynamic evolution. Consequently, it is necessary to deconstruct the relative contributions of large-scale dynamical and thermodynamic processes by quantitatively diagnosing the blockage of specific moisture transport pathways by three-dimensional wind anomalies, and evaluating the advection and diabatic heating terms based on the thermodynamic energy equation.
The evolution of the aforementioned large-scale three-dimensional anomalous circulations is modulated by the teleconnection forcings of tropical sea surface temperature (SST) anomalies. The polarity and spatial structure of the El Niño-Southern Oscillation (ENSO) determine the primary moisture transport pathways of the East Asian summer monsoon [20,21]. Concurrently, the phase evolution of tropical Indian Ocean SST (e.g., the Indian Ocean Dipole, IOD) acts as a critical thermal boundary condition modulating regional circulations [22,23]. Previous studies have demonstrated that SST anomalies in the Pacific or Indian Oceans, as well as their synergistic effects under specific phases, can alter local tropical convective heating distributions, thereby inducing atmospheric teleconnection responses along distinct pathways. These remote wave trains associated with oceanic thermal forcings can systematically reshape the configuration of high- and low-pressure systems and peripheral circulation structures over East Asia [24,25,26,27]. Therefore, identifying the combined forcing background of the Pacific and Indian Oceans under different spatiotemporal polarities is an essential physical prerequisite for explaining the anomalous atmospheric dynamical variability of CHDEs in the same region.
In August 2019 and August 2022, the YRB successively experienced two significant CHDEs. Recent studies have investigated the mechanisms of these events, but most have been limited to case studies of single disaster years. For instance, research on the 2019 event primarily focused on the anomalous circulation causes under the synergistic forcing of the IOD and Central Pacific El Niño [8,9]. Conversely, studies on the 2022 event widely concentrated on atmospheric forcings and local feedback mechanisms against the background of a prolonged La Niña [16,19]. However, simply attributing these events to isolated annual forcings obscures a fundamental scientific question. Therefore, this study tests the hypothesis that seemingly identical regional CHDEs can be governed by fundamentally distinct, independent ocean–atmosphere pathways. The new scientific knowledge generated from this comparison lies in quantitatively demonstrating how contrasting oceanic forcings translate into divergent three-dimensional thermodynamic balances (e.g., deep adiabatic warming versus advection–radiation balance), rather than assuming a uniform maintenance mechanism for all summer extremes. In fact, the external oceanic boundary forcings in 2019 and 2022 exhibited nearly opposite physical states. Under such contrasting SST backgrounds, it remains to be analyzed how atmospheric circulations, through different flow configurations, modulated CHDEs in the same region, and whether fundamental differences exist in the atmospheric thermodynamic budget processes sustaining the local extreme temperature anomalies.
Consequently, utilizing high-resolution surface observations and ERA5 reanalysis data, this study selects the August 2019 and August 2022 events for a comprehensive comparative analysis. By bridging large-scale atmospheric dynamics, local quantitative thermodynamic budgets, and external oceanic boundary forcings, this study aims to reveal the diverse formation mechanisms of seemingly similar CHDEs in the YRB driven by contrasting SST backgrounds. Ultimately, these findings are expected to provide a solid scientific basis for improving the sub-seasonal prediction of regional climate extremes.
The remainder of this paper is organized as follows. Section 2 describes the data and methodology, including the physical definitions of the thermodynamic budget. Section 3 presents the comparative results of the surface climate anomalies, large-scale atmospheric circulations, and thermodynamic structures, while tracing the distinct ocean SST forcing backgrounds. Further discussion, including the role of land–atmosphere coupling and methodological limitations, is provided in Section 4. Finally, concluding remarks are summarized in Section 5.
2. Materials and Methods
2.1. Materials
The atmospheric circulation and meteorological variables used in this study were obtained from the fifth-generation global climate reanalysis dataset (ERA5) produced by the European Centre for Medium-Range Weather Forecasts (ECMWF) [28,29]. To meet the computational requirements for the three-dimensional dynamical structure and thermodynamic budget, the extracted variables included geopotential height (), horizontal wind components (), vertical velocity (), air temperature (), and specific humidity (), covering 27 pressure levels from 1000 hPa to 100 hPa. The spatial resolution is , and monthly mean fields were primarily employed. Additionally, sea surface temperature (SST) was derived from ERA5. Outgoing longwave radiation (OLR) was calculated from the top net thermal radiation () through sign reversal and time integration, converted to a standardized unit of .
High-resolution surface temperature and precipitation were represented using the China high-resolution multi-variable meteorological forcing dataset (ChinaMet). This dataset integrates multi-source remote sensing and observations from over 2000 stations in China [30,31]. The monthly mean daily maximum temperature () and monthly accumulated precipitation data, with a spatial resolution of , were utilized to precisely delineate the spatial extent of the CHDEs.
The study period focuses on the core outbreaks of CHDEs (August 2019 and August 2022). All anomalies and precipitation anomaly percentages were calculated relative to the 1991–2020 climatological baseline.
2.2. Diagnostic Methods
2.2.1. Vertically Integrated Moisture Flux
To evaluate the moisture source/sink and transport characteristics over the YRB during the extreme events, the vertically integrated moisture flux (VIMF) [32] was calculated:
where is the acceleration due to gravity, is the surface pressure, is the upper limit (100 hPa), is the specific humidity, and is the horizontal wind vector. The integrated flux consists of zonal () and meridional () components, with units of .
2.2.2. Thermodynamic Energy Equation
To quantitatively separate and compare the contributions of dynamical motions and advective transport to local temperature anomalies, the thermodynamic energy equation [18] in isobaric coordinates was employed:
where the term on the left-hand side () represents the local temperature tendency. For persistent climate anomalies at monthly or longer timescales, the atmosphere is in a quasi-stationary state. Based on standard dynamic scale analysis, the typical magnitude of the tendency term is one to two orders of magnitude smaller than the primary forcing terms on the right-hand side [18,33]. Consequently, it is mathematically and physically justified to approximate this term as zero (), allowing the diabatic heating to be evaluated strictly as a balancing residual.
Under this assumption, the maintenance of anomalous temperature is primarily achieved through a physical balance among three forced terms:
- (a)
- The horizontal temperature advection term (), characterizing the transport of cold and warm air masses by the horizontal circulation, where is the horizontal wind vector and is the gradient operator on the isobaric surface.
- (b)
- The vertical adiabatic term [], quantifying the adiabatic heating or cooling effects induced by large-scale vertical motion (), where is the gas constant for dry air and is the specific heat at constant pressure.
- (c)
- The diabatic heating term (), representing the contribution of the apparent heat source (), which encompasses radiative processes, latent heat release, and surface heat fluxes [19,34]. In this study, following standard diagnostic procedures [19], this term is evaluated as the balancing residual of the thermodynamic equation (with inherent data uncertainties rigorously acknowledged in Section 4.3), representing the maintenance of temperature anomalies by diabatic processes beyond dynamical advection and adiabatic effects.
3. Results
3.1. Comparison of Surface Climate Anomalies During the Two Compound Hot-Drought Events
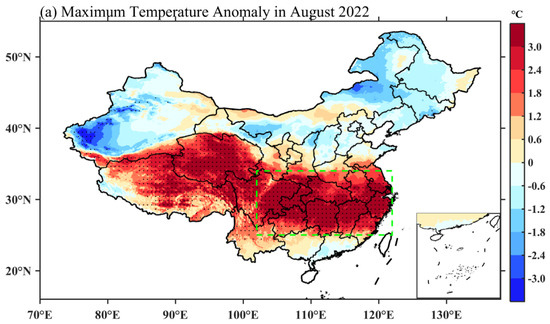
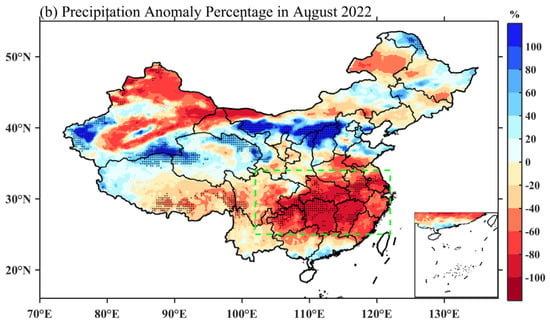
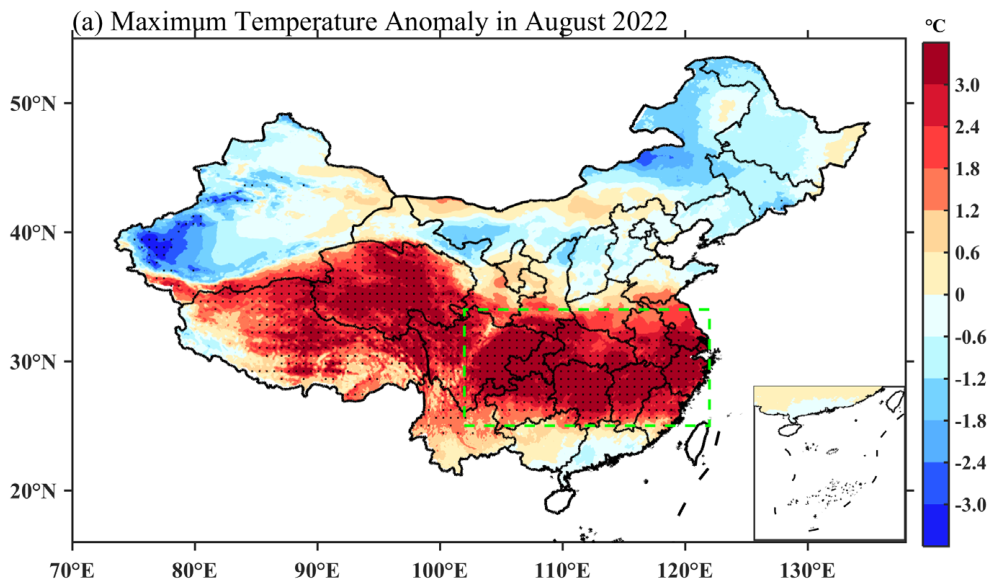
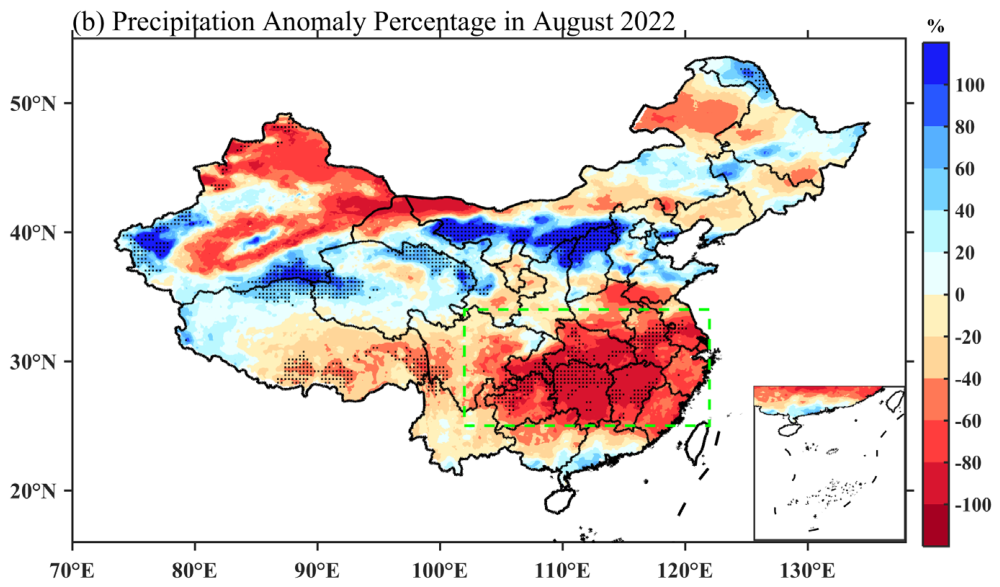
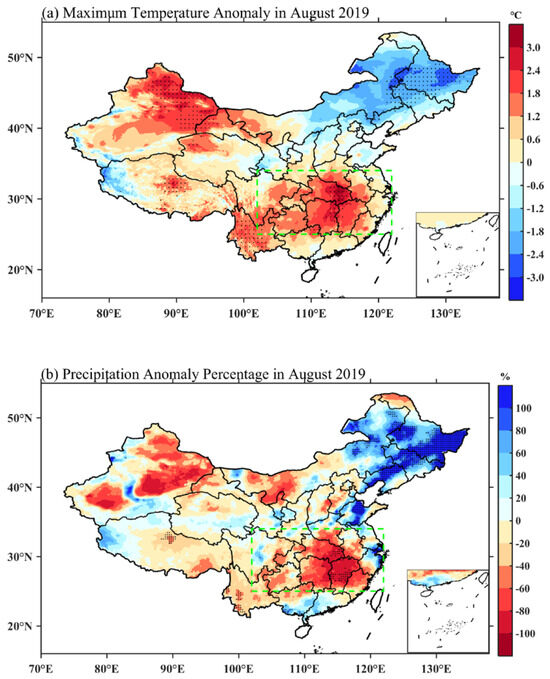
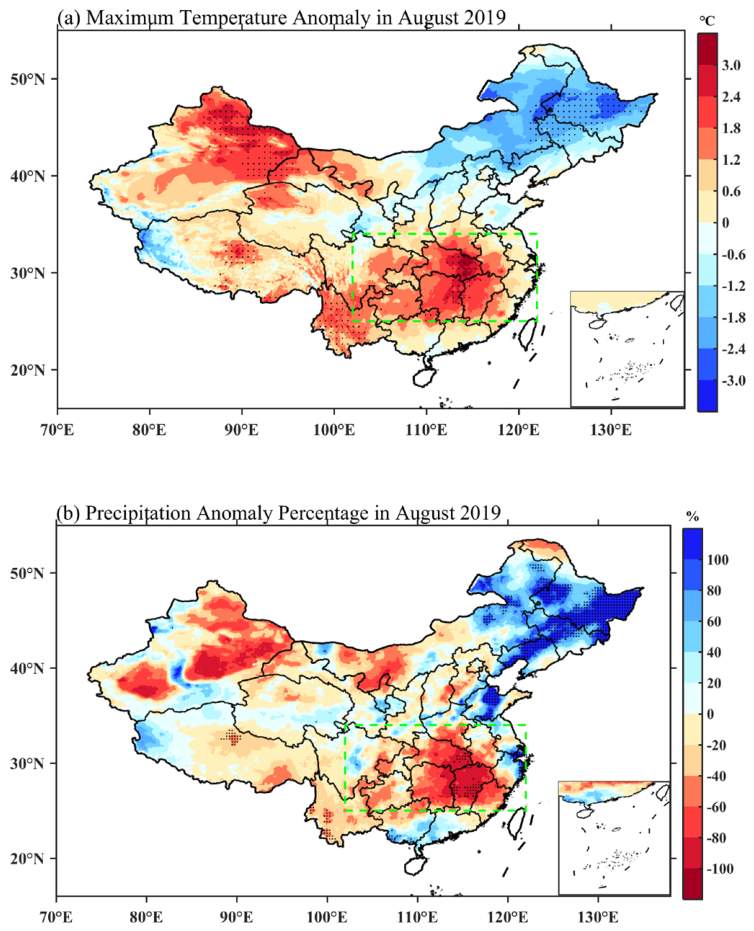
Figure 1 and Figure 2 present the spatial distributions of daily maximum temperature (Tmax) anomalies and precipitation anomaly percentages over China for August 2022 and August 2019, respectively. Comparison reveals that although both events exhibited compound characteristics of extreme heat coupled with precipitation deficits over the YRB (indicated by green boxes in Figure 1 and Figure 2), they displayed substantial differences in their spatial extents and anomaly locations. Quantitatively, while both events featured severe mean anomaly intensities, they fundamentally differed in their affected areas and the percentage of the basin impacted.
Figure 1.
Spatial distributions of (a) monthly mean daily maximum temperature anomaly (Tmax; shaded; °C) and (b) precipitation anomaly percentage (shaded; %) for August 2022. The green dashed rectangle denotes the core region of the Yangtze River Basin (YRB; 25° N–34° N, 102° E–122° E; the same applies hereinafter). Black stippling indicates regions passing the 90% confidence level based on a Student’s t-test evaluated against the interannual standard deviation of the 1991–2020 climatology.
Figure 2.
Spatial distributions of (a) monthly mean daily maximum temperature anomaly (Tmax; shaded; °C) and (b) precipitation anomaly percentage (shaded; %) for August 2019. The green dashed rectangle denotes the core region of the Yangtze River Basin (YRB; 25° N–34° N, 102° E–122° E; the same applies hereinafter). Black stippling indicates regions passing the 90% confidence level based on a Student’s t-test evaluated against the interannual standard deviation of the 1991–2020 climatology.
In August 2022, the compound hot-drought event over the YRB exhibited a basin-wide distribution pattern, impacting nearly 100% of the entire basin. As shown in Figure 1a, positive Tmax anomalies generally exceeded 3.0 °C extending from the Sichuan Basin in the western YRB to most central and eastern regions. Regarding precipitation (Figure 1b), widespread negative anomalies occurred across the entire basin, with precipitation deficits ranging from 80% to 100% relative to the climatological mean in most areas. The spatial overlap of extreme heat centres and severe precipitation deficit zones indicates that this compound event systematically covered the entire YRB.
In contrast, the August 2019 hot-drought event was characterized by a localized pattern over the middle and lower reaches of the YRB. As illustrated in Figure 2a, the heat anomaly centres were concentrated east of 110° E, with Tmax anomalies generally ranging between 1.8 °C and 3.0 °C. Meanwhile, temperatures in the western part of the basin remained near the climatological mean. The spatial configuration of precipitation anomalies corresponded closely to the temperature pattern (Figure 2b), with significant negative precipitation anomalies (40% to 80% deficits) similarly confined to the central and eastern YRB, while the western segment even experienced weak positive precipitation anomalies. This indicates that the 2019 event did not affect the entire basin (impacting approximately half of the basin’s total area) but was a typically localized compound extreme event.
Overall, the surface spatial distributions of the August 2022 and 2019 compound hot-drought events over the YRB corresponded to a basin-wide mode and a middle–lower reaches localized mode, respectively. This remarkable spatial heterogeneity in the locations and extents of surface climate anomalies implies fundamental differences in the large-scale atmospheric circulation backgrounds governing the two events. Therefore, Section 3.2 will subsequently compare the large-scale atmospheric circulations and moisture transport characteristics of these two events to unveil the direct dynamical drivers responsible for the aforementioned spatial differences.
3.2. Divergent Large-Scale Atmospheric Circulation Anomalies and Moisture Transport Characteristics
The distinct spatial differences in surface climate anomalies identified in Section 3.1 are fundamentally the direct responses to divergent large-scale atmospheric circulations and moisture transport patterns. To investigate the dynamical mechanisms, this section conducts a comparative diagnosis of anomalies in tropospheric multi-level geopotential height, wind fields, and moisture transport fluxes.
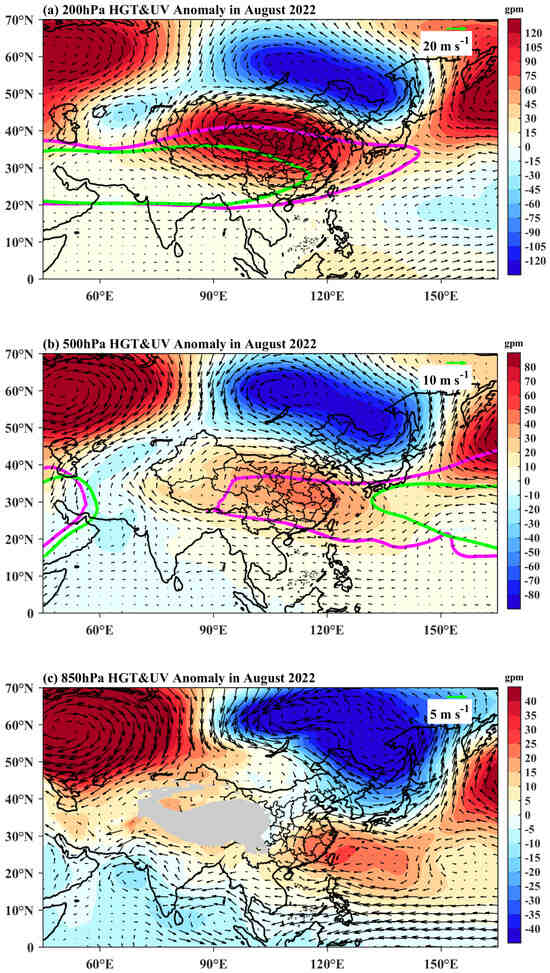
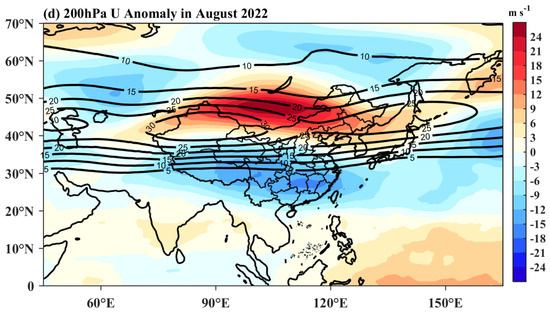
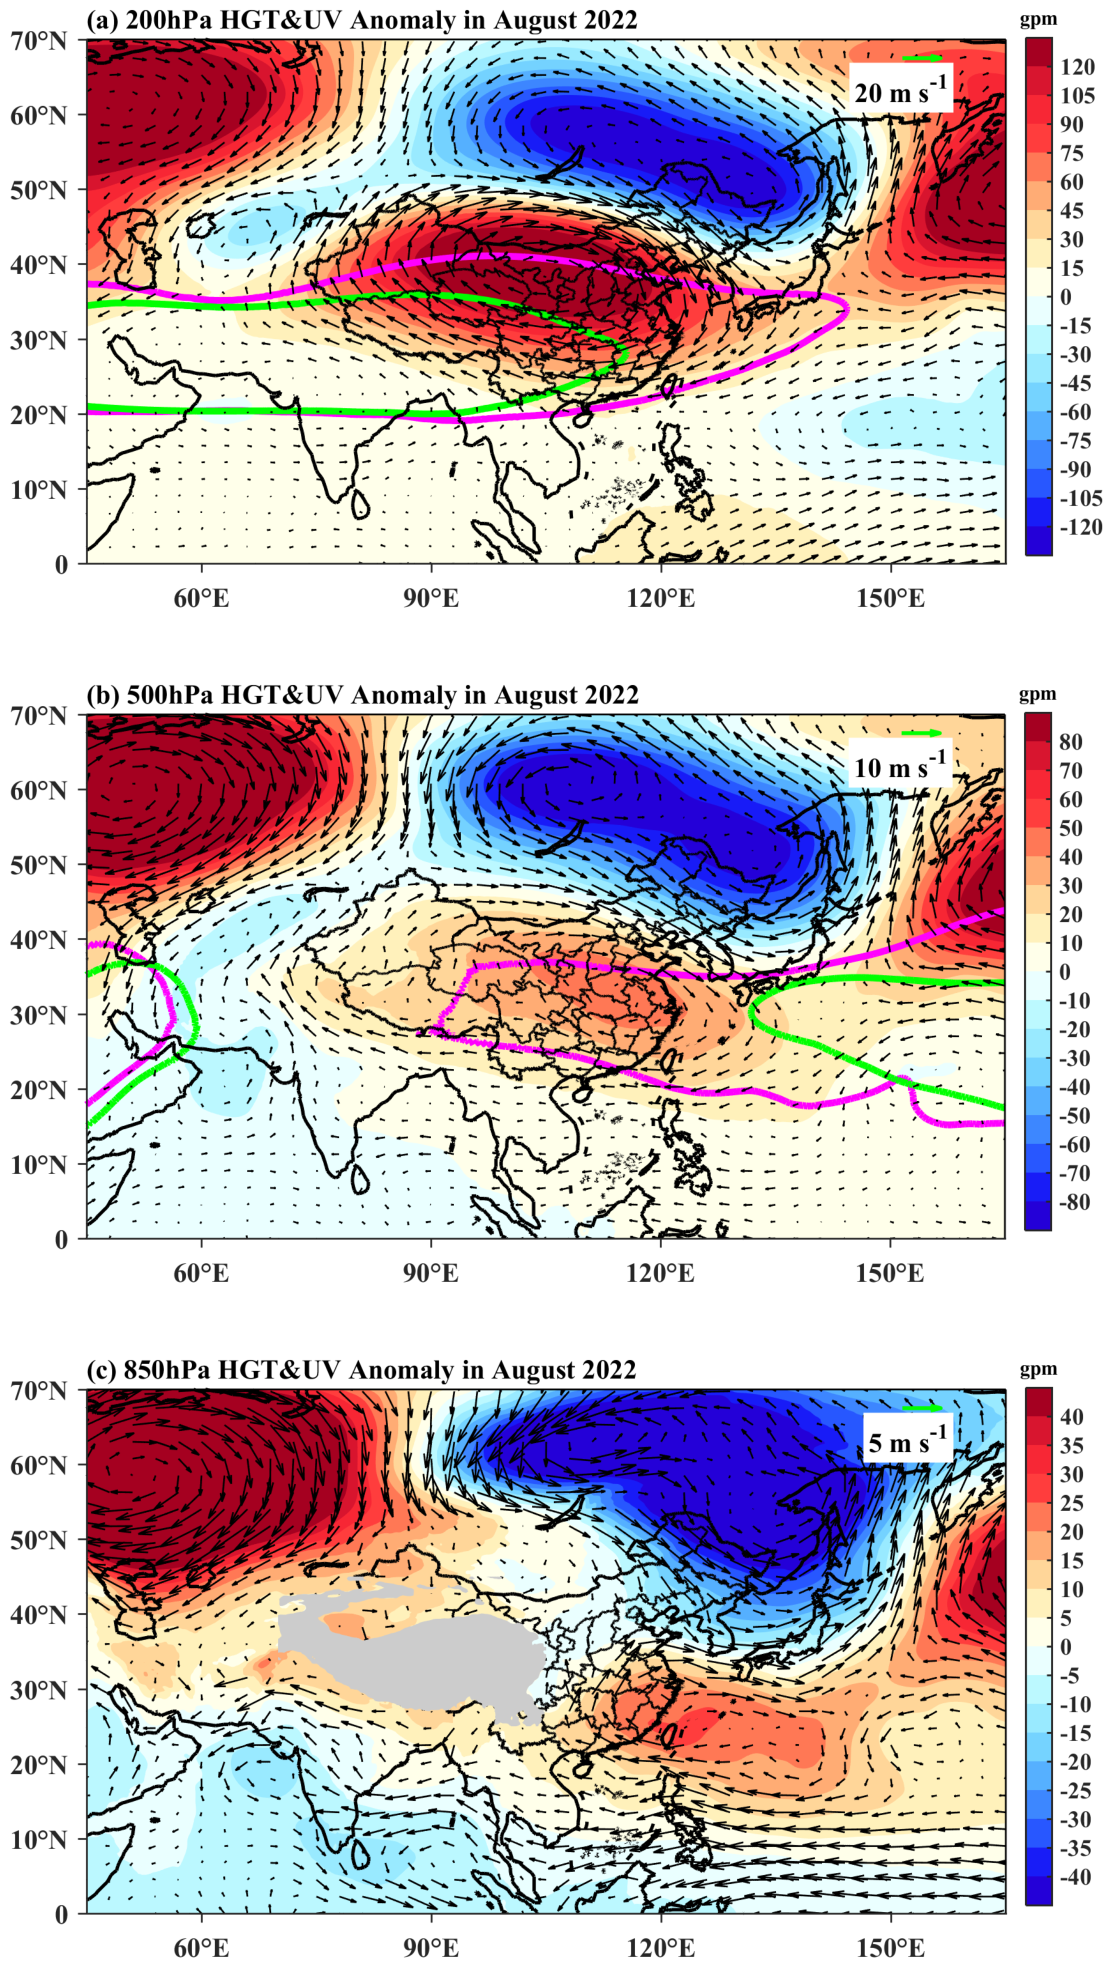
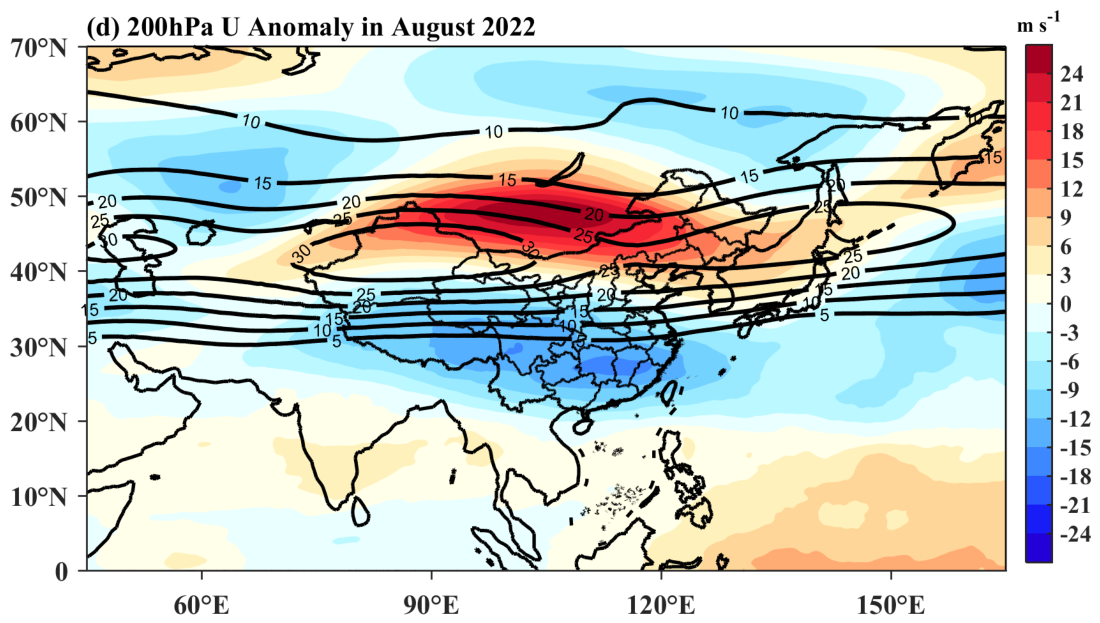
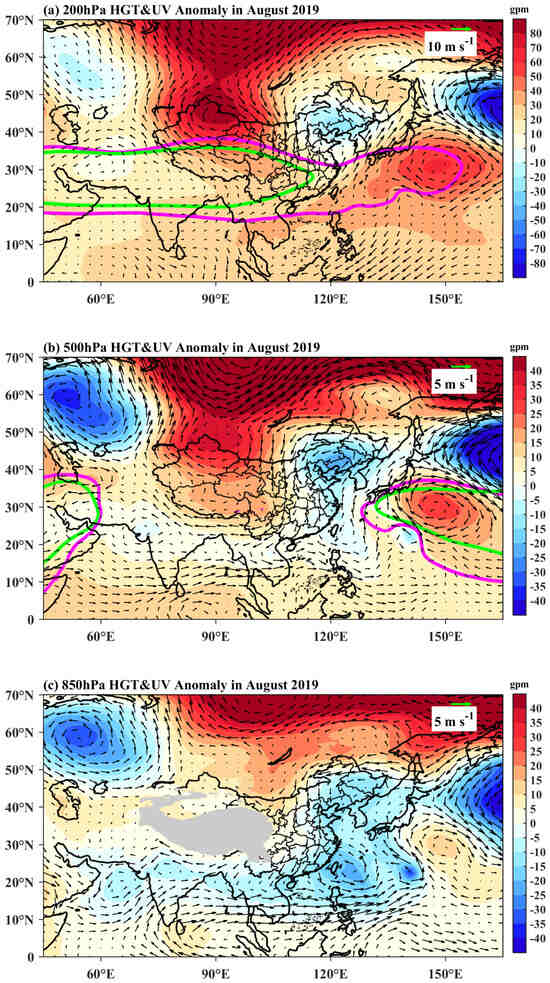
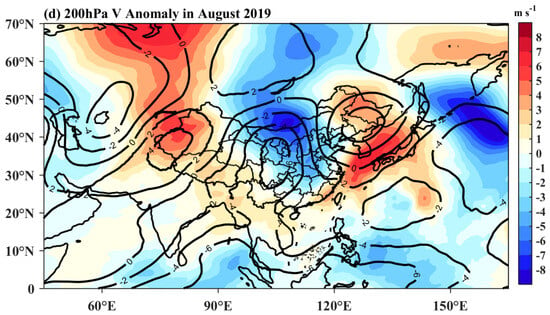
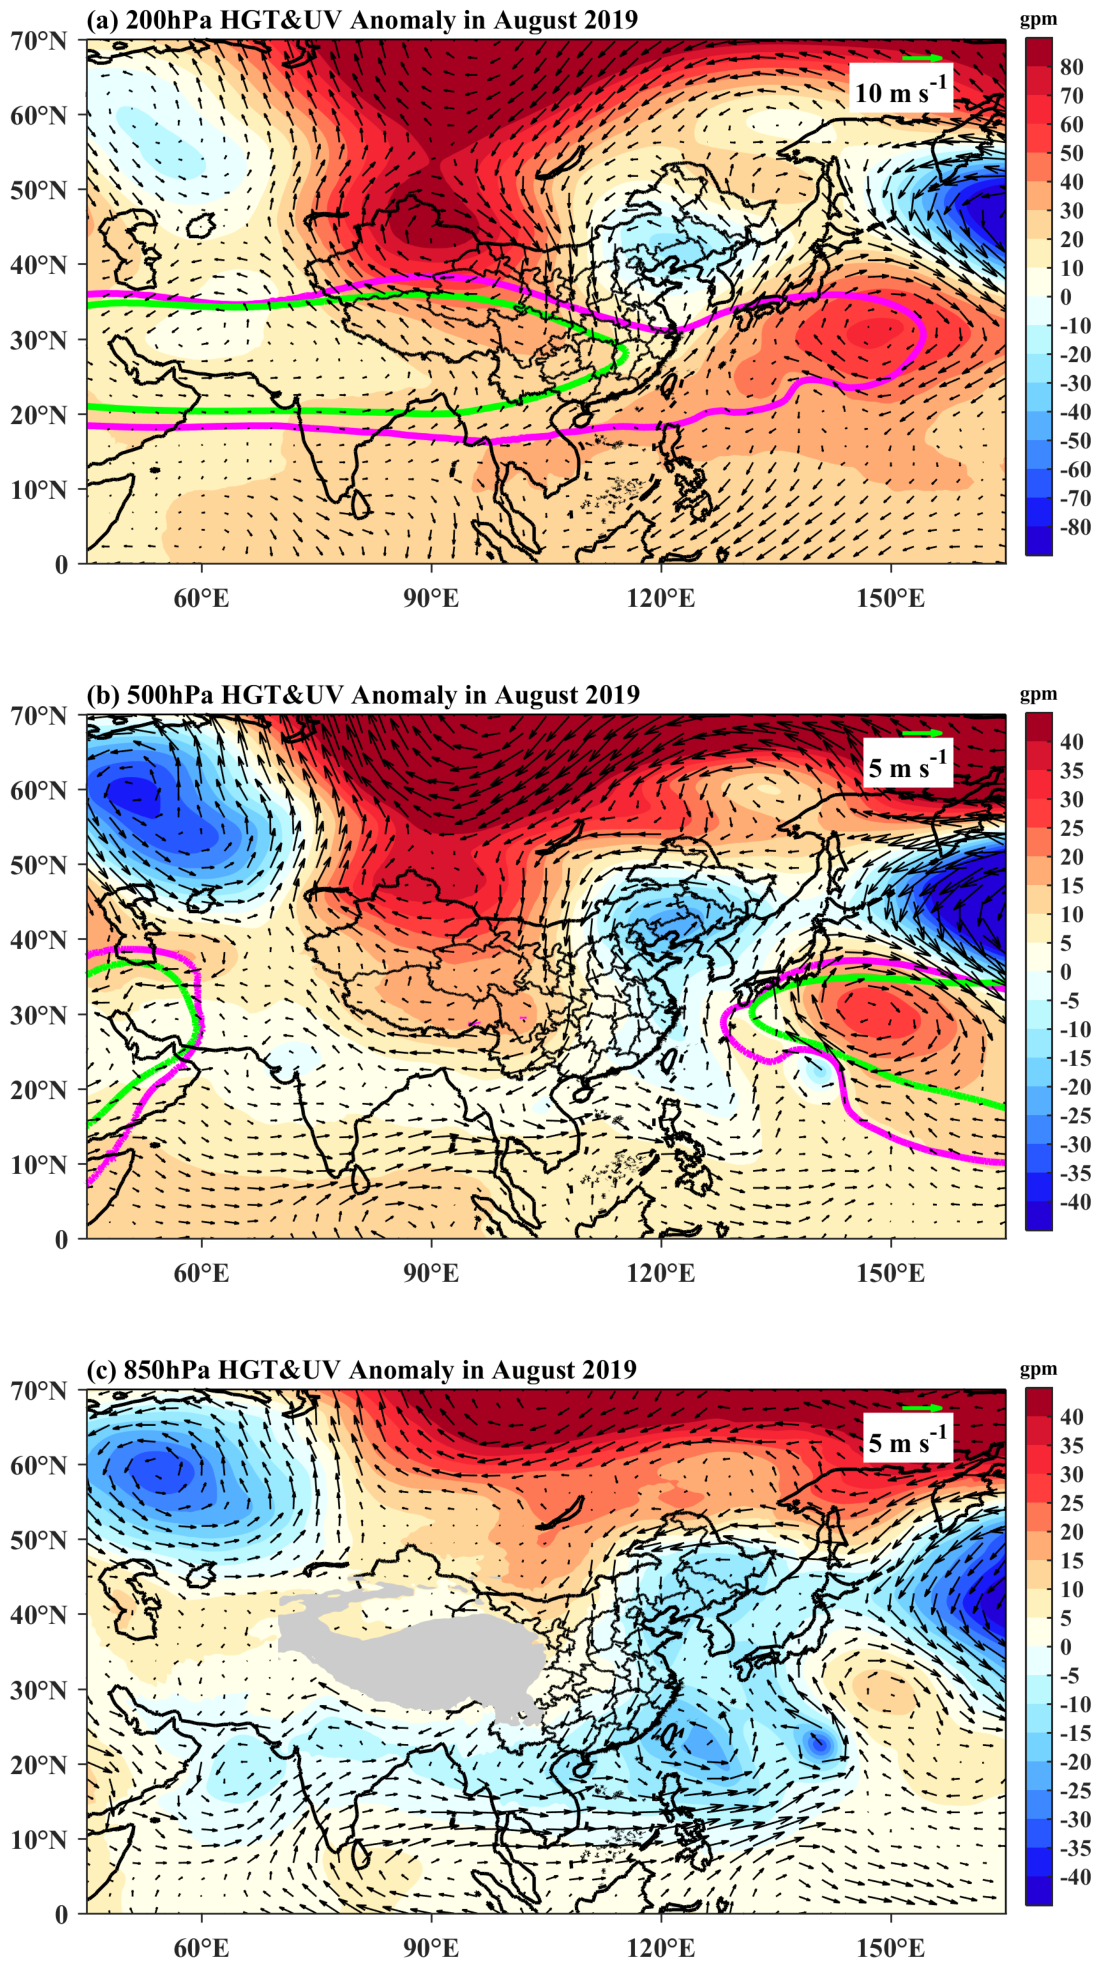
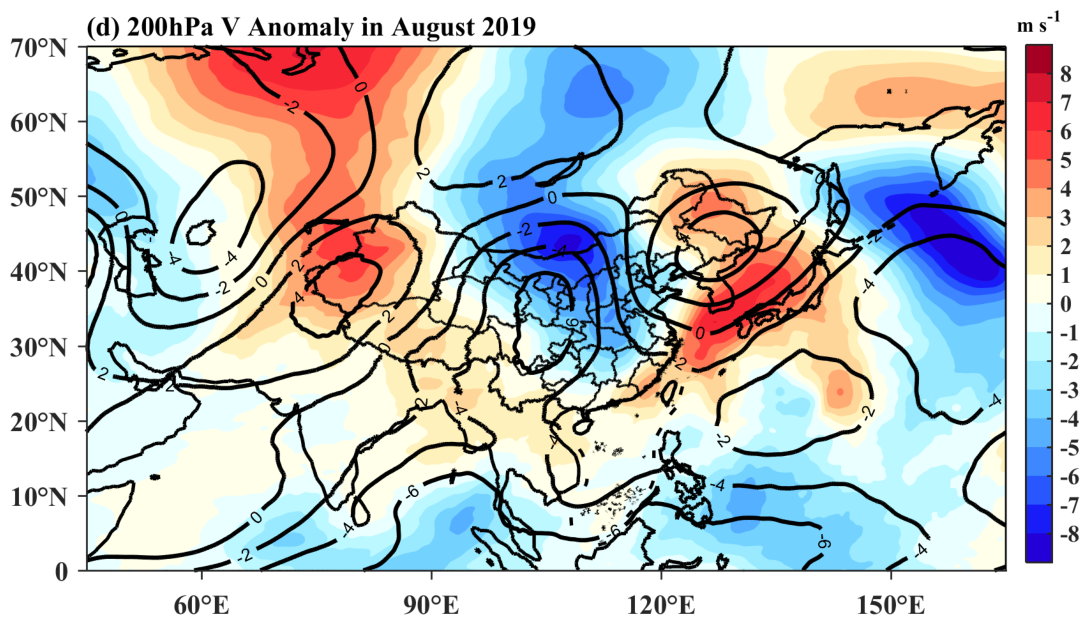
First, substantial differences existed in the spatial scale and configuration of mid-to-upper tropospheric high-pressure systems. In August 2022, the YRB was dominated by a coherent, deep, and quasi-barotropic high-pressure system. At the 200 hPa level (Figure 3a), the South Asian High (SAH) was anomalously strong and significantly extended eastward, while the mid-latitude westerly jet shifted northward (Figure 3d), inhibiting the equatorward intrusion of cold air. At the 500 hPa level (Figure 3b), the Western Pacific Subtropical High (WPSH) extended westward, merging with the western anomalous high to form a continuous high-pressure belt spanning from the Western North Pacific to Central Asia. This in-phase superposition stimulated large-scale descending motions covering the entire YRB, which further modulated the lower-level moisture divergence (Figure 4). In contrast, the mid-to-upper circulation anomalies in August 2019 exhibited a mid-latitude Rossby wave train pattern. Although the middle and lower reaches of the YRB were similarly influenced by anomalous anticyclones at 200 hPa and 500 hPa (Figure 5a,b), this wave train was corroborated by the 200 hPa meridional wind anomalies (Figure 5d), which displayed an alternating meridional flow structure across Eurasia. Specifically, the strong northerly wind anomalies over North and Northeast China delineated an anomalous low-pressure trough located approximately at 120° E–140° E (north of 35° N). This southward-extending trough truncated the connectivity between the continental high and the remote oceanic high, confining the subsidence region primarily to the middle and lower reaches east of 110° E.
Figure 3.
Spatial distributions of (a) 200 hPa geopotential height (HGT) anomalies (shading; units: gpm) and horizontal wind anomalies (vectors; units: m s−1) for August 2022; (b,c) same as (a), but for 500 hPa and 850 hPa, respectively; and (d) 200 hPa zonal wind anomalies (shading; units: m s−1), where black contours denote the climatological mean. The magenta and green solid lines in (a) and (b) denote the 12,520 gpm and 5880 gpm contours for August 2022 and the climatological mean, respectively. Gray shading in (c) represents the Tibetan Plateau with elevations exceeding 2000 m.
Figure 4.
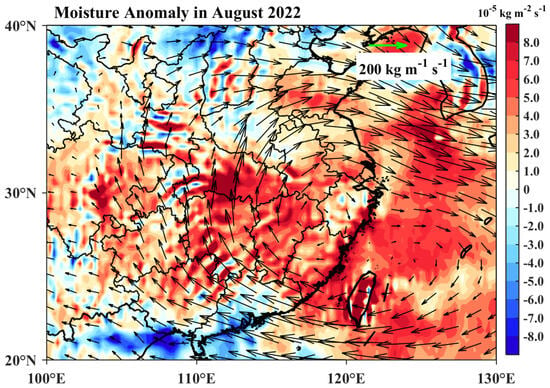
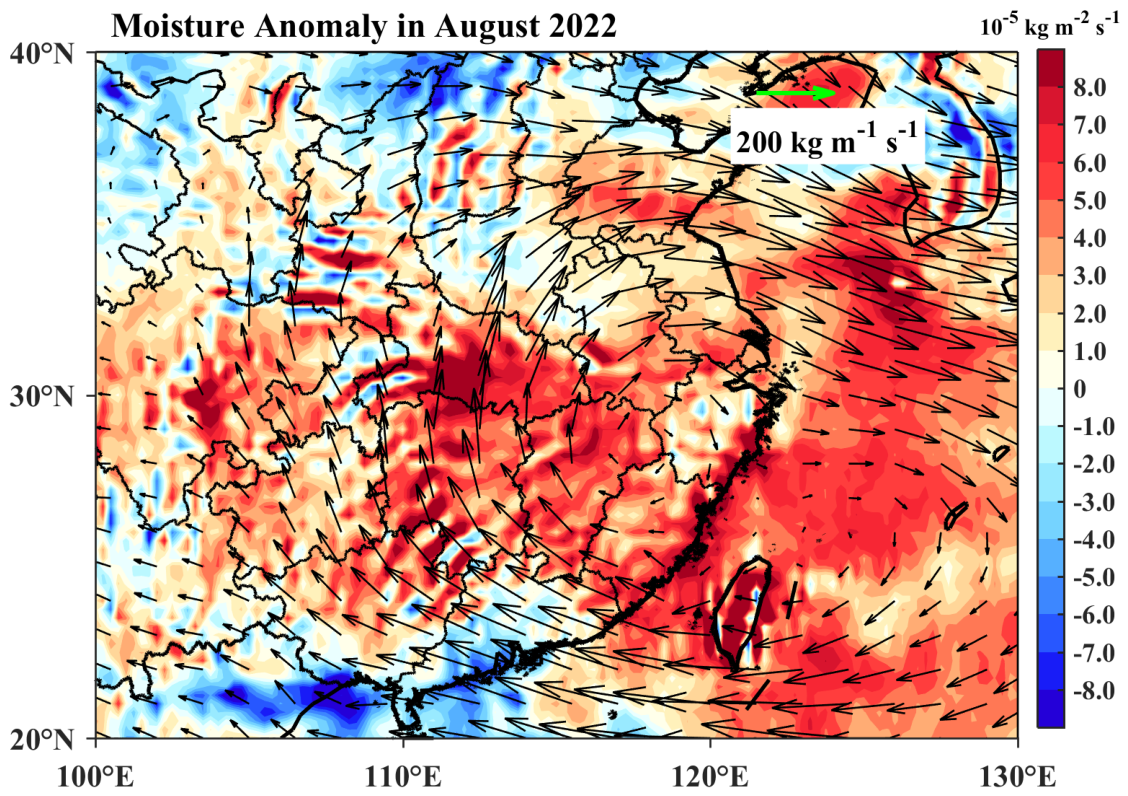
Distributions of column-integrated water vapor flux anomalies (vectors; units: kg m−1 s−1) and water vapor flux divergence anomalies (shading; units: 10−5 kg m−2 s−1) over the Yangtze River Basin in August 2022.
Figure 5.
Spatial distributions of (a) 200 hPa geopotential height (HGT) anomalies (shading; units: gpm) and horizontal wind anomalies (vectors; units: m s−1) for August 2019; (b,c) same as (a), but for 500 hPa and 850 hPa, respectively; and (d) 200 hPa meridional wind anomalies (shading; units: m s−1), where black contours denote the climatological mean. The magenta and green solid lines in (a) and (b) denote the 12,520 gpm and 5880 gpm contours for August 2019 and the climatological mean, respectively. Gray shading in (c) represents the Tibetan Plateau with elevations exceeding 2000 m.
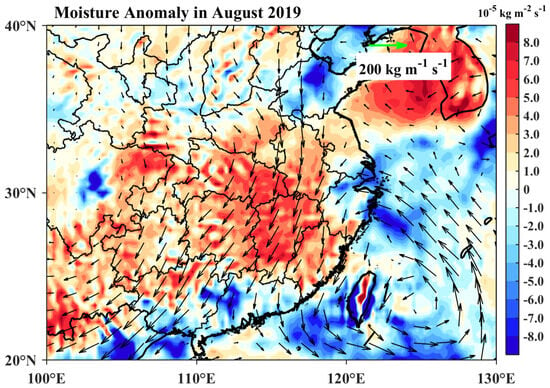
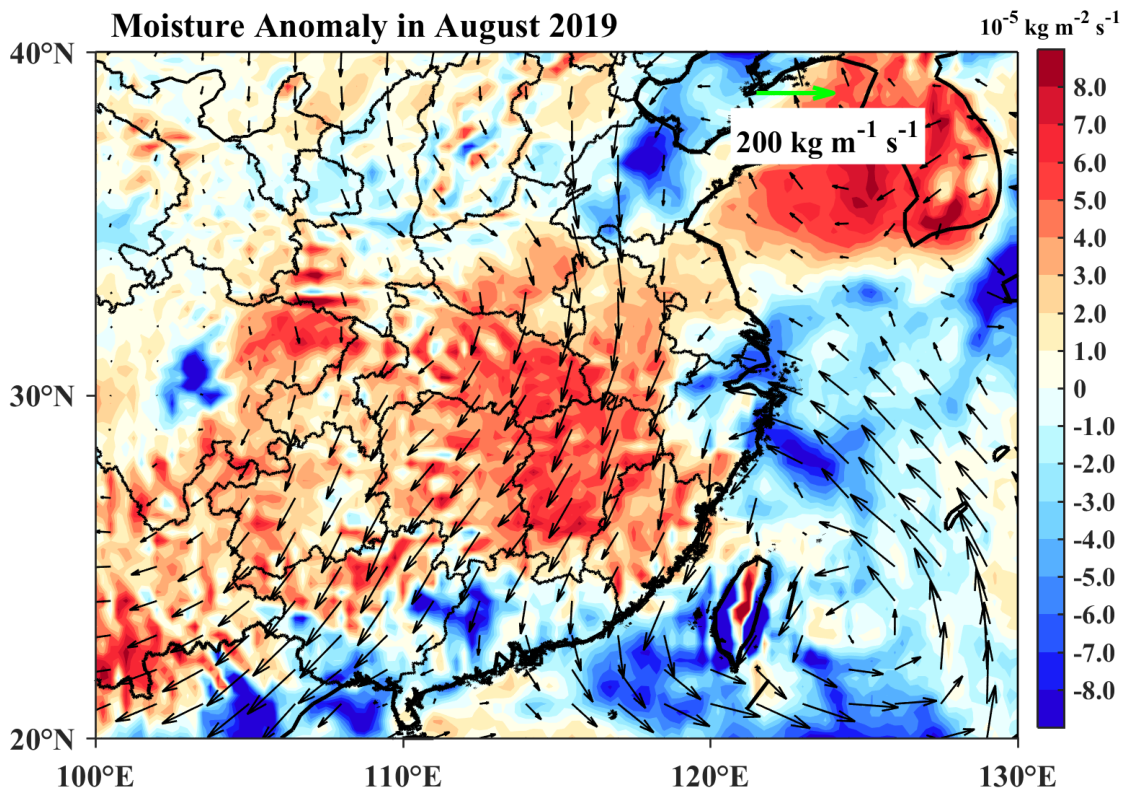
Secondly, lower-level wind anomalies drove two distinct mechanisms for moisture transport blockage. In August 2022, at the 850 hPa level (Figure 3c), a zonal anomalous easterly band was induced along the southern flank of the continental high (located at 10° N–25° N), stretching from the tropical Western Pacific to the Bay of Bengal. This flow suppressed the southwest monsoon moisture transport pathways, resulting in basin-wide moisture divergence anomalies (calculated based on Equation (1); Figure 4). Conversely, the moisture blockage in August 2019 was driven by a lower-level anomalous cyclone offshore in the Western North Pacific. At the 850 hPa level (Figure 5c), this cyclone intensified over the region from the east of the Philippines to Taiwan. Modulated by this system, persistent northerly wind anomalies intruded into eastern China (110° E–120° E), reversing the climatological southerly moisture transport vectors and preventing tropical moisture from reaching the middle–lower YRB (calculated based on Equation (1); Figure 6). Consequently, the moisture deficit in 2019 was confined to the central and eastern basin governed by this northerly circulation.
Figure 6.
Distributions of column-integrated water vapor flux anomalies (vectors; units: kg m−1 s−1) and water vapor flux divergence anomalies (shading; units: 10−5 kg m−2 s−1) over the Yangtze River Basin in August 2019.
In summary, the 2022 event featured a basin-wide deep high-pressure belt coupled with a lower-level zonal easterly block, whereas the 2019 event presented a localized anticyclonic mode modulated by an upper-level trough truncation and a lower-level cyclonic northerly cut-off. Although both events relied on circulation anomalies to maintain descending motions, it is necessary to quantitatively evaluate the direct thermodynamic contributions of dynamical subsidence and horizontal flow. Therefore, Section 3.3 will employ the thermodynamic energy equation to deconstruct the roles of the horizontal temperature advection, vertical adiabatic warming, and diabatic heating terms in maintaining extreme temperatures.
3.3. Thermodynamic Budget Diagnosis for the Maintenance of Local High-Temperature Anomalies
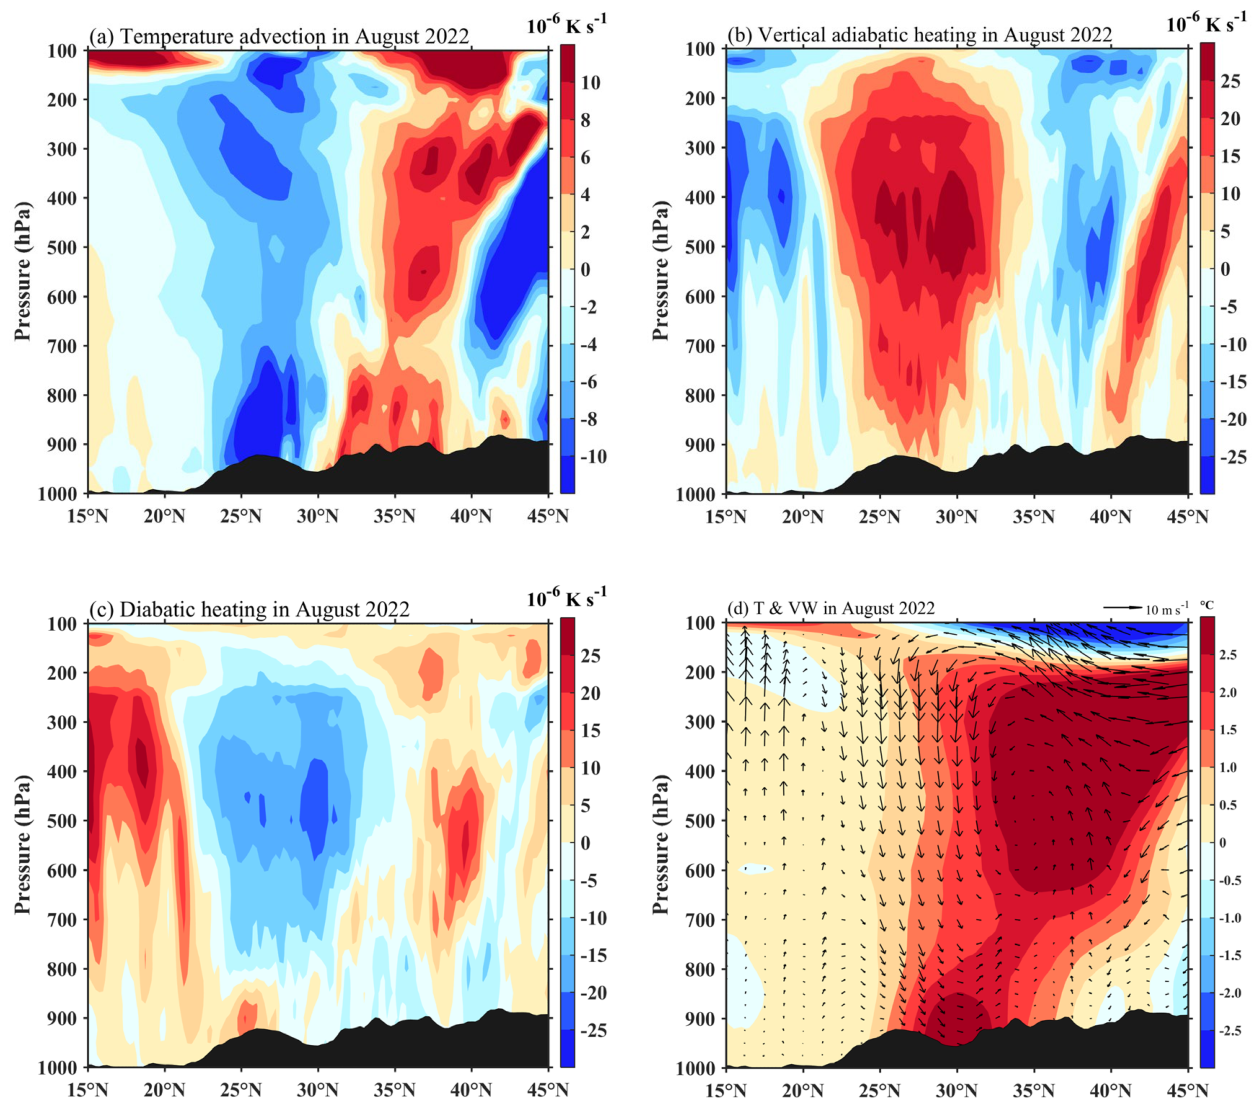
Section 3.1 illustrated the morphological differences in surface anomalies between the two CHDEs, and Section 3.2 elucidated the large-scale circulation and moisture transport patterns dominating these differences. To quantitatively investigate how this dynamical evolution maintains local anomalous tropospheric warming, this section conducts a diagnosis based on the thermodynamic energy equation (Equation (2)). Under the quasi-stationary assumption that the local temperature tendency term approaches zero on a monthly mean timescale, the diabatic heating anomaly term (representing the apparent heat source) acts as the balancing residual of the horizontal temperature advection and vertical adiabatic anomalies. Figure 7 and Figure 8 present the latitude-pressure cross-sections of the three thermodynamic terms alongside the vertical circulation vectors, averaged over the primary YRB longitudes (102° E–122° E) for August 2022 and 2019, respectively.
Figure 7.
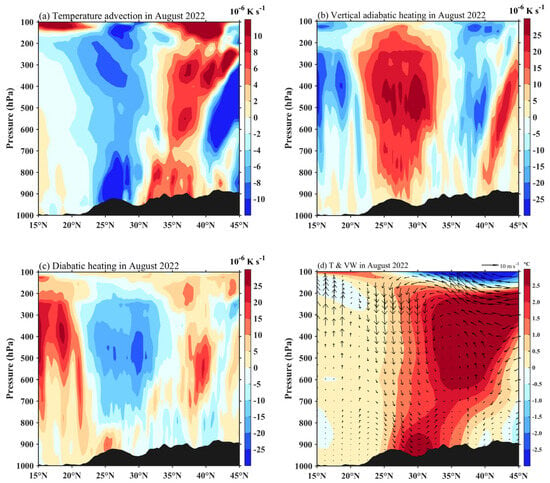
Latitude-pressure cross-sections of anomalies for (a) the horizontal temperature advection term, (b) the vertical adiabatic term, and (c) the diabatic heating term, averaged over 102° E–122° E in the Yangtze River Basin for August 2022 (units: 10−6 K s−1). (d) Latitude-pressure cross-sections of temperature anomalies (shading, °C) and vertical circulation anomalies (vectors) averaged over the same domain. To clearly visualize the atmospheric meridional–vertical circulation against the large disparity between horizontal and vertical spatial scales, the meridional wind anomaly (v) is scaled by a factor of 0.25, and the vertical velocity anomaly (w, converted to ) is multiplied by 500.
Figure 8.
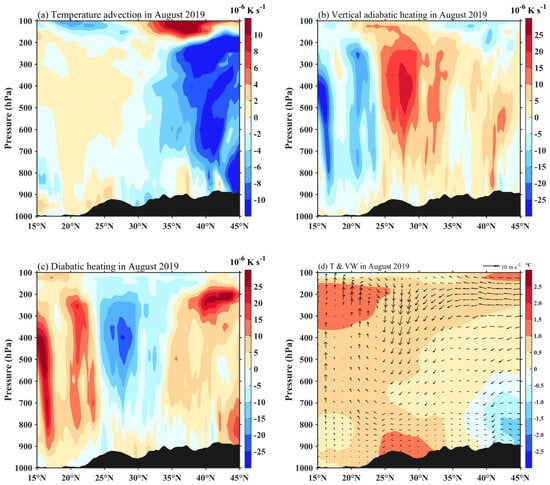
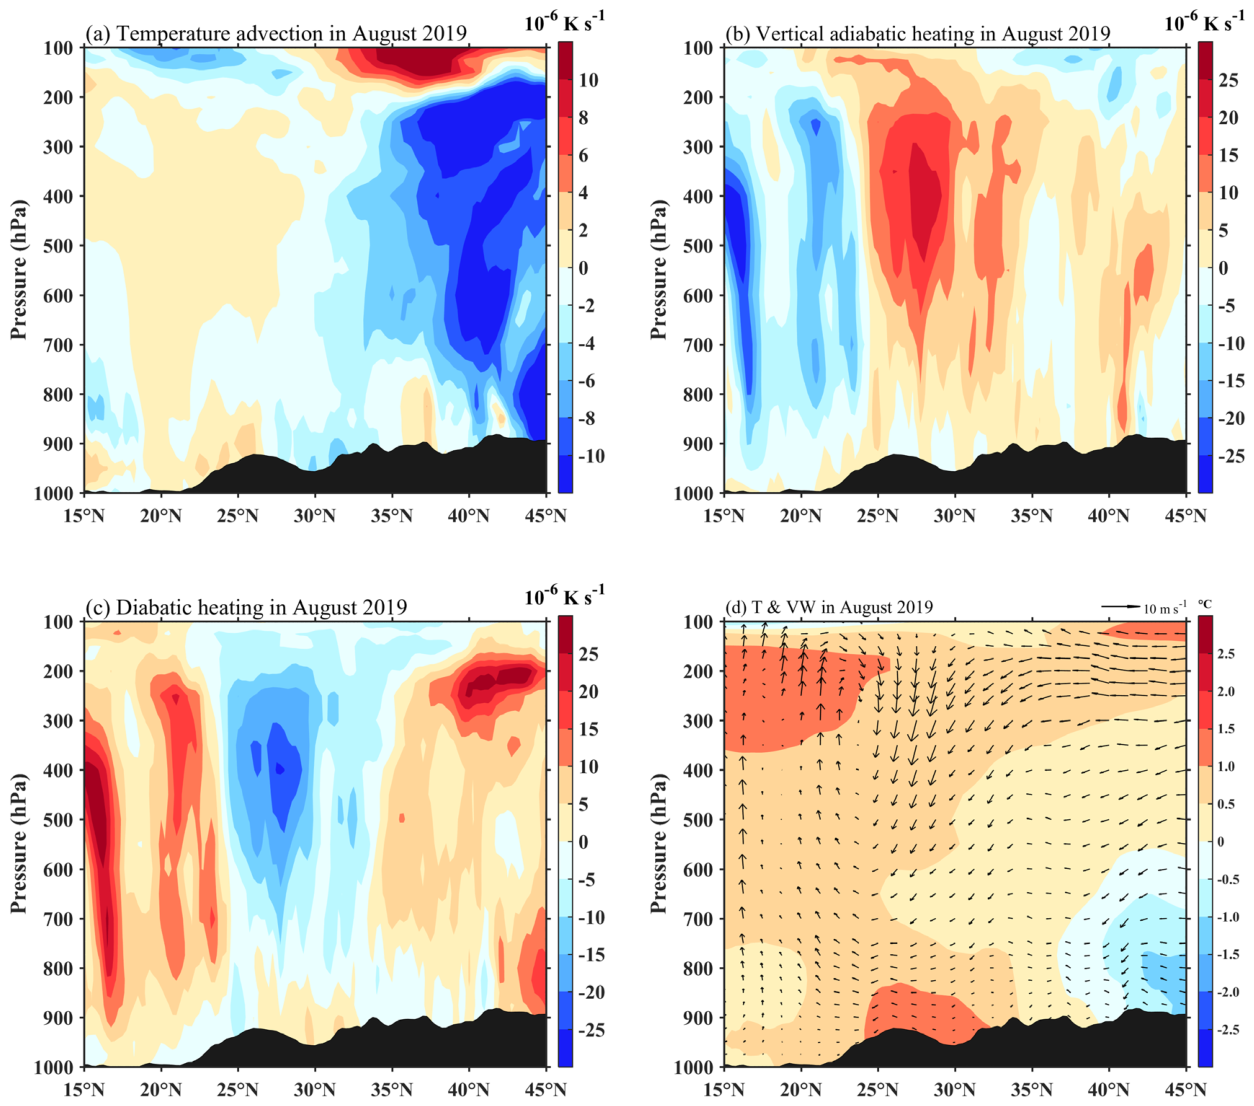
Latitude-pressure cross-sections of anomalies for (a) the horizontal temperature advection term, (b) the vertical adiabatic term, and (c) the diabatic heating term, averaged over 102° E–122° E in the Yangtze River Basin for August 2019 (units: 10−6 K s−1). (d) Latitude-pressure cross-sections of temperature anomalies (shading, °C) and vertical circulation anomalies (vectors) averaged over the same domain. To clearly visualize the atmospheric meridional–vertical circulation against the large disparity between horizontal and vertical spatial scales, the meridional wind anomaly (v) is scaled by a factor of 0.25, and the vertical velocity anomaly (w, converted to ) is multiplied by 500.
For the basin-wide event in August 2022, the thermodynamic structure reflects the dynamical features of the deep barotropic system detailed in Section 3.2. Over the core YRB region (25° N–34° N), Figure 7d reveals extreme positive temperature anomalies extending throughout the troposphere, accompanied by intense descending wind vectors. The thermodynamic maintenance of these local thermal anomalies is primarily governed by adiabatic processes. Specifically, as shown in Figure 7b, this violent subsidence directly drives an intense positive vertical adiabatic center penetrating the entire troposphere (from 200 hPa down to the near-surface) over the YRB. The concurrent horizontal temperature advection field (Figure 7a) exhibited distinct meridional variations within the basin, with cold advection anomalies in the southern YRB and warm advection anomalies in the northern YRB. Despite this regional distribution, absolute magnitude comparisons reveal that the peak advection values (approximately 10 × 10−6 K s−1) are substantially lower than the intensity of the vertical adiabatic term (exceeding 25 × 10−6 K s−1). To achieve the quasi-stationary thermodynamic balance, the diabatic heating term (Figure 7c) presented deep negative anomalies over the YRB. Given that convective latent heating is severely suppressed under intense clear-sky subsidence, this negative apparent heat source physically represents a net heat sink dominated by the longwave radiational cooling effect. This implies that in the 2022 thermodynamic budget, the deep subsidence-induced adiabatic warming played the absolute dominant role; this significant heat input not only offset the local cold advection perturbations but also continuously compensated for the radiational cooling heat sink intrinsic to the extreme hot state, thereby sustaining the persistent high-temperature anomalies in the mid-to-lower troposphere (as observed in Figure 7d).
In contrast, the thermodynamic response during the middle–lower reaches localized event in August 2019 was highly consistent with its constrained large-scale dynamical background. Constrained by the truncation of the upper-level trough and the peripheral northerly winds of the tropical lower-level cyclone, the localized anticyclone over the YRB was restricted from developing into a deep structure. Correspondingly, over the core YRB (25° N–34° N), the vertical circulation field (Figure 8d) displays substantially shallower and weaker subsidence compared to 2022, which dynamically aligns with the vertically limited temperature anomalies. Consequently, as shown in Figure 8b, the positive vertical adiabatic anomalies over the YRB were significantly lower in intensity compared to 2022 and were confined to the mid-troposphere between 300 hPa and 600 hPa. Meanwhile, the horizontal temperature advection (Figure 8a) showed distinct spatial contrasts: weak anomalies over the YRB, while strong cold advection was largely confined to latitudes north of the basin (corresponding to the anomalous cold trough). Under the residual mechanism, the magnitude of the negative diabatic anomalies (the radiational heat sink) over the YRB was similarly weaker (Figure 8c). Overall, lacking a penetrative subsidence adiabatic heat source, the limited subsidence heating in 2019 could merely sustain a lower-level thermodynamic balance, which was insufficient to support extreme temperature anomalies in the deep troposphere. This quantitatively explains the relatively lower intensity of the 2019 CHDEs.
To quantitatively substantiate the cross-sectional diagnoses and confirm the dominance of adiabatic heating, the domain-averaged thermodynamic budgets and relative percentage contributions over the primary Yangtze River Basin (25° N–34° N, 102° E–122° E, 850–200 hPa) are summarized in Table 1. These synthesized values provide objective numerical evidence that vertical adiabatic warming acted as the dominant dynamical heating source in both events. Moreover, the absolute magnitude of the vertical adiabatic term in August 2022 (+14.38 × 10⁻⁶ K s−1) was substantially stronger than that in August 2019 (+9.15 × 10⁻⁶ K s−1).
Table 1.
Domain-averaged thermodynamic budget terms (10−6 K s−1) and relative dynamical contributions over the Yangtze River Basin (25° N–34° N, 102° E–122° E, 850–200 hPa).
In summary, the analysis demonstrates that the differences in surface heat characteristics are fundamentally the result of large-scale circulation evolution modulating the penetrative depth and intensity of subsidence, which subsequently determines the core magnitude of vertical adiabatic warming. The specific oceanic forcing backgrounds that modulated such differences in dynamic subsidence will be further explored in Section 3.4.
3.4. Ocean SST Forcing Backgrounds Driving the Differentiated Large-Scale Circulations
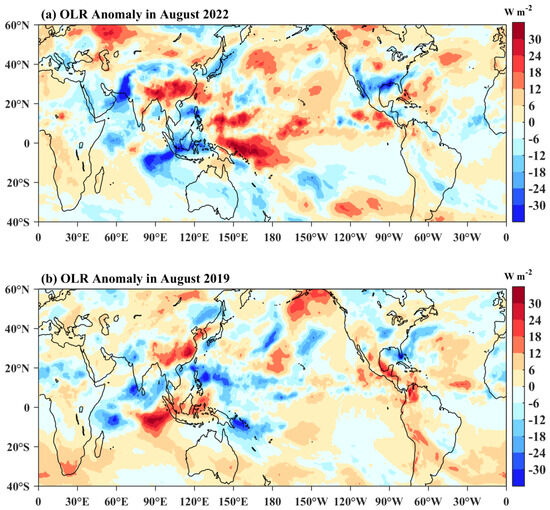
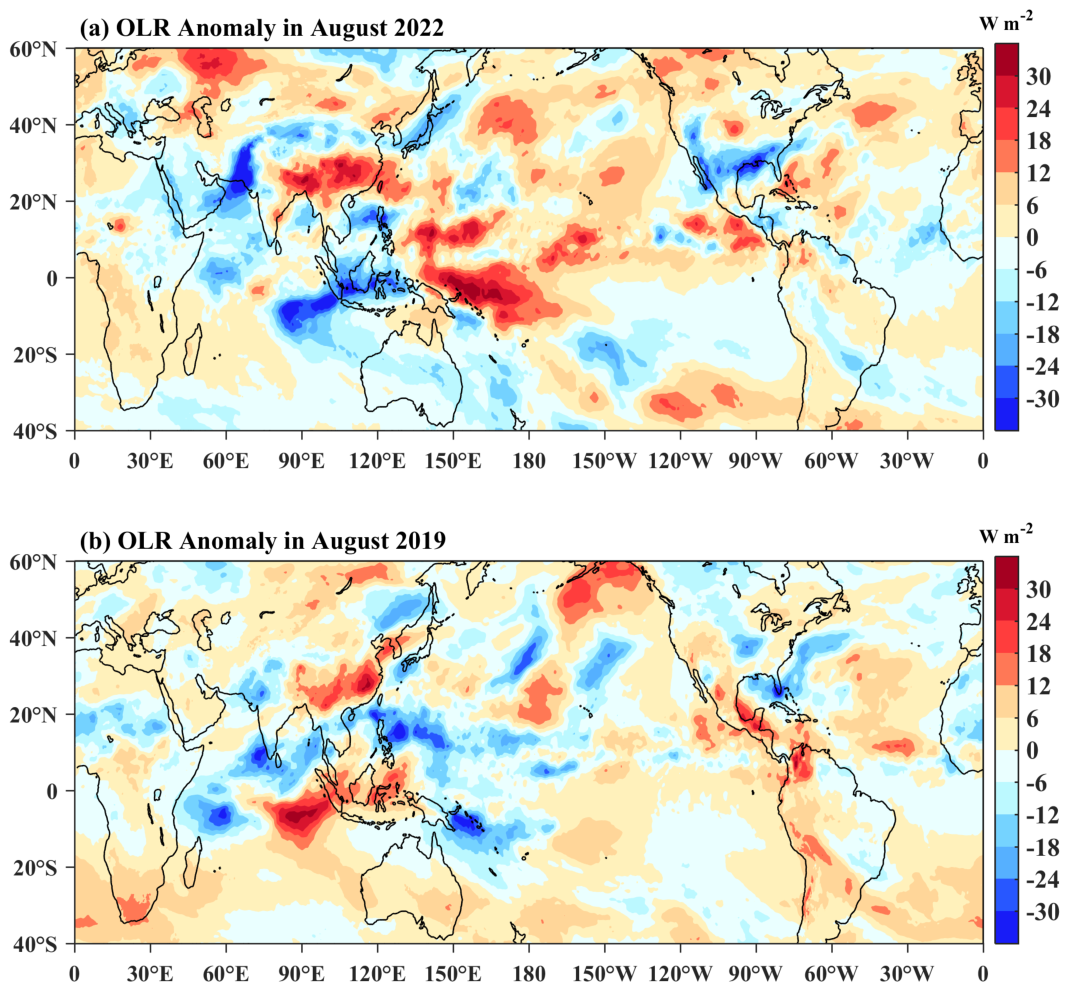
The preceding analyses demonstrated systematic differences between the two CHDEs in terms of surface climate characteristics (Section 3.1), large-scale circulation configurations (Section 3.2), and thermodynamic budgets (Section 3.3). To investigate the external boundary forcing mechanisms, this section focuses on tropical sea surface temperature (SST) anomalies. Simultaneously, outgoing longwave radiation (OLR) anomalies are utilized to characterize the physical processes linking oceanic forcing with atmospheric convective latent heating. The spatial distributions in Figure 9 and Figure 10 indicate that the two events were associated with opposite Indian Ocean Dipole (IOD) phases and distinct El Niño-Southern Oscillation (ENSO) modes.
Figure 9.
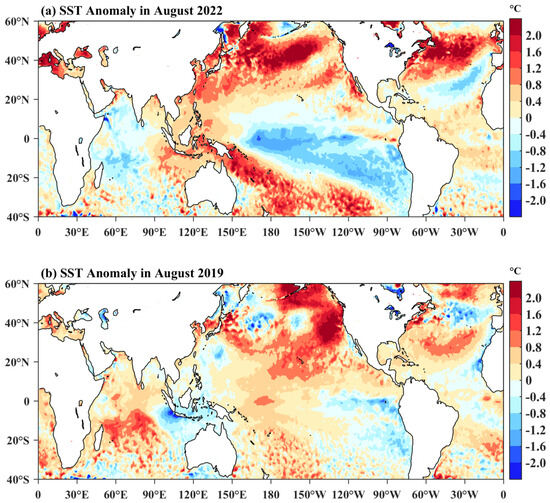
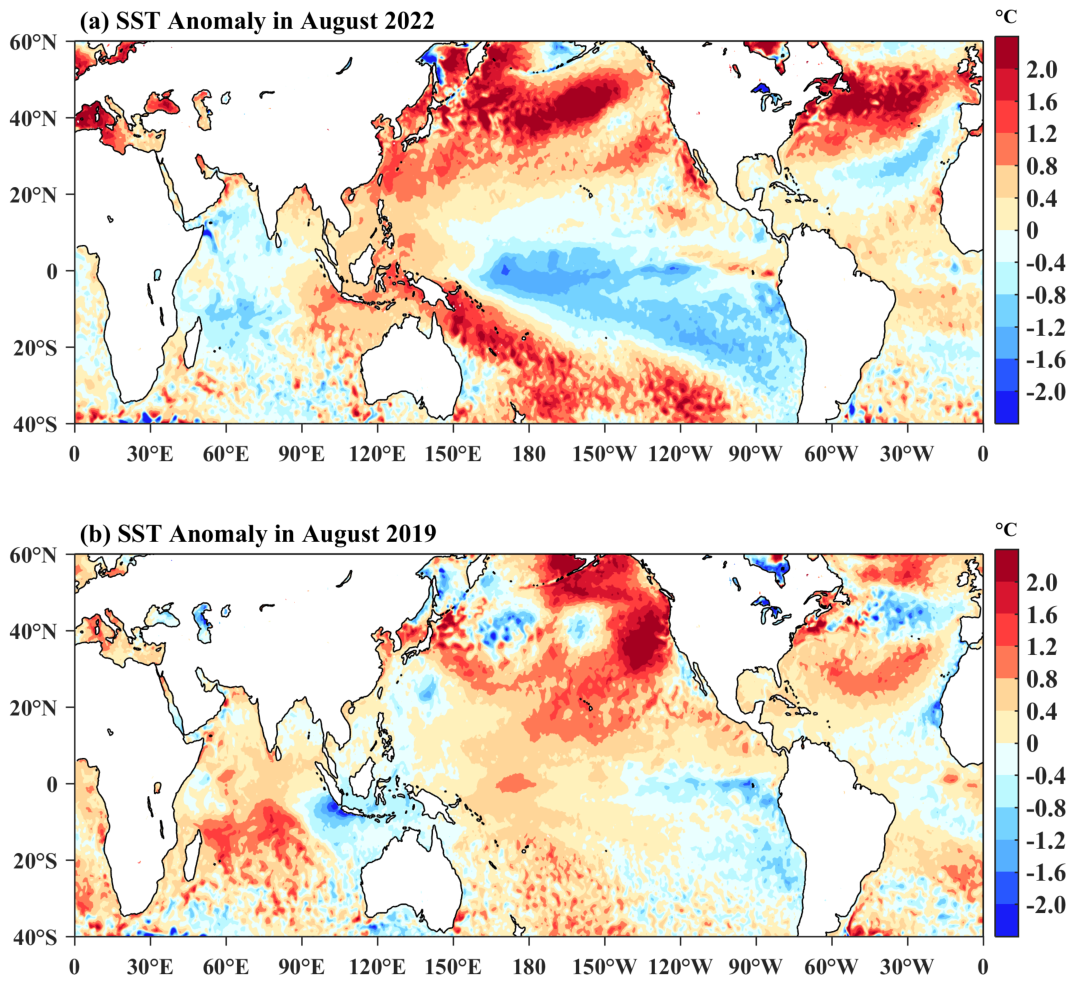
Spatial distributions of sea surface temperature (SST) anomalies in (a) August 2022 and (b) August 2019 (unit: °C).
Figure 10.
Spatial distributions of outgoing longwave radiation (OLR) anomalies in (a) August 2022 and (b) August 2019 (unit: W m−2).
As shown in Figure 9a, based on monitoring data from the National Climate Center (NCC) of China, the Pacific exhibited a La Niña state in August 2022 (Niño 3.4 index = −0.95), while the Indian Ocean exhibited a distinct NIOD (observed index = −1.0). Specifically, the western Indian Ocean experienced anomalously cold SST, while positive SST anomalies prevailed from the tropical eastern Indian Ocean to the Maritime Continent. This NIOD-driven eastern warming exerted a direct diabatic heating forcing on the atmosphere, indicated by significant negative OLR anomalies (active convection) over the eastern Indian Ocean (Figure 10a). From a dynamical perspective, this extensive latent heating anomaly favors the intensification of the local meridional Hadley circulation. The anomalous descending branch of this intensified circulation encompasses the YRB and its northern regions. This large-scale descending forcing is physically consistent with the intense downward circulation anomalies explicitly captured over the YRB (Figure 7d), which dynamically facilitated the deep adiabatic warming diagnosed in Section 3.3. Concurrently, dynamically consistent with the Matsuno–Gill response, this heat source favored the development of anomalous lower-level easterlies in the equatorial region, establishing the zonal moisture-blocking band observed in Section 3.2.
In contrast, the ocean boundary forcing in August 2019 presented a different configuration. The Pacific featured a weak Central Pacific El Niño state (observed Niño 4 index = 0.79), while the Indian Ocean featured an intense positive IOD (PIOD) (observed index = 1.5). As shown in Figure 9b, the equatorial southeastern Indian Ocean (off the Sumatra coast) exhibited intense negative SST anomalies. Suppressed by the cold SST, atmospheric convection was inhibited, manifesting as significant positive OLR anomalies in the tropical eastern Indian Ocean (Figure 10b). This anomalous diabatic cooling source did not favor the enhancement of a broad and deep Hadley descending branch. This lack of systemic subsidence is clearly reflected in the shallower and weaker downward circulation anomalies observed over the YRB (Figure 8d). Instead, this cooling source modulated regional circulations by providing a favorable background for a Rossby wave train propagating to mid-high latitudes. As explicitly presented in Section 3.2, the existence of this wave train is observationally indicated by the alternating pattern of 200 hPa meridional wind anomalies across Eurasia (Figure 5d). Furthermore, the negative OLR anomalies over the Western North Pacific (15° N–25° N, 130° E) are dynamically consistent with the anomalous offshore cyclone detailed in Section 3.2. The peripheral northerly winds of this localized cyclone restricted the expansion of the regional anticyclonic system, confining the extreme warming and drought to the middle–lower reaches of the YRB.
In summary, the August 2022 event was associated with the synergistic forcing of La Niña and NIOD. Its dynamic feedback was characterized by tropical eastern Indian Ocean convective latent heating favoring a robust anomalous Hadley descending branch, which dynamically allowed deep adiabatic warming to overspread the entire basin. Conversely, the August 2019 event was associated with a weak Central Pacific El Niño and a significant PIOD, which weakened systematic subsidence via a tropical diabatic cooling source and favored localized cyclonic wave train responses over the Western North Pacific. Fundamentally, these contrasting ocean boundary forcings and their consequent tropical convective anomalies modulated the depth and intensity of the descending motions over the YRB (Figure 7d and Figure 8d). This discrepancy in boundary forcings ultimately provided the physical background that shaped the divergent three-dimensional circulation configurations (Section 3.2) and local thermodynamic budgets (Section 3.3) between the two events.
4. Discussion
4.1. Two Ocean–Atmosphere Driven Paradigms for CHDEs over the Yangtze River Basin
Synthesizing the progressive diagnostic evidence concerning surface anomalies (Section 3.1), circulation configurations (Section 3.2), thermodynamic budgets (Section 3.3), and oceanic boundary forcings (Section 3.4), this study concludes that although summer CHDEs over the YRB exhibit concurrent occurrences at the surface, their internal physical evolutions demonstrate two distinctly different ocean–atmosphere forcing paradigms.
The first paradigm represents a deep systemic thermodynamic coupling associated with the NIOD and La Niña forcing (exemplified by August 2022). Rather than a mere superposition of circulation anomalies, this pathway is dominated by a robust anomalous Hadley circulation. As explicitly indicated by the intense downward vertical circulation vectors (Figure 7d), this profound systemic subsidence generated massive adiabatic warming throughout the troposphere. It is this penetrative thermal input, balancing the atmospheric longwave radiational cooling heat sink, that sustained the extreme high temperatures in the deep atmosphere. Coupled with the moisture cutoff by anomalous easterlies, this deep thermodynamic–dynamic synergy ultimately shaped the basin-wide CHDEs.
The second paradigm corresponds to a teleconnection wave train and localized blockage mode (exemplified by August 2019). Unlike the systemic blocking in 2022, the anomalous tropical cooling source was insufficient to enhance a broad continental descending branch, which is clearly reflected in the shallower and weaker downward vertical circulation vectors over the YRB (Figure 8d). Instead, it provided a favorable background for Rossby wave trains propagating to mid-high latitudes, inducing an anomalous cyclonic system locally over the Western North Pacific. Consequently, given the lack of a penetrative adiabatic heat source, the limited atmospheric heating could merely sustain a lower-level thermodynamic balance. This vertically confined thermal accumulation quantitatively accounts for the relatively weaker warming intensity and localized spatial distribution of the 2019 event.
4.2. Discussion on the Role of Local Land–Atmosphere Coupling Feedback and Future Prospects
Notably, this study primarily investigates the physical maintenance mechanisms of CHDEs based on large-scale oceanic forcings and atmospheric thermodynamic budgets. However, regarding the prolonged evolution of extremes, physical feedback from the underlying surface constitutes an important modulating mechanism. Recent studies [35,36,37] emphasize that during periods of sustained precipitation deficit primarily driven by large-scale descending motions, soil moisture anomalies can significantly modulate the surface energy balance. Specifically, a reduction in soil moisture limits latent heat flux while enhancing sensible heat flux, thereby initiating a local-scale land–atmosphere positive feedback that further intensifies near-surface warming [38].
Compared with previous investigations that primarily focused on either purely dynamical atmospheric blocking [15,16,19] or isolated land-surface processes, our three-dimensional thermodynamic diagnosis and vertical circulation fields provide a crucial linkage. For instance, the intense descending adiabatic warming and downward vertical circulation vectors identified in our 2022 case (as diagnosed via Equation (2) and Figure 7d) act as the primary initiator for rapid surface drying. This highlights that the extreme intensity of the YRB CHDEs cannot be fully explained by large-scale subsidence alone; rather, it is the synergistic effect of the deep adiabatic heating and the subsequent local land-surface thermodynamic feedback.
For future investigations, it is necessary to employ Coupled Earth System Models (CESM) to conduct numerical experiments. This will aid in quantitatively isolating the contribution weights of large-scale circulation forcings versus local land-surface feedbacks throughout the different stages of such events. Furthermore, although this study focuses specifically on the YRB, the identified physical pathways hold potential applicability for diagnosing CHDEs in other major monsoon regions. These core pathways include both remote oceanic-induced circulation anomalies and local thermodynamic feedbacks. Applying this three-dimensional thermodynamic framework to diverse climatological contexts, such as the South Asian or North American monsoon systems, will be an essential step toward verifying its global universality and refining predictive theories.
4.3. Methodological Limitations and Uncertainties
The diagnostic approach employed in this study presents objective advantages for understanding climate extremes. By utilizing the thermodynamic energy equation (Equation (2)), this method enables a strict quantitative separation of large-scale horizontal temperature advection and vertical adiabatic heating. This three-dimensional perspective is physically logical in diagnosing the specific mechanisms sustaining the tropospheric thermal accumulation, successfully identifying the fundamental differences between the deep adiabatic warming in the 2022 event and the limited lower-level warming in the 2019 event.
Despite these advantages, several methodological limitations and uncertainties must be acknowledged. First, although the ERA5 reanalysis dataset is widely utilized in climate diagnostics, it inherently contains uncertainties, particularly regarding localized precipitation and surface energy budgets. In this study, these data biases have essential implications for the thermodynamic budget analysis. Specifically, the diabatic heating term is evaluated as a balancing residual in the thermodynamic energy equation (Equation (2)). Consequently, assimilation errors in the fundamental variables (e.g., wind, temperature, and vertical velocity fields) and discretization/truncation errors derived from the calculation of the horizontal advection and vertical adiabatic terms inevitably propagate into this residual diabatic heating term. As rigorously pointed out by recent studies [18,19], this term should be most accurately interpreted as an “apparent heat source” (which, under clear-sky subsidence, physically acts as a net radiational heat sink) rather than a purely observed physical radiative flux.
Second, the diagnostic approach based on monthly mean data assumes quasi-stationarity by setting the local temperature tendency term () to approximately zero. To theoretically verify this approximation without introducing sub-seasonal data noise, we performed a standard atmospheric scale analysis. For a typical monthly timescale (), the maximum possible local temperature variation () mathematically restricts the magnitude of to the order of to . This is one to two orders of magnitude smaller than the primary forcing components (e.g., the vertical adiabatic heating term, which reaches ∼10−5 K s−1, as shown in Figure 7 and Figure 8). Thus, neglecting the tendency term is mathematically and physically justified for balancing the dominant thermodynamic processes on a monthly scale. However, relying solely on monthly means inherently filters out sub-seasonal variability, meaning that the intra-seasonal evolution and transient extreme peaks of the CHDEs are not fully captured.
Nevertheless, considering the extreme intensity and broad spatial extent of the 2019 and 2022 CHDEs, the large-scale atmospheric anomaly signals overwhelmingly exceed the background data noise. Therefore, while the aforementioned uncertainties may introduce minor deviations in the precise magnitudes of local thermodynamic terms, the fundamental three-dimensional dynamical structures and thermodynamic mechanisms distinguishing these two events remain highly robust.
5. Conclusions
Based on high-resolution observations and the ERA5 reanalysis data, this study conducted a systematic three-dimensional comparative diagnosis of two typical CHDEs over the YRB in August 2022 and August 2019. Our results suggest the existence of two contrasting ocean–atmosphere pathways associated with these seemingly similar compound extremes. The primary findings are summarized as follows:
- (1)
- Differences in oceanic forcings and teleconnections: The basin-wide event in 2022 was highly associated with the combination of La Niña and NIOD, where robust anomalous latent heating over the tropical eastern Indian Ocean likely favored an extensive meridional Hadley circulation and corresponding easterly responses. In contrast, the localized event over the middle–lower YRB in 2019 occurred under a weak CP El Niño and intense PIOD, where the anomalous cooling source in the southeastern Indian Ocean weakened systematic subsidence and was accompanied by baroclinic Rossby wave trains.
- (2)
- Discrepancies in circulation configurations and moisture-blocking: The 2022 event featured a deep barotropic high-pressure belt, with an anomalous easterly wind band blocking southwest moisture transport. Conversely, the 2019 event was influenced by the large-scale wave train, featuring an anomalous offshore cyclone that utilized its peripheral northerly flow to sever moisture pathways.
- (3)
- Distinct thermodynamic budget mechanisms: In the monthly mean budget, the 2022 extreme heat was primarily maintained by robust, penetrative descending adiabatic warming (characterized by intense downward vertical circulation vectors), which sustained anomalous heat accumulation throughout the deep troposphere. During the 2019 event, owing to the lack of a penetrative adiabatic descending source (associated with shallower downward vertical circulation anomalies), the limited warming primarily balanced the cold advection and radiational cooling heat sink, resulting in lower thermal efficiency and a warming intensity distinctively confined to the central–eastern longitudes.
In summary, this comparative diagnosis highlights that while regional CHDEs over the YRB can present comparable surface severity, their physical sustenance mechanisms can be fundamentally distinct across multiple dimensions, including upstream oceanic forcings, synoptic configurations, and vertical thermodynamic budgets. Recognizing these dual pathways and their associated dynamics is crucial for improving the physical understanding and sub-seasonal prediction of compound climate extremes.
Author Contributions
Conceptualization, J.T. and T.F.; methodology, J.T., T.F. and Z.J.; validation, L.W.; formal analysis, J.T.; investigation, J.T. and T.F.; resources, L.W. and L.L.; data curation, Z.J.; writing—original draft preparation, J.T.; writing—review and editing, J.T., T.F., Z.J. and L.W.; Visualization, J.T.; supervision, L.L. All authors have read and agreed to the published version of the manuscript.
Funding
This work was supported by the Headquarters Science and Technology Project of State Grid Corporation of China (Grant No. 5200-202323473A-3-2-ZN).
Data Availability Statement
The monthly mean daily maximum temperature (Tmax) and monthly accumulated precipitation data utilized in this study were obtained from the National Cryosphere Desert Data Center (https://www.ncdc.ac.cn, accessed on 20 May 2026). The atmospheric reanalysis fields were retrieved from the ERA5 dataset of the European Centre for Medium-Range Weather Forecasts (ECMWF) (https://cds.climate.copernicus.eu, accessed on 20 May 2026). The climate indices for ENSO and the Indian Ocean Dipole (IOD) were provided by the National Climate Center of the China Meteorological Administration (https://cmdp.ncc-cma.net, accessed on 20 May 2026).
Acknowledgments
The authors gratefully acknowledge the dedicated contributions of all contributors to this work.
Conflicts of Interest
The authors declare no conflicts of interest.
References
- IPCC. Climate Change 2021: The Physical Science Basis; Contribution of Working Group I to the Sixth Assessment Report of the Intergovernmental Panel on Climate Change; Cambridge University Press: Cambridge, UK; New York, NY, USA, 2021. [Google Scholar]
- Zscheischler, J.; Westra, S.; Van Den Hurk, B.J.J.M.; Seneviratne, S.I.; Ward, P.J.; Pitman, A.; AghaKouchak, A.; Bresch, D.N.; Leonard, M.; Wahl, T.; et al. Future climate risk from compound events. Nat. Clim. Change 2018, 8, 469–477. [Google Scholar] [CrossRef] [Scilit]
- Zhang, M.; Dong, B.; Robson, J.; Schiemann, R. Anthropogenic influences on 2022-like summer heatwaves over the Yangtze River valley and projected changes in the likelihood of the event. Environ. Res. Commun. 2025, 7, 121008. [Google Scholar] [CrossRef] [Scilit]
- AghaKouchak, A.; Chiang, F.; Huning, L.S.; Love, C.A.; Mallakpour, I.; Mazdiyasni, O.; Moftakhari, H.; Papalexiou, S.M.; Ragno, E.; Sadegh, M. Climate extremes and compound hazards in a warming world. Annu. Rev. Earth Planet. Sci. 2020, 48, 519–548. [Google Scholar] [CrossRef] [Scilit]
- Zscheischler, J.; Martius, O.; Westra, S.; Bevacqua, E.; Raymond, C.; Horton, R.M.; van den Hurk, B.; AghaKouchak, A.; Jézéquel, A.; Mahecha, M.D.; et al. A typology of compound weather and climate events. Nat. Rev. Earth Environ. 2020, 1, 333–347. [Google Scholar] [CrossRef] [Scilit]
- Li, J.; Ding, T.; Jia, X.L.; Zhao, X.C. Analysis on the extreme heat wave over China around Yangtze River region in the summer of 2013 and its main contributing factors. Adv. Meteorol. 2015, 2015, 706713. [Google Scholar] [CrossRef] [Scilit]
- Ma, S.; Zhu, C.; Liu, J. Combined impacts of warm central Equatorial Pacific sea surface temperatures and anthropogenic warming on the 2019 severe drought in East China. Adv. Atmos. Sci. 2020, 37, 1149–1163. [Google Scholar] [CrossRef] [Scilit]
- Xu, K.; Miao, H.Y.; Liu, B.Q.; Tam, C.Y.; Wang, W.Q. Aggravation of record-breaking drought over the mid-to-lower reaches of the Yangtze River in the post-monsoon season of 2019 by anomalous Indo-Pacific oceanic conditions. Geophys. Res. Lett. 2020, 47, e2020GL090847. [Google Scholar] [CrossRef] [Scilit]
- Tang, S.K.; Qiao, S.B.; Wang, B.; Liu, F.; Feng, T.C.; Yang, J.; He, M.; Chen, D.; Cheng, J.B.; Feng, G.L.; et al. Linkages of unprecedented 2022 Yangtze River Valley heatwaves to Pakistan flood and triple-dip La Niña. npj Clim. Atmos. Sci. 2023, 6, 67. [Google Scholar] [CrossRef] [Scilit]
- Wang, R.; Li, X.; Ma, H.D.; Li, X.; Wang, J.C.; Lai, A.W. Persistent meteorological drought in the Yangtze River basin during summer–autumn 2022: Relay effects of different atmospheric internal variabilities. Atmosphere 2023, 14, 1402. [Google Scholar] [CrossRef] [Scilit]
- Tian, F.X.; Klingaman, N.P.; Dong, B.W. The driving processes of concurrent hot and dry extreme events in China. J. Clim. 2021, 34, 1809–1824. [Google Scholar] [CrossRef] [Scilit]
- Ha, K.J.; Seo, Y.W.; Yeo, J.H.; Timmermann, A.; Chung, E.S.; Franzke, C.L.E.; Chan, J.C.L.; Yeh, S.W.; Ting, M.F. Dynamics and characteristics of dry and moist heatwaves over East Asia. npj Clim. Atmos. Sci. 2022, 5, 49. [Google Scholar] [CrossRef] [Scilit]
- Lu, E.; Liu, S.Y.; Luo, Y.L.; Zhao, W.; Li, H.; Chen, H.X.; Zeng, Y.T.; Liu, P.; Wang, X.M.; Higgins, R.W.; et al. The atmospheric anomalies associated with the drought over the Yangtze River basin during spring 2011. J. Geophys. Res. Atmos. 2014, 119, 5881–5894. [Google Scholar] [CrossRef] [Scilit]
- Sun, S.J.; Li, D.L. Variability in the western Pacific subtropical high and its relationship with sea temperature variation considering the background of climate warming over the past 60 years. J. Trop. Meteorol. 2018, 24, 468–480. [Google Scholar]
- Wang, Z.Q.; Luo, H.L.; Yang, S. Different mechanisms for the extremely hot central-eastern China in July–August 2022 from a Eurasian large-scale circulation perspective. Environ. Res. Lett. 2023, 18, 024023. [Google Scholar] [CrossRef] [Scilit]
- Zhang, D.Q.; Chen, L.J.; Yuan, Y.; Zuo, J.Q.; Ke, Z.J. Why was the heat wave in the Yangtze River valley abnormally intensified in late summer 2022? Environ. Res. Lett. 2023, 18, 034014. [Google Scholar] [CrossRef] [Scilit]
- Miralles, D.G.; Teuling, A.J.; van Heerwaarden, C.C.; de Arellano, J.V.G. Mega-heatwave temperatures due to combined soil desiccation and atmospheric heat accumulation. Nat. Geosci. 2014, 7, 345–349. [Google Scholar] [CrossRef] [Scilit]
- Liu, Z.C.; Zhou, W. The 2019 autumn hot drought over the middle-lower reaches of the Yangtze River in China: Early propagation, process evolution, and concurrence. J. Geophys. Res. Atmos. 2021, 126, e2020JD033742. [Google Scholar] [CrossRef] [Scilit]
- An, X.H.; Sun, S.L.; Ma, Q.R.; Wu, H.; Li, D.Y.; Wu, W. Elucidating the varied characteristics of compound hot–drought from two distinctive extreme events in the Yangtze River valley. Int. J. Climatol. 2025, 45, e8809. [Google Scholar] [CrossRef] [Scilit]
- Zhang, W.J.; Jin, F.F.; Turner, A. Increasing autumn drought over southern China associated with ENSO regime shift. Geophys. Res. Lett. 2014, 41, 4020–4026. [Google Scholar] [CrossRef] [Scilit]
- Chen, Z.S.; Wen, Z.P.; Wu, R.G.; Lin, X.B.; Wang, J.B. Relative importance of tropical SST anomalies in maintaining the western North Pacific anomalous anticyclone during El Niño to La Niña transition years. Clim. Dyn. 2016, 46, 1027–1041. [Google Scholar]
- Li, C.X.; Zhao, T.B. Seasonal responses of precipitation in China to El Niño and positive Indian Ocean Dipole modes. Atmosphere 2019, 10, 372. [Google Scholar] [CrossRef] [Scilit]
- Zhang, Y.; Zhou, W.; Chow, E.C.H.; Leung, M.Y.T. Delayed impacts of the IOD: Cross-seasonal relationships between the IOD, Tibetan plateau snow, and summer precipitation over the Yangtze–Huaihe river region. Clim. Dyn. 2019, 53, 4077–4093. [Google Scholar] [CrossRef] [Scilit]
- Wang, B.; Wu, R.G.; Fu, X.H. Pacific-East Asian teleconnection: How does ENSO affect East Asian climate? J. Clim. 2000, 13, 1517–1536. [Google Scholar] [CrossRef] [Scilit]
- Yuan, Y.; Yang, H.; Zhou, W.; Li, C.Y. Influences of the Indian Ocean dipole on the Asian summer monsoon in the following year. Int. J. Climatol. 2008, 28, 1849–1859. [Google Scholar] [CrossRef] [Scilit]
- Chen, W.; Feng, J.; Wu, R.G. Roles of ENSO and PDO in the link of the East Asian winter monsoon to the following summer monsoon. J. Clim. 2013, 26, 622–635. [Google Scholar] [CrossRef] [Scilit]
- Cao, D.R.; Xu, K.; Huang, Q.L.; Tam, C.Y.; Chen, S.; He, Z.Q.; Wang, W.Q. Exceptionally prolonged extreme heat waves over South China in early summer 2020: The role of warming in the tropical Indian Ocean. Atmos. Res. 2022, 278, 106335. [Google Scholar] [CrossRef] [Scilit]
- Hersbach, H.; Bell, B.; Berrisford, P.; Hirahara, S.; Horányi, A.; Muñoz-Sabater, J.; Nicolas, J.; Peubey, C.; Radu, R.; Schepers, D.; et al. The ERA5 global reanalysis. Q. J. R. Meteorol. Soc. 2020, 146, 1999–2049. [Google Scholar] [CrossRef] [Scilit]
- Soci, C.; Hersbach, H.; Simmons, A.; Poli, P.; Bell, B.; Berrisford, P.; Horányi, A.; Muñoz-Sabater, J.; Nicolas, J.; Radu, R.; et al. The ERA5 global reanalysis from 1940 to 2022. Q. J. R. Meteorol. Soc. 2024, 150, 4014–4048. [Google Scholar] [CrossRef] [Scilit]
- Zhang, L.; Li, X.; Zheng, D.H.; Zhang, K.; Ma, Q.M.; Zhao, Y.B.; Ge, Y.C. Merging multiple satellite-based precipitation products and gauge observations using a novel double machine learning approach. J. Hydrol. 2021, 594, 125969. [Google Scholar] [CrossRef] [Scilit]
- Hu, Y.Y.; Zhang, L. Added value of merging techniques in precipitation estimates relative to gauge-interpolation algorithms of varying complexity. J. Hydrol. 2024, 645, 132214. [Google Scholar] [CrossRef] [Scilit]
- Hu, S.; Zhou, T.J.; Peng, D.D.; Jiang, W.Y.; Lu, B.; Wu, B.; Chen, X.L.; Zhang, L.X.; Zhang, W.X. Extreme dry advection dominates the record-breaking Yangtze River heatwave in midsummer of 2022. Clim. Dyn. 2024, 62, 5049–5060. [Google Scholar] [CrossRef] [Scilit]
- Rodwell, M.J.; Hoskins, B.J. Subtropical Anticyclones and Summer Monsoons. J. Clim. 2001, 14, 3192–3211. [Google Scholar] [CrossRef] [Scilit]
- Yanai, M.; Esbensen, S.; Chu, J.H. Determination of bulk properties of tropical cloud clusters from large-scale heat and moisture budgets. J. Atmos. Sci. 1973, 30, 611–627. [Google Scholar] [CrossRef] [Scilit]
- Qiao, L.; Zuo, Z.Y.; Zhang, R.H.; Piao, S.L.; Xiao, D.; Zhang, K.W. Soil moisture–atmosphere coupling accelerates global warming. Nat. Commun. 2023, 14, 4908. [Google Scholar] [CrossRef] [Scilit] [PubMed]
- Guo, Y.; Chen, H.S.; Dong, Y.S. Extreme compound drought and high temperature event in summer 2022 in the Yangtze River basin and possible contribution of land surface feedback. Chin. J. Atmos. Sci. 2025, 49, 229–244. (In Chinese) [Google Scholar]
- Seo, Y.W.; Ha, K.J.; Park, T.W. Feedback attribution to dry heatwaves over East Asia. Environ. Res. Lett. 2021, 16, 064003. [Google Scholar] [CrossRef] [Scilit]
- Chen, Y.; Wang, A.H. Role of land–atmosphere coupling in persistent extreme climate events in eastern China in summer 2022. Atmos. Ocean. Sci. Lett. 2024, 17, 100419. [Google Scholar] [CrossRef] [Scilit]

Disclaimer/Publisher’s Note: The statements, opinions and data contained in all publications are solely those of the individual author(s) and contributor(s) and not of MDPI and/or the editor(s). MDPI and/or the editor(s) disclaim responsibility for any injury to people or property resulting from any ideas, methods, instructions or products referred to in the content. |
© 2026 by the authors. Licensee MDPI, Basel, Switzerland. This article is an open access article distributed under the terms and conditions of the Creative Commons Attribution (CC BY) license.