


Abstract
The Three-River Source Region (TRSR) is an environmentally fragile area in China and on the Qinghai–Tibet Plateau that is extremely vulnerable to climate change. The time lag between climate change and vegetation responses in high-altitude regions is a critical component of ecosystem–climate coupling that has not yet been fully quantified. The purpose of this project is to look into the influence of extreme climatic change in the TRSR on vegetation development, as well as to give data support for vegetation restoration and ecological security on the Qinghai–Tibet Plateau. This study used normalized difference vegetation index (NDVI) data from the TRSR from 2000 to 2024 to investigate the pixel-level lag effects of 12 ETCCDI (Expert Team on Climate Change Detection and Indices) extreme climatic indices. Pixel-level maximum Pearson correlation analysis was used to determine the ideal lag period and correlation direction within an 0–6-month lag window, and the lag ratios for seven vegetation kinds were quantified in stratified order. The results show that precipitation, and not temperature, is the primary climatic limiting factor for changes in NDVI in the TRSR. Furthermore, there is a clear distinction between the temperature- and the precipitation-driven lag responses: temperature extreme indices have shorter average response times and highly polarized correlation directions (positive correlation proportions range from 1.0% to 95.9%), whereas precipitation extreme indices have longer average lags and are predominantly positively correlated. Vegetation types have a significant impact on lag sensitivity: grassland and desert respond faster, reflecting shallower root depths and limited soil moisture buffering capacity, whereas meadows and shrubland have the longest lags, consistent with the water-holding capacity promoted by deeper root systems and higher soil organic matter. These findings contribute to our understanding of time-structured vegetation–climate coupling and provide a solid scientific foundation for proactive vegetation management in the TRSR to meet future extreme climate events.
1. Introduction
Global climate change has had a significant impact on terrestrial ecosystems. According to the IPCC’s (Intergovernmental Panel on Climate Change) Sixth Assessment Report, rising global temperatures have elevated extreme weather occurrences to the status of major disasters in the twenty-first century. Extreme climate events, such as heat waves, extreme precipitation, and droughts, are becoming more frequent and intense [1], posing a significant threat to ecosystem stability and reshaping the structure of terrestrial ecosystems by affecting vegetation productivity, species distribution, and community structure [2]. Global warming has increased the possibility of compound severe events such as heat waves, torrential rains, and flooding, and their consequences have shifted from the isolated effects of single disasters to the spatiotemporal overlap of several catastrophes [3].
Vegetation is essential for preserving ecosystem biodiversity, conserving soil and water resources, and climate regulation [4]. Climate plays a crucial role in vegetation dynamics, and extreme climate events have a more severe and unpredictable impact on vegetation than regular climatic conditions, with marked regional heterogeneity [5,6]. Extreme droughts can trigger widespread tree mortality and reduce ecosystem carbon sequestration capacity [7], while prolonged high temperatures can limit photosynthesis and worsen soil moisture deficits, diminishing vegetation cover and productivity [8]. At the same time, vegetation’s reaction to climate is typically delayed, with a large time-lag effect, implying that current vegetation status is influenced by the residual impacts of previous climatic conditions [9]. On a global scale, Wu et al. [10] found that accounting for time-lag effects raised the explanatory power of climatic factors for vegetation growth from 53% to 64%. Similarly, Ding et al. [11] identified a synergistic interplay between time-lag and cumulative effects; after incorporating these two temporal effects, the explanatory power of climate for vegetation NDVI variability increased from 17 to 19%. These results show that neglecting time-lag effects considerably underestimates the true strength of the climate–vegetation interactions. Therefore, studying the impact of the extreme climate events on ecosystems can help us adapt to such events or mitigate their negative effects.
The NDVI is a widely used remote-sensing indicator for analyzing vegetation dynamics [12], as well as for research on vegetation changes and their underlying causes [13,14,15]. Extreme climatic events are more destructive and less predictable than typical climatic impacts [16,17]. According to research findings, an increased frequency of extreme climate events may cause plant damage and have a substantial impact on vegetation development [18,19,20]. For example, Chen et al. [21] examined the relative effects of climate change and human activities on arid and semi-arid grasslands in Central Asia between 1982 and 2015. They discovered that precipitation was the dominant climatic element impacting grassland variations across most of Central Asia. Reduced precipitation leads to lower photosynthetic efficiency, which inhibits vegetation activity and reduces organic matter, thereby inhibiting grassland growth. Luo et al. [22] evaluated the impact of extreme climate indices on vegetation dynamics in Central Asia and discovered that the region is predominantly mountainous, with seasonal extreme weather events growing more frequent. Gao et al. [23] investigated the impact of seasonal extreme weather on autumn phenology in Central Asian grasslands and discovered that high precipitation and heat waves accelerated autumn phenology. Hu et al. [24] investigated Central Asia’s alpine grassland regions and discovered a pattern of increasing warm nights and warm days, followed by a decrease in cold nights and days. A study of the Tarim Basin (2000–2022) shows that the synergistic impacts of extreme climate indices on ecosystem quality (EQI) outweigh those of individual climate extremes, with particularly strong effects reported in forest and shrub ecosystems [25]. When assessing climate change and its effects on vegetation, these studies frequently miss the time-lag effects of vegetation growth on climate factors, as well as the time-lag effects of climate extremes themselves, which may result in an underestimation of the effects of climate change.
In recent years, the time-lag effects of extreme weather on vegetation have been documented across multiple regions. Studies on grasslands in northern China have revealed that the time-lag effects of heavy precipitation events on the NDVI can persist up to 2–4 months, whereas the impacts of extreme heat are more immediate and short-lived [5]. In the Loess Plateau region, drought’s cumulative and time-lag effects on vegetation have been identified as key drivers of grassland deterioration [26]. However, prior research has been concentrated on temperate and arid regions, with little attention dedicated to alpine ecosystems. In particular, there is a scarcity of systematic examinations of the time-lag effects on vegetation using extreme climatic indices (rather than standard climate averages). Methodologically, most time-lag analyses are performed exclusively at the regional mean scale, ignoring spatial variation at the pixel level [11], which precludes the identification of spatial patterns in lag durations.
The TRSR is critical for preserving ecological security and biodiversity owing to its diversified flora, which is vulnerable to climate change and varies seasonally and spatially. Currently, the time-lag effects of extreme climatic events in the TRSR are unknown, and there is no quantitative characterization of the ideal lag periods, response directions, or spatial patterns for various extreme climate indices. In this study, we derived 12 ETCCDI extreme climate indices using MODIS NDVI data as well as daily temperature and precipitation records from 2000 to 2024. To further understand vegetation dynamics and their reaction to extreme climate events, we used Theil–Sen trend analysis, Mann–Kendall significance testing, Pearson correlation analysis, and pixel-level lag correlation analysis over time periods spanning from 0 to 6 months. The study intends to achieve the following aims: (1) examine the interannual variation patterns of vegetation dynamics in the TRSR; (2) determine the spatiotemporal evolution characteristics of the NDVI and extreme climate indices in the TRSR; (3) quantify the differences in the responses of different vegetation types to extreme climate indices; (4) determine the best time-lag window and rigorously investigate the time-lagged response and spatial patterns of vegetation to extreme climate events. The research findings can serve as a scientific foundation for the adaptive management of vegetation in alpine ecosystems in response to extreme climate events.
2. Materials and Methods
2.1. Overview of the Study Area
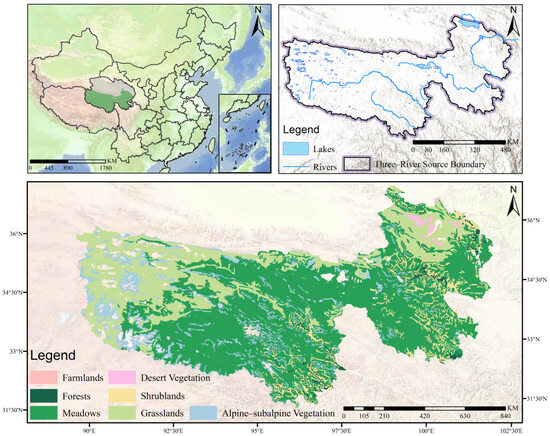
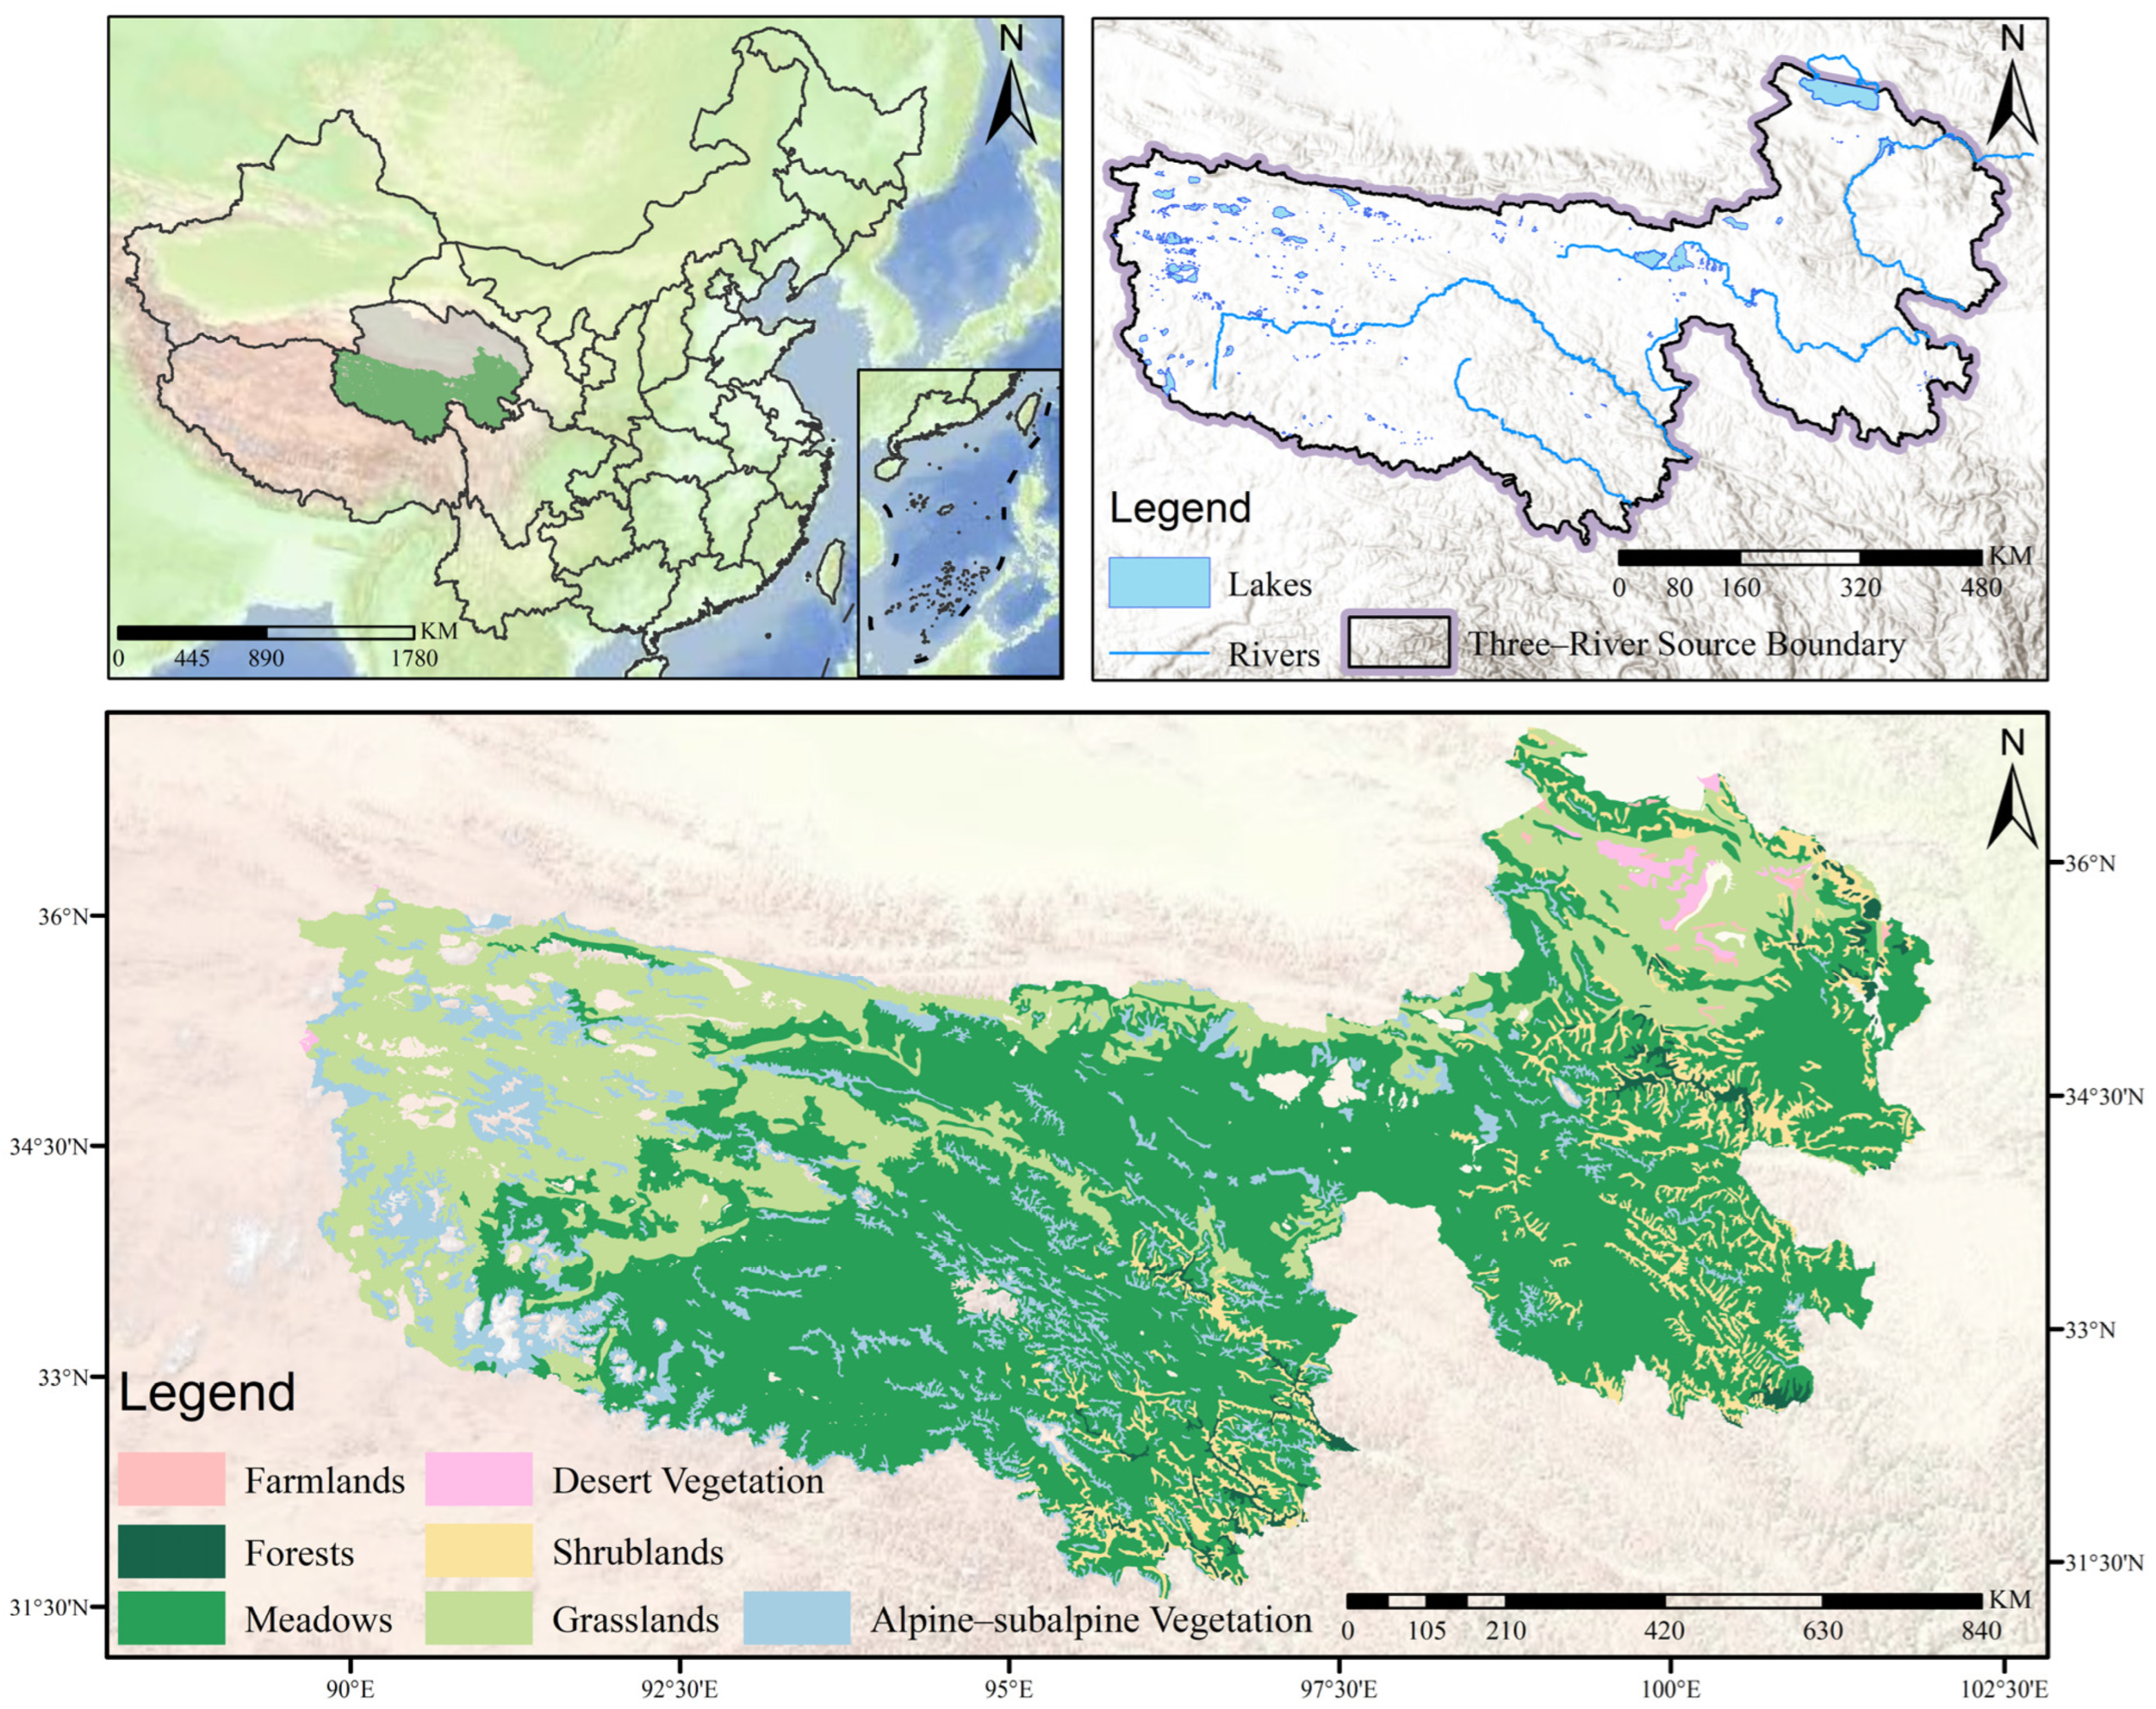
The TRSR, located in the center of the Qinghai–Tibet Plateau in southern Qinghai Province, is the source of the Yangtze, Yellow, and Lancang rivers [27]. The region features high-altitude mountainous terrain with complex topography, an average elevation of 3500 to 4800 m, and a climate typical of the Qinghai–Tibet Plateau [28]. It is one of the world’s highest-altitude, largest, and most ecologically diverse wetland habitats, characterized by a dense network of rivers, lakes, and marshes interspersed with snow-capped mountains and glaciers. It is known as the “Water Tower of Asia”. Because of its exceptionally fragile natural environment, the TRSR has been designated as a priority area for China’s ecological and environmental preservation programs (Figure 1).
Figure 1.
Overview of the study area.
2.2. Datasets
2.2.1. NDVI Datasets
MODIS NDVI data were obtained from the NASA Land Processes Distributed Data Archive Center (LP DAAC; https://www.earthdata.nasa.gov/, accessed on 6 December 2025) derived from the MOD13A3 vegetation index product, and cover the period 2000–2024 at a spatial resolution of 1 km. The MOD13A3 product employs a weighted temporal averaging approach to generate monthly composited data from the 16-day MOD13A2 products. To assure data quality, preprocessing involved geometric correction, radiometric calibration, and strip-removal filtering [29,30]. Data were cropped and filtered using Python 3.8. Monthly maximum NDVI composites for the growing season (May–September) were generated via the maximum-value composite method to minimize cloud contamination and atmospheric interference while preserving peak vegetation greenness. The processed products were subsequently masked to the administrative boundaries of the TRSR using ArcGIS 10.8. Two sets of NDVI time series were constructed: (i) monthly growing season NDVI (May–September) for time-lag correlation analysis with monthly extreme climate indices, and (ii) annual NDVI (mean growing-season value) for long-term trend analysis.
2.2.2. Meteorological Datasets
Daily meteorological data, including minimum temperature (Tmin), maximum temperature (Tmax), and precipitation, were obtained from the National Qinghai-Tibet Plateau Scientific Data Center (https://data.tpdc.ac.cn/, accessed on 6 December 2025) at a spatial resolution of 1 km for the period 2000–2024 [31]. These gridded datasets were created by spatially interpolating quality-controlled observations from meteorological stations using the Delta downscaling method, with the PRISM climatic state serving as the baseline. ETCCDI specified 27 key extreme climate indices [32]; from these, a concise yet representative subset was selected by screening for multicollinearity using variance inflation factor (VIF) analysis. The VIF is calculated using the following formula:
where is the coefficient of determination for the i-th independent variable when compared to the other independent variables. A higher R2 value indicates greater multicollinearity of the variable.
A VIF value exceeding 10 is generally considered indicative of multicollinearity, necessitating the elimination of the relevant variables. Finally, we selected 12 extreme climate indices for subsequent analysis (Table 1). Among these, six indices pertain to temperature extremes, whereas the remaining six correspond to precipitation extremes. All indices were generated at the pixel level from daily gridded climate data using the RClimDex program (Version 1.0), following the ETCCDI standardization methodology.
Table 1.
Detailed information on 12 extreme climate indicators.
2.2.3. Vegetation Cover Dataset
Vegetation type data were obtained from the MODIS MCD12Q1 dataset at 500 m spatial resolution. Using a reclassification technique, the original 17 IGBP categories were reclassified into seven ecologically meaningful vegetation types specific to the TRSR: farmland, forest, grassland, meadow, shrubland, alpine–subalpine vegetation, and desert vegetation. Built-up regions, water bodies, and permanent snow/glaciers were masked as non-vegetation pixels and omitted from subsequent analyses. The reclassified vegetation categories were resampled to 1 km resolution using nearest-neighbor interpolation to match the NDVI and climate data grids.
2.3. Research Protocol
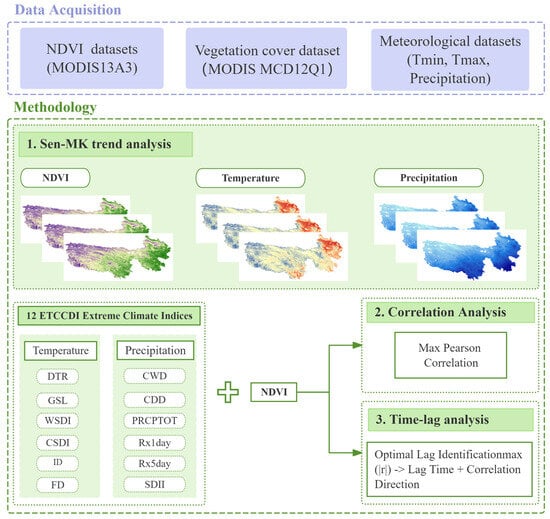
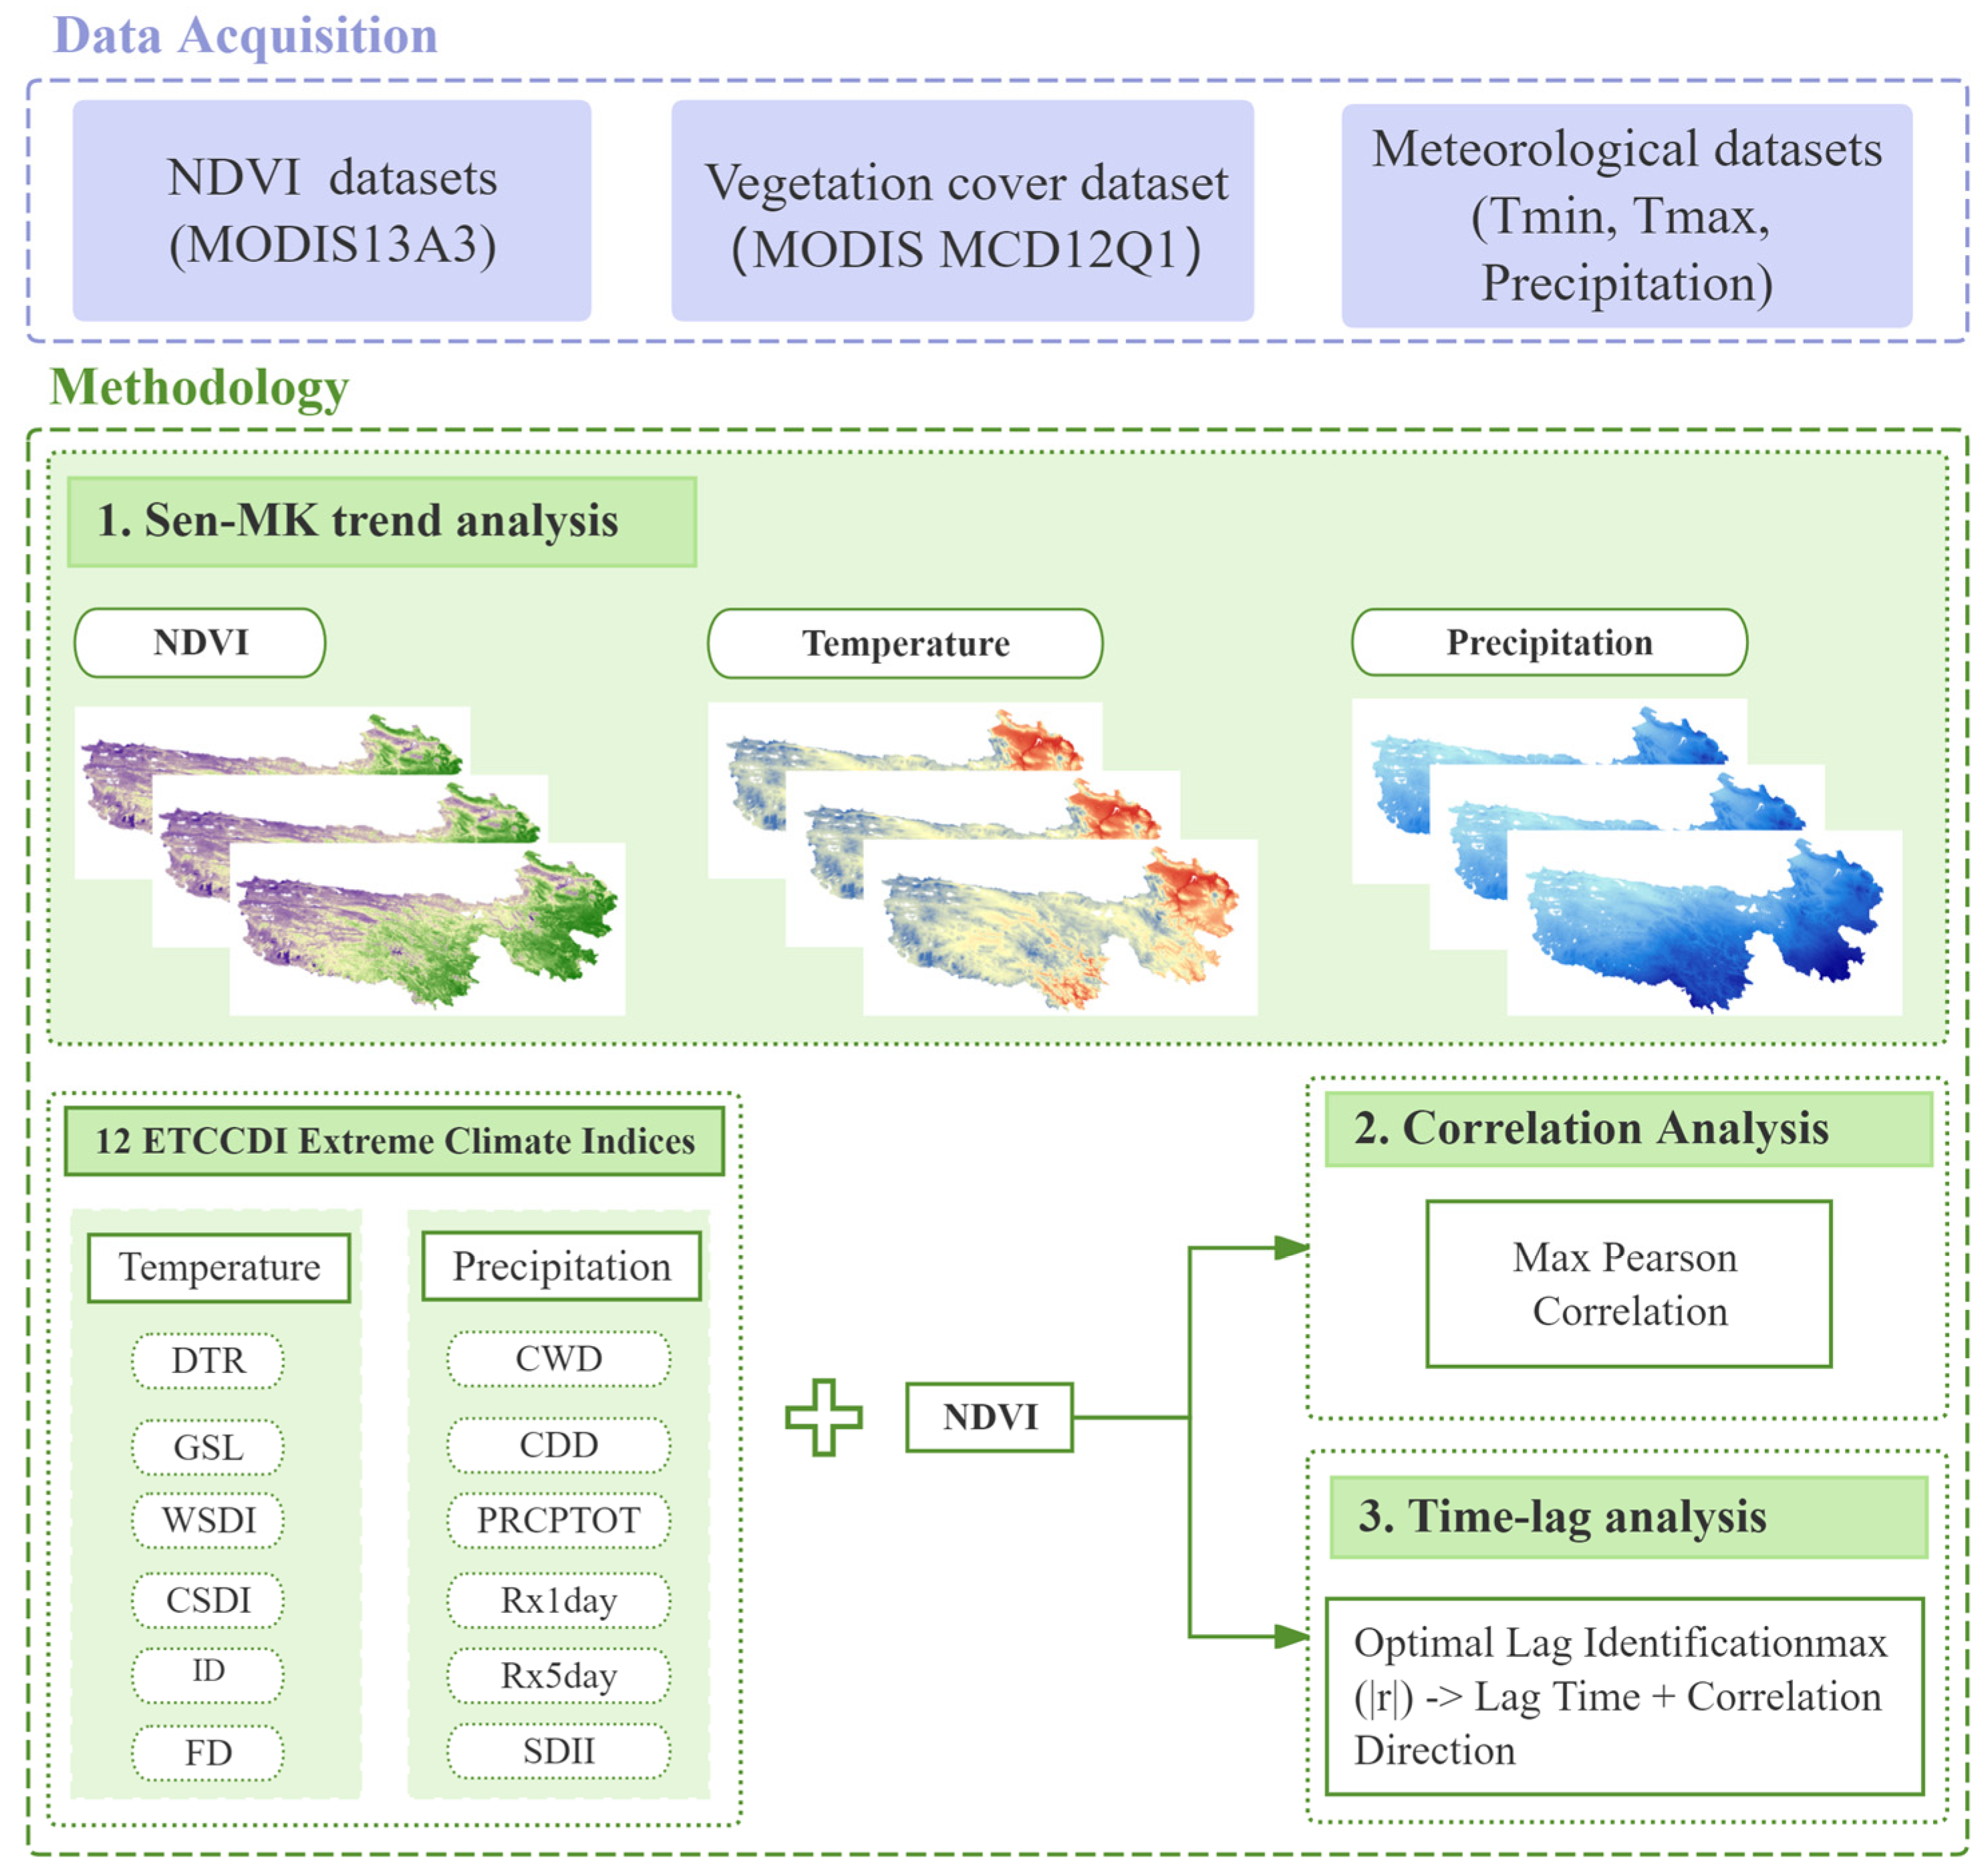
The integrated analytical framework provided in this study consists of three steps (Figure 2): (1) Using MODIS MOD13A monthly NDVI data and ERA5-Land daily climate reanalysis data for the TRSR from 2000 to 2024, we calculated 12 ETCCDI-defined extreme climate indices with RClimDex, thereby constructing a multi-factor spatiotemporal dataset of vegetation and climate for the region. (2) Using the Theil–Sen slope estimation method and the Mann–Kendall significance test, we performed a pixel-scale trend analysis of annual NDVI in the TRSR over 2000 to 2024, along with statistical analysis of the area proportion and spatial differentiation characteristics of NDVI trends across different vegetation types and regions. (3) Using the maximum Pearson correlation coefficient method, we estimated the correlation coefficients between the monthly maximum NDVI and each extreme climate index on a pixel-by-pixel basis for lag times from 0 to 6 months. We determined the ideal response lag period and comprehensively exposed the time-lag reaction and spatial patterns of distinct vegetation types in the TRSR to various extreme climate indices.
Figure 2.
Research framework.
2.4. Methodology
2.4.1. Theil–Sen Median Trend Analysis
In this study, we employed the Theil–Sen (Sen) trend analysis method to quantitatively assess long-term time trends during 2000–2024. As a non-parametric statistical method for trend analysis, the Sen trend method does not assume any specific data distribution, effectively mitigates the impact of outliers, and is suitable for analyzing trends in long-term remote-sensing raster data [33,34]. The computation formula is given below:
where β represents the Sen trend coefficient, indicating the degree of upward or downward trend in the sequence; median denotes the median operation; n = 25 is the total number of years; and NDVIi and NDVIj respectively denote the normalized difference vegetation index for time series i and j. When β is greater than zero, an upward trend is present; conversely, when the slope β is less than zero, a downward trend is present.
2.4.2. Mann–Kendall (M-K) Test
The Mann–Kendall (MK) test is a non-parametric test that determines the statistical significance of a monotonic trend without assuming anything about the data’s distribution [35]. The test statistic S is computed as follows:
The standardized test statistic Z is the major measure used in this test to assess the trend and relevance of time series data; it is calculated from S and Var(S). sgn(θ) provides a logical discrimination function, and it is defined as sign(θ) = +1 for θ > 0, sign(θ) = 0 for θ = 0, and sign(θ) = −1 for θ < 0. If |Z| is more than 1.96, the test is judged statistically significant. The computation formula is given below:
where S denotes the test statistic; n = 25 is the total number of years; NDVIi and NDVIj denote the corresponding values of NDVI for the i^(th) and j^(th) time series, respectively, where i < j; Var(S) is the variance; and Z represents the test statistic. If |Z| ≥ 1.96, it indicates that at the confidence level (significance level), the time series data exhibits a significant upward or downward trend.
Based on the results of Sen trend analysis and M-K significance tests, and with reference to the relevant literature, vegetation change trends on the Qinghai–Tibet Plateau are classified into five types according to actual conditions: significantly degraded (β < 0, Z ≤ −1.96), non-significantly degraded (β < 0, −1.96 < Z < 0), stable (β = 0, Z = 1.96), non-significantly improved (β > 0, 0 < Z < 1.96), and significantly improved (β > 0, 1.96 ≤ Z).
2.4.3. Correlation Analysis
The Pearson correlation coefficients (Rs) between vegetation NDVI and meteorological factors were computed using correlation analysis [36]. The lag month corresponding to the maximum absolute correlation coefficient was selected as the optimal lag time for climate influence on vegetation NDVI. The R-value was computed as follows:
where and represent the mean values of these two variables, while Rxy denotes the correlation coefficient between their monthly values. A stronger correlation corresponds to a larger negative or positive value (ranging from −1.0 to 1.0), R = 0 denotes a nonlinear correlation, whereas its square root (r) represents the degree of correlation between the NDVI and the time variable. A correlation study was carried out at the pixel level for each extreme climatic index over a 25-year period (2000–2024). All computations were done in Python 3.8 with the NumPy and SciPy modules.
2.4.4. Time-Lag Analysis Between Vegetation and Extreme Climate Indices
Time-lag analysis determines the lag period during which extreme climate indices exert the greatest impact on vegetation activity [9]. For each pixel p and each extreme climate index X, we computed the Pearson correlation coefficient Ri (i = 0, 1, …, 6) between the monthly growing-season NDVI time series (May–September; 5 months × 25 years = 125 observations) and the corresponding climate index time series lagged by i months [9,37]. The formula is as follows:
where Ri denotes the correlation coefficient at lag i months, Ni represents the temperature and precipitation values at lag i months, and Rmax−lag indicates the maximum value of the correlation coefficient. A lag window of 0–6 months was used to capture vegetation responses on both an intra-seasonal (instantaneous) and inter-seasonal (seasonal) scale. The maximum lag of 6 months corresponds to a half-year seasonal transition, enabling the detection of inter-seasonal carryover effects (for example, winter temperatures or earlier precipitation influencing summer vegetation via soil moisture memory and phenological preconditions). Lags exceeding 6 months were excluded to avoid an excessive reduction in sample size for the corresponding analyses.
3. Results
3.1. Interannual Variation Trends of NDVI and Climatic Indices
3.1.1. Long-Term Trends of NDVI and Climatic Indices
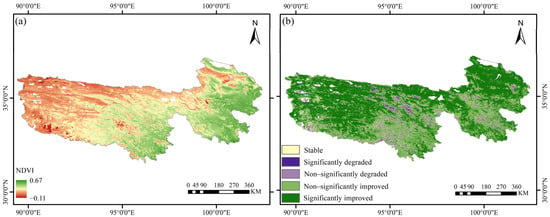
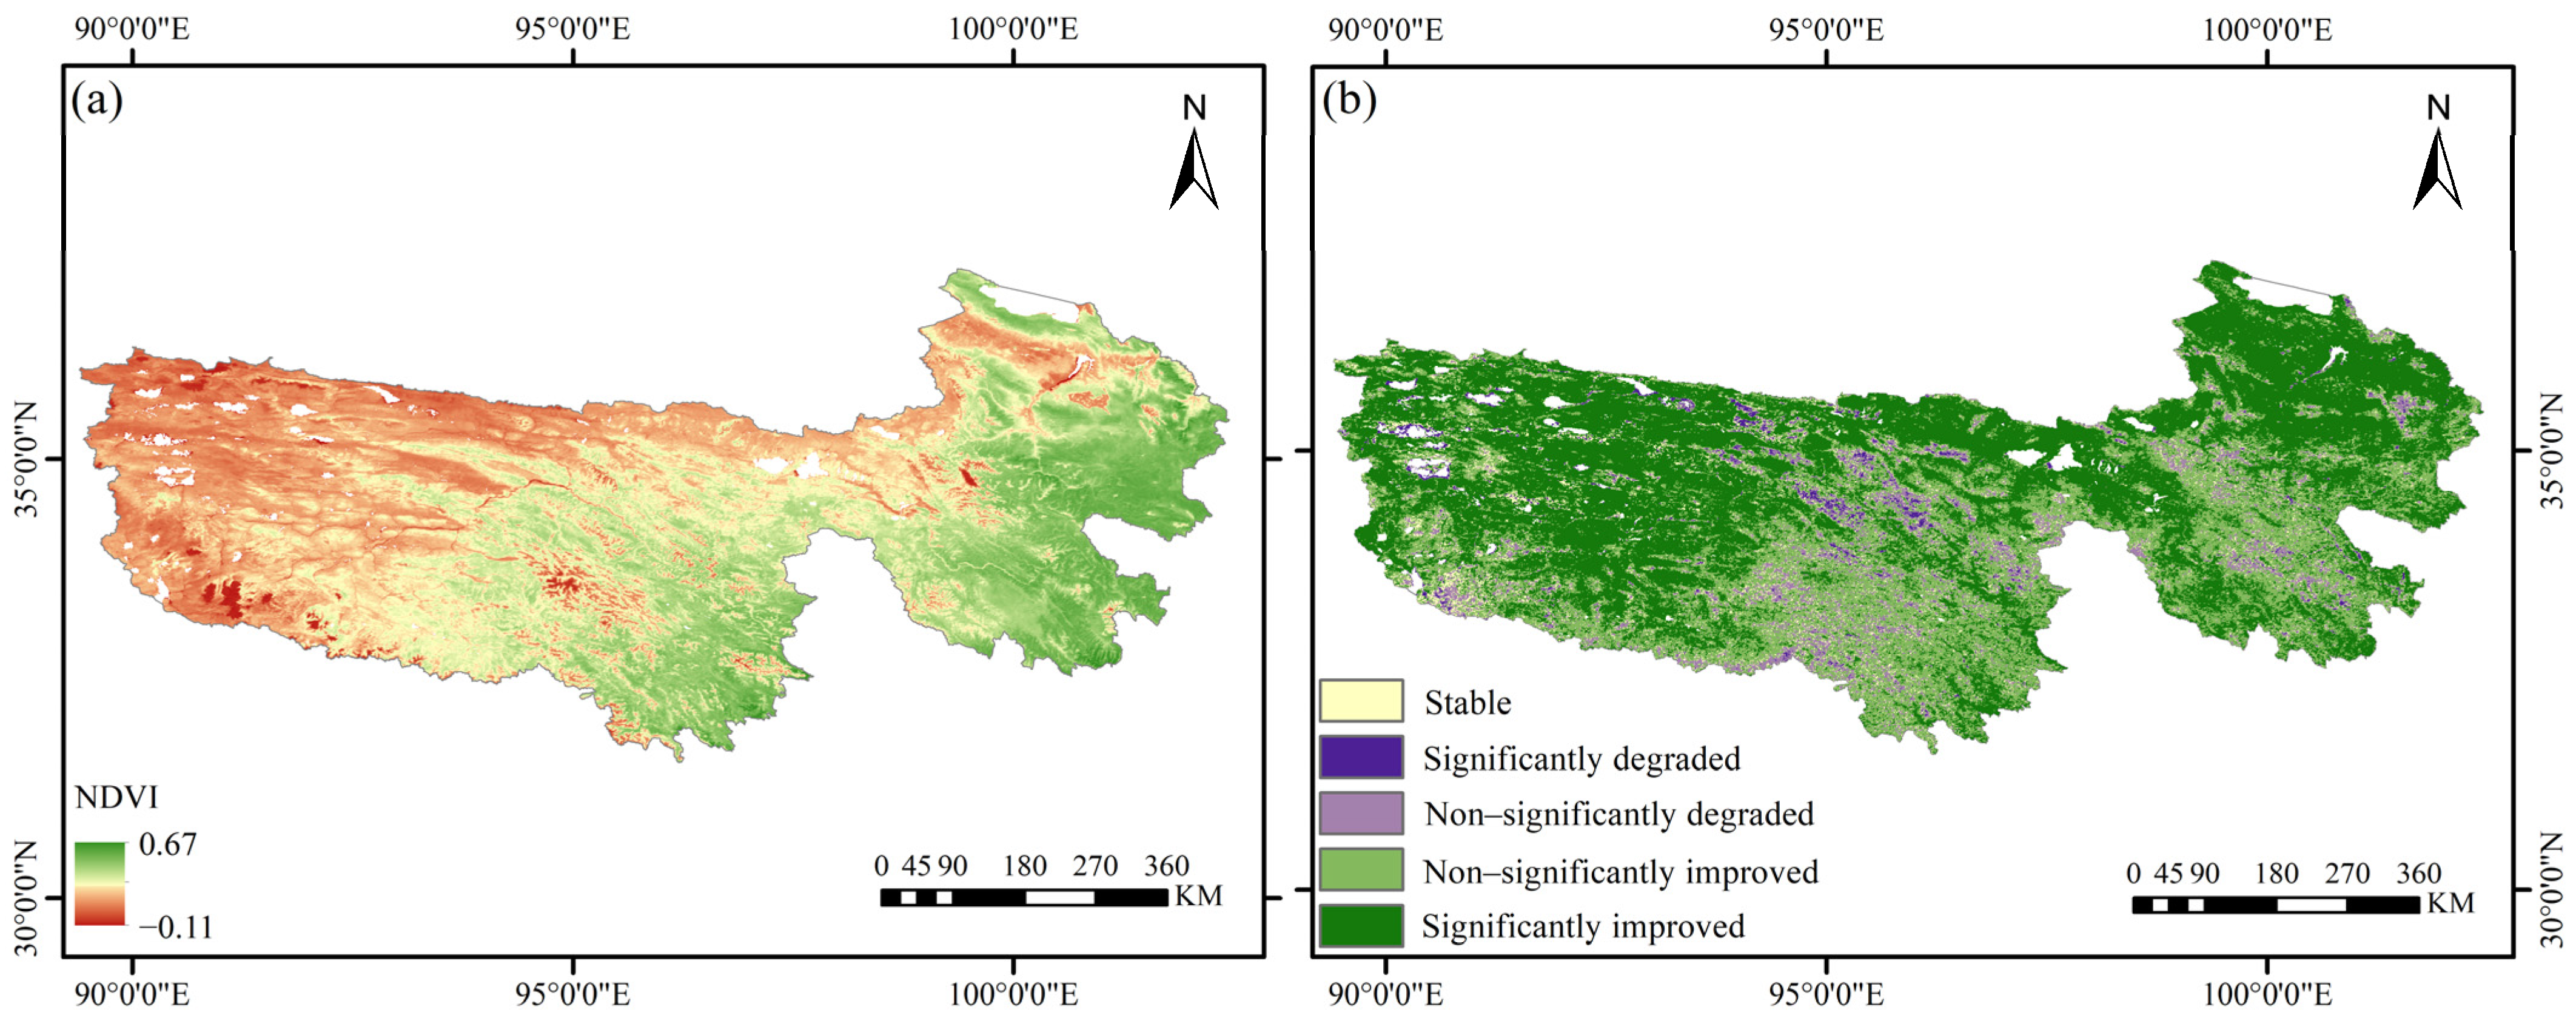
The annual mean NDVI in the TRSR exhibited a decreasing gradient from southeast to northwest over the period 2000–2024, with values ranging from −0.1 to 0.66 (Figure 3a). The highest NDVI values occurred in the alpine meadows of Banma–Jiuzhi County in the southeastern TRSR, whereas the lowest values were found in the Hoh Xil Desert to the west. Figure 3b depicts the results of Theil–Sen slope estimation and Mann–Kendall significance testing applied to interannual NDVI trends across the TRSR. In the region’s vegetation zones, 52.86% (approximately 201,000 km2) exhibited a significant upward trend in NDVI, while 36.92% (approximately 140,700 km2) showed a non-significant increasing trend. Only 1.24% (approximately 4700 km2) showed a significant decreasing trend. Areas with pronounced declines were concentrated in the northern half of Qumalai County, which may be due to lake growth flooding grasslands and localized grazing pressure.
Figure 3.
NDVI changes in the Three-River Source Region from 2000 to 2024. (a) Spatial distribution of the 25-year average NDVI; (b) spatial distribution of annual NDVI significance levels.
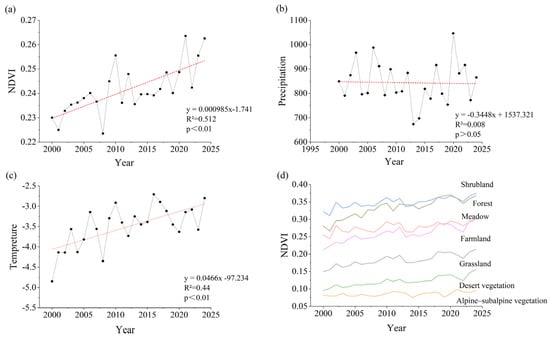
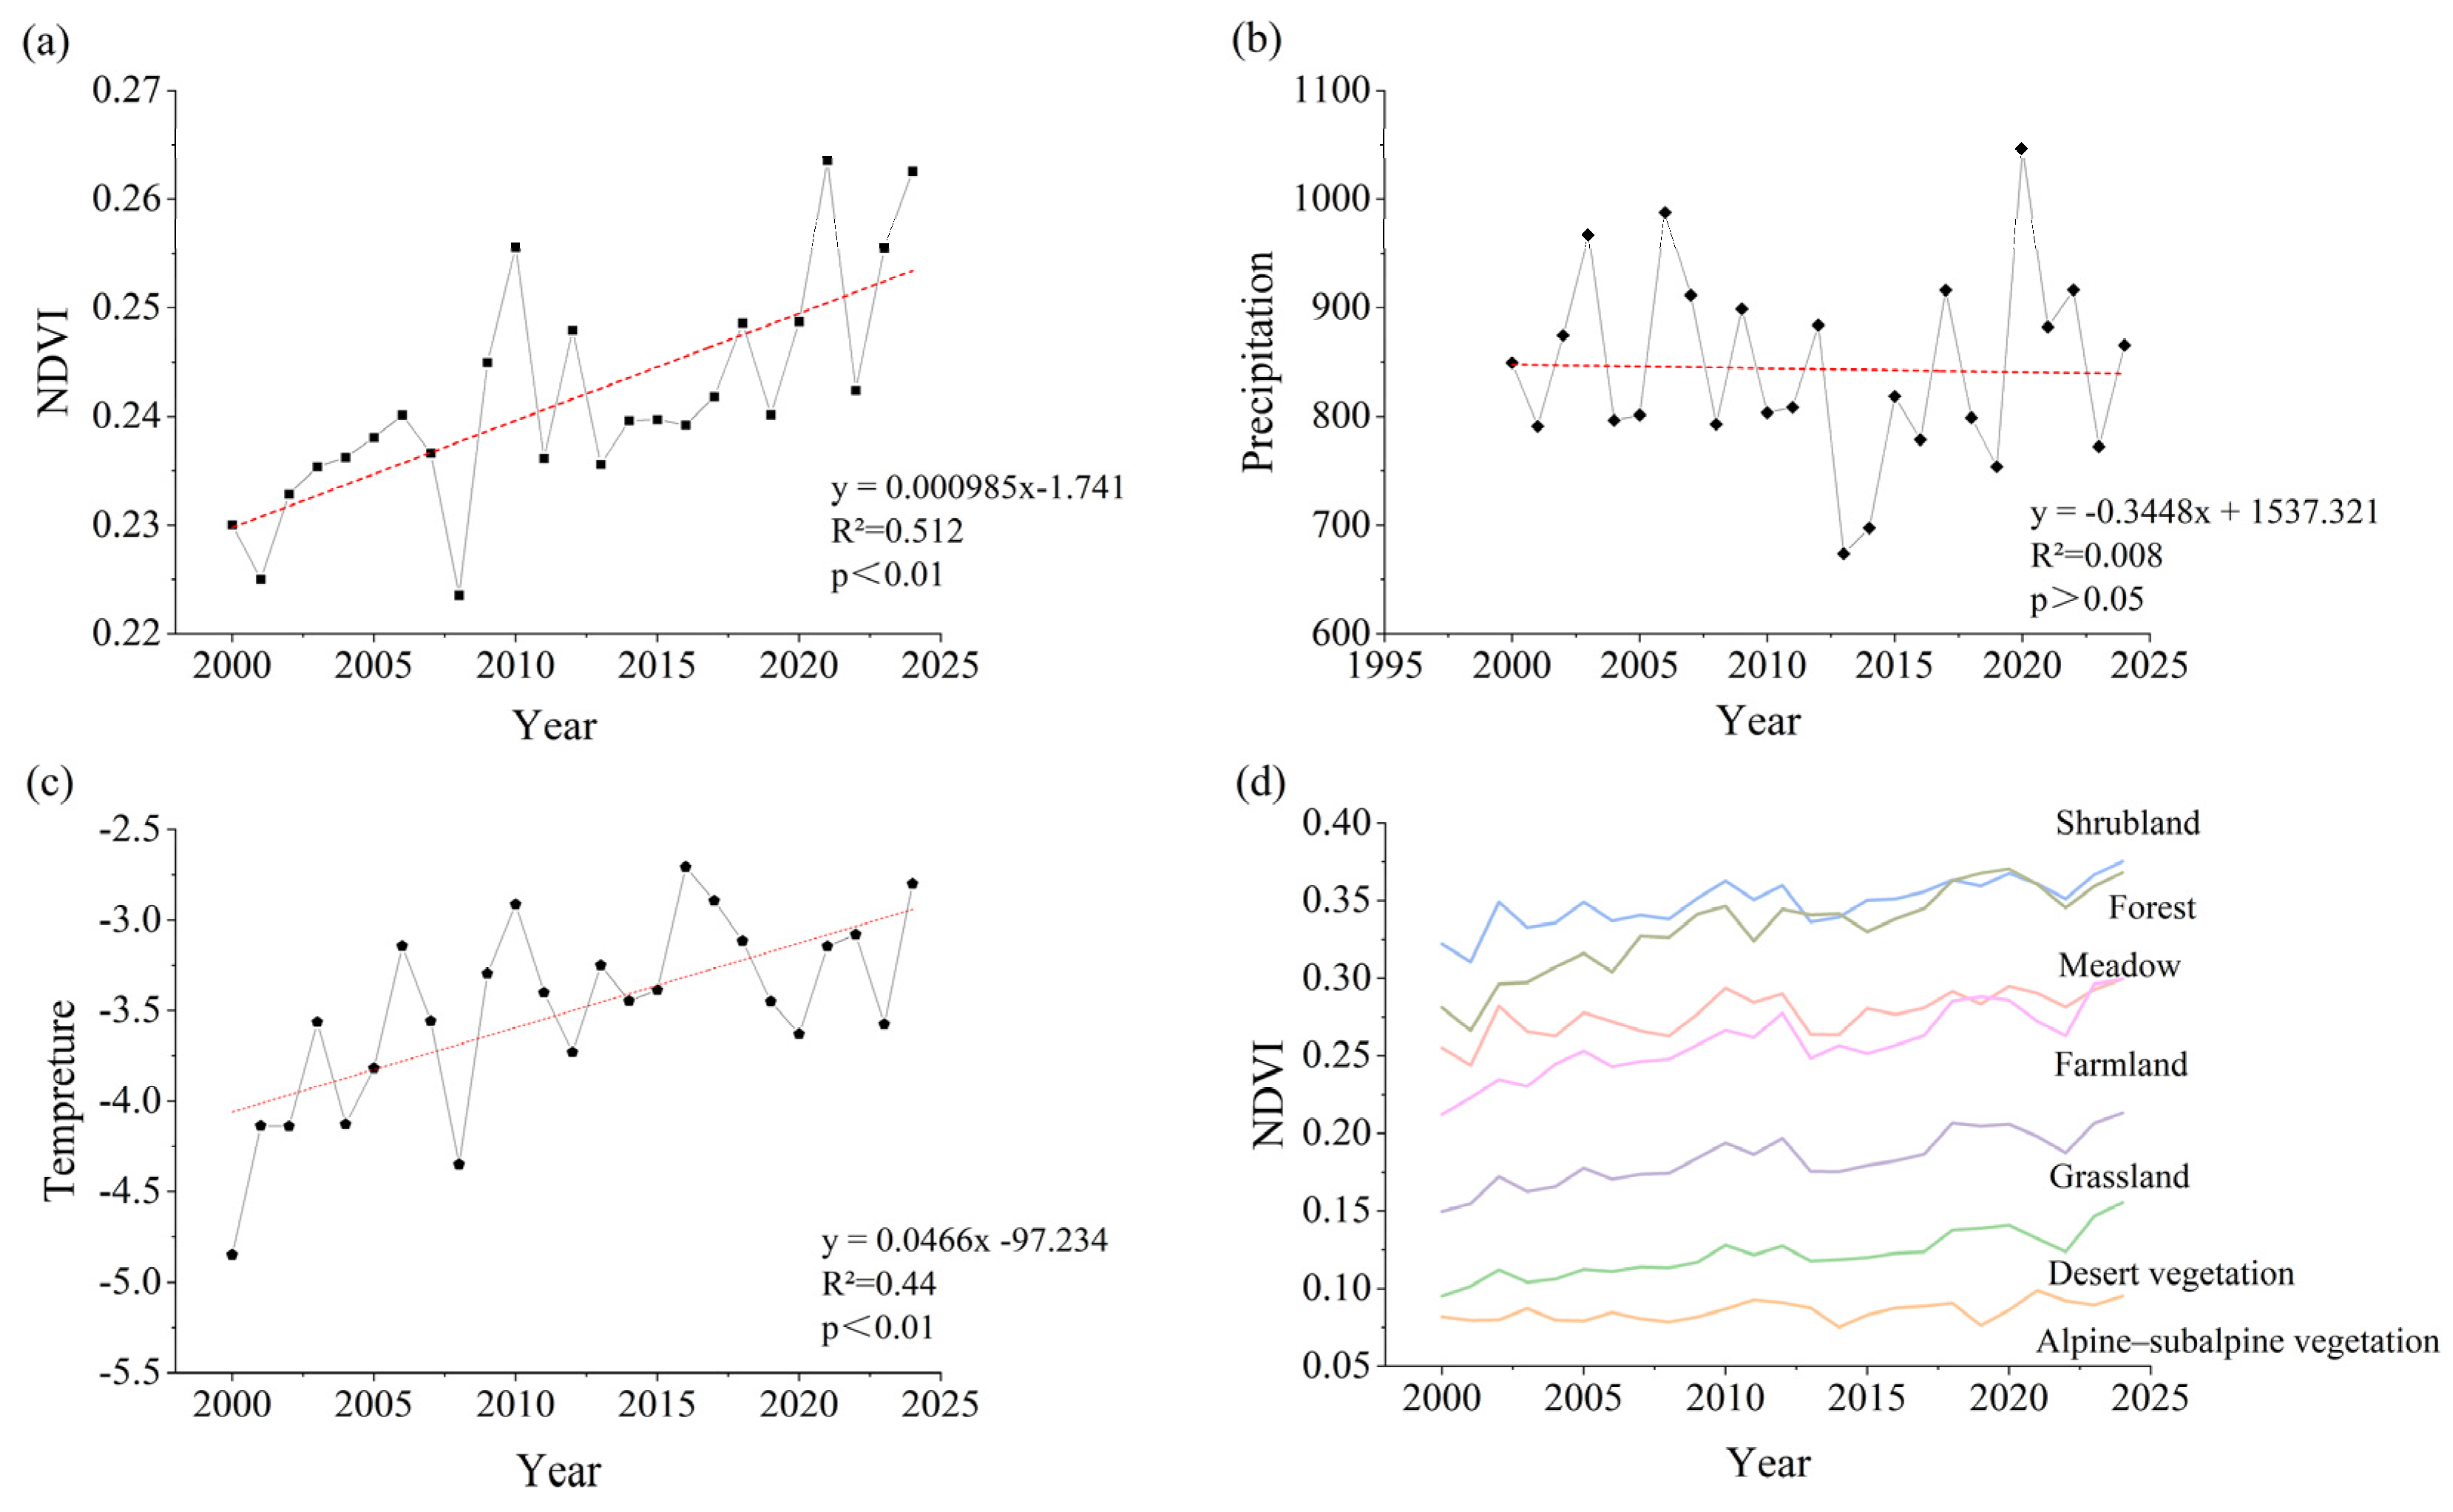
Figure 4a shows that the regional average annual NDVI increased from 0.249 to 0.262, showing a significant upward trend at a rate of 0.000985 per year (p < 0.01), and peaked in 2021. Figure 4b shows that annual precipitation exhibited a decreasing trend, with a multi-year average of 843.6 mm and a decrease of 0.3448 mm per year (p > 0.05). The annual mean temperature showed a significant upward trend at a rate of 0.0466 °C per year (p < 0), and reached its maximum of −2.71 °C in 2024. In addition, the NDVI values for different vegetation types indicated a highly significant rising trend (p < 0.01), with particularly pronounced fluctuations during 2012–2017. Forest, farmland, grassland, desert vegetation, shrubland, meadow, and alpine–subalpine vegetation were graded ranked by their greening rates. Farmland exhibited the fastest greening rate, while alpine–subalpine vegetation grew the slowest, indicating that different vegetation communities respond differently to environmental changes within alpine ecosystems.
Figure 4.
Climate and NDVI changes in the Three-River Source Region, 2000–2024. (a) Regional annual NDVI; (b) regional precipitation time series; (c) regional temperature time series; (d) regional NDVI time series changes for different vegetation types.
3.1.2. Climate Sensitivity by Vegetation Type
Pearson and partial correlation analyses were used to quantify the response of vegetation to climate factors in the TRSR. The results (Table 2) show that the partial correlation of temperature with NDVI (r = 0.140) is weaker than that of precipitation (r = 0.302), implying that precipitation is the dominant climatic factor of vegetation greening in the TRSR, with temperature playing a secondary role. Meanwhile, the vegetation type-specific climate sensitivity analysis (Table 3) reveals that different vegetation types exhibit differential sensitivities: meadows and alpine–subalpine vegetation are primarily temperature-limited, reflecting cold limitations at high elevations, whereas farmland and forest are more dependent on precipitation, consistent with their higher water demands.
Table 2.
NDVI–climate correlation coefficient.
Table 3.
Climate sensitivity of vegetation types.
3.2. Correlation Between NDVI and Extreme Climate Indices
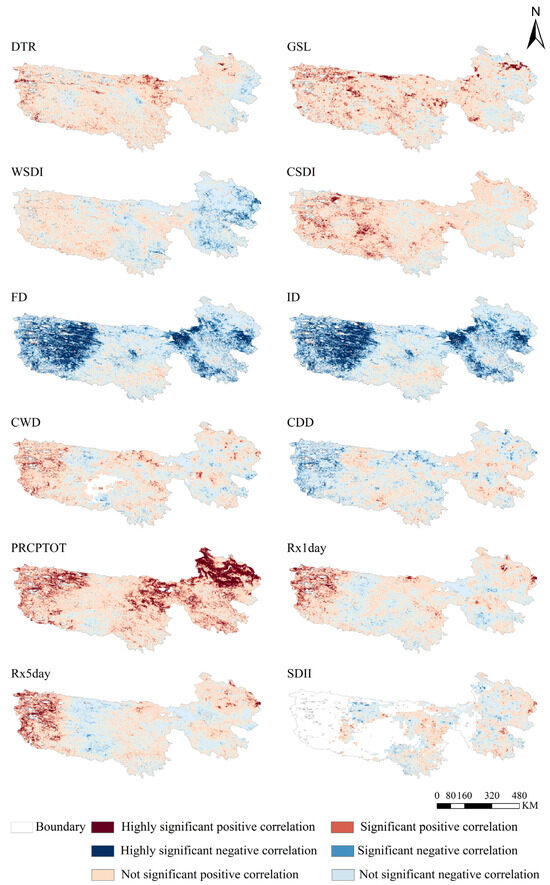
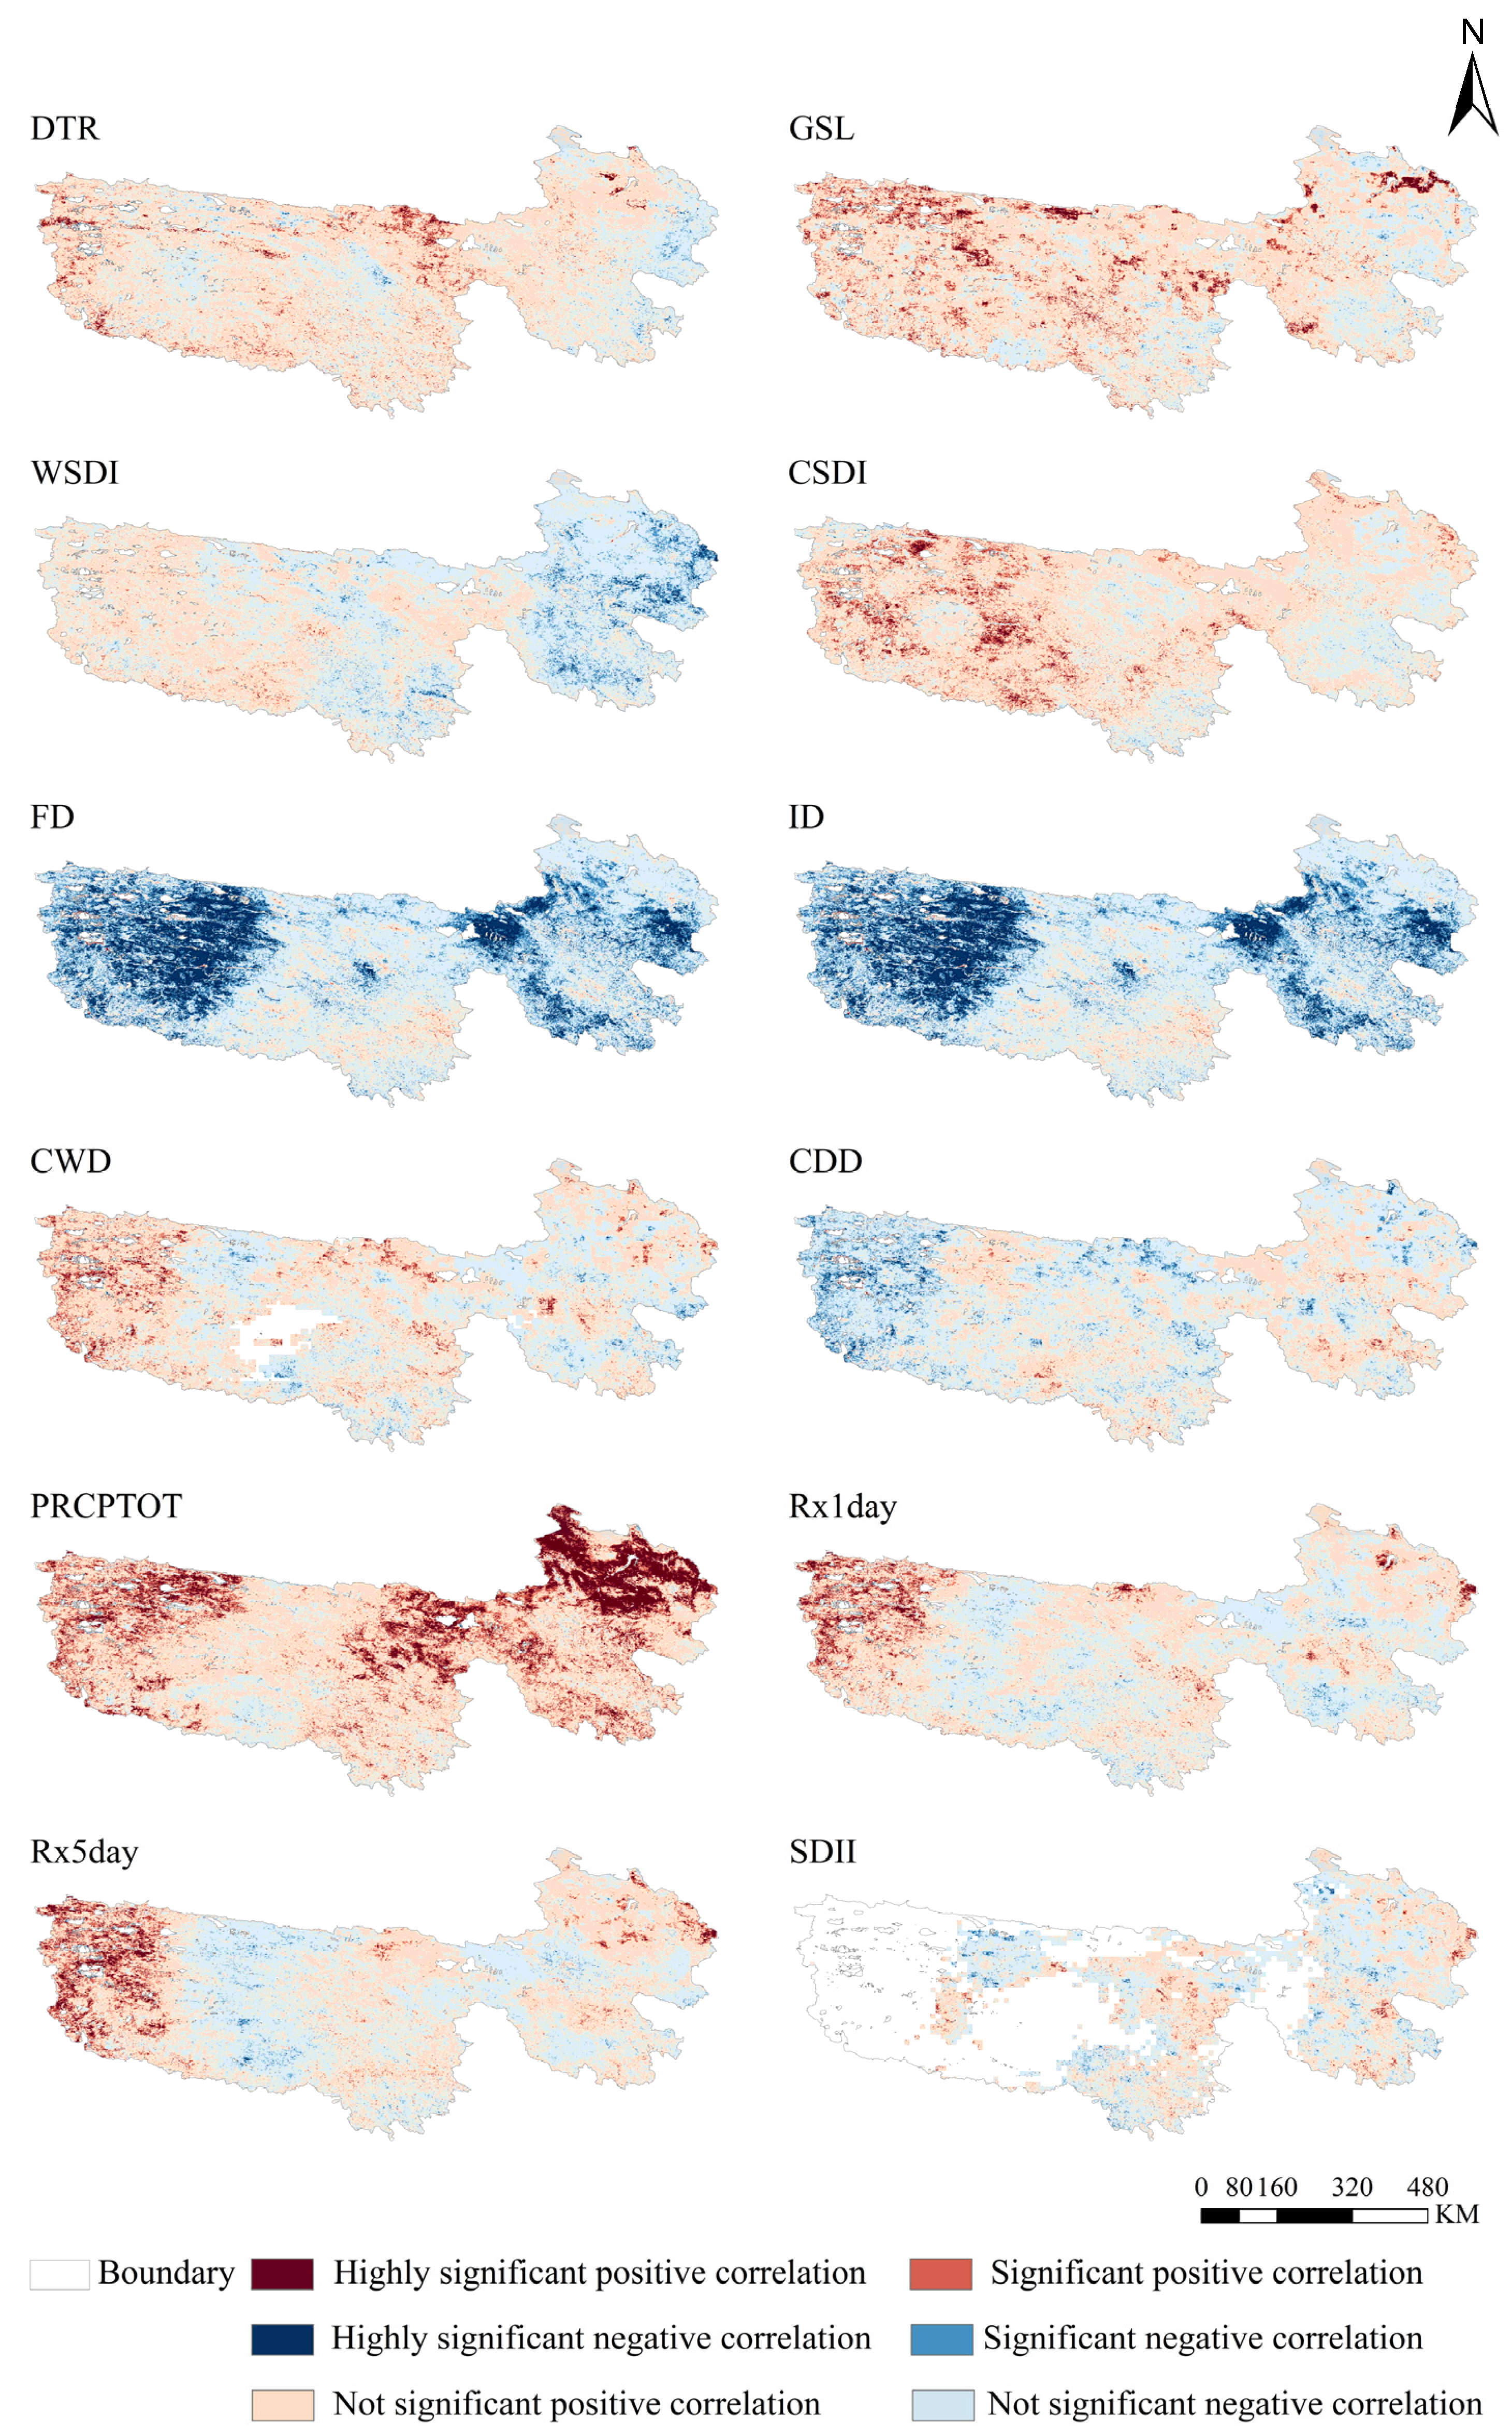
The correlation analysis between NDVI and extreme climate indices revealed three response patterns, each exhibiting a distinct geographic distribution (Figure 5). The first pattern is associated with extreme precipitation, comprising mainly PRCPTOT, Rx1day, and Rx5day. PRCPTOT exhibited a strong positive correlation with NDVI across the entire study area, with a median r-value of 0.52 (p < 0.01). Areas of significant positive correlation (r > 0.6) were concentrated in the alpine meadow zone in the center of the research area, demonstrating that annual total precipitation is a widespread beneficial factor for vegetation across the area. Positive correlations of Rx1day and Rx5day with NDVI were strongest in the eastern and western regions (r = 0.31–0.58, p < 0.05), but weaker in the central plateau region. The second pattern is the low-temperature inhibition type, represented by FD, ID, and WSDI. FD showed a significant negative correlation with NDVI across the study area (r = −0.47), with strong negative correlations (r < −0.6) concentrated in the western alpine grassland and the central high plains. ID and WSDI also showed significant negative correlations in the eastern and western regions, respectively. The third pattern comprises weak response types, including SDII, GSL, CSDI, CWD, and CDD. GSL and CSDI showed significant correlations only in isolated local patches. CDD had a negative correlation in the western region (median r = −0.23). SDII had the highest proportion of positive correlations (71.0%) but the lowest area of significance correlations (29.0%), indicating a weak ecological signal (Table 4).
Figure 5.
Spatial correlation between monthly maximum NDVI and extreme climate indices. Colored areas indicate pixels passing the significance test (P-test).
Table 4.
Relative proportions of different vegetation types.
3.3. Time-Lag Effects of NDVI on Extreme Climate Indices
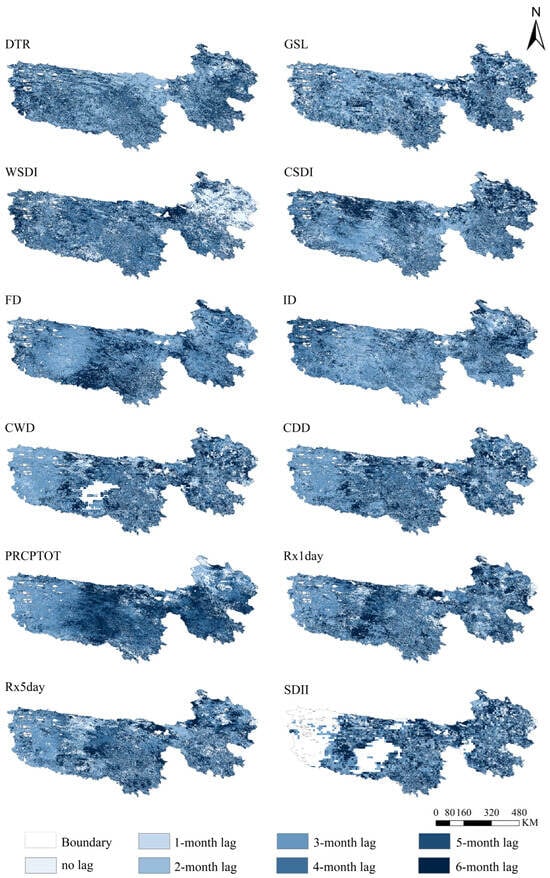
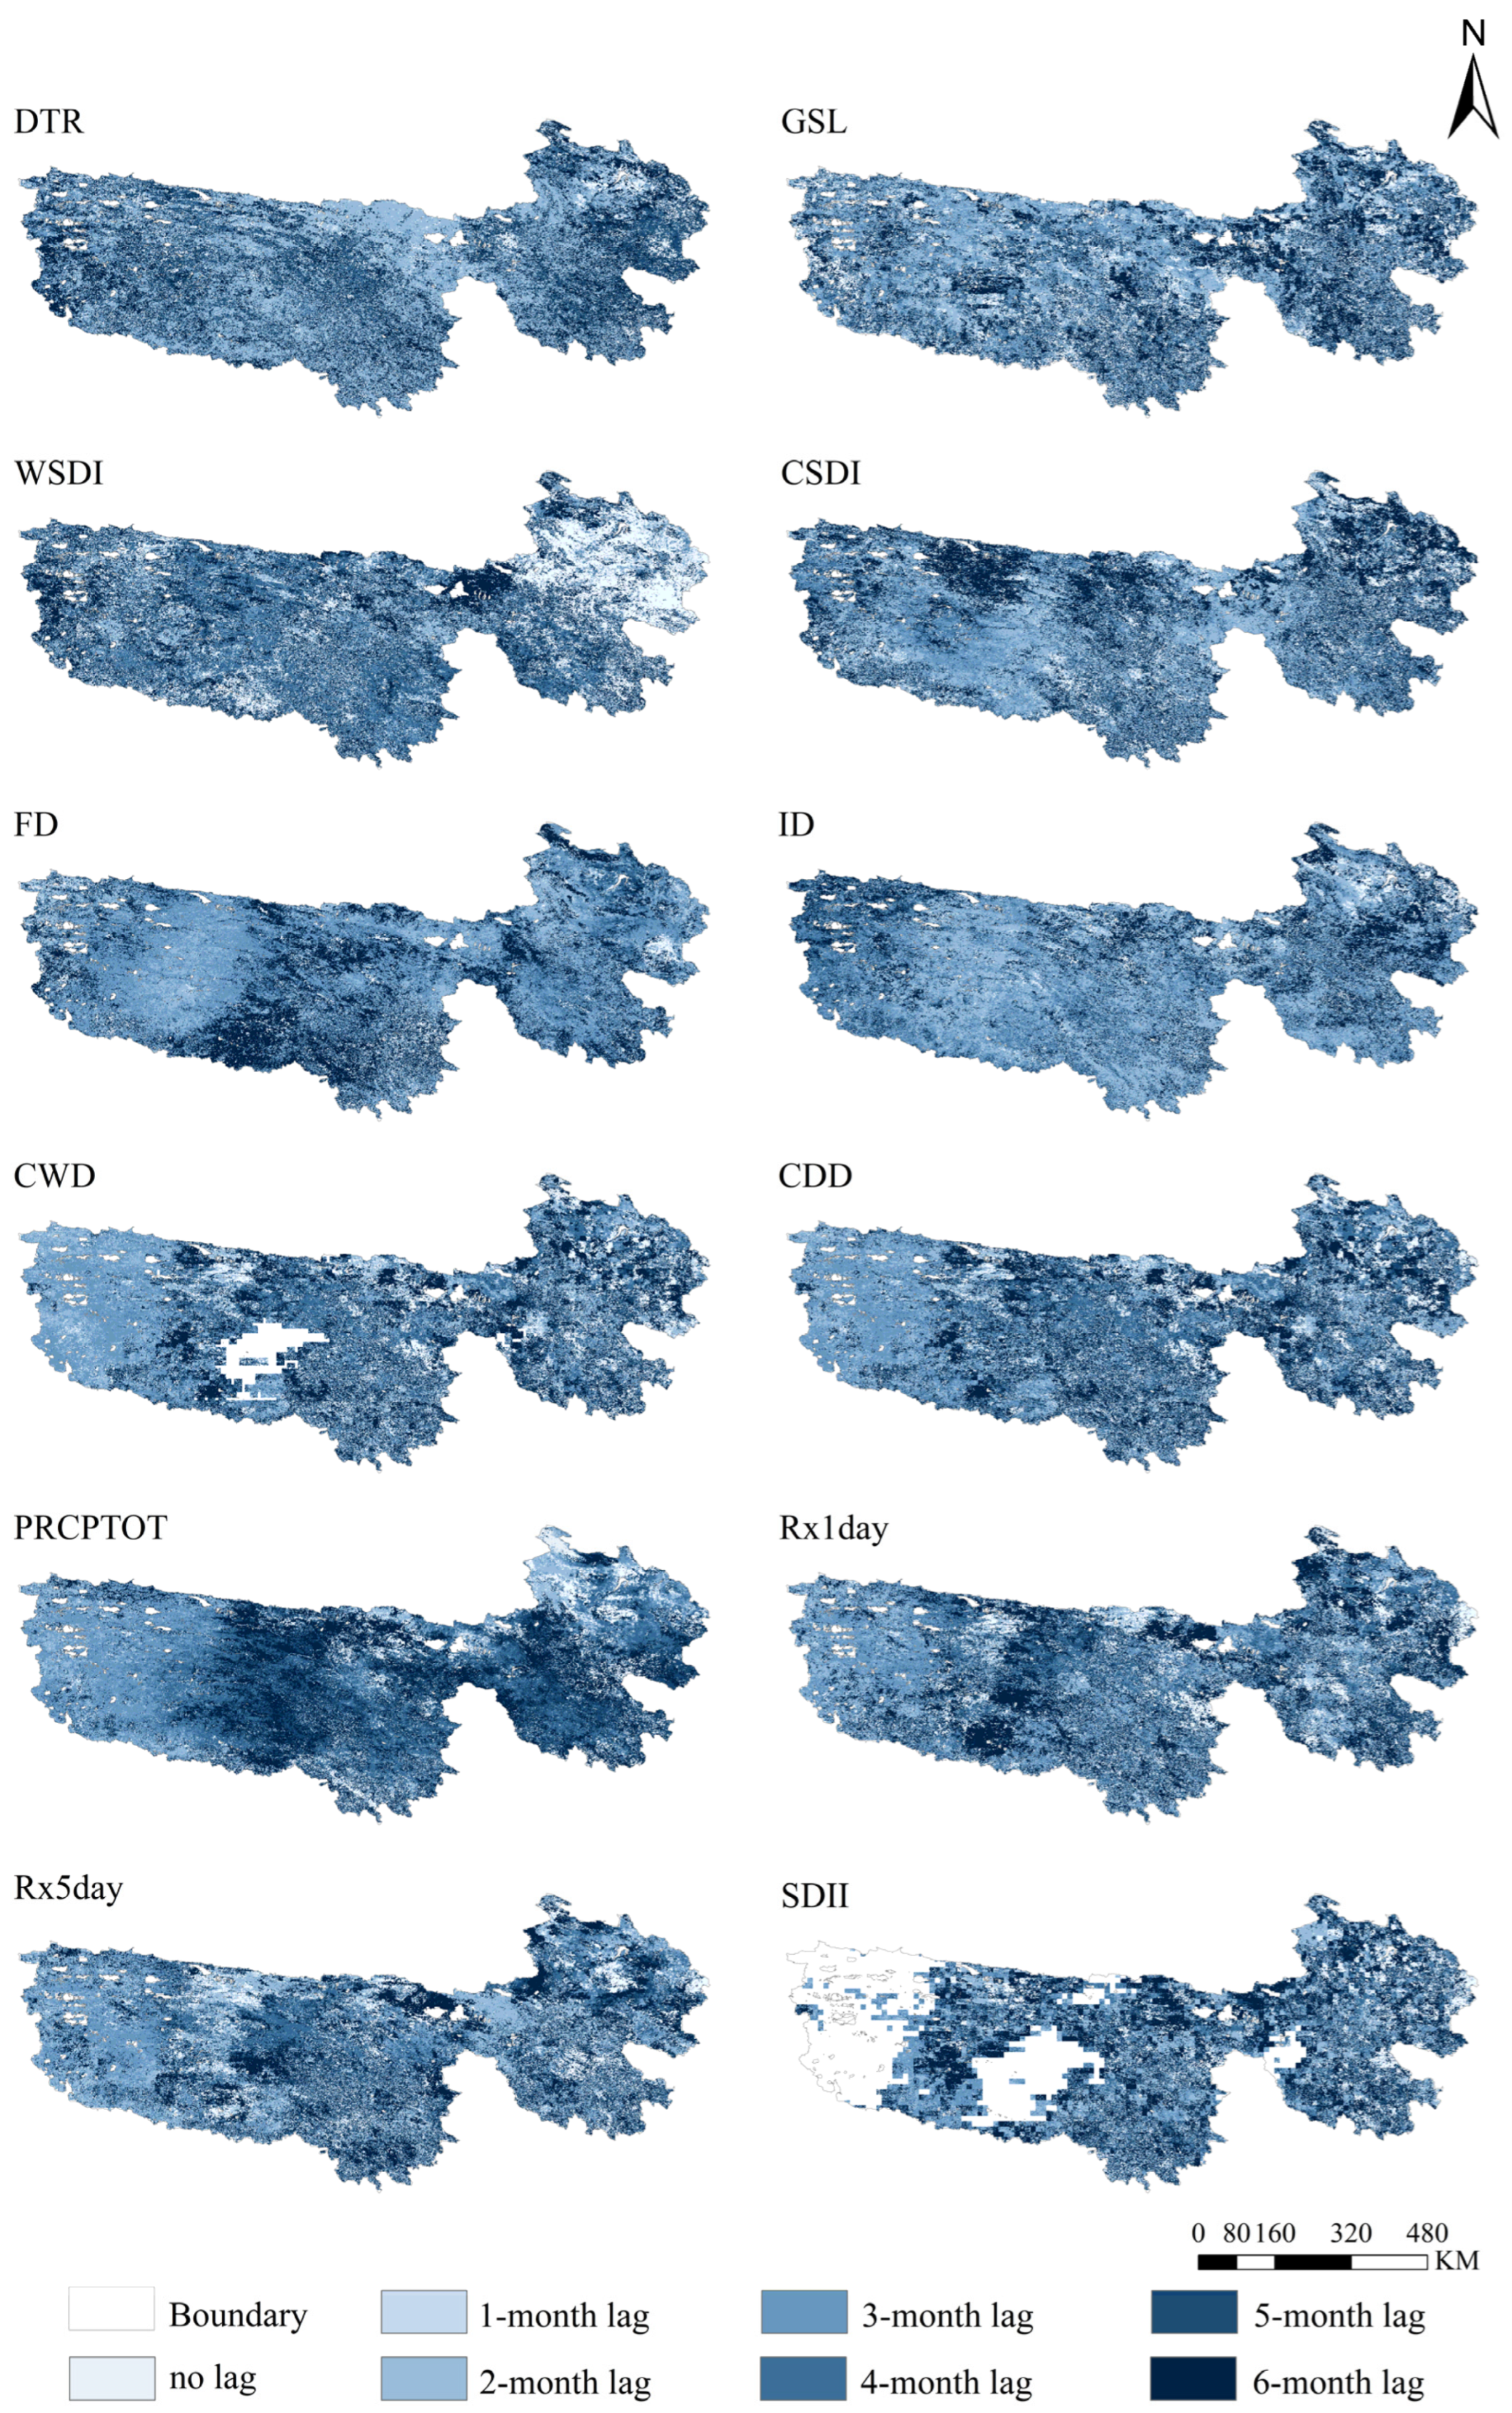
Based on pixel-level maximum Pearson correlation analysis, we determined the optimal lag period and the direction of correlation within a 0–6-month lag (Figure 6). The spatial distribution of the optimal lag exhibited a clear northwest–southeast gradient in lag sensitivity. In the northwestern TRSR, where elevations generally exceed 4500 m and sparse alpine vegetation dominates, the temperature index has a short lag (0–2 months), reflecting a close and direct physical coupling between atmospheric temperature and plant metabolic rates under an extreme environment with limited buffering capacity. In contrast, the precipitation index shows a longer lag (3–6 months) in the southeastern half of the TRSR, at elevations of 3500–4000 m, where alpine meadows are prevalent, suggesting greater soil water storage capacity and stronger hydrological buffering. The areas surrounding Lake Zhaling and Lake Eling constitute a distinct micro-region, where rising groundwater levels shorten the precipitation lag through sustained capillary rise, whereas the thermal inertia of the lakes prolongs the temperature lag by moderating diurnal and seasonal temperature fluctuations.
Figure 6.
Spatial pattern of temporal lag between monthly maximum NDVI and extreme climate indices. Colored areas indicate pixels passing significance testing (P-test).
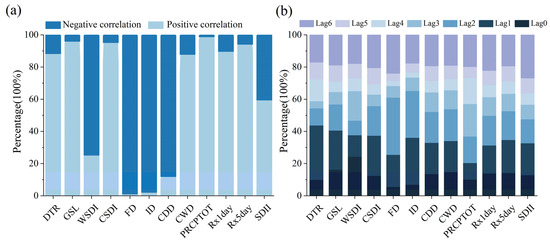
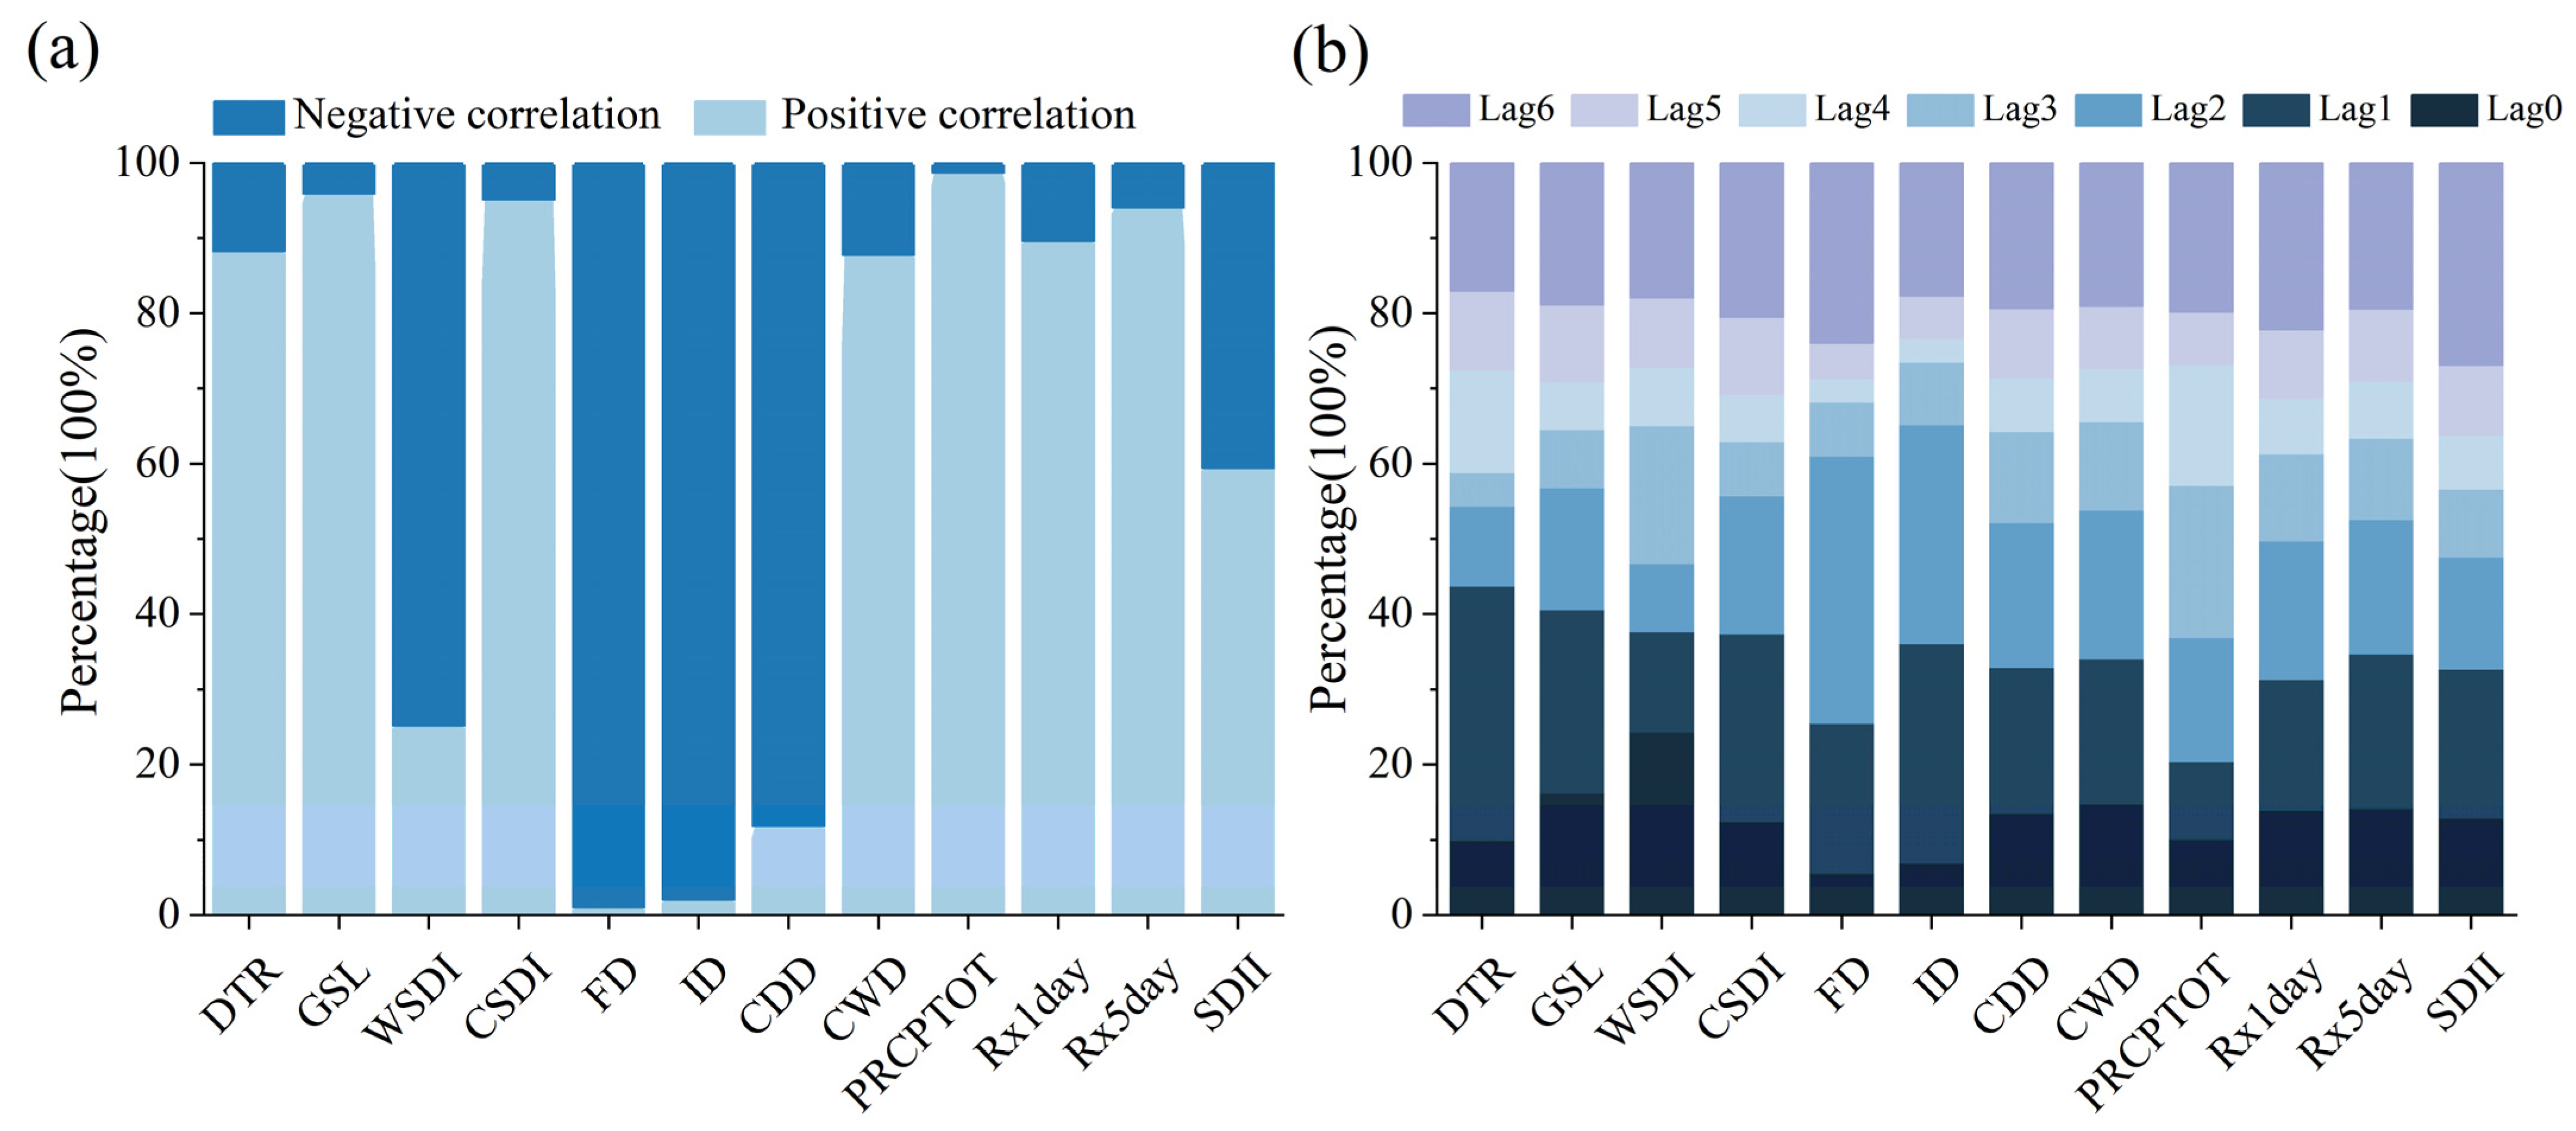
Figure 6 and Figure 7 show three distinct lag response patterns. The short-term (0–1 month) or contemporaneous response is dominated by temperature-related extreme indices. The WSDI exhibited a contemporaneous response (0-month lag) in 78.3% of the eastern TRSR, implying that prolonged warm spells may induce heat stress rather than promote growth in this cold-adapted environment. FD and ID formed an inhibitory pair, with their peak lag responses occurring at 0–1 months and 1–2 months, respectively, across the entire region. Negative correlations were observed in ≥98% of cases. The medium-term reaction (2–4-month lag) is dominated by precipitation-related extreme indices. PRCPTOT has a 3–4-month lag in 58.4% of the region, with predominantly positive correlation, indicating that precipitation must first undergo infiltration, vertical redistribution, and root-zone accumulation before it can substantially influence vegetation water status. SDII stands out as a notable exception within the precipitation-related indices, as it is the only one exhibiting a 6-month lag and displaying the most balanced distribution of positive and negative correlations. This dual characteristic reflects the ecological ambiguity of precipitation intensity: while increased rainfall intensity can alleviate soil moisture deficits and thus promote growth, extreme-intensity events may concurrently trigger soil erosion, nutrient leaching, and physical damage to vegetation, thereby inhibiting growth. A key finding of this study is the prevalence of a 6-month lag effect across a wide range of extreme climate indices. Ten of the twelve indices (CDD, CSDI, DTR, FD, GSL, PRCPTOT, Rx1day, Rx5day, SDII, and WSDI) showed this 6-month lag effect, with the proportion of affected pixels ranging from 17.0% (DTR) to 26.9% (SDII, primary peak). Only ID and CWD lacked this trait; both were densely concentrated at the 1–2-month lag with no substantial extension to the seasonal scale. Notably, CDD exhibited a particularly prominent 6-month lag peak.
Figure 7.
Correlation and lag pixel statistics. Frequency-stacked histograms for each metric, generated using Python 3.8. (a) Frequency-stacked histogram of correlations; (b) frequency-stacked histogram of lag times.
Vegetation type-specific analysis of NDVI lag responses to extreme climate indices (Table 5) reveals that grasslands and desert vegetation exhibit the shortest lag responses with 69.9% for grasslands under FD and 71.8% for desert vegetation under ID, whereas meadows and shrublands show the longest lags. Desert vegetation had a long-term lag proportion of 46.7%, more than twice that of grasslands (23.2%), implying that the thermal growing season affects desert vegetation indirectly through soil moisture levels. Within the 3–4-month lag, 30.1% of desert vegetation had frost-related lag (compared to 8.5% for meadows), potentially indicating a delayed manifestation of damage induced by biocrust formation. Meanwhile, PRCPTOT had the highest inter-vegetation variance (40.9 percentage points), with the divergence between meadows and farmlands indicating fundamental differences in deep versus shallow soil hydrological channels. SDII had the smallest inter-vegetation variance, implying that the effects of precipitation intensity are dominated by soil physical features rather than by vegetation biological characteristics.
Table 5.
Proportion of time lag by vegetation type.
4. Discussion
This study advances previous work on vegetation–climate relationships in the Three-River Source Region in several key respects: whereas earlier investigations predominantly examined NDVI in relation to mean-state climatic variables under an implicit assumption of instantaneous coupling, the present study systematically characterizes—at 1 km resolution—the pixel-specific time-lag effects between NDVI and 12 ETCCDI extreme climate indices over a 0–6-month window across the same region. By substituting the instantaneous-coupling assumption with an optimal-lag framework, our analysis uncovers a temporally structured vegetation response that traditional synchronous correlation approaches systematically fail to capture. Furthermore, this study establishes a quantitative framework that stratifies lag sensitivity across seven vegetation types. The observed gradient—from rapid responses in grasslands and deserts to prolonged responses in meadows and shrublands—provides a landscape-scale mechanistic link connecting root depth, soil organic matter content, and the characteristic timescale of climate–vegetation coupling, a relationship that had been previously hypothesized but not empirically quantified at this spatial extent.
4.1. Spatiotemporal Variation Characteristics of NDVI
During the study period, NDVI in the TRSR showed an overall increasing trend, consistent with earlier findings [38,39]. This suggests that vegetation cover has expanded annually in recent years, accompanied by a steady increase in productivity [40]. Over the same period, the annual mean temperature increased significantly (0.0466 °C/yr, p < 0.01), whereas precipitation showed a slight, non-significant decrease (−0.3448 mm/yr, p > 0.05). Partial correlation analysis revealed that precipitation had a higher independent effect on NDVI (r = 0.302) than temperature did (r = 0.140). This finding challenges the intuitive assumption that “warming is the primary driver of vegetation greening in cold, high-altitude ecosystems” and instead identifies water availability as the dominant limiting factor for vegetation productivity in the cold-temperate TRSR. In the context of global warming, warming effects are more pronounced in high-altitude cold zones. The TRSR, with an average elevation of almost 4000 m, serves as the headwater convergence zone for the Yangtze, Yellow, and Lancang rivers. It harbors abundant freshwater resources and is perennially covered by glacial snow and ice. Rising temperatures have created a warmer growing environment for vegetation, while glacial meltwater has improved hydrological conditions. Together with a moderate increase in warm-season precipitation, these factors have contributed to an increased trend in vegetation cover. Earlier studies have consistently reported higher NDVI values in the southeastern TRSR than in the western areas [41,42,43]. The eastern part of the region exhibits greater topographic diversity and encompasses most of the grasslands, meadows, and forests. Furthermore, the river basins in the southeast promote vegetation development, yielding the highest NDVI values in this area. In contrast, the northwest is characterized by sparse and patchy vegetation. This region is dominated by marsh vegetation, alpine sparse vegetation, and alpine desert ecosystems, resulting in lower vegetation coverage. Under extreme altitude conditions (>4500 m), warming does not consistently benefit vegetation; soil variables such as thin, coarse-textured soil layers, low nutrient availability, intense UV radiation, and hypoxic conditions exert substantial constraints on plant establishment and growth [44]. At elevations above 4500 m, the alpine–subalpine zones in the western TRSR are dominated by sparse mat-forming plants and biological soil crusts that develop on glacial debris and exposed bedrock. Climate warming in this region is predicted to cause only minor landscape changes, such as a slight rise in biological soil crust cover, rather than significant vegetation expansion. During the study period, both temperature and precipitation exhibited pronounced fluctuations around 2013, with a downward tendency. Precipitation declined at a faster rate than temperature, resulting in significant changes in NDVI across different vegetation types during this time. Compared with other vegetation types, forests exhibited smaller NDVI changes over this interval, whereas meadows and farmlands showed greater variability. The combined effects of warming and precipitation changes, along with the final phase of the “Grain-for-Green” program, led to partial land reclamation for agriculture, which consequently reduced vegetation cover [45,46]. Apart from disturbances such as logging and fire, forest vegetation cover has remained relatively stable over time. However, farmland, grazing regions, and farms areas have undergone continuous change. Extreme climate events and intensive human disturbances have degraded vegetation, thereby affecting the estimated vegetation cover results.
While annual-scale climate patterns provide a broad framework, the mechanisms by which temperature and precipitation influence NDVI generally operate at seasonal and monthly levels. Our findings indicate that the growth season (May–September) accounts for more than 80% of annual precipitation in the TRSR; consequently, the seasonal distribution of rainfall, rather than the annual total, constitutes the ecologically meaningful metric. The modest decline in annual precipitation masks substantial interannual variability, with pronounced dry years (e.g., 2003, 2015) and wet years (e.g., 2005, 2012, 2018) yielding distinctly different NDVI patterns. The interannual precipitation variability is the principal cause of the year-to-year NDVI changes shown in Figure 3a. With regard to temperature, the considerable observed rise (0.0466 °C/yr) corresponds to the well-documented accelerated warming trend on the Tibetan Plateau [47]. However, the ecological repercussions of global warming are uneven across the seasons. Winter and spring warming (November–April) can lengthen the GSL and shorten the FD, thereby benefiting vegetation growth by accelerating snowmelt and extending the frost-free period. In contrast, summer heat (June–August) can increase evapotranspiration demands and exacerbate soil moisture deficits during the important growing season.
4.2. Changes in Vegetation Responses to Extreme Climate Events
Between 2000 and 2024, the relationship between NDVI and extreme climate indices in the TRSR exhibited marked spatial and vegetation type heterogeneity. The results reveal three major response patterns. The first pattern is driven by extreme precipitation and is represented primarily by PRCPTOT, Rx1day, and Rx5day; areas of high correlation are concentrated in the central alpine meadow zone. This finding is consistent with Easterling et al. [48], who reported that extreme precipitation events typically produce disproportionate ecological impacts. The second pattern is characterized by temperature-driven suppression: FD and ID are predominantly negatively correlated with NDVI. Early-season frost events can induce ice crystal nucleation in leaf mesophyll cells and xylem embolism, leading to immediate photosynthetic impairment [49]. Low temperatures in plateau regions maintain perennially frozen soils [50]; conversely, a reduction in frost days accelerates soil thawing, releasing nutrients and moisture that promote plant growth and development [51]. The third pattern is a complex response type: WSDI exhibits a significant negative correlation in the eastern part of the TRSR, refuting the assumption that warming generally benefits cold-adapted ecosystems. This result echoes the conclusion of Piao et al. [37] that “warming is not always beneficial,” suggesting that prolonged warm spells may impose heat stress that exceeds the photosynthetic thermal optimum of alpine species, particularly in low-elevation meadow areas already approaching their heat-stress threshold.
During the study period, temperature increased significantly in the region and was negatively correlated with NDVI changes. Enhanced solar radiation increased plant transpiration, reduced photosynthetic rates, accelerated soil moisture consumption, and caused soil moisture stress, all of which inhibited vegetative growth [52]. Piao et al. [37] likewise reported a weakening coupling between interannual temperature variability and vegetation activity across the Northern Hemisphere, attributing this decoupling to water limitations overriding thermal controls. Meadow and grassland are the primary vegetation types in the TRSR, accounting for more than 80% of the area and contributing most substantially to climate–vegetation interaction. The region’s overall response to climate change will thus be largely shaped by the interplay between these two ecosystems. A comparative investigation of responses to major climate conditions indicates essentially opposing reactions to changes in temperature and precipitation, highlighting the central contradiction in the region’s climate–vegetation interaction. This divergence is likely due to ecological niche differences in water usage strategies and thermal adaptation between the two species. Alpine meadows, recognized as conservative ecosystems adapted to cold and wet conditions, are widely considered particularly vulnerable to climate change [53]. Their community structure undergoes reorganization as soil moisture levels decline in response to rising temperatures [54]. Owing to the region’s limited soil water storage capacity and high evapotranspiration rates, sustained moderate-to-low-intensity rainfall is not fully utilized by vegetation because of rapid infiltration and evaporation losses [55]. Grassland vegetation, on the other hand, exhibits more opportunistic traits, capable of enhancing growth by capitalizing on extended growing seasons and extreme precipitation events [24]; warmer temperatures extend the growing season and enhance productivity, whereas increased precipitation alleviates soil moisture deficits—together potentially conferring a competitive advantage to grasslands under future climate scenarios. This niche distinction based on water and temperature adaptation lays the theoretical framework for projecting prospective adjustments in the region’s vegetation patterns, notably meadow contraction and grassland growth, under future climate change. In this study, greening rates differed significantly among vegetation types, a finding consistent with Ganjurjav et al. [54], who reported divergent responses of alpine steppe and alpine meadow to warming on the central Qinghai–Tibetan Plateau, attributed to differences in soil moisture conditions and species functional traits. The relatively rapid greening of farmland may reflect agricultural intensification and the abandonment of marginal cropland under the Grain-for-Green Policy, while the slower response of alpine glacial vegetation reflects extreme biophysical constraints at elevations exceeding 4500 m.
4.3. Vegetation’s Lagged Response to Extreme Climate Events
Vegetation has an adaptive system that allows it to respond to changes in external weather conditions. These mechanisms can prolong the duration of plant respiration and photosynthesis over time, giving rise to lag effects in vegetation development responses to climate [56,57]. In this study, vegetation in the TRSR exhibited pronounced time-lag responses to extreme climate indices, the duration of which varied substantially by index type and spatial location. The three temporally varied response patterns revealed by the lag analysis represent various ecohydrological mechanisms. The short-lag response to temperature extremes, exemplified by FD, has a negative correlation of ≥98% and is driven by a 1–2-month lag, indicating direct thermodynamic influence of freezing episodes on plant tissue viability. Early-season frosts create ice crystal nucleation within leaf mesophyll cells and embolize xylem arteries in stems, causing acute photosynthetic impairment. This damage takes some time to fully emerge as a decline in NDVI; the lag duration corresponds to the turnover time of damaged leaf area and the threshold for satellite-detected greenness declines [49]. This finding is consistent with Wu et al. [10], who reported that temperature-driven vegetation responses are generally shorter than precipitation-driven responses in most biomes. The short-lag response observed for ID further supports this pattern: days with frost imply a more severe freezing regime, cutting out the possibility of diurnal photosynthetic rebound. The medium-term lag response of precipitation extremes, as indicated by PRCPTOT (58.4% of the region with a 3–4-month lag), is consistent with the well-established soil moisture cascade model [58]. The effect of precipitation on NDVI becomes observable only after water has infiltrated the soil profile, been redistributed within the soil pore space, been taken up by roots, and contributed to transpiration-driven growth. The extended lag observed for SDII (concentrated at 5–6 months) arises from multiple seasonal-scale mechanisms: high rainfall alters soil structure, nutrient leaching, and microbial mineralization rates on a seasonal scale.
The lag times for different vegetation types also vary, consistent with previous lag-analysis studies [10,59,60]. Our results confirm the global-scale response pattern identified by Wu et al. [61]—namely, that simple ecosystems respond more quickly while complex ecosystems respond more slowly—and provide a higher-resolution, vegetation type-specific quantification for the TRSR. In this region, simple ecosystems (e.g., desert and alpine–subalpine vegetation) respond more quickly to climate change with shorter lag times, whereas complex ecosystems (e.g., forests, shrublands, and meadows) respond slowly with longer lag times. Compared with trees, shrubs and herbaceous vegetation are more resilient to environmental change [10]. Herbaceous plants often have thinner leaves and a larger specific leaf area, with shallow root systems ranging from 20 to 40 cm in depth. This allows them to absorb rainwater more quickly and utilize it for photosynthesis; nevertheless, their growth cycles are shorter, and they require more time to adjust and adapt to environmental changes. In contrast, meadow ecosystems dominated by the species Potentilla have deeper root systems (40–80 cm) and occur in soils with substantially higher organic matter content and water-holding capacity. The increased soil moisture buffering effect both slows and extends the vegetation’s response to precipitation. This soil-mediated mechanism lends support to the hypothesis that root depth and soil water storage capacity are the major factors determining the magnitude of the vegetation–climate lag [61].
4.4. Implications for Ecological Management and Climate Adaptation
Our findings have important implications for ecosystem management in the TRSR and other alpine regions worldwide. First, the discovery that precipitation, rather than temperature, is the dominant driver of NDVI trends suggests that management efforts should prioritize water resource regulation over temperature-focused interventions to sustain and enhance alpine grassland productivity. Second, the vegetation type-dependent lag sensitivity documented here provides scientific support for regionally differentiated adaptation strategies. Meadow-dominated areas (southeastern TRSR) characterized by long precipitation lags and deep soil profiles may exhibit greater resilience to short-term droughts but remain more vulnerable to multi-year cumulative precipitation deficits that progressively deplete deep soil moisture reserves. In contrast, grassland-dominated areas (central and western TRSR) with short delays and shallow soils react quickly to precipitation variability and can serve as early indicators of ecosystem responses to hydrological changes. Monitoring strategies should therefore be stratified accordingly, with higher-frequency (monthly-scale) observations prioritized in grassland areas, whereas meadow areas warrant combined seasonal-scale assessments.
4.5. Limitations of the Study and Directions for Future Research
In light of the foregoing analysis, this study acknowledges several limitations: First, the maximum Pearson correlation approach identifies only the strongest lag time for each pixel–index combination, which may oversimplify situations in which numerous lag times have statistically indistinguishable correlation strengths. Future research could use a distributed lag model (DLM) or wavelet coherence analysis to capture the entire temporal range of vegetation–climate connection. Second, while the 1 km spatial resolution of MODIS NDVI and climate data is appropriate for a regional-scale study, it inherently averages out intra-pixel variation in vegetation composition, microtopography, and soil properties. In the topographically complex TRSR, slope-dependent solar radiation, heterogeneous snowmelt timing, and local soil moisture gradients can all drive divergent NDVI responses at the sub-kilometer scale, which were not resolved in the present study. The application of higher-resolution satellite data (e.g., Landsat 30 m or Sentinel-2 10 m) may reveal lag heterogeneity at finer spatial scales. Third, while a lag window of 0–6 months is sufficient to capture intra-seasonal and inter-seasonal responses, it precludes the detection of multi-year carryover effects. The TRSR is currently undergoing permafrost degradation; approximately 60% of the area is covered by permafrost, which has the potential to fundamentally alter soil hydrology, nutrient availability, and vegetation community composition by forming thermal karst and deepening the active layer. To assess these multi-year residual impacts, long-term satellite records (25 years or more) should be integrated with in situ permafrost monitoring.
5. Conclusions
This study investigated the spatiotemporal evolution of NDVI in the TRSR and its responses to extreme climate events. Long-term NDVI data from 2000 to 2024 were used, along with 12 extreme climatic indicators (including 6 extreme temperature indicators and 6 extreme precipitation indicators). Trend analysis and lagged partial correlation analysis were additionally applied. The findings provide a scientific foundation for vegetation ecological protection in the TRSR under extreme climate conditions. The results indicate:
(1) Precipitation, rather than temperature, is the primary climatic limiting factor for vegetation productivity in the TRSR. Despite considerable warming (0.0466 °C/yr, p < 0.01), partial correlation analysis shows that precipitation exerts a stronger independent effect on NDVI (partial correlation r = 0.302) than temperature does (partial correlation r = 0.140).
(2) Precipitation-related indices have significantly longer lag times than temperature indices, with PRCPTOT showing the strongest lag impact; SDII is the only precipitation indicator with a lag exceeding 6 months, underscoring the ecological significance of extreme rainfall intensity.
(3) Lag sensitivity is fundamentally modulated by vegetation type. Grassland and desert systems respond rapidly, reflecting shallower root systems and lower soil moisture buffering capacity, whereas meadows and shrubland exhibit the longest lag, consistent with deeper root systems and higher soil organic matter, which promote water retention.
(4) Future research should harness high-resolution satellite data to accurately capture the full temporal spectrum of vegetation–climate coupling through distributed lag models (DLM) or wavelet coherence analysis, while simultaneously revealing lag heterogeneity at high spatial resolutions. Moreover, integrating long-term satellite records with in situ permafrost monitoring would enable quantification of the multi-year legacy effects arising from permafrost degradation and associated nutrient dynamics.
Author Contributions
Conceptualization, H.Z. and Z.L.; methodology, H.Z. and Z.L.; software, Q.G. and Y.Z.; validation, L.X.; formal analysis, H.Z.; investigation, C.L.; resources, Q.G.; data curation, C.L.; writing—original draft preparation, H.Z.; writing—review and editing, Z.L.; visualization, H.Z.; supervision, Y.Z.; project administration, Q.G.; funding acquisition, Q.G. and L.X. All authors have read and agreed to the published version of the manuscript.
Funding
The authors are grateful for the support by the Science and Technology Innovation Foundation of Comprehensive Survey & Command Center for Natural Resources (No. KC20240012) and the Geological survey project of China Geological Survey (DD202607102301).
Institutional Review Board Statement
Not applicable.
Informed Consent Statement
Not applicable.
Data Availability Statement
The data were derived from public domain resources.
Conflicts of Interest
The authors declare no conflicts of interest.
References
- Wang, C.; Huang, M.; Zhai, P. New Progress and Enlightenment on Different Types of Drought Changes from IPCC Sixth Assessment Report. Acta Meteorol. Sin. 2022, 80, 168–175. [Google Scholar] [CrossRef]
- Intergovernmental Panel on Climate Change (IPCC). Climate Change 2021—The Physical Science Basis: Working Group I Contribution to the Sixth Assessment Report of the Intergovernmental Panel on Climate Change; Cambridge University Press: Cambridge, UK, 2023. [Google Scholar]
- Zhang, J.; Hao, F.; Wu, Z.; Li, M.; Zhang, X.; Fu, Y. Response of Vegetation Phenology to Extreme Climate and Its Mechanism. Acta Geogr. Sin. 2023, 78, 2241–2255. [Google Scholar] [CrossRef]
- Yin, Z.; Dekker, S.C.; Van Den Hurk, B.J.J.M.; Dijkstra, H.A. Effects of Vegetation Structure on Biomass Accumulation in a Balanced Optimality Structure Vegetation Model (BOSVM v1.0). Geosci. Model Dev. 2014, 7, 821–845. [Google Scholar] [CrossRef] [Scilit]
- He, X.; Han, Y.; Zhang, C.; Meng, B.; Li, M.; Yang, Y.; Sun, Y. Changes in grassland NDVI in northern China from 1982 to 2022 and its response to extreme climate events. Pratacultural Sci. 2026, 43, 1052–1066. [Google Scholar]
- Li, C.; Filho, W.L.; Wang, J.; Yin, J.; Fedoruk, M.; Bao, G.; Bao, Y.; Yin, S.; Yu, S.; Hu, R. An Assessment of the Impacts of Climate Extremes on the Vegetation in Mongolian Plateau: Using a Scenarios-Based Analysis to Support Regional Adaptation and Mitigation Options. Ecol. Indic. 2018, 95, 805–814. [Google Scholar] [CrossRef] [Scilit]
- Lewis, S.L.; Brando, P.M.; Phillips, O.L.; van der Heijden, G.M.F.; Nepstad, D. The 2010 Amazon Drought. Science 2011, 331, 554. [Google Scholar] [CrossRef] [Scilit] [PubMed]
- Zhang, W.; Wang, L.; Xiang, F.; Qin, W.; Jiang, W. Vegetation Dynamics and the Relations with Climate Change at Multiple Time Scales in the Yangtze River and Yellow River Basin, China. Ecol. Indic. 2020, 110, 105892. [Google Scholar] [CrossRef] [Scilit]
- Wen, Y.; Liu, X.; Pei, F.; Li, X.; Du, G. Non-Uniform Time-Lag Effects of Terrestrial Vegetation Responses to Asymmetric Warming. Agric. For. Meteorol. 2018, 252, 130–143. [Google Scholar] [CrossRef] [Scilit]
- Wu, D.; Zhao, X.; Liang, S.; Zhou, T.; Huang, K.; Tang, B.; Zhao, W. Time-lag Effects of Global Vegetation Responses to Climate Change. Glob. Change Biol. 2015, 21, 3520–3531. [Google Scholar] [CrossRef] [Scilit] [PubMed]
- Ding, Y.; Li, Z.; Peng, S. Global Analysis of Time-Lag and -Accumulation Effects of Climate on Vegetation Growth. Int. J. Appl. Earth Obs. Geoinf. 2020, 92, 102179. [Google Scholar] [CrossRef] [Scilit]
- Fu, J.; Cao, G.; Guo, W. Changes of growing season NDVI at different elevations, slopes, slope aspects and its relationship with meteorological factors in the southern slope of the Qilian Mountains, China from 1998 to 2017. Chin. J. Appl. Ecol. 2020, 31, 1203–1212. [Google Scholar] [CrossRef] [PubMed]
- Cao, Y.; Wang, F. Spatial and temporal variation of vegetation and its response to meteorological drought in Heibei Province. South–North Water Transf. Water Sci. Technol. 2021, 19, 708–719, 757. [Google Scholar] [CrossRef]
- Lei, Q.; Wang, J.; Zhang, A.; Wu, G. Spatiotemporal dynamics of NDVI in China from 1985 to 2015: Ecosystem variation, regional differences, and response to climatic factors. Acta Ecol. Sin. 2023, 43, 6378–6391. [Google Scholar] [CrossRef]
- Ma, Y.; He, Q.; Zhang, Y.; Shi, Y.; Li, J.; Yuan, F. Influences of climate factors and human activities on vegetation leaf area index dynamics in the Songliao River Basin. Acta Ecol. Sin. 2024, 44, 2043–2056. [Google Scholar] [CrossRef]
- Liu, H.; Yin, S.; Xu, L.; Mao, X. Effects of extreme climate and human activities on NDVI (normalized difference vegetation index) of different vegetation types in Shandong Province. Acta Ecol. Sin. 2023, 43, 8780–8792. [Google Scholar] [CrossRef]
- Liu, W.; Jiao, S. Characteristics of Extreme Climate Change in Karst Basin and Its Impact on NDVI. J. Soil Water Conserv. 2022, 36, 220–232. [Google Scholar] [CrossRef]
- Wen, Y.; Liu, X.; Xin, Q.; Wu, J.; Xu, X.; Pei, F.; Li, X.; Du, G.; Cai, Y.; Lin, K.; et al. Cumulative Effects of Climatic Factors on Terrestrial Vegetation Growth. JGR Biogeosci. 2019, 124, 789–806. [Google Scholar] [CrossRef] [Scilit]
- Shao, H.; Zhang, Y.; Gu, F.; Shi, C.; Miao, N.; Liu, S. Impacts of Climate Extremes on Ecosystem Metrics in Southwest China. Sci. Total Environ. 2021, 776, 145979. [Google Scholar] [CrossRef] [Scilit]
- Guo, Z.; Lou, W.; Sun, C.; He, B. Trend Changes of the Vegetation Activity in Northeastern East Asia and the Connections with Extreme Climate Indices. Remote Sens. 2022, 14, 3151. [Google Scholar] [CrossRef] [Scilit]
- Chen, T.; Bao, A.; Jiapaer, G.; Guo, H.; Zheng, G.; Jiang, L.; Chang, C.; Tuerhanjiang, L. Disentangling the Relative Impacts of Climate Change and Human Activities on Arid and Semiarid Grasslands in Central Asia during 1982–2015. Sci. Total Environ. 2019, 653, 1311–1325. [Google Scholar] [CrossRef] [Scilit] [PubMed]
- Luo, M.; Sa, C.; Meng, F.; Duan, Y.; Liu, T.; Bao, Y. Assessing Extreme Climatic Changes on a Monthly Scale and Their Implications for Vegetation in Central Asia. J. Clean. Prod. 2020, 271, 122396. [Google Scholar] [CrossRef] [Scilit]
- Gao, X.; Tao, Z.; Dai, J. Significant Influences of Extreme Climate on Autumn Phenology in Central Asia Grassland. Ecol. Indic. 2023, 155, 111056. [Google Scholar] [CrossRef] [Scilit]
- Hu, Z.; Li, Q.; Chen, X.; Teng, Z.; Chen, C.; Yin, G.; Zhang, Y. Climate Changes in Temperature and Precipitation Extremes in an Alpine Grassland of Central Asia. Theor. Appl. Clim. 2016, 126, 519–531. [Google Scholar] [CrossRef] [Scilit]
- Zhang, Y.; Lu, Y.; Sun, G.; Li, L.; Zhang, Z.; Zhou, X. Dynamic Changes in Vegetation Ecological Quality in the Tarim Basin and Its Response to Extreme Climate during 2000–2022. Forests 2024, 15, 505. [Google Scholar] [CrossRef] [Scilit]
- Guo, F.; Peng, D.; Su, Y.; Zhao, Y.; Wang, M. Time-lag effects of climate and anthropogenic activities on vegetation change on the Loess Plateau. Chin. J. Ecol. 2025, 44, 3036–3043. [Google Scholar] [CrossRef]
- Cui, J. Study on the Impact of Ecological Migration into Towns on the Choice of Livelihood Strategies—A Case Study of Sanjiangyuan Region. Doctoral Dissertation, Northwest A&F University, Yangling, China, 2020. [Google Scholar]
- Chen, J.; Jönsson, P.; Tamura, M.; Gu, Z.; Matsushita, B.; Eklundh, L. A Simple Method for Reconstructing a High-Quality NDVI Time-Series Data Set Based on the Savitzky–Golay Filter. Remote Sens. Environ. 2004, 91, 332–344. [Google Scholar] [CrossRef] [Scilit]
- Huete, A.; Didan, K.; Miura, T.; Rodriguez, E.P.; Gao, X.; Ferreira, L.G. Overview of the Radiometric and Biophysical Performance of the MODIS Vegetation Indices. Remote Sens. Environ. 2002, 83, 195–213. [Google Scholar] [CrossRef] [Scilit]
- Didan, K.; Munoz, A.B.; Ramon, S.; Huete, A. MODIS Vegetation Index User’s Guide (MOD13 Series); University of Arizona, Vegetation Index and Phenology Lab: Tucson, AZ, USA, 2015. [Google Scholar]
- Peng, S.; Ding, Y.; Liu, W.; Li, Z. 1 Km Monthly Temperature and Precipitation Dataset for China from 1901 to 2017. Earth Syst. Sci. Data 2019, 11, 1931–1946. [Google Scholar] [CrossRef] [Scilit]
- Kang, J.; Jin, R.; Li, X.; Zhang, Y.; Zhu, Z. Spatial Upscaling of Sparse Soil Moisture Observations Based on Ridge Regression. Remote Sens. 2018, 10, 192. [Google Scholar] [CrossRef] [Scilit]
- Sen, P.K. Estimates of the Regression Coefficient Based on Kendall’s Tau. J. Am. Stat. Assoc. 1968, 63, 1379–1389. [Google Scholar] [CrossRef]
- Lu, J.; Peng, J.; Li, G.; Guan, J.; Han, W.; Liu, L.; Wang, R.; Zheng, J. Assessment of time-lag and cumulative effects of drought on gross primary productivity of grassland in Central Asia from 1982 to 2018. Acta Ecol. Sin. 2023, 43, 9745–9757. [Google Scholar] [CrossRef]
- Lunetta, R.S.; Knight, J.F.; Ediriwickrema, J.; Lyon, J.G.; Worthy, L.D. Land-Cover Change Detection Using Multi-Temporal MODIS NDVI Data. Remote Sens. Environ. 2006, 105, 142–154. [Google Scholar] [CrossRef] [Scilit]
- Peng, J.; Liu, Z.; Liu, Y.; Wu, J.; Han, Y. Trend Analysis of Vegetation Dynamics in Qinghai–Tibet Plateau Using Hurst Exponent. Ecol. Indic. 2012, 14, 28–39. [Google Scholar] [CrossRef] [Scilit]
- Piao, S.; Nan, H.; Huntingford, C.; Ciais, P.; Friedlingstein, P.; Sitch, S.; Peng, S.; Ahlström, A.; Canadell, J.G.; Cong, N.; et al. Evidence for a Weakening Relationship between Interannual Temperature Variability and Northern Vegetation Activity. Nat. Commun. 2014, 5, 5018. [Google Scholar] [CrossRef] [Scilit] [PubMed]
- Zambrano, F.; Vrieling, A.; Nelson, A.; Meroni, M.; Tadesse, T. Prediction of Drought-Induced Reduction of Agricultural Productivity in Chile from MODIS, Rainfall Estimates, and Climate Oscillation Indices. Remote Sens. Environ. 2018, 219, 15–30. [Google Scholar] [CrossRef] [Scilit]
- Qin, G.; Wu, J.; Li, C.; Qin, A.; Ni, L.; Yao, X. Grassland vegetation phenology change and its response to climate changes in North China. Chin. J. Appl. Ecol. 2019, 30, 4099–4107. [Google Scholar] [CrossRef] [PubMed]
- Zhang, Y. Spatiotemporal Pattern of Vegetation Productivity and Its Driving Forces in the Three Rivers Source Region. Master’s Thesis, Qinghai Normal University, Xining, China, 2021. [Google Scholar]
- Xu, J.; Fang, S.; Zhang, T.; Zhu, Y.; Wu, D.; Yi, G. NDVI changes and its correlation with climate factors of the Three River-Headwater region in growing seasons during 2000–2016. Remote Sens. Land Resour. 2020, 32, 237–246. [Google Scholar]
- Rao, P.; Wang, Y.; Wang, F. Analysis on the NDVI Change and Influence Factors of Vegetation Cover in the Three-River Headwaters Region. Acta Agrestia Sin. 2021, 29, 572–582. [Google Scholar] [CrossRef]
- Xie, Q.; Yang, X.; Hao, L. Spatio-temporal variation of vegetation cover and its driving factors in Three-River headwaters region during 2001–2020. Bull. Soil Water Conserv. 2022, 42, 202–212. [Google Scholar] [CrossRef]
- Körner, C. Alpine Plant Life: Functional Plant Ecology of High Mountain Ecosystems; Springer International Publishing: Cham, Switzerland, 2021. [Google Scholar]
- Wang, F.; Pan, X.; Gerlein-Safdi, C.; Cao, X.; Wang, S.; Gu, L.; Wang, D.; Lu, Q. Vegetation Restoration in Northern China: A Contrasted Picture. Land Degrad. Dev. 2020, 31, 669–676. [Google Scholar] [CrossRef] [Scilit]
- Deng, X.; Wu, L.; He, C.; Shao, H. Study on Spatiotemporal Variation Pattern of Vegetation Coverage on Qinghai–Tibet Plateau and the Analysis of Its Climate Driving Factors. Int. J. Environ. Res. Public Health 2022, 19, 8836. [Google Scholar] [CrossRef] [Scilit] [PubMed]
- Yao, T.; Xue, Y.; Chen, D.; Chen, F.; Thompson, L.; Cui, P.; Koike, T.; Lau, W.K.-M.; Lettenmaier, D.; Mosbrugger, V.; et al. Recent Third Pole’s Rapid Warming Accompanies Cryospheric Melt and Water Cycle Intensification and Interactions between Monsoon and Environment: Multidisciplinary Approach with Observations, Modeling, and Analysis. Bull. Am. Meteorol. Soc. 2019, 100, 423–444. [Google Scholar] [CrossRef] [Scilit]
- Easterling, D.R.; Meehl, G.A.; Parmesan, C.; Changnon, S.A.; Karl, T.R.; Mearns, L.O. Climate Extremes: Observations, Modeling, and Impacts. Science 2000, 289, 2068–2074. [Google Scholar] [CrossRef] [Scilit] [PubMed]
- Yamori, W.; Hikosaka, K.; Way, D.A. Temperature Response of Photosynthesis in C3, C4, and CAM Plants: Temperature Acclimation and Temperature Adaptation. Photosynth. Res. 2014, 119, 101–117. [Google Scholar] [CrossRef] [Scilit] [PubMed]
- Wang, P.; Wang, J.; Elberling, B.; Yang, L.; Chen, W.; Song, L.; Yan, Y.; Wang, S.; Pan, J.; He, Y.; et al. Increased Annual Methane Uptake Driven by Warmer Winters in an Alpine Meadow. Glob. Change Biol. 2022, 28, 3246–3259. [Google Scholar] [CrossRef] [Scilit] [PubMed]
- Sistla, S.A.; Moore, J.C.; Simpson, R.T.; Gough, L.; Shaver, G.R.; Schimel, J.P. Long-Term Warming Restructures Arctic Tundra without Changing Net Soil Carbon Storage. Nature 2013, 497, 615–618. [Google Scholar] [CrossRef] [Scilit] [PubMed]
- Piao, S.; Liu, Q.; Chen, A.; Janssens, I.A.; Fu, Y.; Dai, J.; Liu, L.; Lian, X.; Shen, M.; Zhu, X. Plant Phenology and Global Climate Change: Current Progresses and Challenges. Glob. Change Biol. 2019, 25, 1922–1940. [Google Scholar] [CrossRef] [Scilit] [PubMed]
- Zhang, B.; Tan, X.; Wang, S.; Chen, M.; Chen, S.; Ren, T.; Xia, J.; Bai, Y.; Huang, J.; Han, X. Asymmetric Sensitivity of Ecosystem Carbon and Water Processes in Response to Precipitation Change in a Semi-arid Steppe. Funct. Ecol. 2017, 31, 1301–1311. [Google Scholar] [CrossRef] [Scilit]
- Ganjurjav, H.; Gao, Q.; Gornish, E.S.; Schwartz, M.W.; Liang, Y.; Cao, X.; Zhang, W.; Zhang, Y.; Li, W.; Wan, Y.; et al. Differential Response of Alpine Steppe and Alpine Meadow to Climate Warming in the Central Qinghai–Tibetan Plateau. Agric. For. Meteorol. 2016, 223, 233–240. [Google Scholar] [CrossRef] [Scilit]
- Zhang, W.; Brandt, M.; Tong, X.; Tian, Q.; Fensholt, R. Impacts of the Seasonal Distribution of Rainfall on Vegetation Productivity across the Sahel. Biogeosciences 2018, 15, 319–330. [Google Scholar] [CrossRef] [Scilit]
- Zhao, J.; Huang, S.; Huang, Q.; Wang, H.; Leng, G.; Fang, W. Time-Lagged Response of Vegetation Dynamics to Climatic and Teleconnection Factors. CATENA 2020, 189, 104474. [Google Scholar] [CrossRef] [Scilit]
- Ma, Y.; Guan, Q.; Sun, Y.; Zhang, J.; Yang, L.; Yang, E.; Li, H.; Du, Q. Three-Dimensional Dynamic Characteristics of Vegetation and Its Response to Climatic Factors in the Qilian Mountains. CATENA 2022, 208, 105694. [Google Scholar] [CrossRef] [Scilit]
- Daly, E.; Porporato, A. A Review of Soil Moisture Dynamics: From Rainfall Infiltration to Ecosystem Response. Environ. Eng. Sci. 2005, 22, 9–24. [Google Scholar] [CrossRef] [Scilit]
- Wang, Y.; Wang, Z.; Wang, J.; Li, W. Transient and Lagged Response of Seasonal Vegetation Change to Climate in China during the Past Two Decades. Geogr. Geo-Inf. Sci. 2020, 36, 33–40, 76. [Google Scholar]
- Ouyang, X.; Dong, X.; Wei, R.; Gong, C.; Wu, H. Analysis of Spatiotemporal Variation of NDVI in the Vegetation Growing Season and Responses to Climatic Factors in Qinghai-Tibet Plateau. Res. Soil Water Conserv. 2023, 30, 220–229. [Google Scholar] [CrossRef]
- Li, Y.-Q.; Wang, Z.-H. Leaf Morphological Traits: Ecological Function, Geographic Distribution and Drivers. Chin. J. Plant Ecol. 2021, 45, 1154–1172. [Google Scholar] [CrossRef] [Scilit]

Disclaimer/Publisher’s Note: The statements, opinions and data contained in all publications are solely those of the individual author(s) and contributor(s) and not of MDPI and/or the editor(s). MDPI and/or the editor(s) disclaim responsibility for any injury to people or property resulting from any ideas, methods, instructions or products referred to in the content. |
© 2026 by the authors. Licensee MDPI, Basel, Switzerland. This article is an open access article distributed under the terms and conditions of the Creative Commons Attribution (CC BY) license.