


Abstract
The Aura Microwave Limb Sounder (Aura/MLS) measures temperature profiles with a horizontal spacing of about 170 km along its near polar orbit. We highpass-filtered the horizontal temperature fluctuations along the suborbital track in the middle atmosphere. The characteristics of inertia gravity waves with horizontal wavelengths between 200 and 825 km are evaluated for the equatorial region (10° S to 10° N), northern polar region (70° N to 82° N), and southern polar region (70° S to 82° S) over the time interval from August 2004 to December 2021. A modulation of gravity wave activity by quasi-biennial oscillations is present in the equatorial stratosphere but not in the equatorial mesosphere. The gravity wave activity in the southern polar mesosphere is stronger by a factor of up to 2 than in the northern polar mesosphere. The seasonal variation in the vertical structure of gravity wave activity shows strong interhemispheric differences. There are double layers of enhanced gravity wave activity in the upper mesosphere over Antarctica in the summer and the winter, while the northern polar region does not show a double layer structure of gravity wave activity. In the northern polar region, upper mesospheric gravity wave activity is decreased after the onset of major sudden stratospheric warmings.
1. Introduction
Atmospheric gravity waves transfer energy and momentum through the atmosphere and contribute to the residual meridional circulation of the middle atmosphere [1]. The generation, propagation, and dissipation of atmospheric gravity waves are complex processes and are still a challenge for theory and observation [2,3,4,5]. In the polar regions, gravity waves are mainly generated by storms and orography (wind flow over mountains) in the troposphere and by polar vortex perturbations in the stratosphere [6]. Gravity waves are divided into three classes: low-frequency gravity waves (or inertia gravity waves), medium-frequency gravity waves, and high-frequency gravity waves [2]. The present study derives the characteristics of inertia gravity waves with horizontal wavelengths between 200 and 825 km, periods between 2 and 12 h, and vertical wavelengths between 6 and 30 km. Hocke et al. [7] showed that these inertia gravity waves can be retrieved from level-2 temperature data of the satellite instrument Aura/MLS.
Interhemispheric differences are obvious in the global maps of gravity waves in the middle atmosphere [4,7,8]. There is a clear maximum of gravity wave activity above the Andean mountain ridge and the Antarctic Peninsula, which can be regarded as major wavemakers in southern hemispheric winter. This hot spot of gravity wave activity was also observed in the high-frequency gravity wave maps of [9,10], which were retrieved from the level-1 brightness temperature data of Aura/MLS. In spite of these studies, the interhemispheric differences of gravity waves in the polar middle atmosphere were rarely investigated yet. For the assessment of interhemispheric differences, ground-based instruments are not appropriate, since orography is an essential source of gravity waves, and the observations from one site to another site in Antarctica already show essential differences in amplitudes and phase velocities of the gravity waves [11]. Thus, satellites in near polar orbit are needed for the study of interhemispheric differences. Here, the satellite experiments Aura/MLS and TIMED/SABER can be utilized to some extent, but past studies using these datasets were not focused on gravity waves in the polar mesosphere [4,7,8,9,10,12]. Using a 6-year (2007–2013) temperature dataset from the Solar Occultation for Ice Experiment (SOFIE) onboard the Aeronomy of Ice in the Mesosphere (AIM) satellite, Liu et al. [13] extracted gravity waves in the polar stratosphere and mesosphere of both hemispheres. The authors found stronger gravity wave amplitudes over the southern polar region than over the northern polar region (with exception of the summer months). It was assumed that the stronger polar wind jet of the southern hemisphere is responsible for the interhemispheric difference in gravity wave potential energy. Sato et al. [14] performed a three-year simulation based on a gravity-wave-resolving general circulation model. The authors inferred a global view of gravity wave sources and propagation significantly affecting the momentum balance in the mesosphere. A few dominant propagation paths originating from the subtropics in the summer and the middle to high latitudes in the winter focused the gravity waves into the mesospheric jets in their respective seasons, acting effectively to decelerate the jets.
The seasonal and interannual variability of mesospheric gravity waves were analyzed by means of horizontal wind measurements using an MF radar at Syowa station (69° S) in Antarctica [15]. It was found that mesospheric gravity wave activity has a maximum in the winter and a smaller local maximum in the summer at 70–78 km height. The interannual variability of gravity wave activity was related to the polar vortex’s breakdown and the strength of tropical precipitation and convection. Yoshida et al. [16] compared the absolute momentum flux of inertia gravity waves in the troposphere and stratosphere above Syowa station, observed by the PANSY radar, with that from the ERA5 meteorological reanalysis. They found that ERA5 underestimated the momentum flux by a factor of 5 and more. This comparison shows the importance of observations of gravity waves in the polar regions, which seem to be not well represented in the ERA5 reanalysis.
Ern et al. [4] retrieved global maps of gravity waves from the satellite experiments Aura/HIRDLS and TIMED/SABER. These authors found a modulation of the gravity wave momentum flux with the quasi-biennial oscillation (QBO) in the tropical stratosphere. A possible QBO modulation of the mesospheric gravity wave flux was not reported by [4]. Researchers found indications for a QBO signal in the ionosphere [17,18] and reported about a correlation between the ionospheric QBO and the stratospheric QBO. However, it is a puzzle how the stratospheric QBO signal is transferred into the thermosphere and ionosphere.
Ern et al. [4] showed that the gravity wave activity is increased in regions of strong zonal winds (e.g., polar vortex jet). The activity of high-frequency gravity waves in the Arctic mesosphere was observed to depend on the strength of the Arctic Oscillation (AO) [6]. In January 2015, when high AO values represented the polar stratosphere, the mesospheric gravity wave activity was less than in other winters when small AO values occurred. Critical-level filtering of gravity waves at stratospheric heights possibly explain the reduced amplitude of mesospheric gravity waves above. The relationship between mesospheric gravity wave activity and sudden stratospheric warmings (SSWs) comprises a complex process of critical-level filtering and wave–mean flow interaction. It has been simulated that the breakdown of the polar vortex at the onset of a major SSW leads to a reduction in mesospheric gravity wave flux in the westward direction. This is associated with a reduction in gravity-wave-driven poleward and downward mesospheric wind circulation and the appearance of mesospheric cooling during the SSW [19]. Several days after the SSW’s onset, mesospheric gravity waves (propagating in eastward direction) are supposed to be responsible for the elevated stratopause at about 80 km height [19,20,21]. Recent observations showed that northern hemispheric midlatitude gravity wave activity at 87 km was reduced following the onset of SSWs, likely caused by wind filtering and wave saturation [22]. The upward propagation of gravity waves was suppressed when the zonal wind reversed from eastward to westward in the upper stratosphere. An analysis of ERA5 data showed that stratospheric gravity waves contribute up to 18% of total drag and affect the wind structure prior to SSWs [23]. A rare Antarctic SSW was analyzed by Kogure et al. [24]. The zonal mean gravity wave activity in the stratopause region over Antarctica and the Southern Ocean decreased after the SSW onset of 30 August 2019. The decrease was probably caused by wind filtering and polar night jet breaking.
Damping of gravity waves in the Arctic mesosphere was observed by lidar and airglow measurements [25]. The observations and modeling indicated that convective instabilities are most important for the gravity wave breaking process in the Arctic mesosphere. Qiu et al. [26] found a hemispheric asymmetry in the gravity wave’s impact on polar mesospheric clouds (PMCs). In the Arctic summer mesosphere, the PMCs appear within 23 days after the maximum of gravity wave energy, while in the Antarctic summer mesosphere, the PMCs appear about 35 days before the maximum in gravity wave energy.
The present study is focused on inertia gravity waves in the polar middle atmosphere. The observations of Aura/MLS are analyzed for the time interval from August 2004 to December 2021. This dataset permits the retrieval of seasonal and interannual variation in mesospheric gravity wave activity. Section 2 describes the Aura/MLS dataset and the data analysis. The results are given in Section 3, and a discussion is provided in Section 4. The conclusions are given in Section 5.
2. Aura/MLS Dataset and Data Analysis
This study is based on profiles of temperature and geopotential height in the middle atmosphere, which have been observed by the Microwave Limb Sounder (MLS) on the NASA satellite Aura. The Aura satellite was launched in 2004, and an overview about the technical details of the instrument MLS is given by [27]. Aura has a Sun-synchronous orbit at an altitude of 705 km, with two equator overpasses at 01:45 local solar time (LST) and 13:45 LST. The orbit revolution time of Aura is about 99 min. Aura is in a near-polar orbit with an inclination of about 98°. The atmospheric profiles are sampled along the suborbital track with a distance of 1.48° in latitude or 165 km. The profiles are measured from 82° S to 82° N.
The level-2 data of Aura/MLS of retrieval version 5 are analyzed in the present study. The data analysis applies data screening and a quality check according to [28]. The Aura/MLS retrieval yields atmospheric profiles on 42 pressure levels for the parameters of temperature and geopotential height. These parameters are retrieved from the Aura/MLS measurements of the thermal microwave limb emissions of the O2 lines at 118 GHz and 234 GHz [29]. The geopotential height profiles are used to convert the profiles to profiles from z = 13 to 92 km altitude with a step of 1 km in height. Each profile is converted into a profile before further data analyses are carried out. In order to avoid interpolation errors due to the limited vertical resolution of Aura/MLS, we sometimes smoothed the vertical profiles of gravity wave amplitudes over 10 km in height.
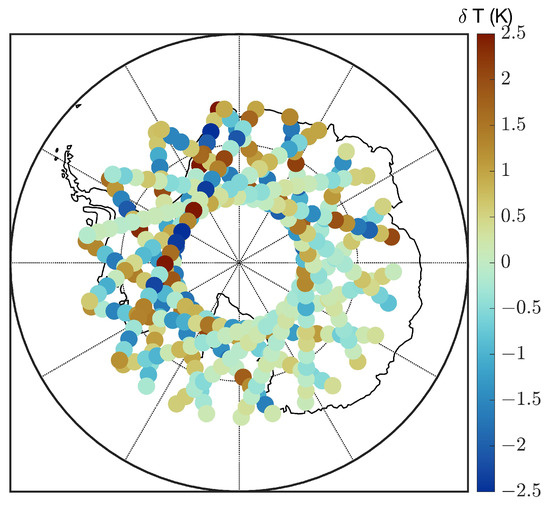
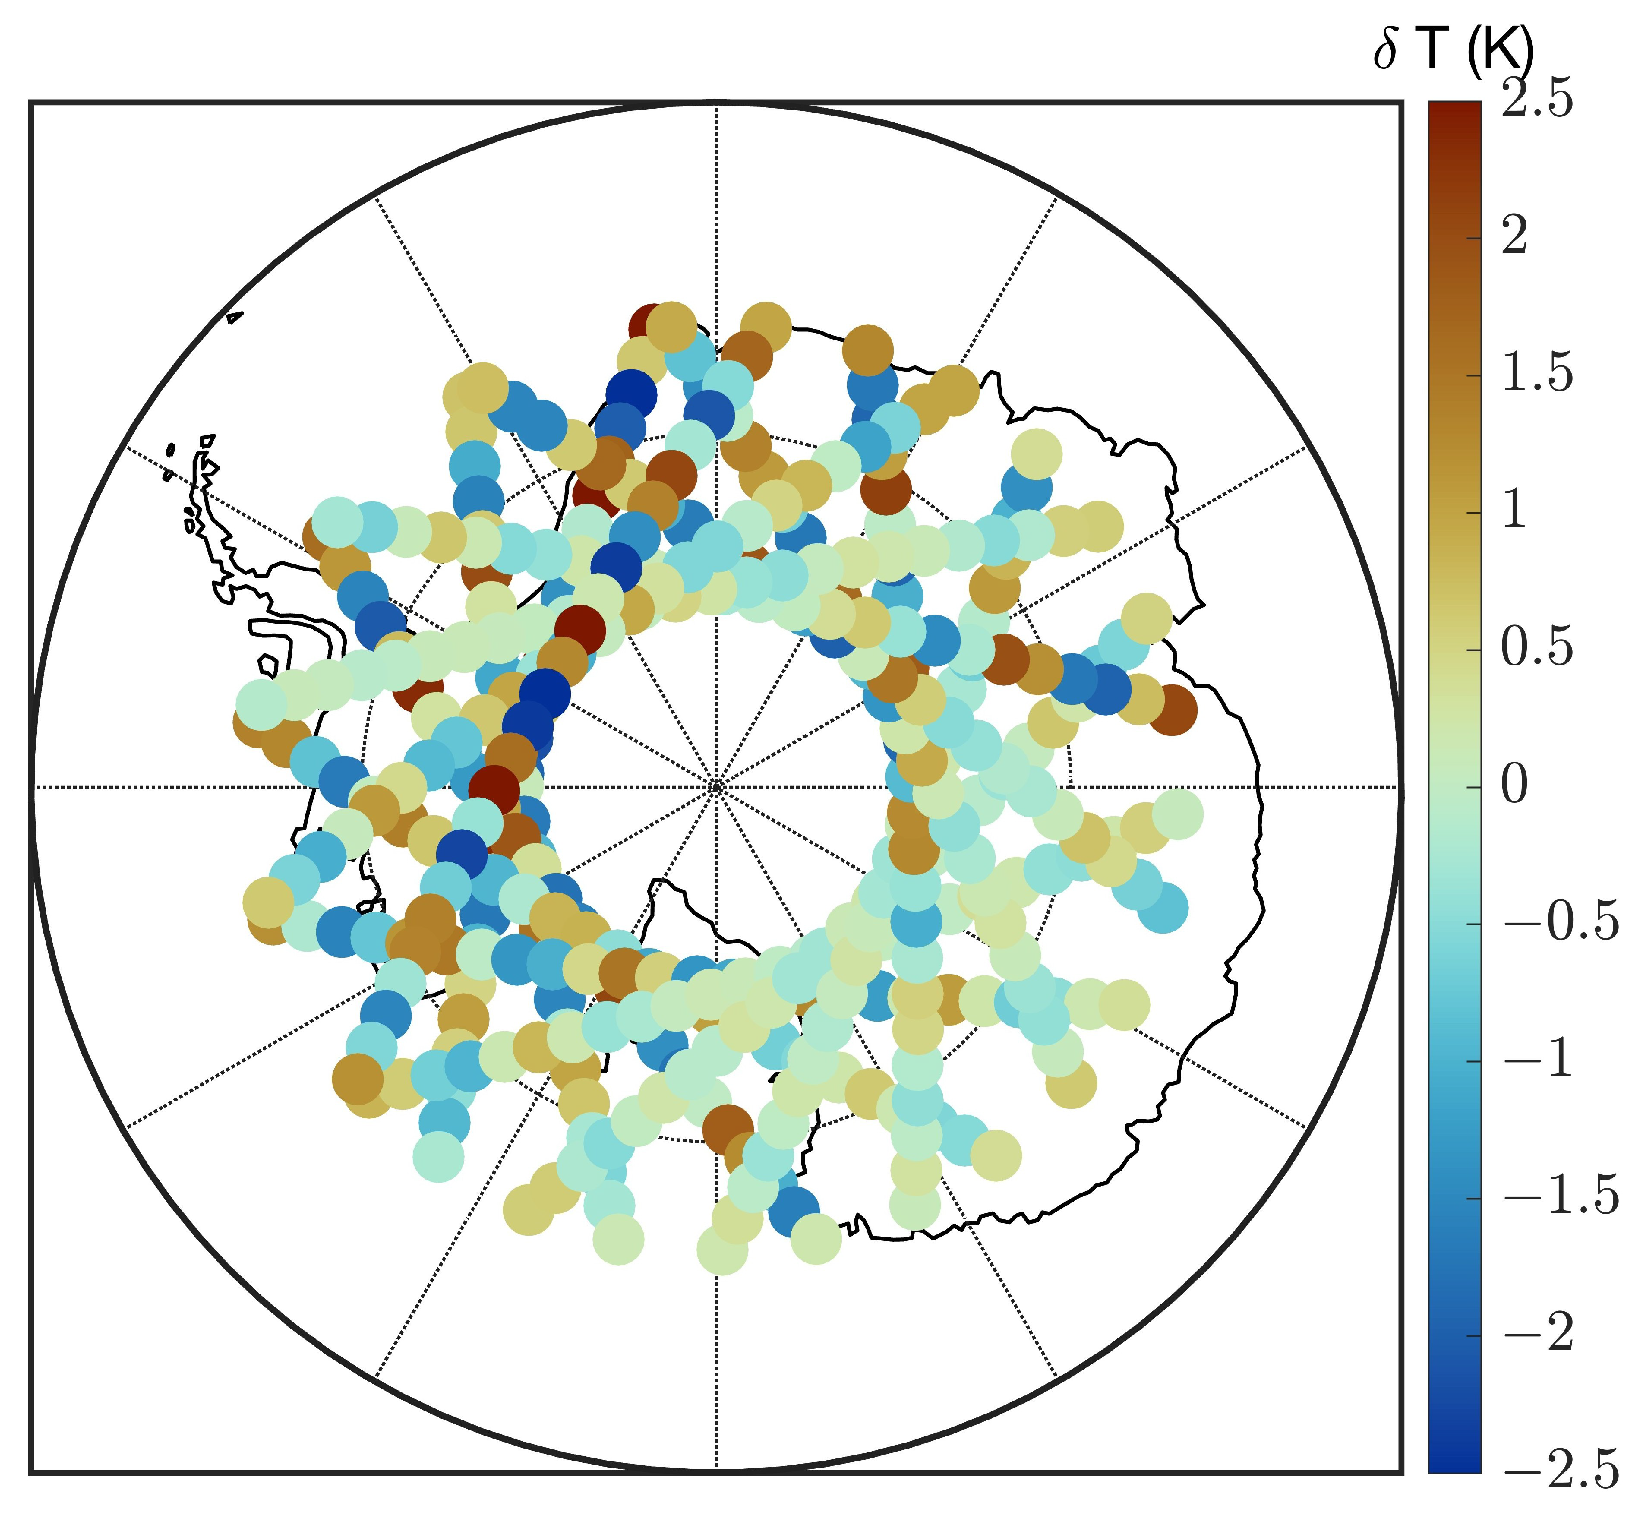
The present study only uses data from 2004 to the end of 2021, since, in 2022, the number of pressure levels of the retrieved Aura/MLS profiles was reduced from 42 to 37 because of a technical degradation of the MLS instrument. It is better to restrict the data analysis to high-quality profiles before 2022 and to omit the Aura/MLS observations from 2022 to 2025 in the present study. The precision of the temperature profiles is about 1 K in the stratosphere and about 3 K in the mesosphere [29]. The precision of the geopotential height is 35 m from 316 hPa to 100 hPa, 44 m at 1 hPa, and 110 m at 0.001 hPa [29]. The vertical resolution of the temperature profiles is about 3 km in the stratosphere and about 8 km in the lower mesosphere [29]. The along-track sounding volume is about 200 km. In the following, we high-pass-filtered the temperature fluctuation along the suborbital track at a certain height. The digital filter was run in forward and reverse directions in order to avoid a filter-induced phase delay. The selected digital filter is a non-recursive, finite impulse response high-pass filter with a Hamming window. The number of filter coefficients corresponds to a window of three times the cutoff distance (825 km, the spatial distance of 5 consecutive temperature profiles). The high-pass cut-off spatial frequencies are at 1/(825 km) and infinity. This means that all spatial fluctuations with horizontal scales less than 825 km will pass the high-pass filter. The high-pass filter will select only the temperature fluctuations along the suborbital track with horizontal spatial scales less than 825 km. Figure 1 shows the filtered temperature fluctuation at 90 km height observed by Aura/MLS over the southern polar region (70° S to 82° S) on 14 July 2009. The mean gravity wave amplitude is given by the standard deviation of these fluctuations, which is 1.0 K in this example. For each day, we can calculate the standard deviation of the temperature fluctuations in the selected region: northern polar region (70° N to 82° N), southern polar region (70° S to 82° S), and equatorial region (10° S to 10° N). The daily time series of the standard deviations for the time interval from August 2004 to December 2021 are analyzed for interhemispheric differences, seasonal variations, interannual variations in inertia gravity waves, and influences of major sudden stratospheric warmings (SSWs) on inertia gravity waves.
Figure 1.
High-pass-filtered temperature fluctuations at 90 km height observed by Aura/MLS over the southern polar region on 14 July 2009. The standard deviation of the temperature fluctuations is 1.0 K.
The angle between the gravity wave propagation direction and the suborbital track vector plays a big role for the sensitivity of Aura/MLS for gravity waves [7]. If the gravity wave propagates parallel to the suborbital track, then Aura/MLS can measure gravity waves with horizontal wavelengths between 200 km (length of sounding volume) and 825 km (cutoff of high-pass filter). The temperature fluctuations due to tidal and planetary waves propagating in zonal directions are successfully suppressed by the filtering process.
The fast Fourier transform (FFT) amplitude spectrum is computed for the equatorial gravity wave amplitude (daily standard deviation of temperature fluctuation) from August 2004 to December 2021. A Hamming window was applied, and zero padding reduced the spacing of the frequency grid by a factor of 3. The amplitude was calibrated by means of a sine wave of a known amplitude.
For January 2010, we calculated polar maps of the mean standard deviation (mean gravity wave amplitude) of the high-pass-filtered temperature fluctuations, . The grid points of the maps have a distance of 2.5° in latitude and 5° in longitude. The grid cell widths are 5° in latitude and 10° in longitude so that there is an overlap. The standard deviation of all high-pass-filtered temperature fluctuations, , in January 2010 within a certain grid cell are averaged for each altitude.
Composite analysis or superposed epoch analysis was applied to the time series of the standard deviation over the northern polar region (70° N to 82° N). The central dates of the northern hemispheric SSWs were taken from the U60 column of the table in [30]. U60 means the reversal of the eastward wind at 10 hPa at 60° N. The time point of this wind reversal is taken as the central date of the SSW, which also stands for the onset of the SSW. Ten major SSWs occurred in the time period from 2004 to 2021, which are listed in Table 1.
Table 1.
Central dates of the 10 major SSWs in the Northern Hemisphere from August 2004 to December 2021. The number in the bracket serves as an identifier of the SSW event.
For the investigation of SSWs, the reversal of the eastward wind at 10 hPa and 60° N is used as a timing mark for the SSW’s onset (central date of SSW). This timing mark l corresponds to the epoch time of 0, and all observed features that are associated with this event can be measured in days of epoch time before and after the SSW onset. The various SSW events as functions of epoch time can be averaged, and the result is a mean SSW impact on the gravity wave amplitude as a function of epoch time.
3. Results
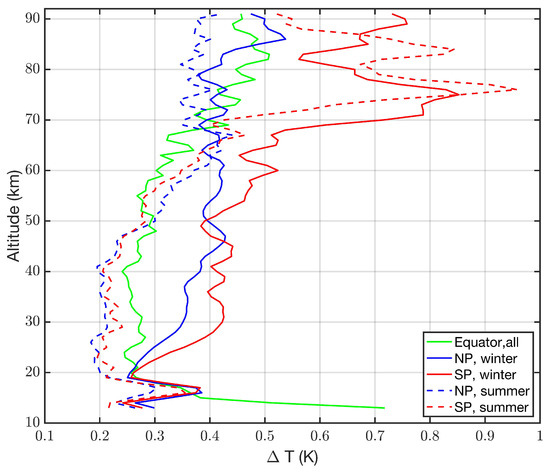
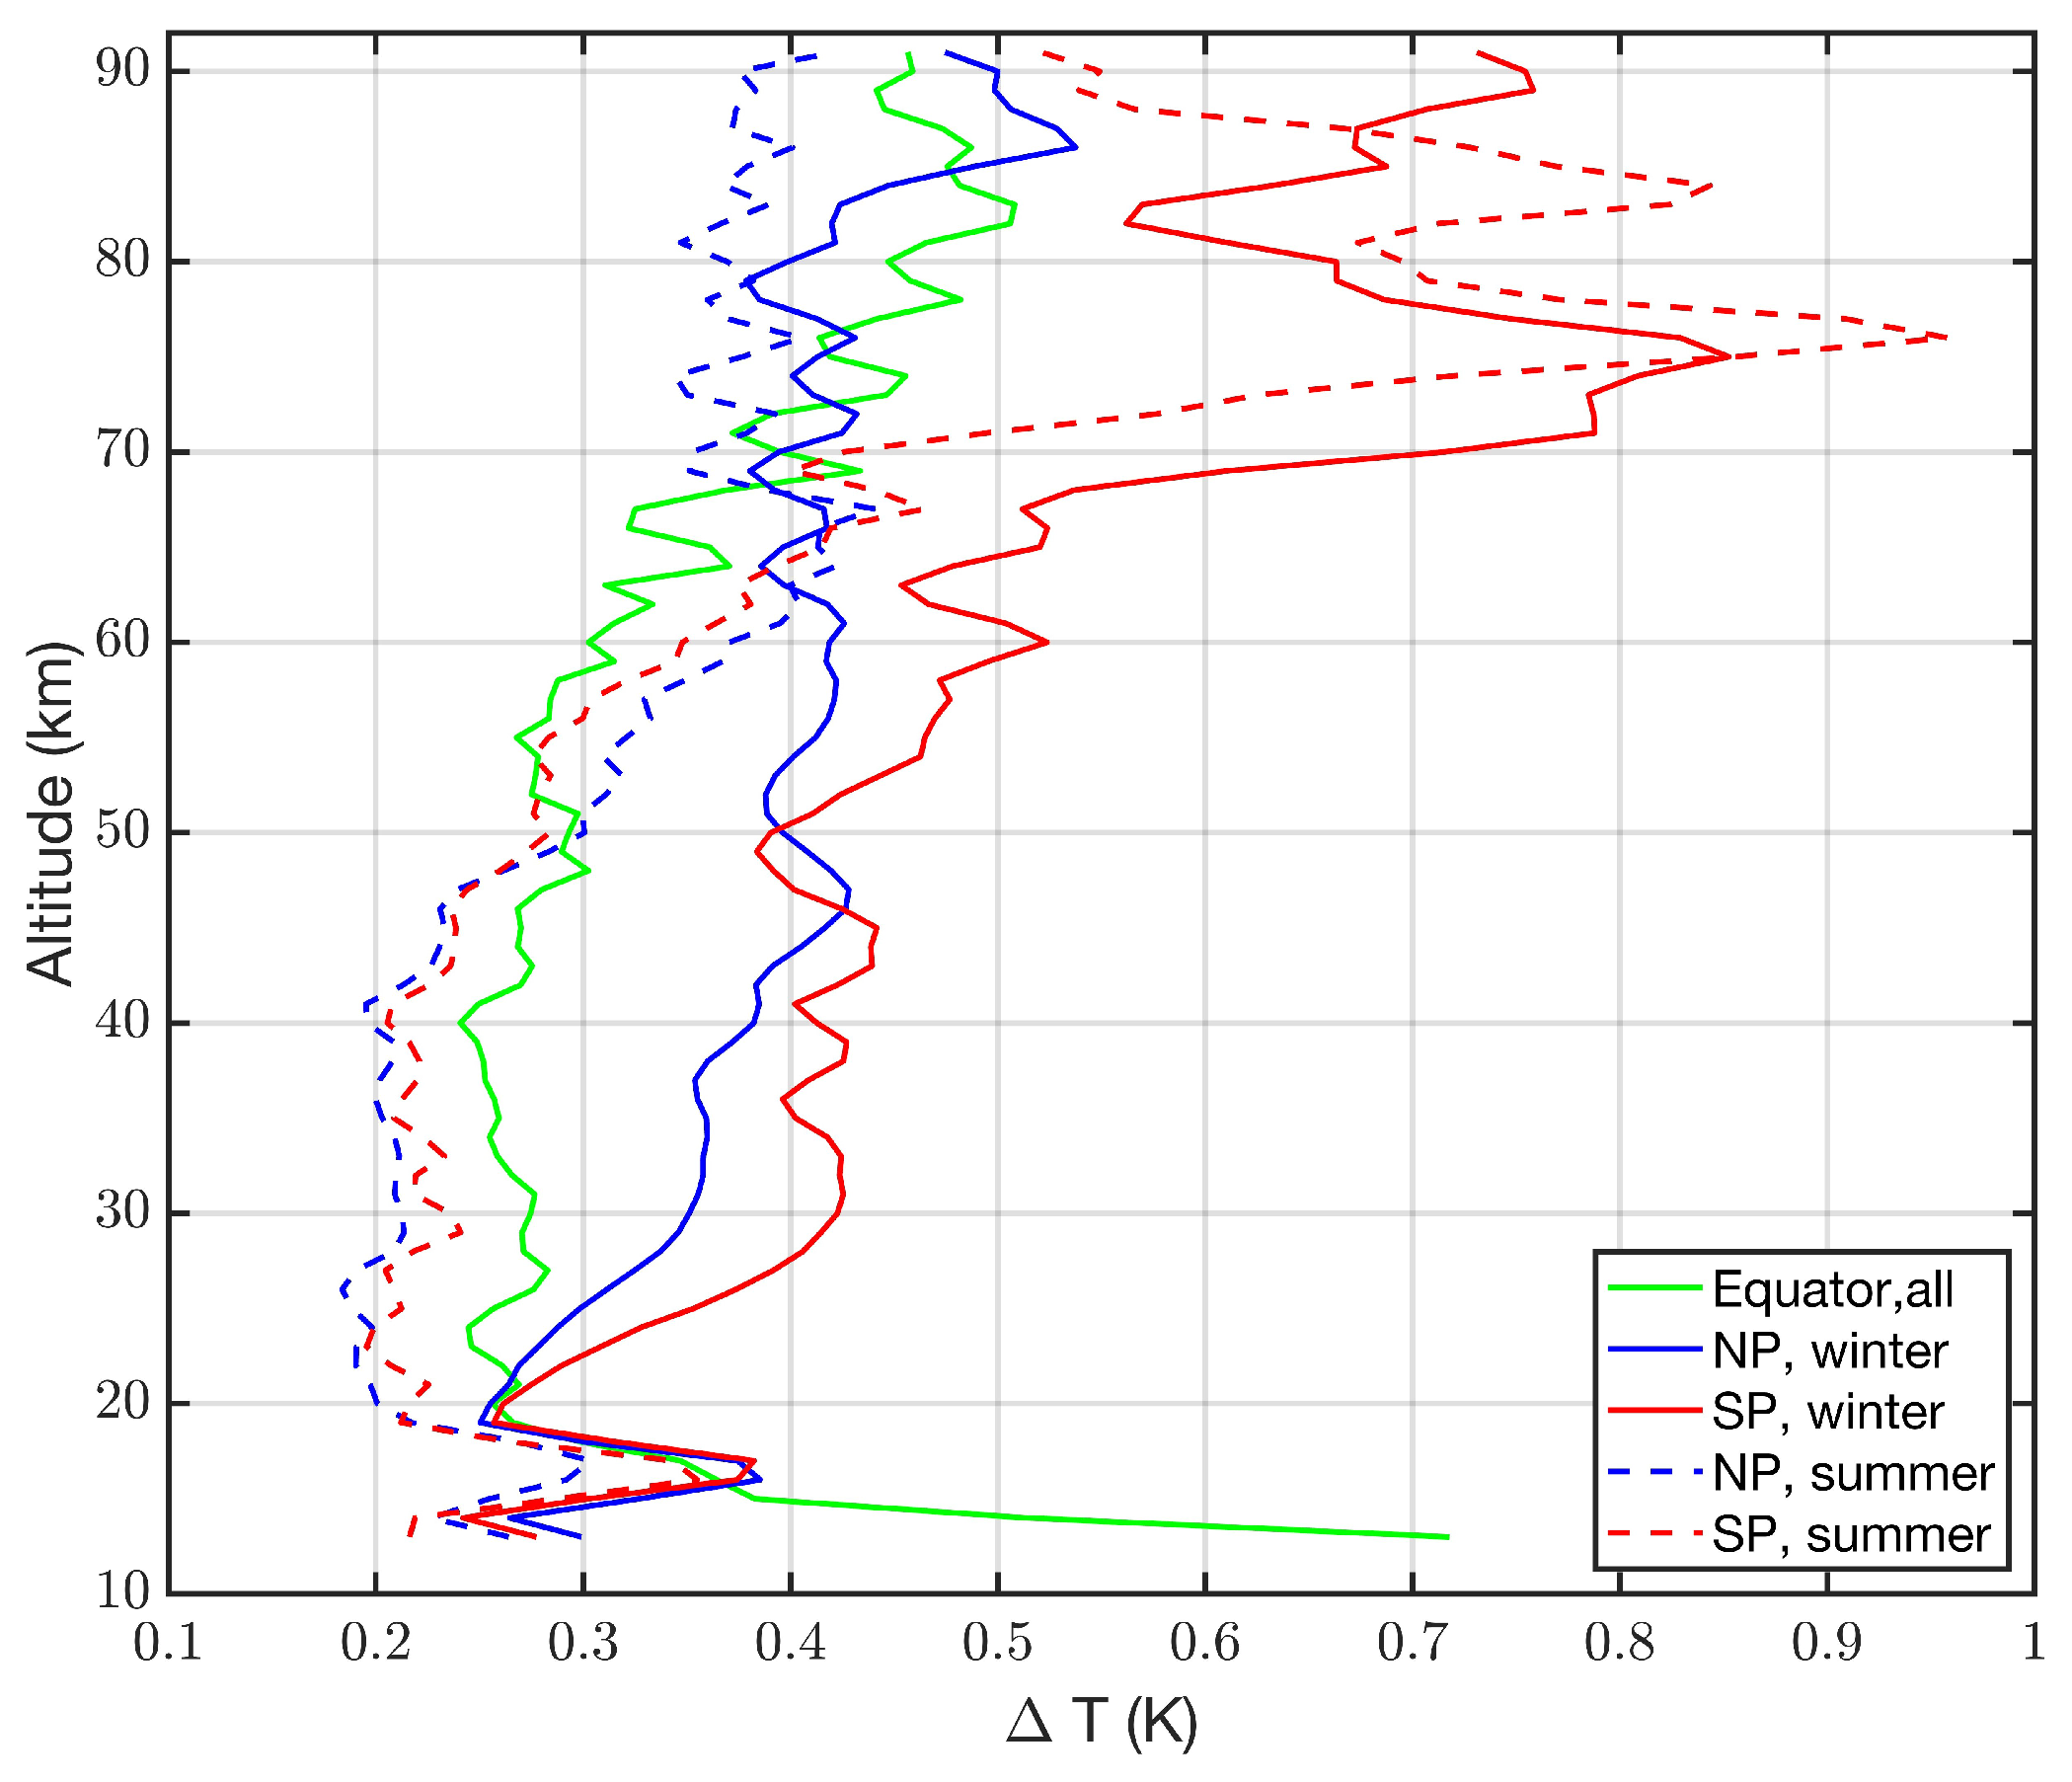
To compare the differences in the average inertia gravity wave amplitude in the selected regions, we averages the profiles of the standard deviations for winter, summer, and all seasons during the time interval from January 2005 to December 2021. The winter or summer season includes either the months of December, January, and February or June, July, and August. The averaged profiles of the mean gravity wave amplitude is depicted in Figure 2. Generally, the amplitudes increase with height. The amplitudes in the winter are larger than in the summer in each hemisphere. Most evident is that the amplitudes in the southern polar mesosphere (red and dashed red lines) are larger by a factor of up to 2 than the corresponding amplitudes in the northern polar mesosphere (blue and dashed blue lines) at altitudes from 70 to 90 km in the mesosphere. In the stratosphere, the interhemispheric differences are small. Particularly, the values for the northern and southern summer stratosphere are very close together.
Figure 2.
Mean profiles of temperature standard deviation over the equator (all seasons), northern polar region (NP: 70° N–82° N), and southern polar region (SP: 70° S–82° S). Winter and summer refer to the months of December, January, and February or June, July, and August. The averages are taken over the time interval from January 2005 to December 2021.
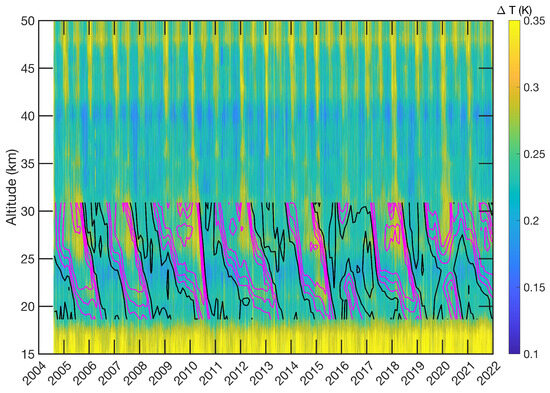
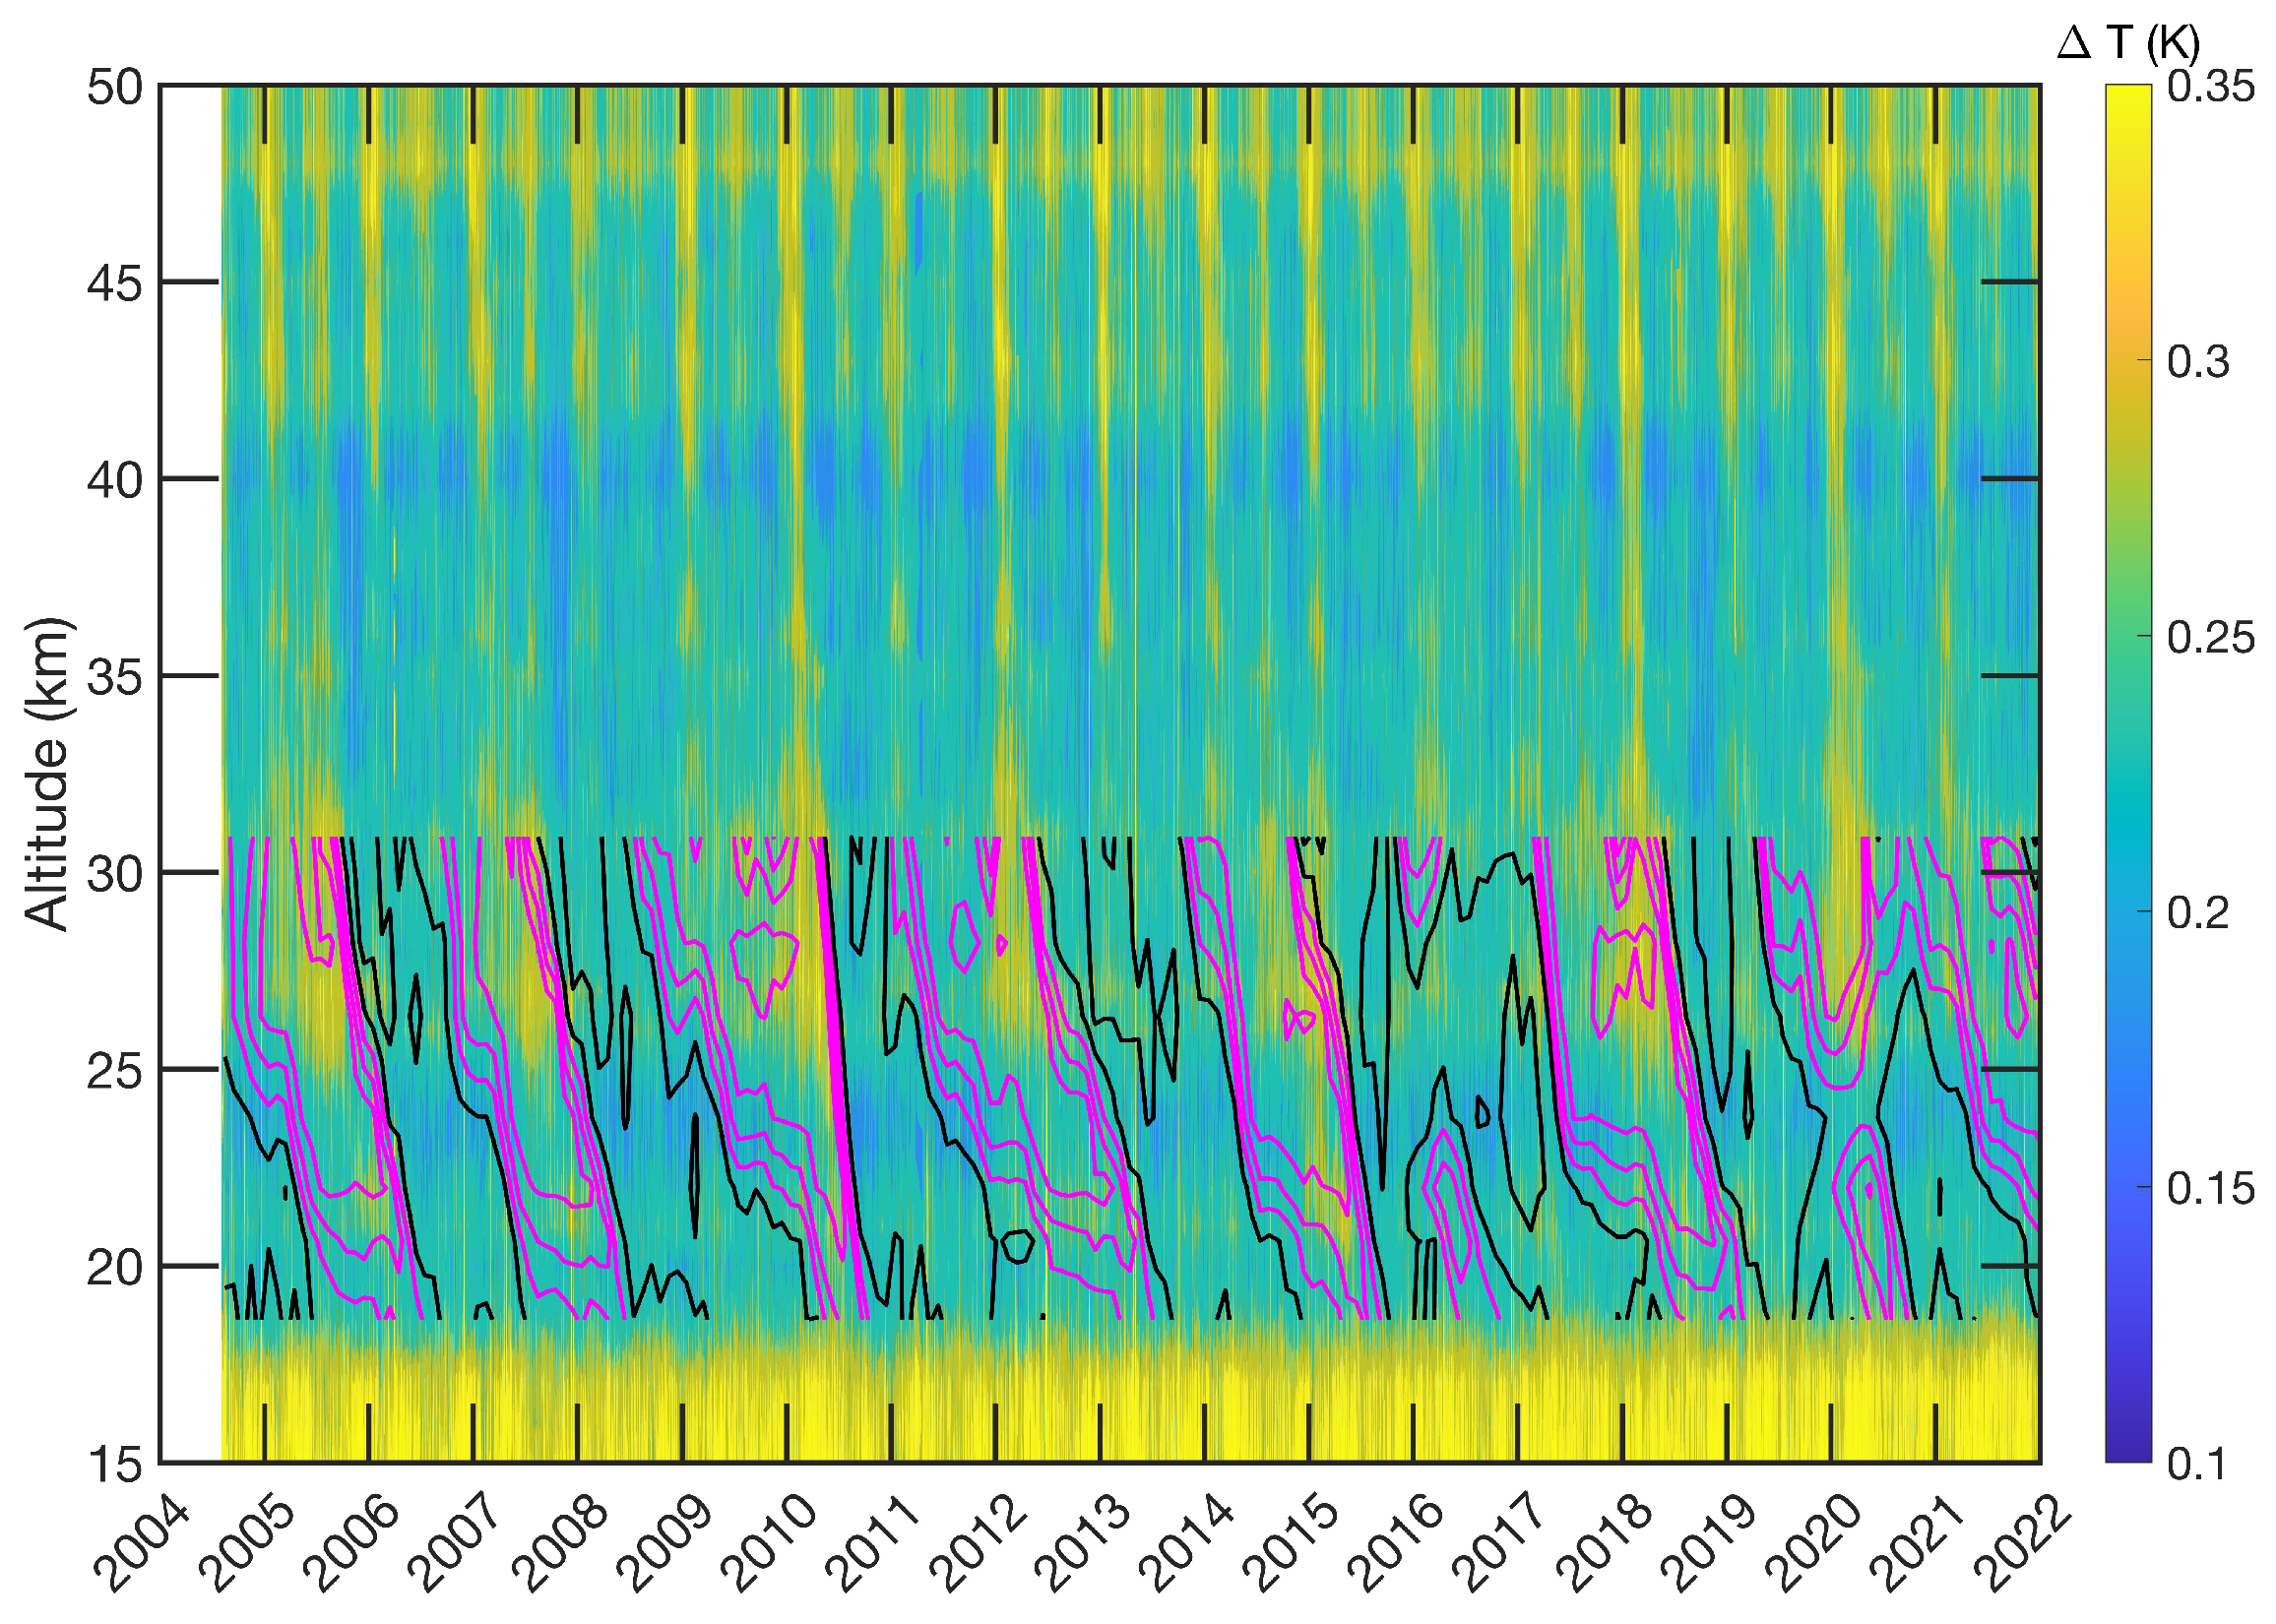
As the next point, we investigate the modulations in inertia gravity wave amplitudes in the equatorial region. Figure 3 shows the time series of the standard deviation from August 2004 to December 2021. Below the tropical tropopause (about 18 km height), the amplitudes are increased. In the mid-stratosphere, a QBO modulation is obvious in the amplitude. The gravity wave’s amplitude is increased at the end of the easterly phase of the QBO. The superposed magenta contour lines depict the easterly wind, while the black contour lines depict the westerly wind observed by radiosondes at Singapore. The zonal wind in the equatorial mid-stratosphere changes its direction with a period of about 28 months (QBO). This long-term oscillation of the zonal wind is driven by equatorial Kelvin waves and gravity waves [31].
Figure 3.
Modulation of the gravity wave amplitude in the equatorial region (10° S to 10° N) by the QBO (lower and middle stratosphere) and by the semiannual oscillation (SAO, upper stratosphere). The magenta and black contour lines denote easterly and westerly winds in Singapore, respectively. Gravity waves are enhanced at the end of the easterly phase of the QBO at 25–30 km height.
In the upper stratosphere (40 to 50 km altitude), Figure 3 shows semiannual and annual oscillations (SAOs and AOs) of the gravity wave amplitude. The yellow wave crests of the QBO in the mid-stratosphere pass over to the wave crests of the SAO and AO in the upper stratosphere.
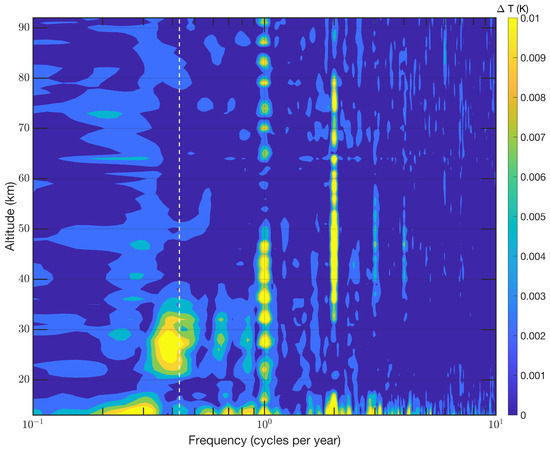
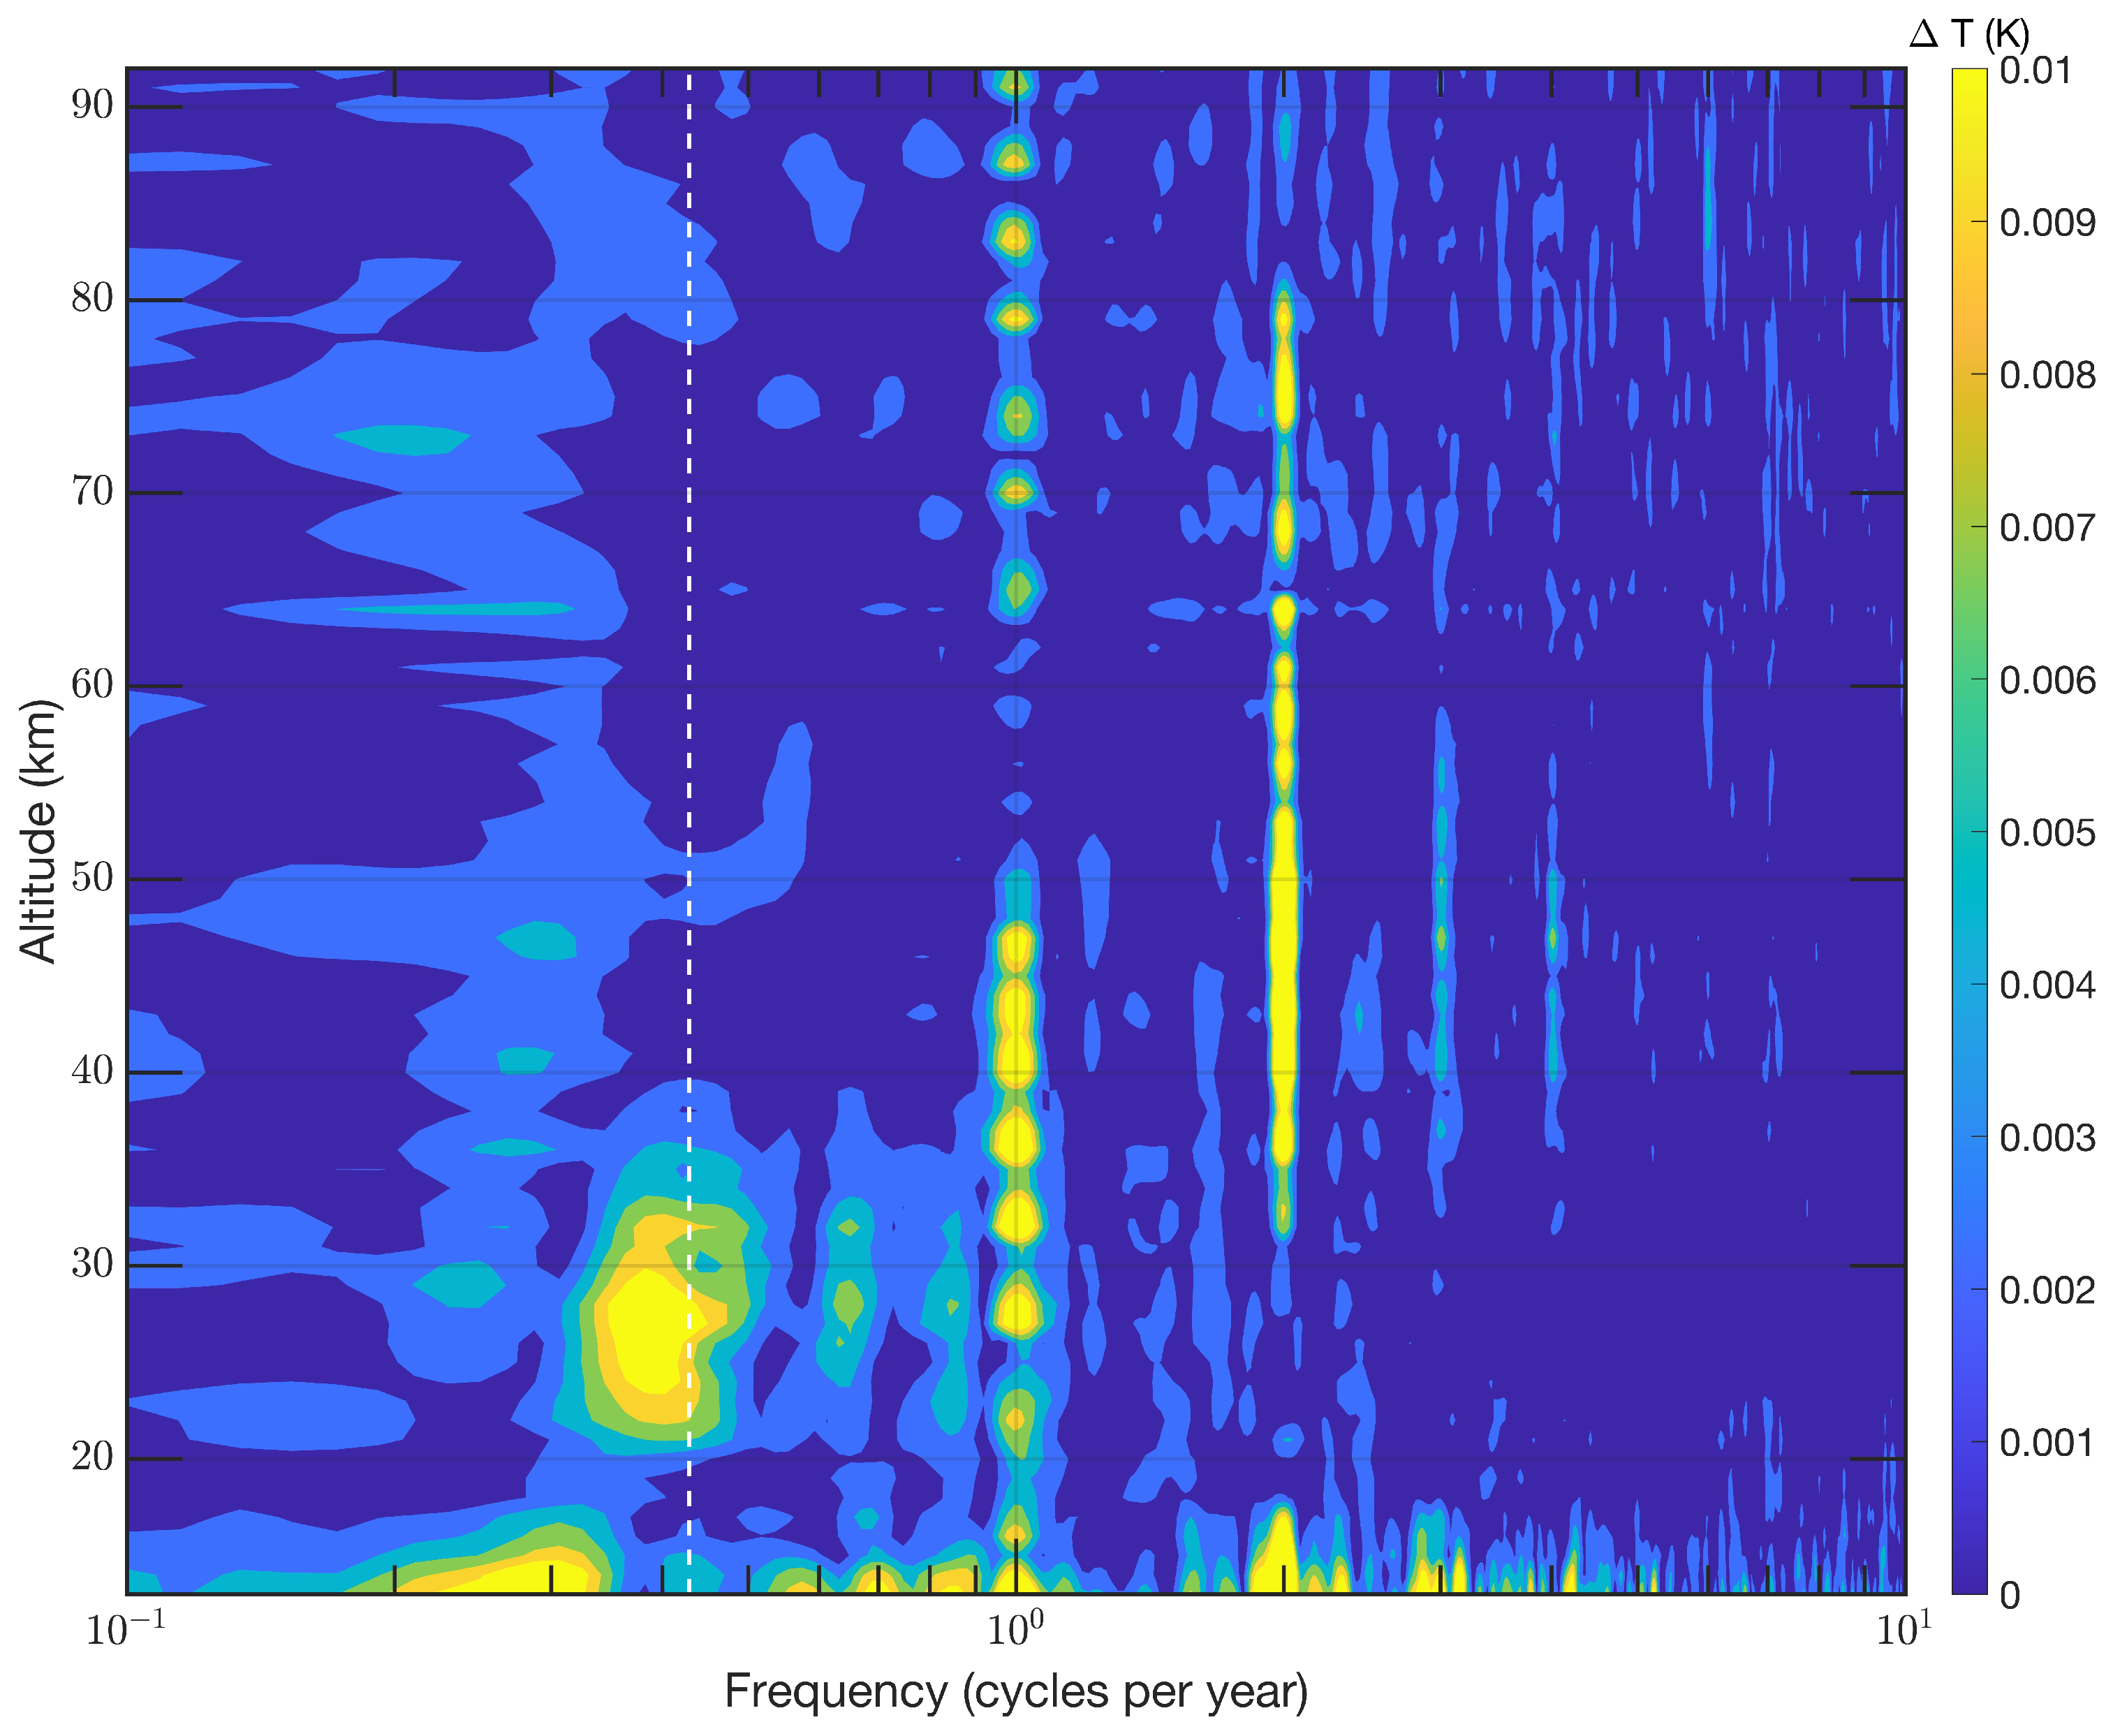
The FFT spectrum of the temporal variations of the gravity wave amplitude in the equatorial region is shown in Figure 4. The dominant oscillations are the QBO in the mid-stratosphere and the SAO and AO in the upper stratosphere and mesosphere. The SAO and AO peaks also occur in the upper troposphere. It is a remarkable result that the inertia gravity waves in the mesosphere are not modulated by the QBO. There are many investigations about possible influences of the QBO on the upper atmosphere and ionosphere. Generally, the modulations of the gravity wave amplitude in the equatorial region are small. We also checked if there is a QBO signal in the gravity wave amplitude series of the northern and southern polar stratosphere and mesosphere, but we found no QBO signal in the high-latitude gravity wave’s activity.
Figure 4.
FFT spectra showing the weak temporal modulations (<0.01 K) of the gravity wave amplitude in the equatorial region (10° S to 10° N). The modulation periods are at 28 months (QBO, white dashed line), 1 year (AO), and 0.5 year (SAO). There is no QBO modulation of the gravity waves in the mesosphere.
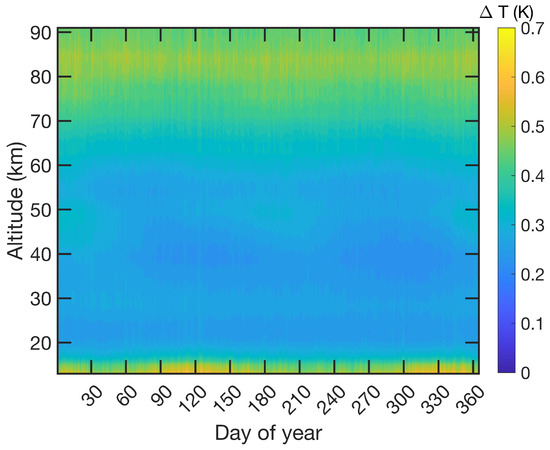
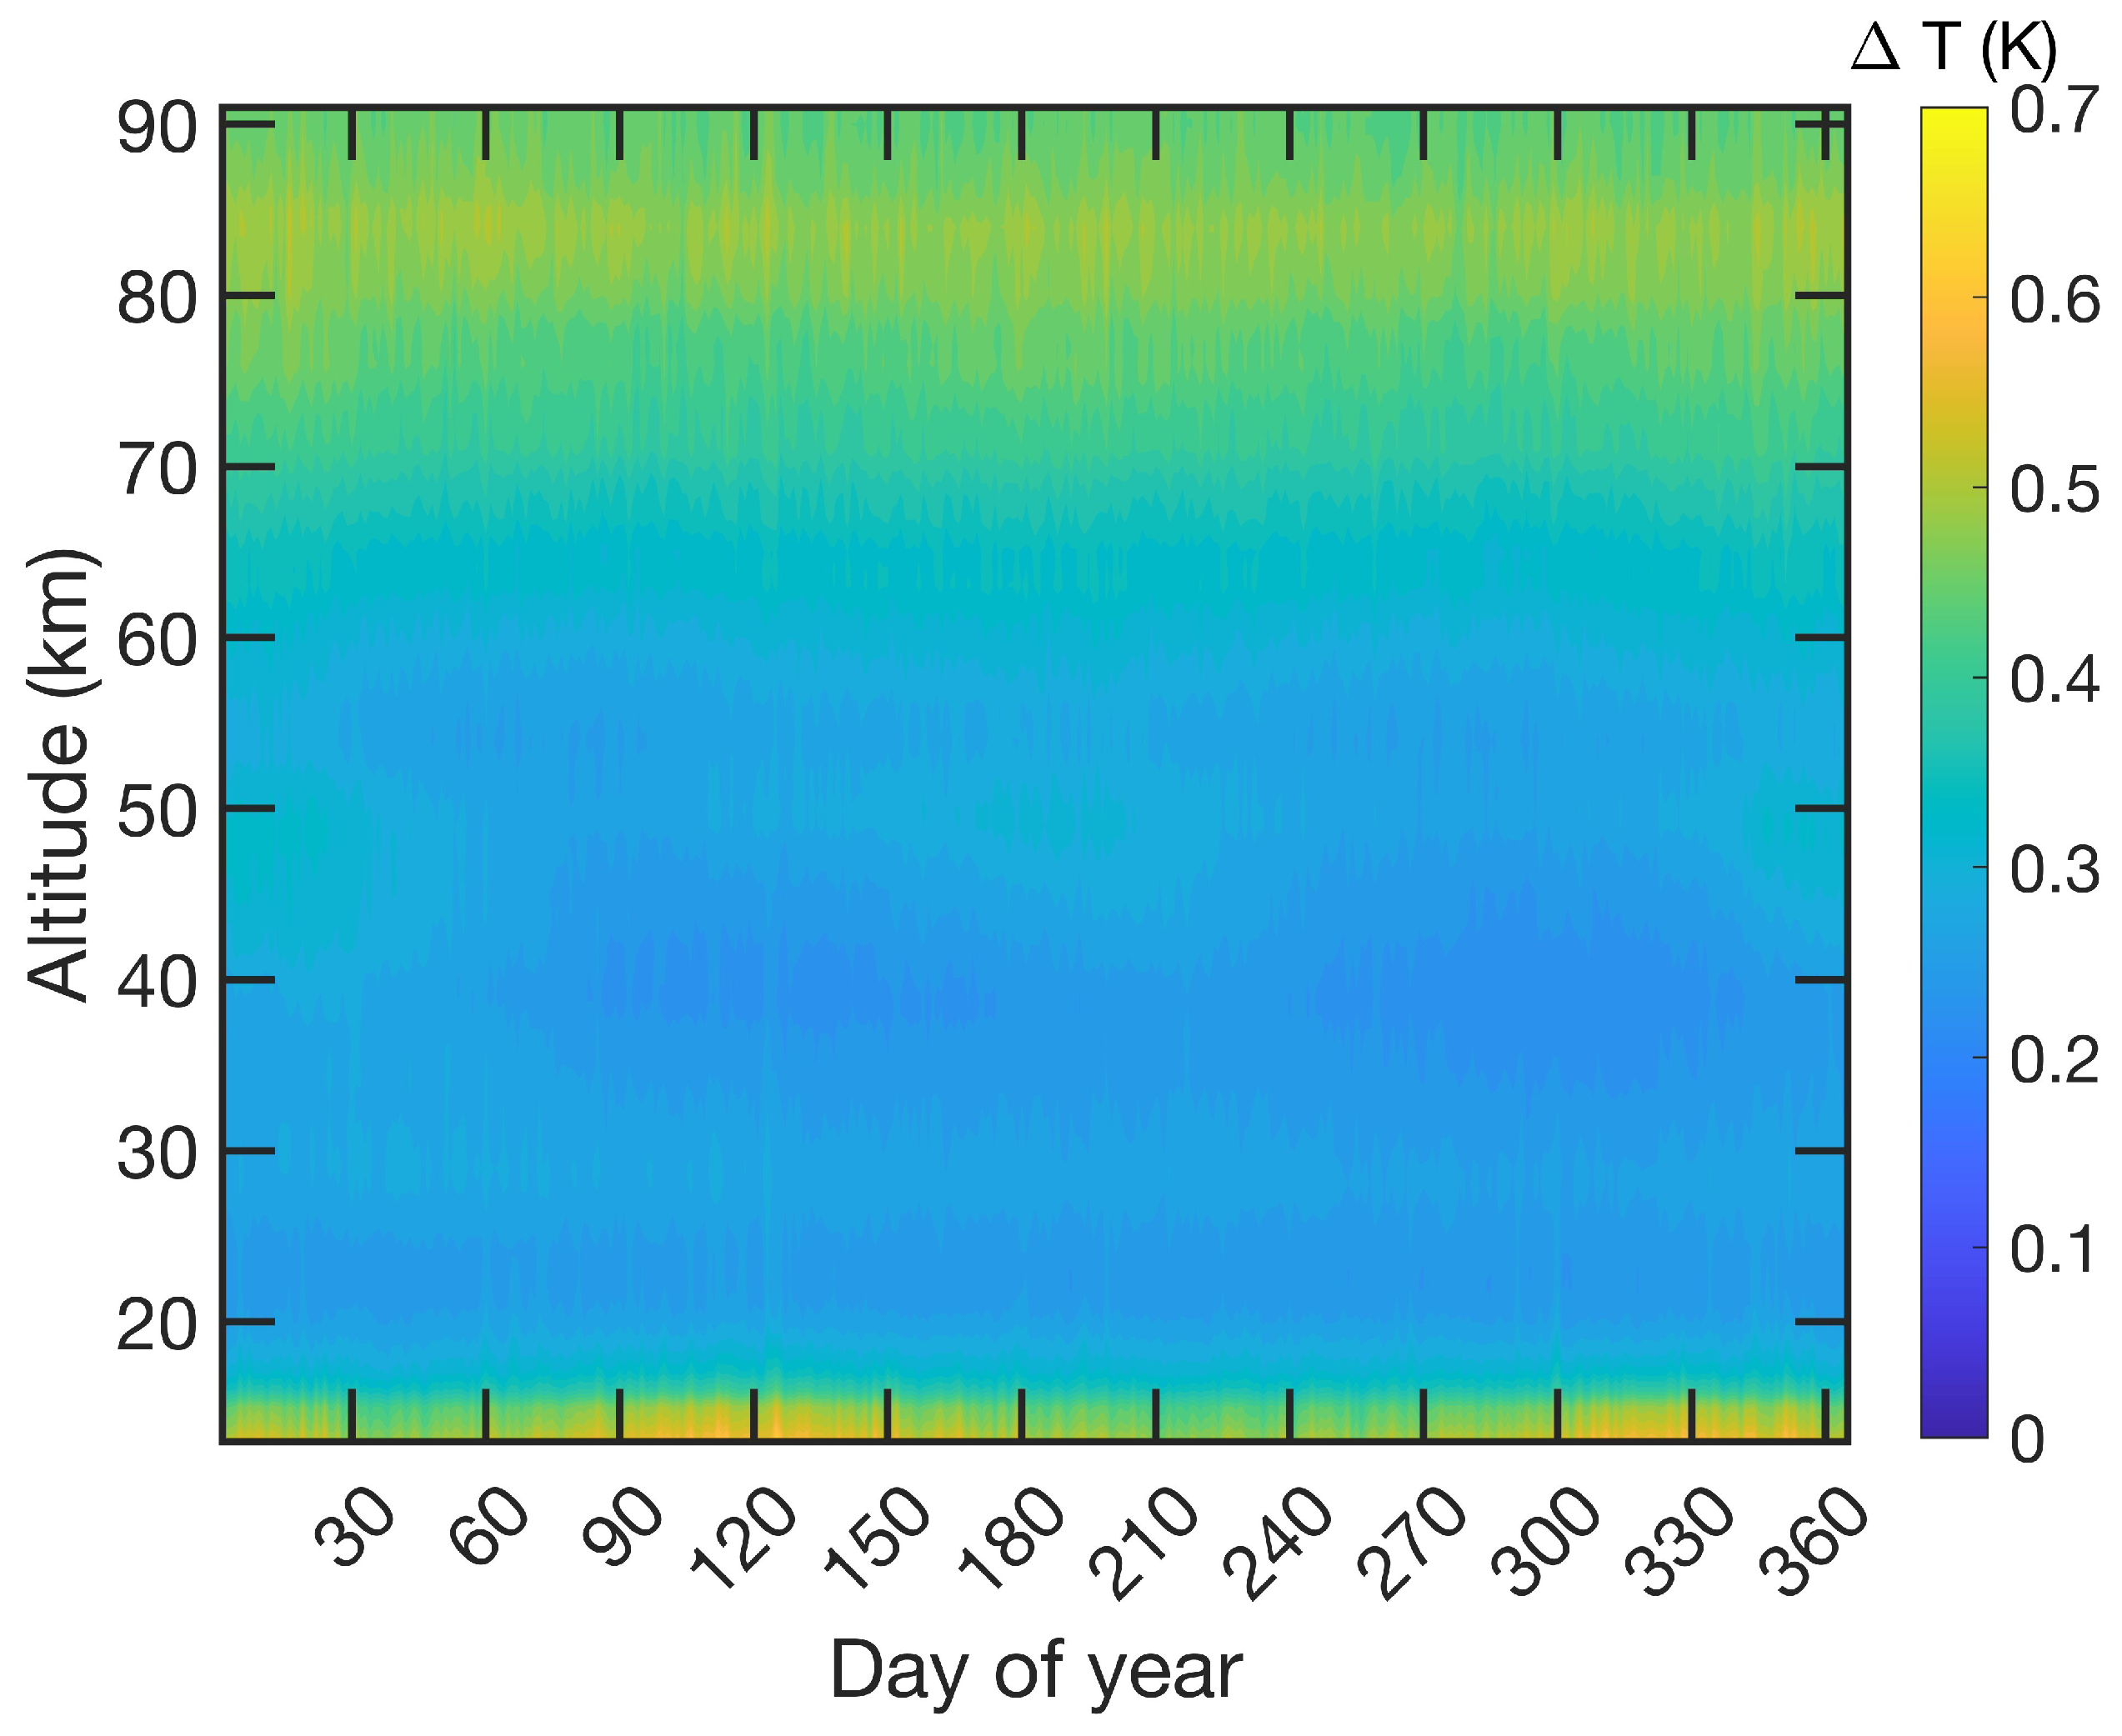
Figure 5 shows the mean seasonal variation of the gravity wave amplitude in the equatorial region. It is obvious that the seasonal variation is quite small, but signatures of the SAO and AO are present (maxima at solstices). Please note that the vertical profiles of gravity wave amplitudes were smoothed over 10 km in altitude in order to avoid interpolation artifacts due to the limited vertical resolution of Aura/MLS.
Figure 5.
Seasonal variation in the gravity wave amplitude in the equatorial region (10° S to 10° N), averaged over the time interval from August 2004 to December 2021.
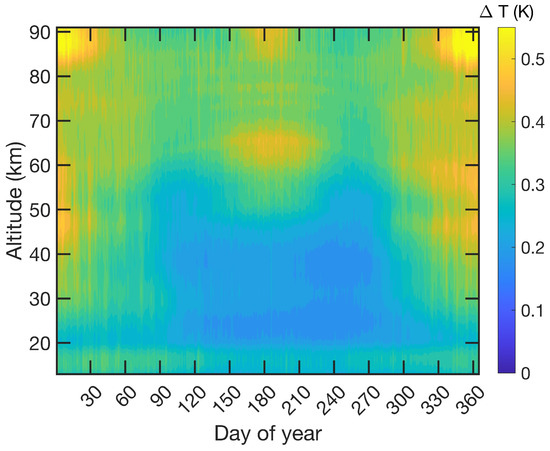
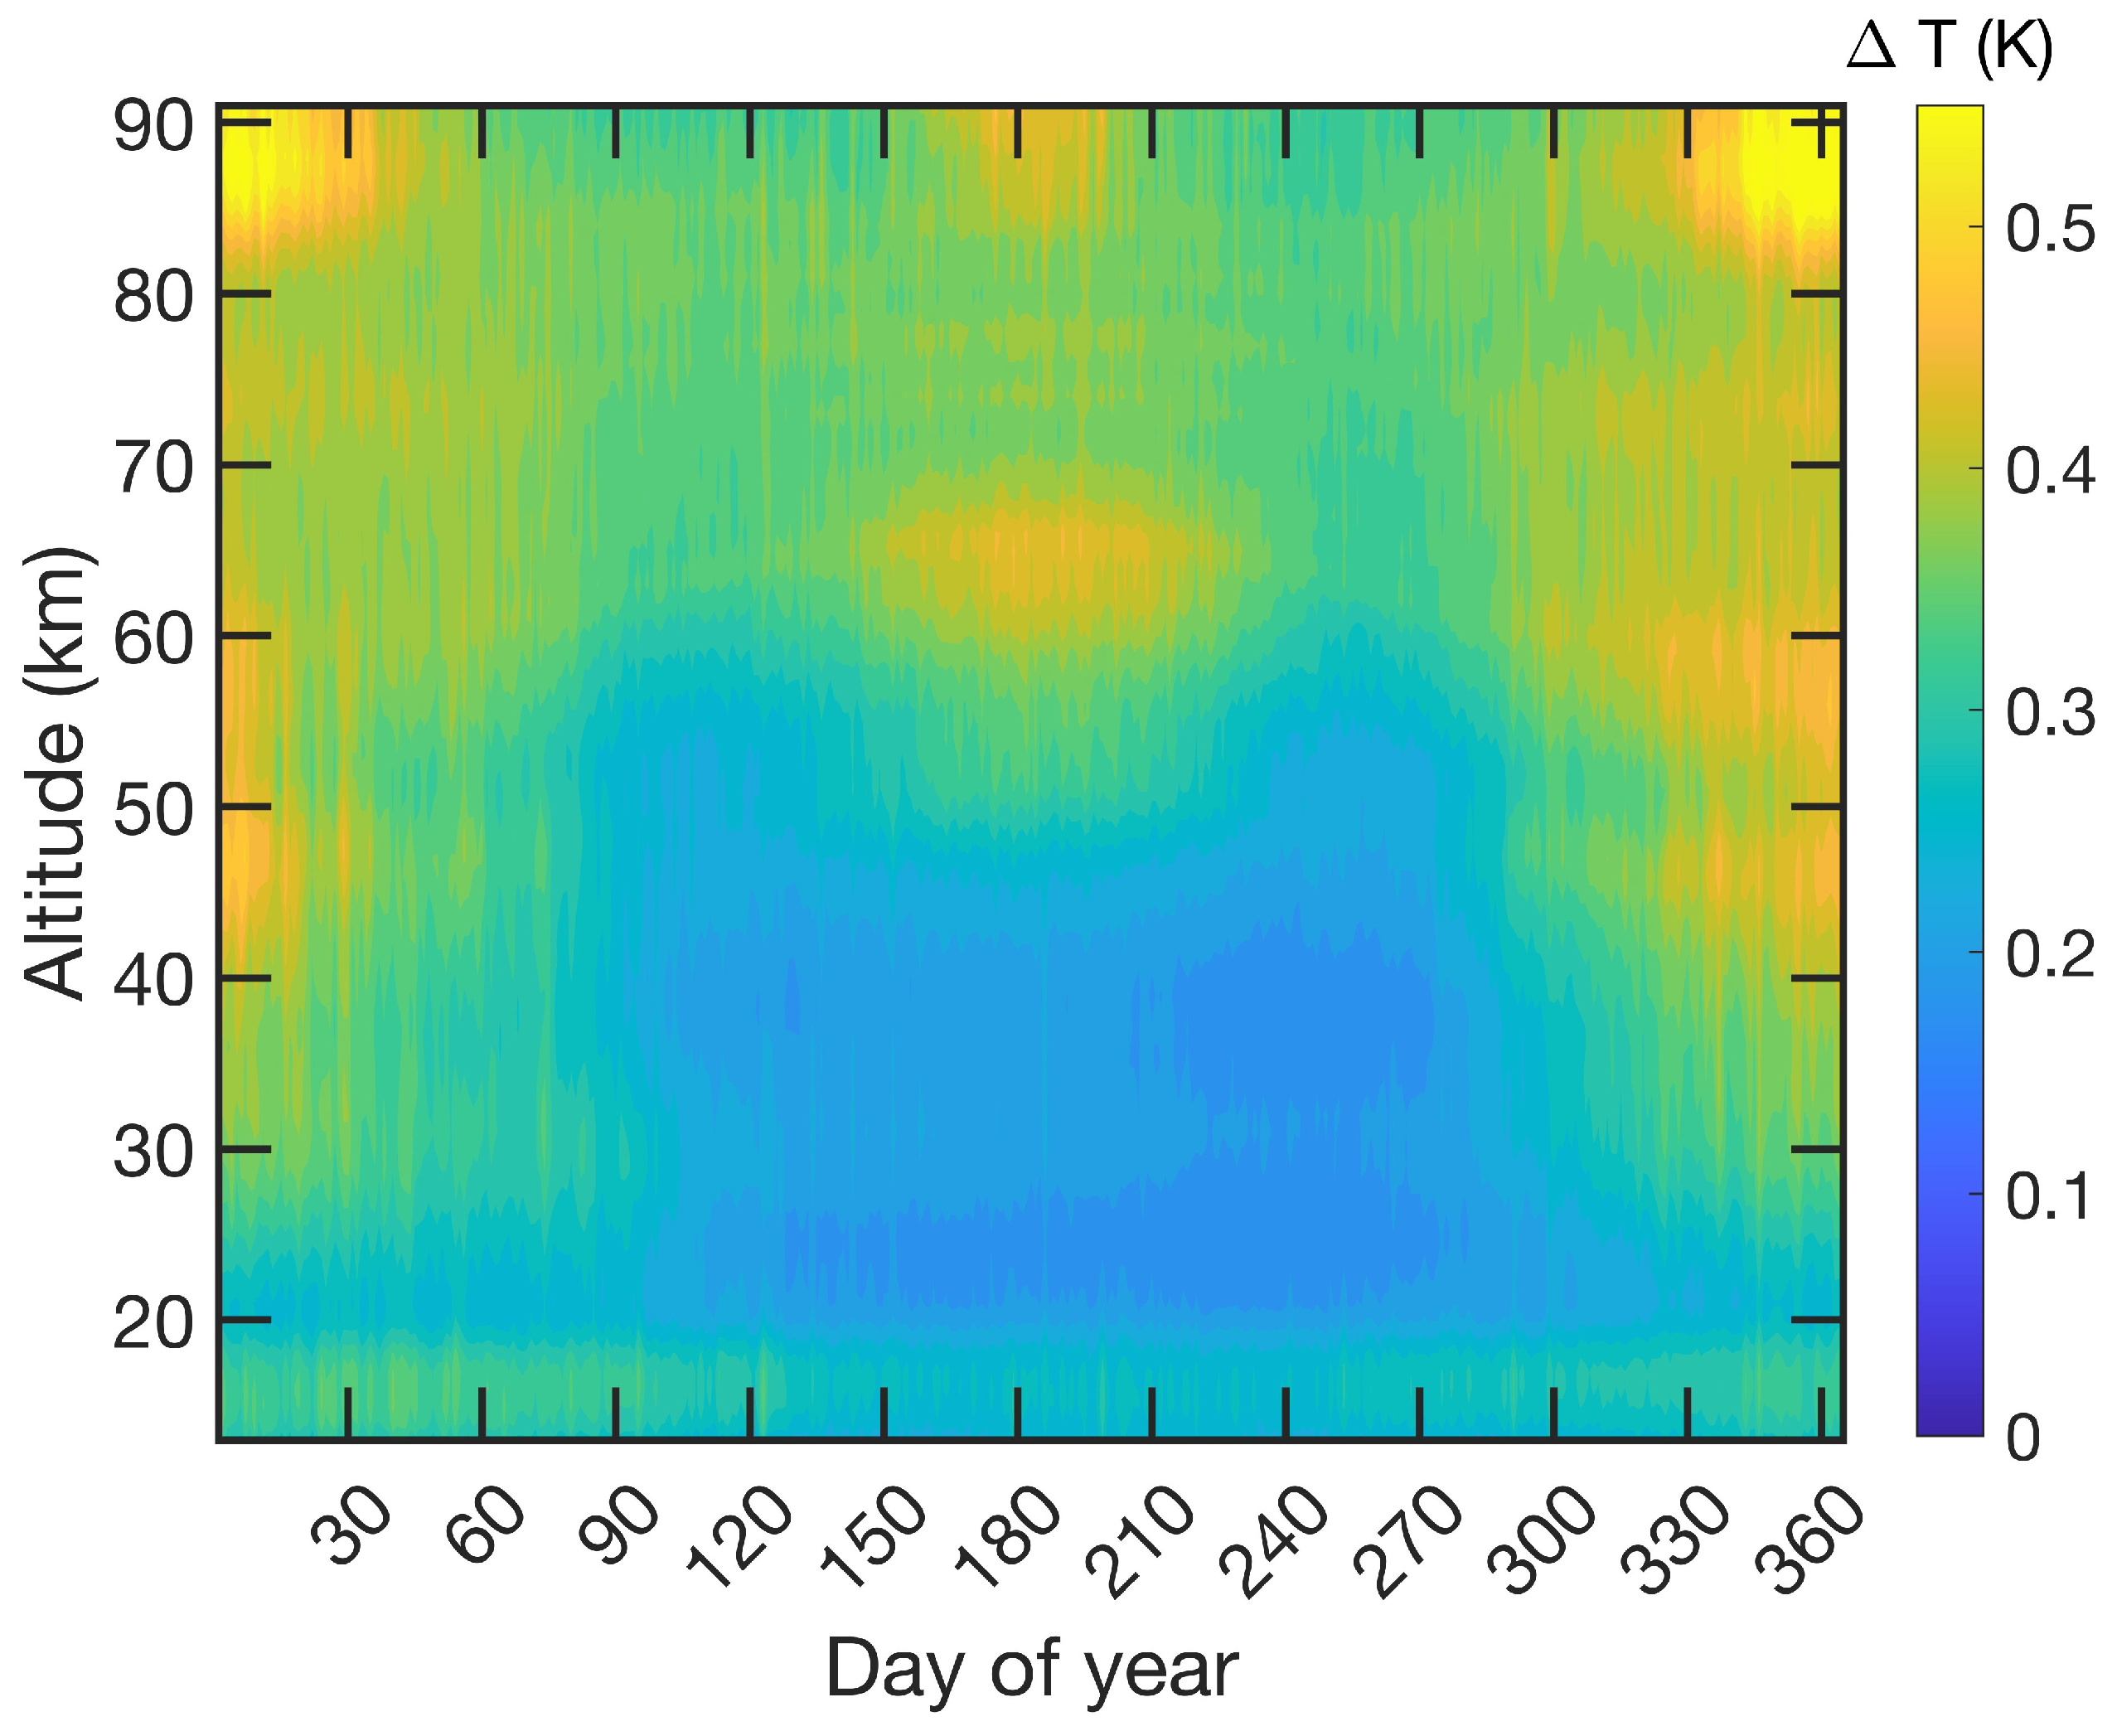
Figure 6 shows the mean seasonal variation of the gravity wave amplitude in the northern polar region. The seasonal variation is stronger in the northern polar region than in the equatorial region in Figure 5. Maximum amplitudes occur in the winter in the stratopause region and upper mesosphere. Smaller local maxima are present in the summer (day of year 150–240) at 60 km and in the upper mesosphere at 88 km. Please note that the vertical profiles of gravity wave amplitude were smoothed over 10 km in altitude in order to avoid interpolation artifacts due to limited vertical resolution of Aura/MLS.
Figure 6.
Seasonal variation in the gravity wave amplitude in the northern polar region (70° N to 82° N), averaged over the time interval from August 2004 to December 2021. Summer is from day of year 150 to 240.
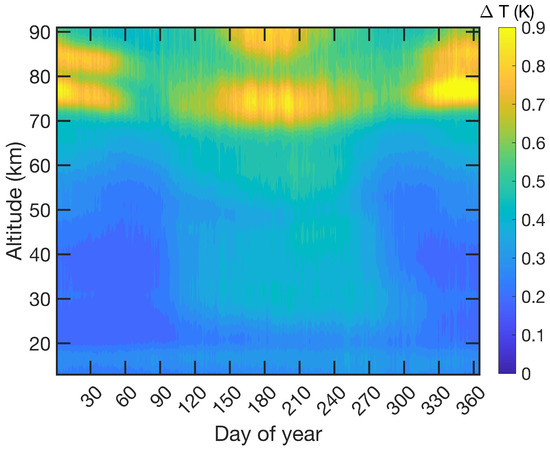
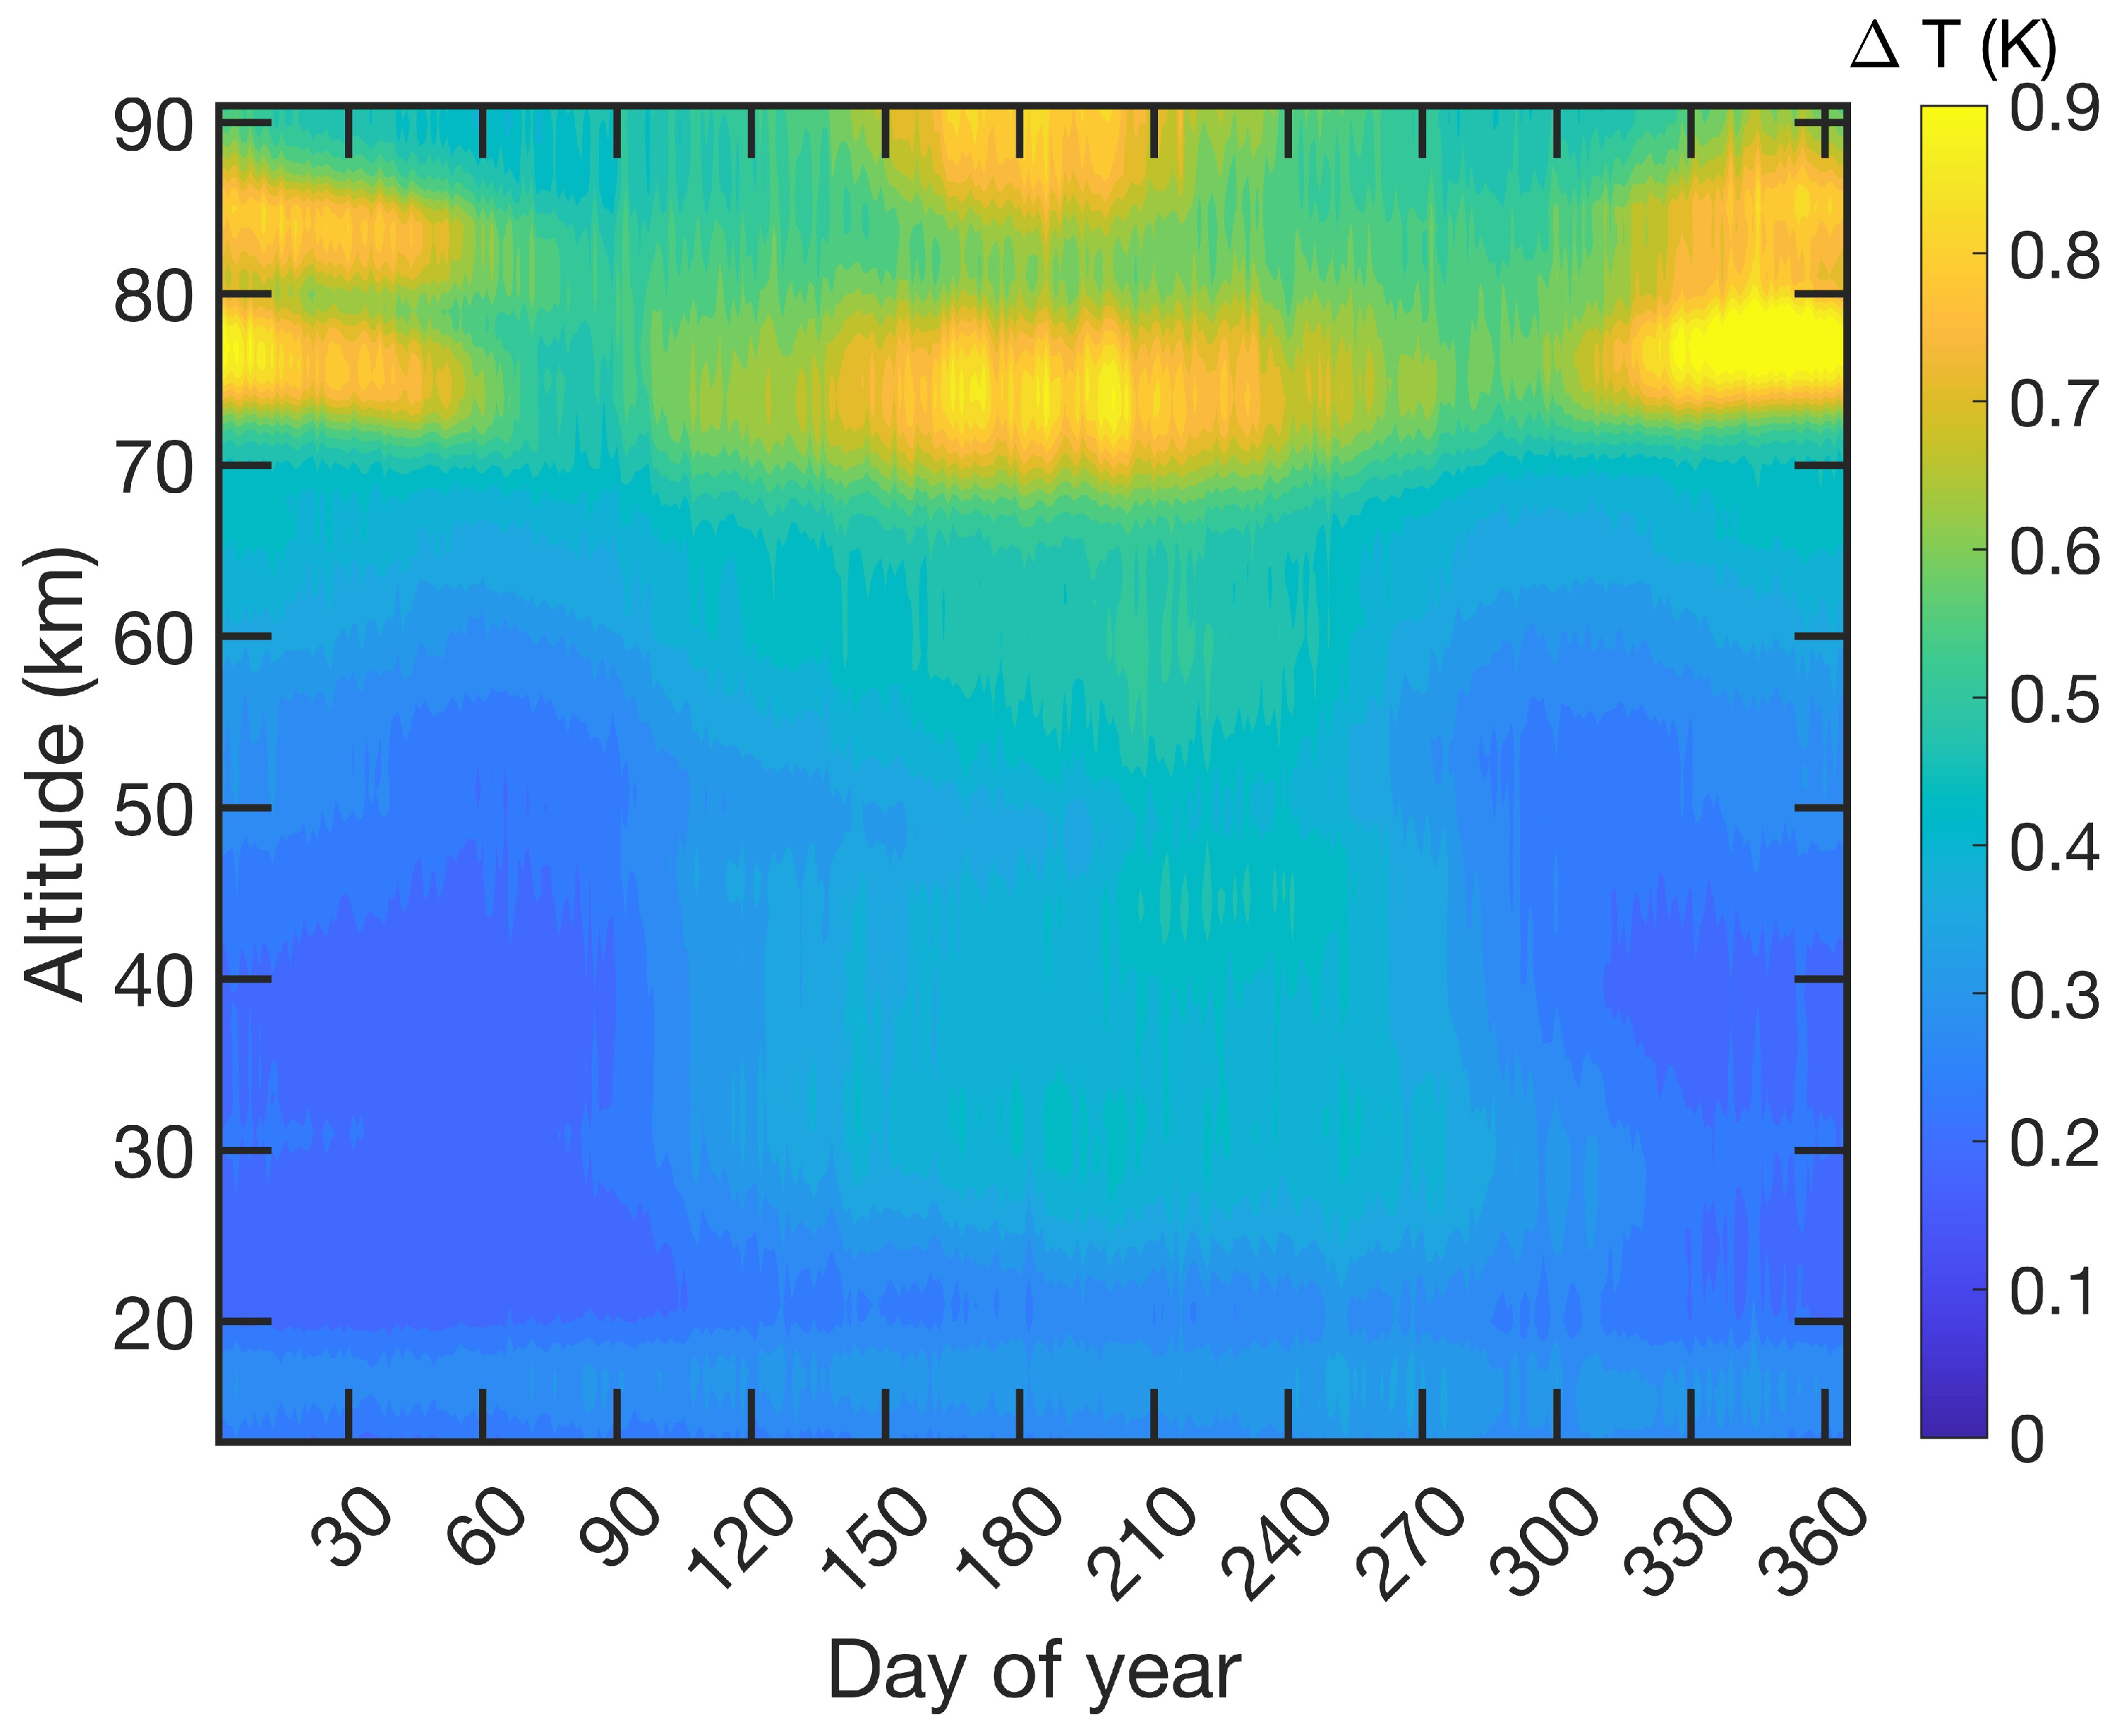
Figure 7 shows the mean seasonal variation in the gravity wave amplitude in the southern polar region. Please note that the vertical profiles of gravity wave amplitude were smoothed over 10 km in altitude in order to avoid interpolation artifacts due to the limited vertical resolution of Aura/MLS. It is obvious that the mesospheric gravity wave amplitudes in the southern polar region are stronger than in the northern polar region. In the mesosphere, there are at the maximum in the summer and the winter. With respect to the difference in the northern polar region, there is a double layer of enhanced wave amplitudes in the mesosphere. For example, in the summer (day of year 1 to 60), there are maxima at 77 km height and 84 km height. The double layer occurs below the cold summer, which is observed at 88 km height by Aura/MLS. In the winter, the double layer occurs again but at heights of 75 km and 90 km. The stratospheric wave activity is clearly higher in the winter season (day of year 150 to 270, June to September) than in the summer season.
Figure 7.
Seasonal variation of the gravity wave amplitude in the southern polar region (70° S to 82° S), averaged over the time interval from August 2004 to December 2021. Winter is from day of year 150 to 240.
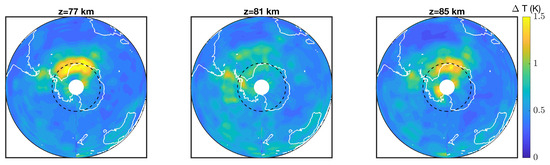
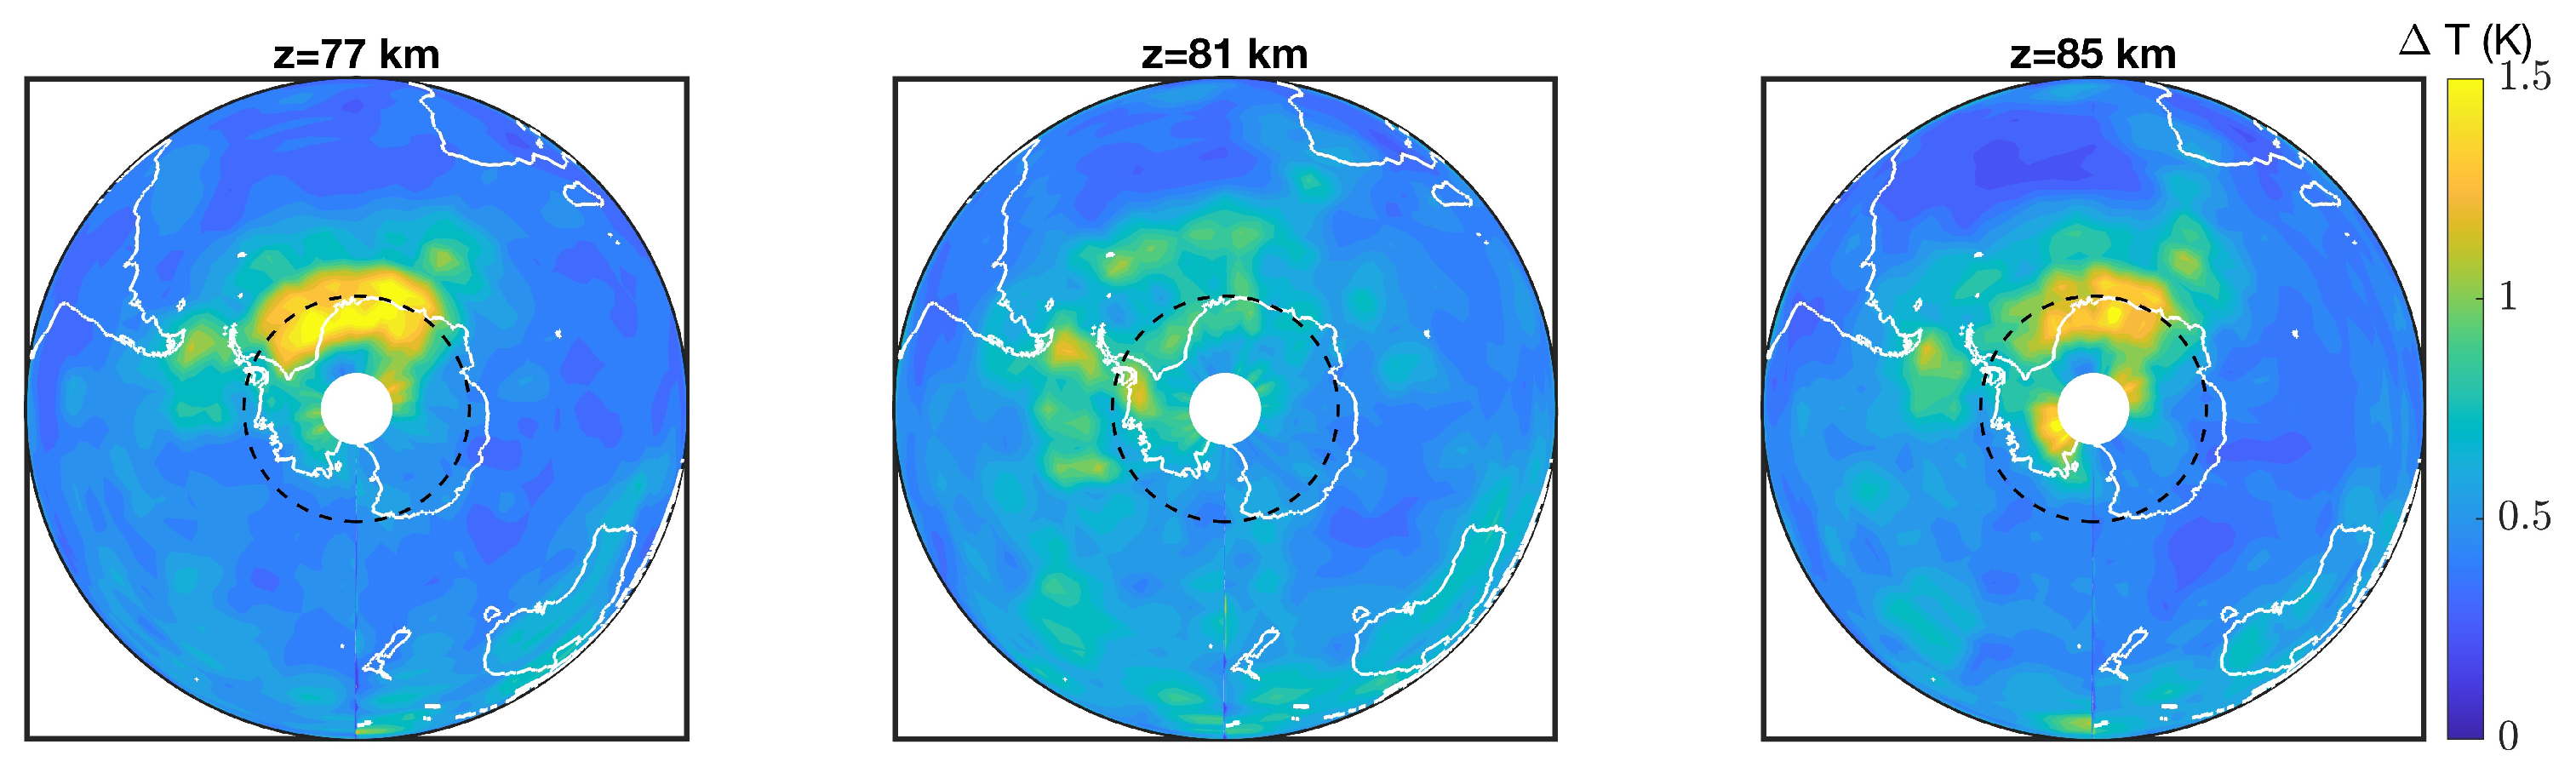
The double layer of enhanced gravity wave activity is a new finding, and thus, we like to show how the double layer depends on the latitude and longitude. Figure 8 shows the gravity wave maps of temperature fluctuations in the southern hemisphere observed in January 2010. The maps at 77 km height and 85 km height show larger gravity wave amplitudes (standard deviation ) than the map at 81 km height. It is an open question why damping occurs at 81 km height between the layers of enhanced amplitudes at 77 and 85 km height. The gravity wave maps show that the double layer occurs in a small region of enhanced gravity wave activity, which is close to the Weddell Sea. Similar gravity wave distributions are obtained in January of other years.
Figure 8.
Gravity wave maps (standard deviation of temperature fluctuations) in the mesosphere over the southern polar region showing the double layer of enhanced gravity wave activity in January 2010. Activity is strong at 77 km height, weak at 81 km height, and then strong again at 85 km height. The dashed black circle is at 70° S.
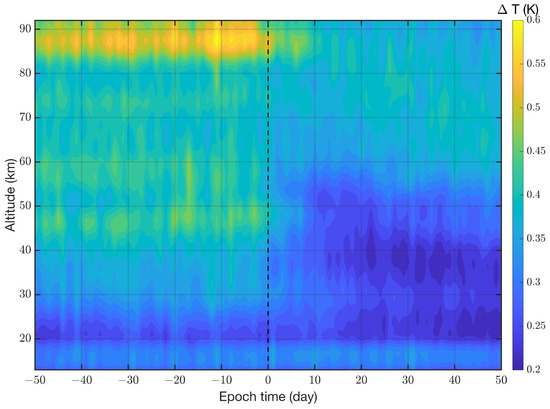
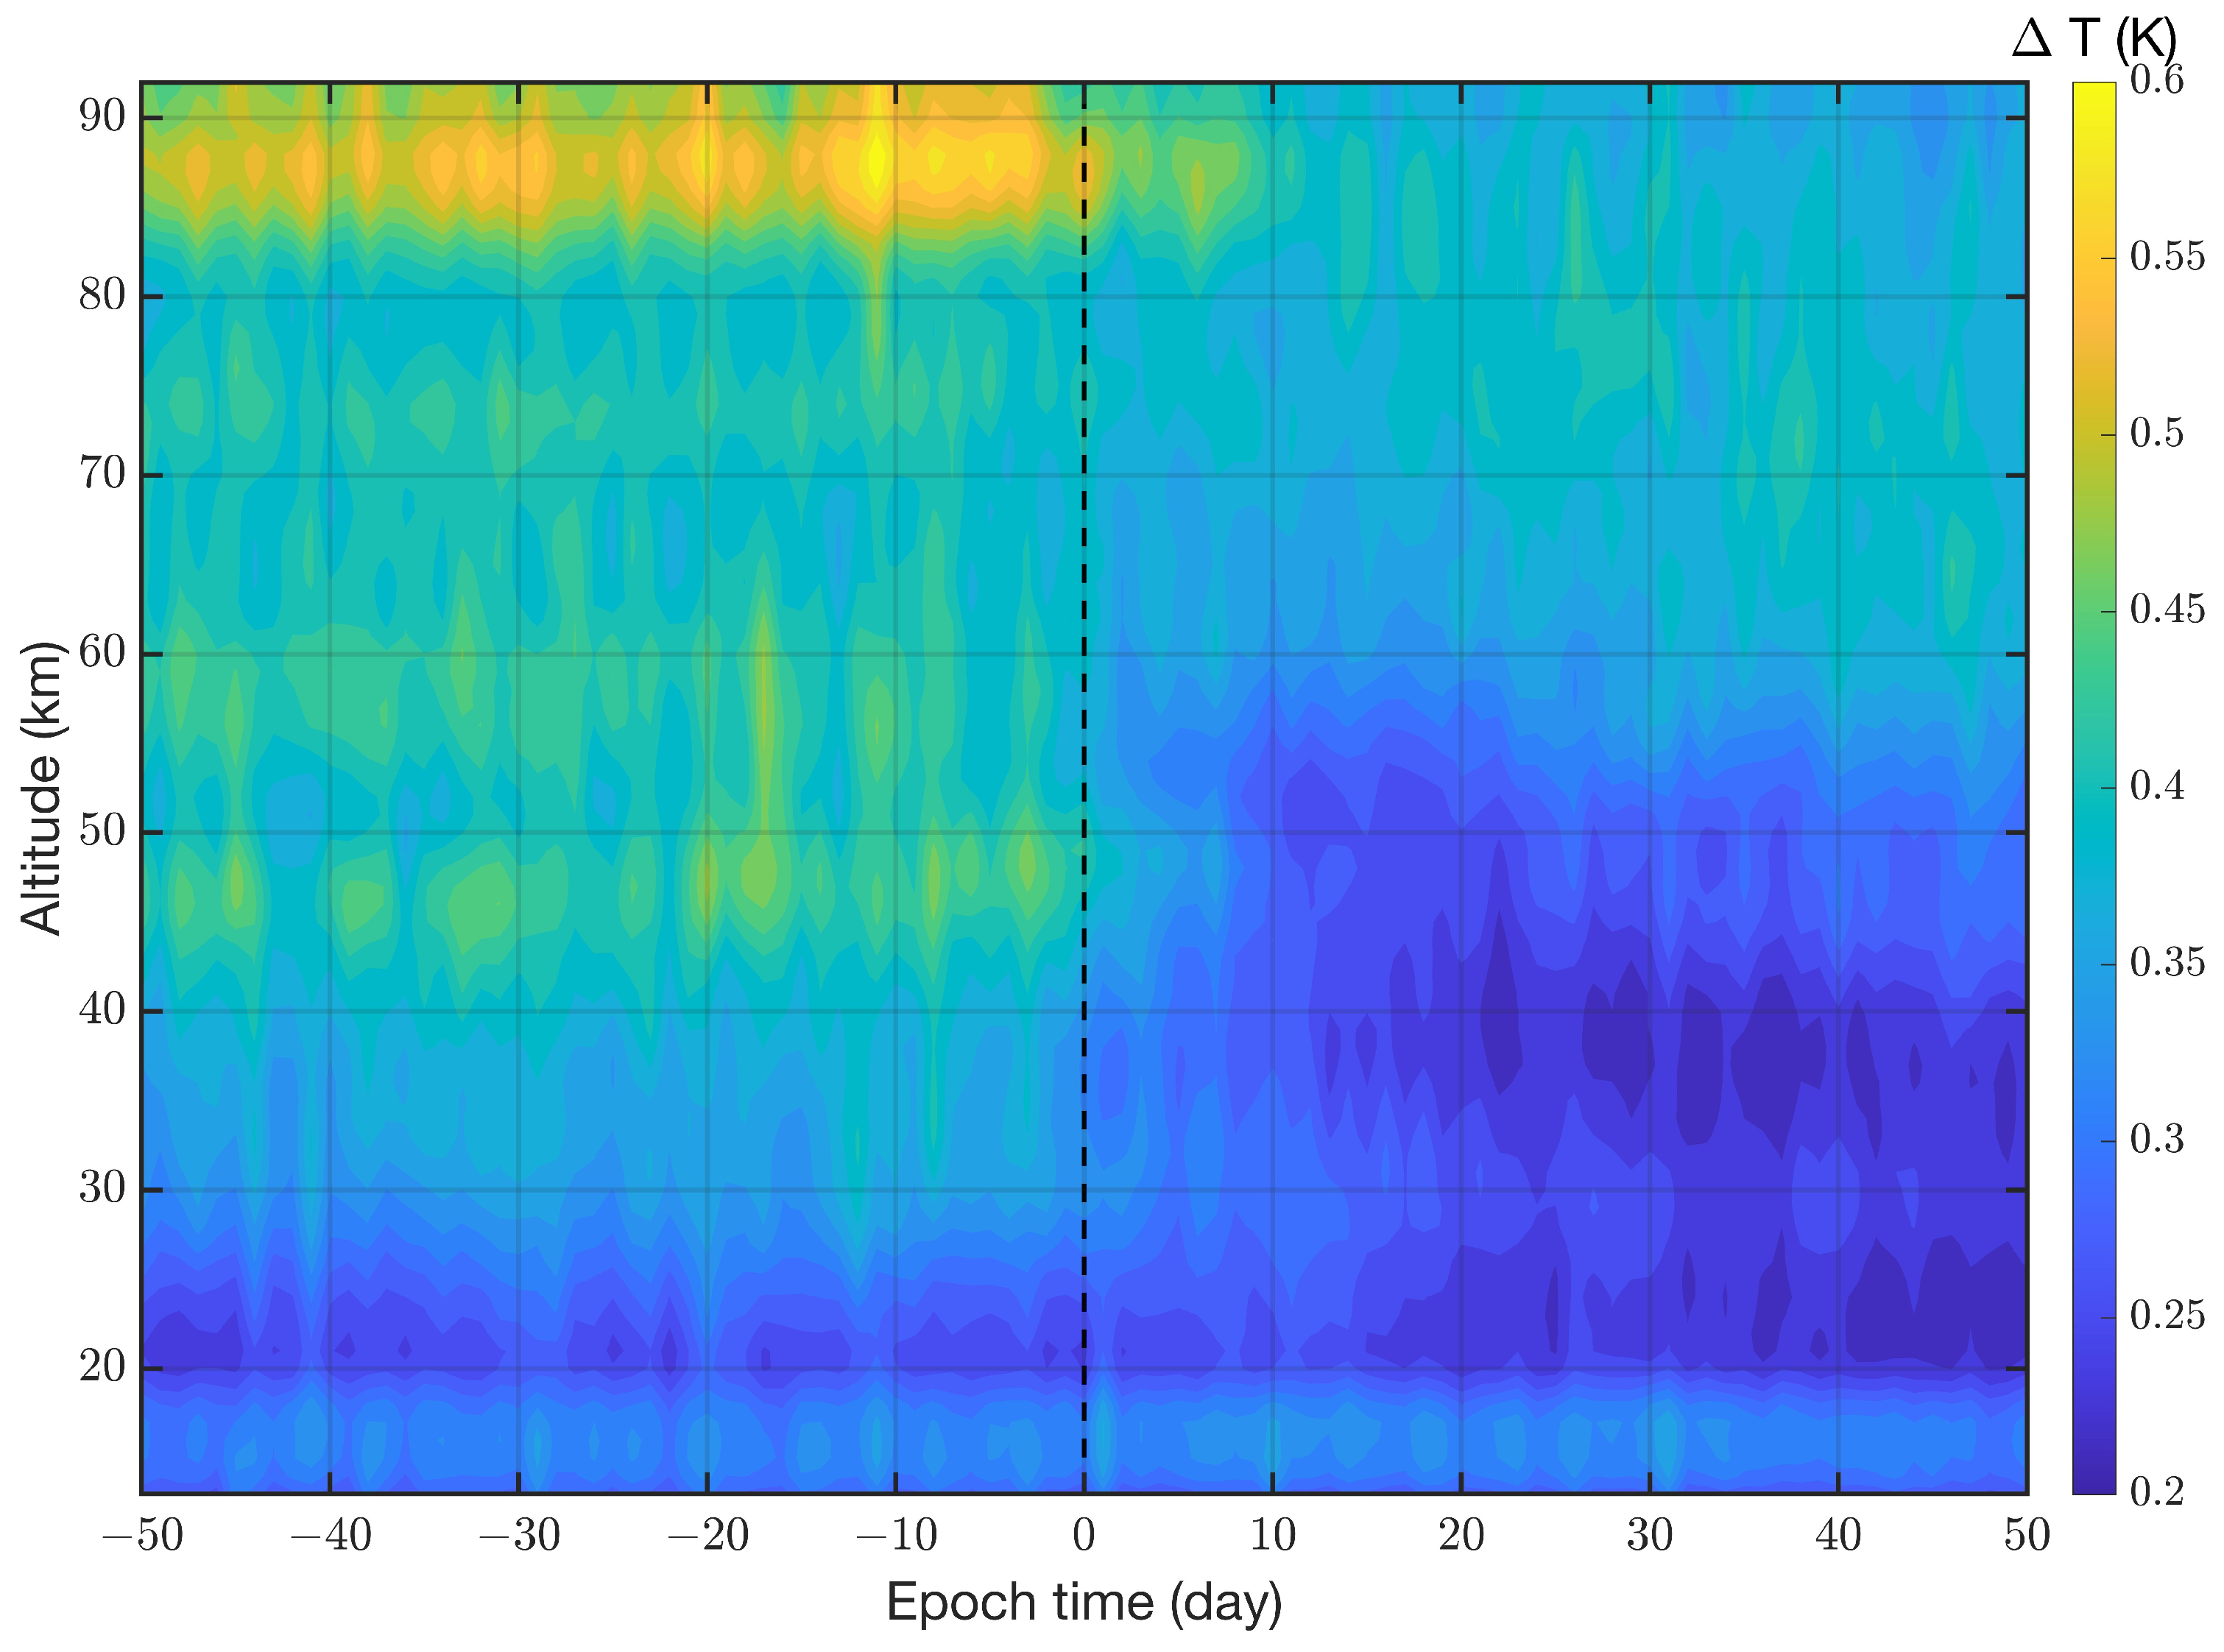
Finally, we performed a composite analysis of the influence of major sudden stratospheric warmings on gravity wave amplitudes. Figure 9 shows that upper mesospheric gravity waves in the northern polar region are enhanced before the SSW onset (dashed black line). There also seems to be a decrease in the amplitude of the gravity waves in the stratopause region (40 to 60 km height) after the SSW onset. The composite analyses for the equatorial and southern polar region showed that there are no influences of major SSWs (from Table 1) on the gravity wave amplitudes in these regions.
Figure 9.
Composite of gravity wave amplitudes in the northern polar region. The central date of the major stratospheric warming is at epoch time 0. In total, 10 SSW events are averaged.
4. Discussion
As investigated in a previous study [7] in more detail, the level-2 temperature data of Aura/MLS are appropriate for the study of inertia gravity waves. In reference to a previous study, we applied a high-pass filter to the temperature variations along the suborbital track of Aura/MLS. Thus, the inertia gravity waves have horizontal wavelengths between 200 and 825 km. Also, in reference to [7], we derived the long-term time series of the mean gravity wave amplitude in three selected regions (equator, northern, and southern polar region). These time series have a time resolution of 1 day so that they are suitable for derivations of seasonal variations and interannual variations and composite analyses of the impact of major SSWs on gravity wave amplitudes.
A key result is that inertia gravity waves are generally stronger in the southern polar mesosphere than in the northern polar mesosphere (Figure 1). Previous studies by [4,7] did not discuss this important point. Our finding of interhemispheric differences of polar mesospheric gravity waves agrees with the satellite observations of AIM/SOFIE by Liu et al. [13]. However, Liu et al. found interhemispheric differences also for polar stratospheric gravity waves, while we found no significant interhemispheric differences below 70 km altitude (Figure 1). Possibly, the interaction of the strong zonal wind in the southern hemisphere with the Andean mountain ridge and the coastline of Antarctica could be stronger gravity wave generation sources than those in the northern polar region. The gravity wave maps of January 2010 (Figure 8) show that enhanced gravity wave activity occurs close to the Weddell Sea and Antarctic Peninsula. Thus, orography plays a central role for understanding of the mesospheric gravity wave distribution over Antarctica.
It is also known that the southern polar vortex is stronger and more stable than the northern polar vortex. The latter is more disturbed by upward propagating and breaking planetary waves during the winter, which can even induce a reversal of the vortex from eastward to westward winds during major SSWs. During winter, gravity waves can propagate in the westward direction against the vortex stream throughout the middle atmosphere. The equal sounding characteristics of Aura/MLS in the southern and northern polar region is valuable for the study of interhemispheric differences in polar atmospheres. TIMED/SABER has more complex sampling behavior, measuring either the northern or southern polar region with long separations in time. Ground-based instruments in Antarctica and Arctic are sparse and cannot be compared in such an easy, representative and objective manner as we did for the Aura/MLS measurements over both polar regions.
Our study confirmed the known result [4,31] that inertia gravity waves are enhanced at the end of the easterly phase of the QBO in the mid-stratosphere (Figure 3). The amplitudes of the inertia gravity waves at the equator are smaller than those of the equatorial Kelvin waves. Both wave classes contribute to the reversal of the easterly QBO phase. The FFT spectra of the modulations of the gravity wave amplitudes showed a QBO signal in the mid-stratosphere but no QBO signal in the mesosphere. Thus, a search for the terrestrial QBO signal in the upper atmosphere and ionosphere might be difficult, although researchers found indications for a QBO signal in the ionosphere [17,18]. Here, we can say that inertia gravity waves apparently do not transfer the QBO signal from the stratosphere to the thermosphere and ionosphere.
Generally the modulations and seasonal variations of inertia gravity waves in the equatorial region are smaller than those in the polar region, which show larger annual and semiannual oscillations peaking at solstices. The vertical structure of the seasonal variations of gravity waves over the southern polar region is rather different compered to those over the northern polar region. We discovered a double layer of enhanced gravity wave amplitudes over the southern polar region in the winter and the summer (Figure 7 and Figure 8). According to the literature on short-period gravity waves, a wave duct layer is often observed at mesospheric heights due to vertical wind shears and vertical temperature gradients and inversion layers [6]. However, we are not aware of a study on a double layer of enhanced gravity wave amplitudes. It was observed that the damping of gravity waves often occur in the polar mesosphere [25], but it is unclear how the gravity wave amplitude can recover after damping at a certain height (e.g., 81 km). It remains an open question as to why a double-layer structure is present over the southern polar region and why it is not present over the northern polar region, but this seems to be related to the special orography of Antarctica (Figure 8). The double layer occurs over the same local region during different years. Of course, the vertical distance between the layers is about 8 km and hence a bit smaller than the the vertical resolution of Aura/MLS. It seems that the double-layer signal is so strong that it still remains, to some extent, in the vertical profile of gravity wave amplitudes and is not smoothed out.
It is reasonable that major SSWs influence the upward propagating gravity wave flux due to the sudden reversal of the zonal wind in the stratosphere [19]. The prevailing westward propagating gravity waves cannot propagate into the polar mesosphere during the SSW. The composite analysis showed that, indeed, in the stratopause region and more clearly in the upper mesosphere, the gravity wave amplitude is decreased after the SSW’s onset (Figure 9). We are not aware of other composite analyses of observations that showed this decrease in gravity wave amplitude. A decrease in mesospheric gravity wave amplitude after the onsets of the SSWs in 2023 and 2024 was also reported by Zhang et al. [22]. It was also a result of our study that the gravity wave amplitudes over the equatorial and southern polar region are not affected by the SSWs in the northern hemisphere. Yasui et al. [15] also found no clear signal in the MF radar observations of horizontal wind above Syowa station (Antarctica) for northern hemispheric SSW onsets.
5. Conclusions
The level-2 temperature data of Aura/MLS are appropriate for finding the characteristics of inertia gravity waves. Of course, one has to keep in mind that the Aura/MLS measurements are more sensitive for gravity waves propagating parallel to the suborbital track than for gravity waves propagating in a perpendicular direction to the track. The equal sampling of temperature fluctuations over the southern and northern polar regions permits an objective evaluation of interhemispheric differences. We find that the inertia gravity waves in the southern polar mesosphere are stronger by a factor of up to 2 than those in the northern polar mesosphere. This is possibly due to the stronger orographic waves in the southern polar region and the more stable polar vortex in the southern hemisphere.
We confirmed that the inertia gravity waves in the equatorial mid-stratosphere are stronger at the end of the QBO easterly phase, so they possibly contribute to the deceleration of easterly winds. The QBO signal is not present for the mesospheric inertia gravity waves, so inertia gravity waves do not transfer the QBO signal to the thermosphere and ionosphere.
The seasonal variations of gravity waves are stronger over the polar regions than over the equator. The gravity wave amplitudes are maximal during the winter and have local maxima in the summer, indicating the importance of AO and SAO at high latitudes. We discovered a double-layer structure of enhanced gravity wave amplitudes in the mesosphere above the southern polar region (vicinity of the Weddell Sea). The double-layer structure occurs in the winter and the summer but with different vertical spacing between the layers.
A composite analysis of the influence of major sudden stratospheric warmings on gravity wave amplitudes was carried out. The upper mesospheric gravity waves of the northern polar region are enhanced before the SSW onset and decreased after the SSW onset. The gravity waves in the equatorial and southern polar region are not affected by the northern hemispheric SSWs.
Author Contributions
Conceptualization, K.H. and W.W.; methodology, K.H. and W.W.; software, K.H.; validation, K.H. and W.W.; formal analysis, K.H. and W.W.; writing—original draft preparation, K.H.; writing—review and editing, K.H. and W.W. All authors have read and agreed to the published version of the manuscript.
Funding
Funding for open-access publication was provided by the University of Bern.
Institutional Review Board Statement
Not applicable.
Informed Consent Statement
Not applicable.
Data Availability Statement
The Aura/MLS data are available from the Aura Validation Data Center (AVDC) at https://avdc.gsfc.nasa.gov/ (accessed on 20 January 2026). The stratospheric zonal wind data over Singapore is provided by NOAA at https://www.cpc.ncep.noaa.gov/data/indices/ (accessed on 1 May 2025).
Acknowledgments
We thank the Aura/MLS team for the high-quality data. We also thank the reviewers and editor for their work and improvements.
Conflicts of Interest
The authors declare no conflicts of interest.
References
- Holton, J.R. The Influence of Gravity Wave Breaking on the General Circulation of the Middle Atmosphere. J. Atmos. Sci. 1983, 40, 2497–2507. [Google Scholar] [CrossRef] [Scilit]
- Fritts, D.C.; Alexander, M.J. Gravity wave dynamics and effects in the middle atmosphere. Rev. Geophys. 2003, 41, 1003. [Google Scholar] [CrossRef] [Scilit]
- Vadas, S.L.; Becker, E.; Bossert, K.; Hozumi, Y.; Stober, G.; Harvey, V.L.; Baumgarten, G.; Hoffmann, L. The Role of the Polar Vortex Jet for Secondary and Higher-Order Gravity Waves in the Northern Mesosphere and Thermosphere During 11–14 January 2016. J. Geophys. Res. Space Phys. 2024, 129, e2024JA032521. [Google Scholar] [CrossRef] [Scilit]
- Ern, M.; Preusse, P.; Gille, J.C.; Hepplewhite, C.L.; Mlynczak, M.G.; Russell, J.M.; Riese, M. Implications for atmospheric dynamics derived from global observations of gravity wave momentum flux in stratosphere and mesosphere. J. Geophys. Res. Atmos. 2011, 116, D19107. [Google Scholar] [CrossRef] [Scilit]
- Richmond, A.D. Gravity wave generation, propagation, and dissipation in the thermosphere. J. Geophys. Res. Space Phys. 1978, 83, 4131–4145. [Google Scholar] [CrossRef] [Scilit]
- Mandal, S.; Moffat-Griffin, T.; Wright, C.J.; Pautet, P.D.; Taylor, M.J.; Nakamura, T. Gravity Wave Variability in the Arctic Winter Mesosphere in Relation With the Stratospheric Polar Vortex. J. Geophys. Res. Atmos. 2025, 130, e2024JD043037. [Google Scholar] [CrossRef] [Scilit]
- Hocke, K.; Lainer, M.; Moreira, L.; Hagen, J.; Fernandez Vidal, S.; Schranz, F. Atmospheric inertia-gravity waves retrieved from level-2 data of the satellite microwave limb sounder Aura/MLS. Ann. Geophys. 2016, 34, 781–788. [Google Scholar] [CrossRef] [Scilit]
- Preusse, P.; Eckermann, S.D.; Ern, M.; Oberheide, J.; Picard, R.H.; Roble, R.G.; Riese, M.; Russell, J.M., III; Mlynczak, M.G. Global ray tracing simulations of the SABER gravity wave climatology. J. Geophys. Res. Atmos. 2009, 114, D08126. [Google Scholar] [CrossRef] [Scilit]
- Jiang, J.H.; Eckermann, S.D.; Wu, D.L.; Ma, J. A search for mountain waves in MLS stratospheric limb radiances from the winter Northern Hemisphere: Data analysis and global mountain wave modeling. J. Geophys. Res. Atmos. 2004, 109, D03107. [Google Scholar] [CrossRef] [Scilit]
- Jiang, J.; Eckermann, S.; Wu, D.; Hocke, K.; Wang, B.; Ma, J.; Zhang, Y. Seasonal variation of gravity wave sources from satellite observation. Adv. Space Res. 2005, 35, 1925–1932. [Google Scholar] [CrossRef] [Scilit]
- Matsuda, T.S.; Nakamura, T.; Ejiri, M.K.; Tsutsumi, M.; Tomikawa, Y.; Taylor, M.J.; Zhao, Y.; Pautet, P.D.; Murphy, D.J.; Moffat-Griffin, T. Characteristics of mesospheric gravity waves over Antarctica observed by Antarctic Gravity Wave Instrument Network imagers using 3-D spectral analyses. J. Geophys. Res. Atmos. 2017, 122, 8969–8981. [Google Scholar] [CrossRef] [Scilit]
- Ern, M.; Trinh, Q.T.; Preusse, P.; Gille, J.C.; Mlynczak, M.G.; Russell, J.M., III; Riese, M. GRACILE: A comprehensive climatology of atmospheric gravity wave parameters based on satellite limb soundings. Earth Syst. Sci. Data 2018, 10, 857–892. [Google Scholar] [CrossRef] [Scilit]
- Liu, X.; Yue, J.; Xu, J.; Wang, L.; Yuan, W.; Russell, J.M., III; Hervig, M.E. Gravity wave variations in the polar stratosphere and mesosphere from SOFIE/AIM temperature observations. J. Geophys. Res. Atmos. 2014, 119, 7368–7381. [Google Scholar] [CrossRef] [Scilit]
- Sato, K.; Watanabe, S.; Kawatani, Y.; Tomikawa, Y.; Miyazaki, K.; Takahashi, M. On the origins of mesospheric gravity waves. Geophys. Res. Lett. 2009, 36, L19801. [Google Scholar] [CrossRef] [Scilit]
- Yasui, R.; Sato, K.; Tsutsumi, M. Seasonal and Interannual Variation of Mesospheric Gravity Waves Based on MF Radar Observations over 15 Years at Syowa Station in the Antarctic. SOLA 2016, 12, 46–50. [Google Scholar] [CrossRef] [Scilit]
- Yoshida, L.; Tomikawa, Y.; Ejiri, M.K.; Tsutsumi, M.; Kohma, M.; Sato, K. Large-Amplitude Inertia Gravity Waves Over Syowa Station: Comparison of PANSY Radar and ERA5 Reanalysis Data. J. Geophys. Res. Atmos. 2024, 129, e2023JD040490. [Google Scholar] [CrossRef] [Scilit]
- Tang, W.; Xue, X.H.; Lei, J.; Dou, X.K. Ionospheric quasi-biennial oscillation in global TEC observations. J. Atmos. Sol.-Terr. Phys. 2014, 107, 36–41. [Google Scholar] [CrossRef] [Scilit]
- Singh, D.; Goncharenko, L.P.; Zhang, S.R. Imprint of the Quasi-Biennial Oscillation on the Ionosphere and Thermosphere. J. Geophys. Res. Space Phys. 2026, 131, e2025JA034748. [Google Scholar] [CrossRef] [Scilit]
- Zuelicke, C.; Becker, E.; Matthias, V.; Peters, D.H.W.; Schmidt, H.; Liu, H.L.; de la Torre Ramos, L.; Mitchell, D.M. Coupling of Stratospheric Warmings with Mesospheric Coolings in Observations and Simulations. J. Clim. 2018, 31, 1107–1133. [Google Scholar] [CrossRef] [Scilit]
- Stephan, C.C.; Schmidt, H.; Zülicke, C.; Matthias, V. Oblique Gravity Wave Propagation During Sudden Stratospheric Warmings. J. Geophys. Res. Atmos. 2020, 125, e2019JD031528. [Google Scholar] [CrossRef] [Scilit]
- Thurairajah, B.; Bailey, S.M.; Cullens, C.Y.; Hervig, M.E.; Russell, J.M., III. Gravity wave activity during recent stratospheric sudden warming events from SOFIE temperature measurements. J. Geophys. Res. Atmos. 2014, 119, 8091–8103. [Google Scholar] [CrossRef] [Scilit]
- Zhang, J.; Zhao, Y.; Pautet, P.D.; Scherliess, L.; Taylor, M.J.; Liu, H. Gravity Wave Activity During the 2024 Sudden Stratospheric Warmings Observed by Atmospheric Waves Experiment (AWE). Geophys. Res. Lett. 2025, 52, e2024GL114187. [Google Scholar] [CrossRef] [Scilit]
- Cullens, C.Y.; Thurairajah, B. Gravity wave variations and contributions to stratospheric sudden warming using long-term ERA5 model output. J. Atmos. Sol.-Terr. Phys. 2021, 219, 105632. [Google Scholar] [CrossRef] [Scilit]
- Kogure, M.; Yue, J.; Liu, H. Gravity Wave Weakening During the 2019 Antarctic Stratospheric Sudden Warming. Geophys. Res. Lett. 2021, 48, e2021GL092537. [Google Scholar] [CrossRef] [Scilit]
- Collins, R.L.; Smith, R.W. Evidence of damping and overturning of gravity waves in the Arctic mesosphere: Na lidar and OH temperature observations. J. Atmos. Sol.-Terr. Phys. 2004, 66, 867–879. [Google Scholar] [CrossRef] [Scilit]
- Qiu, S.; Wang, N.; Soon, W.; Herrera, V.M.V.; Yang, C.; Dou, X. The Hemispheric Asymmetry of Gravity Wave Impact on the Polar Mesospheric Cloud, Based on the Aeronomy of Ice in the Mesosphere Satellite. Atmosphere 2023, 14, 419. [Google Scholar] [CrossRef] [Scilit]
- Waters, J.W.; Froidevaux, L.; Harwood, R.S.; Jarnot, R.F.; Pickett, H.M.; Read, W.G.; Siegel, P.H.; Cofield, R.E.; Filipiak, M.J.; Flower, D.A.; et al. The Earth Observing System Microwave Limb Sounder (EOS MLS) on the Aura satellite. IEEE Trans. Geosci. Remote Sens. 2006, 44, 1075–1092. [Google Scholar] [CrossRef] [Scilit]
- Livesey, N.J.; Read, W.G.; Wagner, P.A.; Froidevaux, L.; Santee, M.L.; Schwartz, M.J.; Lambert, A.; Valle, L.F.M.; Pumphrey, H.C.; Manney, G.L.; et al. Earth Observing System (EOS) Aura Microwave Limb Sounder (MLS) Version 5.0x Level 2 and 3 Data Quality and Description Document; Technical report, JPL D-105336 Rev. B; JPL: Pasadena, CA, USA, 2022. Available online: https://mls.jpl.nasa.gov/data/v5-0_data_quality_document.pdf (accessed on 1 July 2026).
- Schwartz, M.J.; Lambert, A.; Manney, G.L.; Read, W.G.; Livesey, N.J.; Froidevaux, L.; Ao, C.O.; Bernath, P.F.; Boone, C.D.; Cofield, R.E.; et al. Validation of the Aura Microwave Limb Sounder temperature and geopotential height measurements. J. Geophys. Res. Atmos. 2008, 113, D15S11. [Google Scholar] [CrossRef] [Scilit]
- Palmeiro, F.M.; Garcia-Serrano, J.; Ruggieri, P.; Batte, L.; Gualdi, S. On the Influence of ENSO on Sudden Stratospheric Warmings. J. Geophys. Res. Atmos. 2023, 128, e2022JD037607. [Google Scholar] [CrossRef] [Scilit]
- Baldwin, M.P.; Gray, L.J.; Dunkerton, T.J.; Hamilton, K.; Haynes, P.H.; Randel, W.J.; Holton, J.R.; Alexander, M.J.; Hirota, I.; Horinouchi, T.; et al. The quasi-biennial oscillation. Rev. Geophys. 2001, 39, 179–229. [Google Scholar] [CrossRef] [Scilit]

Disclaimer/Publisher’s Note: The statements, opinions and data contained in all publications are solely those of the individual author(s) and contributor(s) and not of MDPI and/or the editor(s). MDPI and/or the editor(s) disclaim responsibility for any injury to people or property resulting from any ideas, methods, instructions or products referred to in the content. |
© 2026 by the authors. Licensee MDPI, Basel, Switzerland. This article is an open access article distributed under the terms and conditions of the Creative Commons Attribution (CC BY) license.