


Abstract
This study investigated short-duration heavy-rainfall events in Sichuan during 2023–2025. A 35 km × 35 km cloud window centered on heavy-rainfall stations was constructed. Multiple cloud parameters in the window were statistically analyzed to examine their responses to heavy rainfall under different rainfall-intensity classes. Representative cases were also examined. The results showed that: (1) Eight major cloud parameters, including minimum cloud-top brightness temperature and deep convection index, showed clear responses to heavy rainfall in both rainfall-intensity classes. (2) Heavy-rainfall locations were mainly found in large-gradient zones near the edges of low cloud-top brightness temperature regions (<220 K) and high cloud-top height regions (>12 km). Cloud-parameter extrema generally appeared before the end of peak rainfall. Samples with rainfall intensity > 50 mm·h−1 were mainly associated with ice-phase cold cloud-tops. These cloud-tops had brightness temperatures below 200 K, heights above 15 km, and pressures below 100 hPa, indicating stronger convective activity. In contrast, the 20–50 mm·h−1 samples showed relatively weaker convective activity. (3) When cloud-top brightness temperature < 220 K, deep convection index ≥ 40, cloud-top height ≥ 15 km, DTB13 ≤ −1 K, and cloud-top pressure ≤ 130 hPa occurred simultaneously or successively, the cloud window indicated potential for short-duration heavy rainfall.
1. Introduction
Sichuan is located in the transitional zone between the eastern edge of the Tibetan Plateau and the Sichuan Basin. The western part is mainly dominated by plateaus and mountains; whereas, the eastern part consists of basins, hills, and surrounding mountainous areas. The terrain varies greatly, and the underlying surface is highly complex. Influenced by warm and moist southwesterly airflow, terrain lifting over the basin, and mesoscale and small-scale convective systems, short-duration heavy rainfall in Sichuan is often characterized by sudden occurrence, highly localized characteristics, and high hourly rainfall intensity. Studies based on high-density station observations and spatially dense datasets have shown that extreme hourly precipitation and short-duration heavy rainfall in the Sichuan Basin exhibit clear regional differences and strong terrain-related characteristics [1,2]. Research on severe convective weather requires consideration of both mesoscale and small-scale systems and local environmental conditions [3]. Continuous monitoring of severe convective weather mainly relies on weather radar and meteorological satellites. Weather radar has high spatial and temporal resolution and is an important tool for monitoring severe convective systems. However, in complex terrain regions such as Sichuan, radar observations are easily affected by terrain blockage, ground clutter, signal attenuation, and calibration errors [4,5]. In contrast, geostationary meteorological satellites have advantages such as broad spatial coverage, high observation frequency, and relatively less influence from terrain blockage. They can continuously track the formation, development, merging, and dissipation of cloud systems over the same region [6,7]. Kim et al. [8] showed through a case study of localized extreme precipitation in Seoul that geostationary satellite cloud parameters can characterize changes such as cloud-top cooling before rainfall occurrence. The combination of satellite and radar data can better describe cloud-system evolution before precipitation. Therefore, using geostationary satellite data to analyze the evolution of localized short-duration heavy-rainfall cloud systems in complex terrain regions is of great importance. It can help compensate for the limitations of surface and radar observations and improve the monitoring and identification of heavy rainfall.
In recent years, data from FY-series satellites and other geostationary meteorological satellites, such as Himawari-8, have been widely used for heavy-rainfall cloud identification, cloud-system evolution analysis, and precipitation monitoring. FY meteorological satellites provide multidimensional, continuous, and operational observations [9]. Among them, the cloud-top height products of FY-4 satellites show good consistency with Himawari-8, MODIS, CALIPSO, and other datasets. These products provide useful information for analyzing the vertical development of convective clouds [10]. Previous studies have shown that cloud-top temperature, equivalent blackbody temperature, cloud-top height, brightness temperature gradient, and spectral band differences are related to short-duration heavy rainfall. However, their relationships with rainfall vary with cloud type, weather background, and regional conditions [11,12]. In plateau, mountainous, and severe convective rainfall studies, satellite cloud-top brightness temperature, brightness temperature gradient, cloud-top height, and deep convection index are often used to describe the evolution of heavy-rainfall cloud systems. Studies of rainstorms over the eastern Tibetan Plateau and short-duration heavy rainfall over the Qinghai Plateau showed that changes in minimum cloud-top brightness temperature, brightness-temperature difference, brightness temperature gradient, and deep convection index may provide useful indications of heavy rainfall occurrence [13,14]. FY-2 infrared and water-vapor channel data can also distinguish cirrus clouds from strong convective clouds and reflect the life-cycle evolution of cloud clusters [15]. Himawari-8 and FY-series satellite data also show good potential in rainfall-area identification, precipitation estimation, and rainstorm monitoring. Related studies have shown that multi-channel cloud macro- and microphysical features, water-vapor channel information, cloud-top brightness-temperature changes, and convective cloud merging are closely related to the occurrence and evolution of short-duration heavy rainfall [16,17,18,19,20]. Cloud optical thickness, cloud effective particle radius, cloud-top temperature, and other parameters are related to precipitation probability. However, a single parameter has limited ability to explain hourly rainfall intensity. Multi-parameter analysis can better characterize precipitation cloud systems [17]. For FY satellite applications, studies found that TBB thresholds, cloud-classification products, and FY-4A cloud-top temperature and cloud-top height can be used for precipitation cloud identification and cloud-physical analysis. These parameters also show good consistency with MODIS and other datasets [21,22,23,24]. In addition, TBB during short-duration heavy rainfall is mostly concentrated at 190–230 K, and lower TBB usually corresponds to stronger rainfall intensity [25]. Overall, multi-channel observations and cloud-parameter products from geostationary meteorological satellites can characterize the evolution of heavy-rainfall cloud systems in terms of cloud-top thermal state, vertical development, spectral band differences, water-vapor structure, and cloud morphology. These products have important applications in heavy-rainfall cloud identification, cloud-system evolution analysis, and precipitation monitoring.
Studies on the application of FY-4B data in Sichuan and along the eastern edge of the Tibetan Plateau have gradually increased. However, most previous studies have mainly focused on the accuracy evaluation of QPE products, single-case analyses, or applications in specific regions. Chu and Wu [26] evaluated the accuracy of FY-4A and FY-4B quantitative precipitation estimation products in Sichuan. They found that both products could indicate the general distribution of rainfall areas and reasonably capture rainfall occurrence periods, but still underestimated heavy rainfall intensity. This suggests that satellite precipitation estimation products alone are not sufficient to fully characterize localized heavy-rainfall intensity. Wang et al. [27] evaluated the applicability of FY-4B temperature profile products over the eastern Tibetan Plateau using radiosonde observations and ERA5 reanalysis data. Their results showed that FY-4B data can provide supplementary information for monitoring atmospheric vertical structures in regions with sparse sounding observations. Studies in Sichuan and nearby complex terrain regions have also shown that low brightness temperature, cloud-top height, and ice-cloud distribution can be used to characterize convective cloud development and rainfall intensity changes [25,28]. In addition, FY-4B AGRI multi-channel infrared data can complement radar precipitation estimation products and improve the identification of heavy-rainfall areas and reduce underestimation in complex terrain regions [29]. At present, studies on localized short-duration heavy rainfall in Sichuan using FY-4B AGRI L1 multi-channel brightness temperature data together with L2 cloud products, including cloud-top height, cloud-top temperature, cloud-top pressure, cloud phase, and cloud type, remain limited. Multi-year and multi-station regional statistical analyses are especially lacking. Therefore, it is necessary to systematically analyze the ability of FY-4B L1 and L2 cloud parameters to characterize localized short-duration heavy-rainfall cloud systems over complex terrain in Sichuan. It is also necessary to further reveal the response differences in cloud-top thermal state, vertical development, spectral band differences, and cloud phase under different rainfall-intensity classes.
Based on this background, this study selected localized short-duration heavy rainfall events in Sichuan during 2023–2025 and used FY-4B AGRI multi-channel L1 brightness temperature data together with multiple L2 cloud products. A 35 km × 35 km cloud-window parameter statistical method centered on heavy-rainfall stations was constructed to analyze the responses of multiple satellite cloud parameters under different rainfall-intensity classes. Representative cases were also examined to discuss the satellite representation and evolution of heavy-rainfall cloud systems under complex terrain. Compared with previous studies, this study has three main features. First, it conducts a multi-year, multi-station statistical analysis of localized short-duration heavy rainfall over the complex terrain of Sichuan. Second, it combines FY-4B L1 multi-channel brightness temperature data and derived parameters, including spectral band differences, brightness temperature gradient, and deep convection index, with L2 cloud products, including cloud-top height, cloud-top temperature, cloud-top pressure, cloud phase, and cloud type. These parameters characterize heavy-rainfall cloud systems from four physical dimensions: cloud-top thermal conditions and vertical development, spectral band-difference information represented by DTB12min, spectral band-difference information represented by DTB13min, and cloud-top horizontal structural characteristics. Third, by combining statistical analysis with representative case evolution, this study further reveals the response characteristics of FY-4B satellite cloud parameters to localized short-duration heavy rainfall in Sichuan and provides a reference for monitoring and identifying short-duration heavy rainfall in complex terrain regions.
2. Materials and Methods
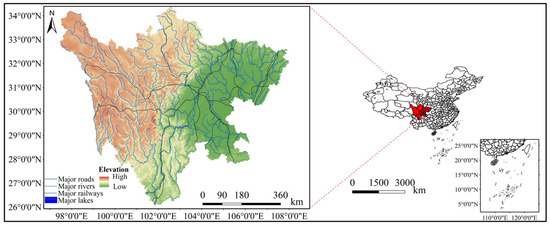
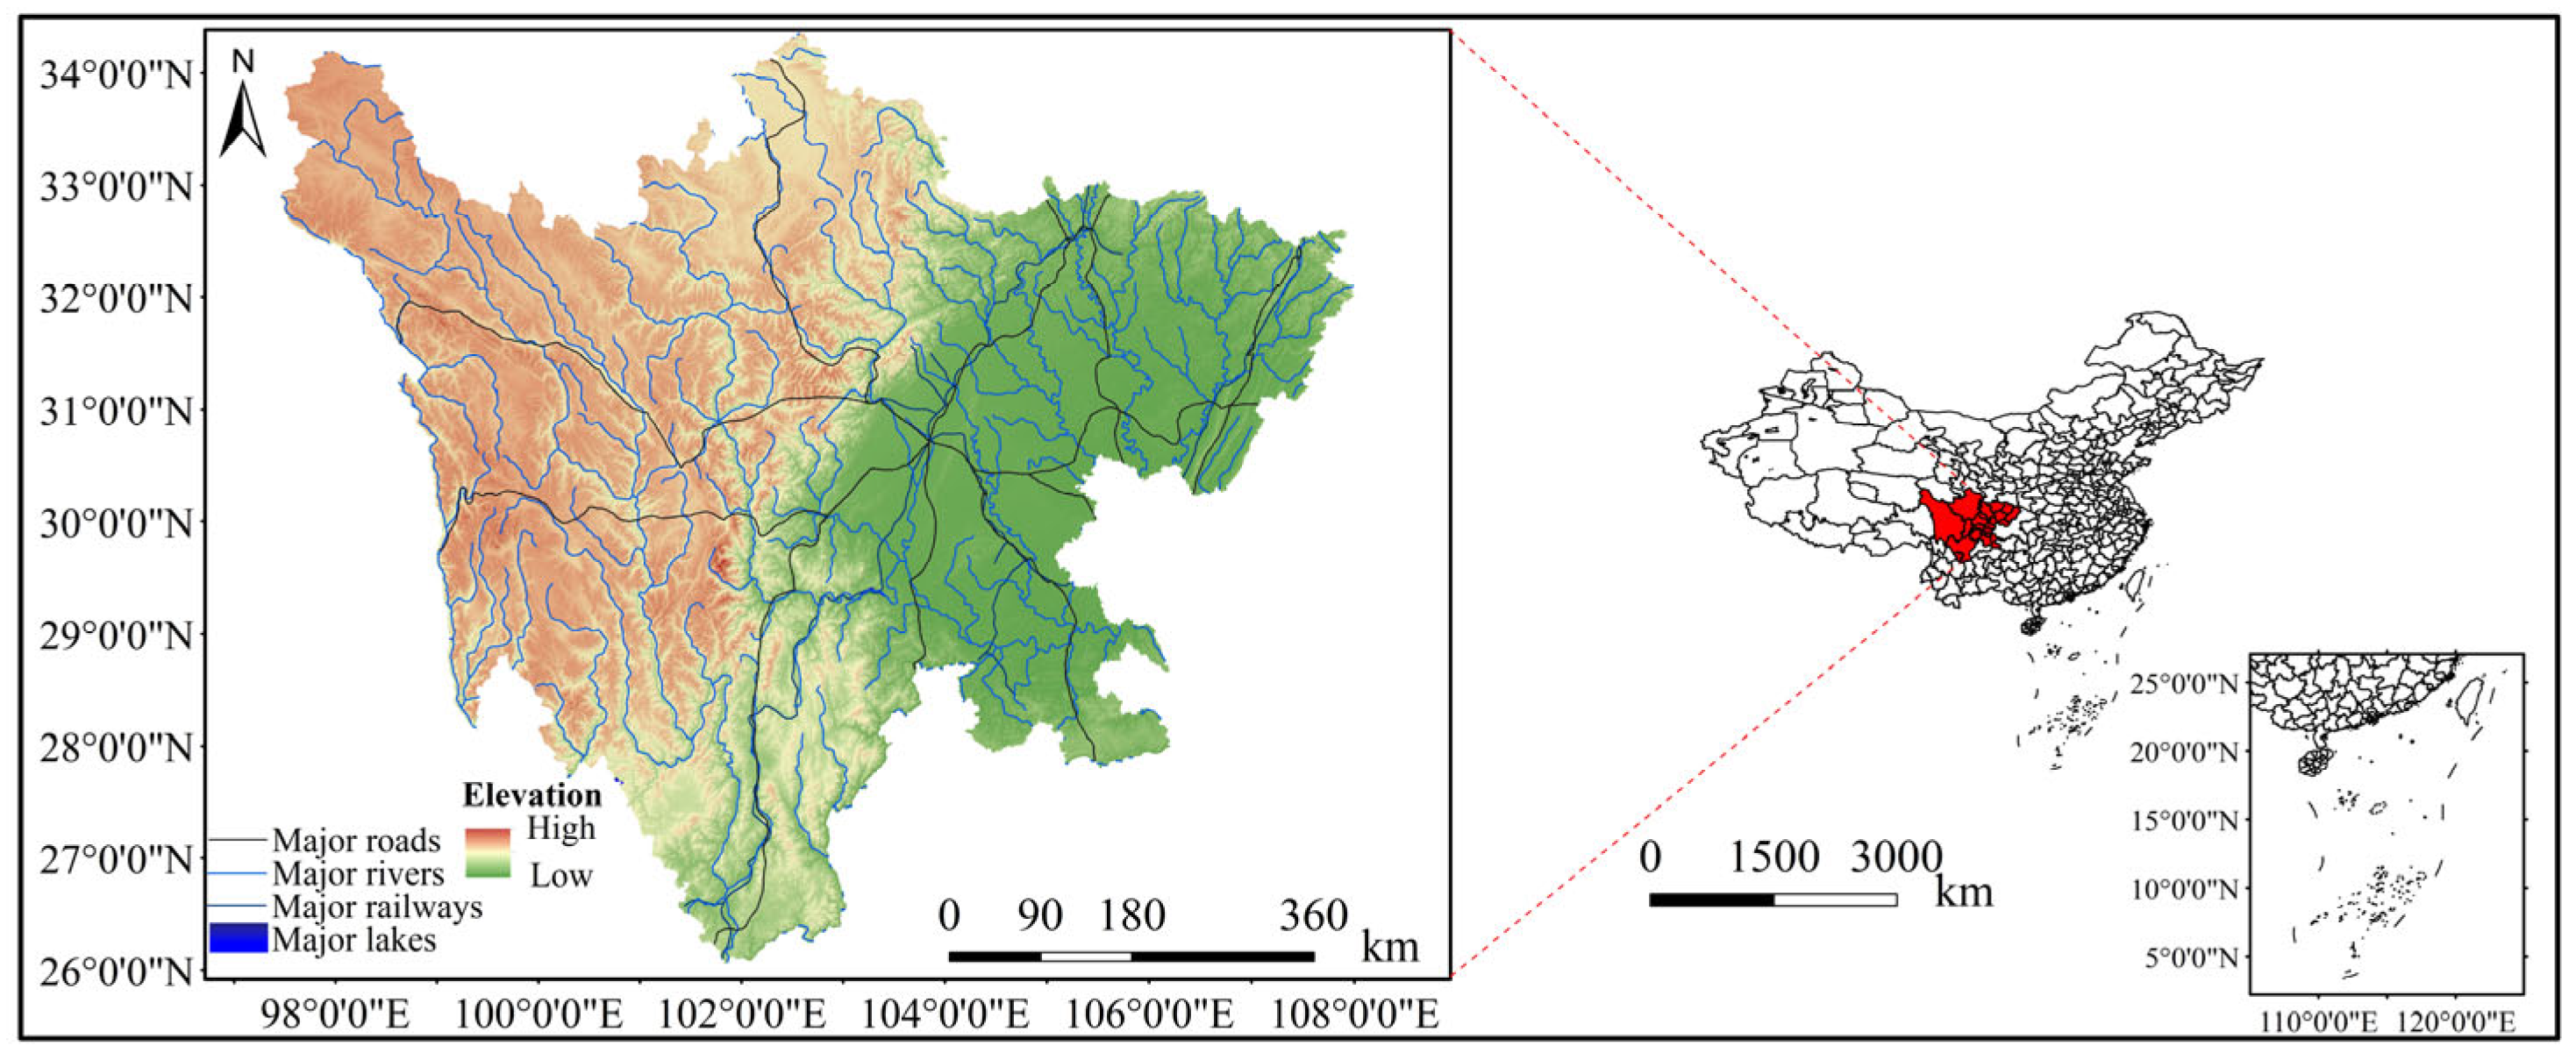
Sichuan is located in southwestern China, with geographic coordinates approximately ranging from 26°03′ N to 34°19′ N and from 97°21′ E to 108°33′ E. It borders Chongqing to the east, Yunnan and Guizhou to the south, Xizang to the west, and Qinghai, Gansu, and Shaanxi to the north. The terrain of Sichuan is generally higher in the west and lower in the east, with complex geomorphic types. The western part is dominated by plateaus, mountains, and alpine gorges, whereas the eastern part mainly consists of the Sichuan Basin and the surrounding mountains, with hills and parallel ridge-and-valley landforms distributed locally. Under the combined influence of complex terrain and monsoon circulation, water vapor transport conditions in Sichuan show marked regional differences. Heavy rainfall events in this region are characterized by abrupt onset, highly localized occurrence, intense short-duration rainfall, and marked regional differences, especially along the western edge of the basin, the mountainous areas surrounding the basin, and the transition zone along the eastern edge of the Tibetan plateau. Therefore, Sichuan is a representative and practically significant study area for analyzing the response characteristics of short-duration heavy-rainfall cloud systems using FY-4B satellite observations. Figure 1 shows the location and topography of the Sichuan study area.
Figure 1.
Location and topography of the Sichuan study area. Note: The red shaded area indicates Sichuan Province, and the red dashed lines indicate the enlarged study area.
2.1. Data and Statistical Methods
This study uses observed precipitation data from heavy rainfall events in Sichuan during 2023–2025, together with the corresponding Level-1 data from the Advanced Geostationary Radiation Imager (AGRI) onboard Fengyun-4B (FY-4B) and its Level-2 cloud parameter products. The satellite data were obtained from the National Satellite Meteorological Center. For the Level-1 data, channels 10, 13, and 14, which are representative of clouds and precipitation, were selected. These channels correspond to the 7.1 μm water vapor channel, the 10.8 μm infrared channel, and the 12.0 μm infrared channel, respectively, and are denoted as IR3, IR1, and IR2. The cloud parameter products include cloud-top height (CTH), cloud-top temperature (CTT), cloud-top pressure (CTP), cloud mask (CLM), cloud type (CLT), and cloud phase (CLP). These datasets have a spatial resolution of 4 km and a temporal resolution of 15 min.
In this study, an hourly precipitation amount of ≥20 mm·h−1 was used as the criterion for short-duration heavy rainfall. Hourly precipitation of ≥50 mm·h−1 and 24 h accumulated precipitation of ≥50 mm were used as the criteria for short-duration rainstorms and rainstorm events, respectively, consistent with the standards of the China Meteorological Administration. First, heavy-rainfall events were identified according to the event definition proposed by Liu et al. (2019) [30]. On this basis, 43 regional rainstorm events associated with localized short-duration heavy rainfall during 2023–2025 were selected for analysis by considering precipitation observations, the temporal continuity of FY-4B satellite data, and the correspondence between heavy-rainfall centers and low brightness-temperature centers, following operational nowcasting experience [31]. These events included 11 cases in 2023, 10 cases in 2024, and 22 cases in 2025.
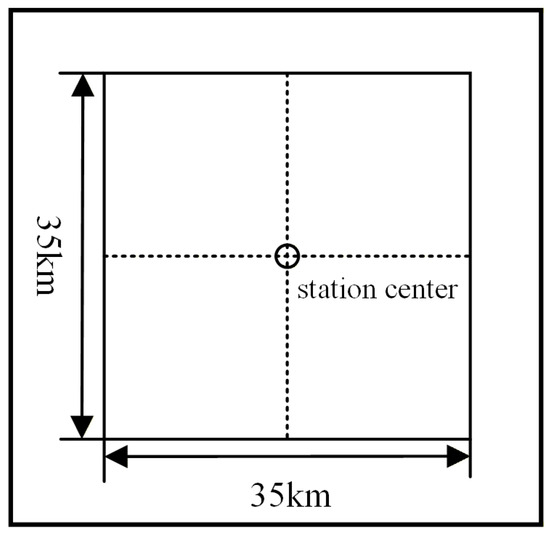
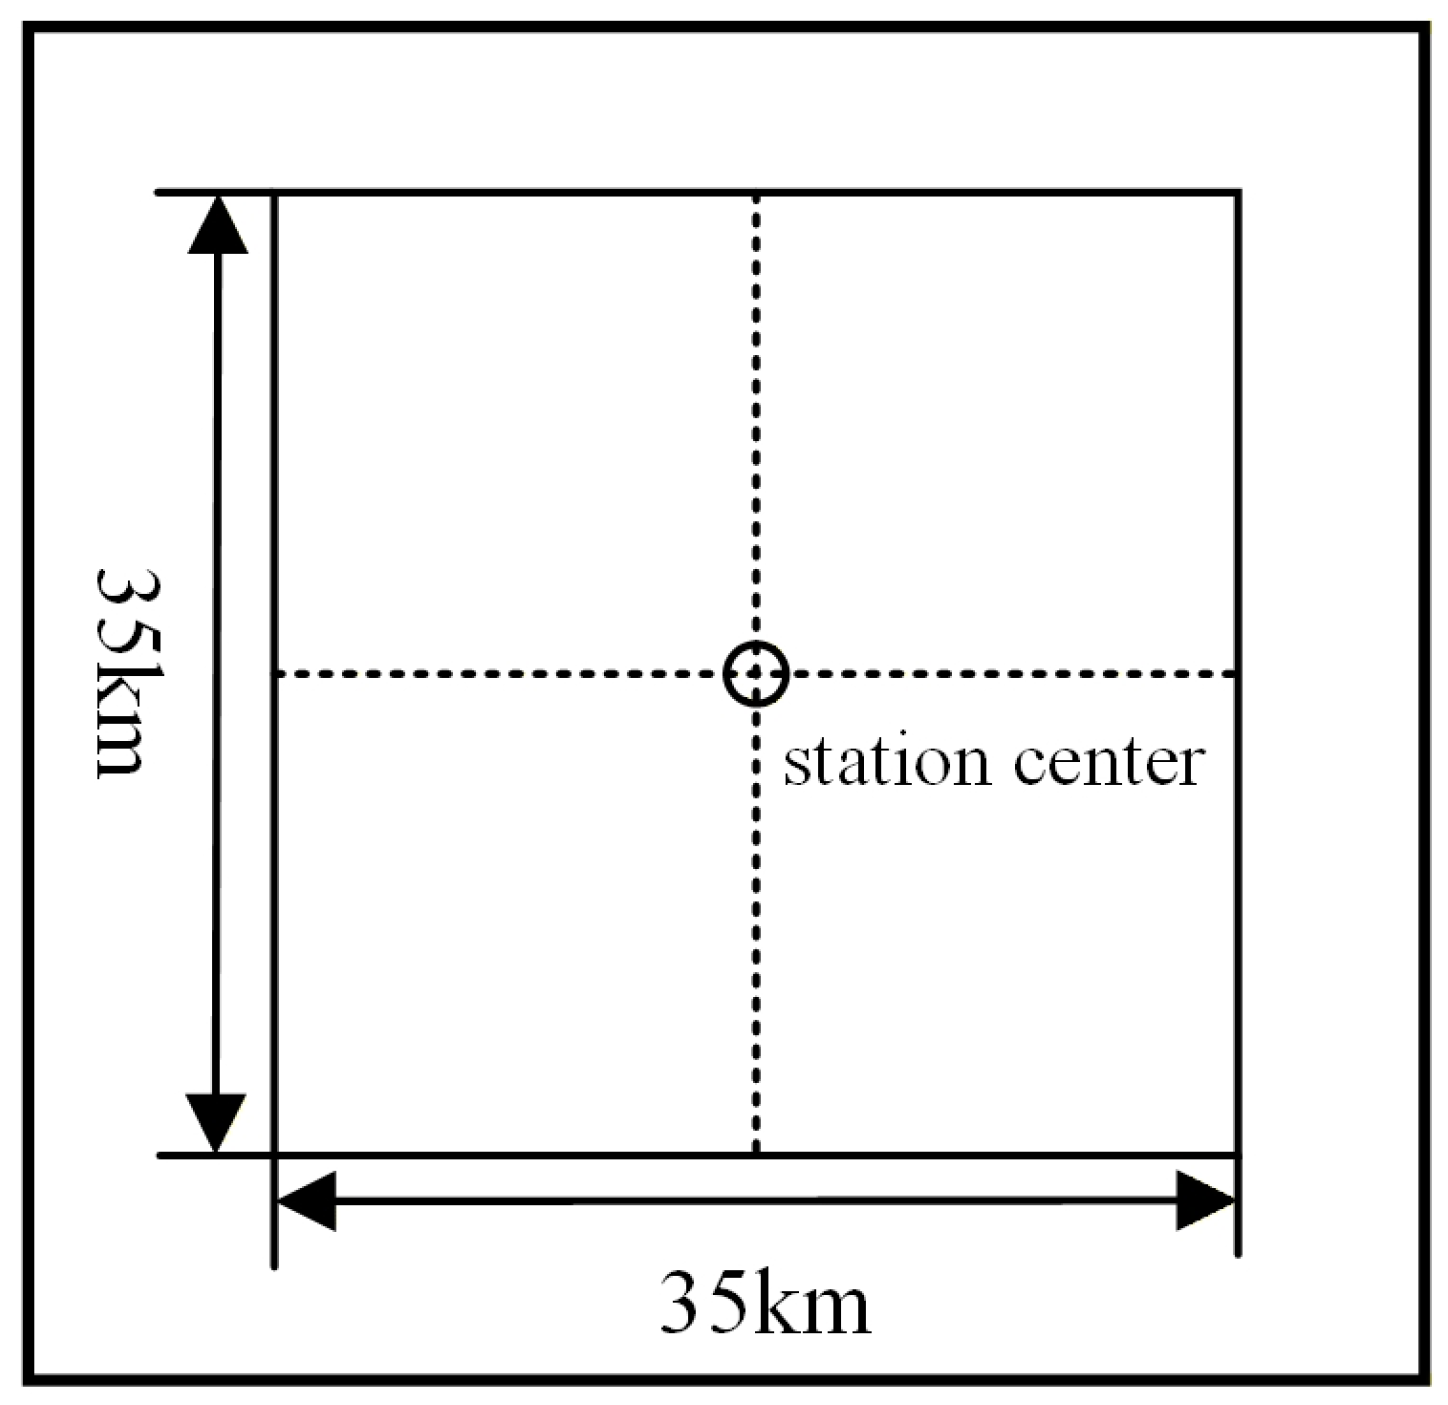
Previous studies [13] considered the diameter of mesoscale and small-scale severe convective cloud cores, usually about 10–20 km, and the spacing of automatic meteorological stations in key flash-flood prevention areas across China, generally about 20–40 km. Based on these factors, a 35 km × 35 km rectangular cloud window centered on heavy-rainfall stations was adopted in complex plateau terrain to analyze convective cloud development above stations and its relationship with precipitation, as shown in Figure 2. Sichuan is also characterized by complex terrain. Meteorological stations are densely distributed within the basin, where the distance between most stations is less than 10 km. In contrast, station spacing is relatively larger in the mountainous areas surrounding the basin and the transition zone along the eastern edge of the western Sichuan Plateau, usually ranging from 20 to 40 km. Therefore, this study selected the meteorological station, either regional or national, with the maximum hourly rainfall during each rainstorm event as the representative station. A 35 km × 35 km regional window centered on the representative station was then used to extract satellite cloud-parameter characteristics for localized short-duration heavy rainfall. This window can cover the convective cloud core and surrounding cloud area near the heavy-rainfall station while minimizing interference from neighboring convective systems.
Figure 2.
Schematic diagram of the 35 km × 35 km cloud window centered on the representative station.
Due to the temporal mismatch between satellite observations and precipitation data, the 15 min satellite observations and 1 h precipitation data were unified to the hourly scale for overall statistics and case analyses. For each hourly precipitation record, the four FY-4B observations within that hour were used. Cloud parameters were extracted from the 35 km × 35 km window around each heavy-rainfall station. During short-duration heavy rainfall, cloud-top cooling, cloud-top height increase, and brightness temperature gradient enhancement are usually most evident in hourly extreme values. Therefore, the extremes from the four 15 min observations within each hour were used to capture the strongest state of cloud development during that hour. This approach also reduces information loss that may occur when only a single satellite observation time is selected. The specific method was as follows. For parameters that reflect cloud-top cooling, pressure decrease, and spectral band-difference changes, including IR1, IR2, IR3 brightness temperatures, CTT, CTP, DTB12, and DTB13, the hourly minimum value was used. For parameters that reflect vertical cloud development and cloud-top structural changes, including CTH, deep convection index, and maximum gradient, the hourly maximum value was used. For classification products, including CLM, CLP, and CLT, the dominant category at the station location or within the neighboring area during the heavy-rainfall period was extracted.
During data matching, samples with missing satellite data during key periods or samples that could not be matched with precipitation periods were removed. Only events with relatively complete FY-4B data during the peak rainfall period and adjacent periods were retained. It should be noted that FY-4B satellite data are instantaneous observations; whereas, precipitation data are hourly accumulated values. Therefore, there is still a difference in temporal representativeness between the two datasets. The cloud-parameter thresholds obtained in this study mainly reflect the statistical characteristics of cloud-system development during localized short-duration heavy rainfall in Sichuan. They can be used as reference indicators for heavy-rainfall identification and monitoring, but should not be interpreted as strict deterministic forecasting thresholds.
Before data use, quality control was applied to both precipitation observations and satellite data. For precipitation data, missing and abnormal rainfall records were removed. The temporal continuity of precipitation data during heavy-rainfall periods was also checked. For satellite data, the completeness and temporal matching of FY-4B observations during the peak rainfall period and adjacent periods were checked. These procedures helped ensure the reliability of heavy-rainfall case selection, representative-station determination, and cloud-parameter extraction.
2.2. Parameter Calculation
To characterize the cloud-top thermal state and convective development during short-duration heavy rainfall events in Sichuan, several parameters were calculated in this study, including the minimum brightness temperature, spectral brightness temperature differences (DTB12 and DTB13), deep convection index, brightness temperature gradient, and extrema of satellite-derived cloud products. These parameters were used to describe the degree of cloud-top cooling, vertical development, cloud phase, intensity of deep convective development, upper-level moist region, and atmospheric stability within the area corresponding to the short-duration rainstorm period.
For each FY-4B observation time, the minimum brightness temperatures of IR1 (Channel 13), IR2 (Channel 14), and IR3 (Channel 10) within the regional window were extracted separately. The mean of these three values was used as the minimum brightness temperature (TBBmin) for that observation time.
where denotes the minimum brightness temperature of the channel (i = 1, 2, 3) within the regional window.
DTB12 is defined as the difference between the cloud-top brightness temperature (TBB) of IR1 and that of IR2. A difference greater than 3 K is commonly used to exclude thick cirrus clouds; whereas, a difference of ≤3 K can be used to identify convective cloud areas [14,32]. A negative value can serve as an auxiliary indicator of ice-phase cloud-tops. More negative values indicate stronger convective development and greater heavy-rainfall potential. DTB13 is defined as the difference between the cloud-top brightness temperature (TBB) of IR1 and that of IR3. A negative value indicates strong convective cloud areas, high and cold cloud-tops, strong deep convection, and obvious ice-phase clouds [14,15]. More negative values indicate that water vapor is transported to higher levels by strong upward motion, suggesting greater heavy-rainfall potential. Within the regional window Ω, the minimum values during the rainstorm period were extracted as follows:
The deep convection index was calculated from the minimum brightness temperatures of the IR1, IR2, and IR3 channels within the regional window and was used to characterize cold cloud-tops and the intensity of deep moist convection. When the minimum brightness temperature of a given channel was higher than 250 K, the deep convection index for that channel was set to 0. When the minimum brightness temperature was lower than 250 K, it was calculated as the difference between 250 K and the minimum brightness temperature of that channel. Finally, the maximum value among the three channel-based results was taken as the deep convection index at that observation time, as follows:
where DCI denotes the deep convection index, and , , and denote the minimum brightness temperatures of the IR1, IR2, and IR3 channels within the regional window, respectively.
The brightness temperature gradient was calculated based on the differences between adjacent pixels within the regional window. In this study, the maximum brightness temperature gradients of the IR1, IR2, and IR3 channels within the regional window were calculated separately, and their average was taken as the maximum gradient (Gmax), as follows:
where denotes the maximum brightness temperature gradient of the channel within the regional window Ω.
FY-4B cloud products are mainly retrieved using variational methods, optimal estimation, and temperature profile information. Specifically, two infrared split-window channels of FY-4B/AGRI, namely Channel 13 (10.8 μm) and Channel 14 (12.0 μm), and one CO2 absorption channel, Channel 15 (13.5 μm), are used. A one-dimensional variational method (1D-Var) is applied to determine the optimal cloud-top temperature layer, and the corresponding cloud-top height and cloud-top pressure are then retrieved through interpolation using numerical weather prediction profile products [33,34]. Cloud-top height, cloud-top temperature, and cloud-top pressure are generally determined jointly from infrared observations, optimal estimation methods, and numerical weather prediction temperature profiles [35].
The one-dimensional variational retrieval can be expressed as the minimization of the following cost function:
where is the cost function, is the state vector to be retrieved, is the a priori state vector, is the satellite observation vector, is the radiative transfer forward operator, and and denote the observation error covariance matrix and the a priori error covariance matrix, respectively. The state vector can be expressed as:
where is the cloud-top temperature, is the cloud emissivity at 11 μm, and is the spectral variation parameter of cloud emissivity between the 11 and 12 μm channels. The optimal state vector is obtained by minimizing the cost function:
where the cloud-top temperature component of the optimal state vector corresponds to the cloud-top temperature product:
By further combining the retrieved cloud-top temperature with the numerical weather prediction temperature profile, the corresponding cloud-top height and cloud-top pressure can be obtained:
where and denote the height and pressure in the numerical weather prediction temperature profile that correspond to the optimal cloud-top temperature, respectively. Therefore, CTT mainly reflects the thermal state of the cloud-top; whereas, CTH and CTP characterize the vertical development height of the cloud body and the pressure level at which the cloud-top is located, respectively. It should be noted that CTT, CTH, and CTP were obtained through the above approximate retrieval method, and the results may differ from the actual cloud-top conditions. According to historical COSMIC radio occultation observations, the tropopause height over the southeastern Tibetan Plateau and Sichuan is approximately 13–19 km, with maximum values reaching 17–19 km [36,37].
3. Results
To distinguish the cloud-parameter characteristics of short-duration heavy rainfall and short-duration rainstorms, heavy-rainfall events in Sichuan were classified into two categories: 20–50 mm·h−1 and ≥50 mm·h−1. The 20–50 mm·h−1 category represents ordinary short-duration heavy rainfall; whereas, the ≥50 mm·h−1 category represents short-duration rainstorms and more intense rainfall events. A total of 280 independent samples were obtained from the 35 km × 35 km regional windows of localized short-duration heavy rainfall in Sichuan. Among them, 216 samples belonged to the 20–50 mm·h−1 category, and 64 samples belonged to the ≥50 mm·h−1 category.
3.1. Statistical Characteristics of Cloud Parameters Under Different Rainfall-Intensity Classes
The Mann–Whitney U nonparametric test was used to examine differences in cloud-parameter characteristics between the two rainfall-intensity groups. Since eight continuous cloud parameters were tested simultaneously, the Benjamini–Hochberg method was further applied to adjust the original p-values. This was done to reduce the risk of Type I errors caused by multiple comparisons. The comparison results are shown in Table 1.
Table 1.
Statistical characteristics of FY-4B parameters under different rainfall-intensity classes, Mann–Whitney U test results, and BH-adjusted results.
From Table 1, compared with the 20–50 mm·h−1 group, the ≥50 mm·h−1 group shows clearly lower mean and median values of minimum brightness temperature and CTTmin. This indicates that stronger short-duration heavy rainfall is associated with a colder cloud-top thermal state. Meanwhile, CTHmax is generally higher and CTPmin is generally lower in the ≥50 mm·h−1 group. This suggests stronger vertical cloud development during more intense rainfall, with cloud-tops extending to higher levels. In addition, the mean CTPmin and CTHmax values in the ≥50 mm·h−1 group are 93.17 hPa and 17.09 km, respectively. In the 20–50 mm·h−1 group, the corresponding mean values are 119.32 hPa and 16.02 km. These results indicate that some convective clouds during heavy rainfall in Sichuan can develop near the tropopause and exhibit strong deep-convection characteristics.
For samples of short-duration rainstorms and above, the extreme values of the deep convection index and brightness temperature gradient were higher than those of the 20–50 mm·h−1 short-duration heavy rainfall samples. This indicates that stronger rainfall corresponds to deeper moist convection, more active internal convection, and more pronounced cloud-top structural fluctuations. Meanwhile, the extreme values of DTB13 and DTB12 in the ≥50 mm·h−1 group were lower than those in the 20–50 mm·h−1 group, indicating that the moist region associated with short-duration rainstorms and above can extend to higher levels of the troposphere. The Mann–Whitney U test showed that the minimum brightness temperature, deep convection index, DTB12min, DTB13min, maximum gradient, CTHmax, CTTmin, and CTPmin all passed the 0.01 significance level test between the two rainfall-intensity groups. After further applying the Benjamini–Hochberg method for multiple-comparison correction, the adjusted p-values of all eight parameters remained below 0.01. This indicates that FY-4B cloud characteristic parameters show clear response characteristics and statistical significance for different levels of short-duration heavy rainfall, and that this conclusion remains valid after multiple-comparison control.
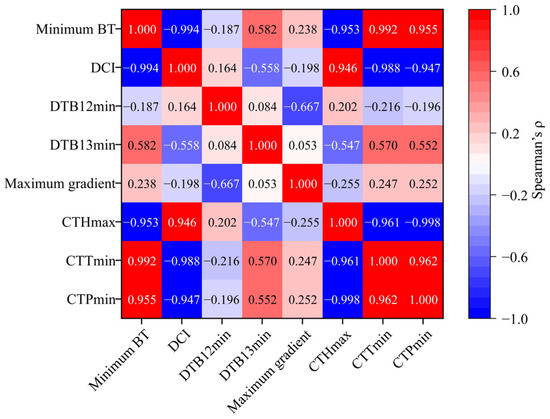
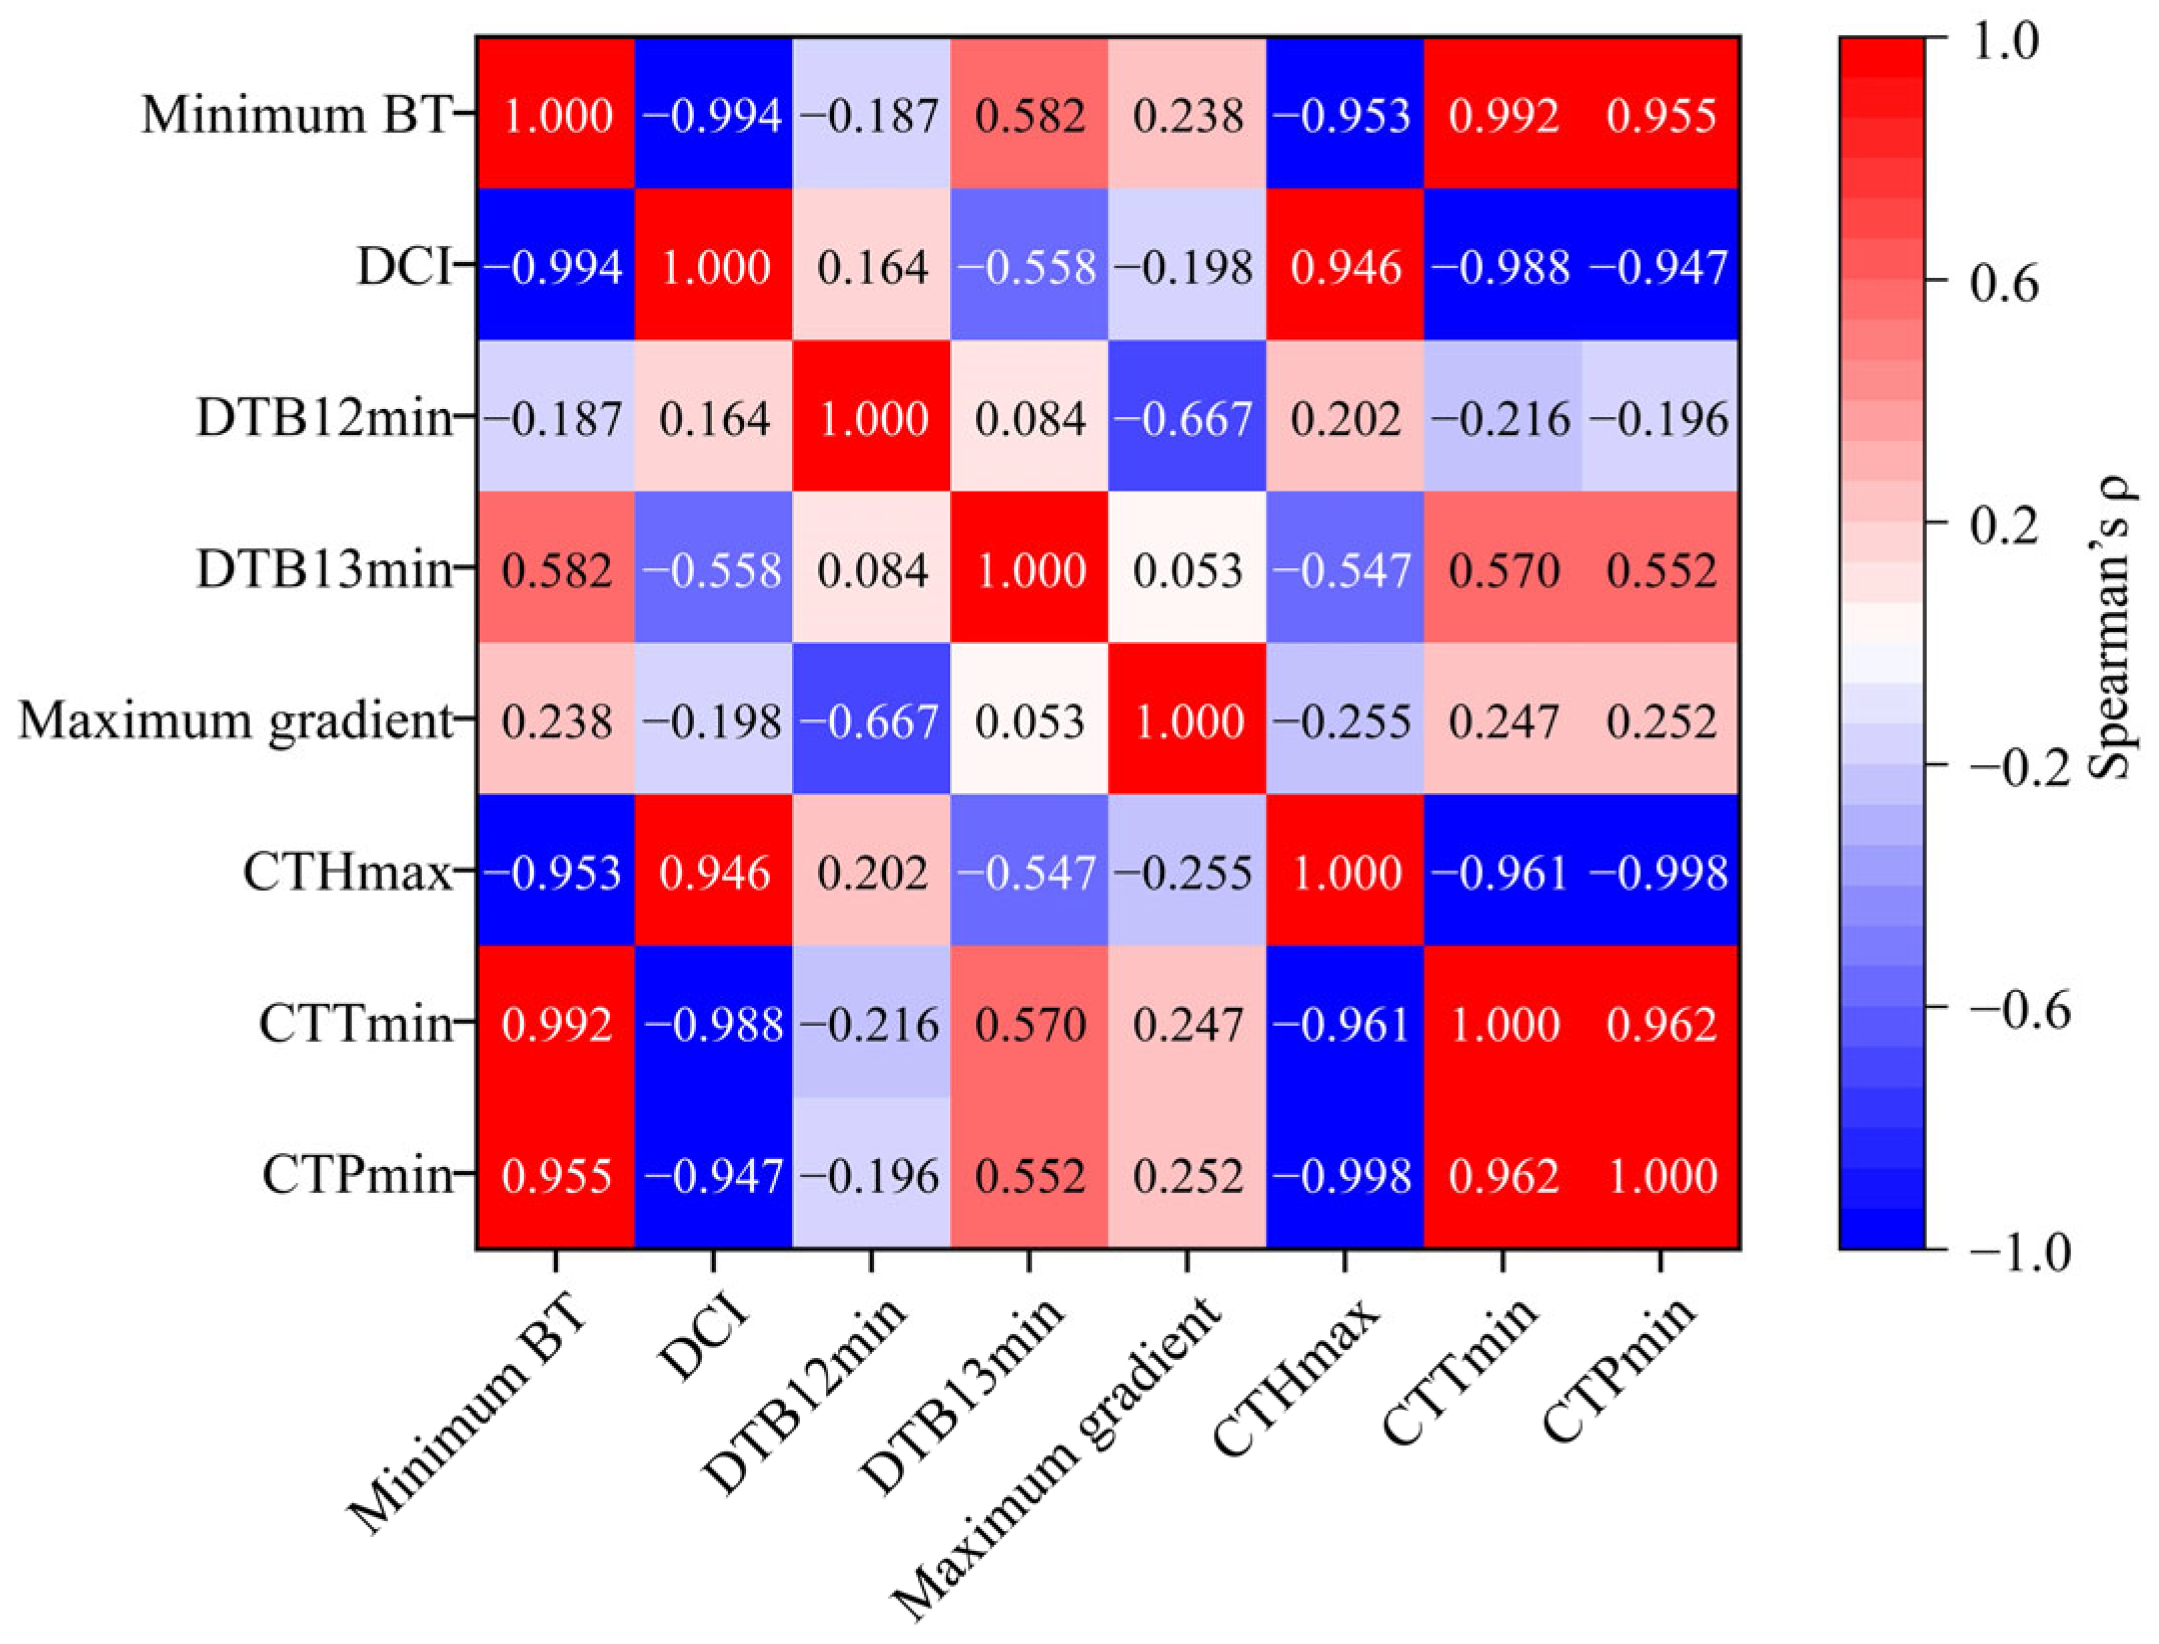
To further illustrate the information independence among different cloud parameters, this study calculated the Spearman correlation coefficients among the above eight parameters and plotted a correlation-coefficient heatmap (Figure 3). The results show strong correlations between the calculated minimum brightness temperature and deep convection index (using FY-4B Channels 10, 13, and 14) and the Level-2 product retrieval parameters CTTmin, CTHmax, and CTPmin (using Channels 13, 14, and 15). Specifically, the correlation coefficients between the minimum brightness temperature and deep convection index, between the minimum brightness temperature and CTTmin, between CTTmin and CTHmax, and between CTHmax and CTPmin reached −0.994, 0.992, −0.96, and −0.998, respectively. This indicates that these parameters mainly reflect the cloud-top thermal state and vertical development state, and are not completely independent sources of information. In contrast, DTB12min, DTB13min, and the maximum gradient (using FY-4B Channels 10, 13, and 14) show relatively weaker correlations with the above cloud parameters. For example, the correlation coefficients between DTB12min and the minimum brightness temperature, between DTB13min and CTPmin, and between the maximum gradient and the deep convection index are −0.19, 0.55, and 0.20, respectively. In addition, the correlations among DTB12min, DTB13min, and the maximum gradient are even weaker. For example, the correlation coefficient between DTB12min and DTB13min is 0.08, and that between DTB13min and the maximum gradient is 0.05. Therefore, the multi-parameter combination emphasized in this study does not imply that all parameters are completely independent of one another. Rather, it refers to four relatively independent physical dimensions: the cloud-top thermal and vertical-development state, the spectral band-difference information represented by DTB12min, the spectral band-difference information represented by DTB13min, and the horizontal structural characteristics of the cloud top. Specifically, the minimum brightness temperature, deep convection index, CTHmax, CTTmin, and CTPmin mainly characterize cloud-top temperature, cloud-top height, and the degree of vertical development. Although DTB12min and DTB13min both represent spectral band-difference information, their correlation coefficient is relatively low, indicating that they contain largely independent information. They may respectively reflect spectral differences associated with cloud microphysical properties and mid- to upper-level water vapor conditions. The maximum gradient characterizes the horizontal inhomogeneity of the cloud-top brightness temperature field and the edge structure of the cloud body.
Figure 3.
Heatmap of the Spearman correlation matrix among eight cloud parameters.
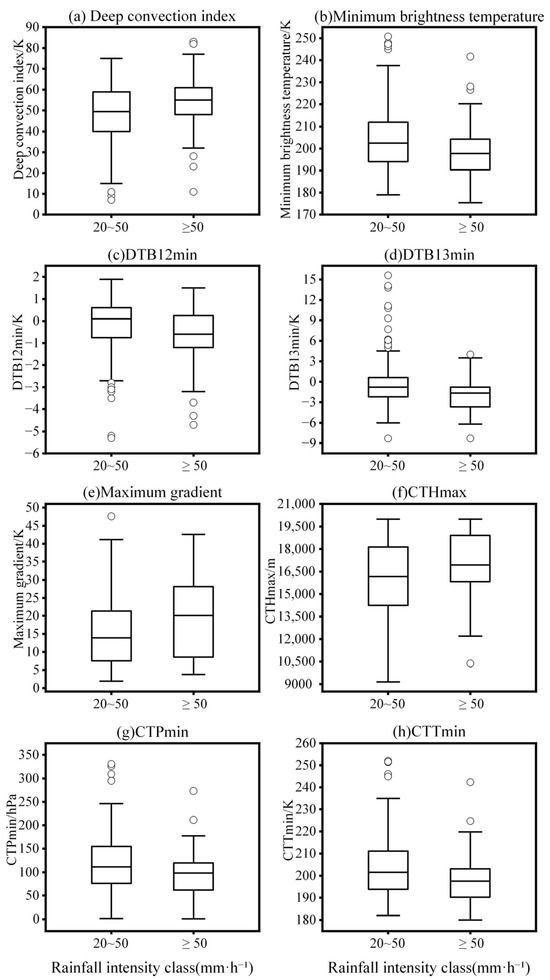
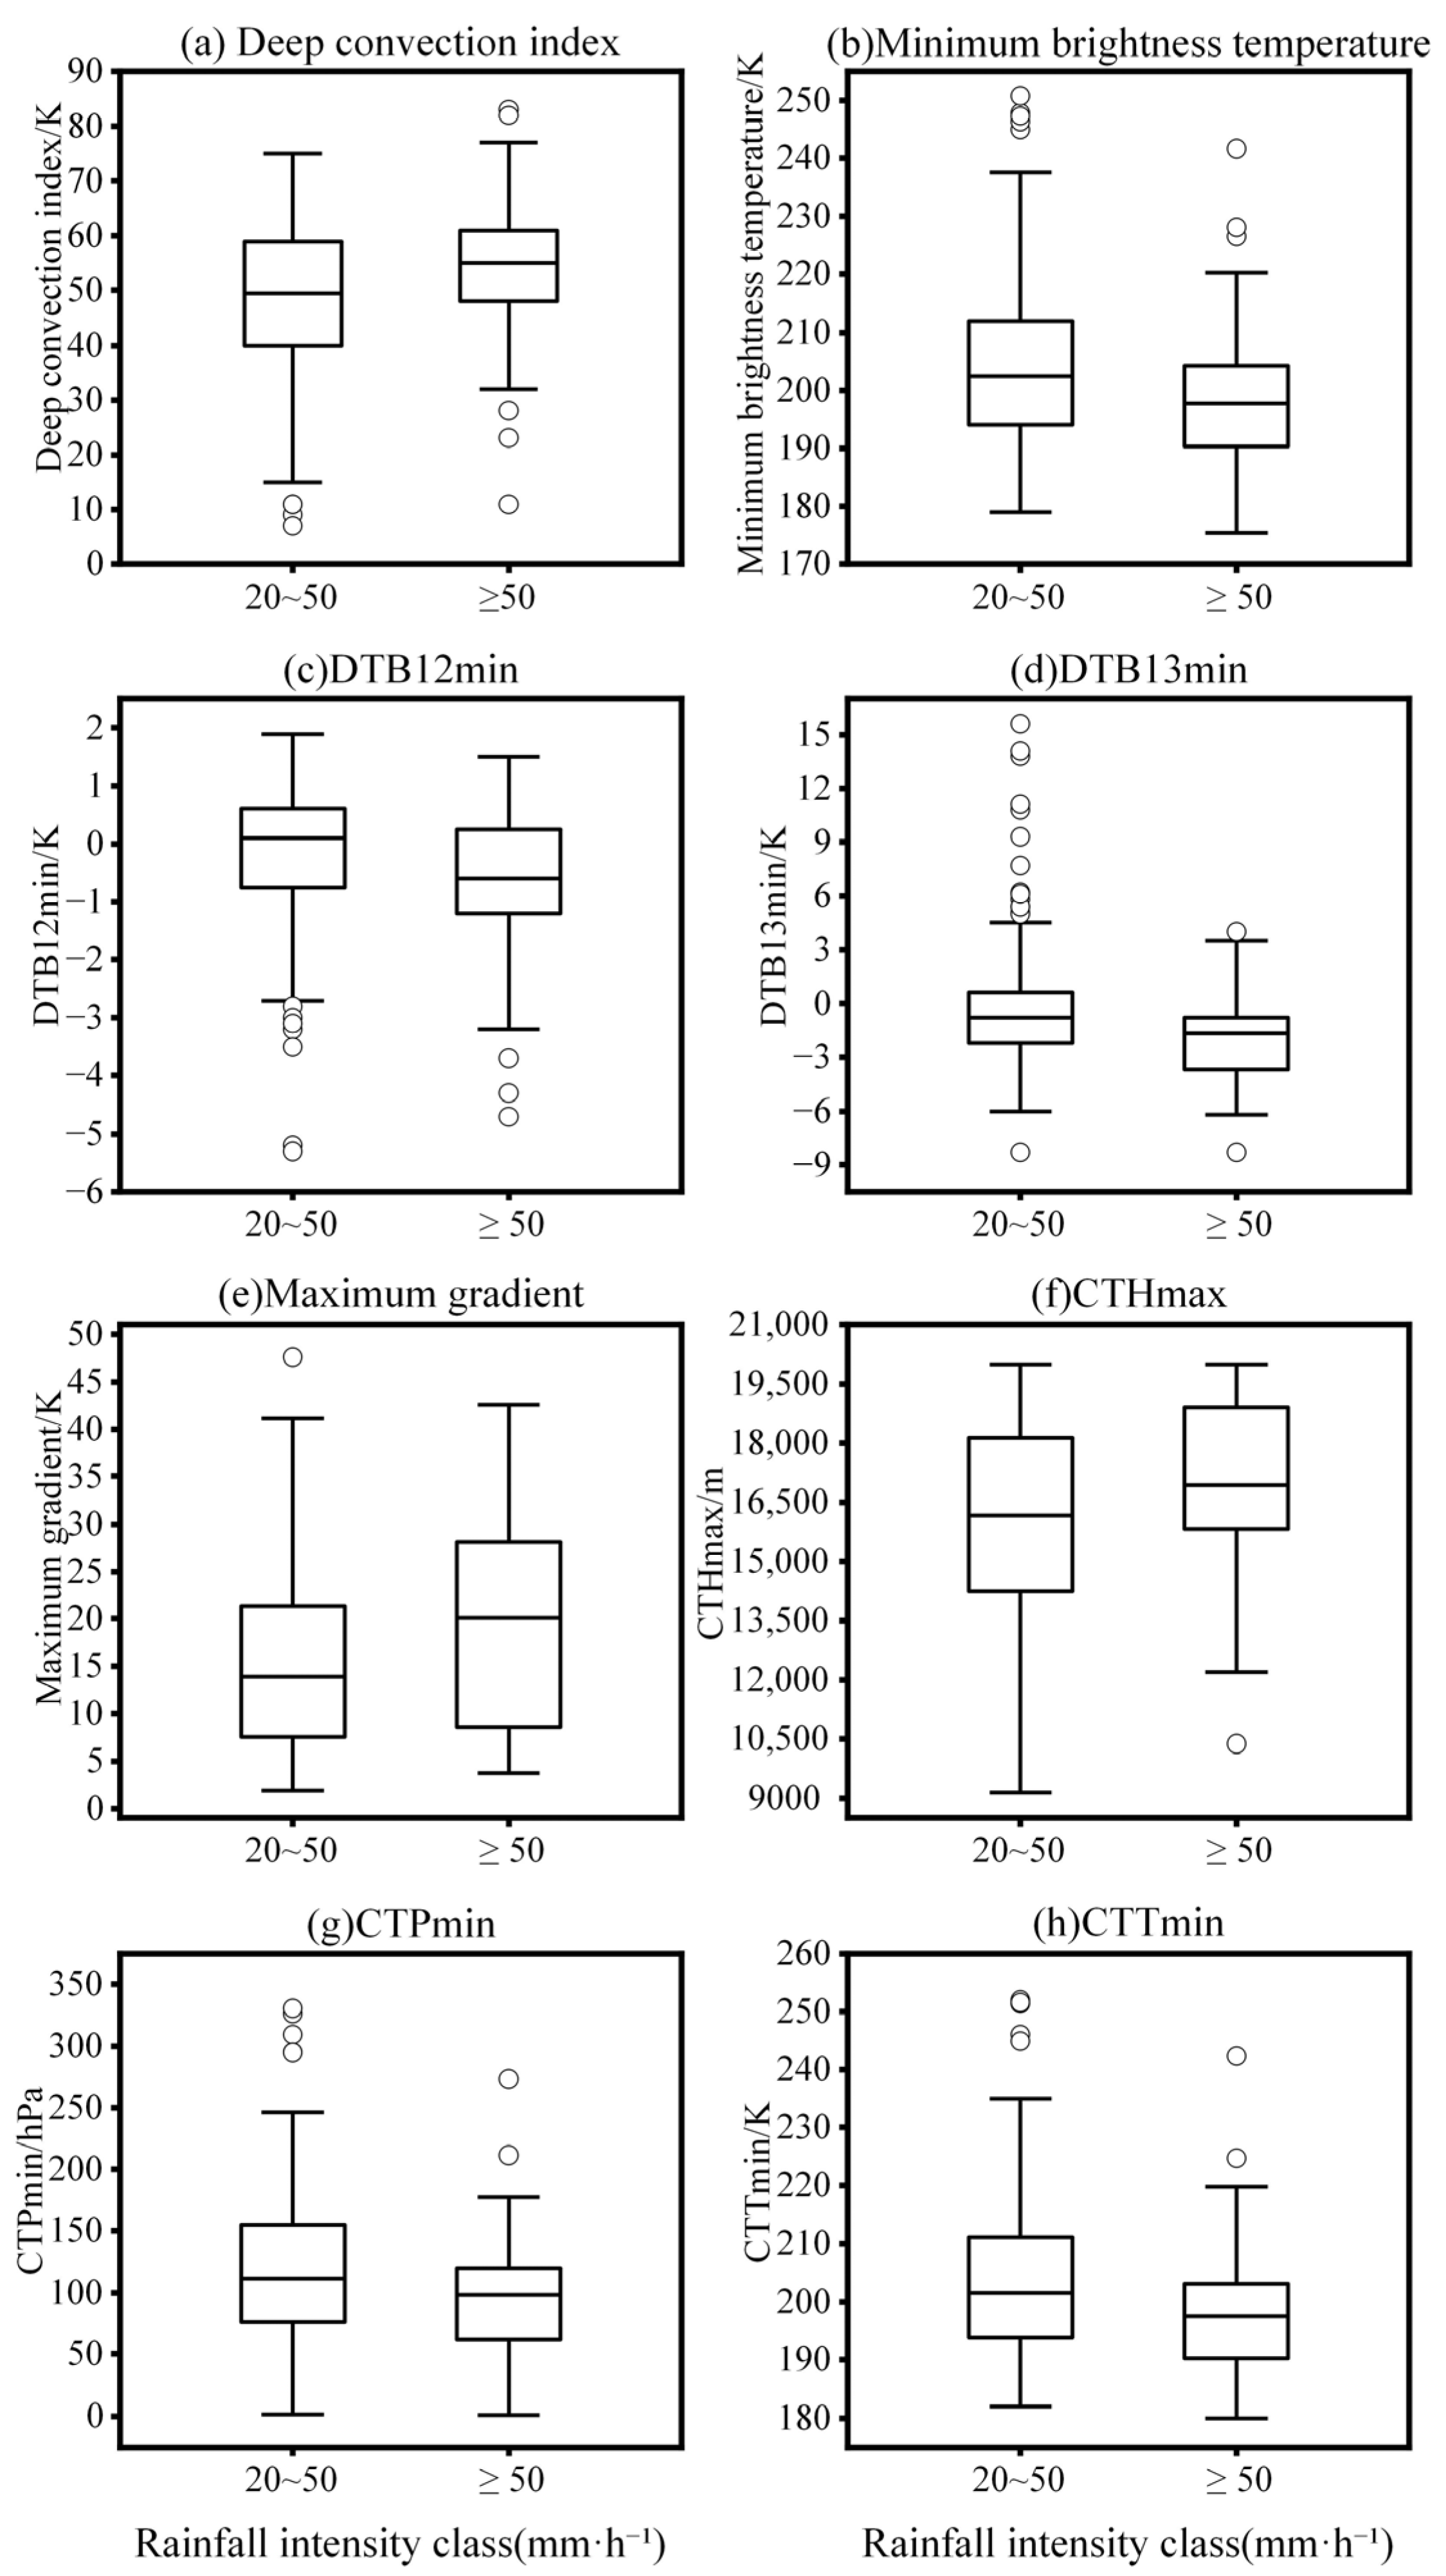
By comparing the box plots of cloud-feature parameters for the two heavy-rainfall classes (Figure 4), it can be seen that for ≥50 mm·h−1 short-duration rainstorm processes, the boxes of minimum brightness temperature, CTTmin, and CTPmin are generally lower than those for ordinary 20–50 mm·h−1 short-duration heavy-rainfall processes; whereas, the deep convection index, maximum gradient, and CTHmax are generally higher. This also indicates that higher rainfall-intensity classes correspond to colder cloud-tops, greater development height, larger cloud-top structural fluctuations, and more active convection within the cloud. However, the distributions of the two heavy-rainfall classes still overlap for several parameters, indicating that a single satellite parameter cannot fully distinguish rainfall-intensity classes and that multiple cloud parameters are needed to characterize the common cloud-development features associated with rainfall intensity.
Figure 4.
Box plots of FY-4B continuous parameters under different rainfall-intensity classes. Note: Boxes indicate the interquartile ranges, central lines indicate medians, whiskers indicate 1.5 times the interquartile ranges, and circles indicate outliers.
3.2. Statistical Characteristics of CL Parameters During Heavy-Rainfall Processes
The CL parameters of short-duration heavy-rainfall stations in Sichuan over the past three years were statistically analyzed. The CL parameters include cloud mask (CLM), cloud type (CLT), and cloud phase (CLP), and the statistical results are shown in Table 2 and Table 3. The CLM cloud mask results (Table 2) are dominated by cloudy pixels (value 0), accounting for 97.33%. Possible cloud (value 1) accounts for 1.75%; whereas, possible clear and clear-sky pixels account for only 0.33% and 0.58%, respectively. This indicates that most stations within the short-duration heavy-rainfall regional window are cloud-covered, which is consistent with the actual situation.
Table 2.
Statistical characteristics of cloud mask (CLM) in short-duration heavy-rainfall samples.
Table 3.
Statistical characteristics of cloud type (CLT) and cloud phase (CLP) in short-duration heavy-rainfall samples.
For heavy-rainfall processes, the CLT cloud type (Table 3) is dominated by ice cloud (value 5), accounting for 66.94%, and the CLP cloud phase (Table 3) is dominated by ice phase (value 4), accounting for 74.42%. Water cloud, supercooled water cloud, and mixed cloud occur in certain proportions, but their proportions are much lower than those of ice cloud and ice phase. This result indicates that cloud-tops during short-duration heavy-rainfall processes in Sichuan are mainly ice-phase cold clouds. In Table 1, CTH extrema during heavy-rainfall processes exceed 15 km, and the multi-channel minimum brightness temperature from Level-1 data together with the retrieved CTT product indicate cloud-top brightness temperature extrema below 200 K. At such heights, cloud particle temperatures are very low and the particles can only exist in the ice phase. This confirms that deep moist convection develops vigorously during short-duration heavy rainfall in Sichuan and that cloud-tops in most heavy-rainfall processes develop near the tropopause.
4. Cloud Characteristics of Typical Local Heavy-Rainfall Processes
To illustrate the specific cloud-parameter characteristics of local heavy-rainfall processes in Sichuan, one typical representative event was selected from each year during 2023–2025 according to hourly precipitation amount, continuity of satellite data, and completeness of precipitation observations. The representative events occurred on 26 July 2023, 13 July 2024, and 21 May 2025.
4.1. Event on 26 July 2023
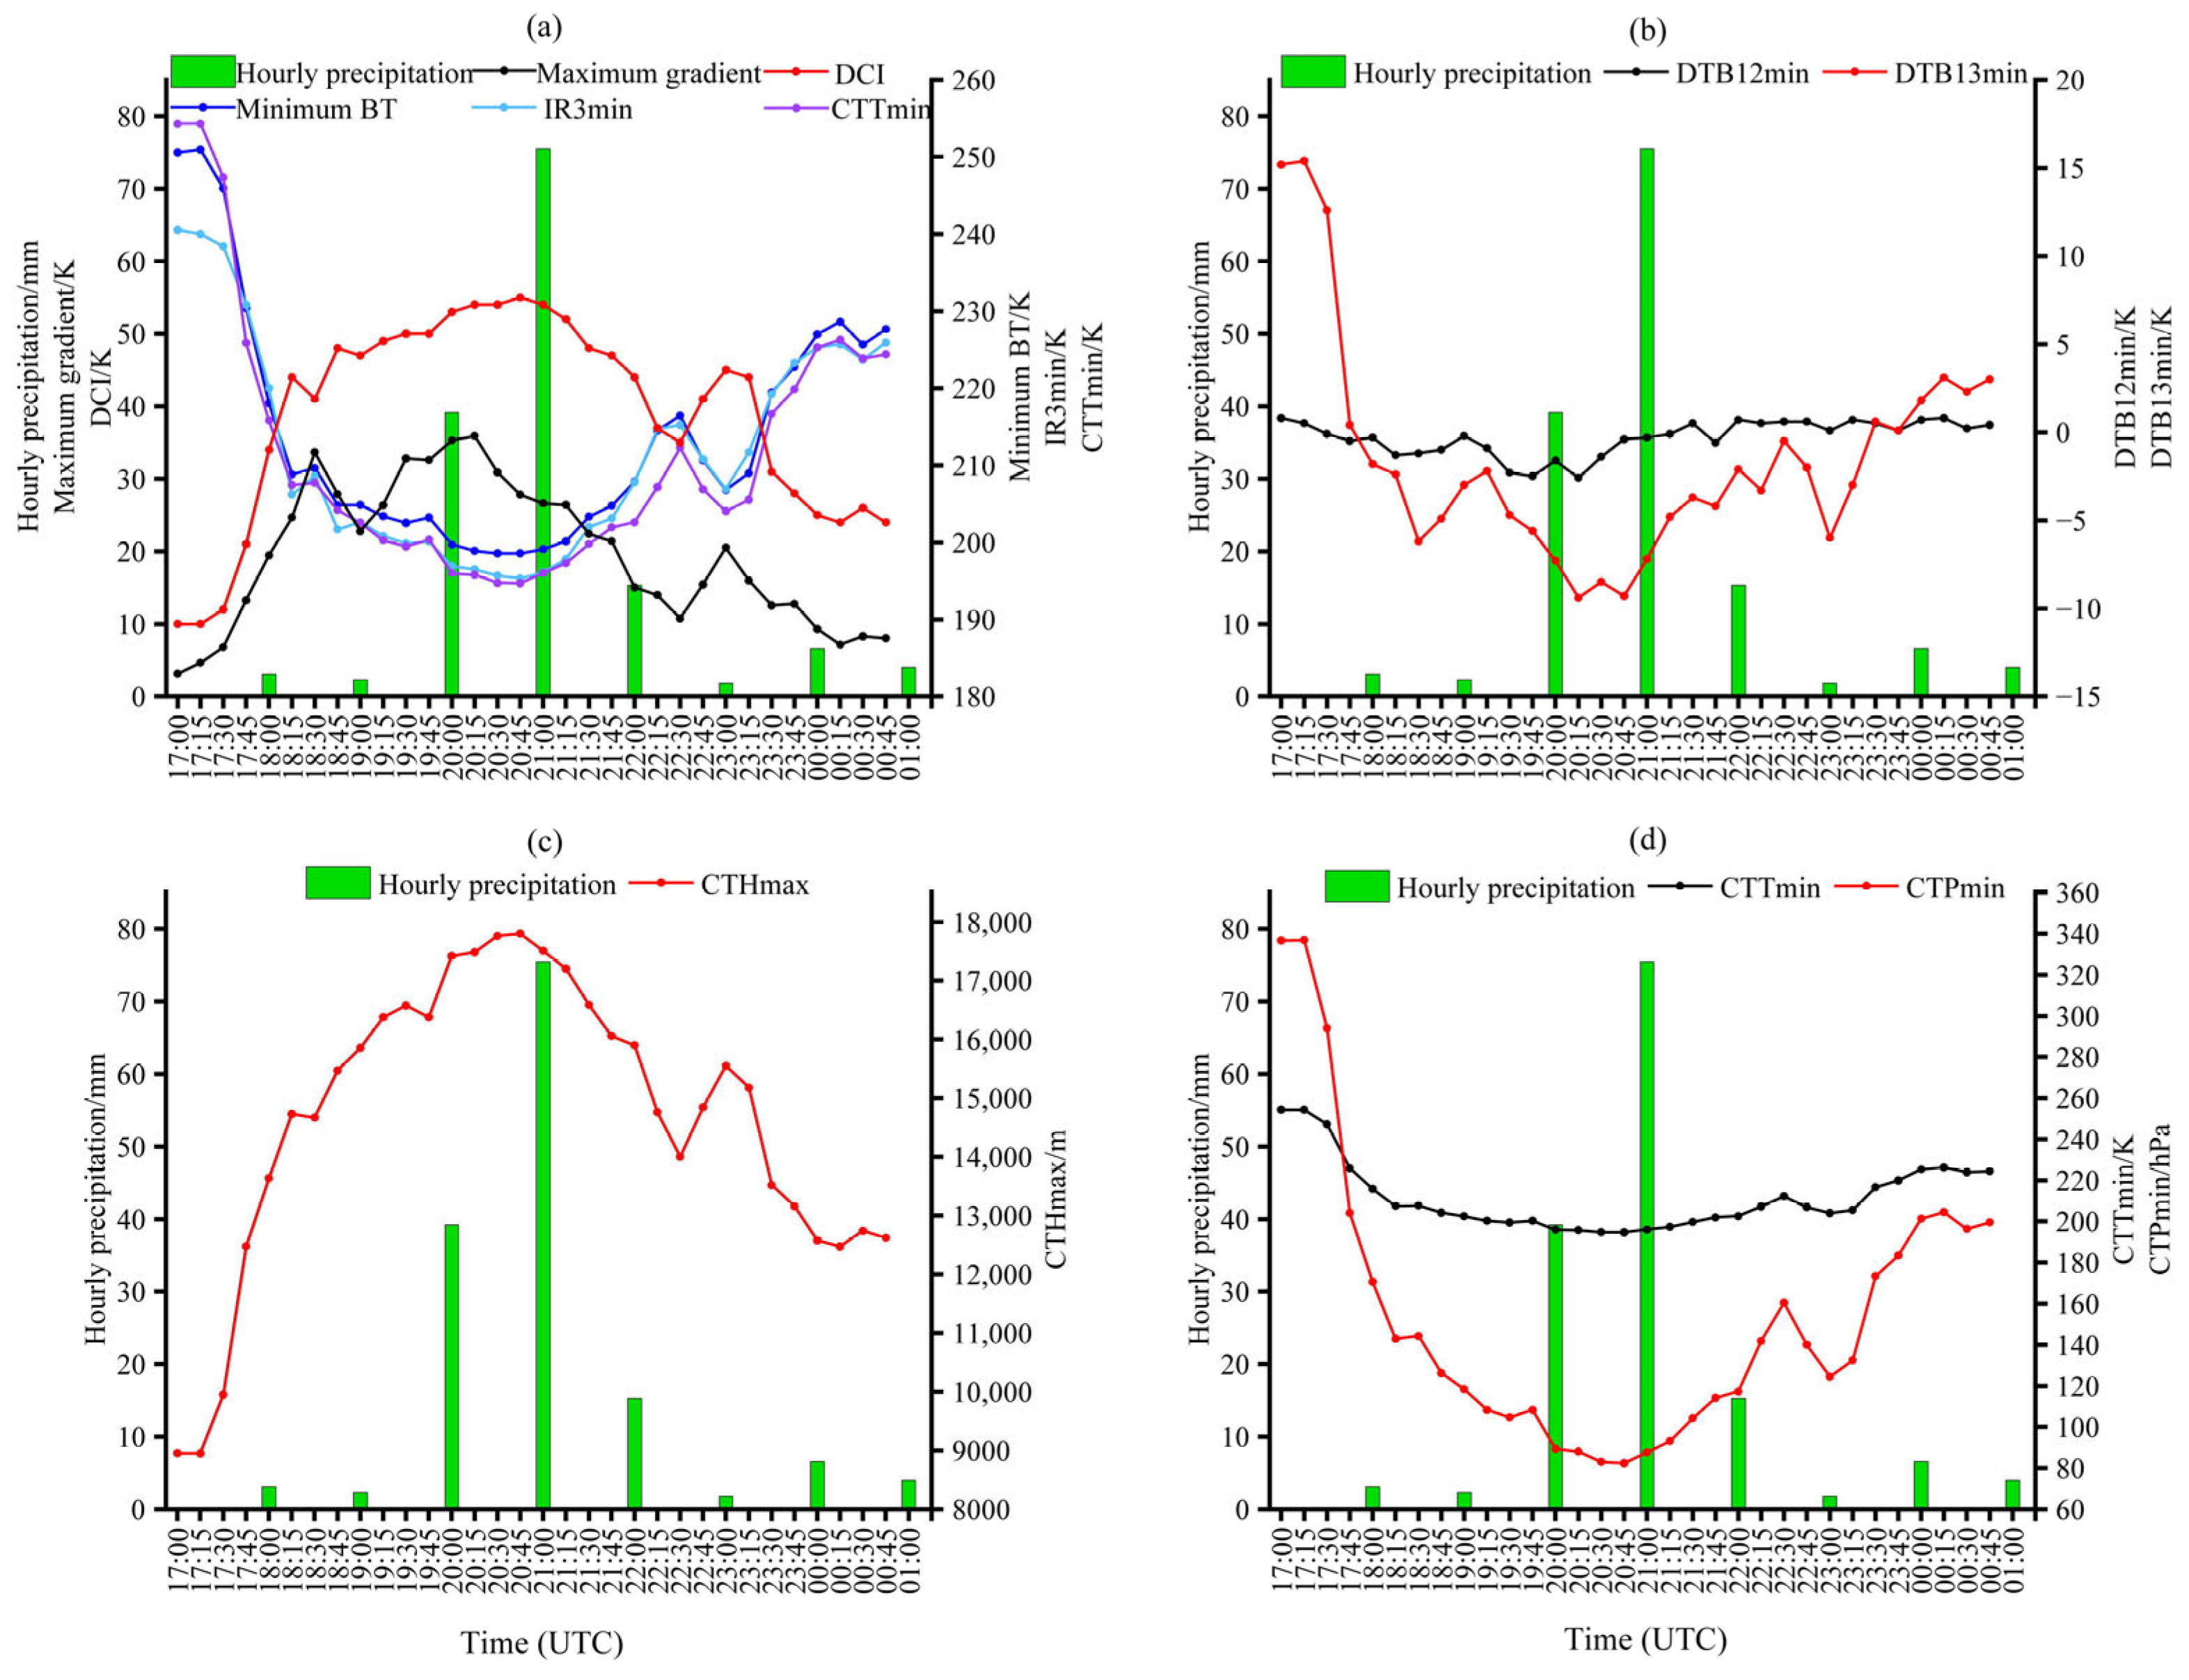
During the 26 July 2023 event, the maximum hourly rainfall intensity was 75.5 mm·h−1 and occurred at Deyao Fulaicun during 20:00–20:59. Rainfall increased markedly during 19:00–19:59, reached its peak during 20:00–20:59, and then weakened rapidly, showing a clear short-duration intensification feature.
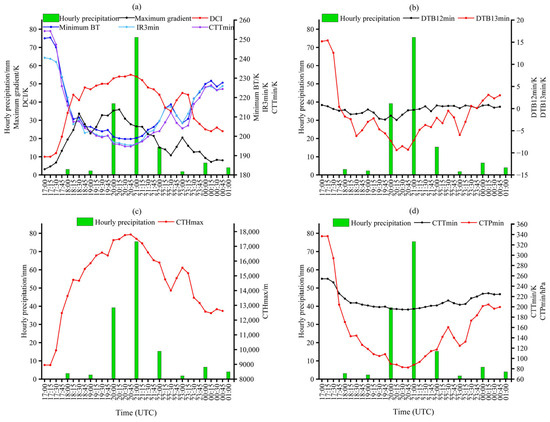
From the time series of FY-4B key cloud-parameter values with hourly precipitation (hourly rainfall intensity) (Figure 5), the minimum brightness temperature decreased from 204.87 K at 19:00 to 199.70 K at 20:00 and remained near 199 K from 20:15 to 20:45 (Figure 5a). The water vapor channel IR3 and the retrieved CTT product showed similar trends, both consistent with the strongest rainfall period. The deep convection index also rose above 50 K during the strongest rainfall period. The maximum cloud-top brightness temperature gradient reached peaks twice and increased to a peak of about 35 K when the strongest rainfall began, about 1 h earlier than the onset of the secondary heavy rainfall. As precipitation weakened, cloud-top brightness temperature increased, and the deep convection index and brightness temperature gradient decreased. This indicates that decreases in cloud-top brightness temperature and increases in the deep convection index are associated with strengthening hourly rainfall intensity; whereas, the opposite changes are associated with weakening rainfall intensity. In addition, the timing of the cloud-top brightness temperature gradient peak can indicate the onset of heavy rainfall, and the number of peaks corresponds to the number of short-duration heavy-rainfall peaks.
Figure 5.
Temporal evolution of key cloud parameters during the heavy-rainfall event on 26 July 2023. (a) Hourly precipitation, minimum brightness temperature, IR3min, CTTmin, maximum gradient, and deep convection index; (b) hourly precipitation and brightness temperature differences DTB12min and DTB13min; (c) hourly precipitation and maximum cloud-top height; (d) hourly precipitation, minimum cloud-top temperature, and minimum cloud-top pressure. BT denotes brightness temperature, and DCI denotes deep convection index.
The spectral band difference DTB13min remained below the process valley value of −8 K during the strongest rainfall period from 20:15 to 20:45, indicating that the moist layer of the heavy-rainfall cloud system also reached its maximum extension height and that deep moist convection developed to its strongest stage. During the entire heavy-rainfall period, the variation amplitude of DTB13min between adjacent observation times was generally larger than that of DTB12min (Figure 5b), indicating that, during the mature stage of the heavy-rainfall cloud system, the enhancement of mid- to upper-level water vapor was more pronounced than the enhancement of cloud optical thickness. The temporal variations in cloud-top height (CTHmax) and cloud-top pressure (CTPmin) with precipitation (Figure 5c,d) also maintained peak values of approximately 17 km and valley values of approximately 100 hPa, respectively, during the strongest rainfall period from 20:15 to 20:45. This indicates that the valley values of cloud-top brightness temperature and spectral band differences, together with the peak value of cloud-top height, can indicate the strongest rainfall period. Combining Figure 5a,b, short-duration heavy rainfall can be inferred to occur during periods of decreasing cloud-top brightness temperature, decreasing spectral band differences, decreasing cloud-top pressure, increasing cloud-top height, increasing deep convection index, and increasing brightness temperature gradient.
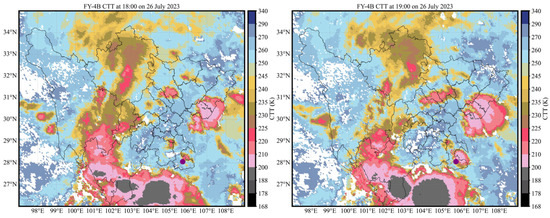
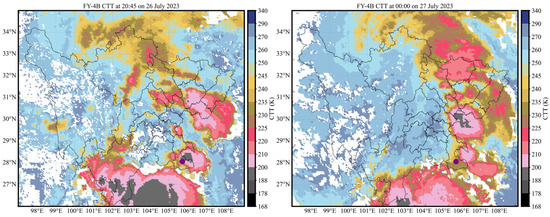
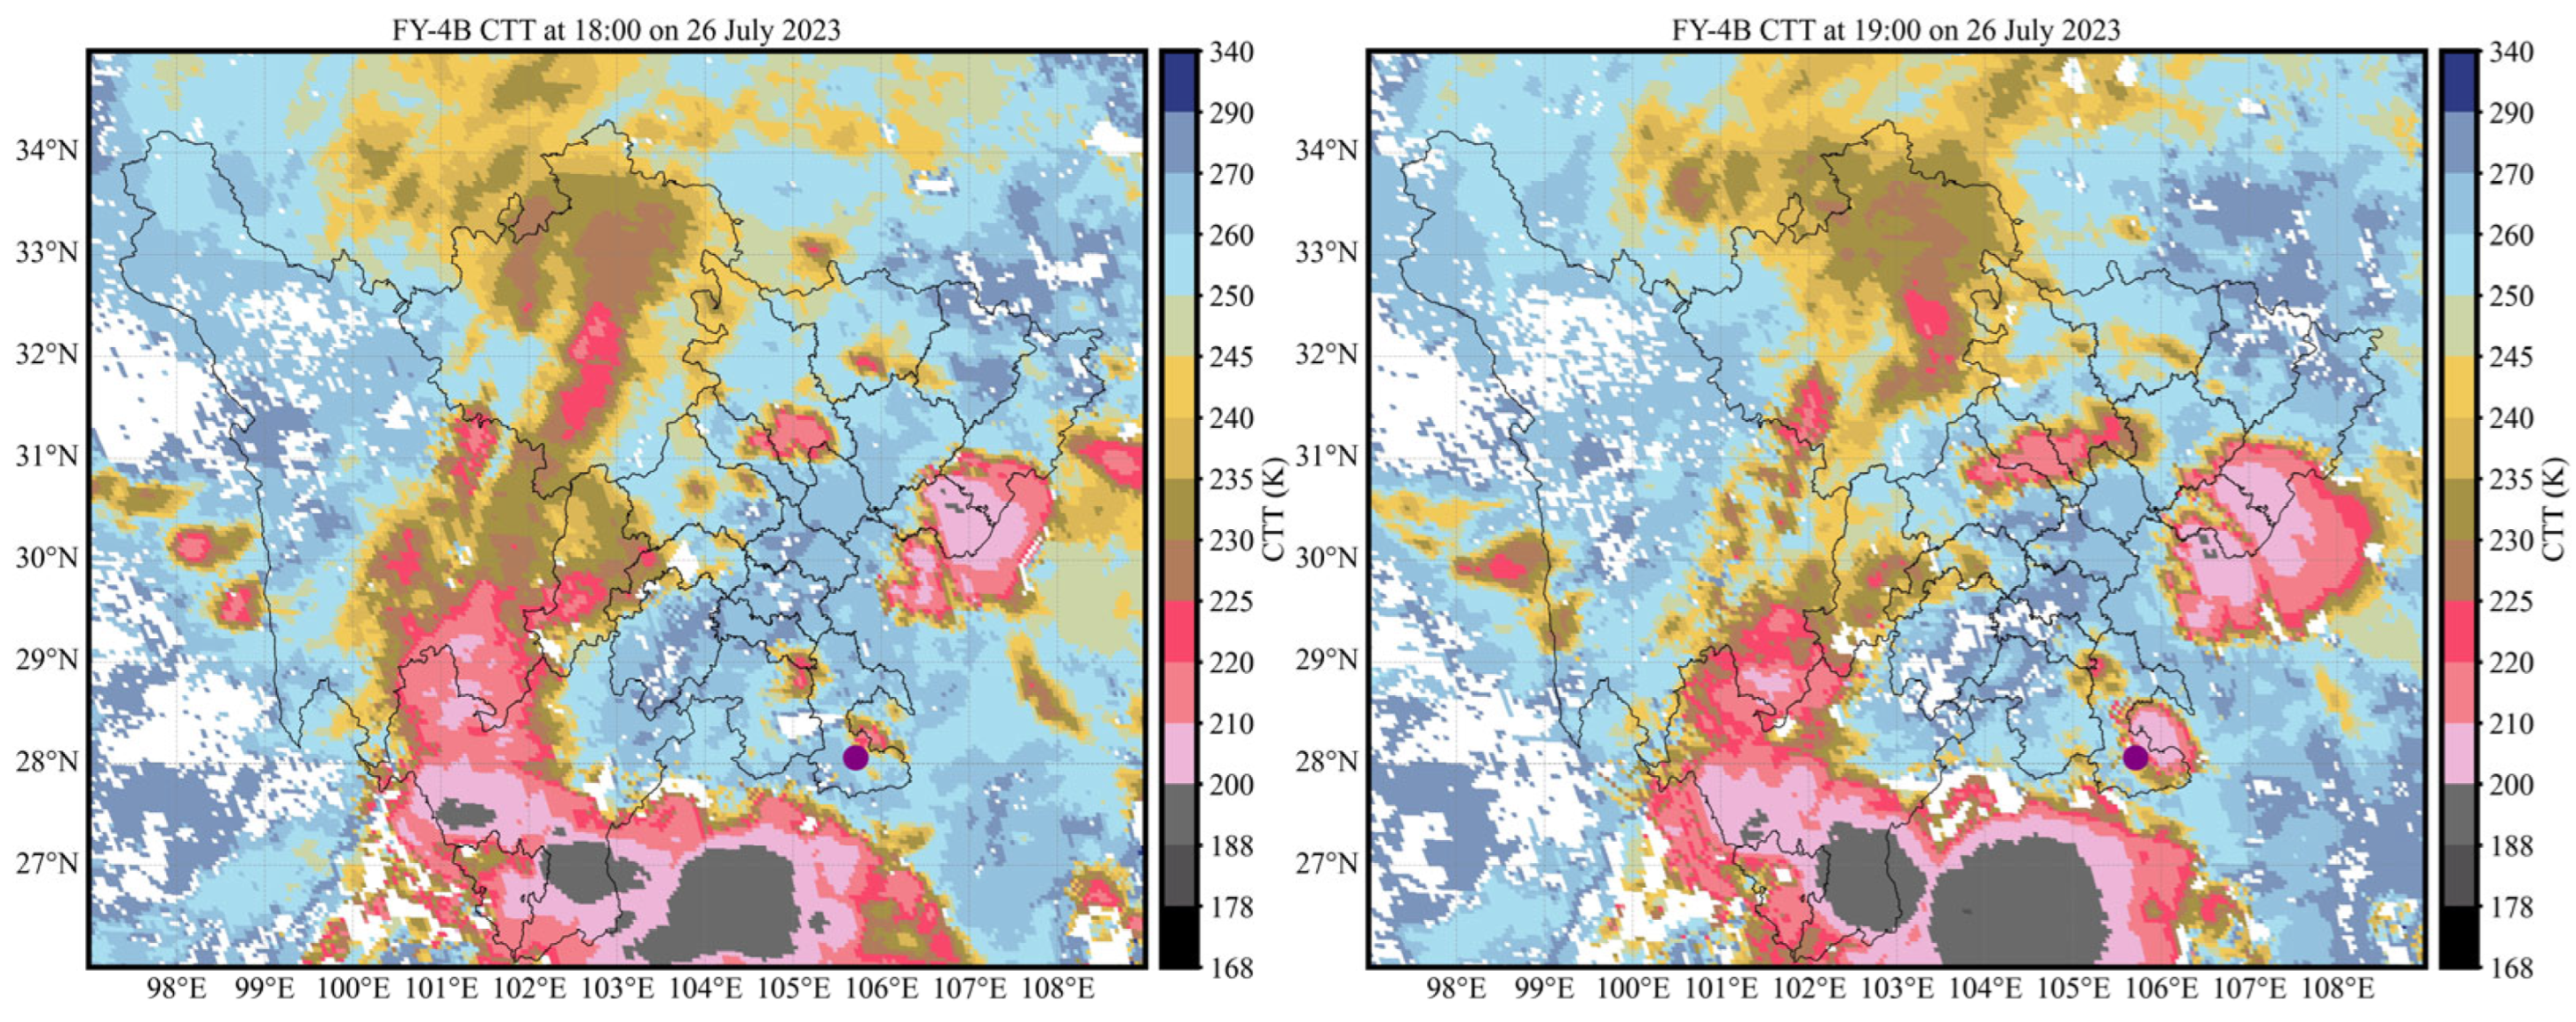
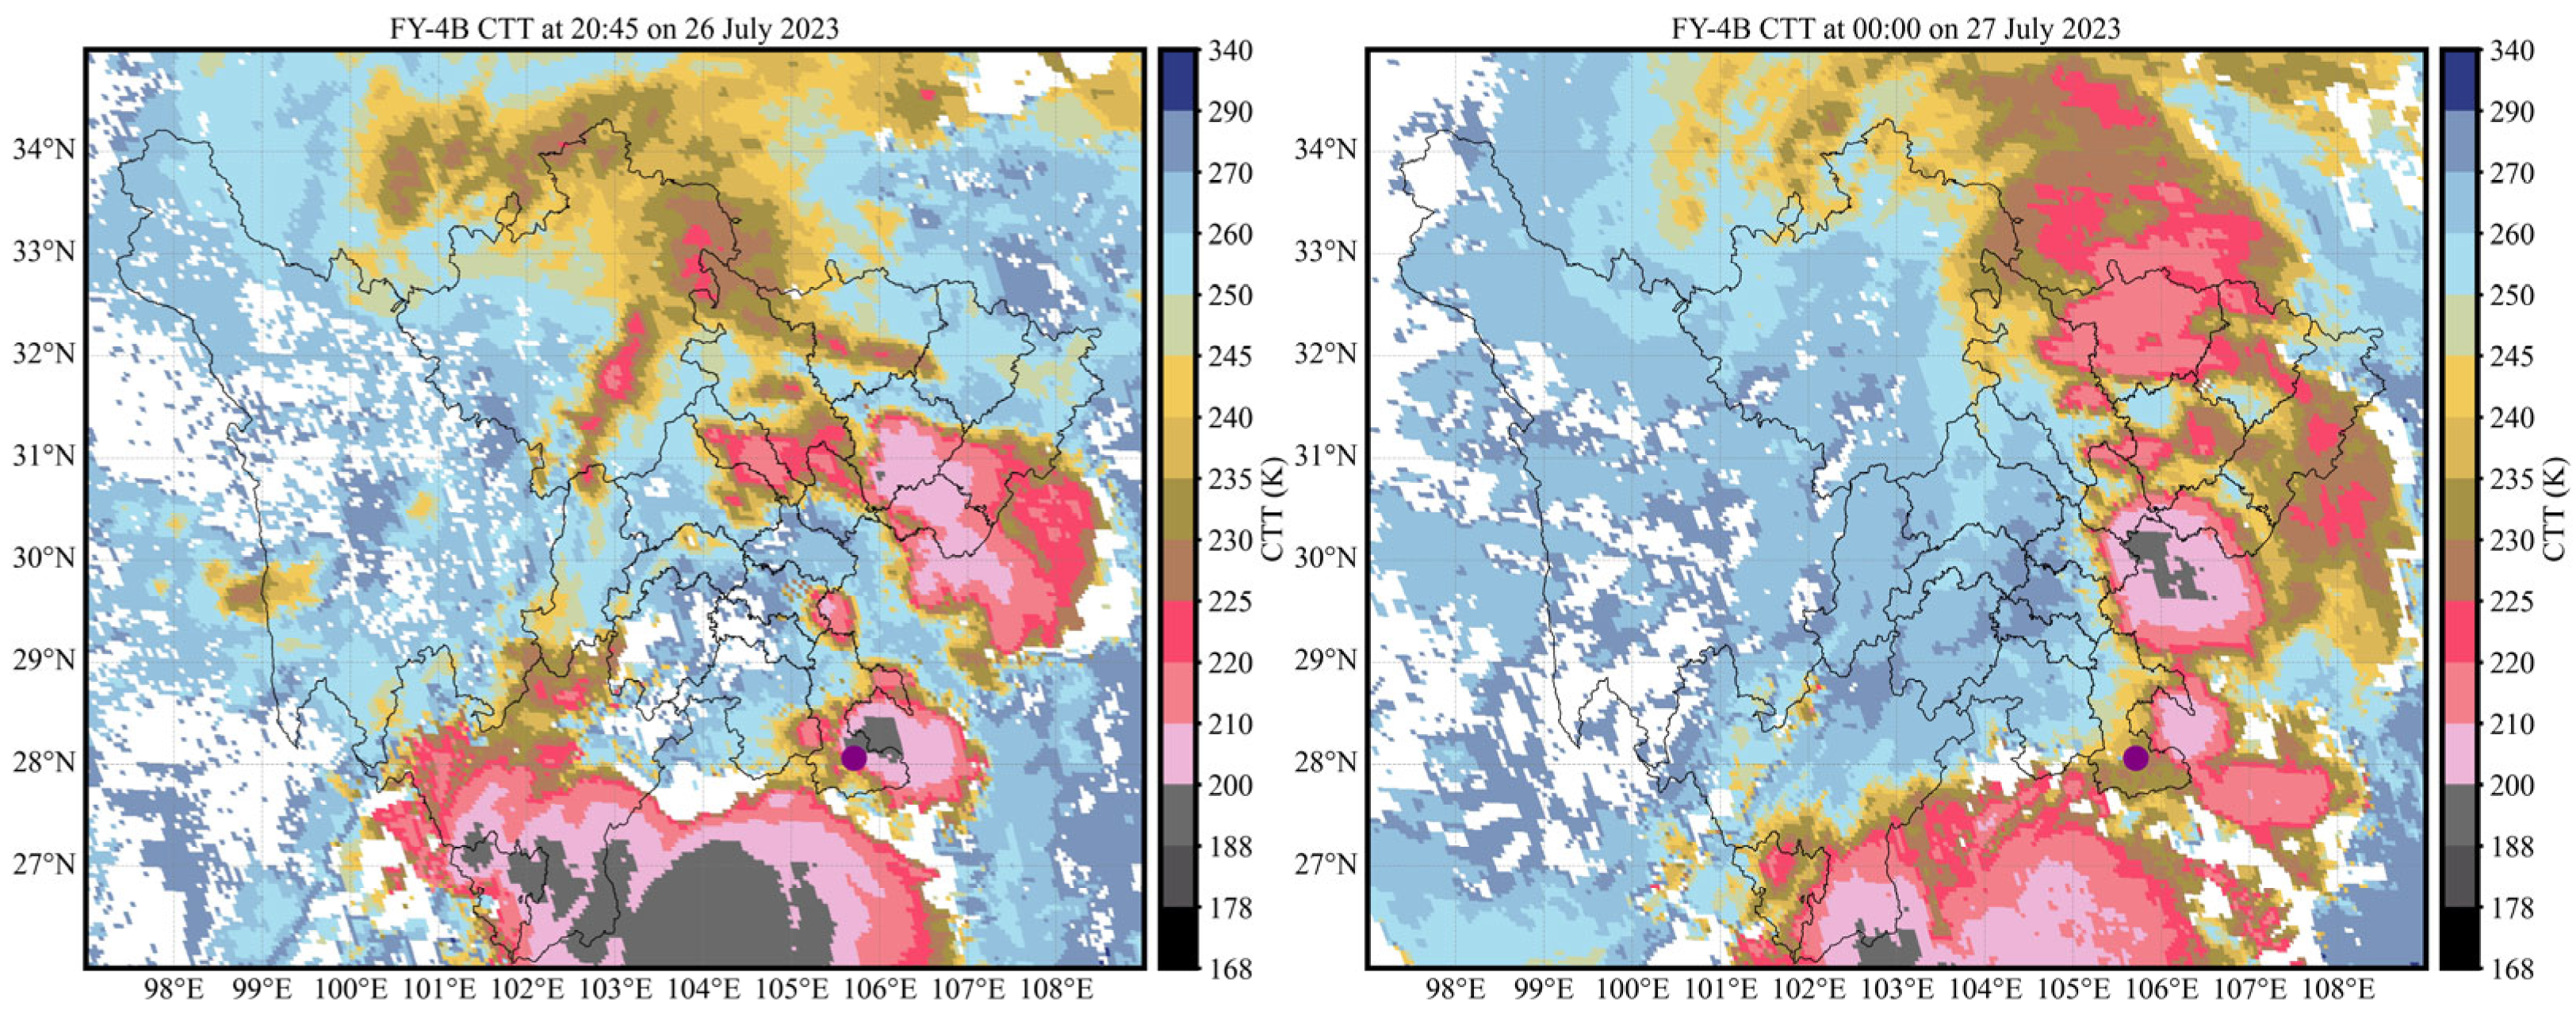
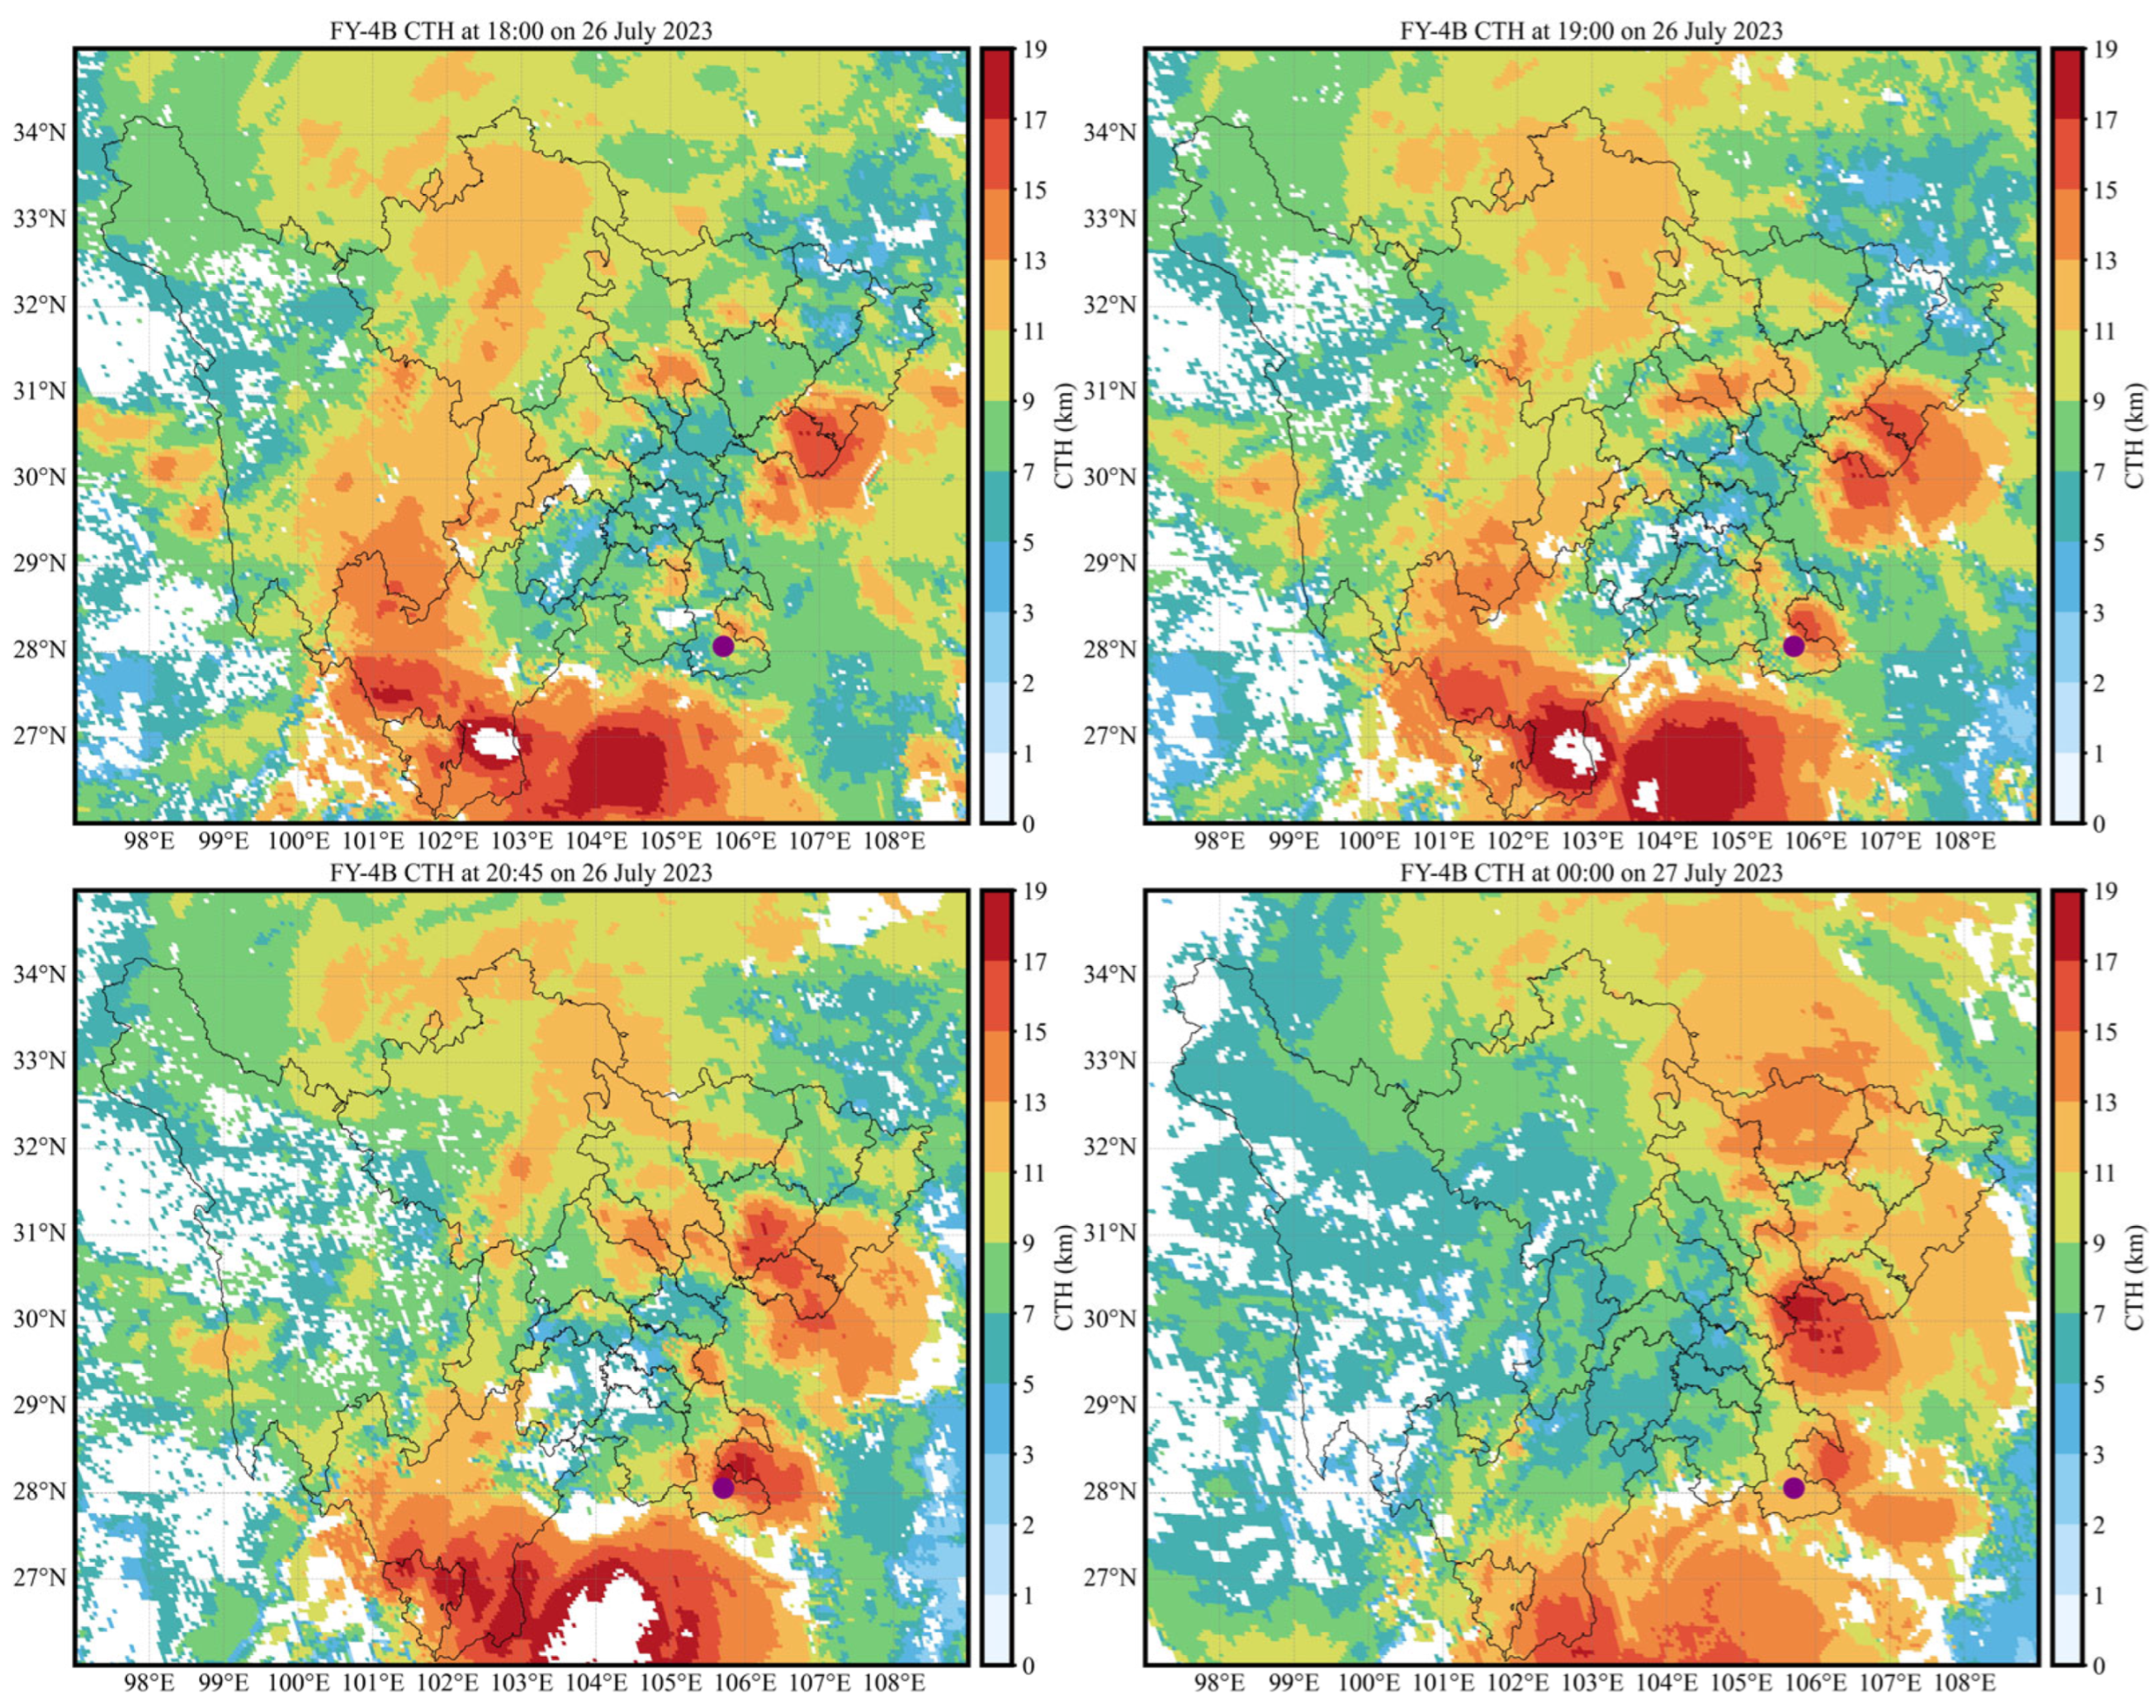
The CTT and CTH images for this heavy-rainfall event are shown in Figure 6 and Figure 7 (the solid purple dot indicates the Deyao Fulaicun station, where the maximum hourly precipitation occurred). The low-temperature cloud area over Deyao Fulaicun gradually developed. Short-duration heavy rainfall began when cloud-top brightness temperature was below 210 K and cloud-top height reached 9 km. During the strongest rainfall stage, the process reached its minimum brightness temperature (below 200 K) and the cloud-top height extended to its maximum value (17 km). Deyao Fulaicun lay in the large-gradient area at the edge of both the minimum brightness temperature region and the maximum cloud-top height region. Subsequently, cloud-top brightness temperature over the station increased and cloud-top height decreased as precipitation weakened. Thus, the heavy-rainfall location in this event was situated in a large-gradient area of cloud-top brightness temperature and cloud-top height, and both cloud-top brightness temperature and cloud-top height reached their process extremes during the strongest rainfall period.
Figure 6.
CTT images at key times during the heavy-rainfall event on 26 July 2023. The times are 18:00, 19:00, 20:45, and 00:00 of the following day, respectively, in UTC. The solid purple dot indicates the Deyao Fulaicun station, where the maximum hourly precipitation occurred during the event. The solid black lines indicate administrative boundaries within Sichuan Province.
Figure 7.
CTH images at key times during the heavy-rainfall event on 26 July 2023. The times are 18:00, 19:00, 20:45, and 00:00 of the following day, respectively, in UTC. The solid purple dot indicates the Deyao Fulaicun station, where the maximum hourly precipitation occurred during the event. The solid black lines indicate administrative boundaries within Sichuan Province.
4.2. Event on 13 July 2024
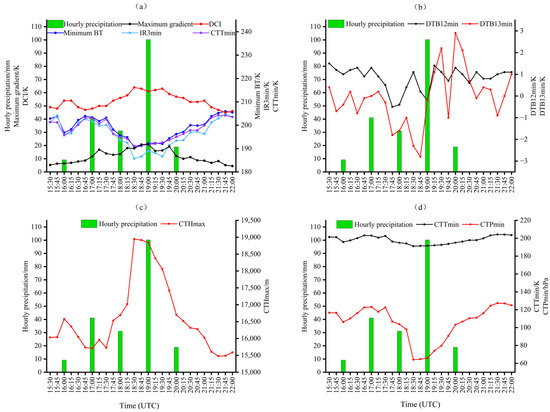
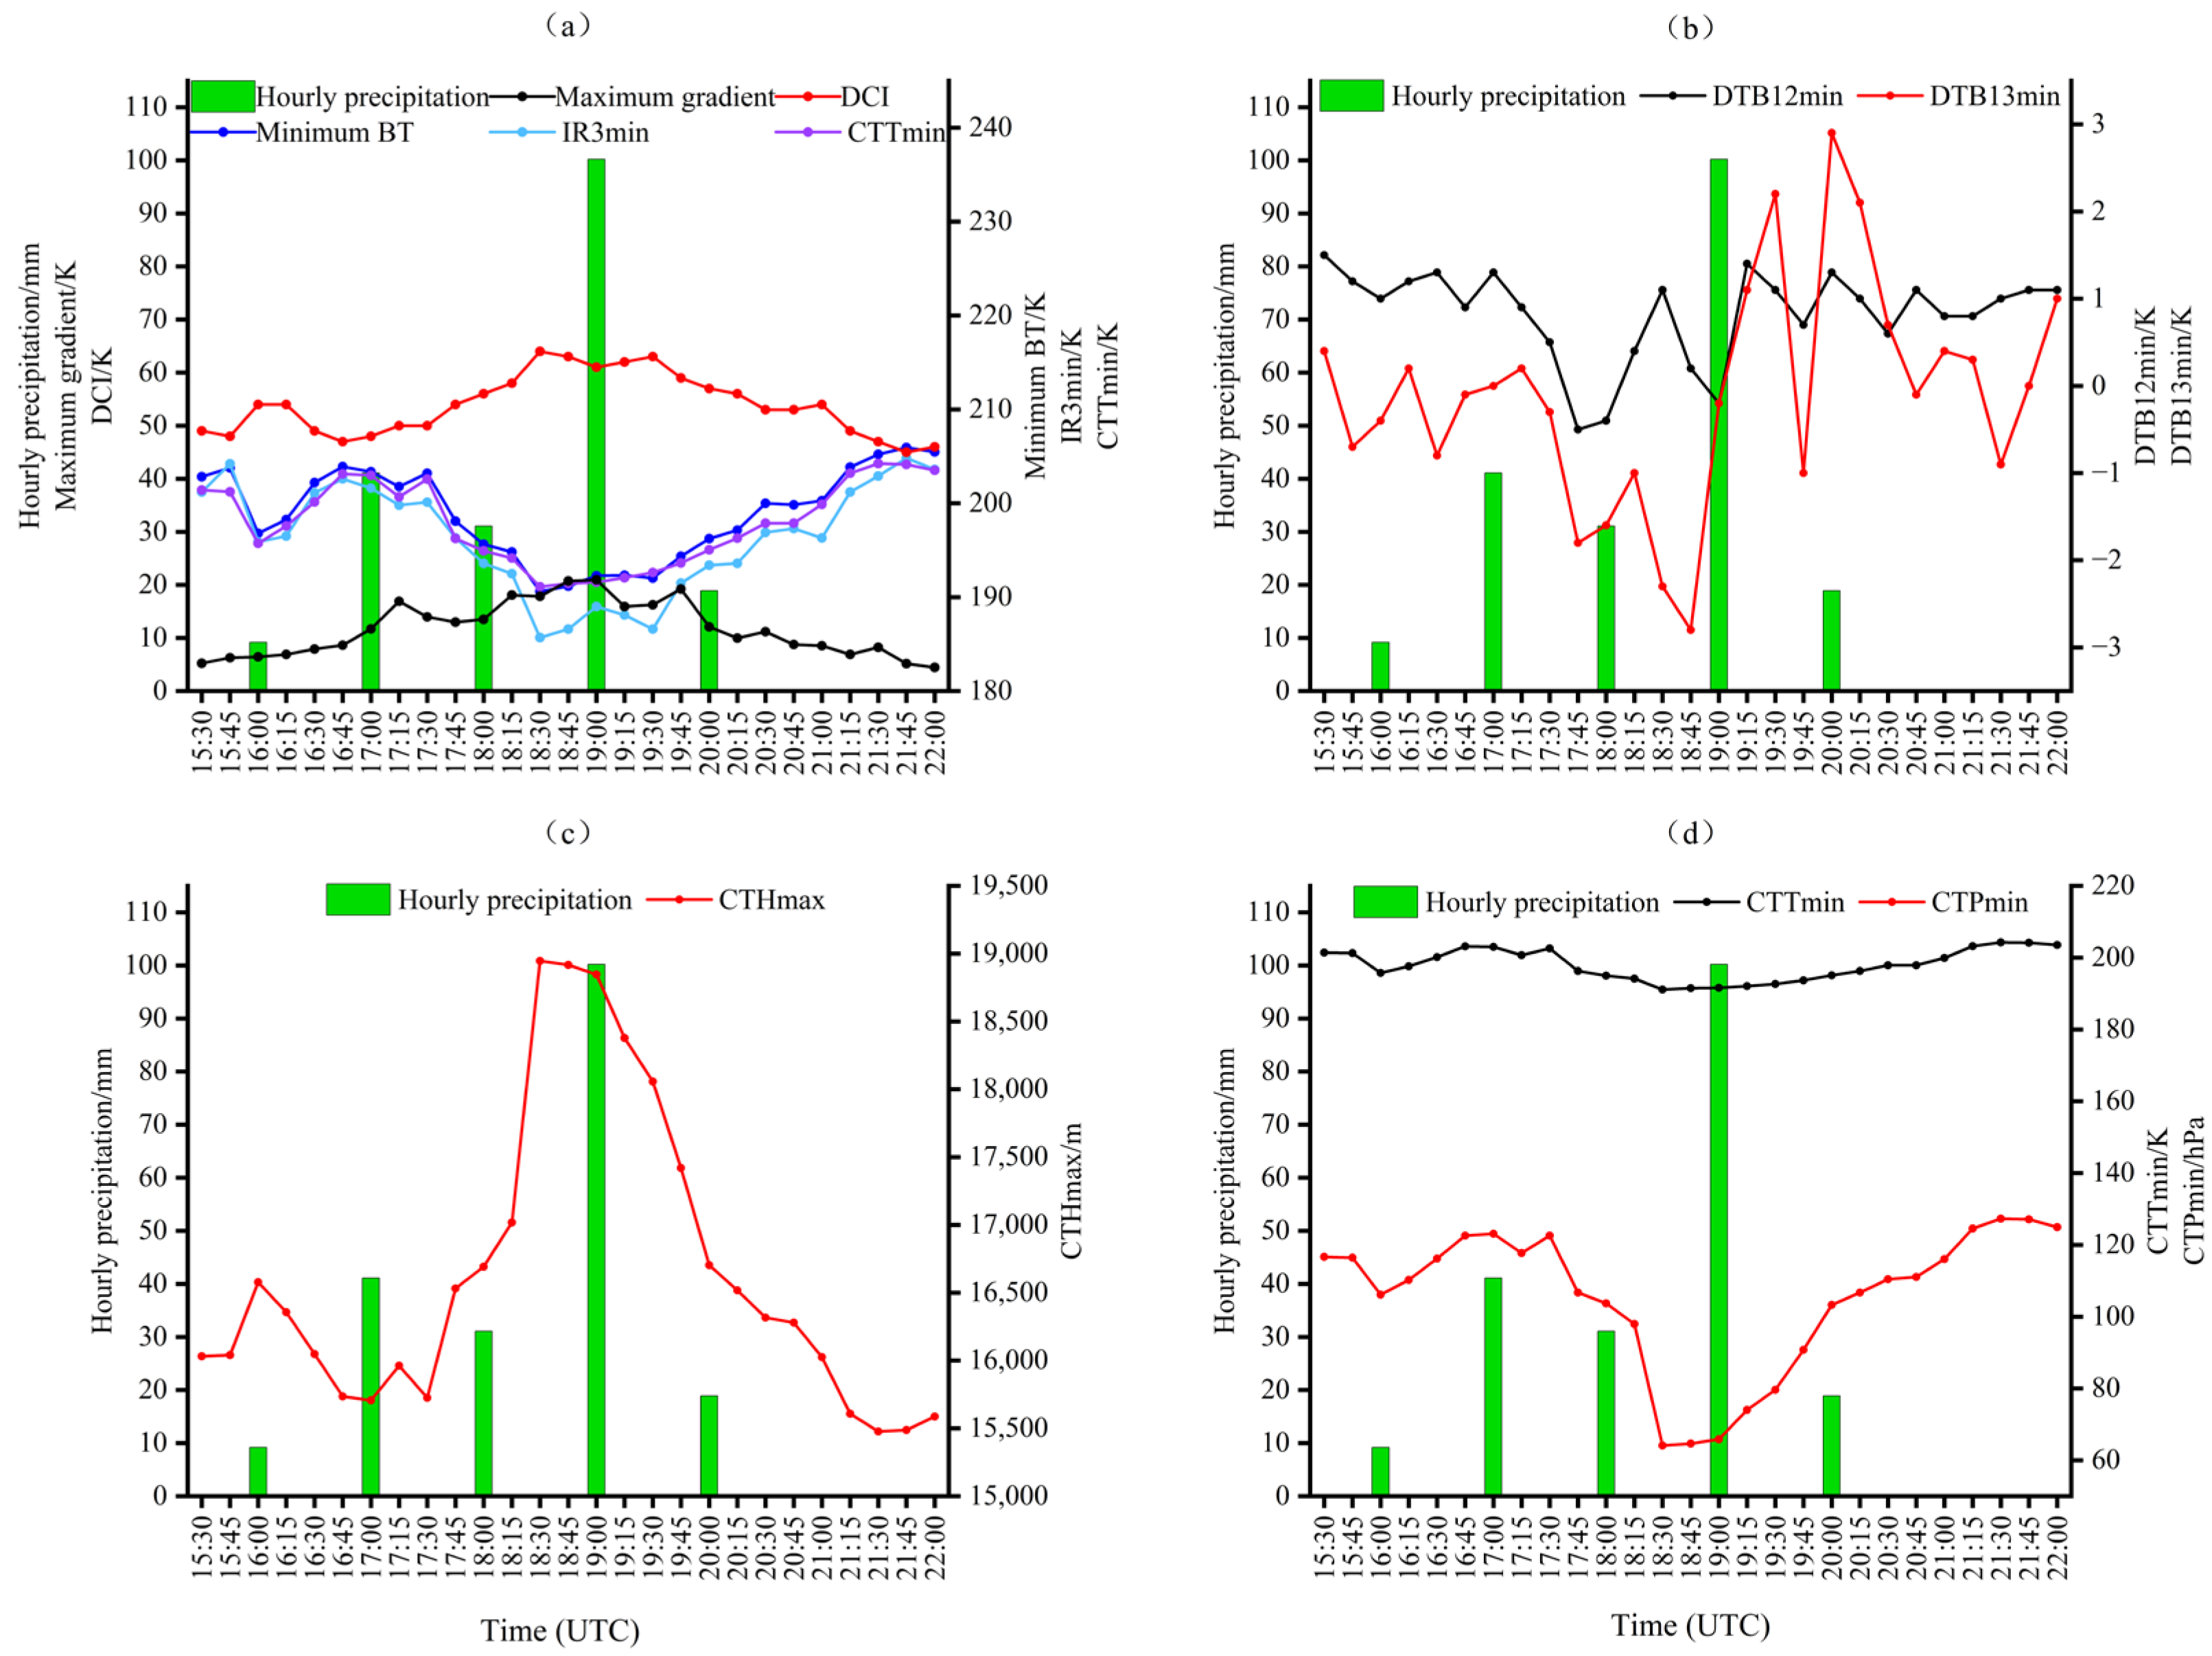
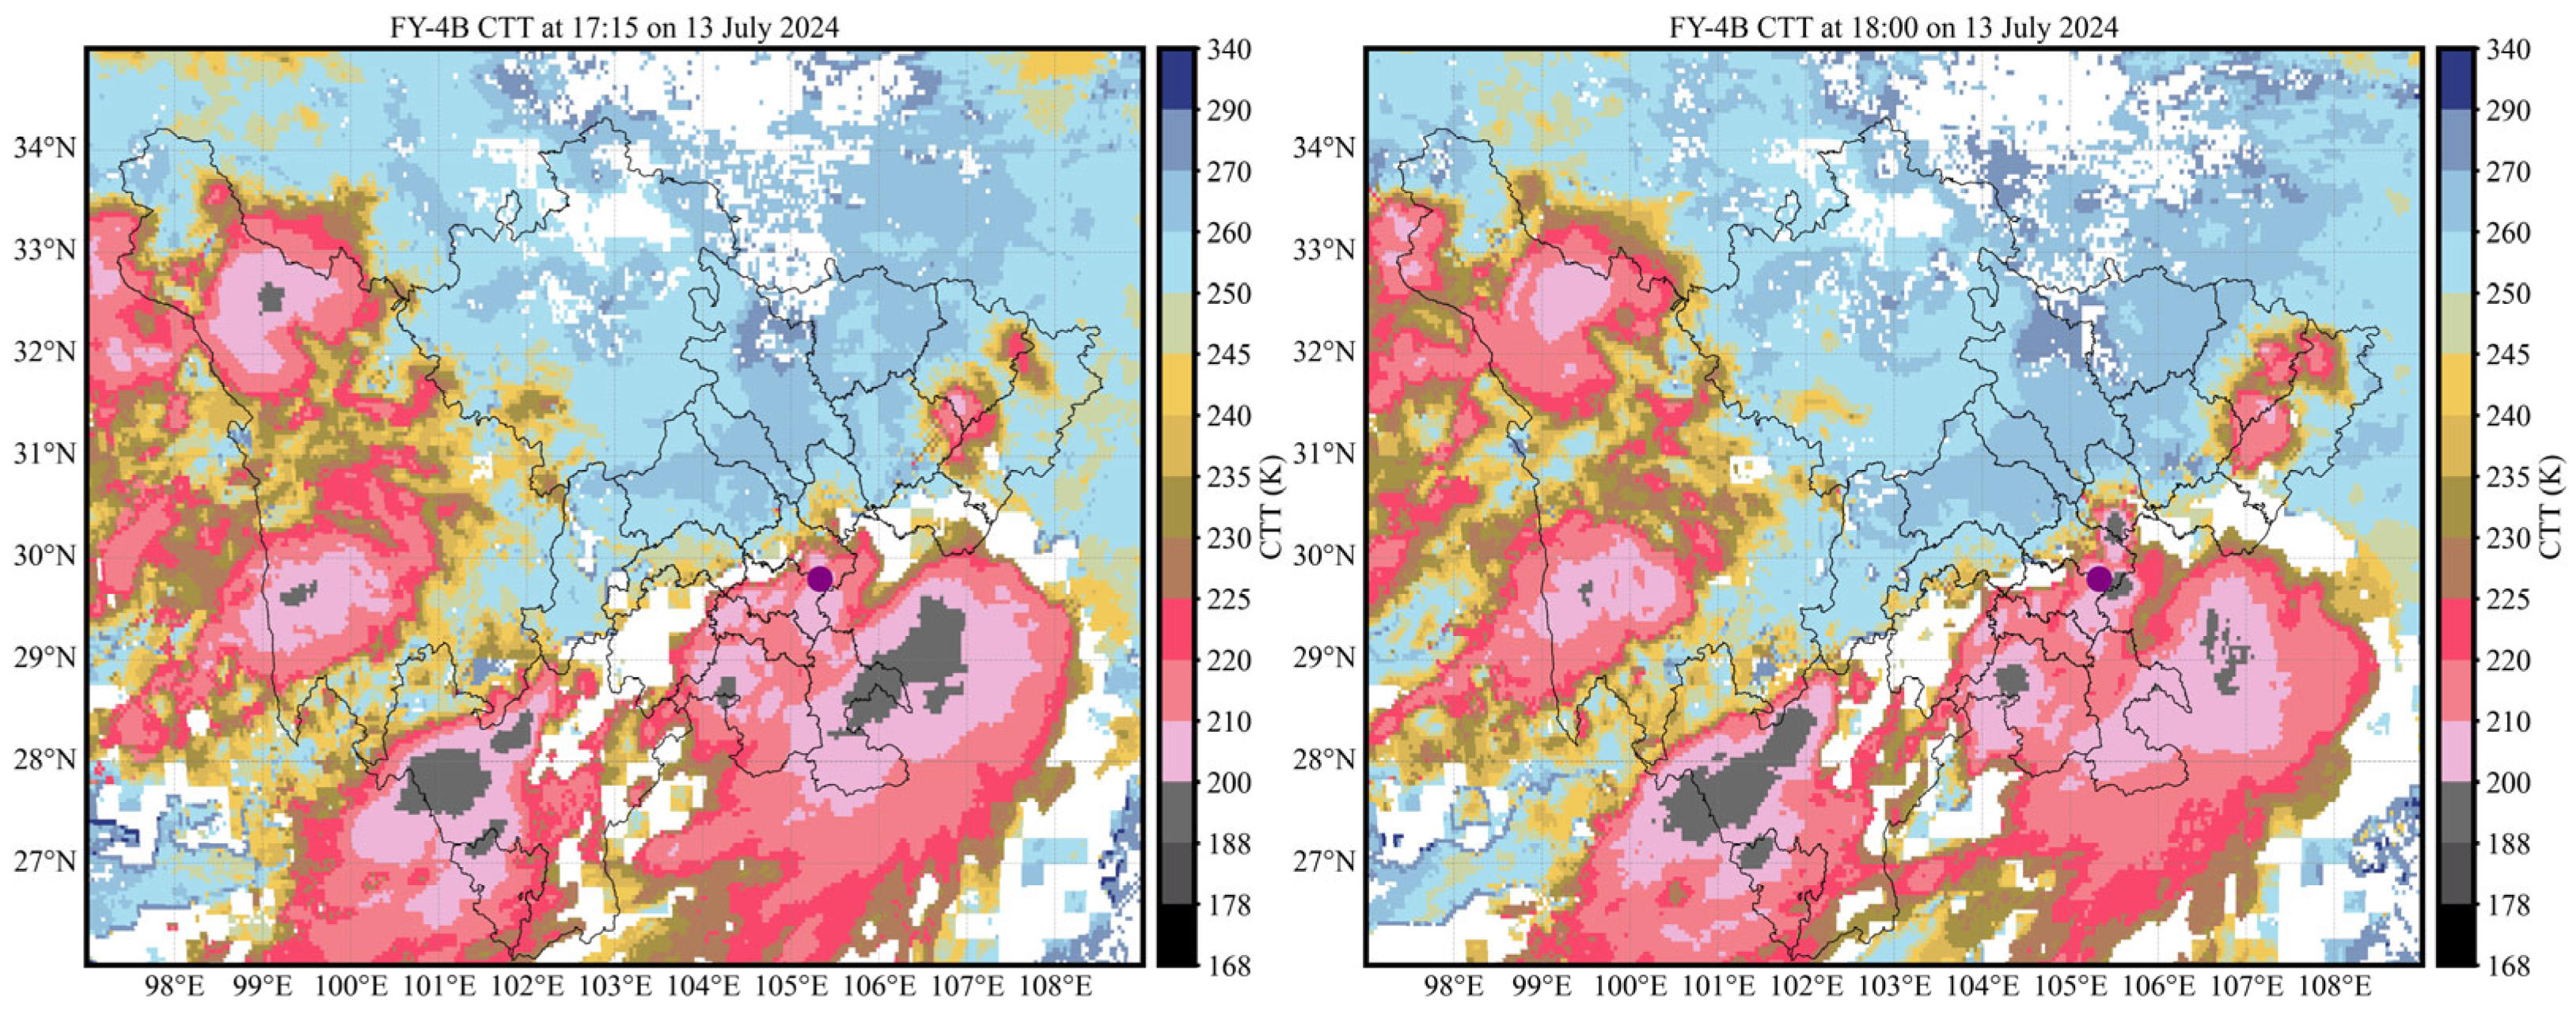
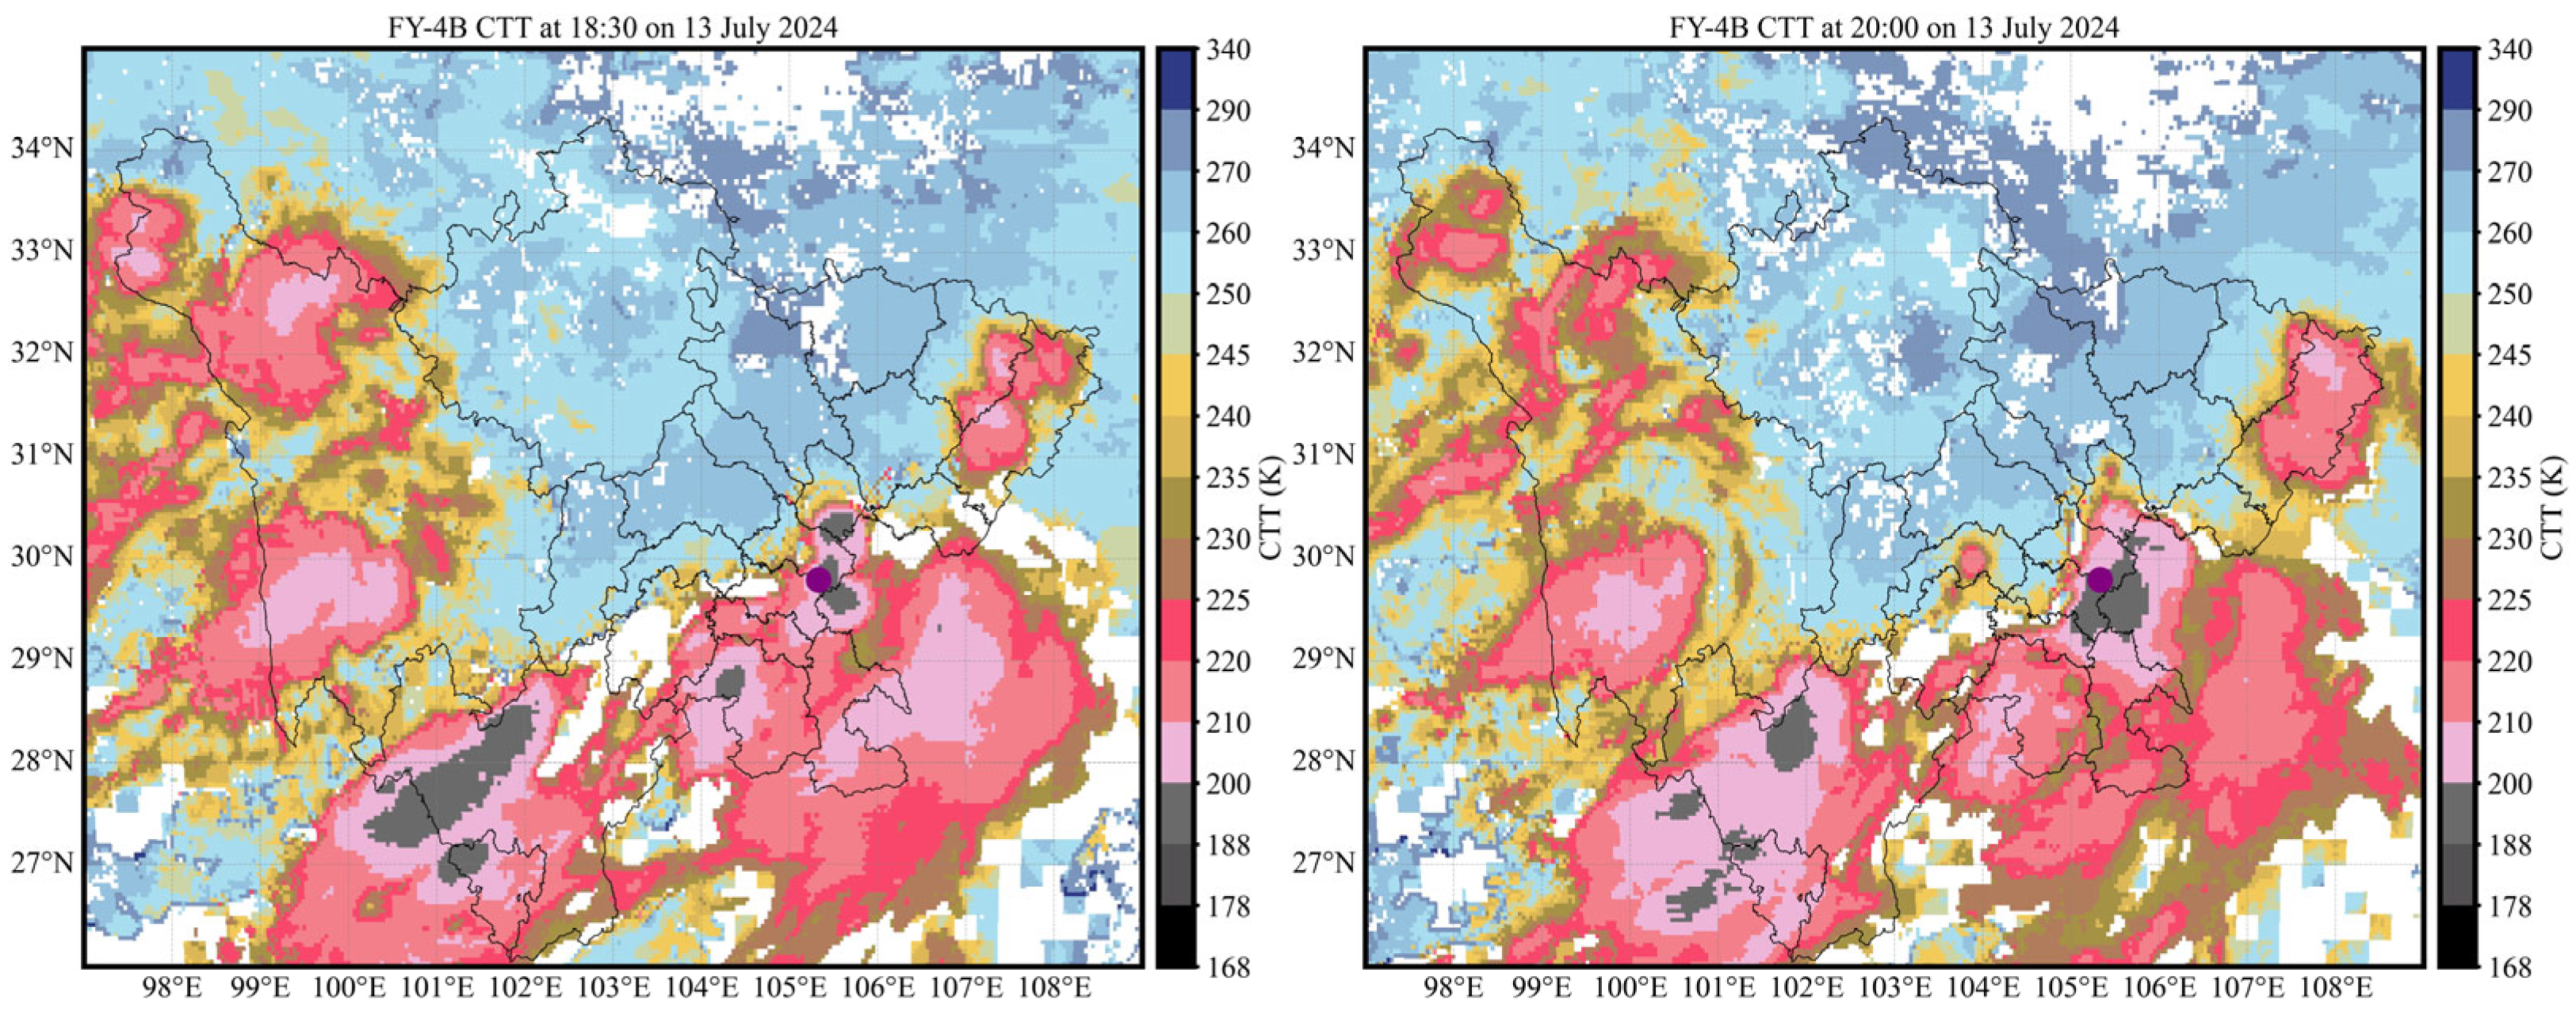
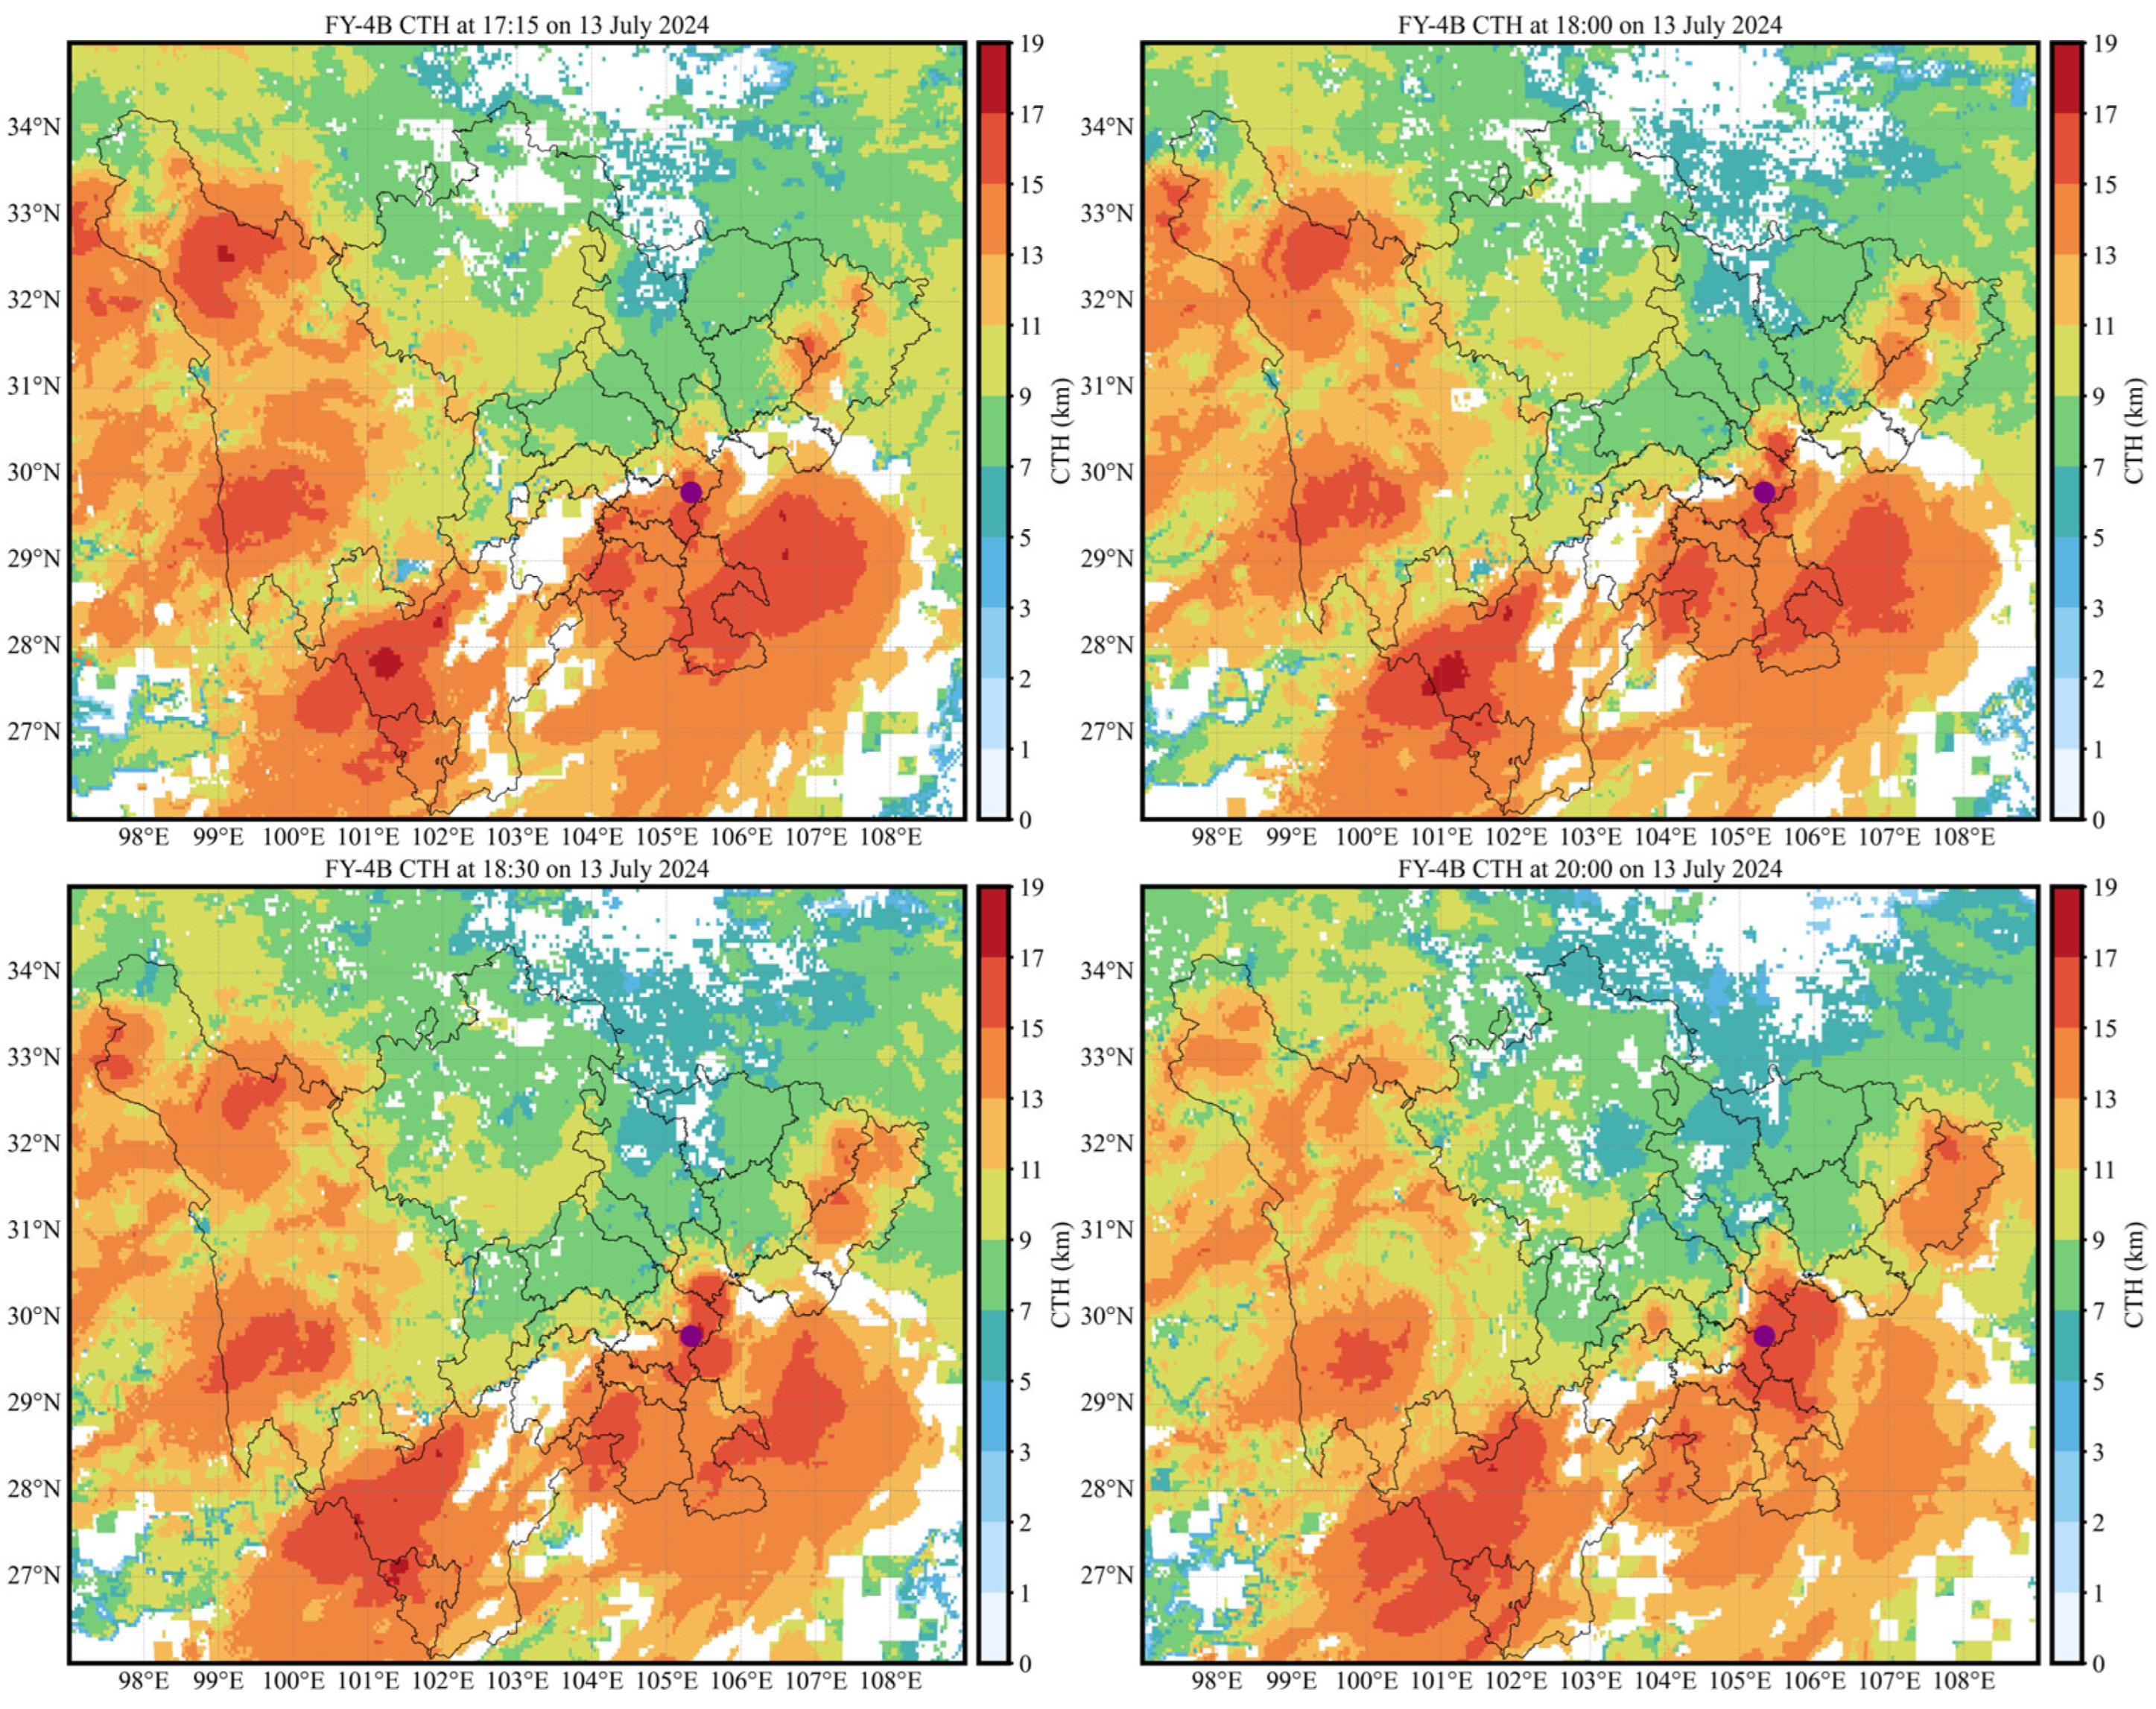
During the 13 July 2024 heavy-rainfall event, the maximum hourly rainfall intensity occurred at Yongfu Xinfangcun during 18:00–18:59, reaching 100.2 mm·h−1. Before that, precipitation reached 41.1 mm and 31.1 mm during 16:00–16:59 and 17:00–17:59, respectively. After rapidly increasing to the event peak, precipitation weakened markedly.
The time series of FY-4B key cloud-parameter values with hourly rainfall intensity (Figure 8) shows that the Level-1 multi-channel minimum brightness temperature, the minimum brightness temperature of the water vapor channel (IR3min), and the algorithm-retrieved minimum brightness temperature (CTTmin) all reached their process trough at the same time (18:30) within the maximum hourly rainfall period (18:00–18:59). At the same time, the deep convection index reached its process peak (over 60 K), and the maximum cloud-top brightness temperature gradient also reached its process peak before the end of the strongest rainfall, although its variation was less intense than in the previous event (Figure 8a). CTTmin and the multi-channel minimum brightness temperature were about 191 K, and IR3min was about 186 K, indicating that the cloud-top became coldest during the strongest rainfall, that middle- and upper-level water vapor were abundant, and that deep moist convection reached its most vigorous stage. However, the cloud-top structural fluctuation was somewhat weaker than in the previous event. Compared with the previous heavy-rainfall event, hourly precipitation after the strongest rainfall in the previous event weakened to about 15 mm, and the water vapor channel (IR3) increased together with cloud-top brightness temperatures of other infrared channels after the strongest rainfall. In the present event, 20 mm of short-duration heavy rainfall still occurred after the strongest hourly rainfall, and IR3 showed another marked decreasing trend; whereas, cloud-top brightness temperatures in the other infrared channels continued to rise slowly. This indicates that the cloud body in this event contained abundant water vapor.
Figure 8.
Temporal evolution of key cloud parameters during the heavy-rainfall event on 13 July 2024. (a) Hourly precipitation, minimum brightness temperature, IR3min, CTTmin, maximum gradient, and deep convection index; (b) hourly precipitation and brightness temperature differences DTB12min and DTB13min; (c) hourly precipitation and maximum cloud-top height; (d) hourly precipitation, minimum cloud-top temperature, and minimum cloud-top pressure. BT denotes brightness temperature, and DCI denotes deep convection index.
From the changes in spectral band differences with rainfall intensity (Figure 8b), DTB12min and DTB13min both showed a rise-and-fall pattern before the end of each short-duration heavy-rainfall period with hourly precipitation greater than 20 mm. However, DTB12min fluctuated only slightly, and its response to peak rainfall was not obvious. Before the end of the peak rainfall periods, DTB13min showed three clear decreases, with amplitudes of 1 K, 2 K, and 1.8 K. These decreases corresponded to the three short-duration heavy-rainfall periods. DTB13min also reached its process trough during the peak rainfall period, indicating that the moist layer extended to its maximum height during the strongest rainfall. During the heavy-rainfall stage, the variation amplitude of DTB13min between adjacent observation times was clearly larger than that of DTB12min. This indicates that, when deep convective clouds developed to the mature stage and had large optical thickness, the cloud-top brightness temperatures observed by IR1 and IR2 were relatively close, leading to a small variation in DTB12min. Meanwhile, strong upward motion transported water vapor and ice-phase particles to higher levels. This expanded the upper-level moist region and was accompanied by cloud-top cooling. Therefore, DTB13min responded more clearly to the heavy-rainfall process. From the changes in cloud-top height and cloud-top pressure with rainfall intensity (Figure 8c,d), CTHmax and CTPmin still reached their process peak and trough, respectively, during the strongest hourly rainfall period. The peak CTHmax was 18.9 km, and the trough CTPmin was lower than 80 hPa. This indicates that the strongest rainfall was accompanied by the lowest cloud-top pressure and the highest cloud-top development during the event.
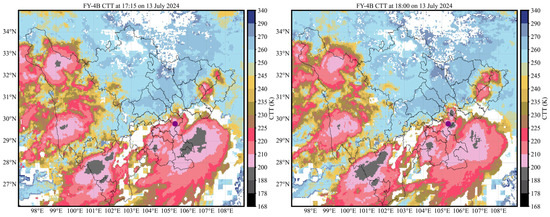
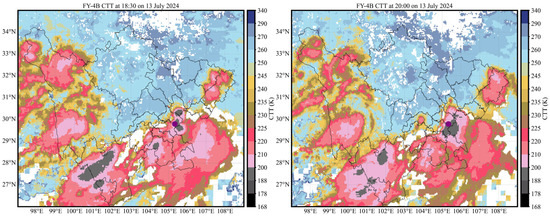
The CTT and CTH evolution during this heavy-rainfall event showed that at 15:45, the low-temperature cloud-top near the cloud area containing the strongest-rainfall station was not yet obvious (figure omitted). It then developed gradually (Figure 9 and Figure 10; the solid purple dot indicates the Yongfu Xinfangcun station, where the maximum hourly precipitation occurred). Short-duration intensified precipitation began when the cloud-top brightness temperature was below 210 K and the cloud-top height reached 13 km. When the minimum cloud-top brightness temperature over Yongfu Xinfangcun developed to below 200 K and the cloud-top height reached 15 km, the strongest hourly rainfall began. Yongfu Xinfangcun remained in the large-gradient area at the edge of the minimum brightness temperature region (below 200 K) and the maximum cloud-top height region (above 15 km). After the short-duration heavy rainfall ended, cloud energy release was accompanied by decreasing cloud-top height and increasing cloud-top brightness temperature, and the precipitation gradually ended.
Figure 9.
CTT images at key times during the heavy-rainfall event on 13 July 2024. The times are 17:15, 18:00, 18:30, and 20:00, respectively, in UTC. The solid purple dot indicates the Yongfu Xinfangcun station, where the maximum hourly precipitation occurred during the event. The solid black lines indicate administrative boundaries within Sichuan Province.
Figure 10.
CTH images at key times during the heavy-rainfall event on 13 July 2024. The times are 17:15, 18:00, 18:30, and 20:00, respectively, in UTC. The solid purple dot indicates the Yongfu Xinfangcun station, where the maximum hourly precipitation occurred during the event. The solid black lines indicate administrative boundaries within Sichuan Province.
4.3. Event on 21 May 2025
During the 21 May 2025 event, the maximum hourly rainfall intensity (87.2 mm·h−1) occurred at Xuyong Xianglintaiguan during 13:00–13:59. This maximum intensity was between that of the 13 July 2024 event (100.2 mm·h−1) and that of the 26 July 2023 event (75.5 mm·h−1). Only weak precipitation occurred near the station during 12:00–12:59. Rainfall then rapidly intensified to the peak during 13:00–13:59 and weakened rapidly during 14:00–14:59, although it still reached 38 mm·h−1.
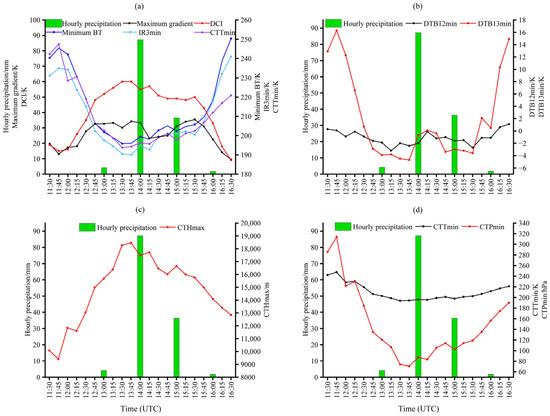
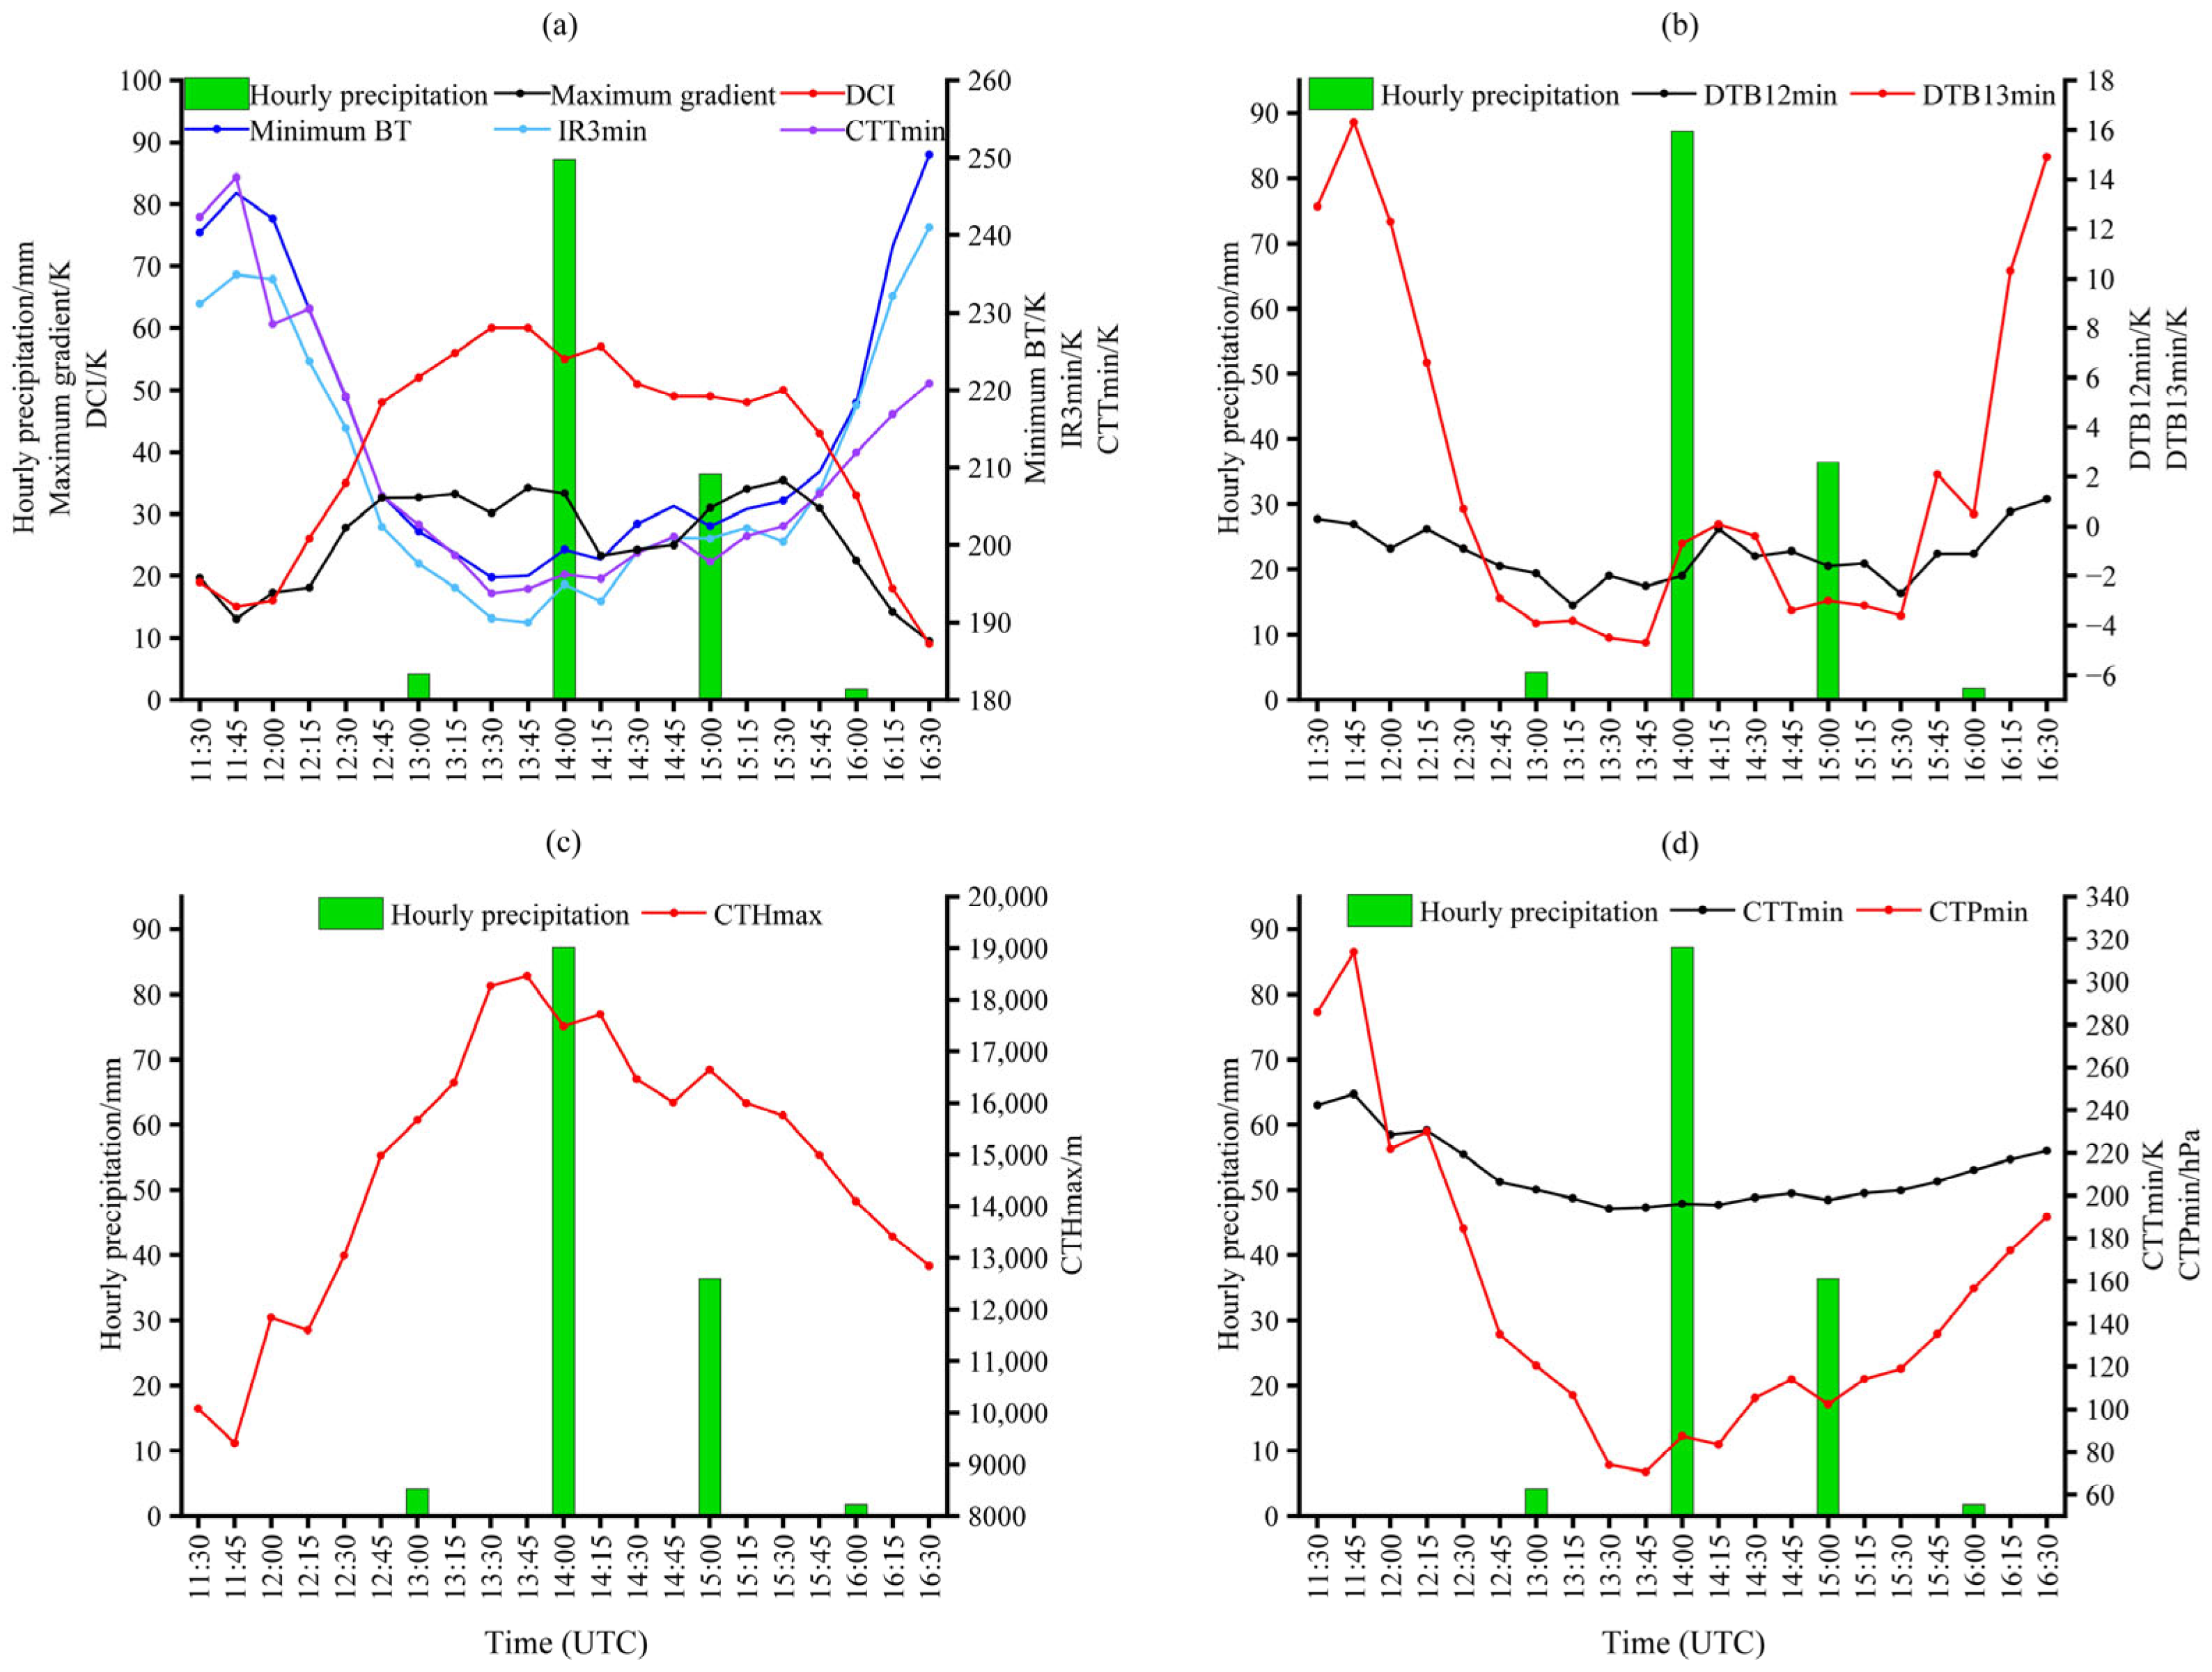
The variations in key cloud parameters with rainfall intensity for this heavy-rainfall event at the strongest hourly precipitation station (Xuyong Xianglintaiguan) and within the 35 km × 35 km regional window are shown in Figure 11.
Figure 11.
Temporal evolution of key cloud parameters during the heavy-rainfall event on 21 May 2025. (a) Hourly precipitation, minimum brightness temperature, IR3min, CTTmin, maximum gradient, and deep convection index; (b) hourly precipitation and brightness temperature differences DTB12min and DTB13min; (c) hourly precipitation and maximum cloud-top height; (d) hourly precipitation, minimum cloud-top temperature, and minimum cloud-top pressure. BT denotes brightness temperature, and DCI denotes deep convection index.
Before the heavy rainfall occurred, minimum brightness temperature, IR3min, and CTTmin showed a sustained and substantial decreasing trend, while the deep convection index increased synchronously. The cloud-top brightness temperature gradient still fluctuated, decreasing and increasing, before the onset of heavy rainfall. The deep convection index, minimum brightness temperature, and CTTmin reached their process extrema simultaneously, and the process peak of the deep convection index (52 K) was maintained until the cloud-top brightness temperature gradient reached its peak (33 K) and the water vapor channel IR3min reached its trough (below 190 K). The timing of the IR3min trough was later than the process troughs of minimum brightness temperature and CTTmin (Figure 11a), and it coincided with the process extrema of DTB13min, CTHmax (peak about 19 km), and CTPmin (Figure 11b–d). This indicates that rapid development of deep moist convection caused cold cloud-top cooling to reach its limit earlier than the increase in moist-layer height and the decrease in cloud-top pressure.
During the strongest hourly rainfall period from 13:00 to 14:00, DTB12min also reached its process trough of about −2 K. This indicates that convective clouds dominated during the heavy rainfall period. However, the variation amplitude of DTB12min between adjacent observation times was generally smaller than that of DTB13min. This indicates that, during the mature stage of the heavy-rainfall cloud system, the change in cloud optical thickness was smaller than the change in middle- and upper-level water vapor caused by strong upward motion. Therefore, the variation trend of DTB12min was less indicative of rainfall intensity than that of DTB13min. As the heavy rainfall continued and cloud energy was released, the above cloud-parameter values fluctuated and generally showed a weakening trend. For example, cloud-top height generally decreased, and cloud-top brightness temperature generally increased. However, during the weakening stage of the strongest rainfall, DTB13min showed a relatively clear decrease. As shown in Figure 11b, during the second short-duration heavy-rainfall period from 14:00 to 15:00, DTB13min decreased by 4 K between adjacent observation times. The minimum cloud-top height was still 16 km, and the cloud-top brightness temperature remained below 210 K. This indicates that the height of the upper-level moist layer still increased intermittently, so heavy rainfall persisted for a short time.
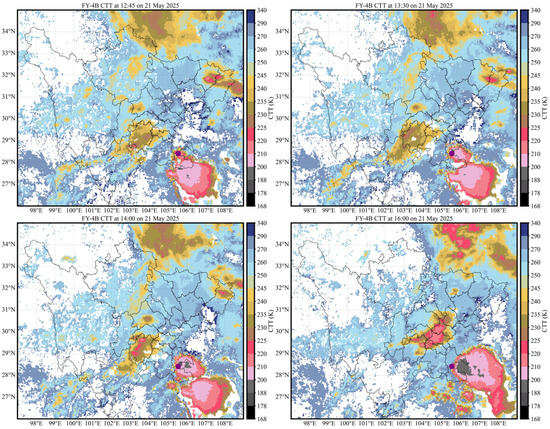
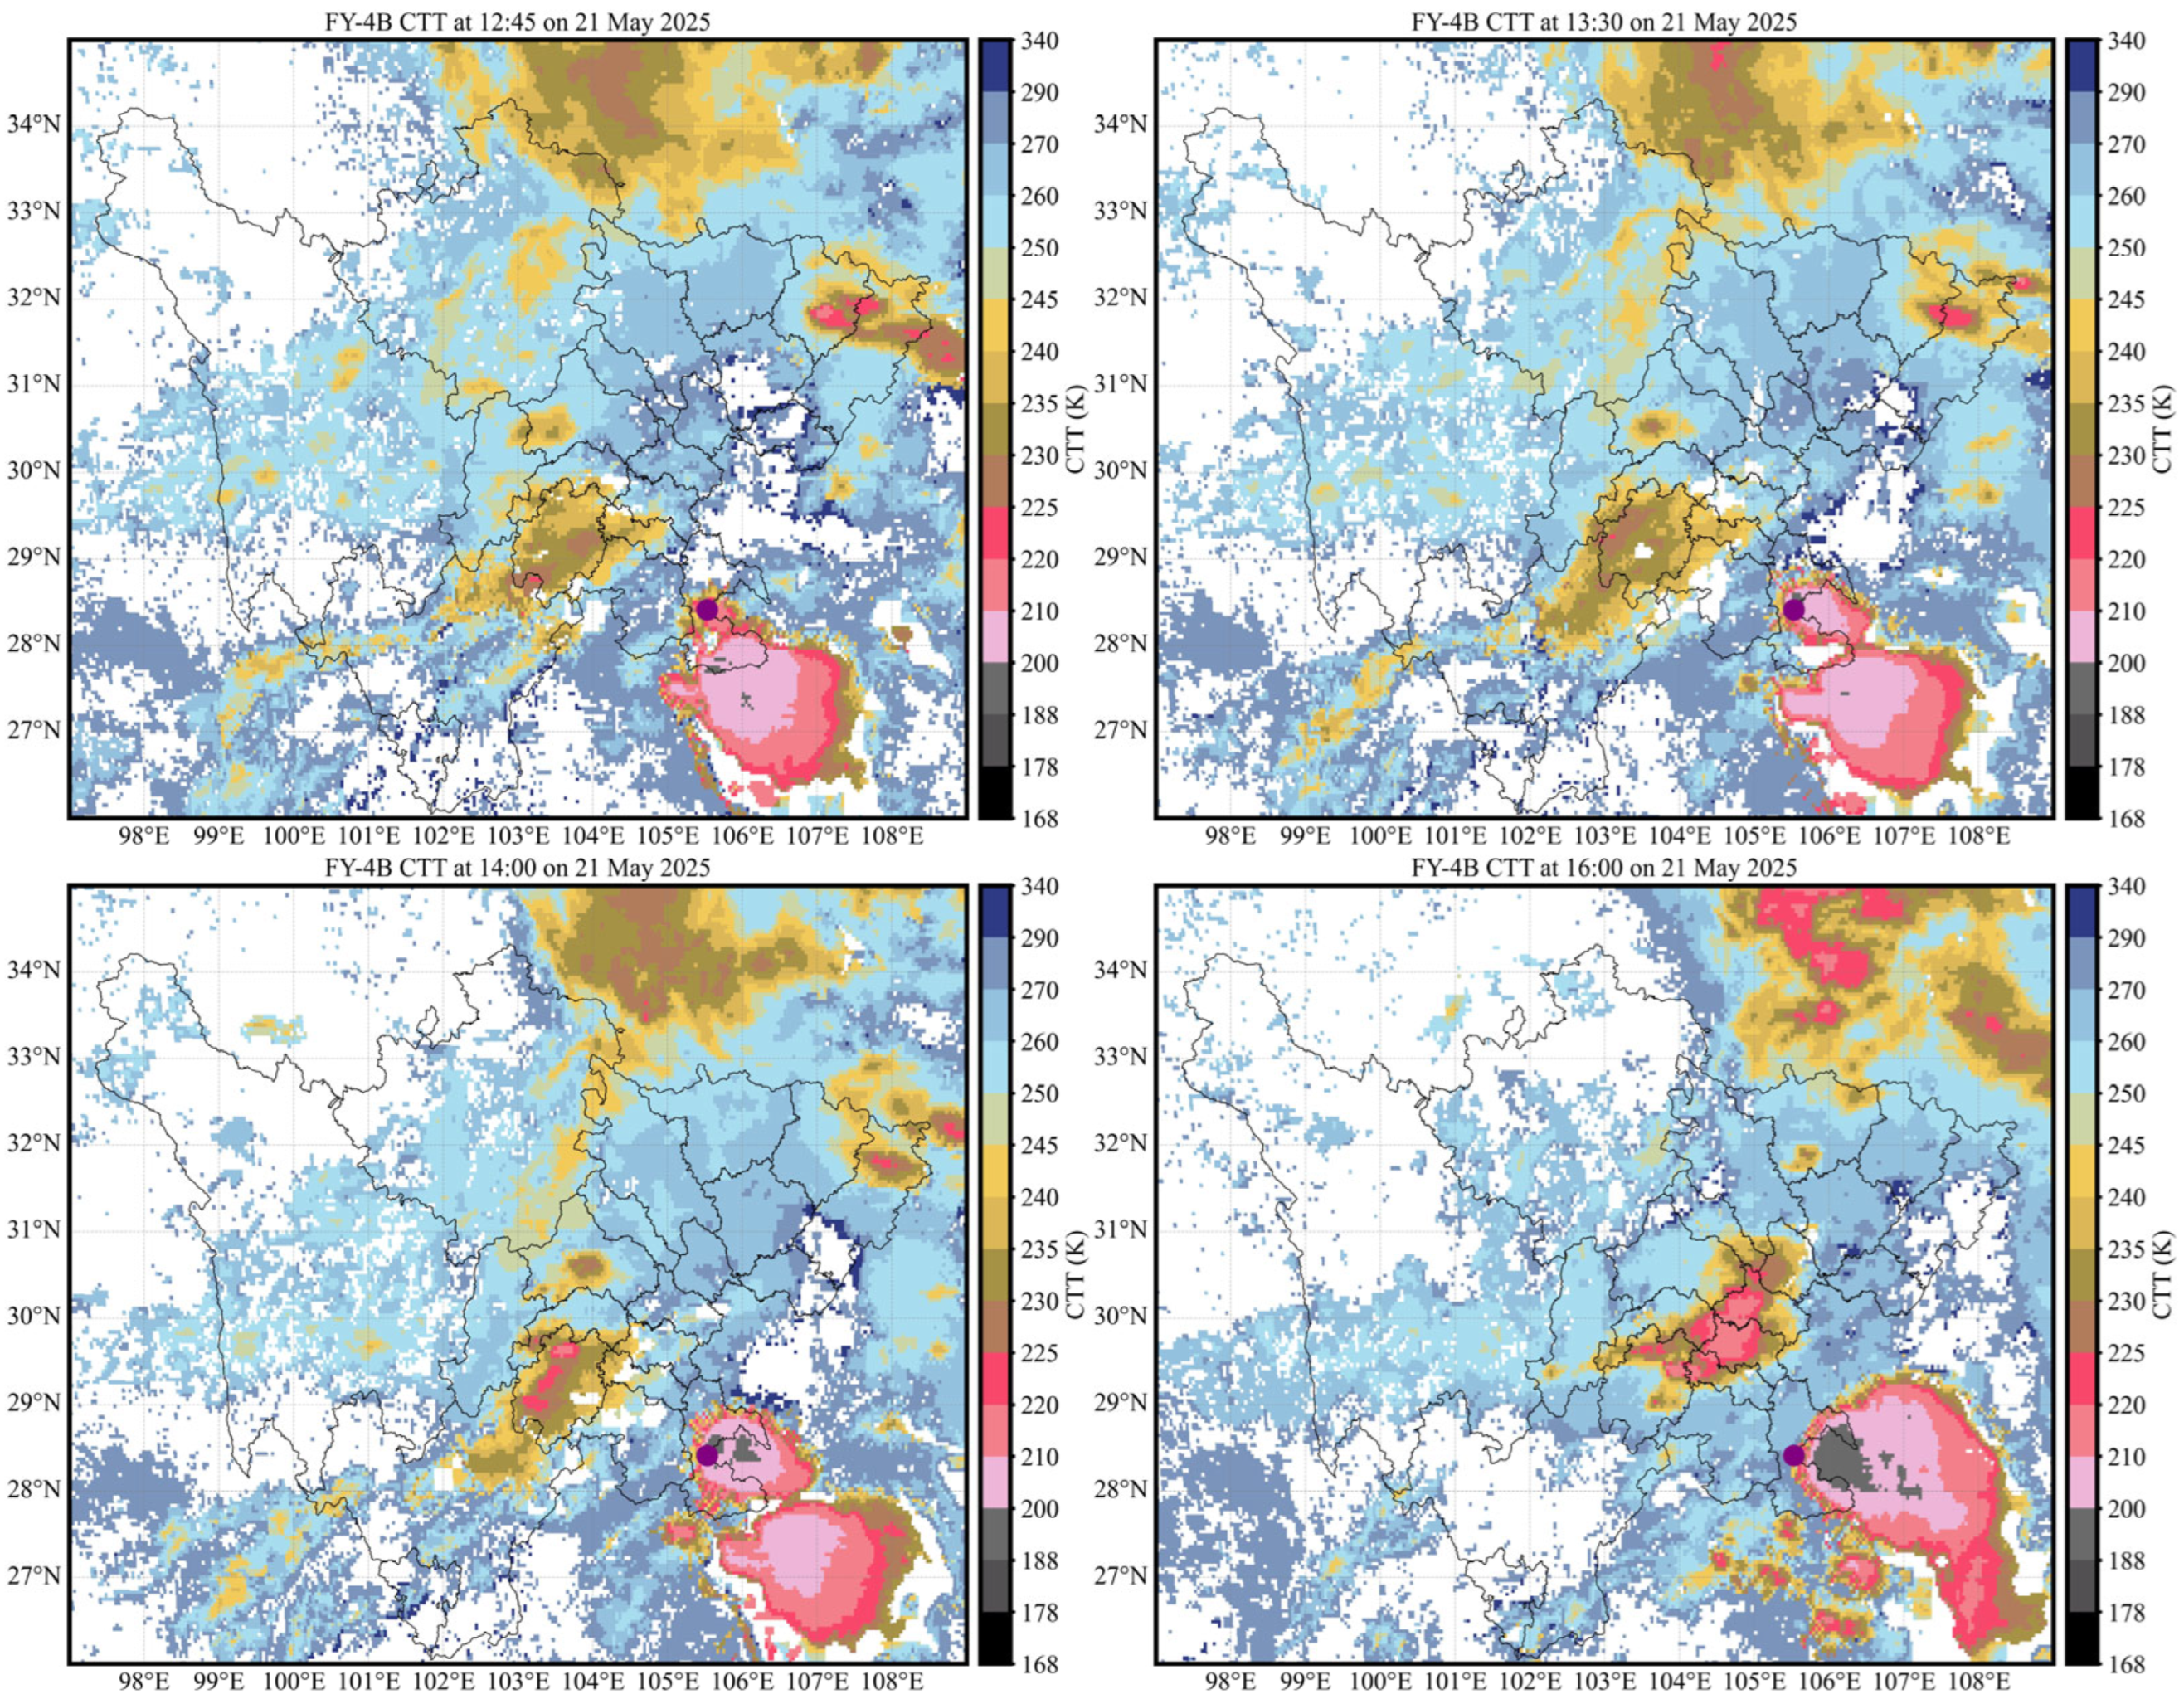
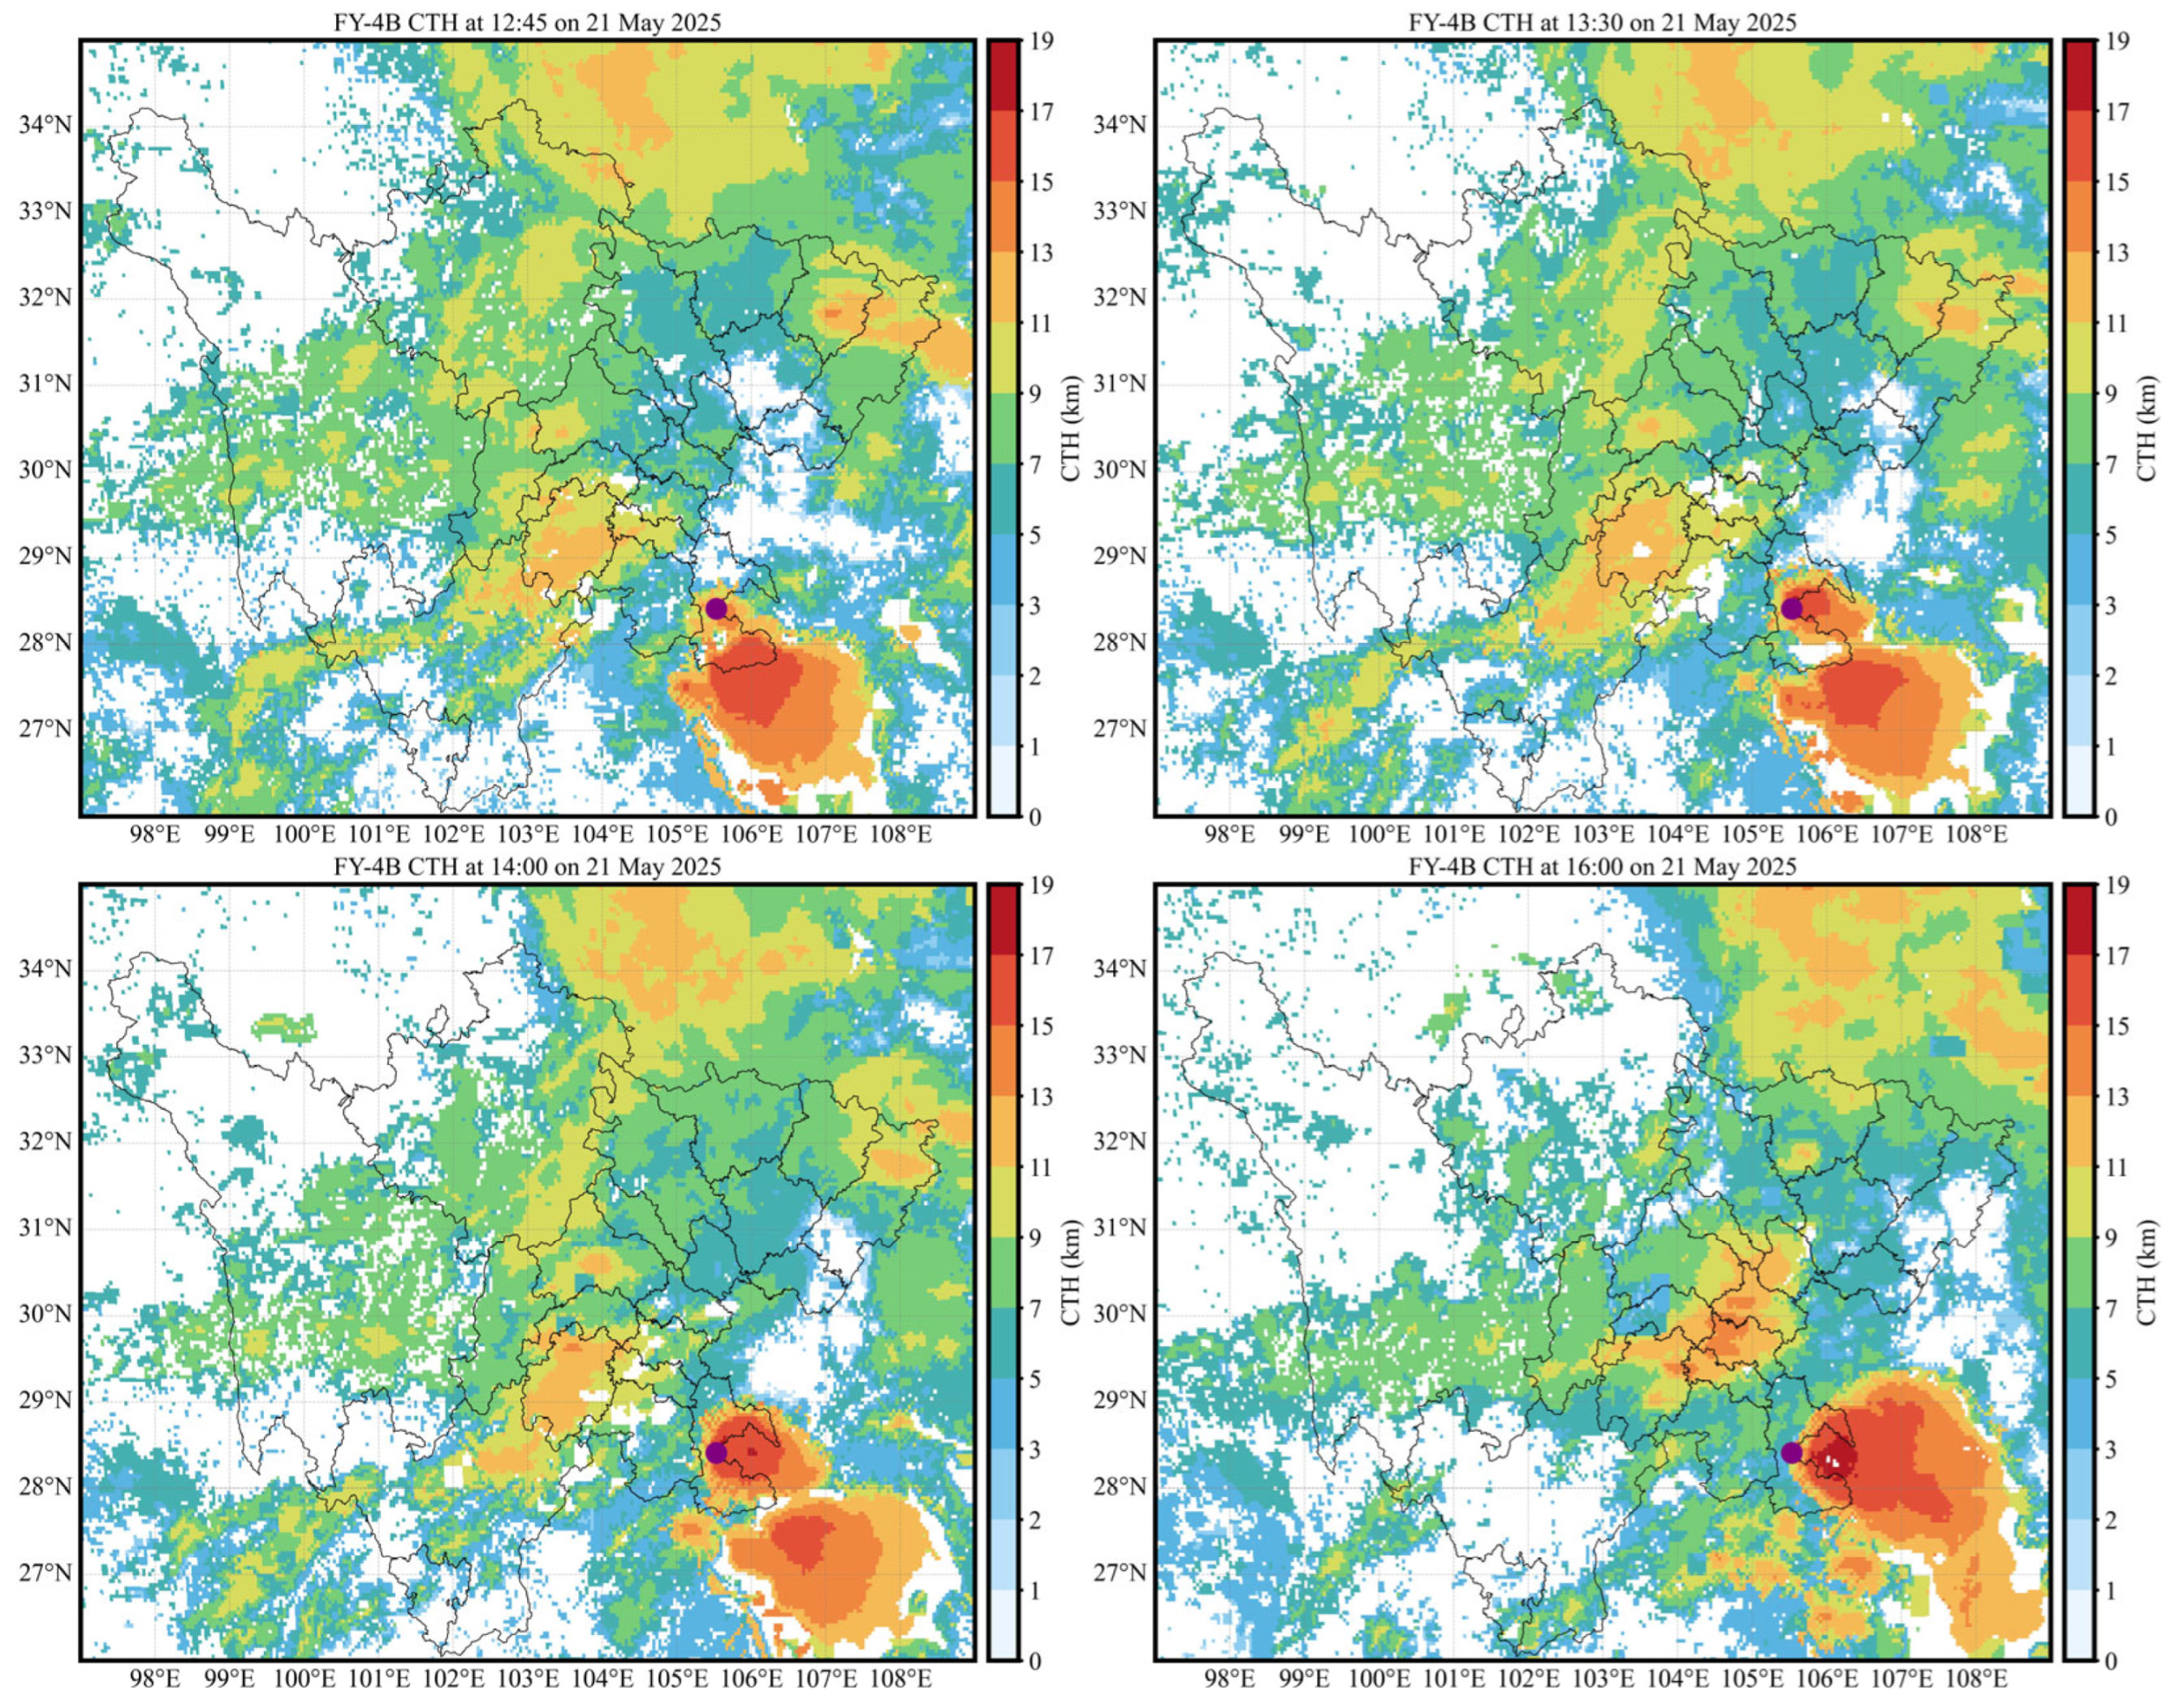
The cloud-image evolution reflected by CTT and CTH in this heavy-rainfall event (Figure 12 and Figure 13) shows that during 12:00–12:45, the cloud-top brightness temperature within the 35 km × 35 km regional window around the station with the maximum hourly rainfall intensity (the purple solid dot in Figure 12 and Figure 13 represents the Xuyong Xianglintaiguan station) decreased from about 240 K to about 210 K, and cloud-top height increased from 11.6 km to 14.9 km. However, DTB12min remained between −2 K and 0 K, some cirrus was still present in the cloud, and DTB13min did not decrease to −2 to −3 K until 12:45–13:00 (Figure 11b). Therefore, the moist region over the heavy-rainfall station was relatively low during this period, and heavy rainfall did not occur at this time. Subsequently, the low-temperature cloud area below 200 K and the high cold-cloud area above 15 km rapidly developed and moved toward the Xuyong Xianglintaiguan station. During the strongest rainfall period (13:00–13:59), Xuyong Xianglintaiguan was located in the large-gradient area at the edge of the low-brightness-temperature core (below 200 K) and the high cold-cloud region (above 15 km). During the secondary rainfall-intensity period (14:00–14:59), the station was located in the large-gradient area at the edge of the low-brightness-temperature core (below 210 K) and the high cold-cloud region (above 11 km).
Figure 12.
CTT images at key times during the heavy-rainfall event on 21 May 2025. The times are 12:45, 13:30, 14:00, and 16:00, respectively, in UTC. The solid purple dot indicates the Xuyong Xianglintaiguan station, where the maximum hourly precipitation occurred during the event. The solid black lines indicate administrative boundaries within Sichuan Province.
Figure 13.
CTH images at key times during the heavy-rainfall event on 21 May 2025. The times are 12:45, 13:30, 14:00, and 16:00, respectively, in UTC. The solid purple dot indicates the Xuyong Xianglintaiguan station, where the maximum hourly precipitation occurred during the event. The solid black lines indicate administrative boundaries within Sichuan Province.
4.4. Comparative Analysis of Cloud Characteristics in Heavy-Rainfall Processes
Before the end of heavy rainfall, the Sichuan heavy-rainfall events from 2023 to 2025 all showed common features, including decreasing cloud-top brightness temperature, increasing CTHmax, increasing deep convection index, increasing cloud-top brightness temperature gradient, decreasing DTB13 and DTB12, decreasing CTTmin, and decreasing CTPmin. These features correspond to decreases in cloud-top temperature and cloud-top pressure and increases in cloud-top height and the height of deep moist convective clouds. Changes in cloud-feature parameters are mainly characterized by single-peak or single-trough patterns, and the peak or trough mostly occurs before the end of the strongest rainfall. The locations of short-duration heavy rainfall, especially short-duration rainstorms, are mostly situated in large-gradient areas near the edges of low cloud-top brightness temperature regions (below 220 K) and high cloud-top height regions (above 12 km). For 20–50 mm·h−1 short-duration heavy rainfall, during the heavy-rainfall period, the low-value cloud-top brightness temperature center is generally below 220 K, the high-value cloud-top height region generally reaches 12 km, the deep convection index is generally above 30, cloud-top pressure is generally below 130 hPa, DTB12 and DTB13 are generally below 2 K and 0 K, respectively, and the maximum cloud-top brightness temperature gradient is generally above 10. For ≥50 mm·h−1 short-duration rainstorms, the low-value cloud-top brightness temperature center during heavy rainfall is generally below 200 K, the high-value cloud-top height region generally reaches 15 km, cloud-top pressure is generally below 100 hPa, DTB12 and DTB13 are generally below 0 K and −2 K, respectively, the deep convection index is generally above 50, and the maximum cloud-top brightness temperature gradient is generally above 20. These critical cloud-parameter features are reached simultaneously or successively within 0.5 h. In addition, if the above characteristic parameters fluctuate after the strongest rainfall and still satisfy the cloud-parameter characteristics of short-duration heavy rainfall, observations show that short-duration heavy rainfall continues to occur. The common features described above are especially evident in the three representative heavy-rainfall events selected in this study (Figure 4, Figure 5, Figure 6, Figure 7, Figure 8, Figure 9, Figure 10, Figure 11, Figure 12 and Figure 13).
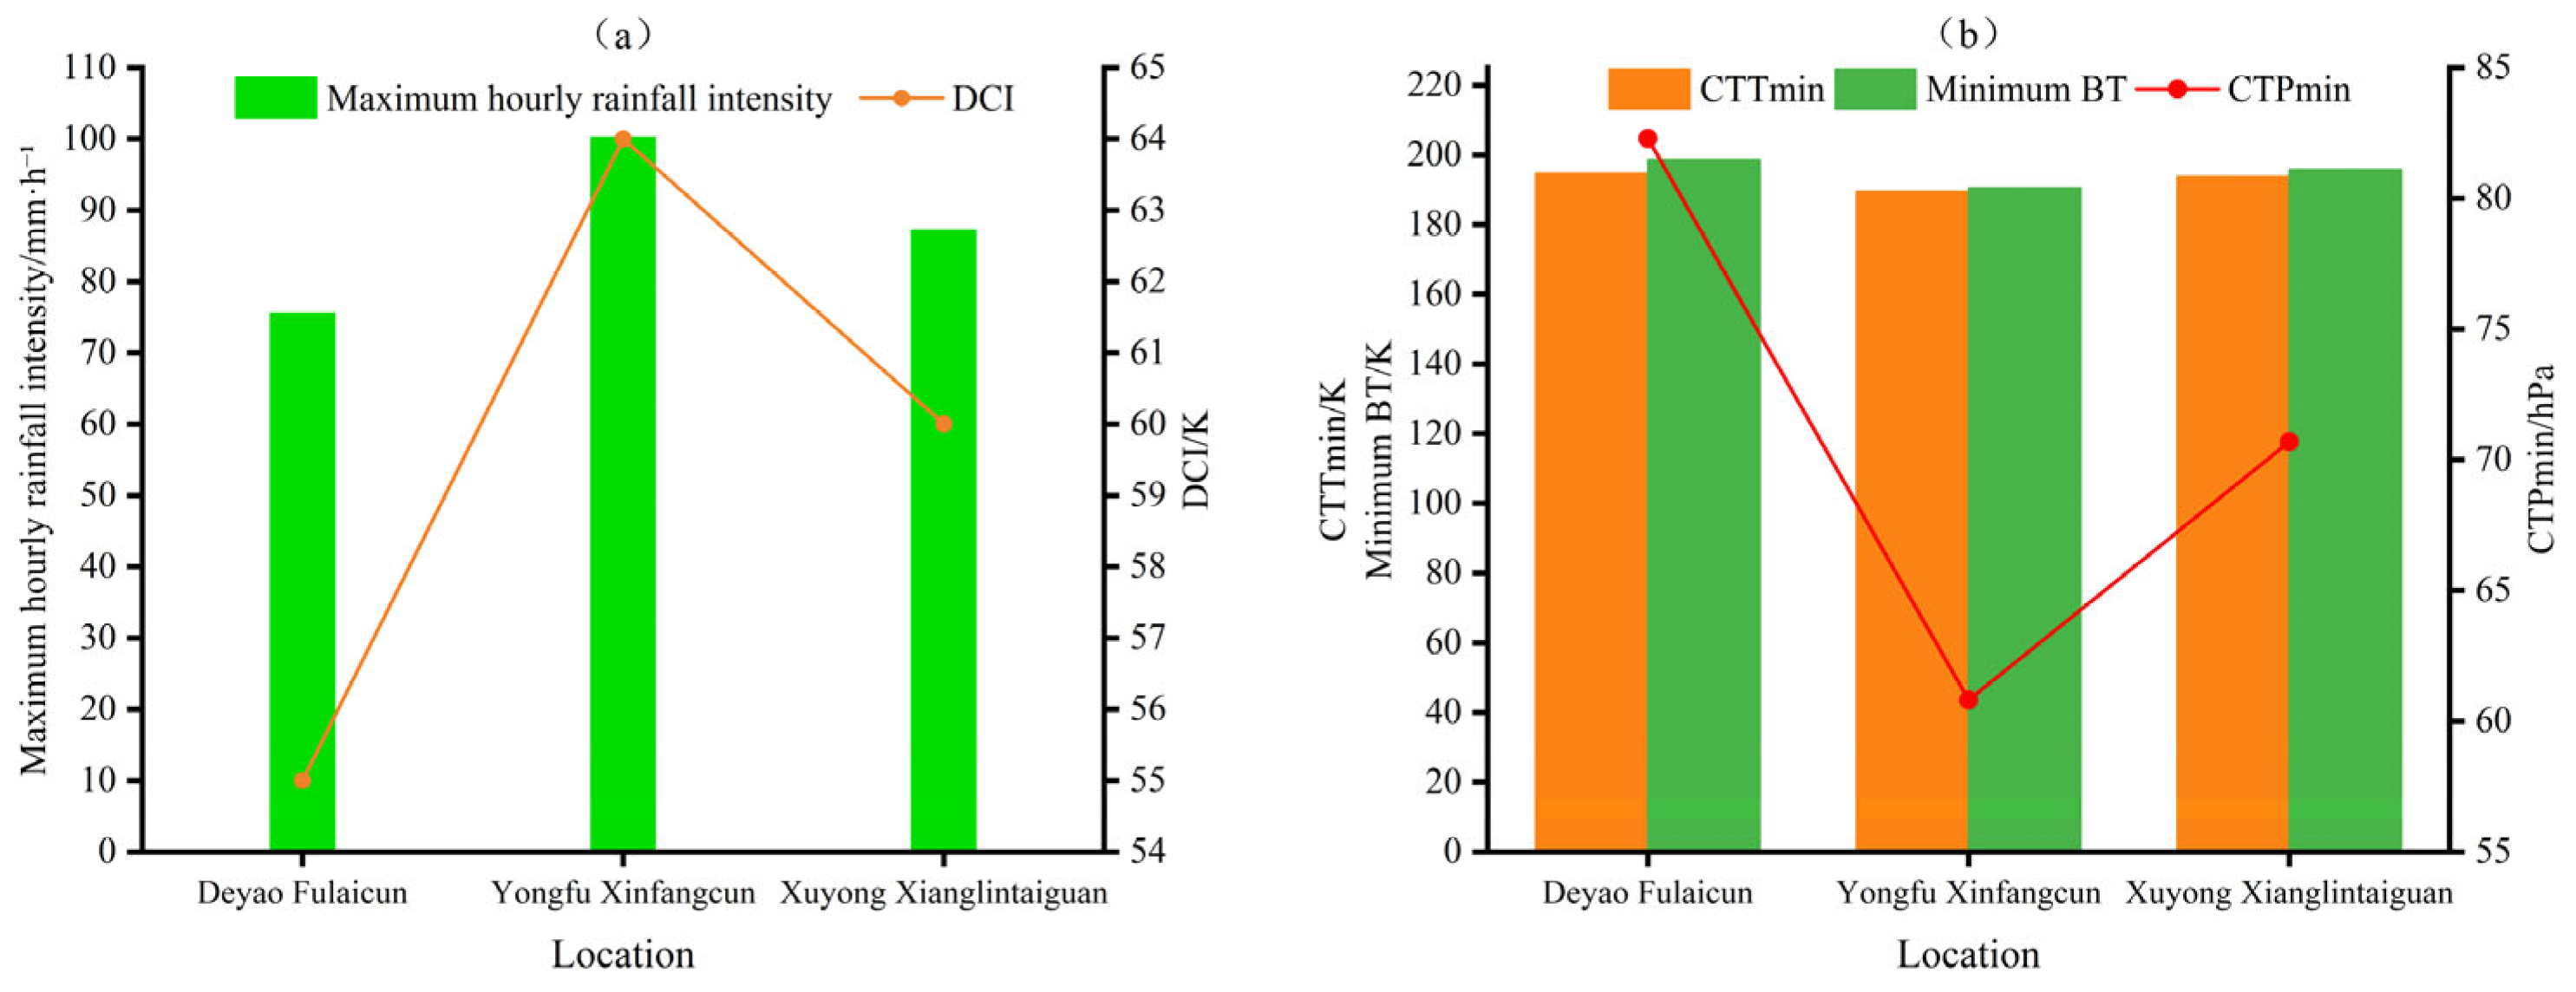
The maximum hourly rainfall intensities of the three representative heavy-rainfall events are 75.5 mm·h−1 at Deyao Fulaicun, 100.2 mm·h−1 at Yongfu Xinfangcun, and 87.2 mm·h−1 at Xuyong Xianglintaiguan, representing a short-duration rainstorm, a short-duration severe rainstorm, and a relatively strong short-duration rainstorm, respectively. Comparing the extrema of the deep convection index and cloud-top pressure under different rainfall intensities (Figure 14) shows that the deep convection index during the strongest rainfall period exceeds 50; the larger the rainfall intensity is, the larger the corresponding deep convection index and the lower the cloud-top pressure are. However, cloud-top brightness temperature does not clearly distinguish short-duration rainstorm processes above 50 mm·h−1, although all values are below 200 K. The latter two stronger short-duration rainstorm events showed abrupt changes in cloud-top height and cloud-top pressure during the strongest hourly rainfall period. Between adjacent observation times, cloud-top height increased sharply by about 1.93 km and 1.87 km, respectively, and cloud-top pressure decreased sharply by 33.81 hPa and 32.55 hPa, respectively (Figure 8 and Figure 11). This indicates that short-duration rainstorm cloud clusters with higher rainfall intensity have stronger convective activity.
Figure 14.
Comparison of key cloud parameters among three representative heavy-rainfall events. (a) Maximum hourly rainfall intensity and deep convection index; (b) minimum brightness temperature, CTTmin, and CTPmin. BT denotes brightness temperature, and DCI denotes deep convection index.
Comparing the cloud-parameter extrema of the representative events (Table 4), the 35 km × 35 km regional window around Yongfu Xinfangcun, where the maximum hourly rainfall intensity was 100.2 mm·h−1, shows a minimum brightness temperature of 190.53 K, a maximum deep convection index of 64.0 K, a CTHmax of 19.2 km, a CTTmin of 189.49 K, and a CTPmin as low as 60.81 hPa. These indicators all show the characteristics of a high and cold cloud-top associated with vigorous deep moist convection. For Xuyong Xianglintaiguan, where the maximum hourly rainfall intensity was 87.2 mm·h−1, and its nearby cloud area, the cloud-parameter values, including the minimum cloud-top brightness temperature, CTHmax, CTTmin, and CTPmin, were generally weaker than those of the Yongfu Xinfangcun event with 100.2 mm·h−1 rainfall, but stronger than those of the Deyao Fulaicun event with 75.5 mm·h−1 rainfall. Although the maximum cloud-top brightness temperature gradient at Yongfu Xinfangcun was relatively weak, the increase in CTHmax between adjacent observation times was the largest, reaching about 1.93 km (Figure 8c). During the maximum hourly rainfall period, CTHmax at Yongfu Xinfangcun was also the highest, about 19.2 km, corresponding to the lowest CTPmin. Because the hourly rainfall intensity at this station reached the level of extreme short-duration heavy rainfall (100.2 mm·h−1), this retrieved height was still within the range of convective cloud-top height and was only slightly higher than the historical maximum value of 19 km from COSMIC radio occultation observations [37]. This indicates that, during short-duration heavy rainfall, especially short-duration rainstorms, higher cloud height, lower cloud-top pressure, colder cloud-top, larger deep convection index, and larger increases in cloud-top gradients, including cloud-height gradient or cloud-top brightness temperature gradient, correspond to stronger hourly rainfall intensity.
Table 4.
Statistics of extreme values of key parameters in three typical cases.
In addition, comparison of the cloud-feature parameters in the three representative heavy-rainfall events (Figure 5, Figure 6, Figure 7, Figure 8, Figure 9, Figure 10, Figure 11, Figure 12 and Figure 13) shows that the correspondence between any single cloud parameter and the timing of heavy-rainfall occurrence at the rainfall stations and in nearby cloud areas is unclear, with no stable pattern. For example, the minimum cloud-top brightness temperature may occur either during the strongest rainfall period or after the strongest rainfall has ended, indicating evident case-to-case differences in the temporal relationship of individual parameters. However, within a 35 km radius around the heavy-rainfall stations, when the low-value cloud-top brightness temperature region was below 220 K, the high-value deep convection index region exceeded 40 K, the high-value cloud-top height region exceeded 15 km, the DTB13 spectral band difference at the corresponding location was below −1 K, and the cloud-top pressure was below 130 hPa, all three heavy-rainfall events were accompanied by short-duration heavy rainfall or stronger rainfall. Therefore, compared with any single parameter, a multi-parameter combination can serve as a potential reference signal for nowcasting and monitoring.
5. Conclusions and Discussion
Based on FY-4B AGRI multi-channel brightness temperature data and retrieved cloud products including cloud-top height (CTH), cloud-top temperature (CTT), cloud-top pressure (CTP), cloud mask (CLM), cloud type (CLT), and cloud phase (CLP), this study calculates cloud parameters in a window centered on heavy-rainfall stations (35 km × 35 km regional window) for short-duration heavy-rainfall processes in Sichuan during 2023–2025. The characteristics of satellite cloud parameters and their response differences under two rainfall-intensity classes (20–50 mm·h−1 and ≥50 mm·h−1) are statistically analyzed, and three representative heavy-rainfall events are selected to analyze cloud evolution characteristics in the window. The main conclusions are as follows:
- Short-duration heavy rainfall events with rainfall intensities of 20–50 mm·h−1 are dominant among heavy-rainfall events in Sichuan, while short-duration rainstorms and stronger heavy-rainfall events with rainfall intensities greater than 50 mm·h−1 are relatively fewer. After the Mann–Whitney U test and Benjamini–Hochberg multiple-comparison correction, the differences in the above cloud parameters between the two rainfall-intensity groups all pass the 0.01 significance level test. This indicates that these cloud parameters show clear responses to short-duration heavy rainfall in Sichuan and play an important role in statistical analysis of cloud-parameter characteristics according to rainfall intensity. The Spearman correlation analysis shows that the above cloud parameters can be grouped into four relatively independent physical dimensions: cloud-top thermal conditions and vertical development, the spectral band-difference information represented by DTB12min, the spectral band-difference information represented by DTB13min, and the horizontal structural characteristics of the cloud top. Specifically, the minimum brightness temperature, deep convection index, CTHmax, CTTmin, and CTPmin mainly characterize cloud-top temperature, cloud-top height, and the degree of vertical development. DTB12min and DTB13min reflect spectral differences related to cloud microphysical properties and mid- to upper-level water vapor conditions, respectively. The maximum gradient characterizes the horizontal inhomogeneity of the cloud-top brightness temperature field and the edge structure of the cloud body. However, the boxplot distributions of cloud parameters under different rainfall-intensity classes overlap. This indicates that a single cloud-feature parameter is difficult to distinguish different rainfall-intensity classes, and that multi-parameter joint application is needed for heavy-rainfall analysis in the complex terrain of Sichuan.
- The cloud parameters of ≥50 mm·h−1 heavy-rainfall processes in Sichuan indicate stronger precipitation characteristics than those of 20–50 mm·h−1 processes. For the former, cloud-tops during heavy rainfall are mainly ice-phase cold clouds with cloud-top brightness temperature below 200 K, cloud-top height above 15 km, cloud-top pressure below 100 hPa, and longwave infrared-water vapor channel brightness temperature difference DTB13 below −2 K. For the latter, cloud-tops are mainly ice clouds with cloud-top brightness temperature of 220 K or lower, cloud-top height of 12 km or higher, deep convection index of 30 or higher, cloud-top pressure of 130 hPa or lower, and DTB13 reaching −1 K. In general, the greater the rainfall intensity of short-duration heavy rainfall, the sharper the increase in the cloud-top brightness temperature gradient or cloud-top height gradient between adjacent observation times, corresponding to more vigorous convection within the cloud body.
- Before the end of all short-duration heavy-rainfall processes in Sichuan, cloud parameters indicate common features: decreases in cloud-top temperature and cloud-top pressure, increases in cloud-top height and deep moist-convective cloud height, cloud-top development to a peak above 12 km during the strongest rainfall, deep convection index reaching a peak above 30, cloud-top brightness temperature gradient or cloud-top height gradient reaching a peak, spectral band differences reaching troughs below 0, and cloud-top pressure reaching a trough below 130 hPa. Heavy-rainfall locations are mostly situated in large-gradient areas near the edges of low cloud-top brightness temperature regions (below 220 K) and high cloud-top height regions (above 12 km). One or several short-duration heavy-rainfall periods may occur before the onset or after the end of the strongest rainfall, but within the cloud window, the above cloud-feature parameters mainly show single-peak or single-trough variations with rainfall intensity. Cloud-tops during heavy rainfall also often show fluctuations in cloud-top brightness temperature or height gradients.
- Within the cloud-window areas centered on short-duration heavy-rainfall stations in Sichuan, cloud-feature parameters show a certain early statistical association with heavy-rainfall occurrence when they reach specific levels. Specifically, the low-value region of cloud-top brightness temperature is generally below 220 K, the high-value region of the deep convection index reaches 40, the high-value region of cloud-top height reaches 15 km, the DTB13 spectral band difference at the corresponding location is below −1 K, and the cloud-top pressure is below 130 hPa. When these critical features are met simultaneously or successively within 0.5 h, the samples in this study usually correspond to the occurrence of short-duration heavy rainfall or stronger rainfall during the subsequent 0.5–2 h. However, these thresholds mainly reflect the statistical association between cloud-feature parameters and the occurrence of short-duration heavy rainfall and should not be interpreted as deterministic forecasting thresholds. Meanwhile, the lead time represented by any single cloud parameter shows no specific pattern.
This study still has some limitations. First, the 35 km × 35 km regional window was mainly selected based on previous studies, the spatial distribution of automatic meteorological stations in Sichuan, and the spatial scale of local severe convective cloud systems. It was used to characterize the local development of cloud systems near heavy-rainfall stations. However, heavy rainfall is unevenly distributed in Sichuan. Different window sizes may affect the extrema of cloud parameters and the statistical results. Sensitivity comparisons using different window sizes should be further carried out in future studies. Second, the retrieved products used in this study, such as CTH and CTP, are not exact values. However, under the influence of complex terrain and local circulation, heavy-rainfall systems in Sichuan can easily produce local extreme short-duration heavy rainfall. Their convective cloud-tops may even overshoot the tropopause. Therefore, these retrieved products can be used for qualitative analysis of local heavy-rainfall cloud characteristics. In the future, radio occultation and other observational data can be combined to correct the retrieved products. In addition, this study mainly focuses on the response characteristics of FY-4B cloud parameters to localized short-duration heavy rainfall under different rainfall-intensity classes. The sample size of heavy-rainfall events is still insufficient to support the construction of rainfall-intensity classification or quantitative precipitation prediction models. This is especially true for heavy-rainfall events over the western Sichuan Plateau, where the number of samples is small. In the future, when sufficient samples are available, differentiated thresholds for different terrain regions can be studied, and machine-learning prediction models can be established.
Author Contributions
Conceptualization, Y.Z. and P.Z.; methodology, Y.Z. and P.Z.; software, Y.Z.; validation, Y.Z., P.Z. and D.L.; formal analysis, Y.Z.; investigation, Y.Z.; resources, P.Z. and D.L.; data curation, Y.Z.; writing—original draft preparation, Y.Z.; writing—review and editing, P.Z. and D.L.; visualization, Y.Z.; supervision, P.Z.; project administration, P.Z.; funding acquisition, P.Z. All authors have read and agreed to the published version of the manuscript.
Funding
This research was funded by the Southwest Regional Weather Modification Capacity Building Project, grant number SCIT-ZG(Z)-2024100001; the National Natural Science Foundation of China, grant number 42575154; the “Qomolangma Talent Program” Project, grant number ZFYC-GCLJ-202501; and the Research Start-up Project of Chengdu University of Information Technology, grant numbers KYTZ202224 and 2025KYTZ009.
Institutional Review Board Statement
Not applicable.
Informed Consent Statement
Not applicable.
Data Availability Statement
The FY-4B satellite data used in this study are available from the National Satellite Meteorological Center of the China Meteorological Administration (https://satellite.nsmc.org.cn/DataPortal/cn/home/index.html (accessed on 23 June 2026)). The precipitation observation data and processed datasets generated during the current study are available from the corresponding author upon reasonable request.
Conflicts of Interest
The authors declare no conflicts of interest.
References
- Ran, J.J.; Qi, Y.L.; Long, Z.P.; Wang, T.J. Characteristics of short-duration heavy rainfall in the Sichuan Basin based on high-density station observations. Plateau Meteorol. 2023, 42, 949–961. [Google Scholar]
- Zhou, Q.X.; Kang, L. Spatiotemporal characteristics of extreme hourly precipitation in Sichuan Province based on spatially dense data. Plateau Meteorol. 2025, 44, 1261–1272. [Google Scholar] [CrossRef]
- Yu, X.D.; Zheng, Y.G. Advances in contemporary severe convective weather research and operations in China. Acta Meteorol. Sin. 2020, 78, 391–418. [Google Scholar] [CrossRef]
- Yan, J.; Xu, G.R.; Cheng, C.Y.; He, J. Comparative analysis of FY-4A/4B hourly QPE and ground-observed precipitation during the 2023 Meiyu period in Hubei. Torrential Rain Disasters 2025, 44, 835–846. [Google Scholar] [CrossRef]
- Liu, Y.L.; Li, C.X.; Zhang, L.J.; Wen, H.; Wang, S.D. Statistical analysis of terrain blockage effects on the new-generation weather radar network based on high-resolution elevation data. Acta Meteorol. Sin. 2020, 78, 705–720. [Google Scholar] [CrossRef]
- Lu, F.; Zhang, X.H.; Chen, B.Y.; Liu, H.; Wu, R.H.; Han, Q.; Feng, X.H.; Li, Y.; Zhang, Z.Q. Imaging characteristics and application prospects of the Fengyun-4 meteorological satellite. J. Mar. Meteorol. 2017, 37, 1–12. [Google Scholar] [CrossRef]
- Wang, Q.P.; Wu, X.J.; Chen, Y.Q.; Duan, J. Visualization and application of FY-4A satellite data. Meteorol. Sci. Technol. 2019, 47, 502–507. [Google Scholar] [CrossRef]
- Kim, G.; Choi, S.Y.; Ho, J. Potential precursory signals of localized torrential rainfall from geostationary satellite and radar observations: A case study of the 2022 Seoul flood. Asia-Pac. J. Atmos. Sci. 2024, 60, 679–692. [Google Scholar] [CrossRef] [Scilit]
- Zheng, W.; Wang, X.; Zhang, Y.P.; Han, X.Z.; Tang, S.H. Application of Fengyun meteorological satellites in disaster prevention and mitigation. Sci. Technol. Rev. 2021, 39, 31–38. [Google Scholar] [CrossRef]
- Wang, F.; Zhao, Y. Cloud-top height retrieval algorithm for the Fengyun-4 geostationary meteorological satellite. J. Sichuan Norm. Univ. Nat. Sci. 2021, 44, 412–418. [Google Scholar]
- Shao, J.; Zhang, S.Z.; Chen, M.; Li, Q.; Zheng, Y.J.; Cheng, Y.; Ma, N. Applicability of FY-4A satellite data to short-duration heavy rainfall in Ningxia. Arid Zone Res. 2023, 40, 163–172. [Google Scholar] [CrossRef]
- Shao, J.; Zheng, P.H.; Pei, X.R.; Zhang, S.Z.; Cheng, Y.; Ma, B.B.; Chen, Y.Y. Characteristics of FY-4A Satellite Cloud Physical Parameters in Severe Convective Weather in Ningxia. Meteorol. Mon. 2025, 51, 337–348. [Google Scholar]
- Zhu, P.; Li, S.C.; Wang, Z.H.; Xiao, J.S. Characteristics of Rainstorm Cloud Clusters to Local Heavy Precipitation over the Eastern Qinghai–Tibet Plateau. J. Remote Sens. 2014, 18, 405–431. [Google Scholar] [CrossRef] [Scilit]
- Zhu, P.; Xiao, J.S. Comparative analysis of Himawari-8 satellite monitoring and warning characteristics for short-duration heavy rainfall over the Qinghai Plateau. Plateau Meteorol. 2022, 41, 502–514. [Google Scholar] [CrossRef]
- Xiao, X.; Wei, M. Identification and evolution of severe convective cloud clusters using FY-2E infrared and water vapor bands. Trans. Atmos. Sci. 2018, 41, 135–144. [Google Scholar] [CrossRef]
- Chen, X.; Letu, H.; Shang, H.; Ri, X.; Tang, C.; Ji, D.; Shi, C.; Teng, Y. Rainfall area identification algorithm based on Himawari-8 satellite data and analysis of its spatiotemporal characteristics. Remote Sens. 2024, 16, 747. [Google Scholar] [CrossRef] [Scilit]
- Gui, H.L.; Zhuge, X.Y.; Wei, X.C.; Liu, B.J.; Tang, Z.J.; Jiang, Q. Relationship between cloud parameters and precipitation based on Himawari-8 satellite data. Meteorol. Mon. 2019, 45, 1579–1588. [Google Scholar] [CrossRef]
- Yan, Y.F.; Tan, J.G.; Cui, L.L.; Yue, C.J.; Guo, W.; Liu, D.W. Estimating short-duration heavy rainfall and its evolution for Typhoon Meranti using high-spatiotemporal-resolution infrared brightness temperature data from Himawari-8. Meteorol. Mon. 2019, 45, 318–329. [Google Scholar] [CrossRef]
- Yang, L.; Cai, K.Z.; Sun, L.; Chen, Y.; Zhang, Y. Comparative analysis of convective cloud characteristics in two Shenyang rainstorm processes based on Himawari-8 satellite data. Torrential Rain Disasters 2020, 39, 125–135. [Google Scholar] [CrossRef]
- Liang, H.; Xu, D.M.; Shu, A.Q.; Zhang, X.W.; Song, L.X. Application of Himawari-8 radiance data assimilation in forecasting a Sichuan–Chongqing rainstorm. Plateau Meteorol. 2023, 42, 1478–1491. [Google Scholar] [CrossRef]
- Mao, C.; Qing, Y.; Qian, Z.; Zhang, C.; Gu, Z.; Gong, L.; Liao, J.; Li, H. Application of FY Satellite Data in Precipitation of Eastward-Moving Southwest China Vortex: A Case Study of Precipitation in Zhejiang Province. Atmosphere 2023, 14, 1664. [Google Scholar] [CrossRef] [Scilit]
- Wang, X.Q.; Xu, W.H.; Xiang, S.Y.; Fang, M. Analysis of rainstorm cloud-system characteristics based on FY-4 satellite data. Plateau Mt. Meteorol. Res. 2020, 40, 36–40. [Google Scholar]
- Wang, M.; Chen, Y.Y.; Zhou, Y.Q.; Li, Q. Comparative analysis of the application effects of three FY-4A cloud parameters in a rainstorm process. Torrential Rain Disasters 2022, 41, 396–404. [Google Scholar] [CrossRef]
- Guo, X.; Lin, D.; Wu, F. Analysis of Precipitation Process and Operational Precipitation Enhancement in Panxi Region Based on Cloud Parameters Retrievals from China’s Next-Generation Geostationary Meteorological Satellite FY-4A. Atmosphere 2023, 14, 922. [Google Scholar] [CrossRef] [Scilit]
- Liu, X.; Chen, Y.; Guo, J.; Song, W.; Dan, J. Brightness Temperature Characteristics of Short-Duration Heavy Rainfall in the Chengdu–Chongqing Railway Region in China. Atmosphere 2023, 14, 896. [Google Scholar] [CrossRef] [Scilit]
- Chu, M.; Wu, W. Accuracy Assessment of FY-4A and FY-4B Quantitative Precipitation Estimation in Sichuan. J. Meteorol. Environ. 2025, 41, 76–84. [Google Scholar]
- Wang, Y.; Wu, X.; Zhang, H.; Ren, H.-L.; Yang, K. Evaluation of Fengyun-4B satellite temperature profile products using radiosonde observations and ERA5 reanalysis over the Eastern Tibetan Plateau. Remote Sens. 2024, 16, 4155. [Google Scholar] [CrossRef] [Scilit]
- Cao, X.J. Application of FY-4A Satellite to Convective Precipitation Weather in the Qinba Mountains. Master’s Thesis, Chengdu University of Information Technology, Chengdu, China, 2023. [Google Scholar] [CrossRef]
- Liu, J.; Li, Y.P.; Huang, J.; Chen, J.B.; Huang, J.; Wei, X.W. Optimization of radar precipitation-estimation products based on FY-4B AGRI infrared radiance observations. Meteorol. Res. Appl. 2025, 46, 55–61. [Google Scholar] [CrossRef]
- Liu, R.; Sun, J.; Chen, B. Selection and Classification of Warm-Sector Heavy Rainfall Events over South China. Chin. J. Atmos. Sci. 2019, 43, 119–130. [Google Scholar] [CrossRef]
- Zhao, L.; Wei, T.; Wang, L.; Xie, W. Research on a Similarity Retrieval Method for Regional Rainstorm Processes Based on Multidimensional Features. J. Trop. Meteorol. 2024, 40, 966–973. [Google Scholar] [CrossRef]
- Liao, Y. Research on Convective Cloud Identification Technology Based on Air Traffic Control Demand DDD. Master’s Thesis, Civil Aviation Flight University of China, Guanghan, China, 2020. [Google Scholar] [CrossRef]
- Zhang, M.; Xu, N.; Chen, L.; Liu, J.; Yang, C.J. Consistency evaluation of the accuracy of FY-4B and FY-4A cloud-top property products. J. Trop. Meteorol. 2024, 40, 389–396. [Google Scholar]
- Zhang, M.; Li, B.; Xu, N.; Yang, C. Research on the factors influencing the inversion of cloud top properties of Fengyun 4B. J. Sichuan Norm. Univ. Nat. Sci. 2025, 48, 398–405. [Google Scholar] [CrossRef]
- Heidinger, A. ABI Cloud Height; GOES-R Algorithm Theoretical Basis Document; NOAA/NESDIS/STAR: College Park, MD, USA, 2011; pp. 1–77. [Google Scholar]
- Feng, S.; Fu, Y.; Xiao, Q. Is the tropopause higher over the Tibetan Plateau? Observational evidence from Constellation Observing System for Meteorology, Ionosphere, and Climate (COSMIC) data. J. Geophys. Res. 2011, 116, D21121. [Google Scholar] [CrossRef] [Scilit]
- Yu, X.J.; Yang, S.P.; Jiang, X.; Zhang, M. Analysis of seasonal variations of the tropopause over the Tibetan Plateau using COSMIC radio occultation data. Trans. Atmos. Sci. 2022, 45, 292–301. [Google Scholar] [CrossRef]

Disclaimer/Publisher’s Note: The statements, opinions and data contained in all publications are solely those of the individual author(s) and contributor(s) and not of MDPI and/or the editor(s). MDPI and/or the editor(s) disclaim responsibility for any injury to people or property resulting from any ideas, methods, instructions or products referred to in the content. |
© 2026 by the authors. Licensee MDPI, Basel, Switzerland. This article is an open access article distributed under the terms and conditions of the Creative Commons Attribution (CC BY) license.