


Abstract
Indoor radon is a key indoor air pollutant and a major contributor to population exposure to natural ionizing radiation, with relevance in school buildings where children and staff spend extended periods indoors. This study investigated indoor radon concentrations in two public schools located in a radon-prone area of northern Portugal using a combined short- and long-term monitoring strategy. In the first phase, active RadonEye detectors were deployed for continuous winter measurements in four ground-floor rooms across two schools, with three rooms located in School S1 and one in School S2, providing hourly data to characterize temporal variability. In the second phase, CR-39 passive detectors were installed in the same spaces to obtain integrated long-term concentrations. Active monitoring revealed pronounced spatial and temporal variability, with mean concentrations ranging from 140 to 228 Bq/m3 and peak values reaching 586 Bq/m3. Radon levels generally declined during occupied periods and increased at night and on weekends, indicating the importance of ventilation and occupancy patterns in shaping indoor radon dynamics. Passive measurements ranged from 290 to 300 Bq/m3 in school S1 and from 84 Bq/m3 to 300 Bq/m3 in school S2, confirming higher long-term concentrations in S1. Although most measurements remained below the reference level of 300 Bq/m3, several rooms approached or temporarily exceeded this threshold. These findings highlight the value of combining active and passive techniques to improve radon assessment in school environments and support targeted ventilation and mitigation strategies to reduce exposure and improve indoor air quality.
1. Introduction
Radon is an inert, colorless, and odorless radioactive gas generated by the natural decay of uranium in soils and rocks. Among its naturally occurring isotopes (219Rn, 220Rn, and 222Rn), radon-222 is the most relevant for indoor environments because its 3.8-day half-life allows migration from the ground and accumulation in enclosed spaces. In the context of indoor air quality, radon is one of the most important natural air pollutants and a major contributor to population exposure to ionizing radiation from natural sources [1,2,3].
Indoor radon originates predominantly from soil gas entering buildings through cracks in foundations, structural joints, and gaps around pipes, especially in ground-contact spaces and lower floors [1,2,4]. Indoor radon concentrations are highly variable, reflecting the combined influence of geological conditions, building characteristics (including floor level), air exchange rates, and occupant-driven ventilation practices, with marked spatial and temporal variability particularly in educational buildings [2,4,5]. Consequently, radon is considered not only a geological issue but also a primarily indoor air quality problem shaped by how buildings are designed, used, and ventilated [2,4,5,6].
Schools are environments of particular interest for indoor radon research, as children spend a significant portion of their time indoors in these settings [7,8]. Furthermore, children constitute a particularly vulnerable subpopulation: they exhibit higher respiratory rates per unit body mass than adults, potentially leading to higher radon inhalation, and have a longer remaining lifetime during which radon-induced health effects, including lung cancer, may develop [1,2].
In many schools, especially older buildings, ventilation relies mainly on opening windows and doors, which may be insufficient or inconsistent depending on weather, occupancy schedules, and building operation [7,8,9]. Under such conditions, inadequate air renewal, combined with direct contact with the ground and specific structural features, may favour radon accumulation in classrooms and other occupied spaces [4,8,10].
Several international studies have reported substantial variability in radon concentrations across educational buildings [7,8,11,12,13,14]. For example, a study conducted in Italian schools reported a wide range of indoor radon concentrations, highlighting the influence of building characteristics and ventilation conditions on exposure levels [14]. Mean concentrations range from values below 20 Bq/m3 in some settings to averages exceeding 300 Bq/m3 in others, and approximately 1.5% of educational institutions have been reported to exceed 300 Bq/m3 [8,12]. Although average levels are often below national reference thresholds, localized hotspots and short-term exceedances remain relevant from both air quality and public health perspectives [8,12,13].
Radon exposure is recognized as the second leading cause of lung cancer worldwide and the primary cause among never-smokers [2,15,16,17]. It is estimated that between 3% and 20% of lung cancer deaths globally are attributable to radon exposure, with higher proportions among non-smokers [2,15,17,18,19]. The International Agency for Research on Cancer classifies radon as a Group 1 human carcinogen [20]. For this reason, reference levels for indoor environments are used as practical tools for exposure management: the World Health Organization recommends 100 Bq/m3 where feasible [2], while the European Union established a reference level not exceeding 300 Bq/m3 under Directive 2013/59/Euratom [21].
Despite growing international evidence, data on indoor radon in Portuguese school buildings remain limited (as reflected by the relatively few studies available in the literature), particularly in northern Portugal, where granitic formations are associated with elevated radon potential [22,23,24]. In addition, relatively few school-based studies combine short-term continuous measurements with long-term integrated monitoring in the same rooms, even though these approaches provide complementary information on temporal dynamics and average exposure [8,12,13]. Addressing this gap is important for identifying higher-risk spaces, understanding how occupancy and ventilation influence indoor radon behavior, and supporting targeted surveillance and mitigation measures in educational settings [8,13].
Therefore, this study aimed to assess indoor radon concentrations in two schools in northern Portugal using complementary active and passive monitoring, characterize spatial and temporal variability in the monitored rooms, and examine the implications of the observed patterns for exposure assessment, ventilation management, and compliance with current reference levels.
2. Materials and Methods
This study was conducted in two public educational institutions located in northern Portugal.
The first school (S1), covering the 2nd and 3rd cycles of basic education, has an area of approximately 16,110 m2 and underwent a major renovation in 2021, including upgrades to floors, walls, and ventilation systems; by the end of 2026, the building will be approximately 40 years old.
The second school (S2), comprising a nursery and 1st cycle, has an area of 1800 m2 and is a century-old building that has undergone significant renovations over the past decade, including the construction of new blocks, refurbishment of classrooms, and replacement of windows and interior finishes; measurements in S2 were carried out in the recently renovated section.
Ventilation in both schools is exclusively natural, with windows opened and closed manually by occupants. The buildings are constructed of reinforced concrete and brick masonry, with ground floors consisting of concrete slabs finished with linoleum.
In Portugal, studies conducted in nursery and pre-school settings have shown considerable spatial and temporal variability in indoor radon concentrations, with levels that may exceed international recommendations in certain cases, highlighting the need for systematic monitoring and mitigation strategies in these environments [23,24].
The first cycle lasts 4 years (with the normal age range for attendance being 6 to 9 years); the second cycle lasts two years (with the normal age range for attendance being 10 to 11 years old); and the third cycle lasts three years (with the normal age range for attendance being 12 to 14 years old).
The assessment of indoor radon concentration was carried out in two complementary phases. In the first phase, a diagnostic assessment was conducted to evaluate radon levels. For this purpose, Radon Eye active detectors were used to obtain continuous measurements over 15 days, with hourly radon concentrations automatically recorded. The measurements were performed using RadonEye detectors (model RD200P2, FTLab, Ansan-city, Gyeonggi-do, Republic of Korea), which operate on a pulsed ionization chamber principle. According to the manufacturer’s specifications, the detector has a measurement range of 0.1–255 pCi/L (approximately 4–9435 Bq/m3), an accuracy of ±10% (minimum error ±0.5 pCi/L, equivalent to ±18.5 Bq/m3) at 10 pCi/L (~370 Bq/m3), and a precision better than ±10%. The devices are factory-calibrated by the manufacturer, and no additional pre-deployment calibration against a certified reference standard was performed prior to their use in this study.
In the second phase, radon levels were evaluated using CR-39 Solid State Nuclear Track Detectors (SSNTDs), a widely used method for long-term radon monitoring in indoor environments [25]. These detectors consist of a passive diffusion chamber (4.5 cm high and 2 cm in diameter) containing a CR-39 plastic track detector. Radon enters the chamber by diffusion, allowing long-term passive measurements with an exposure period of up to approximately 3 months per detector. This method provides an integrated assessment of the average radon concentration over time, minimizing seasonal and diurnal variations.
In the first phase, measurements with active detectors were conducted from 17 February to 3 March 2025, whereas the second phase involved passive detectors deployed from 30 October 2025 to 30 January 2026. Although conducted in different calendar periods, both campaigns were carried out under comparable conditions, with building use, occupancy patterns, and natural ventilation routines remaining consistent and relying on manual window operation by occupants. No significant changes in building operation or usage were reported between the two monitoring periods.
At School S1, measurements were conducted in three rooms on the ground floor of three separate buildings: the library, the music room, and the computer laboratory, each equipped with a CR-39 passive detector. At School S2, the assessment was conducted in one classroom on the ground floor, also using a CR-39 passive detector. The results’ uncertainty is determined in accordance with DIN ISO 11665-4 [26].
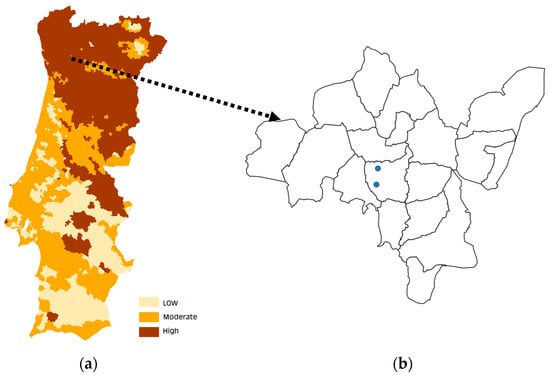
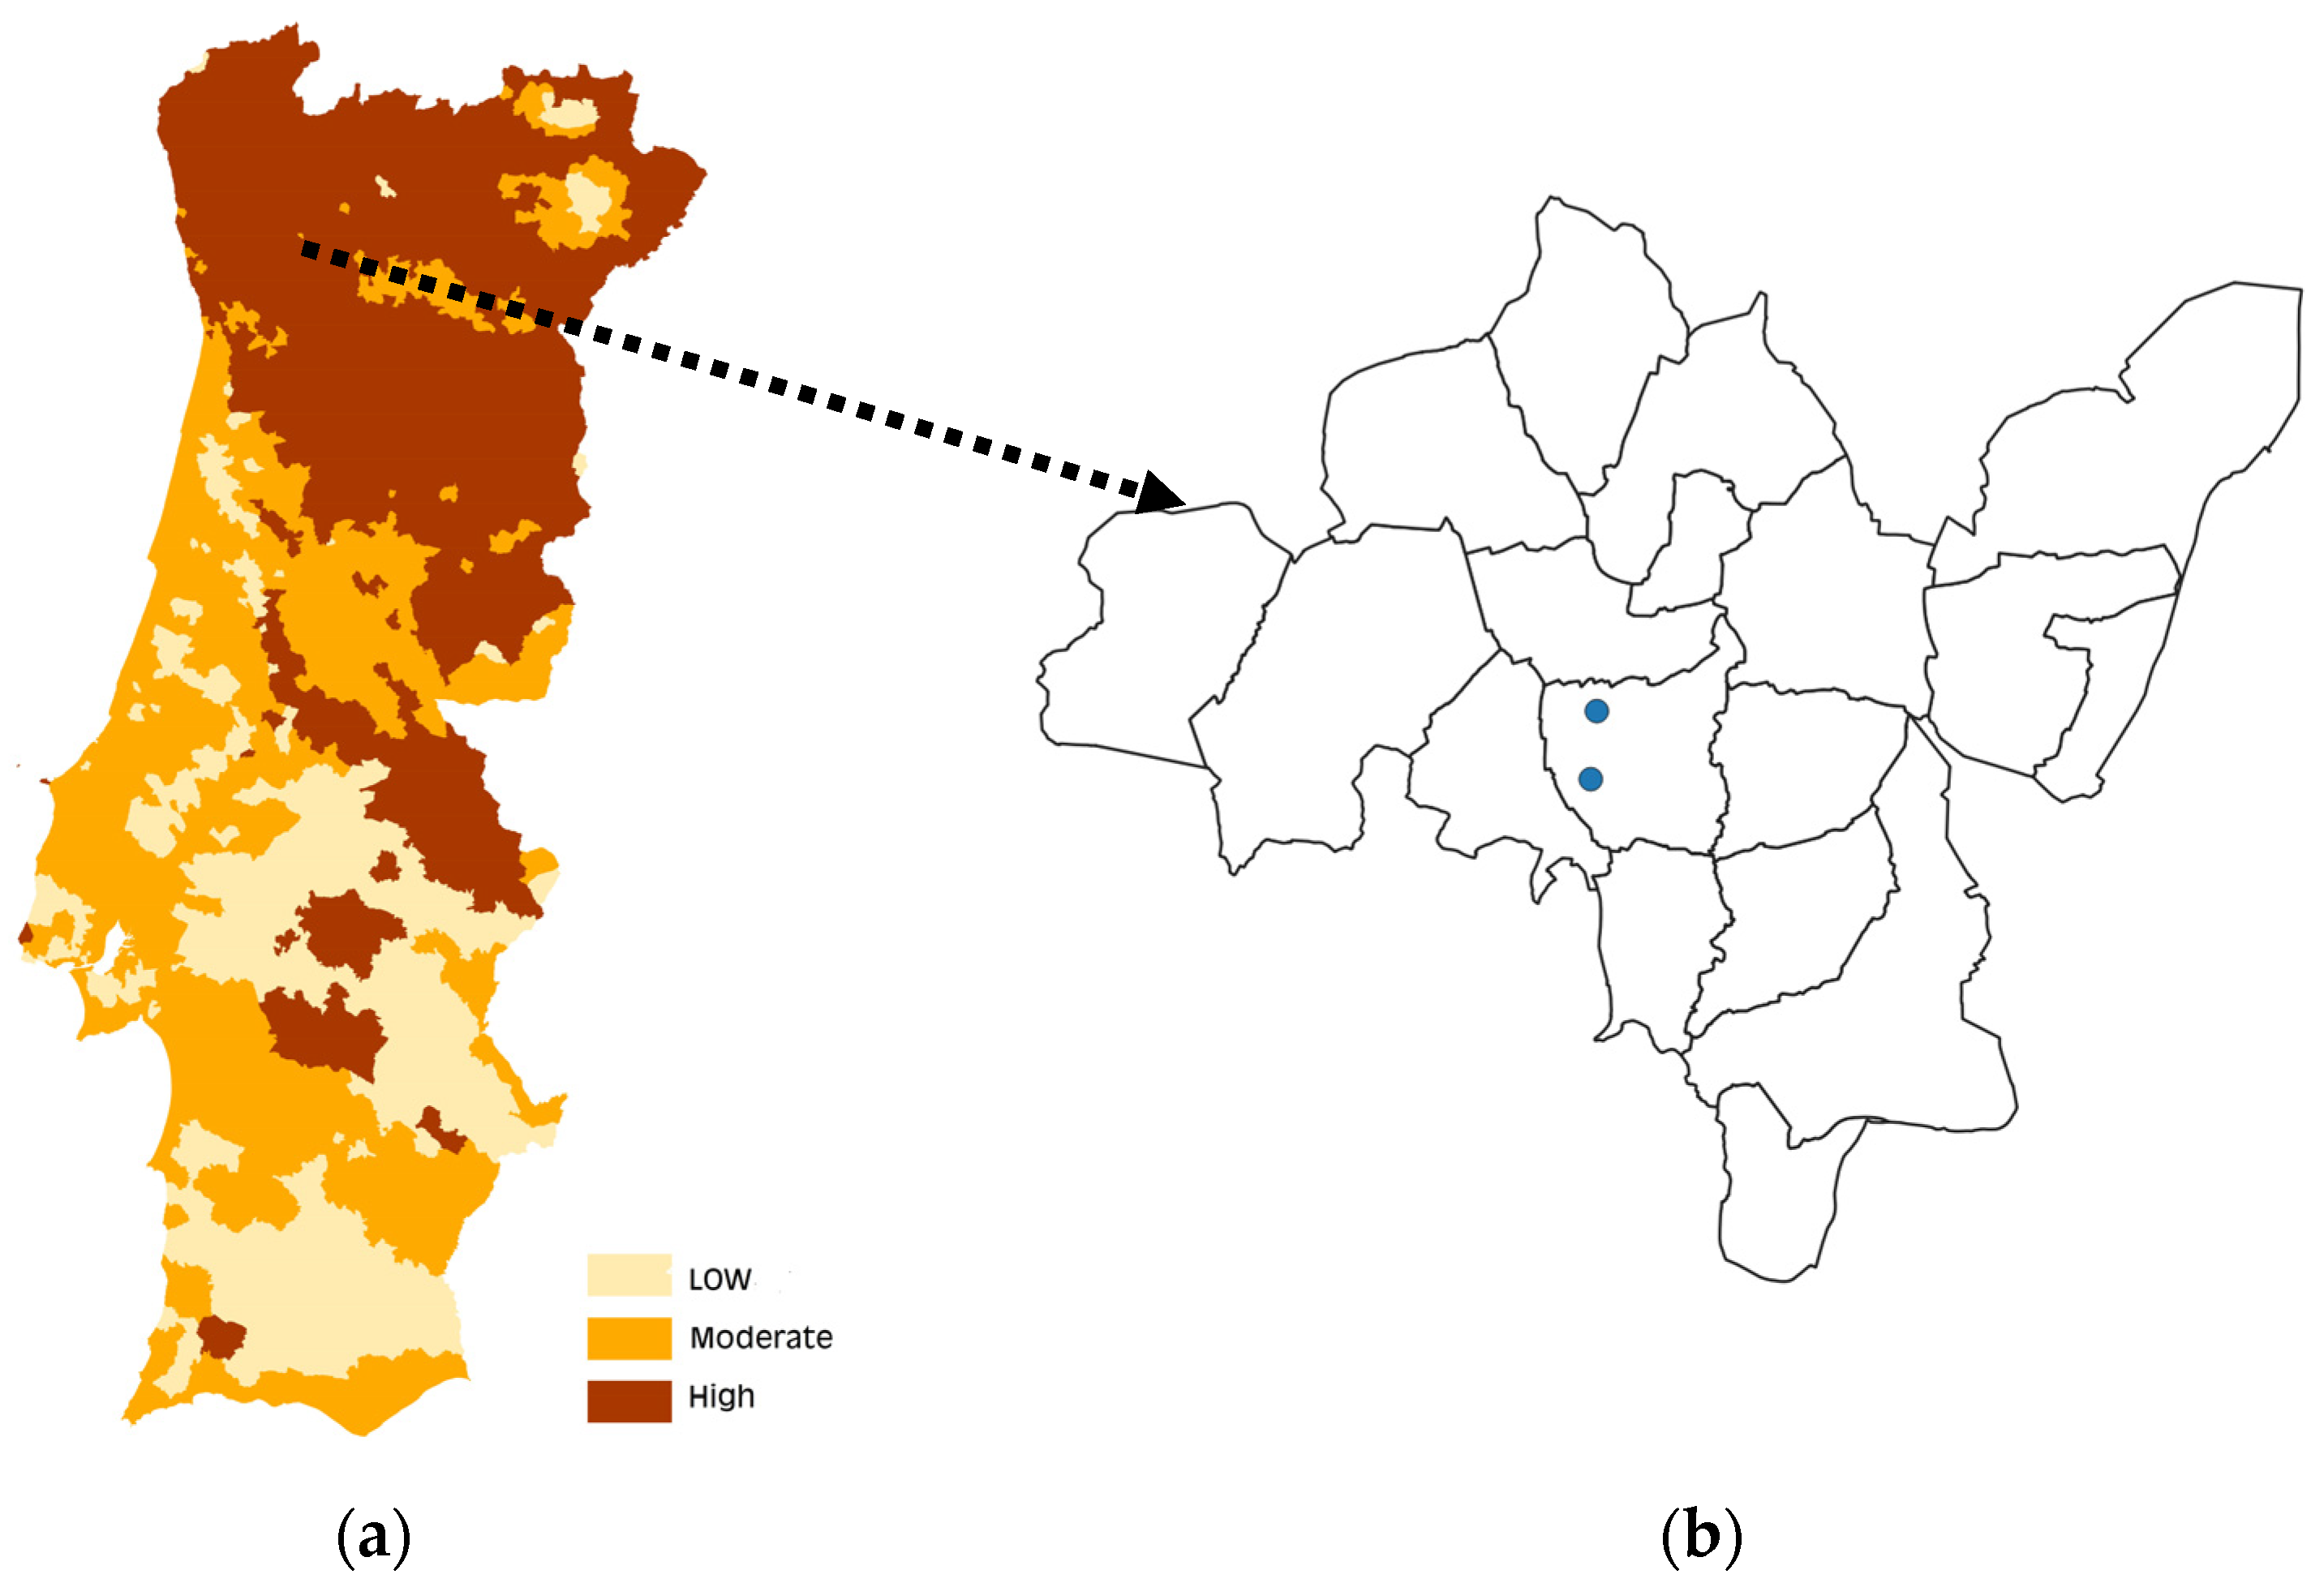
Both schools are located in north-western Portugal, within the same parish and approximately 800 m apart. The study area lies in the Central Iberian Zone (CIZ), a geological setting associated with high indoor radon potential due to the widespread presence of granitic formations and uranium-rich metasedimentary rocks. In addition, faults and fractures may act as preferential pathways for radon migration from the bedrock to the surface. Accordingly, both schools are situated in areas classified as having high radon susceptibility [22] (Figure 1).
Figure 1.
(a) Radon susceptibility map for mainland Portugal [22]. (b) Location of the schools under study within the parish, with blue dots indicating the approximate position of each school.
3. Results
3.1. Assessment of Radon Concentration
3.1.1. Active Detectors
Table 1 summarizes the descriptive statistics of radon concentrations measured in the monitored rooms of the two schools using Radon Eye active detectors. In addition to radon, microclimatic parameters, namely temperature and relative humidity, were recorded throughout the monitoring period. For each location, the table reports mean values together with the corresponding minimum and maximum values, allowing the characterization of environmental variability and comparison of radon levels across schools and rooms. To facilitate interpretation, the monitored rooms were identified by letters (A, B, C).
Table 1.
Descriptive statistics of radon concentrations measured with active detectors in the monitored rooms.
In School 1, the three rooms exhibited distinct radon concentration patterns, reflecting the influence of building characteristics, ventilation conditions, and occupancy patterns. These factors led to high variability in radon concentrations during the measurement period.
In addition to radon concentrations, temperature and relative humidity were monitored to provide context for indoor environmental conditions. Across the monitored rooms, temperature values remained relatively stable (14–21 °C), reflecting typical indoor conditions during occupancy, while relative humidity showed moderate variability (40–70%) (Table 2). Although no strong quantitative relationship was established, these parameters may indirectly influence radon concentrations by association with ventilation practices and, therefore, result in, for example, lower radon levels.
Table 2.
Descriptive statistics of temperature and relative humidity in monitored rooms.
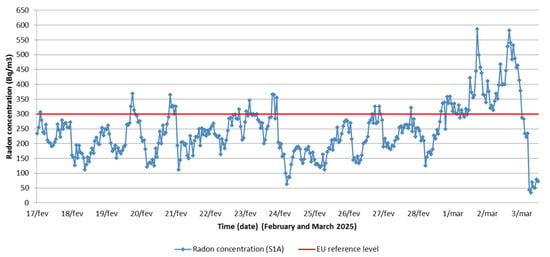
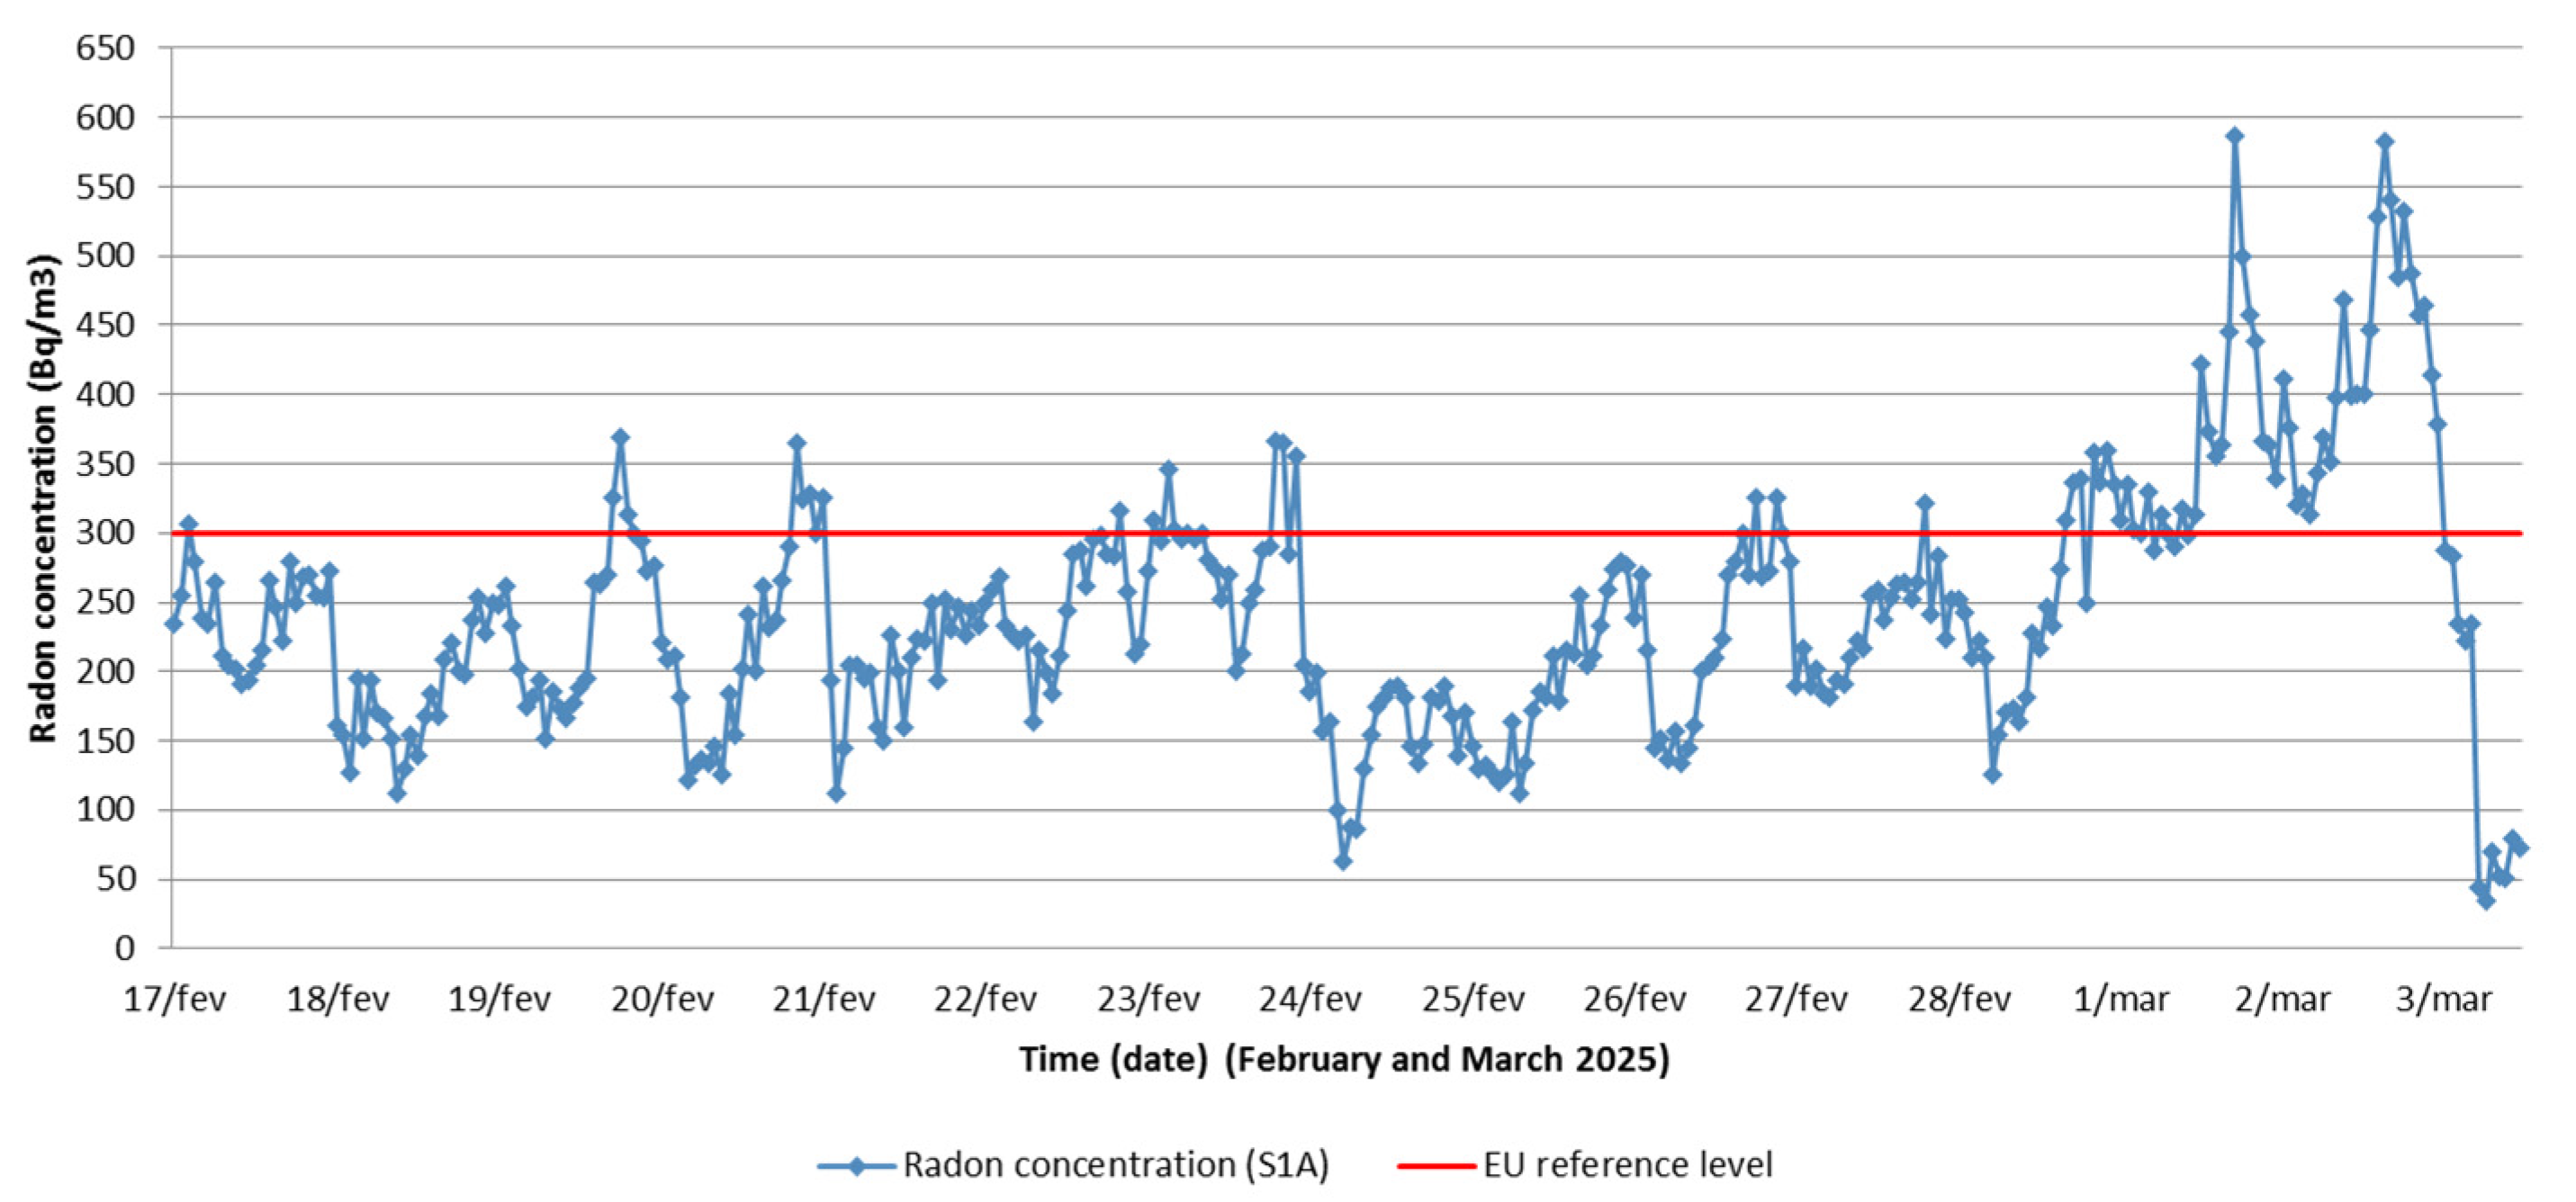
In room A (library) (Figure 2), radon concentrations were predominantly between 150 and 300 Bq/m3. However, significant peaks ranging from 500 to 600 Bq/m3 were recorded, particularly on Sundays and Mondays. Lower concentrations were generally observed during daytime hours, likely due to increased ventilation and occupant activity. In contrast, a progressive increase in radon levels was observed on weekends, culminating in a peak near 600 Bq/m3 on the last Sunday of the measurement period. Subsequently, an abrupt decrease to values below 100 Bq/m3 was recorded on Monday, a pattern that may be attributed to the resumption of ventilation. The reference level of 300 Bq/m3 was exceeded on several occasions throughout the monitoring period.
Figure 2.
Hourly radon concentration in room S1A over the monitoring period. The dashed line indicates the EU reference level (300 Bq/m3).
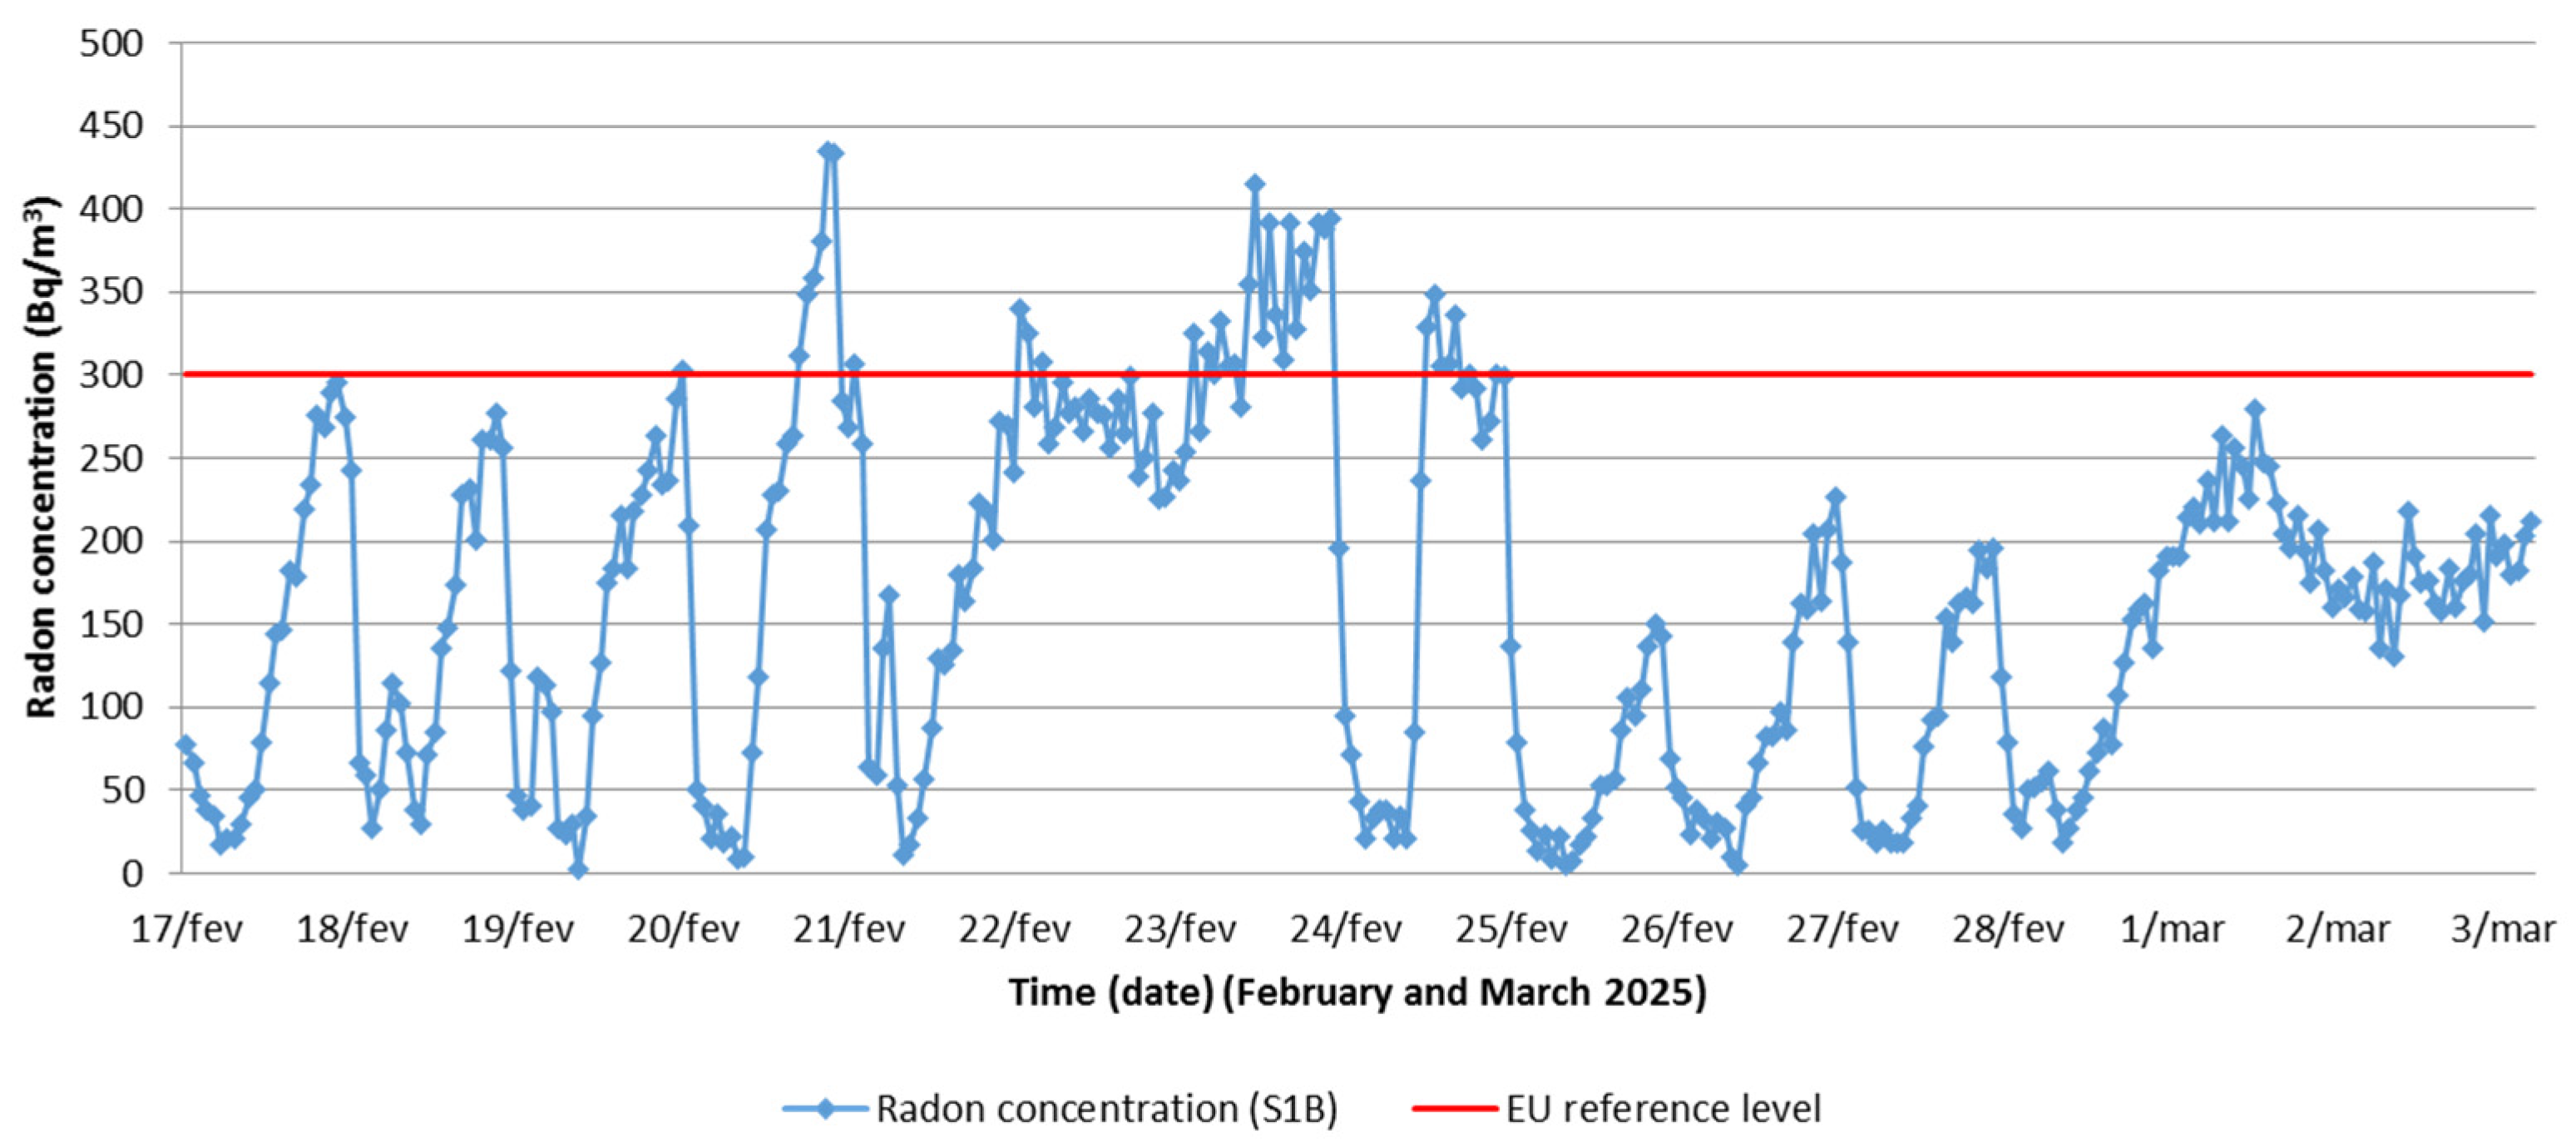
Regarding room B (classroom) (Figure 3), located in a different building, temporal variability in radon concentrations was observed. Most measurements ranged from approximately 50 to 300 Bq/m3, although occasional measurements exceeding 400 Bq/m3 were recorded. A clear daily cyclical pattern was evident, with lower concentrations during daytime, likely associated with natural ventilation and room occupancy. During periods of reduced use, particularly at night and on weekends, radon concentrations increased gradually, suggesting accumulation under limited ventilation conditions. More pronounced peaks were observed midweek and during the intermediate weekend of the monitoring period. Following these episodes, concentrations decreased sharply, coinciding with the resumption of school activities and, consequently, ventilation. The 300 Bq/m3 reference level was also exceeded on several occasions, although for shorter periods than in the library.
Figure 3.
Hourly radon concentration in room S1B over the monitoring period. The dashed line indicates the EU reference level (300 Bq/m3).
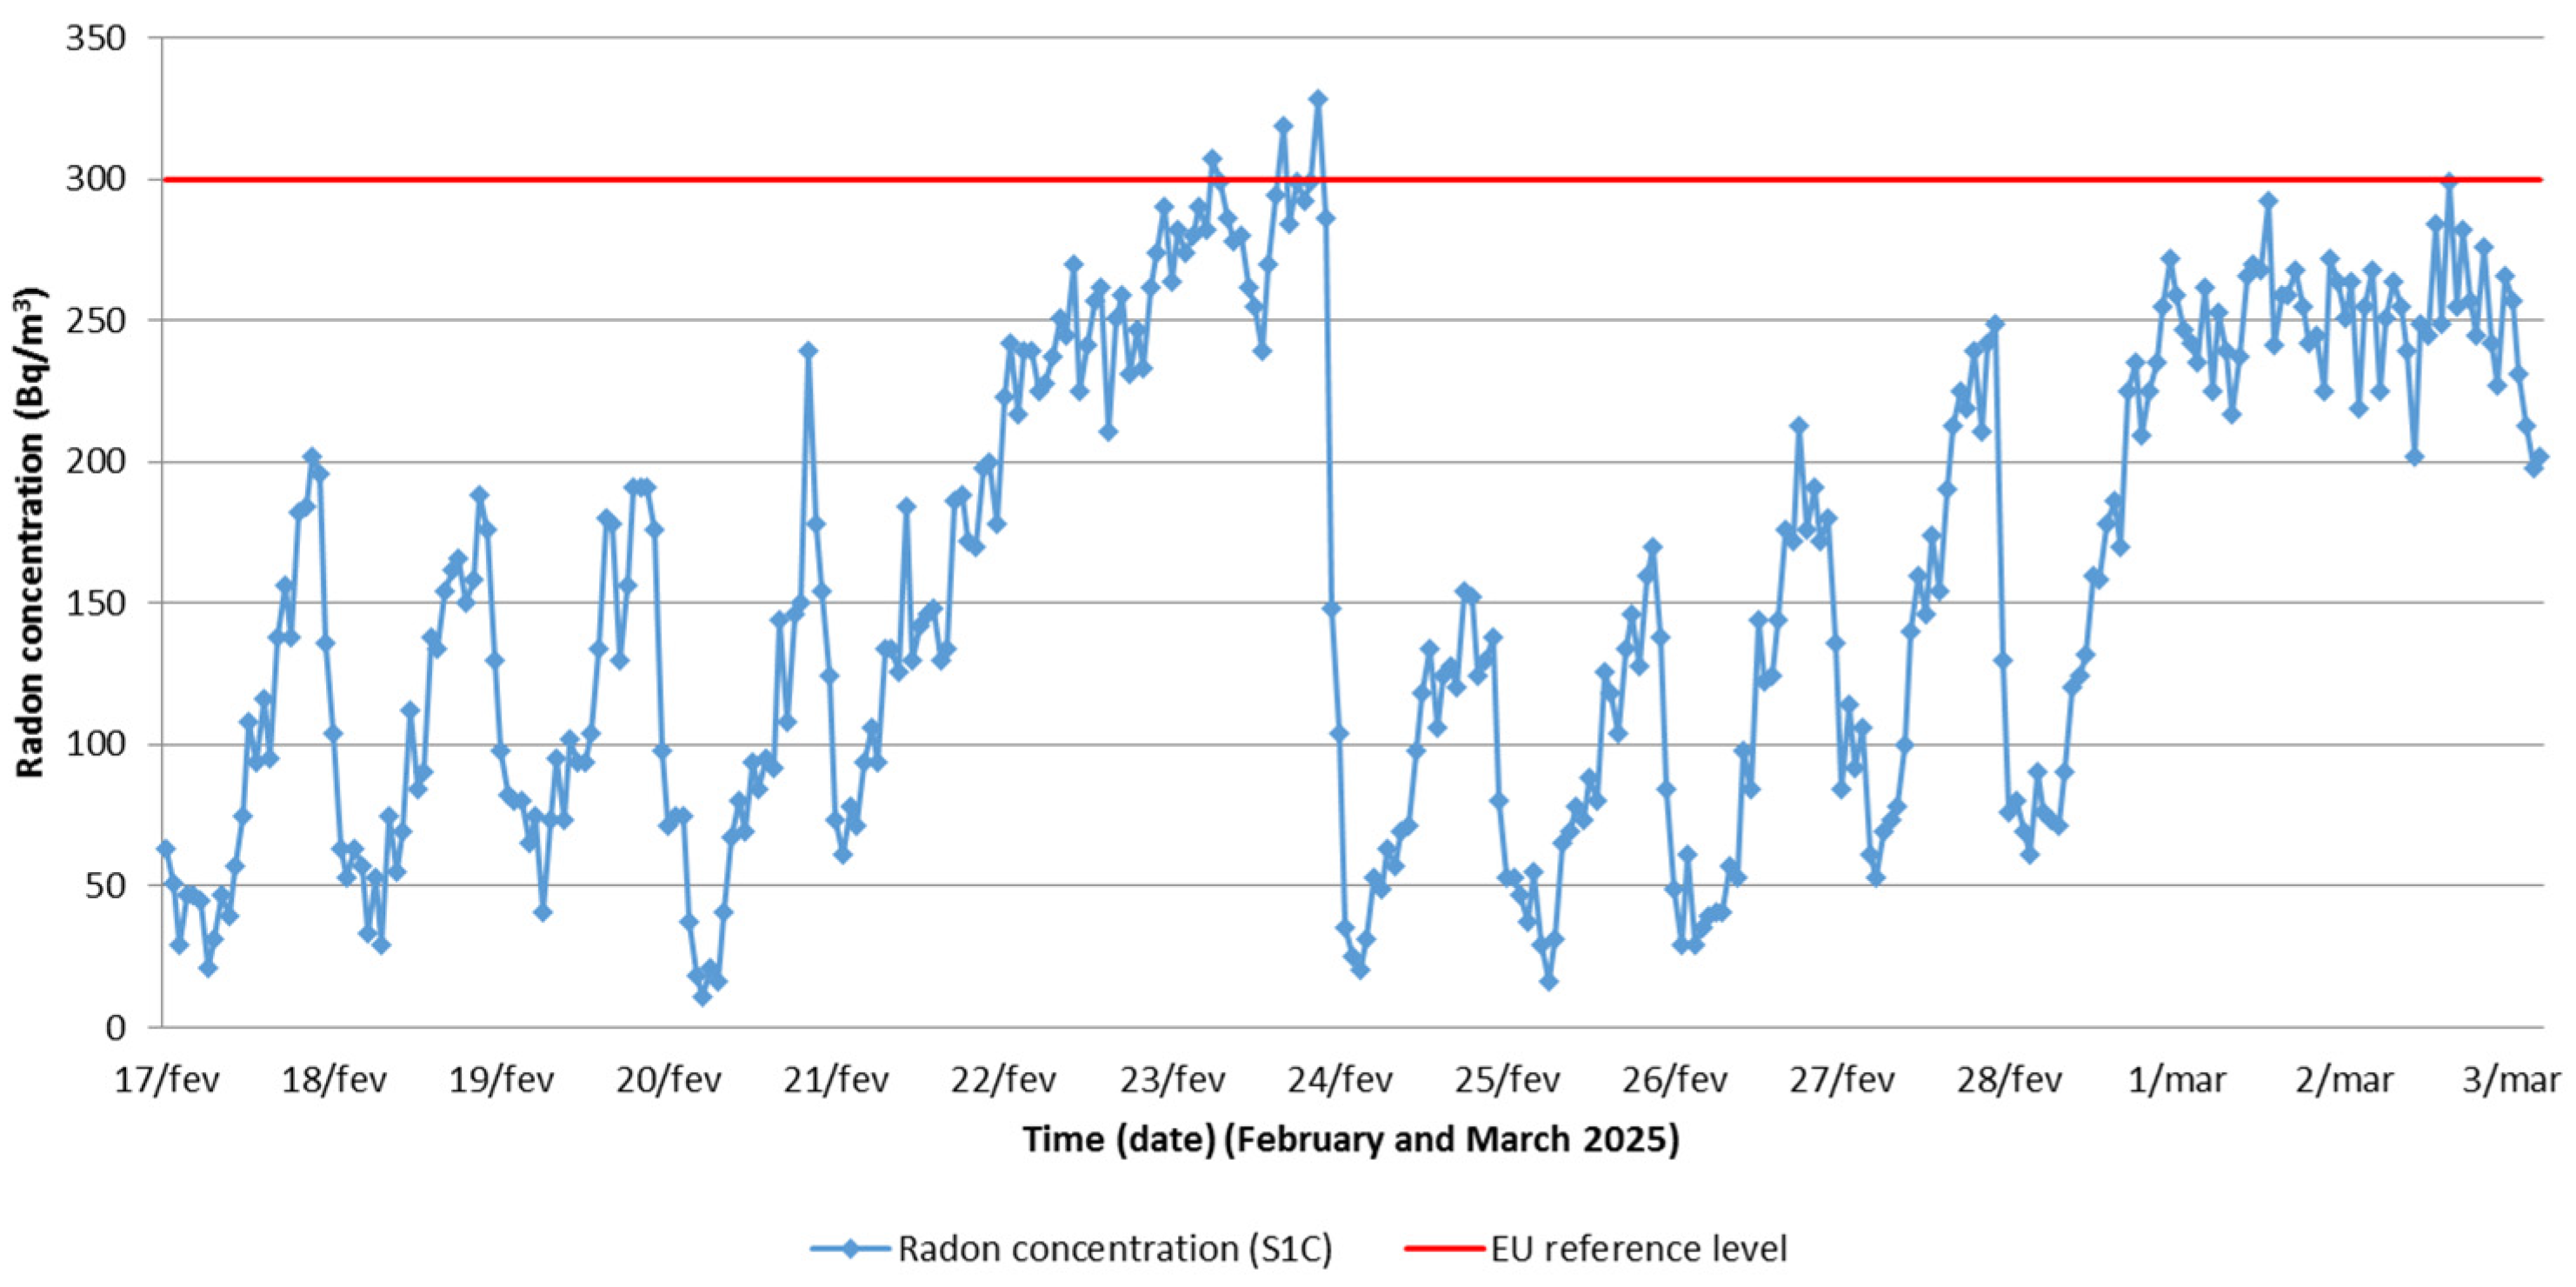
In room C (computer laboratory) (Figure 4), a marked temporal variation in radon concentration was also observed. Recorded values were predominantly between 50 and 250 Bq/m3, with occasional approaches to and exceedances of the 300 Bq/m3 reference level, reaching a maximum of approximately 320 Bq/m3. As in the other rooms, concentrations tended to be lower during occupancy periods, possibly due to natural ventilation and frequent door opening. Conversely, during periods of reduced use, particularly at the end of the day and on weekends, radon levels increased progressively. A gradual and sustained rise occurred during the first week, culminating in values close to 300 Bq/m3 on Sunday, followed by an abrupt decline to below 50 Bq/m3 at the beginning of the following week, consistent with the resumption of ventilation. During the second week, the pattern remained oscillatory, although maximum values were lower than those recorded previously.
Figure 4.
Hourly radon concentration in room S1C over the monitoring period. The dashed line indicates the EU reference level (300 Bq/m3).
Overall, although most radon concentrations remained below the 300 Bq/m3 reference level, the observed exceedances and the accumulation trend during non-occupancy periods highlight the decisive role of ventilation conditions in radon dynamics across the different spaces. These findings underscore the importance of continuous monitoring and the implementation of appropriate indoor air renewal strategies.
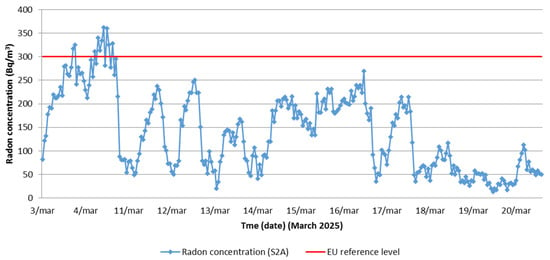
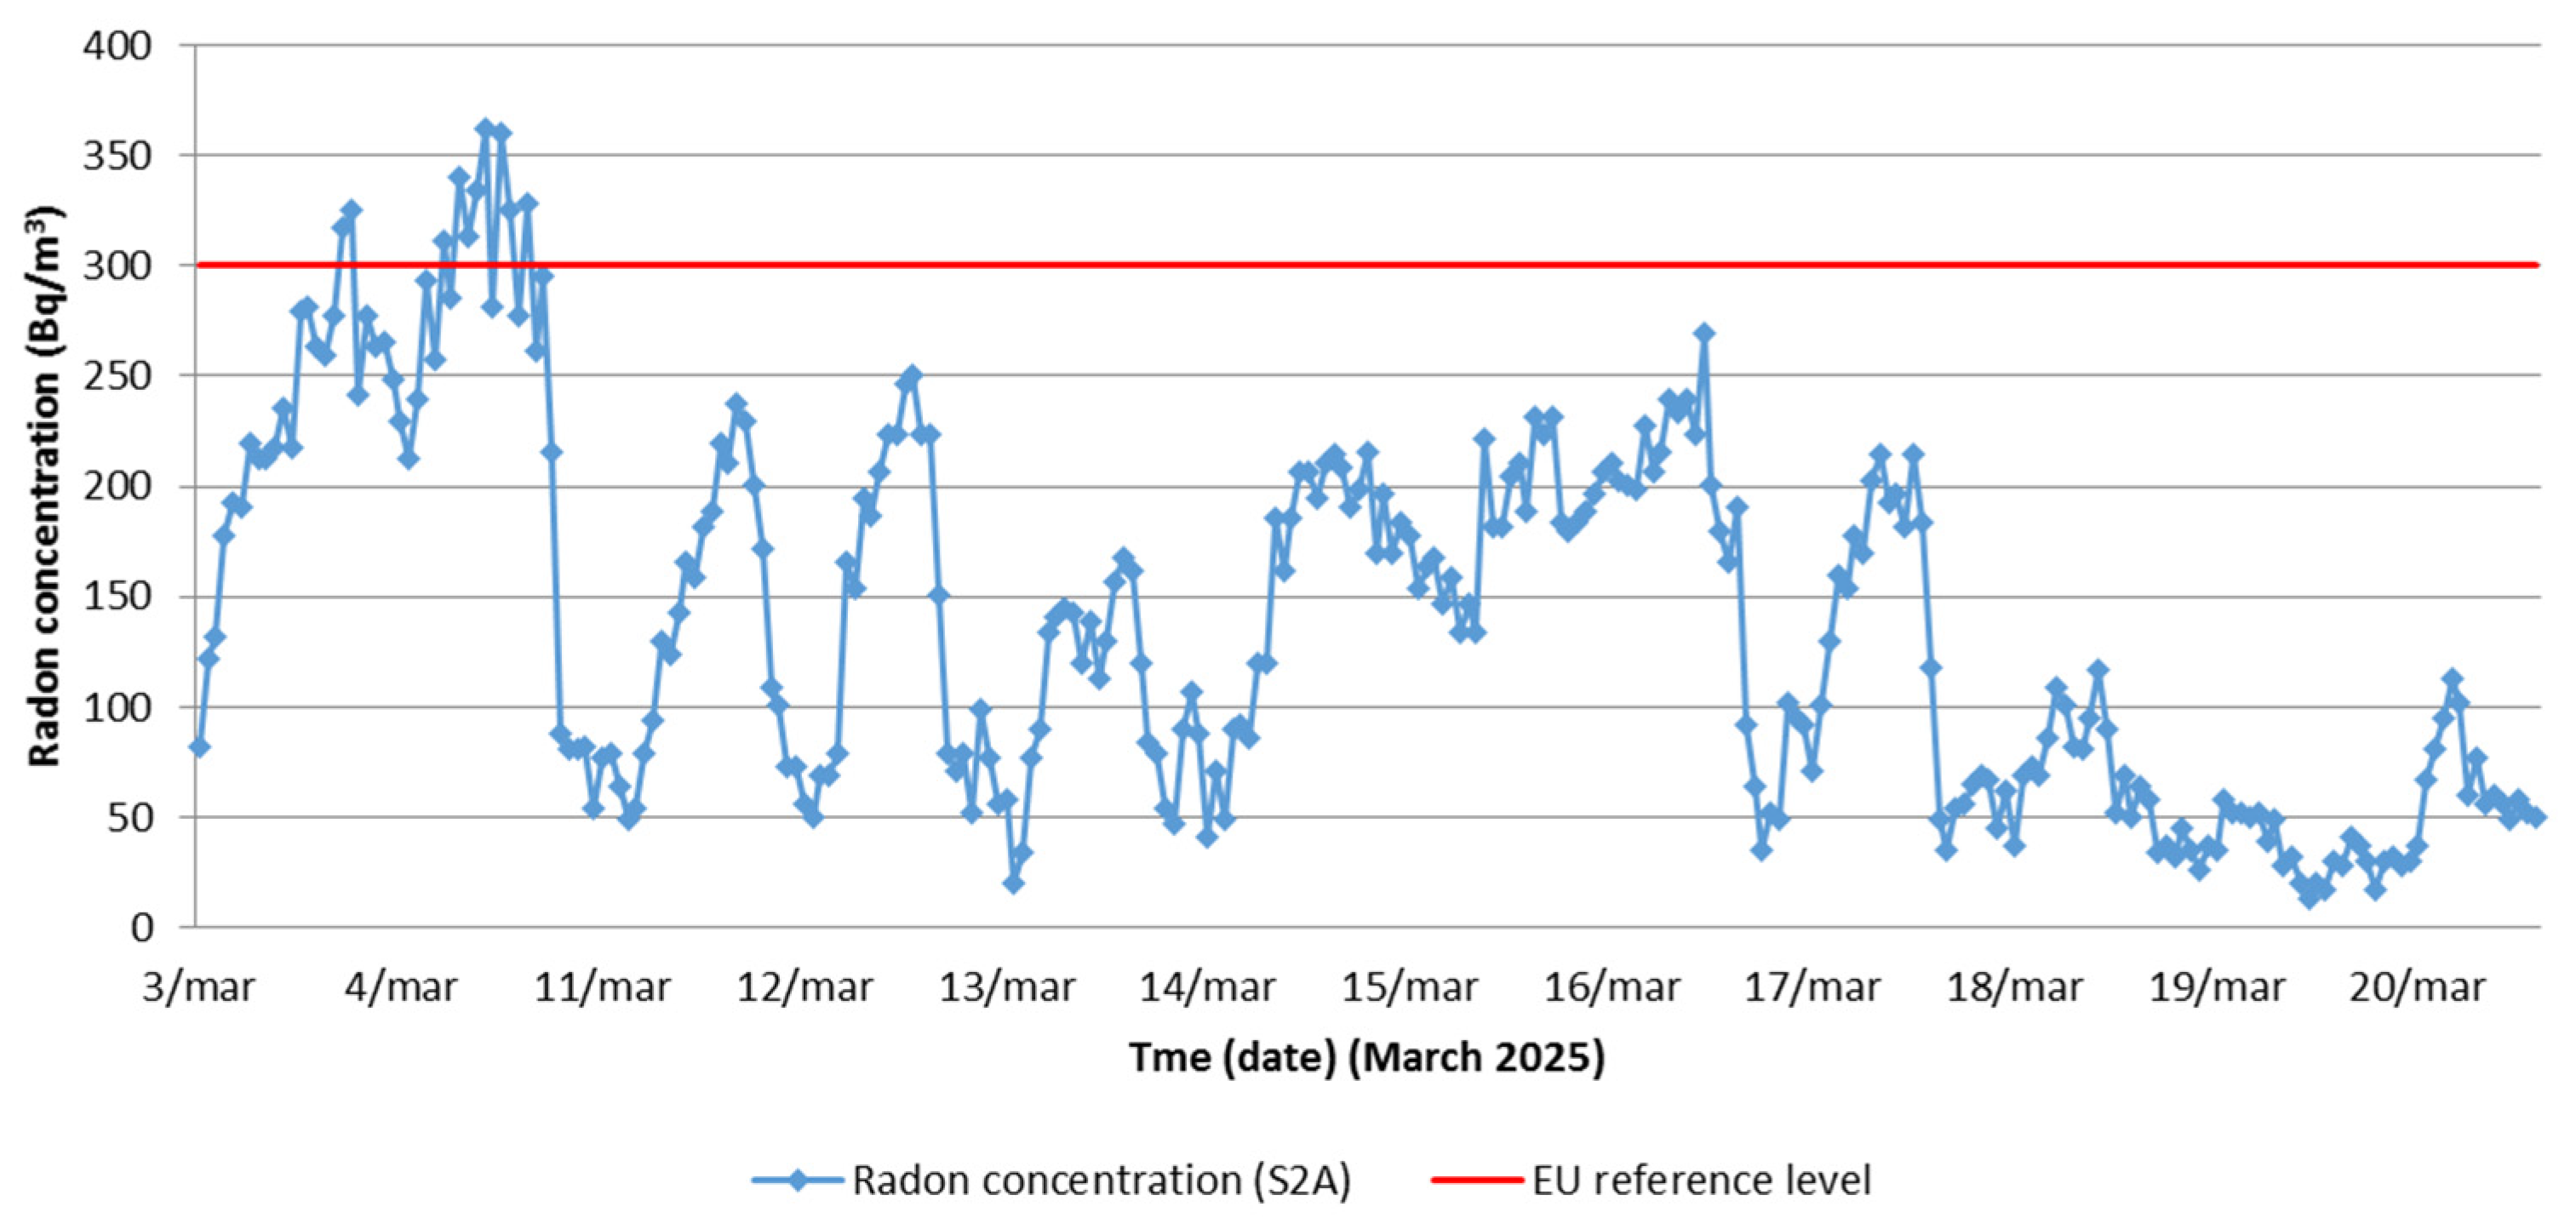
In School 2, room A (classroom) (Figure 5), radon concentrations ranged from 200 to 350 Bq/m3 during the first two days of monitoring. Subsequently, due to a power outage, measurements were unavailable for six consecutive days (5 March, Wednesday, to 10 March, Monday), representing approximately 40% of the 15-day monitoring campaign at School S2. Monitoring resumed on 11 March at 09:45. Although this temporary data gap slightly limits the continuity of the time series, the available dataset still allows for a robust characterization of radon concentration patterns during the monitoring period, including relevant diurnal and weekly variability.
Figure 5.
Hourly radon concentration in room S12A over the monitoring period. The dashed line indicates the EU reference level (300 Bq/m3).
Following the restoration of the monitoring system, a cyclical pattern in radon concentrations was observed, characterized by higher values during nighttime and at weekends, coinciding with periods when the school was closed and, consequently, with reduced ventilation and absence of occupancy. Overall, most recorded values remained below the reference level of 300 Bq/m3, although occasional higher readings were observed in this school.
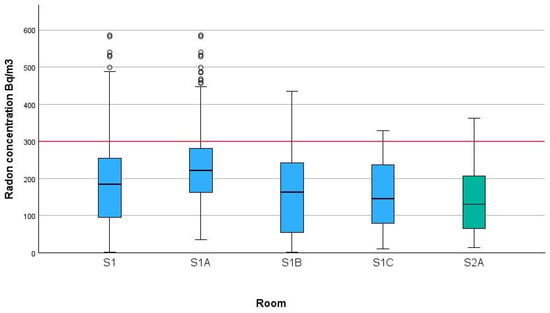
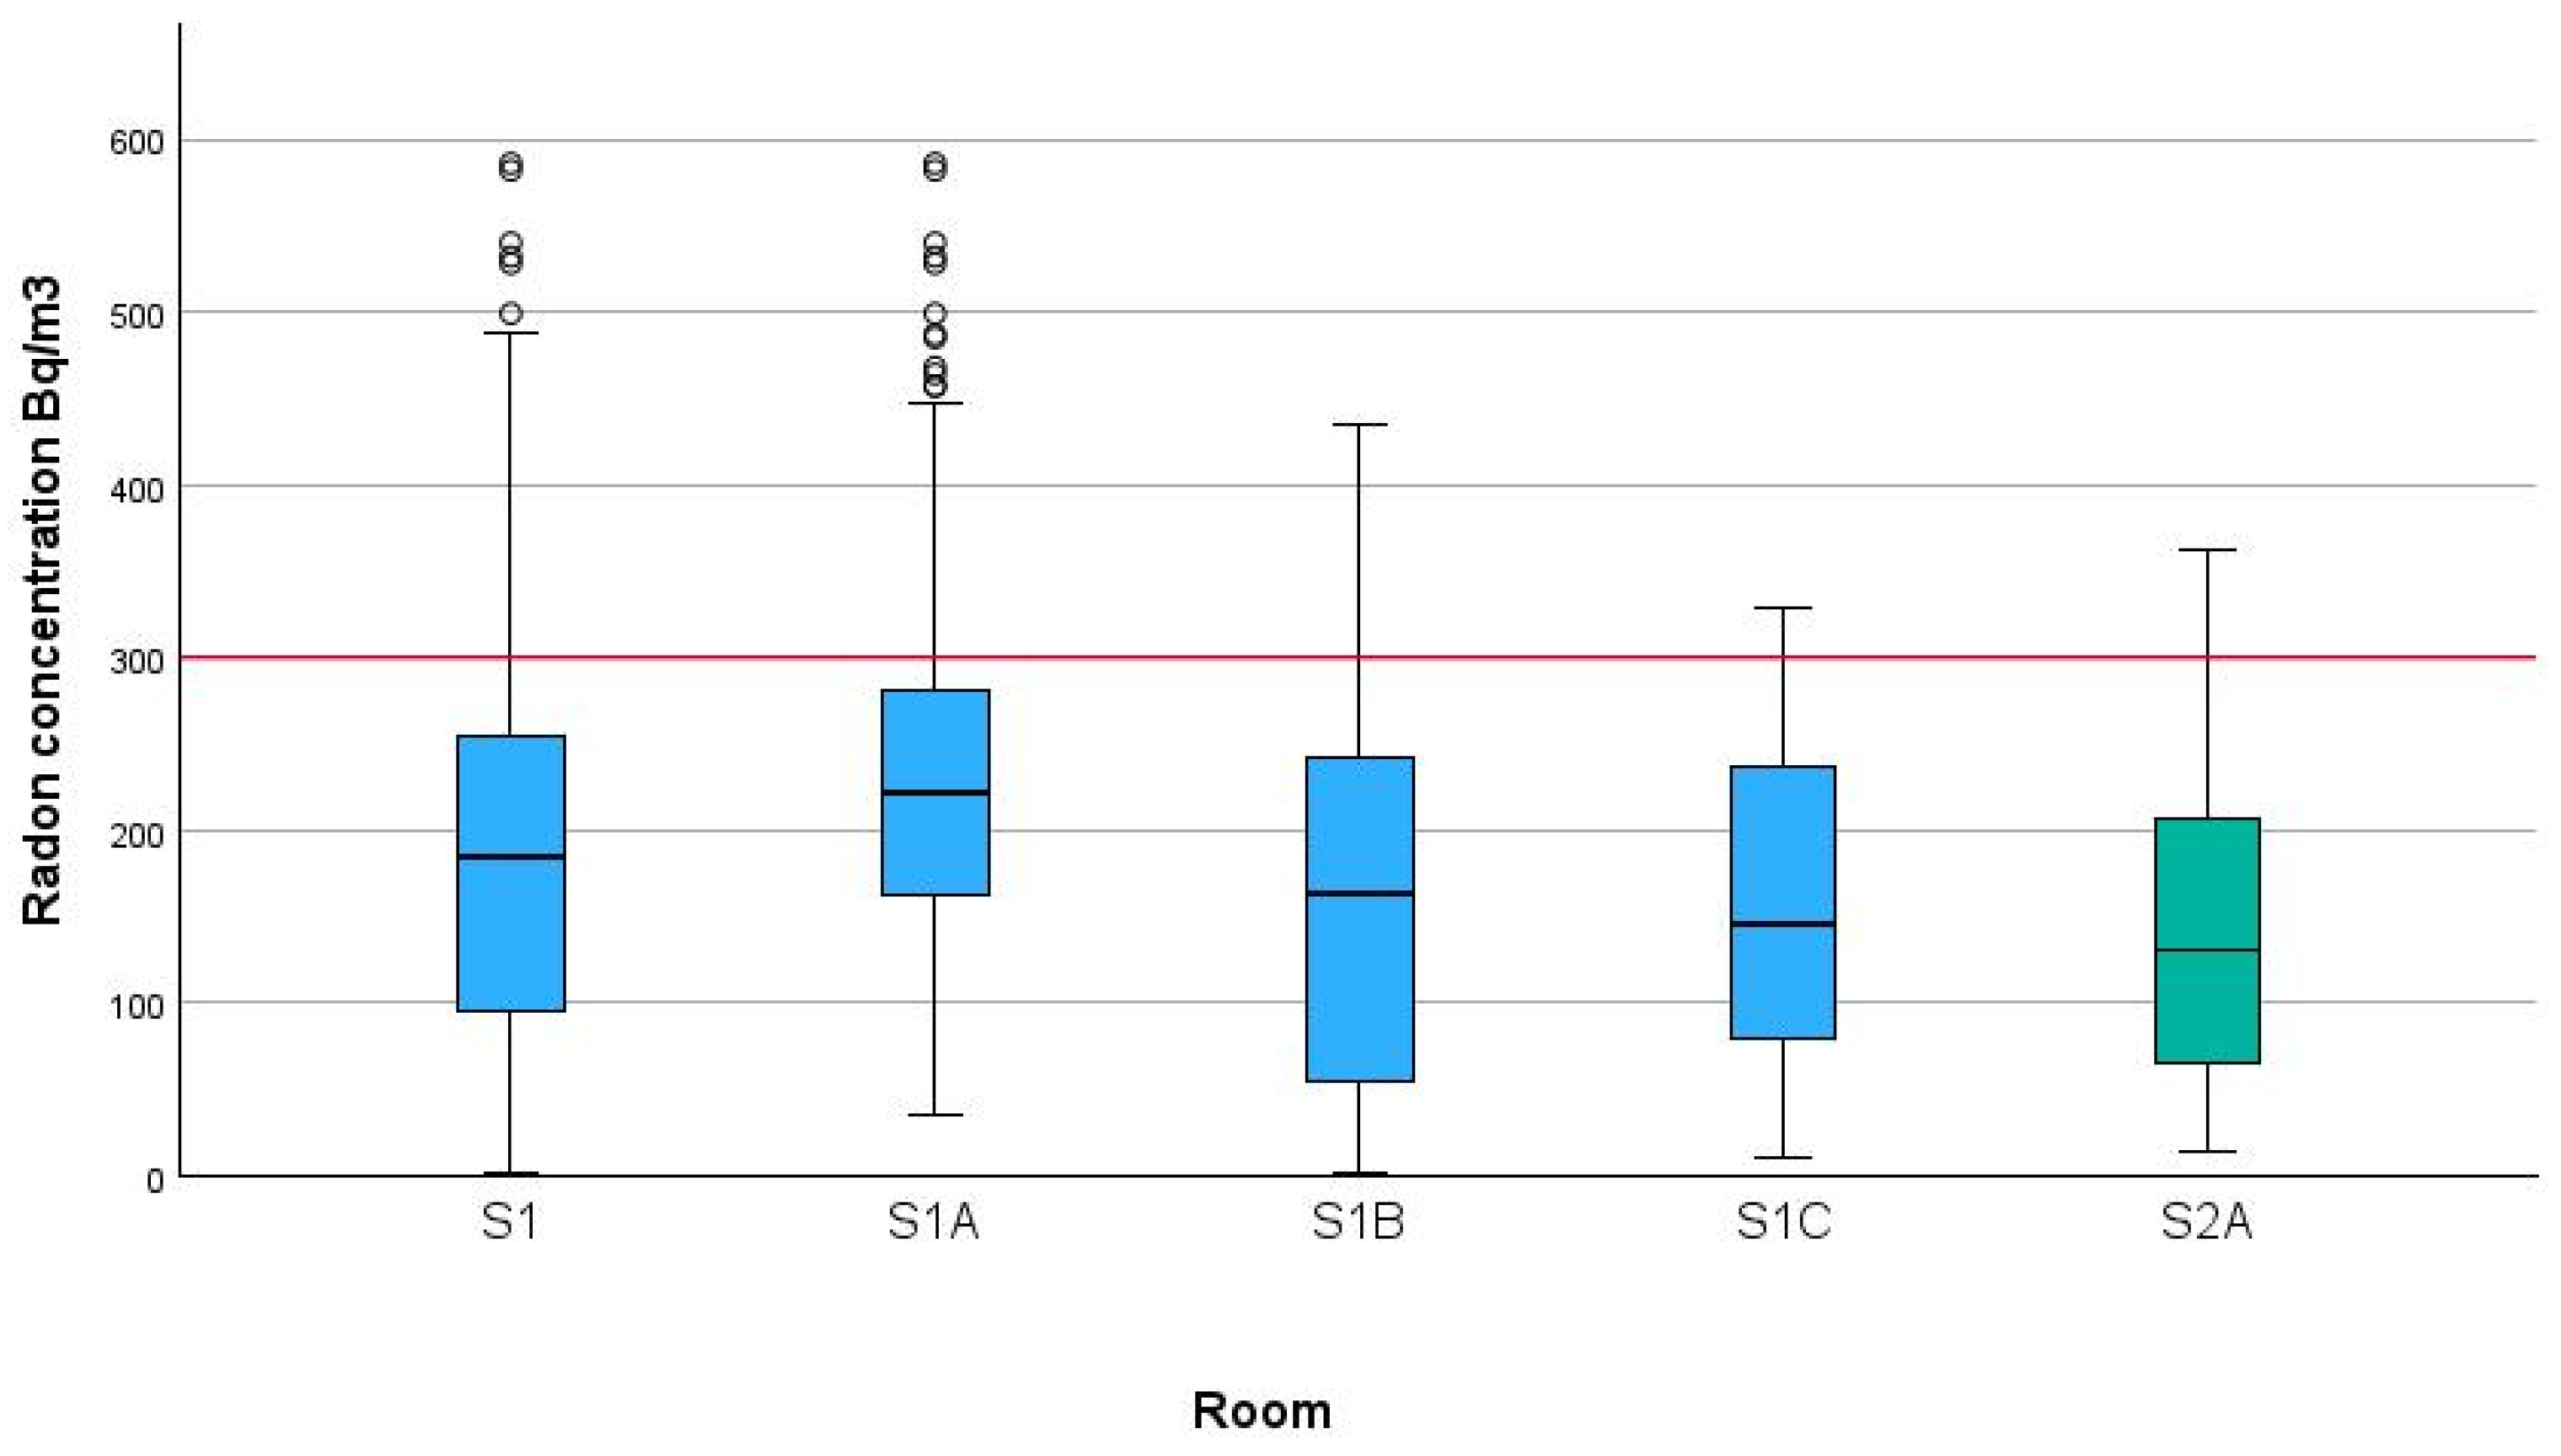
The analysis of radon concentrations between the two schools indicates that school S1 has higher average radon levels (≈185 Bq/m3) than school S2 (≈140 Bq/m3), suggesting that students and staff at S1 are potentially exposed to higher radon levels. Furthermore, when evaluating the different spaces in school S1, it is observed that S1A has the highest median (≈225 Bq/m3) and the most extreme maximum values, including multiple outliers above 500 Bq/m3, indicating high variability in exposure within that space. On the other hand, rooms S1B and S1C have lower medians (≈165 Bq/m3 and ≈150 Bq/m3, respectively), with a relatively wide interquartile range, suggesting moderate variation in radon levels. These results highlight the importance of considering not only the school but also the heterogeneity of radon concentrations across different indoor environments to guide more precise mitigation strategies (Figure 6).
Figure 6.
Boxplots of indoor radon concentration by room type. The horizontal line inside each box represents the median; the box limits correspond to the 25th and 75th percentiles (interquartile range, IQR); whiskers represent the non-outlier range; circles indicate outliers. The red horizontal line indicates the reference level of 300 Bq/m3.
3.1.2. Passive Detectors
The concentration of radon in indoor air was evaluated using CR-39 passive detectors placed at the same locations previously monitored with active detectors during the winter period (Table 3).
Table 3.
Radon concentration levels (Bq/m3) measured in the different rooms of the schools under study (CR-39 detectors).
The results showed marked variation between the two schools, with radon average concentrations of 290 and 300 Bq/m3 in School S1 and 84 Bq/m3 in School S2. Although the measured concentrations did not exceed the reference level, values near 300 Bq/m3 warrant attention and support the need for a longer-term assessment [21]. In room C of School S1, the maximum concentration reached 300 Bq/m3.
The differences observed between the monitored spaces may be related to the buildings’ construction characteristics, ventilation conditions, and other factors, such as the presence of gaps in contact with the ground—factors recognized as key determinants of radon accumulation in indoor environments.
4. Discussion
This study provides insight into indoor radon behaviour in school buildings by combining continuous active monitoring with integrated passive measurements in the same rooms. This approach enabled assessment not only of average concentration levels but also of short-term temporal dynamics, which are highly relevant for indoor air quality management. The results show clear spatial differences between schools and between rooms within the same school, indicating that a combination of geological setting, building characteristics, and day-to-day ventilation conditions controls radon accumulation.
The passive radon concentration values reported in Table 2 correspond to integrated measurements obtained from an accredited laboratory. The associated uncertainty is evaluated in accordance with DIN ISO 11665-4 [26]. Although not explicitly reported, passive radon measurements of this type typically provide an expanded uncertainty (k = 2) of 10–30%, depending on detector performance and exposure conditions. When considering this information, the results should be interpreted with practical considerations in mind, particularly for values close to the reference level of 300 Bq/m3. This is the case of the concentrations measured in rooms S1A (290 Bq/m3), S1B (290 Bq/m3), and S1C (300 Bq/m3), whose measurement uncertainties may fall within a range that could influence compliance assessment. Therefore, when uncertainty is considered, these values may lie either below or above the reference threshold, preventing an unambiguous classification of these rooms as compliant or non-compliant. Nevertheless, the reference level of 300 Bq/m3 refers to the annual average, but the measured radon levels are representative only of the specified measurement period. Therefore, the legally specified one-year measurement period must be satisfied by several consecutive individual measurements.
School S1 consistently showed higher radon concentrations than School S2 in both the active and passive monitoring campaigns, and some rooms in S1 approached or exceeded the reference level of 300 Bq/m3. These findings are in line with ranges reported in previous studies conducted in the Galicia–northern Portugal radon-prone region, where it was reported indoor radon concentrations ranging from 3 to 3039 Bq/m3, with median, geometric mean, and arithmetic mean values of 181, 185, and 332 Bq/m3, respectively [23]. Notably, nearly one-third of the monitored locations exceeded the European reference level of 300 Bq/m3, and approximately 75% exceeded 100 Bq/m3, a level recommended by the World Health Organization as a reference for public health action.
In this context, the concentrations observed in School S1—particularly the passive values of 290–300 Bq/m3—are substantially higher than the regional median and close to the arithmetic mean reported for the Euroregion, placing them within the upper range of the regional distribution. These findings indicate that, while not exceptional, the radon levels measured in S1 are representative of elevated exposure conditions previously identified in radon-prone areas and are of potential public health concern, especially given the absence of a safe threshold for radon exposure. In this context, the present findings reinforce that even within the same parish, buildings may exhibit markedly different indoor radon behaviour, underlining the importance of room-specific assessment rather than assuming uniform exposure across a school or municipality.
The higher concentrations observed in certain rooms are likely related to direct ground contact, reduced air exchange, and structural pathways that facilitate radon entry and retention indoors. Differences in room use may also have contributed. Libraries, classrooms, and computer rooms can exhibit distinct occupancy patterns, door-opening frequencies, and ventilation practices, which, in turn, influence indoor radon dilution.
The continuous measurements obtained with the active detectors revealed a consistent temporal structure across the monitored spaces. Radon concentrations generally declined during school hours and increased during the evening, overnight, and at weekends, when air exchange was presumably reduced. This recurrent cycle strongly suggests that natural ventilation associated with daily occupancy plays a central role in controlling indoor radon concentrations in these buildings, a finding consistent with previous studies on indoor environmental quality in schools that highlight the influence of ventilation and occupancy patterns on pollutant dynamics [25]. From an indoor air quality perspective, these findings are important because they show that exposure conditions cannot be fully understood from a single short measurement or from daily averages alone; hourly variation may be substantial, and temporary exceedances of the reference level can occur even when average concentrations remain lower.
Among the monitored rooms, the library (S1A) showed the highest average concentration and the most pronounced peaks, reaching values close to 600 Bq/m3. This behaviour suggests that the room may combine several unfavourable conditions for radon control, such as lower ventilation efficiency, longer periods of closure, or construction features that increase radon entry from the ground. The marked weekend build-up, followed by sharp decreases after school reopening, further supports the interpretation that ventilation and occupancy schedules strongly influence the room’s radon dynamics.
By contrast, rooms S1B and S1C had lower average concentrations but still exhibited intermittent exceedances or near-exceedances of the 300 Bq/m3 threshold. This within-school heterogeneity is an important practical finding, as it indicates that one or two measurements at the building level may fail to identify the most relevant exposure hotspots. Similar spatial variability has been reported previously in Portuguese school settings [9,24]. Therefore, radon screening strategies in educational buildings should prioritize ground-floor rooms and consider the functional characteristics of each space rather than relying solely on school-wide averages.
The passive CR-39 measurements are qualitatively consistent with the active-monitoring results, confirming higher radon concentrations in School S1 than in School S2. However, the two datasets show a noticeable quantitative difference. Active monitoring in School S1 (12 February–3 March 2025) yielded mean concentrations of approximately 155–228 Bq/m3, whereas passive detectors deployed in the same rooms recorded values of 290–300 Bq/m3 over an extended period (30 October 2025–31 January 2026).
The differences between the datasets are largely attributable to the different monitoring periods. Passive sampling integrated radon concentrations over autumn and winter, likely capturing longer intervals of lower outdoor temperatures and reduced natural ventilation than the late-winter active campaign. In addition, passive detectors continuously capture nocturnal and weekend accumulation, whereas active-monitoring averages are more influenced by occupied periods and associated ventilation. Although both detector types were placed in the same rooms, changes in occupancy, ventilation behaviour, and environmental conditions over time add uncertainty to comparisons between datasets collected during non-overlapping periods.
Therefore, the two methods should not be regarded as quantitatively interchangeable. Instead, they offer complementary but distinct insights: active monitoring captures short-term variability and ventilation-driven dynamics, whereas passive monitoring provides time-integrated estimates that are more relevant for long-term exposure assessment and regulatory evaluation. This difference highlights the need to consider both methodology and monitoring period when interpreting radon data from different measurement approaches [6,13].
Although most measured values remained below the reference level, as also reported in studies from other European school settings [7], the presence of rooms with concentrations close to or temporarily above 300 Bq/m3 remains relevant from both exposure-assessment and indoor air quality perspectives. In schools, repeated occupancy of the same rooms by children and staff means that even moderate average concentrations deserve attention, especially when associated with regular peaks during low-ventilation periods [13]. Because radon is a well-established carcinogenic exposure, preventive action is justified even when exceedances are intermittent rather than persistent [20,25]. In radon-prone areas, school buildings should therefore be considered priority environments for surveillance, particularly where ground-floor rooms are occupied for prolonged periods.
Practical measures should extend beyond a general ventilation review and may include evidence-based actions such as increasing the frequency and duration of natural ventilation, introducing mechanical systems, such as positive-input ventilation, where appropriate, and, when needed, applying structural mitigation measures, such as sub-slab depressurization, to reduce radon ingress. Rooms with persistently elevated concentrations should be prioritized for repeated assessment and building-specific mitigation measures.
This study is relevant to indoor air quality management in educational buildings and identifies areas for further research. The number of schools and monitored rooms was limited, and the active and passive campaigns were conducted at different times (winter 2025 and autumn–winter 2025–2026), which should be considered when making direct quantitative comparisons between the two approaches. In addition, ventilation rates and building airtightness were not measured, so the mechanisms underlying radon variability warrant further investigation.
The relatively narrow temperature range (14–21 °C) and moderate variation in relative humidity (40–70%) indicate generally stable indoor conditions. This suggests that these variables were not the main drivers of radon variability in the monitored rooms. Instead, the observed radon fluctuations were more likely associated with changes in ventilation and occupancy patterns, with temperature and humidity acting only as indirect indicators of these processes.
This study was not intended to provide a comprehensive characterization of radon dynamics or transport processes in school buildings, but rather to assess indoor radon concentrations and their temporal variability under real operating conditions. Even so, the consistency of the observed temporal patterns and the agreement in identifying higher-exposure environments support the main interpretation that room-specific conditions and ventilation practices strongly influence radon concentrations in schools. These findings reinforce the value of targeted monitoring programmes in radon-prone areas and suggest that improved ventilation management and follow-up assessment of higher-risk rooms can help reduce exposure and improve indoor air quality.
Further work incorporating detailed ventilation measurements and quantitative correlation analysis would help clarify the relative influence of microclimatic parameters on indoor radon behaviour.
5. Conclusions
This study showed that indoor radon concentrations in school buildings can vary substantially both between schools and among rooms within the same school, reflecting the combined influence of local geology, building characteristics, and ventilation conditions. The continuous active measurements demonstrated clear daily and weekend accumulation patterns, while the passive measurements confirmed differences in longer-term average exposure. Together, these findings indicate that radon in schools should be addressed as an indoor air quality issue shaped by both geogenic potential and building occupancy and ventilation.
The combined use of active and passive monitoring proved especially useful for assessing school environments, as it captured both short-term temporal variability and integrated longer-term concentrations. However, a key limitation of this study is that the monitoring phases were not conducted concurrently (active: winter 2025; passive: autumn–winter 2025–2026), which constrains direct quantitative comparison between methods and should be considered when interpreting the results.
Although most values remained below the reference level of 300 Bq m−3, the identification of rooms that approached or temporarily exceeded this threshold underscores the need for room-specific surveillance, particularly in radon-prone regions and in ground-floor spaces used for prolonged periods. Overall, the results support the implementation of targeted radon monitoring programmes and practical, ventilation-oriented management strategies in educational buildings. Follow-up assessment of higher-risk rooms and, where necessary, building-specific mitigation measures may help reduce exposure and improve indoor air quality for students and school staff.
The monitoring protocol applied in this study, combining active and passive techniques, also demonstrates potential for scalability and systematic application to other schools in the region. Its broader implementation could support more comprehensive regional assessments of indoor radon exposure in educational environments and inform public health and regulatory decision-making.
Future work may include applying the methodology developed in this study to additional schools in the same region, enabling a broader assessment of indoor radon exposure in educational environments.
Author Contributions
Conceptualization, A.S.S. and M.d.L.D.; methodology, A.S.S. and M.d.L.D.; validation, A.S.S. and M.d.L.D.; formal analysis, A.S.S.; investigation, M.d.L.D.; resources, M.d.L.D.; writing—original draft preparation, A.S.S.; writing—review and editing, M.d.L.D.; funding acquisition, M.d.L.D. All authors have read and agreed to the published version of the manuscript.
Funding
This work was developed at the R&D Unit CERENA, supported by the FCT Project UID/04028/2025 (https://doi.org/10.54499/UID/04028/2025).
Data Availability Statement
The original contributions presented in this study are included in the article.
Conflicts of Interest
The authors declare no conflicts of interest.
References
- United Nations Scientific Committee on the Effects of Atomic Radiation (UNSCEAR). Sources and Effects of Ionizing Radiation: UNSCEAR 2000 Report to the General Assembly, with Scientific Annexes, Annex B: Exposures from Natural Radiation Sources; United Nations: New York, NY, USA, 2000. [Google Scholar]
- World Health Organization (WHO). WHO Handbook on Indoor Radon: A Public Health Perspective; World Health Organization: Geneva, Switzerland, 2009. [Google Scholar]
- Mozzoni, P.; Pinelli, S.; Corradi, M.; Ranzieri, S.; Grolla, A.A.; Pala, M.; Toma, M.; Turci, F.; Cavallo, D.; Goldoni, M.; et al. Environmental and biological monitoring of radon exposure among non-smoking residents in a rural area of Northern Italy. Int. J. Environ. Res. Public Health 2019, 16, 3003. [Google Scholar]
- Bochicchio, F.; Žunić, Z.S.; Carpentieri, C.; Antignani, S.; Venoso, G.; Carelli, V.; Cordeddu, V.; Veschetti, M.; Viotti, P.; Risica, S. Radon in indoor air of primary schools: A systematic survey to evaluate factors affecting radon concentration levels and their variability. Indoor Air 2014, 24, 315–326. [Google Scholar] [PubMed]
- Friedmann, H.; Baumgartner, A.; Gruber, V.; Kaineder, H.; Maringer, F.J.; Ringer, W.; Seidel, C. The uncertainty in the radon hazard classification of areas as a function of the number of measurements. J. Environ. Radioact. 2017, 173, 6–10. [Google Scholar] [CrossRef] [Scilit] [PubMed]
- Ma, X.; Su, C.; Zhu, Z.; Zou, Z.; Dai, W.; Sun, C.; Wang, H. Assessing indoor radon concentration: Field study from a university campus in Shanghai. Build. Environ. 2025, 278, 112998. [Google Scholar] [CrossRef] [Scilit]
- Sofuoglu, S.C.; Ari, A.; Civan, M.; Dumanoglu, Y.; Gullu, G.; Mentese, S.; Onat, B.; Şahin, U.A.; Toksoy, M. A proposal of indoor air pollutant limit values for Turkish schools based on a literature review of emission sources, concentrations, health effects, and limits/guidelines. Atmos. Pollut. Res. 2026, 17, 102743. [Google Scholar] [CrossRef] [Scilit]
- Salonen, H.; Salthammer, T.; Alapieti, T.; Shirazi, A.; Mikkola, R.; Morawska, L. Indoor radon concentrations in European kindergartens and other educational facilities. Environ. Int. 2025, 205, 109877. [Google Scholar] [CrossRef] [Scilit] [PubMed]
- Ekren, O.; Karadeniz, Z.H.; Atmaca, I.; Ugranli-Cicek, T.; Sofuoglu, S.C.; Toksoy, M. Assessment and improvement of indoor environmental quality in a primary school. Sci. Technol. Built Environ. 2017, 23, 391–402. [Google Scholar] [CrossRef] [Scilit]
- Damla, N.; Aldemir, K. Radon survey and soil gamma doses in primary schools of Batman, Turkey. Isot. Environ. Health Stud. 2014, 50, 226–234. [Google Scholar] [CrossRef] [Scilit] [PubMed]
- Zhukovsky, M.; Vasilyev, A.; Onishchenko, A.; Yarmoshenko, I. Review of indoor radon concentrations in schools and kindergartens. Radiat. Prot. Dosim. 2018, 181, 6–10. [Google Scholar] [CrossRef] [Scilit]
- Cucoș, A.; Dicu, T.; Moldovan, M.; Dobrei, G.; Țenter, A.; Florică, Ș.; Lupulescu, A.; Maloș, C.; Papp, B.; Hening, K.; et al. A comparative analysis of indoor radon activity concentrations in houses and educational institutions. Heliyon 2025, 11, e42659. [Google Scholar] [CrossRef] [Scilit] [PubMed]
- Loffredo, F.; Opoku-Ntim, I.; Meo, G.; Quarto, M. Indoor radon monitoring in kindergarten and primary schools in South Italy. Atmosphere 2022, 13, 478. [Google Scholar] [CrossRef] [Scilit]
- Azara, A.; Dettori, M.; Castiglia, P.; Piana, A.; Durando, P.; Parodi, V.; Salis, G.; Saderi, L.; Sotgiu, G. Indoor radon exposure in Italian schools. Int. J. Environ. Res. Public Health 2018, 15, 749. [Google Scholar] [CrossRef] [Scilit] [PubMed]
- Liu, Y.; Xu, Y.; Xu, W.; He, Z.; Fu, C.; Du, F. Radon and lung cancer: Current status and future prospects. Crit. Rev. Oncol. Hematol. 2024, 198, 104363. [Google Scholar] [CrossRef] [Scilit] [PubMed]
- Maier, A.; Wiedemann, J.; Rapp, F.; Papenfuss, F.; Rodel, F.; Hehlgans, S.; Gaipl, U.S.; Frey, B. Radon exposure—Therapeutic effect and cancer risk. Int. J. Mol. Sci. 2021, 22, 316. [Google Scholar]
- Lorenzo-González, M.; Ruano-Ravina, A.; Torres-Durán, M.; Kelsey, K.T.; Provencio, M.; Parente-Lamelas, I.; Leiro-Fernández, V.; Vidal-García, I.; Castro-Añón, O.; Martínez, C.; et al. Lung cancer and residential radon in never-smokers: A pooling study in the Northwest of Spain. Environ. Res. 2019, 172, 713–718. [Google Scholar] [CrossRef] [Scilit] [PubMed]
- Torres-Durán, M.; Barros-Dios, J.M.; Fernández-Villar, A.; Ruano-Ravina, A. Residential radon and lung cancer in never smokers: A systematic review. Cancer Lett. 2014, 345, 21–26. [Google Scholar] [CrossRef] [Scilit] [PubMed]
- Darby, S.; Hill, D.; Deo, H.; Auvinen, A.; Barros-Dios, J.M.; Baysson, H.; Bochicchio, F.; Falk, R.; Farchi, S.; Figueiras, A.; et al. Residential radon and lung cancer—Detailed results of a collaborative analysis of individual data on 7,148 persons with lung cancer and 14,208 persons without lung cancer from 13 epidemiologic studies in Europe. Scand. J. Work Environ. Health 2006, 32, 1–84. [Google Scholar] [PubMed]
- International Agency for Research on Cancer (IARC). IARC Monographs on the Evaluation of Carcinogenic Risks to Humans, Volume 100 D, Radiation; IARC: Lyon, France, 2012. [Google Scholar]
- Council of the European Union. Council Directive 2013/59/Euratom of 5 December 2013 laying down basic safety standards for protection against the dangers arising from exposure to ionizing radiation, and repealing Directives 89/618/Euratom, 90/641/Euratom, 96/29/Euratom, 97/43/Euratom and 2003/122/Euratom. Off. J. Eur. Union L 2014, 13, 1–73. [Google Scholar]
- Portuguese Environment Agency (APA). Radon Susceptibility Map for Mainland Portugal. Agência Portuguesa do Ambiente. 2026. Available online: https://apambiente.pt (accessed on 15 April 2026).
- Branco, P.B.S.; Martin-Gisbert, L.; Sá, J.P.; Ruano-Raviña, A.; Barros-Dios, J.; Varela-Lema, L.; Sousa, S.I. Quantifying indoor radon levels and determinants in schools: A case study in the radon-prone area Galicia–Norte de Portugal Euroregion. Sci. Total Environ. 2023, 882, 163566. [Google Scholar] [CrossRef] [Scilit] [PubMed]
- Sousa, S.I.V.; Branco, P.T.B.S.; Nunes, R.A.O.; Alvim-Ferraz, M.C.M.; Martins, F.G. Radon levels in nurseries and primary schools in Bragança District: Preliminary assessment. J. Toxicol. Environ. Health A 2015, 78, 805–813. [Google Scholar] [CrossRef] [Scilit] [PubMed]
- Vogeltanz-Holm, N.; Schwartz, G.G. Radon and lung cancer: What does the public really know? J. Environ. Radioact. 2018, 192, 26–31. [Google Scholar] [CrossRef] [Scilit] [PubMed]
- International Organization for Standardization (ISO). ISO 11665-4:2012. Measurement of Radioactivity in the Environment—Air: Radon-222—Part 4: Integrated Measurement Method for Determining Average Activity Concentration Using Passive Sampling and Delayed Analysis; ISO: Geneva, Switzerland, 2012. [Google Scholar]

Disclaimer/Publisher’s Note: The statements, opinions and data contained in all publications are solely those of the individual author(s) and contributor(s) and not of MDPI and/or the editor(s). MDPI and/or the editor(s) disclaim responsibility for any injury to people or property resulting from any ideas, methods, instructions or products referred to in the content. |
© 2026 by the authors. Licensee MDPI, Basel, Switzerland. This article is an open access article distributed under the terms and conditions of the Creative Commons Attribution (CC BY) license.