


Abstract
To investigate the influence of complex terrain on precipitation characteristics in the Jinsha River Basin (JRB), this study analyzes the spatiotemporal distribution of precipitation amount, frequency, and intensity under different topographic factors in the middle and lower reaches of the JRB (MLJRB), based on hourly precipitation observations from 1745 ground stations deployed by the China Meteorological Administration. The results indicate the following: (1) Precipitation amount increases gradually from low altitudes, peaks at sub-high altitudes, and then decreases. The highest precipitation frequency occurs at high altitudes, while the greatest precipitation intensity is observed at mid altitudes. (2) Spatially, a high-precipitation center with high frequency and intensity is formed in the lower reaches of the JRB, whereas the northern part of the study area exhibits a low center for both frequency and intensity. (3) Pronounced diurnal and monthly variations are observed at all altitudes. Precipitation amount and intensity peak during nighttime hours. On a monthly scale, both precipitation amount and intensity increase from May to July or August and then decrease, while the trend for precipitation frequency is not entirely consistent. (4) Precipitation amount shows little change with increasing slope gradient. Precipitation frequency increases with slope gradient, whereas precipitation intensity exhibits a clear decreasing trend. Eastern slopes receive higher precipitation amount and frequency compared to other aspects, followed by southern slopes, with western slopes receiving the lowest; however, differences in precipitation intensity among different slope aspects are minimal. In conclusion, the MLJRB exhibits strong spatiotemporal variability, distinct vertical differentiation, and pronounced periodic variation in precipitation. Precipitation frequency and intensity in this region are also associated with micro-topography.
1. Introduction
The Jinsha River is one of the largest rivers in southwestern China [1,2,3]. Originating on the Qinghai–Tibet Plateau, it flows from the Batang River estuary in Yushu, Qinghai Province, to Hejiangmen in Cuiping District, Yibin City, Sichuan Province, and is considered to constitute the upper reaches of the Yangtze River [4]. Thanks to its abundant and stable runoff, significant riverbed elevation drop, and favorable development conditions, the Jinsha River Basin (JRB) has become an important base for hydropower generation in China [5]. Precipitation, as the most active meteorological element in the atmosphere, determines the moisture and thermal conditions of a region [6,7]. Its formation and spatiotemporal distribution are directly influenced by factors such as topographic lifting, flow deflection, and alterations in local atmospheric thermodynamic conditions [8,9,10,11,12]. The Middle and Lower reaches of the Jinsha River Basin (MLJRB) are home to 12 massive hydropower stations, including Wudongde, Baihetan, Xiluodu, and Xiangjiaba [4]. This region spans two distinct climatic zones—the plateau mountain climate zone and the subtropical monsoon climate zone—with complex topography [13], high sensitivity to climate change [12], fragile ecological environments [14], and strong spatiotemporal heterogeneity in hydroclimatic conditions. Therefore, investigating the macro- and micro-scale characteristics of precipitation in different terrains within the JRB, as well as its vertical structure and the influence of topographic factors on precipitation, is of great significance for improving precipitation forecasting, enhancing flood control and effective regulation capabilities, and promoting efficient water resource utilization and disaster prevention and mitigation [15,16,17,18,19].
In recent years, numerous scholars both domestically and internationally have conducted extensive analyses of precipitation characteristics in the JRB. Zeng et al. [20] analyzed long-term precipitation components and the number of typical rainy days in the basin based on daily precipitation data from 1961 to 2010, concluding that annual precipitation in the basin shows a certain increasing trend. Gao et al. [21], using daily precipitation data from the MLJRB from 1961 to 2023, determined—by applying meteorological criteria for the rainy season—that the overall average duration of the rainy season in the basin is 152 days, with an average precipitation amount of 785.2 mm. The long-term trends in the basin’s rainy-season characteristics are not significant, but interdecadal fluctuations are evident. Li et al. [1] utilized daily precipitation data from 56 national meteorological stations in the MLJRB from 2000 to 2012, calculating areal rainfall through arithmetic averaging. They pointed out that the spatial and temporal variations in precipitation in the MLJRB are pronounced; summer sees the highest precipitation, followed by autumn, while winter has the lowest. Moreover, autumn rainfall exceeds spring rainfall, and the period from May to October accounts for 91% of the annual precipitation. Sun et al. [22], using daily precipitation data from 64 meteorological stations in the JRB from 2005 to 2008, analyzed the climatic characteristics of areal rainfall in the basin. The results indicate that the basin’s annual average precipitation is relatively lower than those of the Jialing River, Wujiang River, and the Three Gorges region, and during the rainy season (May to October), precipitation accounts for 90% of the annual total. Zhu et al. [17] found that the frequency of heavy rainfall events has increased, while the frequency of light rainfall events has decreased. Su et al. [23] noted that as extreme precipitation significantly increases, the peak of precipitation in the JRB shifts earlier, appearing in June, coinciding with the earlier occurrence of the precipitation peak in the middle and lower reaches synchronously, the likelihood of flash floods in the Yangtze River Basin will inevitably increase. Lu et al. [24] further analyzed the trend changes in precipitation across different seasons and found that the spring season exhibited the most significant trend, with a growth rate of 3.6 mm/10 years. In contrast, precipitation during summer, autumn, and winter showed a declining trend, though the rate of decline was relatively small. The trends in precipitation events of different intensity levels also varied considerably. Xi et al. [25], based on monthly precipitation data from 28 rain gauge stations in the JRB spanning from 1979 to 2011, analyzed the characteristics of precipitation changes in the basin and revealed that spatial distribution of precipitation in the JRB was uneven. Zhao et al. [26] examined the trends in precipitation changes along the upper, middle, and lower reaches of the JRB. Zhang et al. [27] using precipitation and runoff data from the JRB spanning from 1966 to 2010, applied the univariate Mann–Kendall (MK) trend analysis method, the mutation detection method, and the multivariate MK method to analyze the recent decades’ changes in precipitation and runoff in the basin. The results indicated that both annual precipitation and annual runoff in the JRB have shown an overall upward trend over the past several decades.
Previous studies have mainly focused on extreme precipitation events or natural seasons. Due to the unique geographical location of the JRB, which is influenced by the westerly belt and the monsoon, its annual precipitation distribution is highly uneven, exhibiting a distinct wet–dry climate pattern. Generally speaking, the rainy season primarily spans from May to October, accounting for about 90% of the annual precipitation [1,22]. Moreover, the rainy season varies considerably from year to year in terms of its onset, duration, and total rainfall amounts. The MLJRB constitute the critical section where the Yangtze River transitions from the plateau canyons into the Sichuan Basin. This stretch not only serves as the most energy-rich artery of the Yangtze River, abundant in hydropower resources, but also plays a pivotal role in maintaining ecological security and ensuring water supply throughout the Yangtze River Basin [28,29]. Consequently, spatiotemporal variations in precipitation in the middle and lower reaches of the MLJRB will inevitably lead to changes in the spatiotemporal patterns of hydrological processes, thereby significantly impacting the development and utilization of water resources and hydropower energy in the Yangtze River Basin [30].
To address the limitations of previous studies, this study employs high-density hourly precipitation data obtained from national and regional automatic weather stations of the China Meteorological Administration. These data have undergone a three-tier quality control procedure at the national, provincial, and station levels. Relative to prior investigations, the contributions of this study are threefold: (1) the precipitation dataset comprises 1745 stations, offering not only enhanced data quality but also greater station density and broader spatial coverage; (2) this study presents, for the first time in the JRB, a systematic analysis of the effects of slope gradient and slope aspect on precipitation; and (3) elevation is classified into five distinct levels, thereby revealing a more refined vertical differentiation pattern. Furthermore, by integrating high-resolution topographic factor data, this study conducts a detailed analysis of the spatiotemporal distribution characteristics of precipitation amount, precipitation frequency, and precipitation intensity under varying topographic conditions. The objective is to elucidate the relationship between precipitation characteristics and local topography, thereby providing a scientific reference for construction safety, engineering design, flood control, and energy security pertaining to hydropower station projects in the middle and lower reaches of the JRB.
2. Data and Methods
2.1. Study Area and Data
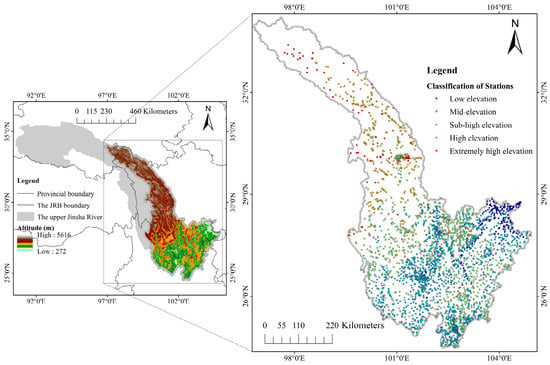
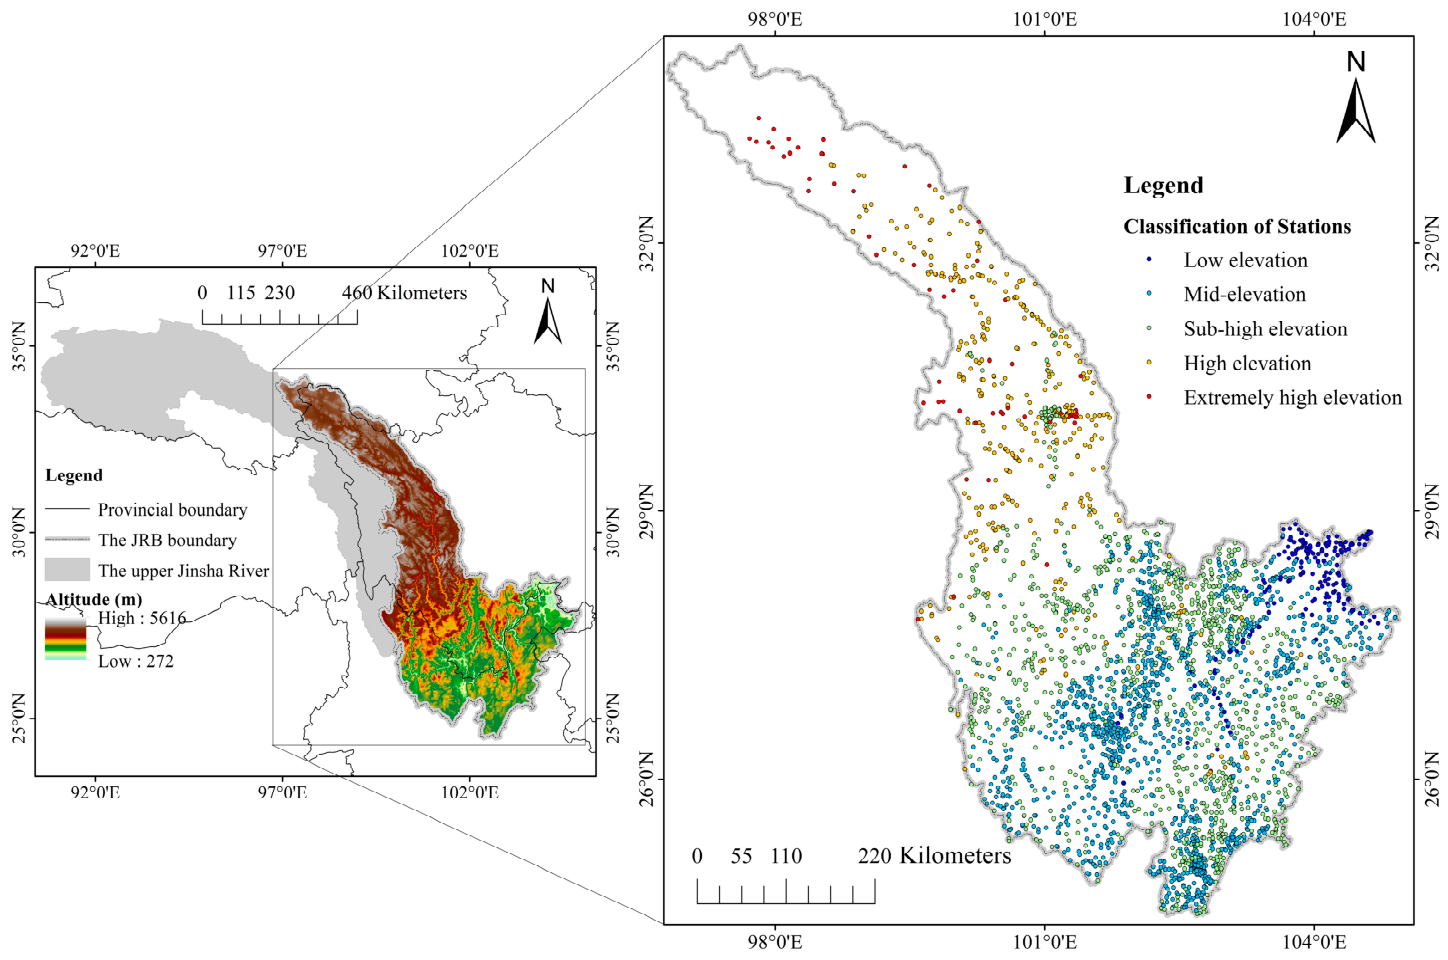
The upper reaches of the Jinsha River extend from the Batang River estuary in Yushu, Qinghai Province, to Shigudun Town in Lijiang, Yunnan Province; the middle reaches stretch from Shigudun Town to Xinshi Town in Pingshan, Sichuan Province; and the lower reaches run from Xinshi Town to the Minjiang River estuary near Yibin [1,4]. This study focuses on the MLJRB (Figure 1), which span four provinces—Qinghai, Sichuan, Yunnan, and Guizhou. The elevation within this region ranges from a maximum of 5616 m to a minimum of 272 m, with rugged mountains and complex topography. The middle reaches of the JRB are characterized by continuous “V”-shaped canyons, with elevations along both banks generally between 1500 and 3000 m. In contrast, the lower reaches feature elevations along both banks that typically fall below 500 m, with only the hills near Xiangjiaba exceeding 500 m in elevation. Influenced jointly by topographic gradients and atmospheric circulation patterns, precipitation in this region exhibits a pronounced three-dimensional distribution pattern [25], characterized by distinct seasonal variations and regional differences. Coupled with the clear wet-and-dry monsoon climate and recent changes in regional precipitation patterns [30], these factors have collectively contributed to the increasingly complex hydrological conditions in this watershed.
Figure 1.
The topography and meteorological stations in the study region.
Due to the high elevation of some automatic precipitation observation stations in the study area, freeze–thaw cycles occur from November to April of the following year, necessitating the deactivation or covering of precipitation monitoring equipment, which results in data gaps. Therefore, this study uses hourly precipitation data from May to October 2023–2025, which have undergone a three-level quality control process at the national, provincial, and station levels [31]. At the same time, considering the continuity and completeness of the observational data, we selected observation stations with a data availability rate of 98%, including 69 national meteorological observation stations and 1676 regional automatic weather stations. Based on China’s topographic elevation classification criteria [32], the stations were categorized into five elevation zones: low elevation (<1000 m), mid-elevation (≥1000–2000 m), sub-high elevation (≥2000–3000 m), high elevation (≥3000–4000 m), and extremely high elevation (≥4000 m) [33]. Hereafter, these zones are referred to as Low, Mid, Sub-high, High, and Ext-high, respectively.
2.2. Research Methodology
During the precipitation process, if the hourly precipitation amount is ≥0.1 mm, that hour is recorded as having a precipitation occurrence [34,35]. Based on this, statistical analyses were conducted on the variations in the annual average total precipitation, mean hourly precipitation, precipitation frequency (defined as the ratio of the number of hours with precipitation occurrence to the total number of hours in the statistical period), and precipitation intensity (defined as the ratio of precipitation amount to precipitation frequency. This indicator directly reflects the average precipitation rate per hour under conditions when precipitation occurs.) during the warm season (May–October). These statistical metrics are defined according to the following formulas:
Among these, represents the hourly precipitation amount, and indicates whether precipitation occurred during that hour—1 if precipitation occurred, and 0 otherwise. denotes the number of hours observed at the station within the statistical period. is the number of years ( = 3). Based on different elevation levels, the above four indicators are used to analyze the characteristics of precipitation amounts, the spatial distribution of precipitation, and the temporal variation in precipitation (daily and monthly) over the study period. Due to the presence of numerous zero values and positive skewness, hourly precipitation data do not satisfy the normality assumption. Hence, the Kruskal–Wallis non-parametric test, which is robust and does not assume normality, was used to compare precipitation characteristics among elevation groups. The test was performed on station-level precipitation metrics aggregated over the warm season (May–October, 2023–2025), including warm-season average total precipitation amount, mean hourly precipitation, precipitation frequency, and precipitation intensity. It is important to note that the Kruskal–Wallis test indicates whether statistically significant differences exist among elevation groups but does not imply any causal relationship between elevation and precipitation characteristics.
3. Results
3.1. Regional Precipitation Characteristics
The statistical characteristics of annual precipitation at different altitudes (Table 1) show that the warm-season average total precipitation () in the study area increases from 746.9 mm at low altitude to 836.9 mm at the mid-high altitude, and then gradually decreases to 589.4 mm at the highest altitude—indicating a pattern of first increasing and then decreasing with rising altitude. As for the average hourly precipitation (), it rises from 0.171 mm/h at low altitude to 0.191 mm/h at the mid-high altitude, before dropping to 0.134 mm/h at the highest altitude. Regarding precipitation frequency (F), it reaches its peak at 11.8% at high altitude and its lowest at 8.7% at low altitude; at mid-altitude, it is slightly higher than at low altitude, standing at 8.8%. In terms of precipitation intensity (I), mid-altitude records the highest value at 2.037 mm/h, followed by low altitude at 1.951 mm/h, while the highest altitude has the lowest intensity at 1.227 mm/h. Overall, within the region, the annual total precipitation and hourly average precipitation rate follow the order: sub-high altitude > mid-altitude > low altitude > high altitude > extremely high altitude; precipitation frequency is highest at high altitude, whereas precipitation intensity is greatest at mid-altitude. Precipitation intensity shows the sequence: mid-altitude > low altitude > sub-high altitude > high altitude > extremely high altitude. Although high-altitude and sub-high-altitude regions have high precipitation frequencies, their intensities are relatively low, suggesting that these areas are dominated by sustained light rainfall. In contrast, mid-altitude and low-altitude regions likely experience more convective precipitation events, resulting in higher precipitation intensities. To test sensitivity and robustness, we removed the top 4 highest-elevation stations (20% of the 19 extremely high altitude stations) and recalculated precipitation metrics using the remaining 15 stations. Before removal, the values were 589.4 mm, 0.134 mm/h, 10.9%, and 1.227 mm/h; after removal, they became 577.5 mm, 0.131 mm/h, 10.8%, and 1.201 mm/h—all changes < 2.2%. This indicates that the results are not sensitive to station elevation.
Table 1.
Precipitation Characteristics at Different Altitudes.
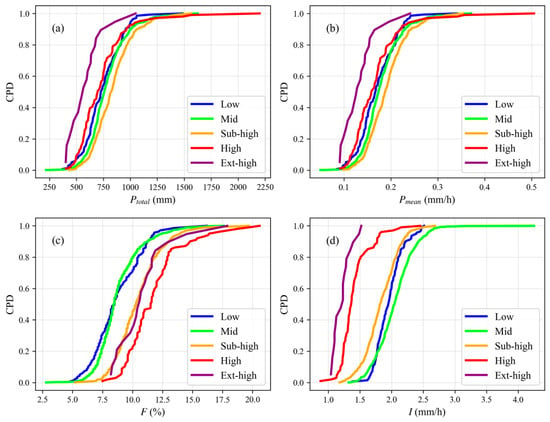
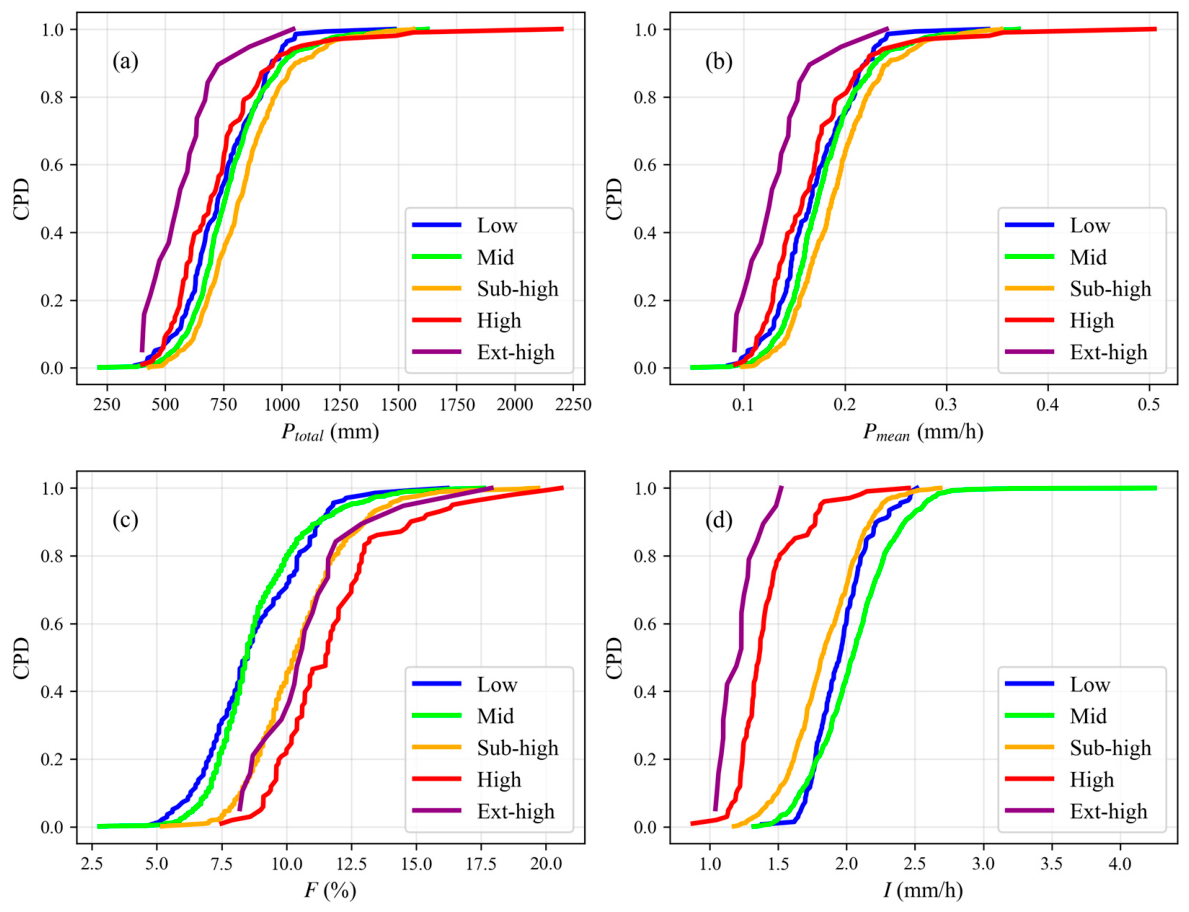
Figure 2 shows the cumulative probability distribution (CPD) of precipitation characteristics. As illustrated in Figure 2a,b, the cumulative curves for warm-season average total precipitation and hourly average precipitation at extremely high altitudes are shifted farthest to the left. At most stations, warm-season average total precipitation at extremely high altitudes is below 1000 mm (Figure 2a), and the precipitation intensity is below 1.5 mm/h (Figure 2d). Once warm-season average total precipitation reaches or exceeds 1500 mm at various altitudes, the cumulative probability approaches 1 for all altitudes, indicating that there is little variation in the upper limit of warm-season average total precipitation across the region. The key differences lie in the thresholds within the medium- and low-probability ranges; the curves at each altitude tend to flatten out after an hourly precipitation intensity of 0.3 mm/h. As shown in Figure 2c, the steepness of the curves at different altitudes is similar, suggesting that the dispersion of precipitation frequency remains relatively consistent across altitudes. In terms of precipitation intensity (Figure 2d), at high altitudes, a cumulative probability of 0.5 corresponds to an intensity of approximately 1.2 mm/h—the highest among all altitudes. At low altitudes, a cumulative probability of 0.5 corresponds to an intensity of about 2.0 mm/h. The curves for mid-altitude, sub-high-altitude, and high-altitude regions shift progressively to the right. Notably, the curve for extremely high altitudes exhibits an exceptionally steep slope in the high-probability range (0–0.8), indicating that precipitation intensity at these altitudes is highly concentrated in the lower-intensity zone. By contrast, the curve for mid-altitude is the flattest, reflecting the greatest dispersion in the distribution of high-intensity precipitation events.
Figure 2.
Cumulative probability distribution of different precipitation levels ((a) annual average total precipitation; (b) hourly average precipitation; (c) precipitation frequency; (d) precipitation intensity).
3.2. Spatial Distribution Characteristics of Precipitation
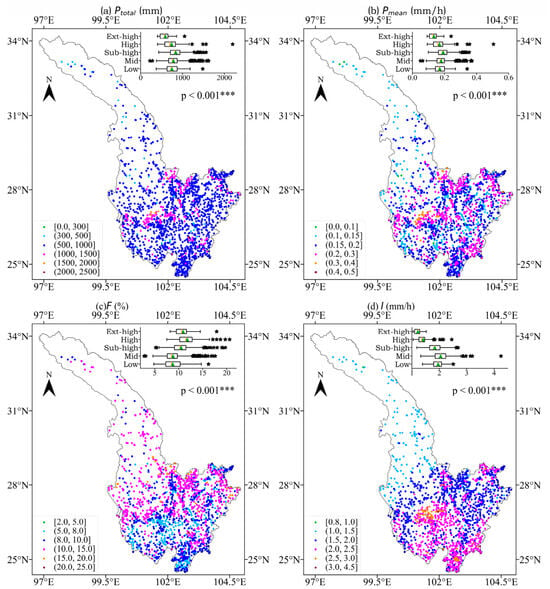
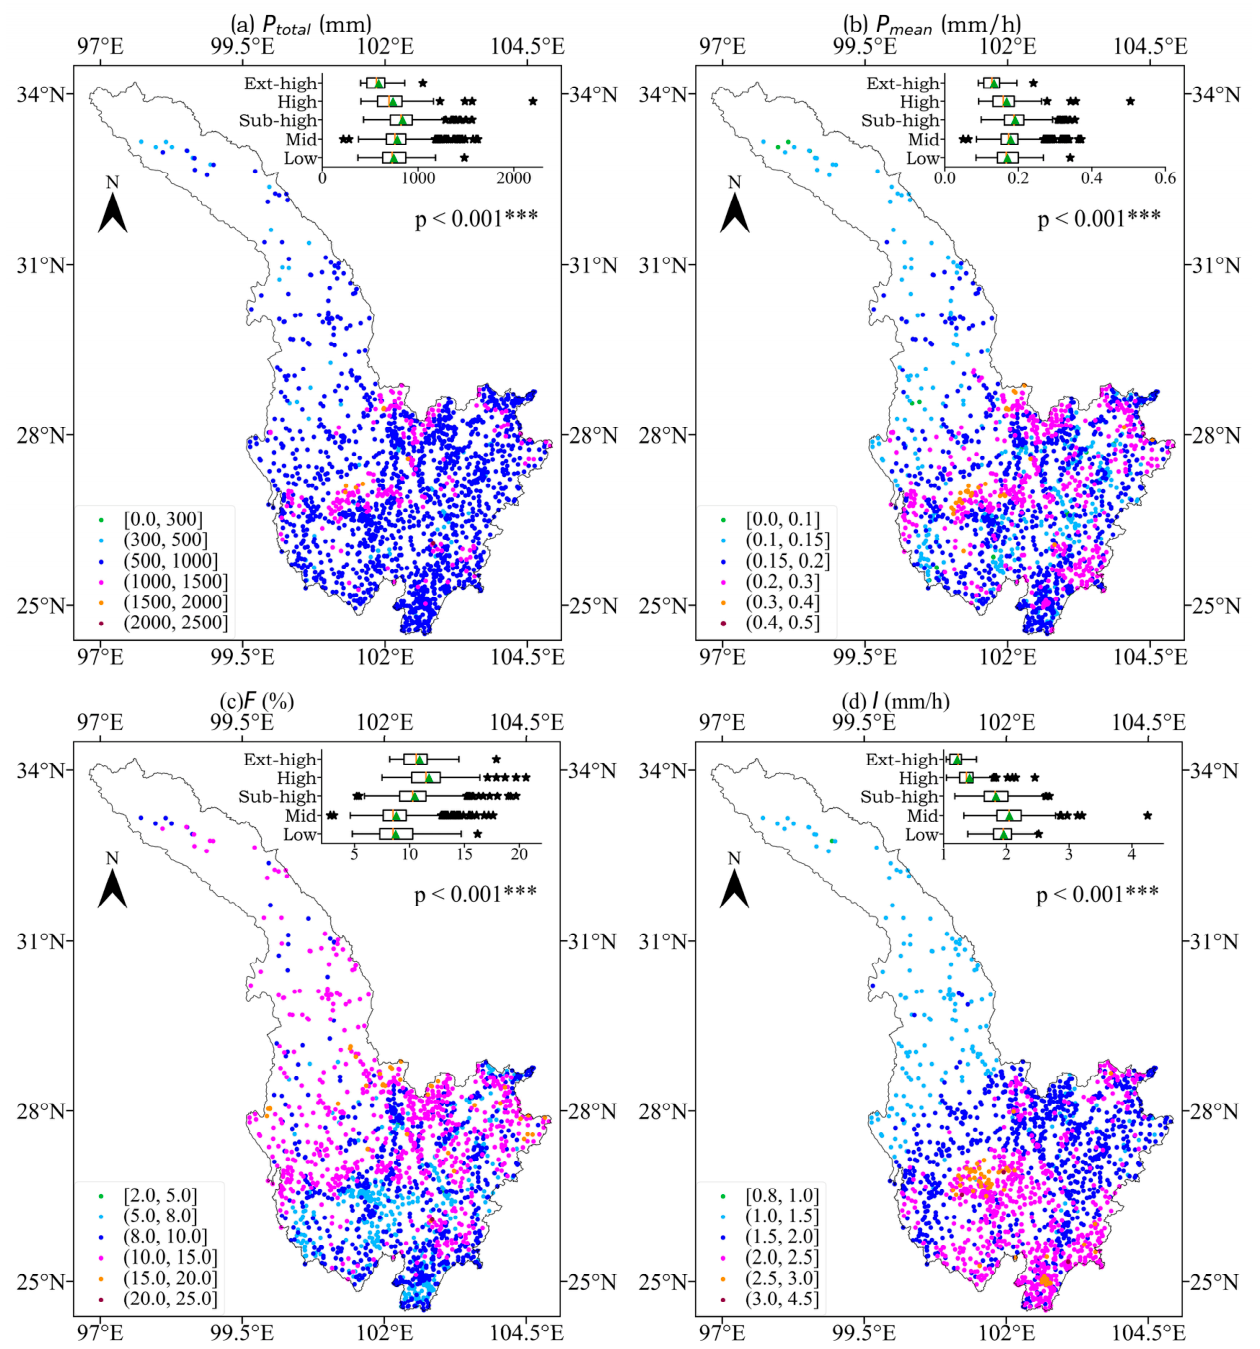
Figure 3 shows the spatial distribution characteristics of precipitation at the stations and box plots of precipitation at different altitudes. The annual average total precipitation at the stations (Figure 3a) generally ranges from 500 to 1000 mm, accounting for 84.8% of the total number of stations; stations with annual average precipitation exceeding 1000 mm account for only 11.9%. At low altitudes, the annual average precipitation ranges from 371.9 to 1483.6 mm; at mid-altitudes, it ranges from 219.6 to 1624.4 mm; and at sub-high altitudes, it ranges from 431.3 to 1564.4 mm. At high altitudes, the annual average precipitation ranges from 403.7 to 2199.6 mm; and at extremely high altitudes, it ranges from 401.3 to 1049.2 mm. The hourly average precipitation at the stations (Figure 3b) generally falls between 0.15 and 0.3 mm/h, accounting for 76.96% of the total number of stations; stations with hourly precipitation exceeding 0.3 mm/h account for 1.78%. At low altitudes, the hourly average precipitation ranges from 0.085 to 0.341 mm/h; at mid-altitudes, it ranges from 0.05 to 0.371 mm/h; and at sub-high altitudes, it ranges from 0.099 to 0.354 mm/h. At high altitudes, the hourly average precipitation ranges from 0.092 to 0.505 mm/h; and at extremely high altitudes, it ranges from 0.091 to 0.241 mm/h. With regard to precipitation frequency (Figure 3c), it generally ranges from 8% to 15%, accounting for 75.6% of the total number of stations; stations with precipitation frequency exceeding 15% account for only 2.1%. At low altitudes, the hourly precipitation frequency ranges from 4.8% to 16.2%; at mid-altitudes, it ranges from 2.8% to 17.6%; and at sub-high altitudes, it ranges from 5.2% to 19.7%. At high altitudes, the precipitation frequency ranges from 7.5% to 20.6%; and at extremely high altitudes, it ranges from 8.2% to 17.9%. As for precipitation intensity (Figure 3d), the stations generally show values between 1.5 and 2.5 mm/h, accounting for 85.7% of the total number of stations; stations with precipitation intensity exceeding 2.5 mm/h account for 4.0%. At low altitudes, the hourly average precipitation ranges from 1.38 to 2.52 mm/h; at mid-altitudes, it ranges from 1.32 to 4.25 mm/h; and at sub-high altitudes, it ranges from 1.18 to 2.69 mm/h. At high altitudes, the hourly average precipitation ranges from 0.88 to 2.45 mm/h; and at extremely high altitudes, it ranges from 1.04 to 1.52 mm/h. Overall, a distinct high-value center for both precipitation frequency and intensity is located in the lower JRB, contrasting with a low-value center in the northern study area. This spatial distribution is consistent with the positive correlation observed between precipitation amount, frequency, and intensity across stations.
Figure 3.
The spatial distribution of the precipitation at gauge observation stations ((a) annual av-erage total precipitation; (b) hourly average precipitation; (c) precipitation frequency; (d) precipita-tion intensity). Note: The five lines in the box chart from left to right are the lower edge, the lower quartile, the median, the upper quartile, and the upper edge. The star point outside the upper and lower edges is the abnormal value, and the triangle represents the mean value. Based on the Kruskal–Wallis test, *** denotes significance at the p < 0.001 threshold.
3.3. Temporal Variation Characteristics of Precipitation
3.3.1. Daily Variation Characteristics
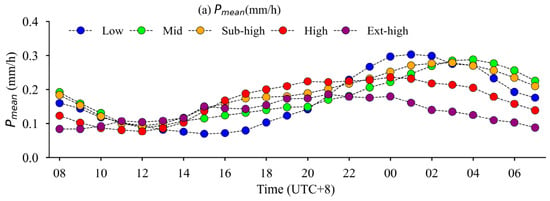
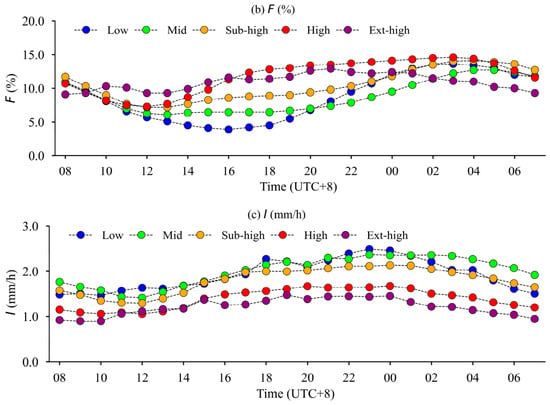
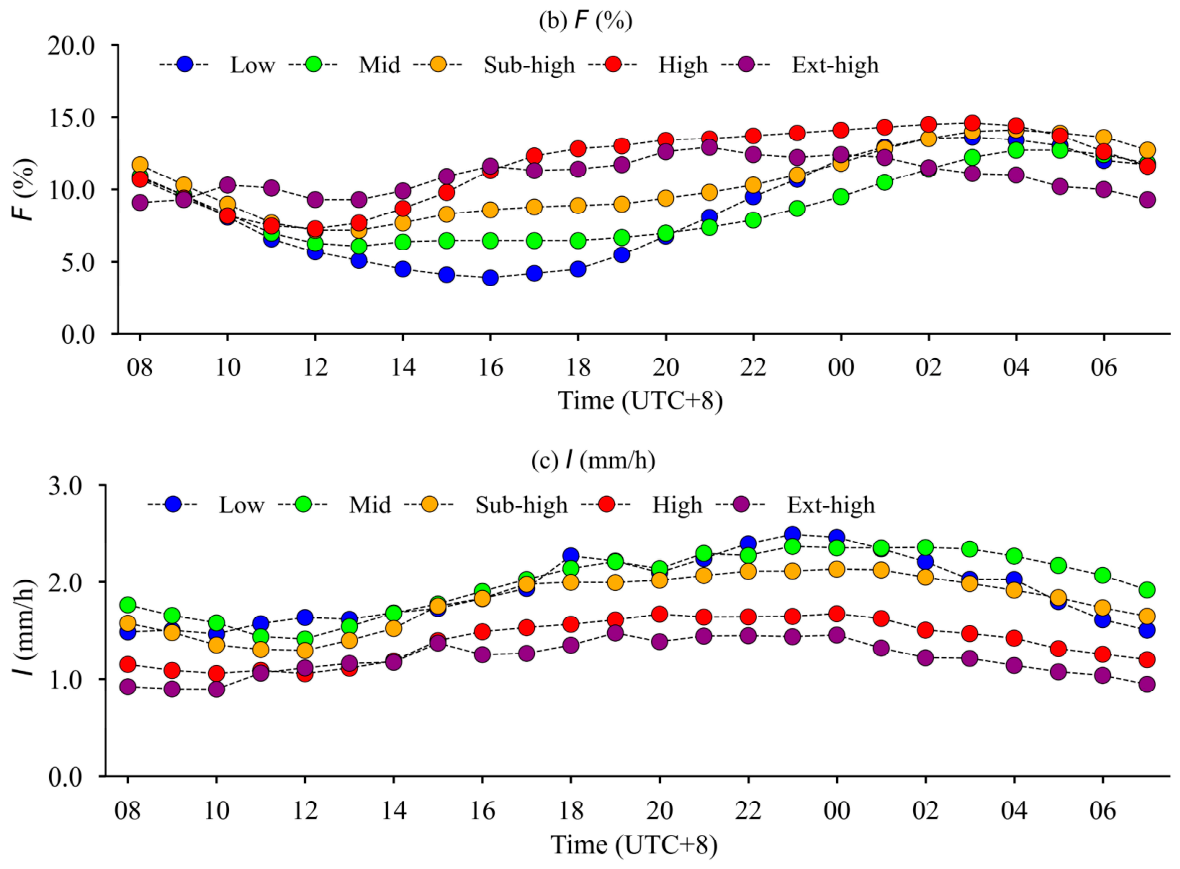
Figure 4 shows the diurnal variation characteristics of precipitation at different times from 00:00 to 23:00 local time (UTC + 8), during the evaluation period. The average hourly precipitation amounts at low, mid-, sub-high, high, and very high altitudes (Figure 4a) ranged from 0.07 to 0.303 mm/h, 0.088 to 0.288 mm/h, 0.093 to 0.279 mm/h, 0.077 to 0.236 mm/h, and 0.084 to 0.186 mm/h, respectively. At the five altitude levels, precipitation was lowest from 12 to 15 h in the afternoon, gradually increasing thereafter and reaching its maximum between 01:00 and 04:00 in the night, after which it began to decline again. At 01:00, the precipitation amounts at low, mid, sub-high, high, and ext-high altitudes were 43.4%, 40.6%, 50.5%, 63.5% and 42.5% higher, respectively, compared to those at 13:00. The greatest differences in precipitation among the various altitude levels occurred at 01:00, when precipitation was most abundant; whereas from 15:00 to 21:00, the differences in precipitation across altitude levels were relatively smaller compared to other time periods. The diurnal variation in precipitation frequency (Figure 4b) was similar to that of the hourly average precipitation amounts. The proportions of low-altitude, mid-altitude, sub-high-altitude, high-altitude, and extremely high-altitude areas range from 3.9% to 13.6%, 6.1% to 12.7%, 7.2% to 14.1%, 7.3% to 14.6%, and 9.1% to 12.9%, respectively. The frequency of precipitation is lowest around 2 p.m. or 3 p.m. and highest around midnight (0 a.m. or 1 a.m.). At high altitudes, the frequency of precipitation between 3 p.m. and 10 p.m. is higher than that at low and mid altitudes; at all other times, the frequency is higher at low altitudes than at high and mid altitudes. As for precipitation intensity (Figure 4c), the values at low altitude, mid altitude, sub-high altitude, high altitude, and extremely high altitude range from 1.465 to 2.491 mm/h, 1.413 to 2.367 mm/h, 1.294 to 2.134 mm/h, 1.055 to 1.673 mm/h, and 0.895 to 1.474 mm/h, respectively. The maximum precipitation intensity occurs at 11 p.m. in both low- and mid-altitude areas, while it peaks at midnight in sub-high, high, and extremely high-altitude areas. Overall, the daily variation characteristics of precipitation across the five altitude zones in the region are distinct: average precipitation amount, precipitation frequency, and precipitation intensity all exhibit a peak-shaped pattern. Precipitation reaches its lowest level around 2 p.m., gradually increases thereafter, peaks around midnight, and then gradually declines again.
Figure 4.
Daily variation characteristics of precipitation ((a) hourly average precipitation; (b) precipitation frequency; (c) precipitation intensity).
3.3.2. Monthly Characteristics
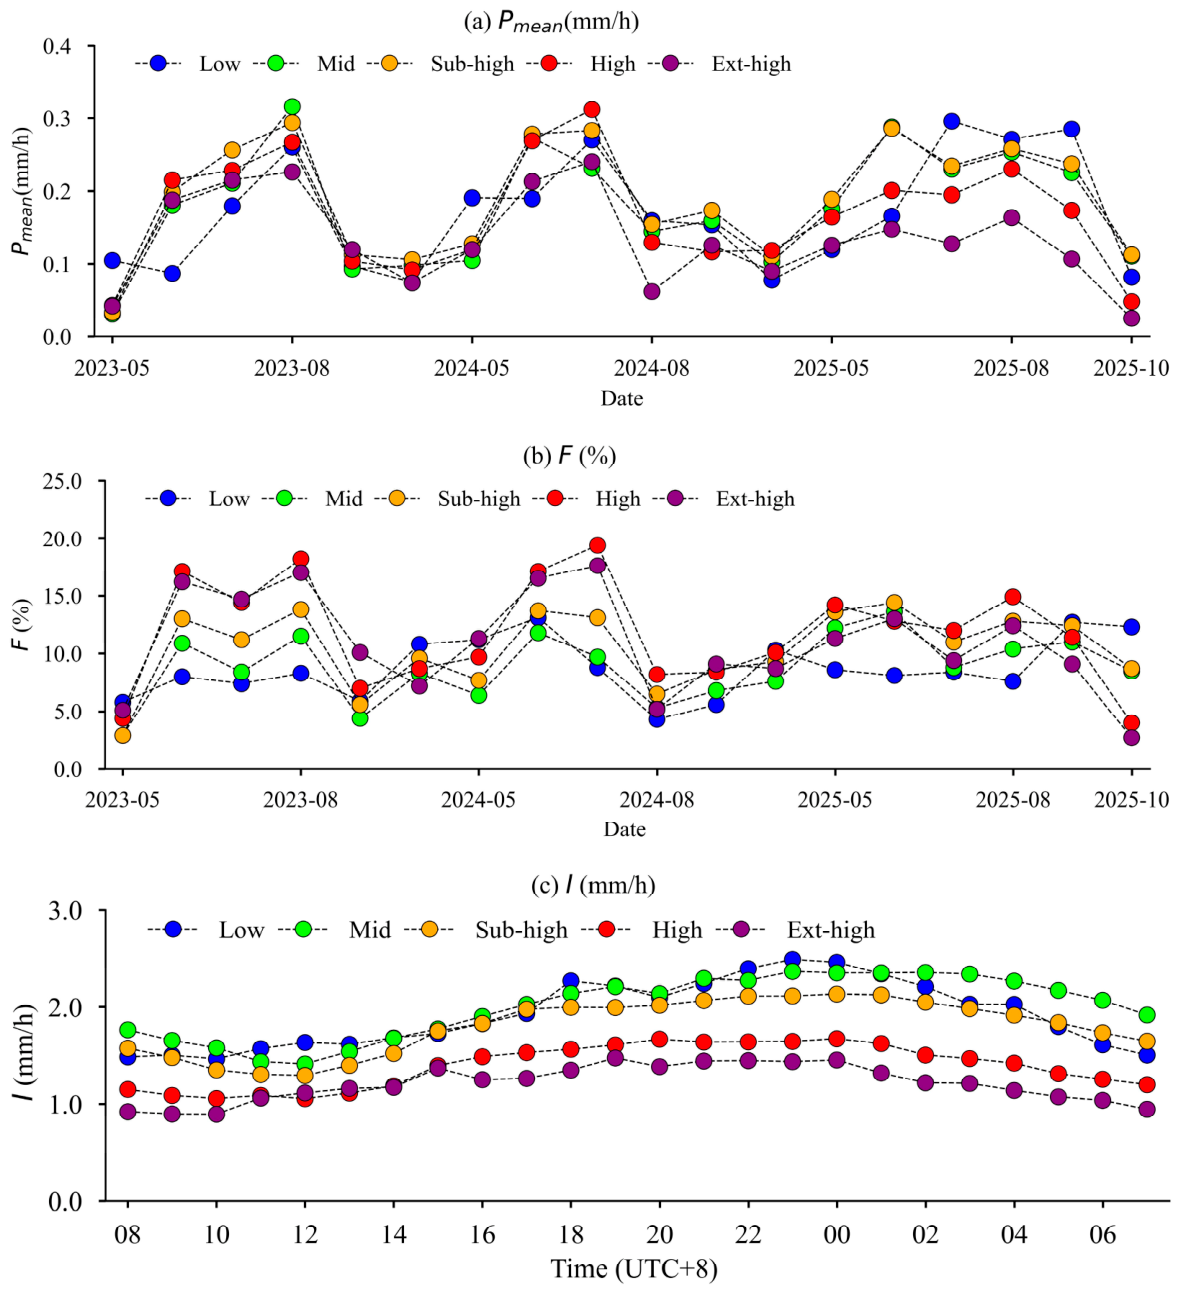
Figure 5 shows the monthly variation characteristics of precipitation during the assessment period. The hourly average precipitation amounts at different elevation categories (Figure 5a) all exhibit a peak-shaped pattern: starting from May, precipitation gradually increases, reaching its maximum in July or August, and then gradually decreases. Figure 5b illustrates the monthly frequency of precipitation events; it can be seen that the months with the highest precipitation frequency throughout the study period—ranging from May to October—are not entirely consistent with the magnitude of precipitation itself. At higher elevations, the frequency of precipitation generally peaks in May and June, higher than at lower elevations. In mid-altitude regions, the frequency of precipitation is relatively lower from August to October. As for monthly precipitation intensity (Figure 5c), it can be seen that the precipitation intensities at the five altitudes are not significantly different in May, June, and October, but show greater differences from July to September. The precipitation intensity at low altitudes varies considerably, followed by that at mid-altitudes, while the variation at high altitudes is the smallest. Overall, the monthly precipitation amounts and precipitation intensities at the five altitude levels generally exhibit similar trends, with certain periodic fluctuations: starting from May through July or August, precipitation intensity increases along with increasing precipitation amounts, then decreases again as total precipitation declines. However, the frequency of precipitation does not fully coincide with these patterns.
Figure 5.
Monthly variation characteristics of precipitation ((a) hourly average precipitation; (b) precipitation frequency; (c) precipitation intensity).
4. Discussion
Based on the temporal and spatial variation characteristics of precipitation at different altitudes, we found that precipitation amounts, frequencies, and intensities all exhibit statistically significant associations with elevation, highlighting the substantial local influence on precipitation amount and intensity. Given the highly complex distribution of precipitation in mountainous regions, which is influenced not only by climatic conditions but also by topographic factors (such as slope, aspect, etc.) [36,37], we further explored precipitation characteristics under different topographic conditions. Therefore, drawing on references [35,38,39,40,41,42], we utilized a digital elevation model (DEM) with a resolution of 90 m to calculate slope and aspect data for each station, thereby further exploring precipitation characteristics under different topographic conditions.
4.1. Precipitation Characteristics Under Different Slopes
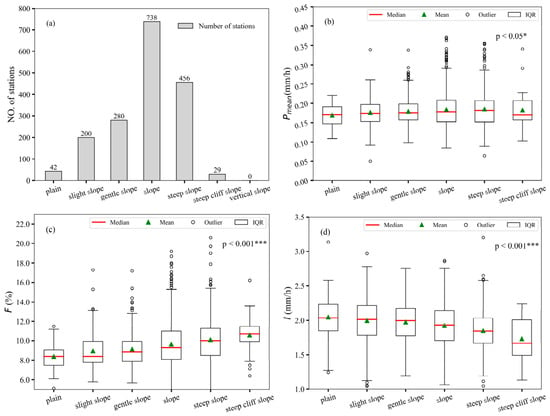
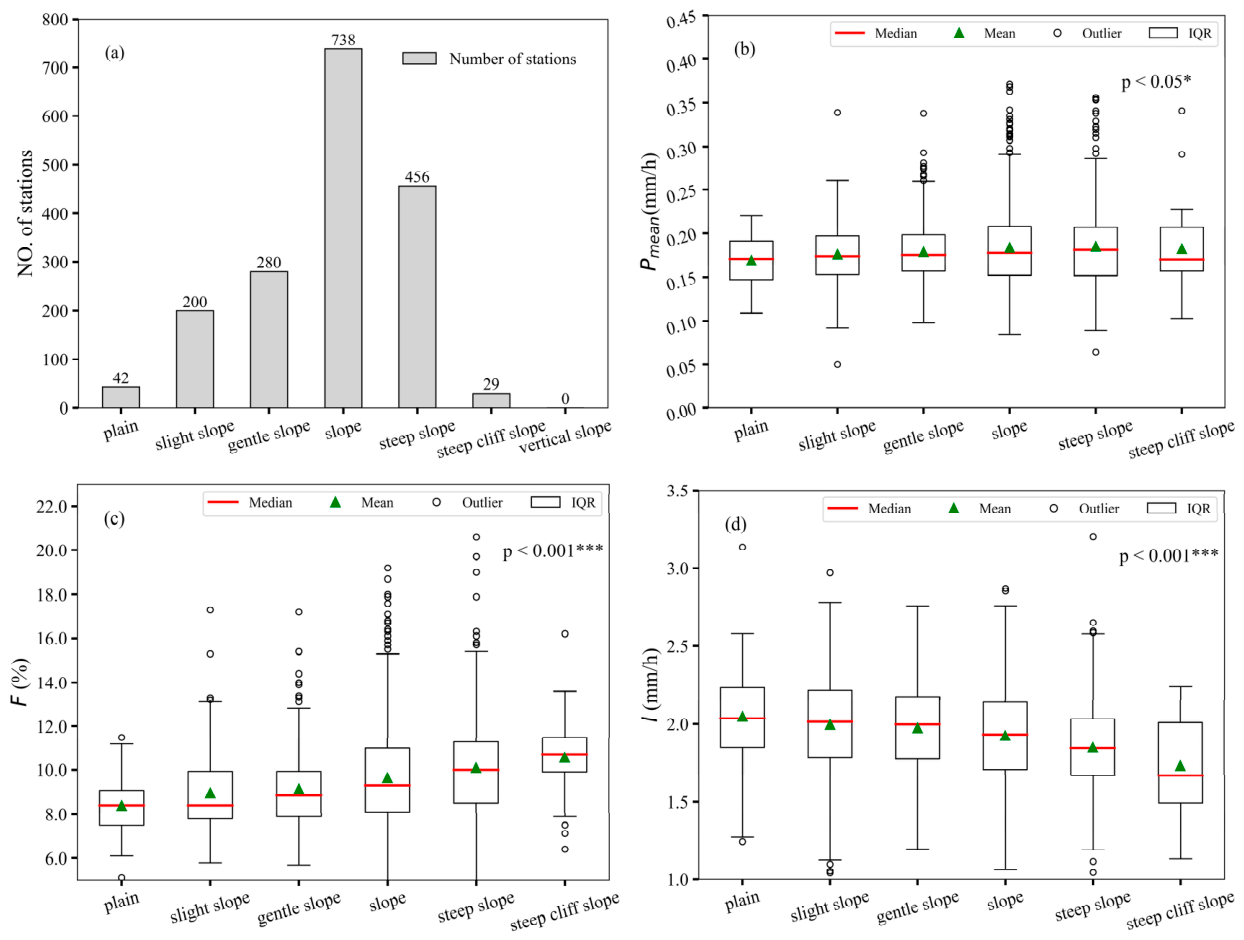
Following the slope classification standard established by the International Geographical Union and the Geomorphological Mapping Committee for detailed geomorphological mapping [43,44], slope grades are defined as: plain (0–0.5°), slight slope (>0.5–2°), gentle slope (>2–5°), slope (>5–15°), steep slope (>15–35°), steep cliff slope (>35–55°), and vertical slope (>55–90°). Figure 6a shows the number of stations distributed across different slope categories. It can be seen that stations located on slopes and steep slopes account for 42.3% and 26.1% of the total number of stations, respectively. As the slope category increases, we observe that the hourly average precipitation in the MLJRB (Figure 6b) remains relatively stable regardless of increasing slope steepness; however, the frequency of precipitation events (Figure 6c) rises with increasing slope steepness, while the intensity of precipitation (Figure 6d) tends to decrease with increasing slope steepness.
Figure 6.
Precipitation characteristics of different slopes. ((a) the number of stations distributed across different slope categories; (b) hourly average precipitation; (c) precipitation frequency; (d) precipitation intensity). Note: Based on the Kruskal–Wallis test, * and *** denote significance at the p < 0.05 and p < 0.001 thresholds, respectively.
4.2. Precipitation Characteristics Under Different Aspects
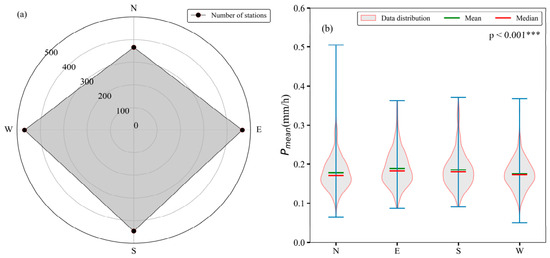
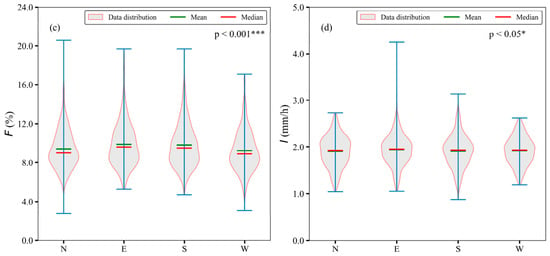
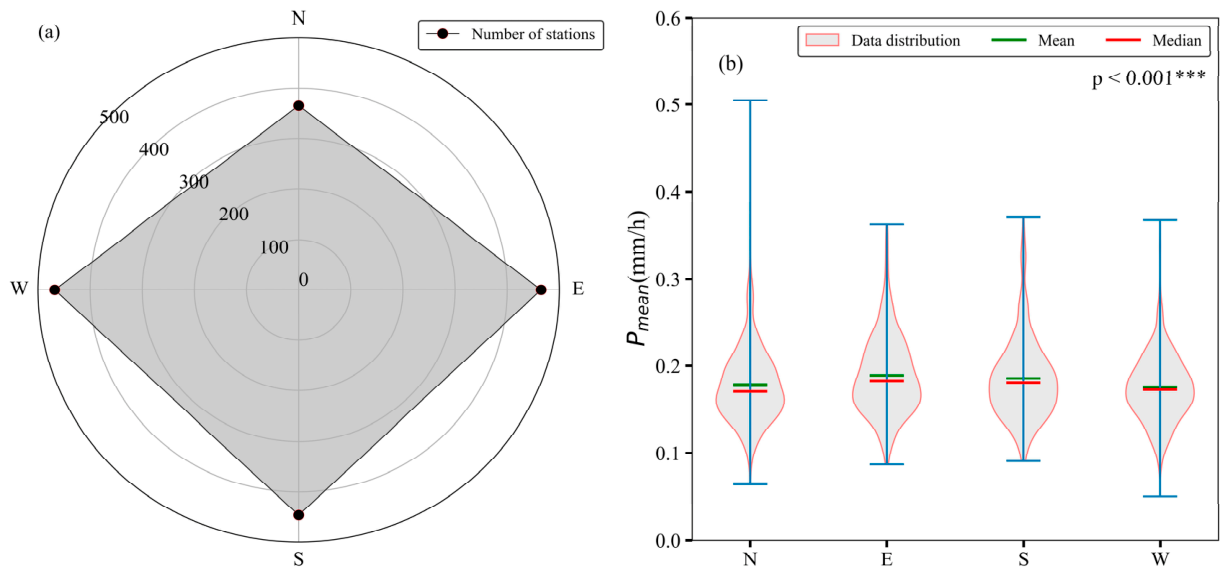
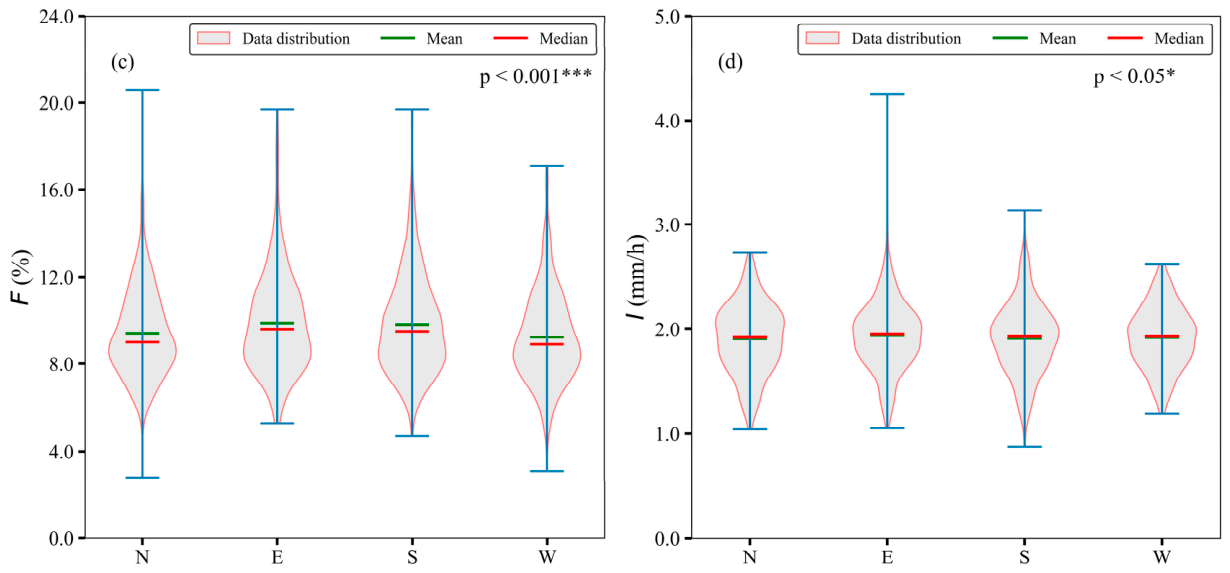
Aspect has a certain impact on various surface meteorological elements [44,45,46]. The locations of the stations were categorized into five groups based on their orientation: flat (no slope), south-facing slope (135–225°), north-facing slope (315–45°), west-facing slope (225–315°), and east-facing slope (45–135°). Figure 7a shows the number of stations located on each slope in the MLJRB. Relatively fewer stations are situated on the north-facing slope (365 stations on the north slope; 465 stations on the east slope; 446 stations on the west slope; 468 stations on the south slope), while stations distributed on other slopes are relatively evenly spread. As shown in Figure 7b (hourly average precipitation) and Figure 7c (precipitation frequency), stations located on the east-facing slope exhibit higher precipitation amounts and greater precipitation frequency than those on other slope orientations, with the south-facing slope ranking second and the west-facing slope recording the lowest values. In terms of precipitation intensity (Figure 7d), there is little difference among the various slope orientations. Overall, slope orientation is associated with precipitation frequency, but shows little association with precipitation intensity.
Figure 7.
Precipitation characteristics of different slope aspects. ((a) number of stations; (b) hourly average precipitation; (c) precipitation frequency; (d) precipitation intensity). Note: Based on the Kruskal–Wallis test, * and *** denote significance at the p < 0.05 and p < 0.001 thresholds, respec-tively.
The above analysis indicates that the unique topography of the MLJRB is associated with the frequent occurrence of precipitation, high rainfall amounts, and significant spatial heterogeneity in this region [1,4]. Through statistical analysis of precipitation in the region from May to October of 2023–2025, it was found that the MLJRB exhibit local high-value centers in terms of precipitation amount, frequency, and intensity, all characterized by a pronounced single nighttime peak. The peak precipitation occurs at night, while the trough occurs in the afternoon, which is largely consistent with previous studies by Zhu et al. [17]. The concentrated precipitation period in the JRB spans from May to October, with the peak occurring in July or August, which is consistent with the findings of Li et al. [1] and Sun et al. [22]. Regarding the relationship between precipitation and topographic factors, our conclusions are generally consistent with those of Zhang et al. [16], who constructed a stepwise regression model relating seasonal precipitation to ten topographic factors. In their study, elevation, slope, and aspect were found to be important for the precipitation model in spring, summer, and autumn, although notable differences were observed in winter. It is worth noting that the diurnal variation in precipitation (nighttime peak) and monthly variation (summer peak) observed in this study are closely related to the monsoon circulation activity over the JRB. The northward advancement of the East Asian summer monsoon and the eastward expansion of the South Asian summer monsoon jointly transport moisture to this region, while the complex terrain modulates the intra-daily distribution of precipitation through local thermal circulation and dynamic lifting effects.
Most stations in the study area are located at altitudes ranging from 2000 to 3000 m, predominantly on the slopes of the river basin. Such topography is highly conducive to air convergence and uplift, making it particularly susceptible to forced uplift that triggers precipitation. Through mechanisms including dynamic orographic lifting, thermally driven circulations, and the blocking and deflection of moisture transport, topography is closely linked to the spatial distribution, intensity, and diurnal cycle of precipitation [47,48,49]. This gives rise to characteristic patterns such as enhanced precipitation on windward slopes, reduced precipitation on leeward slopes (rain shadow effect), and nocturnal precipitation maxima. Although we assessed the sensitivity and robustness of the results for the extremely high-altitude category to further support the reliability of the findings on precipitation characteristics at high altitudes and effectively alleviate concerns about representativeness arising from the limited number of stations, robustness itself does not equate to representativeness. Even if the results exhibit minimal fluctuation, if the sample inherently lacks sufficient spatial coverage or is geographically imbalanced, the inferences may still be difficult to extrapolate to the actual high-altitude region.
This study, by analyzing different topographic feature factors associated with station locations, finds that precipitation frequency and intensity are indeed correlated to some extent with altitude, slope steepness, and aspect. However, given the complex nature of mountainous precipitation, which is influenced not only by climatic and topographic conditions but also potentially by multiple factors such as land cover, the relationship between these variables remains intricate and multifaceted. At the same time, we should be fully aware that the precipitation data used in this study cover a relatively short period. Although we have gained some valuable insights into diurnal and monthly variation patterns as well as the topographic effects on precipitation, this period is insufficient for drawing robust climatological conclusions. Further research is needed to comprehensively investigate the spatiotemporal distribution characteristics of precipitation and the physical mechanisms of atmospheric precipitation over complex terrain, incorporating multi-factor analyses including topography, environment, weather, and climate, as well as employing indicators such as percentile-based thresholds, wet-hour distributions, and extreme precipitation diagnostics.
5. Conclusions
This study is based on hourly precipitation data observed by 1745 automated surface meteorological stations of the China Meteorological Administration from May to October 2023–2025, and focuses on the precipitation characteristics in the MLJRB. The following key conclusions were obtained:
1. In the MLJRB, the average total precipitation and average hourly precipitation gradually increase from low altitudes, peak at sub-high altitudes, and then gradually decrease, reaching their lowest values at extremely high altitudes. The order of annual total precipitation and average hourly precipitation from highest to lowest is sub-high altitude > mid-altitude > low altitude > high altitude > extremely high altitude. Precipitation frequency is highest at high altitudes, while precipitation intensity is greatest at mid-altitudes, with the order of intensity being mid-altitude > low altitude > high altitude.
2. Regarding spatial distribution, a high-value center with high precipitation frequency and intensity is formed in the lower reaches of the Jinsha River, while the upper reaches serve as a low-value center. Stations with higher precipitation amounts generally exhibit relatively higher precipitation frequency and intensity. Significant differences in precipitation amount, frequency, and intensity are observed across different altitude levels.
3. Pronounced diurnal variation characteristics are evident at all altitudes. The average precipitation amount, precipitation frequency, and precipitation intensity all exhibit a unimodal pattern; they reach their lowest values around 14:00, gradually increase thereafter, peak around midnight (00:00), and then gradually decrease again. Monthly variations in average hourly precipitation amount and intensity across different altitudes show consistent trends: from May to July or August, precipitation intensity increases with increasing precipitation amount, and then decreases as the average hourly precipitation amount declines. However, the trend for precipitation frequency is not entirely consistent.
4. Precipitation frequency and intensity in the MLJRB are also associated with micro-topographic features such as slope and aspect. As slope increases, precipitation amount shows little change, precipitation frequency increases, while precipitation intensity decreases markedly. Eastern slopes receive higher precipitation amounts and frequency compared to other slope aspects, followed by southern slopes, with western slopes receiving the lowest. However, differences in precipitation intensity among different slope aspects are minimal.
In summary, these findings have important implications for hydropower operation and flood forecasting in the MLJRB. The identification of mid-altitude areas as hotspots of high-intensity rainfall indicates that flash flood and landslide risks are most prominent in mid-altitude zones, providing a basis for targeted deployment of early warning systems. The pronounced nocturnal precipitation peak observed across all altitudes implies that heavy rainfall events tend to occur during nighttime hours, a pattern that should be incorporated into reservoir pre-release strategies and flood preparedness plans. Due to the limited number of stations and incomplete spatial coverage at extremely high elevations, these results should be interpreted as preliminary and require confirmation with denser and more spatially balanced observations in future studies.
Author Contributions
Conceptualization, H.W., P.Y., Y.Y. and C.C.; methodology, C.C. and Y.Y.; validation, H.W., P.Y., Y.Y. and C.C.; writing—original draft preparation, H.W.; writing—review and editing, H.W., P.Y., Y.Y. and C.C.; visualization, H.W. and P.Y.; supervision, H.W. and P.Y.; funding acquisition, H.W. All authors have read and agreed to the published version of the manuscript.
Funding
This research was funded by the Three Gorges Jinsha River Yunchuan Hydropower Development Co., Ltd., China, and the Yangtze Power Co., Ltd. (Project Number: 4323020006).
Institutional Review Board Statement
Not applicable.
Informed Consent Statement
Not applicable.
Data Availability Statement
The data presented in this study are available on request from the corresponding author due to privacy.
Conflicts of Interest
Author Hantao Wang, Ye Yin and Cuihua Chen were employed by the company China Yangtze Power Co., Ltd. The remaining authors declare that the research was conducted in the absence of any commercial or financial relationships that could be construed as a potential conflict of interest.
References
- Li, W.; Wang, J.; Guo, Y.; Jin, Q. Analysis on Characteristics of Areal Precipitation in the Middle and Lower Reaches of the Jinsha River Basin. Resour. Environ. Yangtze Basin 2014, 23, 846–853. (In Chinese) [Google Scholar] [CrossRef]
- Cen, S.; Qin, N.; Li, Y. Climatic Characteristics of Runoff Variation in Flood Season in Jinsha River Basin. Resour. Sci. 2012, 34, 1538–1545. (In Chinese) [Google Scholar]
- Wu, Y.; Fang, H.; Huang, L.; Ouyang, W. Changing runoff due to temperature and precipitation variations in the dammed Jinsha River. J. Hydrol. 2020, 582, 124500. [Google Scholar] [CrossRef] [Scilit]
- Xu, C.; Dan, J.; Song, W.; Li, Y. The Distribution Characteristics of Areal Rainfall and Performance Evaluation in the Middle and Lower Reaches of Jinsha River. Plateau Mt. Meteorol. Res. 2020, 40, 38–42. Available online: https://www.gysdqxyj.cn/en/article/doi/10.3969/j.issn.1674-2184%C2%B72020.02.006 (accessed on 24 April 2026). (In Chinese)
- Han, D.; Cui, Z.; Zhou, L.; Li, Y.D.; Zheng, Y. Current Situation and Medium-and Long-Term Prospect of Hydropower Development during the 14th Five-Year Plan Period. Express Water Resour. Hydropower Inf. 2025, 46, 46–53. (In Chinese) [Google Scholar] [CrossRef]
- Trenberth, K.E.; Fasullo, J.T.; Mackaro, J. Atmospheric Moisture Transports from Ocean to Land and Global Energy Flows in Reanalyses. J. Clim. 2011, 24, 4907–4924. [Google Scholar] [CrossRef] [Scilit]
- Zhang, M.; Lei, B.; Zhou, F.; Wang, J.; Chao, Z. Contribution of increased precipitation and air temperature to hydrothermal dynamics of permafrost in the Qinghai-Tibet Plateau. Rock Soil Mech. 2024, 45, 2140–2152. (In Chinese) [Google Scholar] [CrossRef] [Scilit]
- Zhong, S. A Review on the Impact Mechanism of Topography on Precipitation and Its Forecasting Methods. Plateau Meteorol. 2020, 39, 1122–1132. (In Chinese) [Google Scholar] [CrossRef]
- Liao, F.; Hong, Y.; Zheng, G. Review on Dynamic, Thermodynamic and Microphysical Factors Influencing Clouds and Precipitation. Meteorology 2006, 11, 3–11. (In Chinese) [Google Scholar] [CrossRef]
- Roe, G.H. Orographic Precipitation. Annu. Rev. Earth Planet. Sci. 2005, 33, 645–671. [Google Scholar] [CrossRef] [Scilit]
- Smith, R.B. 100 Years of Progress on Mountain Meteorology Research. Meteorol. Monogr. 2019, 59, 20.1–20.73. [Google Scholar] [CrossRef] [Scilit]
- Zheng, Q.; Sun, W.; Li, J.; Feng, J.; Wei, Y.; Li, J. Impacts of Moisture Advection Scheme on Precipitation in the Steep Topography Region between the Tibetan Plateau and the Sichuan Basin. J. Appl. Meteorol. Climatol. 2024, 63, 781–801. [Google Scholar] [CrossRef] [Scilit]
- Yin, G.; Wei, C.; Wang, D.; Han, F.; Su, P.; Hu, X. Complexity of valley deposits on the southeastern margin of the Qinghai-Tibet Plateau: A case study from the middle reaches of the Jinsha River. Quat. Sci. 2022, 42, 797–808. (In Chinese) [Google Scholar] [CrossRef]
- Wang, D.; Yu, C.; Sun, M.; Yang, J.; Li, Y.; Chen, Y. Impact of Typical Hydropower Development on Local Climate in the Dry-hot Valley of the Jinsha River Basin. J. Soil Water Conserv. 2024, 38, 158–166. (In Chinese) [Google Scholar] [CrossRef]
- Zhu, L.; Shi, W.; Wang, Q.X.; Qin, Y.; Zhang, Q.; Lei, T. Ecological Vulnerability Assessment and Driving Force Analysis of the Jinsha River Basin Based on SRP Model. Sichuan Water Resour. 2025, 46, 15–19. [Google Scholar]
- Zhang, S.K.; Lu, Z.A.; Zhang, N. Influence of Topographic Factors on Spatial Distribution of Precipitation in Jinshajiang River Basin. Water Resour. Power 2011, 29, 13–15, 146. (In Chinese) [Google Scholar] [CrossRef]
- Zhu, L.H.; Guan, Y.H. Evolution and Non-stationarity Characteristics of Precipitation Structure in the Jinsha River Basin. J. Yangtze River Sci. Res. Inst. 2025, 42, 50–58. Available online: https://d.wanfangdata.com.cn/periodical/cjkxyyb202503010 (accessed on 24 April 2026). (In Chinese)
- Yin, Y.; Song, W.W.; Zheng, H.; Zhou, Y.; Xu, C. Diagnostic Analysis and Numerical Simulation of a Rainstorm Process in the Lower Reaches of the Jinsha River. Plateau Mt. Meteorol. Res. 2023, 43, 40–50. (In Chinese) [Google Scholar] [CrossRef]
- Li, S.; Huang, X.; Wu, W.; Xu, J.H.; Xu, X.L.; Long, K. Correction of CMPAS Precipitation Products over Complex Terrain Areas with Machine Learning Models. J. Trop. Meteorol. 2023, 29, 264–276. [Google Scholar] [CrossRef] [Scilit]
- Zeng, X.F.; Ye, L.; Zhai, J.; Jiang, T.; Xiong, M. Spatial-Temporal Evolution Characteristics of Precipitation in the Jinsha River Basin during 1961–2010. Resour. Environ. Yangtze Basin 2015, 24, 402–407. (In Chinese) [Google Scholar] [CrossRef]
- Gao, Y.Q.; Xiao, Y.; Li, L. Climatic Characteristics of the Rainy Season and Evolution of Atmospheric Circulation in the Middle and Lower Reaches of the Jinsha River. Resour. Environ. Yangtze Basin 2025, 34, 2366–2375. Available online: https://d.wanfangdata.com.cn/periodical/CiBQZXJpb2RpY2FsQ0hJU29scjkyMDI2MDQyODE2MzExMRISY2pseXp5eWhqMjAyNTEwMDE4Ggg2eGU4c2lyZA%3D%3D (accessed on 24 April 2026). (In Chinese)
- Sun, S.X.; Chen, L.H.; Xiang, Y.L.; Du, S.L.; Xiang, W. Climatic Characteristics of Areal Precipitation in the Jinsha River Basin. Plateau Mt. Meteorol. Res. 2009, 28, 7–10. (In Chinese) [Google Scholar] [CrossRef]
- Su, B.D.; Jiang, T.; Ren, G.Y.; Chen, Z.H. Trend of Extreme Precipitation Events over the Yangtze River Basin during 1960–2004. Adv. Clim. Change Res. 2006, 2, 9–14. (In Chinese) [Google Scholar] [CrossRef]
- Lu, Y.T.; Zhang, X.F. Analysis of Precipitation Variation Characteristics in the Jinsha River Basin from 1957 to 2015. China Rural Water Hydropower 2019, 32, 22–27. (In Chinese) [Google Scholar] [CrossRef]
- Xi, Y.; Huang, X.; Li, J. Analysis on variation features of Precipitation in the Jinsha River Basin. People’s Yangtze River 2017, 48, 50–55, 65. (In Chinese) [Google Scholar] [CrossRef]
- Zhao, Q.; Ming, Q. Climate change characteristics and its impact on eco-environment in Jinshajiang area from 1971 to 2009. J. Meteorol. Environ. 2010, 26, 18–23. (In Chinese) [Google Scholar] [CrossRef]
- Zhang, H.; Zhou, J.; Zeng, X.; Guo, J.; Wang, C. Inconsistency Analysis of Spatial and Temporal Evolution of Precipitation and Runoff in the Jinsha River Basin. Hydrology 2015, 35, 90–96. (In Chinese) [Google Scholar] [CrossRef]
- Zhang, M.; Huang, X.R.; Wang, Y.J. Analysis of Runoff Evolution Process and Influencing Factors in the Jinsha River Basin. Water Resour. Power. 2022, 40, 27–31. (In Chinese) [Google Scholar] [CrossRef]
- Ye, Y.; Liang, L.; Gong, J.; Wang, Y.; Lei, X. Spatial-temporal characteristics of precipitation structure in the upper Yangtze River basin, China. Adv. Water Sci. 2014, 25, 164–171. (In Chinese) [Google Scholar] [CrossRef]
- Xiang, T.; Xie, Y.; Zeng, H. Analysis of Precipitation Change Characteristics in the Jinsha River Basin. J. China West Norm. Univ. (Nat. Sci. Ed.) 2025, 46, 631–639. Available online: https://d.wanfangdata.com.cn/periodical/CiBQZXJpb2RpY2FsQ0hJU29scjkyMDI2MDQyODE2MzExMRIUc2NzZnh5eGItenIyMDI1MDYwMTAaCGo5enNod3Vj (accessed on 24 April 2026). (In Chinese)
- Ren, Z.; Zhang, Q.; Gao, F.; Liu, Y.; Yang, J. CMA Meteorological Data Quality Control System. Adv. Meteorol. Sci. Technol. 2018, 8, 54–55. (In Chinese) [Google Scholar] [CrossRef]
- Li, B.; Pan, B.; Han, J. Basic Terrain Types of China and Their Indicating Factors. Quat. Sci. 2008, 28, 535–543. (In Chinese) [Google Scholar] [CrossRef]
- Dong, X.; Ni, X. Spatial and Temporal Variation Characteristics of Extreme Precipitation at Different Altitudes in Southwest China. J. Southwest Univ. (Nat. Sci. Ed.) 2022, 44, 110–121. (In Chinese) [Google Scholar] [CrossRef]
- Han, H.; Wu, H.; Huang, A. Temporal and Spatial Distributions of the Diurnal Cycle of Summer Precipitation over North China. Chin. J. Atmos. Sci. 2017, 41, 263–274. (In Chinese) [Google Scholar] [CrossRef]
- Yu, R.; Li, J.; Chen, H.; Yuan, W.; Wu, M. Simulation Study on Diurnal Variation Characteristics of Regional Precipitation in Eastern China. Acta Meteorol. Sin. 2014, 72, 1093–1105. (In Chinese) [Google Scholar] [CrossRef]
- Huang, X.; Wu, W.; Xu, J.; Xu, X.; Long, K. Applicability Assessment of ERA5-Land Precipitation Reanalysis Data in Southwest China. Plateau Meteorol. 2023, 42, 1562–1575. (In Chinese) [Google Scholar] [CrossRef]
- Houze, R.A. Orographic Effects on Precipitating Clouds. Rev. Geophys. 2012, 50, RG1001. [Google Scholar] [CrossRef] [Scilit]
- Jiang, Y.; Han, S.; Shi, C.; Gao, T.; Zhen, H.; Liu, X. Evaluation of HRCLDAS and ERA5 Datasets for Near-Surface Wind over Hainan Island and South China Sea. Atmosphere 2021, 12, 766. [Google Scholar] [CrossRef] [Scilit]
- Huang, X.; Han, S.; Shi, C. Multiscale Assessments of Three Reanalysis Temperature Data Systems over China. Agriculture 2021, 11, 1292. [Google Scholar] [CrossRef] [Scilit]
- Wang, Q.; Li, W.; Xiao, C.; Ai, W. Evaluation of High-Resolution Crop Model Meteorological Forcing Datasets at Regional Scale: Air Temperature and Precipitation over Major Land Areas of China. Atmosphere 2020, 11, 1011. [Google Scholar] [CrossRef] [Scilit]
- Huang, X.; Wu, W.; Xu, X.; Long, K.; Li, S. Study on the Suitability of Surface Meteorological Stations in Sichuan Province Based on Topographic Relief. J. Arid Meteorol. 2023, 41, 579–588. (In Chinese) [Google Scholar] [CrossRef]
- Tang, G.; Song, J. Comparison of Slope Classification Methods in Slope Mapping from DEM. J. Soil Water Conserv. 2006, 20, 157–160+192. (In Chinese) [Google Scholar] [CrossRef]
- Liu, Y.; Tang, K. Slope Classification at Home and Abroad and Slope Composition in the Wangdonggou Experimental Area. Bull. Soil Water Conserv. 1987, 3, 59–65. Available online: https://kns.cnki.net/kcms2/article/abstract?v=uxn9QsgV9c8NEyZTDQ5Nbi8EvDsd4XCg_E9XChx9dO5J1J7Ylt3JVKiyiIfe0AQjb0xQjN92X9DWb3GukoGUH5i8piYfoObgYsiNYCF-RGCbf_Xj77z3OE0J4tJN_ckXk3ldIM8PLqN-nsanCZ-48CGn_o9b__ObzMbxcRs_YCyqO47lWpfFBw==&uniplatform=NZKPT&language=CHS (accessed on 24 April 2026). (In Chinese)
- Huang, X.; Xiang, X.; Wang, L.; Xu, X.; Wu, W. Applicability Study of Global IMERG Satellite Retrieval and ERA5 Land Reanalysis Precipitation in Sichuan Region. J. Meteorol. Environ. 2024, 40, 65–75. (In Chinese) [Google Scholar] [CrossRef]
- Huang, X.; Xu, X.; Wu, W.; Long, K.; Li, S. Topographic Characteristic Analysis of Surface Meteorological Stations in Sichuan Province Based on DEM. Plateau Mt. Meteorol. Res. 2022, 42, 135–142. (In Chinese) [Google Scholar] [CrossRef]
- Shi, L.; Wan, Y.; Zhang, D.; Wang, Y.; Wang, C. Accuracy Evaluation of CMPA Precipitation Data over Different Terrains in China. J. Meteorol. Sci. 2018, 38, 616–624. (In Chinese) [Google Scholar] [CrossRef]
- Kirshbaum, D.J.; Adler, B.; Kalthoff, N.; Barthlott, C.; Serafin, S. Moist Orographic Convection: Physical Mechanisms and Links to Surface-Exchange Processes. Atmosphere 2018, 9, 80. [Google Scholar] [CrossRef] [Scilit]
- Barros, A.P.; Lettenmaier, D.P. Dynamic Modeling of Orographically Induced Precipitation. Rev. Geophys. 1994, 32, 265–284. [Google Scholar] [CrossRef] [Scilit]
- Duan, A.; Hu, D.; Hu, W.; Zhang, P. Precursor Effect of the Tibetan Plateau Heating Anomaly on the Seasonal March of the East Asian Summer Monsoon Precipitation. J. Geophys. Res. Atmos. 2020, 125, e2020JD032948. [Google Scholar] [CrossRef] [Scilit]

Disclaimer/Publisher’s Note: The statements, opinions and data contained in all publications are solely those of the individual author(s) and contributor(s) and not of MDPI and/or the editor(s). MDPI and/or the editor(s) disclaim responsibility for any injury to people or property resulting from any ideas, methods, instructions or products referred to in the content. |
© 2026 by the authors. Licensee MDPI, Basel, Switzerland. This article is an open access article distributed under the terms and conditions of the Creative Commons Attribution (CC BY) license.