


Abstract
In the period 2 to 4 March 2026, two rainstorms with intense convective weather occurred within and in the vicinity of Hong Kong, China, in the early rain season of the year in southern China. This is rather uncommon because the atmosphere is still generally stable (with very low or even zero value of convective available potential energy), and upper tropospheric divergence does not yet exist in the region climatologically. The rain episode is documented in this paper from both observational and forecasting aspects. On the observational side, a low-level vortex is found on and near the surface based on Doppler velocity measurements from a newly installed C-band solid-state weather radar. Combining the three-dimensional wind field as retrieved from the weather data and the measurements from the other ground-based remote-sensing meteorological equipment, the intense convection is mainly triggered by middle to lower tropospheric waves, and the vertical circulation in the atmospheric boundary layer may be stretched vertically upward to form the low-level vortex. In the second rainstorm, features of elevated thunderstorms are also identified. On the forecasting side, a high-resolution, limited-area atmosphere–ocean–wave coupled model manages to capture the occurrence and the timing of the heavy rain. The sub-seasonal forecast by a global model also provides a useful indication of the occurrence of above-normal rainfall over southern China, with a rather special feature of a deep and stationary westerly trough located to the north of the Indochina Peninsula. The microscale cyclone could be successfully picked up by the real-time run of a high-resolution numerical weather prediction model with data assimilation. This paper also discusses the weather service aspect of this rather unusual rainstorm episode.
1. Introduction
The rainy season in Hong Kong starts as early as March each year and lasts till June, before the occurrence of heavy rain associated with the more frequent occurrence of tropical cyclones [1,2]. Some scholars define the first rainy season in Guangdong as April to June [3]. In March and April, the rain can be associated with cold fronts or troughs of low pressure, with the occurrence of cold fronts becoming less frequent in May and June. The fronts/troughs near the surface are associated with mid-tropospheric westerly waves and sometimes upper-tropospheric divergence, leading to the occurrence of heavy and passing showers over the territory [4].
At the beginning of March 2026, still within the 15-day period of the Chinese New Year, Hong Kong experienced rainstorms twice, with the issuance of amber rainstorm warnings (widespread occurrence of hourly rainfall of 30 mm or more over the territory; an introduction to the rainstorm warning system in Hong Kong can be found at https://www.hko.gov.hk/en/wservice/warning/rainstor.htm (accessed on 6 March 2026)) for two consecutive nights, namely, in the evening of 2 March 2026 with the arrival of a cold front from the north, and in the overnight period of 3 to 4 March 2026, when the territory was affected by the northeast monsoon. This heavy rain episode is significant in a number of aspects. (a) The highest daily rainfall was recorded at the Hong Kong Observatory (HKO) headquarters during the Spring Lantern Festival (68.0 mm), the last day of the 15-day period of Chinese New Year, when members of the public had gone out at night to see the full moon and the lantern displays since records began in 1884. The previous record dates back to 1959, with a daily rainfall of 45.7 mm, and such events are rare because it is still very early springtime in Hong Kong, according to climatology. (b) They were the earliest rainstorm warnings issued for Hong Kong since past events in January and February of previous years (amber rainstorm warnings on 5 January 2016, 13 February 2020, and 19 February 2019). (c) The highest rainfall over a 3-day period was recorded in early March (2 to 4 March 2026), with a total rainfall of 149.4 mm (15.4 mm + 68.0 mm + 66.0 mm), nearly double the climatology (1991 to 2000) of rainfall for the whole month of March at the HKO headquarters (75.3 mm). The intensity of rain and its persistence were exceptional. Moreover, thunderstorms have been recorded within the territory, which is rather uncommon given the season (the last documented event can be found in [5], with elevated thunderstorms near Hong Kong). This episode adds to the growing documentation of atypical early or pre-summer extreme rainfall events in South China driven by unusual circulation patterns [6]. This study addresses the following research questions:
- 1.
- What are the synoptic and mesoscale mechanisms that triggered and sustained intense convection during this early-season rainstorm episode under low-CAPE conditions?
- 2.
- How did the newly installed C-band solid-state weather radar and three-dimensional wind field retrieval enhance the understanding of low-level vortex formation and evolution?
- 3.
- To what extent can current numerical weather prediction models capture the timing, location, and intensity of such atypical early-season convective events?
- 4.
- What are the implications of this event for weather forecasting and warning services in southern China during the early rain season?
The innovations of this study include: (i) the first application of Doppler velocity data from the newly installed C-band solid-state radar at Cheung Chau for observing low-level vortices in early spring convection over southern China; (ii) the construction of three-dimensional wind fields down to 1 km above sea level over the southern part of Hong Kong, enabled by the low-level scanning capability of the new radar; (iii) the first real-time use of cloud liquid water content (CLWC) profiles derived from ground-based microwave radiometer measurements using machine learning techniques [7] for studying temporal changes in a heavy rain episode; (iv) the successful simulation of a microscale cyclone using a high-resolution WRF model with dense vertical levels in the atmospheric boundary layer and building effect parameterization (BEP); and (v) the demonstration of useful sub-seasonal forecast signals for above-normal rainfall about 1–3 weeks ahead, associated with a stationary westerly trough configuration.
The thesis of this paper is that the March 2026 rainstorm episode represents a previously under-documented class of early-season convective events in southern China, characterized by elevated convection and low-level vortex formation under low-CAPE conditions, driven primarily by middle-to-lower tropospheric wave activity and boundary-layer vertical circulation stretching, rather than the traditional ingredients of high instability and upper-tropospheric divergence. This study demonstrates that the integration of new observational technologies—including Doppler radar, radar wind profilers, microwave radiometers, and high-resolution numerical models with data assimilation—provides critical insights into the mechanisms of such atypical events and improves the potential for their prediction.
In this paper, the synoptic and mesoscale aspects of the heavy rain episode are reviewed. Observational studies are conducted, in addition to the conventional meteorological equipment in Hong Kong, following the introduction of some new weather data in the territory, namely, the Doppler velocity observation and the three-dimensional radar-based wind field constructed just after the newly installed C-band solid-state radar in Hong Kong, and the availability of cloud liquid water content (CLWC) profile estimates based on machine learning results of ground-based microwave radiometer measurements. The nowcasting and forecasting aspects of the episode are also reviewed, studying the performance of an atmosphere–ocean–wave coupled model [8] and the European Centre for Medium Range Weather Forecast (ECMWF) sub-seasonal model.
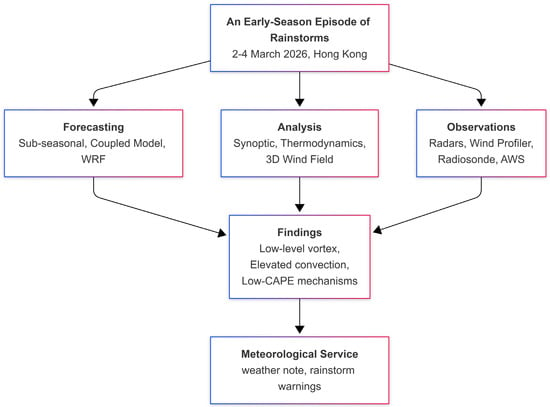
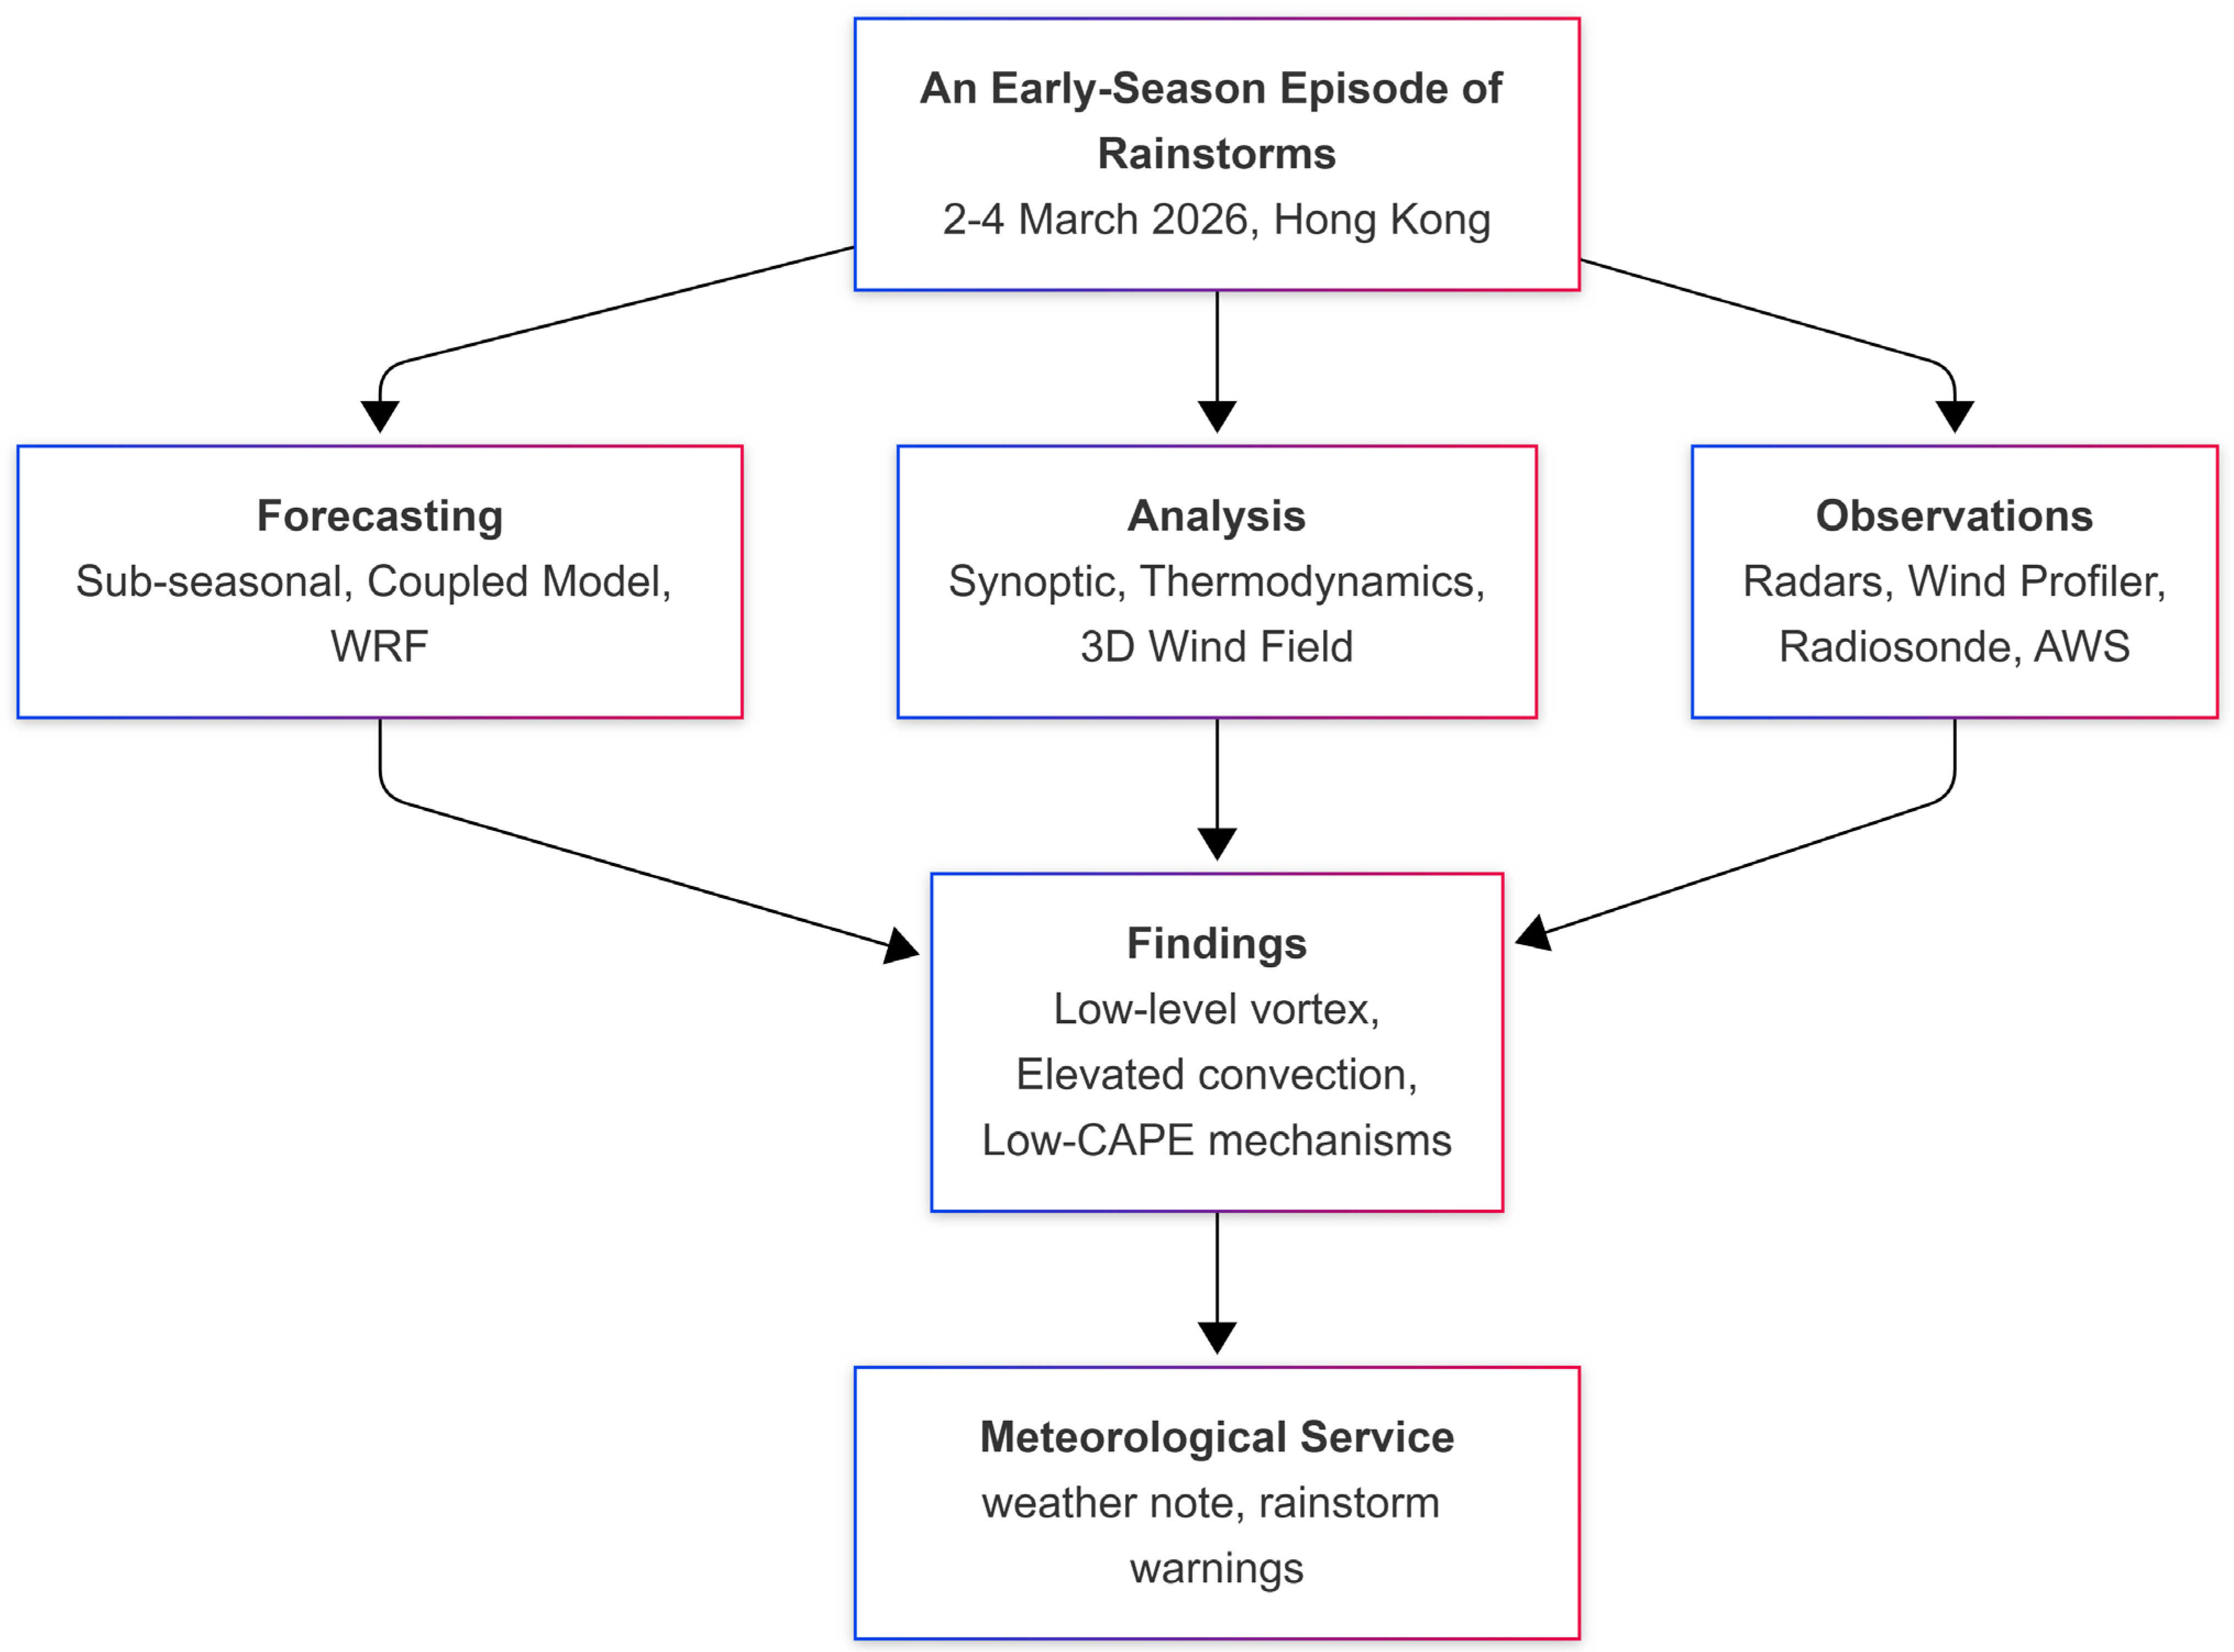
Figure 1 provides a flowchart summarizing the study design and methodology. The analysis proceeds from event identification and data collection through synoptic and thermodynamic analysis, 3D wind field retrieval, forecasting assessment, and finally to mechanism identification and service implications. The multi-platform approach integrates conventional observations, remote sensing data from newly commissioned instrumentation, and numerical model outputs to provide a comprehensive understanding of this atypical early-season convective event.
Figure 1.
Flowchart of the study design showing the methodology for analyzing the March 2026 rainstorm episode in Hong Kong. The study integrates multi-platform observations (surface stations, radiosonde, radar wind profiler, microwave radiometer, and four weather radars, including the newly installed C-band solid-state radar at Cheung Chau), numerical weather prediction model outputs (atmosphere–ocean–wave coupled model, WRF, and sub-seasonal ECMWF forecasts) to investigate the synoptic, mesoscale, and thermodynamic mechanisms of early-season convection under low-CAPE conditions.
2. Meteorological Equipment and Analysis
The nearly continuous (updated every 10 min) upper air winds in Hong Kong are available from the boundary-layer type radar wind profiler in the downtown part of the territory. Three components of the wind are measured up to a height of about 9 km above ground. In between the rain (when the wind profiler mainly gives the terminal velocity of rain droplets), the vertical motion of the air can be measured by tracking the motion of refractivity discontinuity of the atmosphere using electromagnetic waves with a frequency of about 1299 MHz. Line-of-sight wind measurements are made using three beams in sequence in order to contrast the three components of the wind. For winds at higher altitudes specifically, the equipment’s consensus algorithm assumes spatial uniformity of the wind during retrieval.
Three units of 14-channel microwave radiometers are operated in Hong Kong, using 7 oxygen channels for temperature measurements and 7 water vapor channels for humidity measurements. Only the radiometer in the downtown part of the territory is considered. It is installed at the radiosonde station in Hong Kong and is nearly co-located with the radar wind profiler. In the current study, the precipitable water vapor (PWV) product from the radiometer is considered. The thermodynamic profiles from the radiometer are also used in conjunction with the radar wind profiler data to provide hourly updated meteorological parameters, such as vertical wind shears and stability indices of the troposphere. Following the method of [7], CLWC profiles are used in real time for the first time to study their temporal changes in a heavy rain episode.
There are two units of S-band surveillance radars in Hong Kong, both on mountain tops. One of them is located at Tai Mo Shan (TMS), the highest point in Hong Kong, with an altitude of about 1 km above mean sea level. These radars are used to monitor the evolution of rain over a wide area centered at Hong Kong (with a measurement range up to 512 km from the radar) and to nowcast the rain cell movements and thus the rainfall in Hong Kong following various image processing and machine learning methods.
A major novelty of this paper is the observation provided by a C-band solid-state radar at Cheung Chau (CCH), a small island in the southern part of Hong Kong, just after its installation and initial tests. It is a dual polarization Doppler weather radar with a measurement range of about 300 km. In contrast to the S-band surveillance radars in Hong Kong, it is located near sea level to provide unique measurements of the radar reflectivity and Doppler velocity within the atmospheric boundary layer, particularly for the rain cells or rainbands moving in from the west or from the south of Hong Kong. Though it is newly installed, its signal quality is found to be very good, and the Doppler velocity and reflectivity are subjectively considered to be reasonable, through occasional comparisons that are made with the other wind measurements and the reflectivity fields from S-band radars, and more quantitative evaluations are still in the planning stage and will be reported in the literature in the future to establish the quality of the new solid-state radar technology. Moreover, the current rain episode is the first heavy rain event to occur over southern China after the installation of this radar, and there are no previous cases with which to establish the quality of measurements obtained using this new technology for the heavy rain in southern China.
Following the availability of the low-level scanning data from CCH radar, three-dimensional (3D) wind fields [9,10] in the rain areas are constructed for the first time, following the method described in [11], by combining the wind and reflectivity data from four radars, namely, CCH, TMS, a phased array weather radar at Sha Lo Wan, and the Zhu Ao (ZAR) radar located to the west of Macao, down to an altitude of 1 km above sea level, which is within the atmospheric boundary layer. Previously, because of the absence of low-level radar data over the southern part of Hong Kong (with the S-band radars installed on mountain tops in the territory and oriented with an elevation angle relative to the horizon), good-quality 3D wind field data are only available from a height of 2 km above sea level. The observation from the 1 km wind field will also be reported in this paper. However, since the CCH radar is only newly available, this is the first time that a 1 km wind field has been constructed over the southern part of Hong Kong, and its quality can only be quantitatively assessed in the future with the accumulation of more heavy rain cases in Hong Kong that are reported in future papers.
3. Synoptic and Mesoscale Patterns
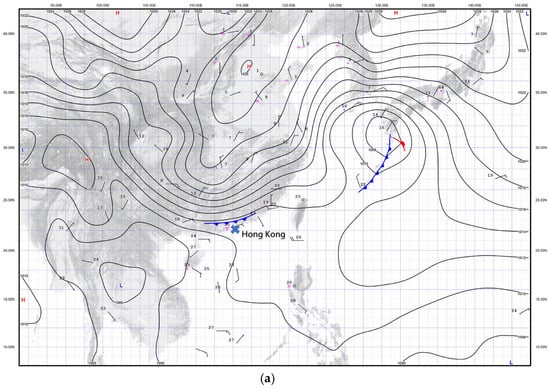
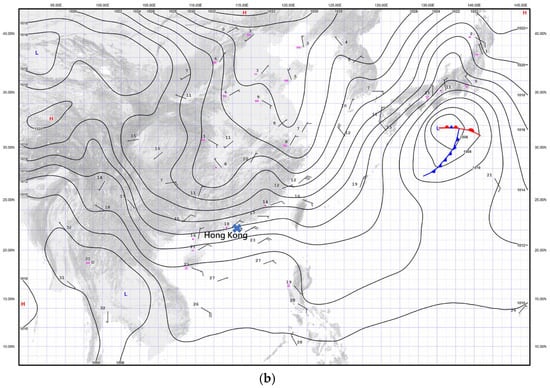
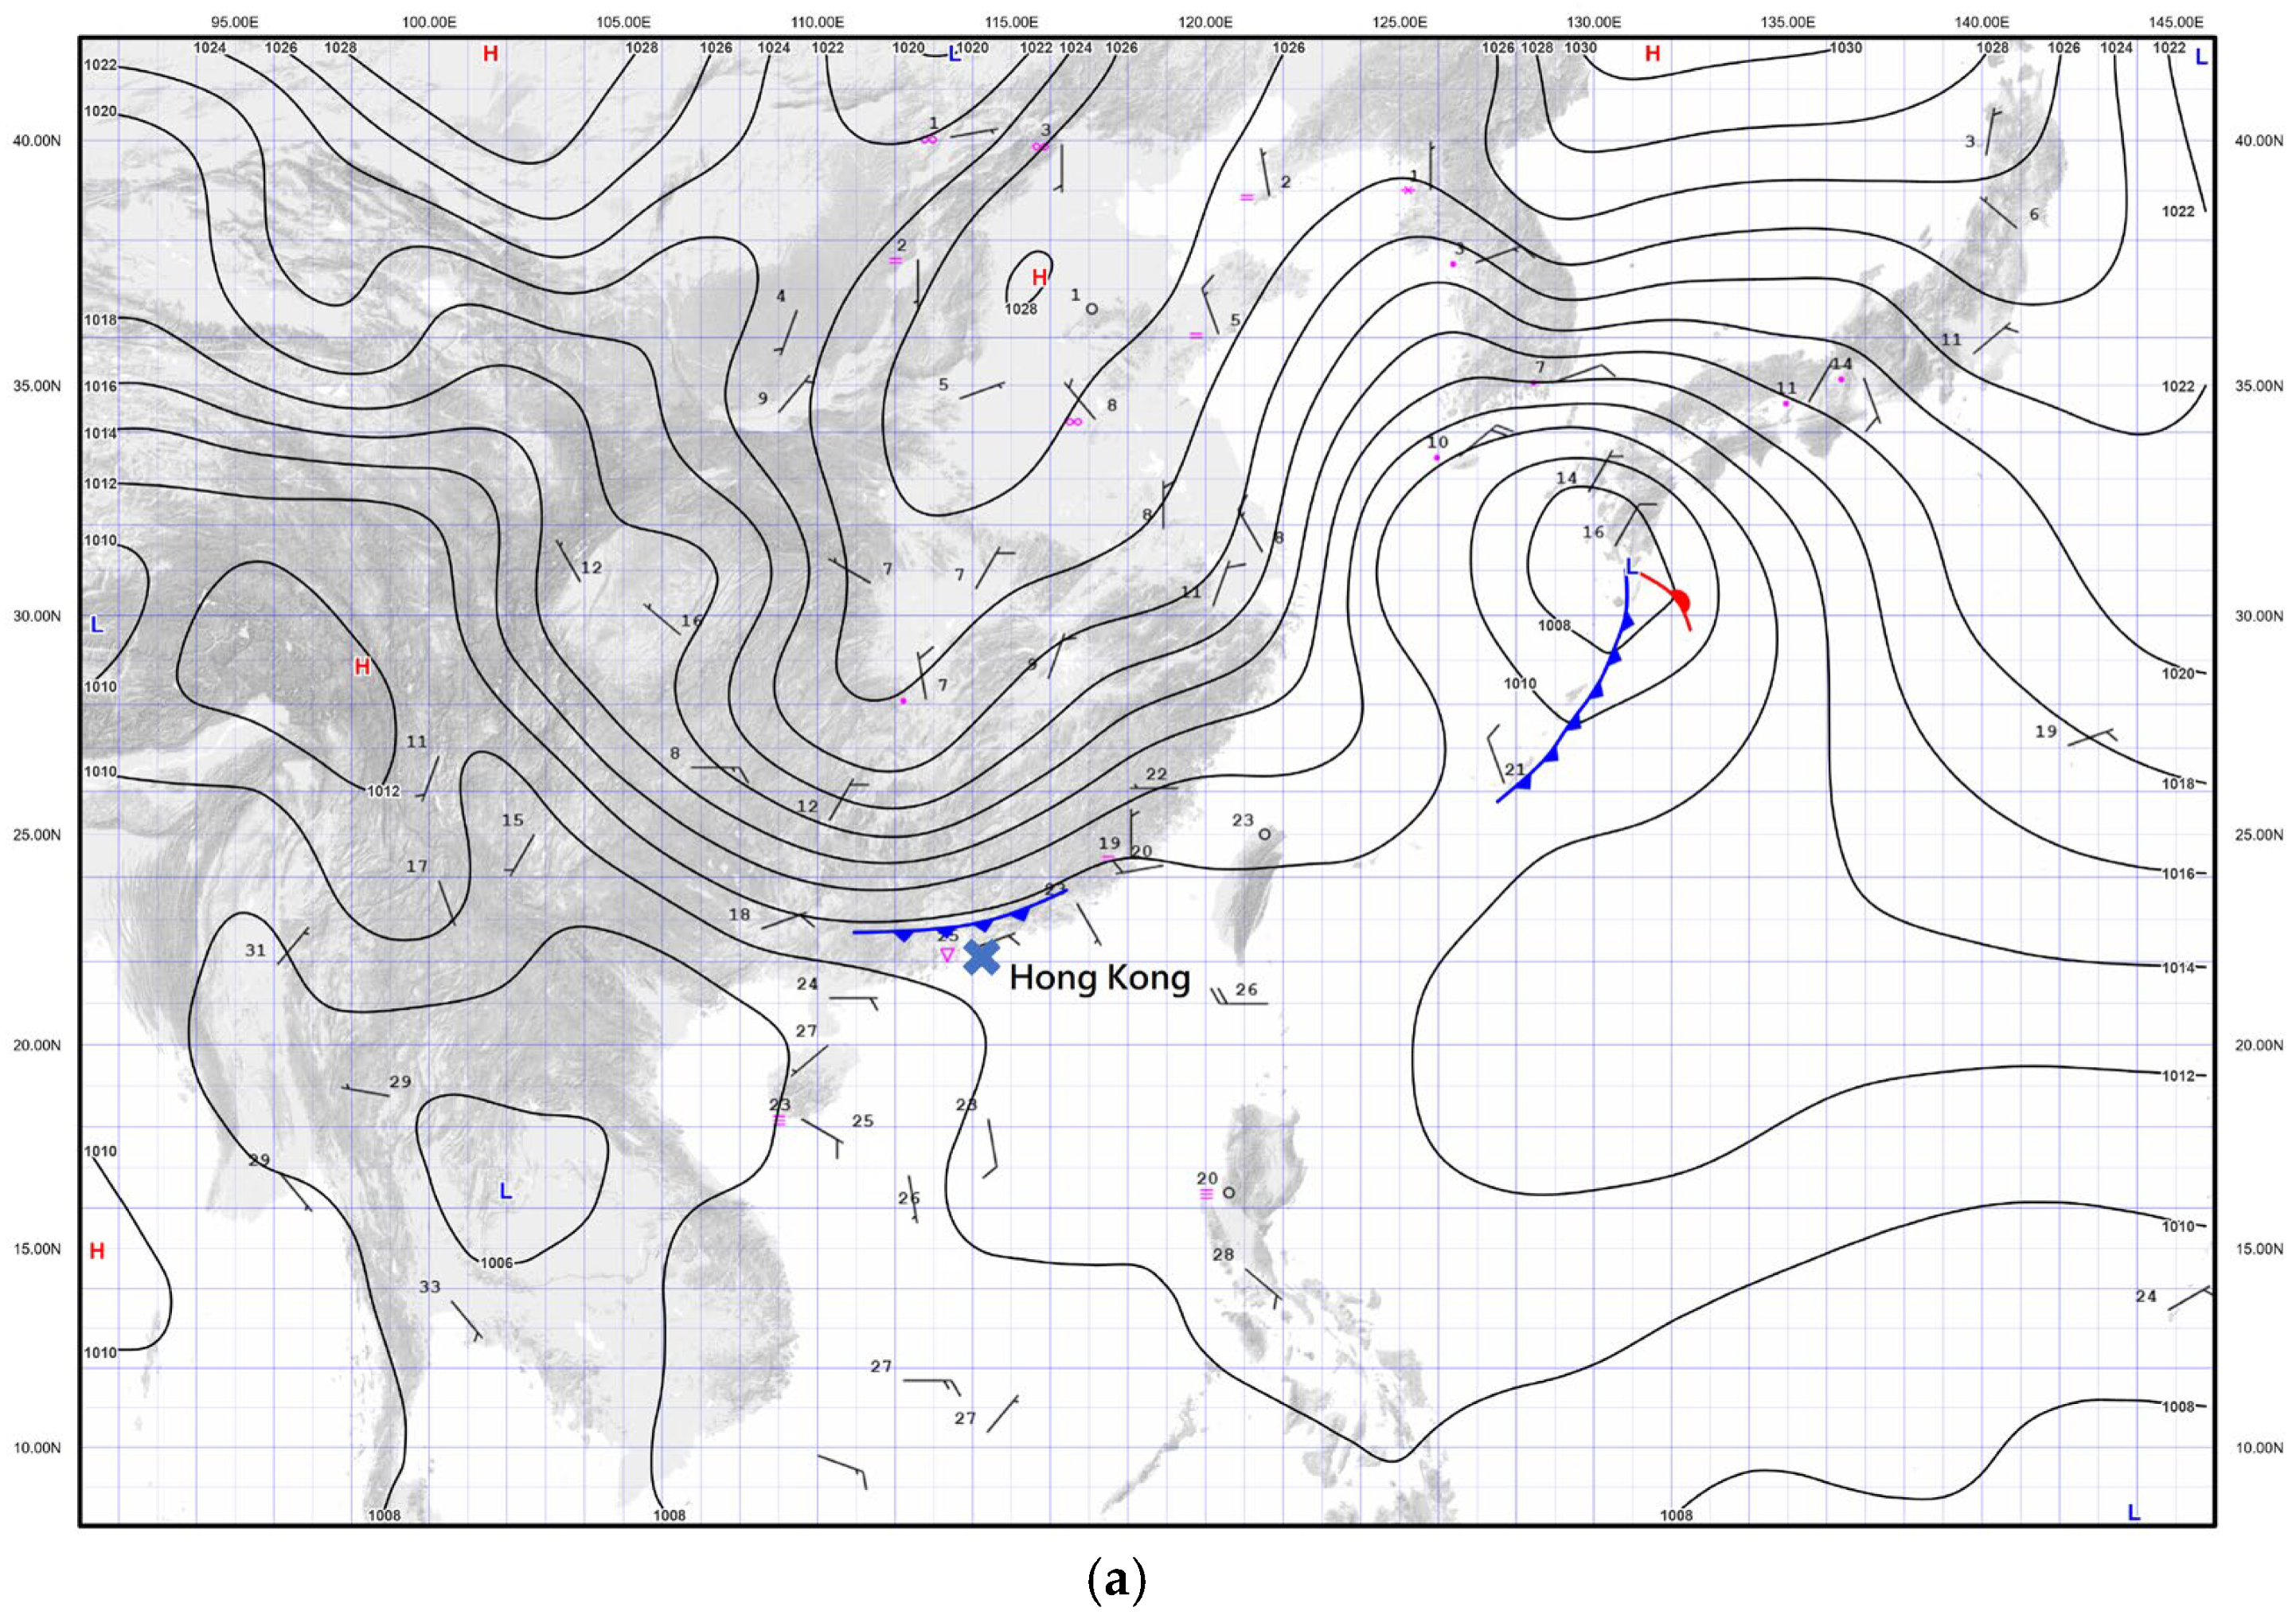
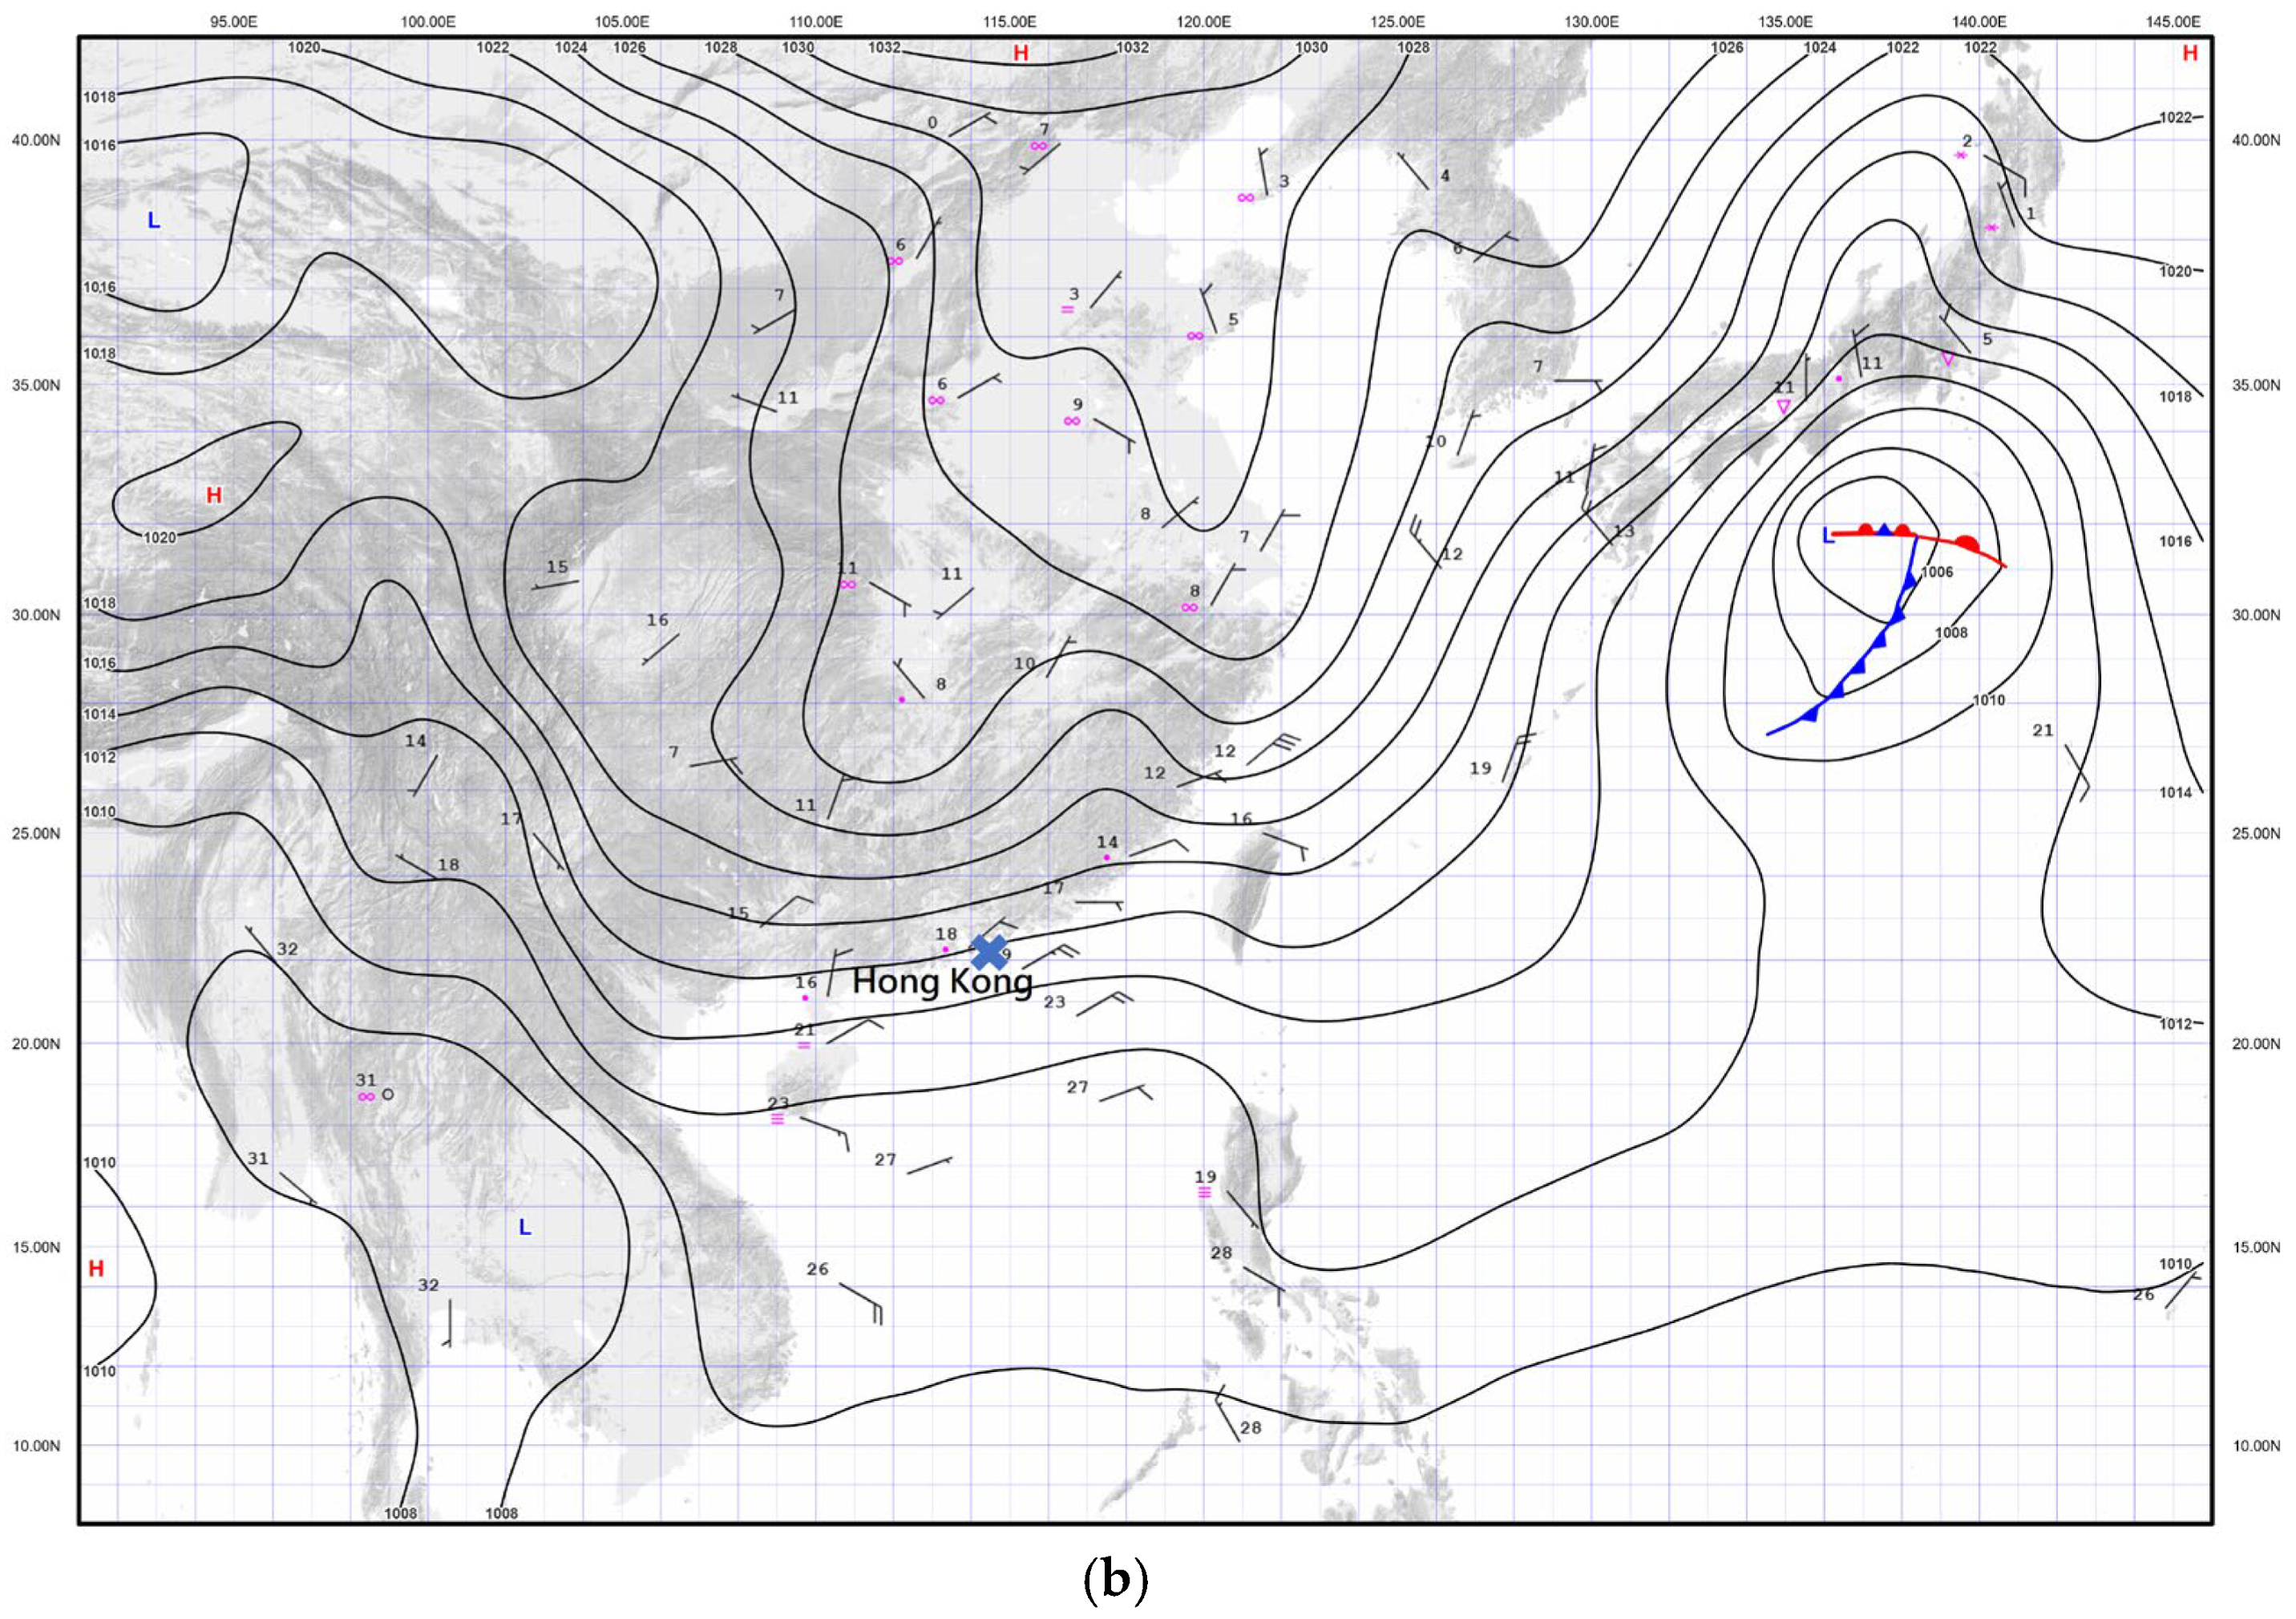
The surface isobaric charts for East Asia are shown in Figure 2. A cold front can be identified to the north of Hong Kong on the surface at around 20:00 local time (12 UTC, with Hong Kong time = UTC + 8 h, Figure 2a). Heavy rain occurs in Hong Kong in proximity to the cold front. The northeast monsoon to the rear of the front advances southward gradually and dominates over southern China on the next day (Figure 2b), following the dissipation of the cold front over the sea. The lower part of the atmospheric boundary layer is cooled down with the arrival of the continental air from the north, but intense convective weather still occurs over southern China, including Hong Kong, following the dominance of the northeast monsoon near the surface. This situation is not common and may be related to elevated thunderstorms, which have been analyzed in other parts of southern China in association with frontal activity [12,13,14].
Figure 2.
Surface isobaric chart at 12 UTC on (a) 2 March 2026 and (b) 3 March 2026.
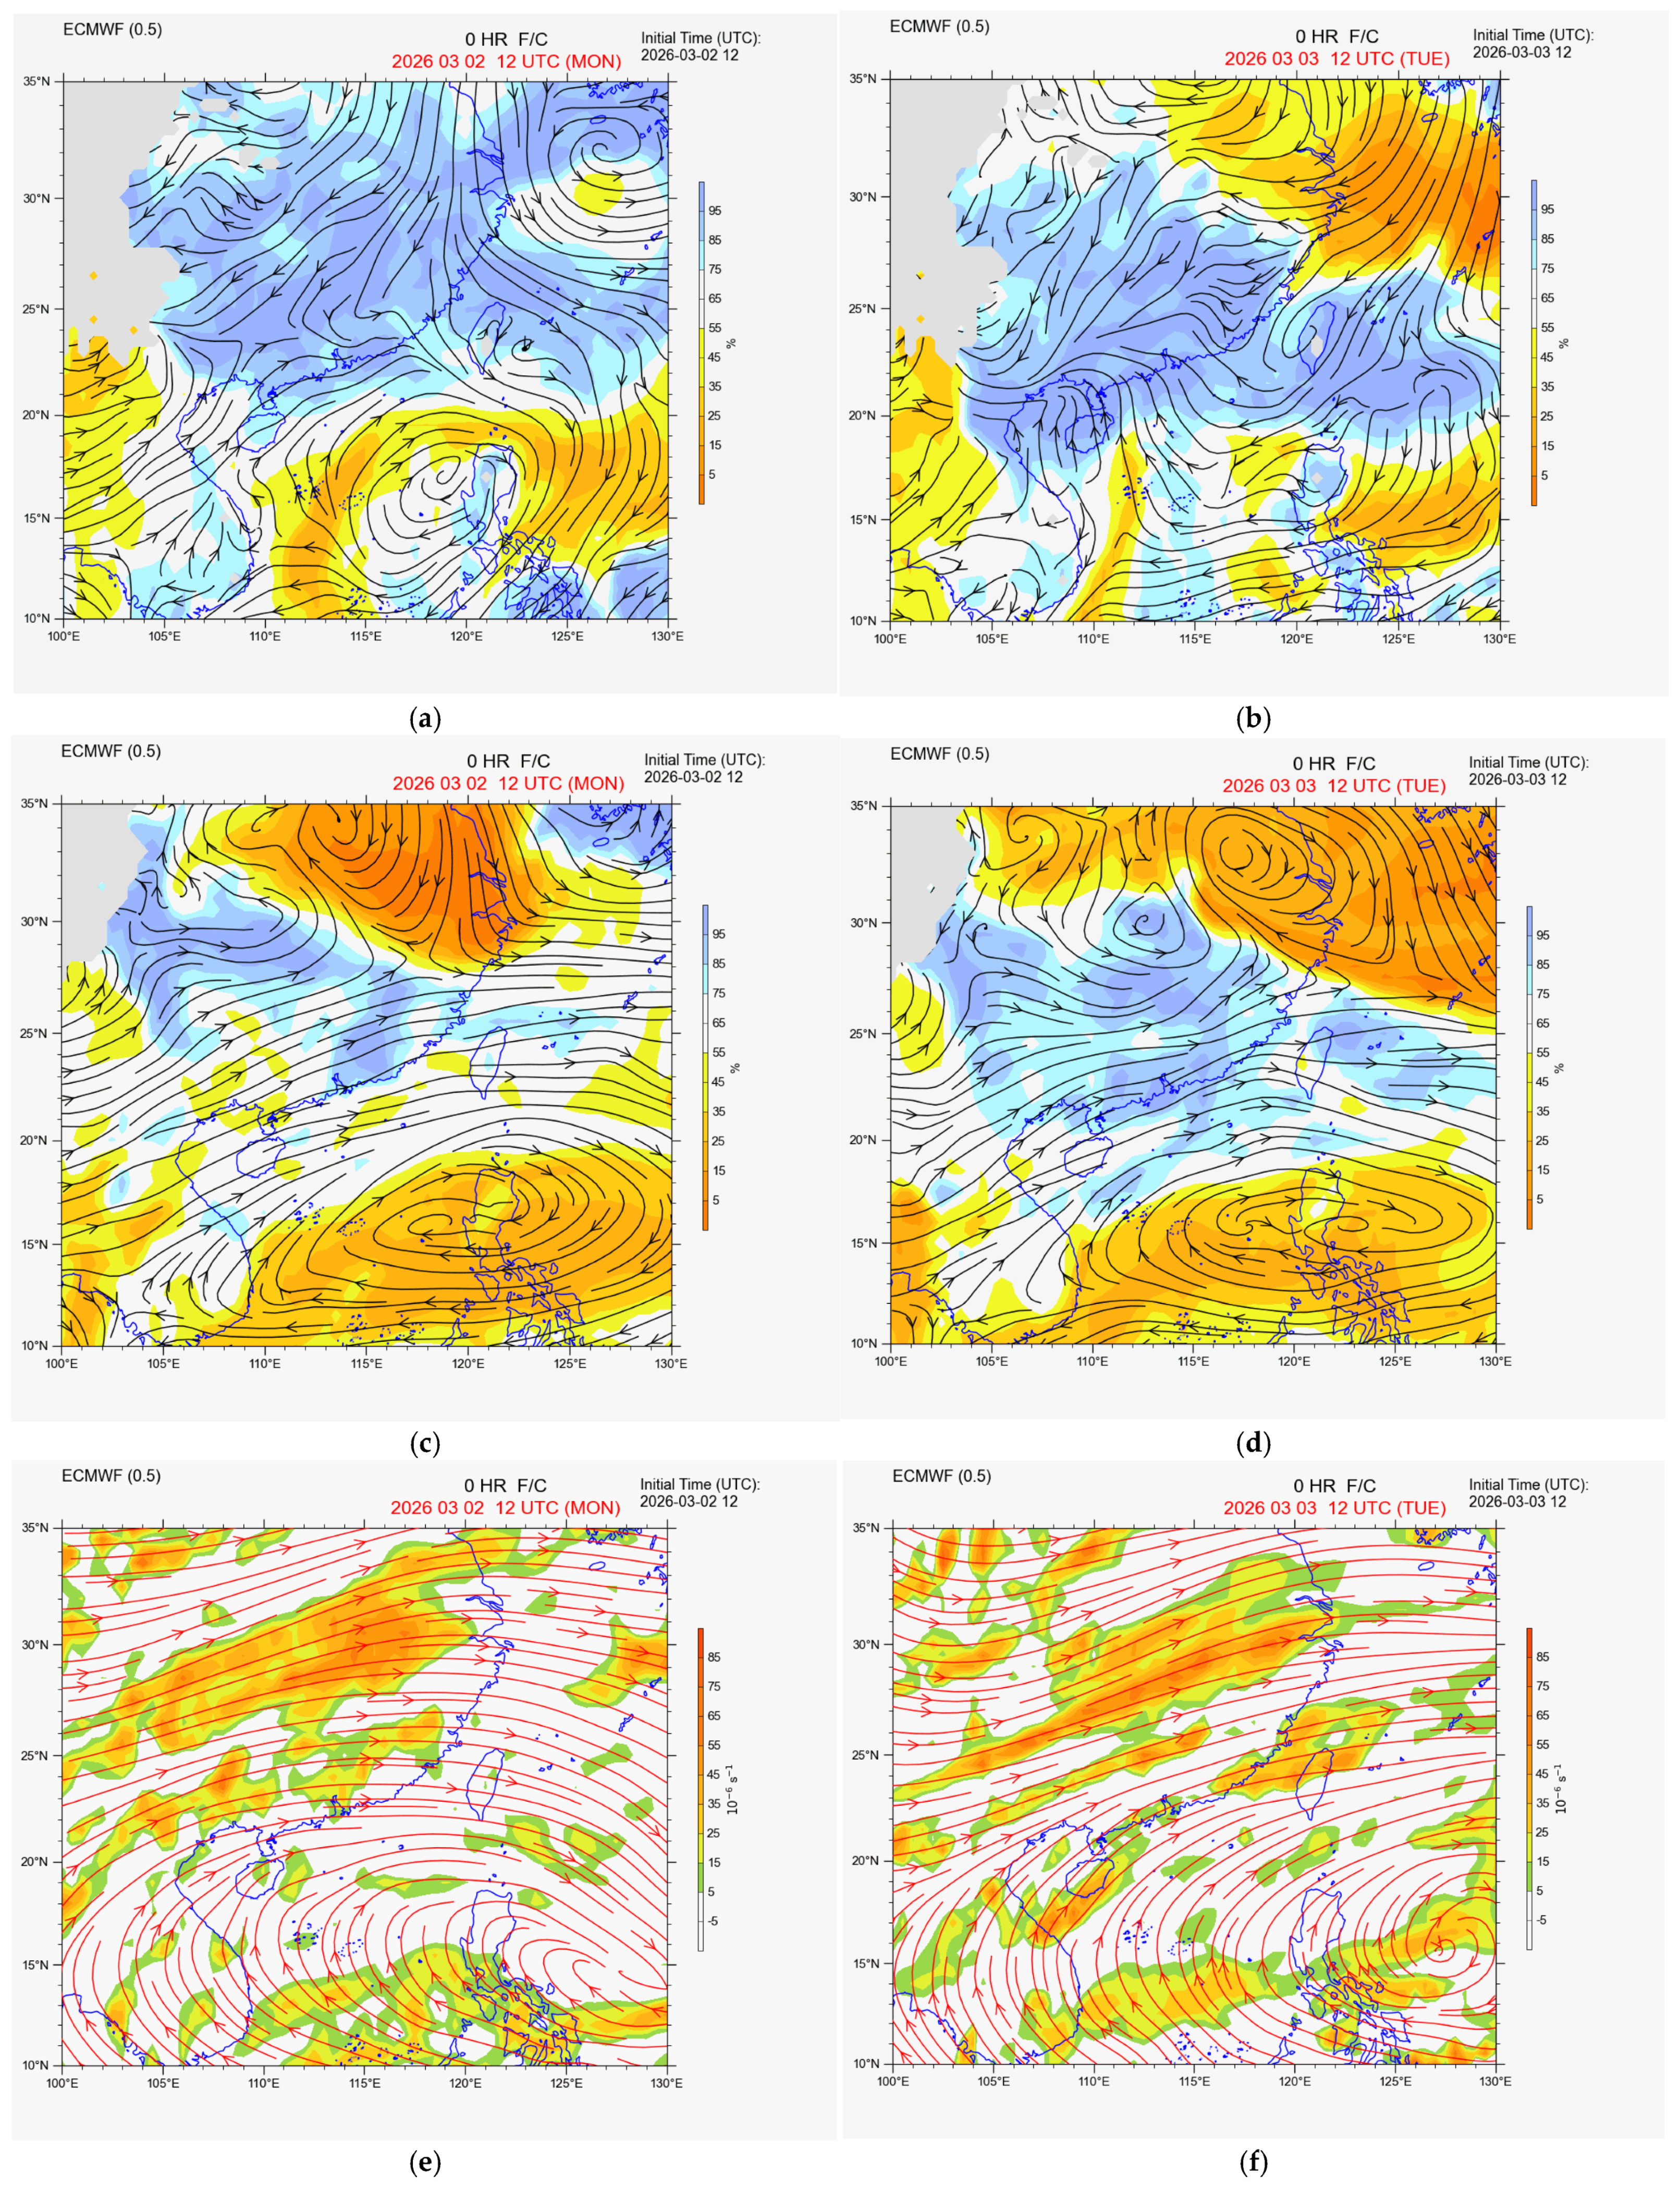
Upper-air analysis is available from the real-time operational analysis of the ECMWF Integrated Forecast System (IFS). From Figure 3a,c, it can be seen that, at 12 UTC on 2 March 2026, the south China coastal area is under the influence of the moist southwesterly winds ahead of the shearline over inland areas at 850 hPa, and some minor waves can be identified at 700 hPa. As a result, the convection in the evening on that day was mainly related to the arrival of the surface cold front, with some support from upper motion associated with mid-tropospheric westerly waves. On the following day, the 850 hPa shearline remains inland (Figure 3b), with prevailing southerly flow and moisture advection from the South China Sea along the coastal areas, though the 850 hPa wind speed along the coast is not particularly high (just about 10 knots). At the same time, wave motion is observed in the westerly winds in the middle troposphere (Figure 3d). As such, from the mesoscale analysis, though the near-ground air was cooled down with the arrival of the northeast monsoon in the evening of 3 March 2026, the under-cutting of the significant moisture flux near the top of the atmospheric boundary layer, together with the upward air motion triggered by the mid-tropospheric waves, was conducive to the occurrence of elevated convection [15,16].
Figure 3.
The ECMWF IFS analysis for (a,b) 850 hPa wind (streamlines) and humidity (color shading), (c,d) 700 hPa wind and humidity, and (e,f) 200 hPa wind and divergence (color shading).
It is interesting to note that, throughout the whole episode, the coast of southern China was under the influence of a broad anticyclone centered over the northwest Pacific in the upper troposphere, and no areas of significant upper-air divergence were observed at the 200 hPa level (Figure 3e,f). As such, though isolated convection may be expected with the arrival of the cold front in the evening of 2 March 2026, weather forecasters believed that the rain over southern China on 3 March 2026 was mostly stratiform, with possibly only very isolated convection, and thus thunderstorms were not included in the weather forecast for Hong Kong. This points to the importance of documenting the limited number of cases of elevated thunderstorms in the territory for larger-scale statistical analysis of this type of weather in Hong Kong in the future.
4. Thermodynamics, Precipitable Water Vapor (PWV), and Vertical Wind Profiles
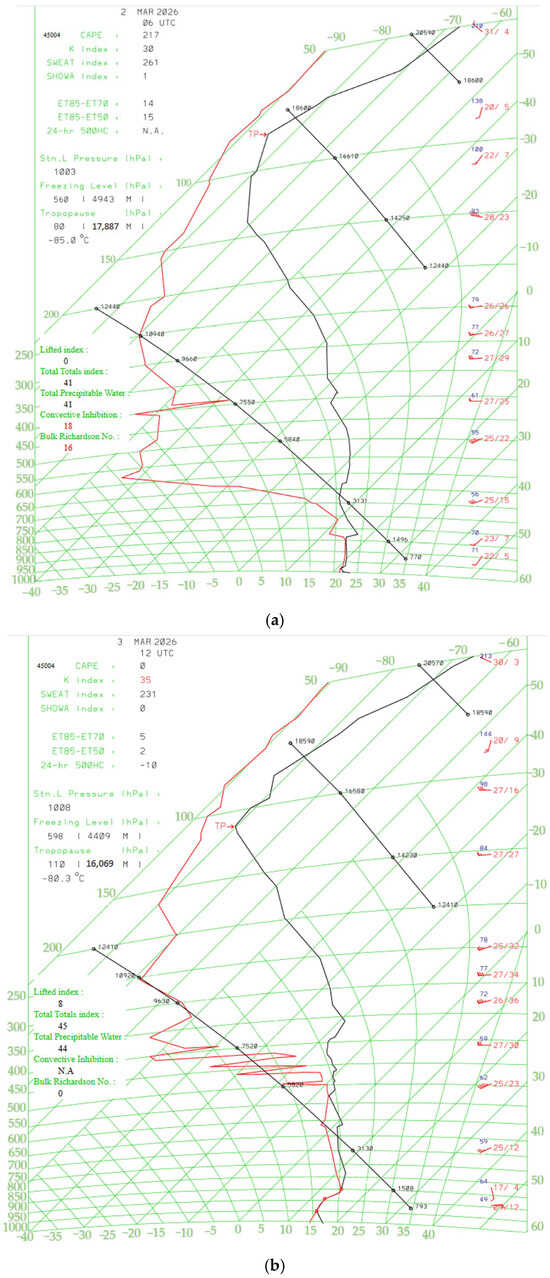
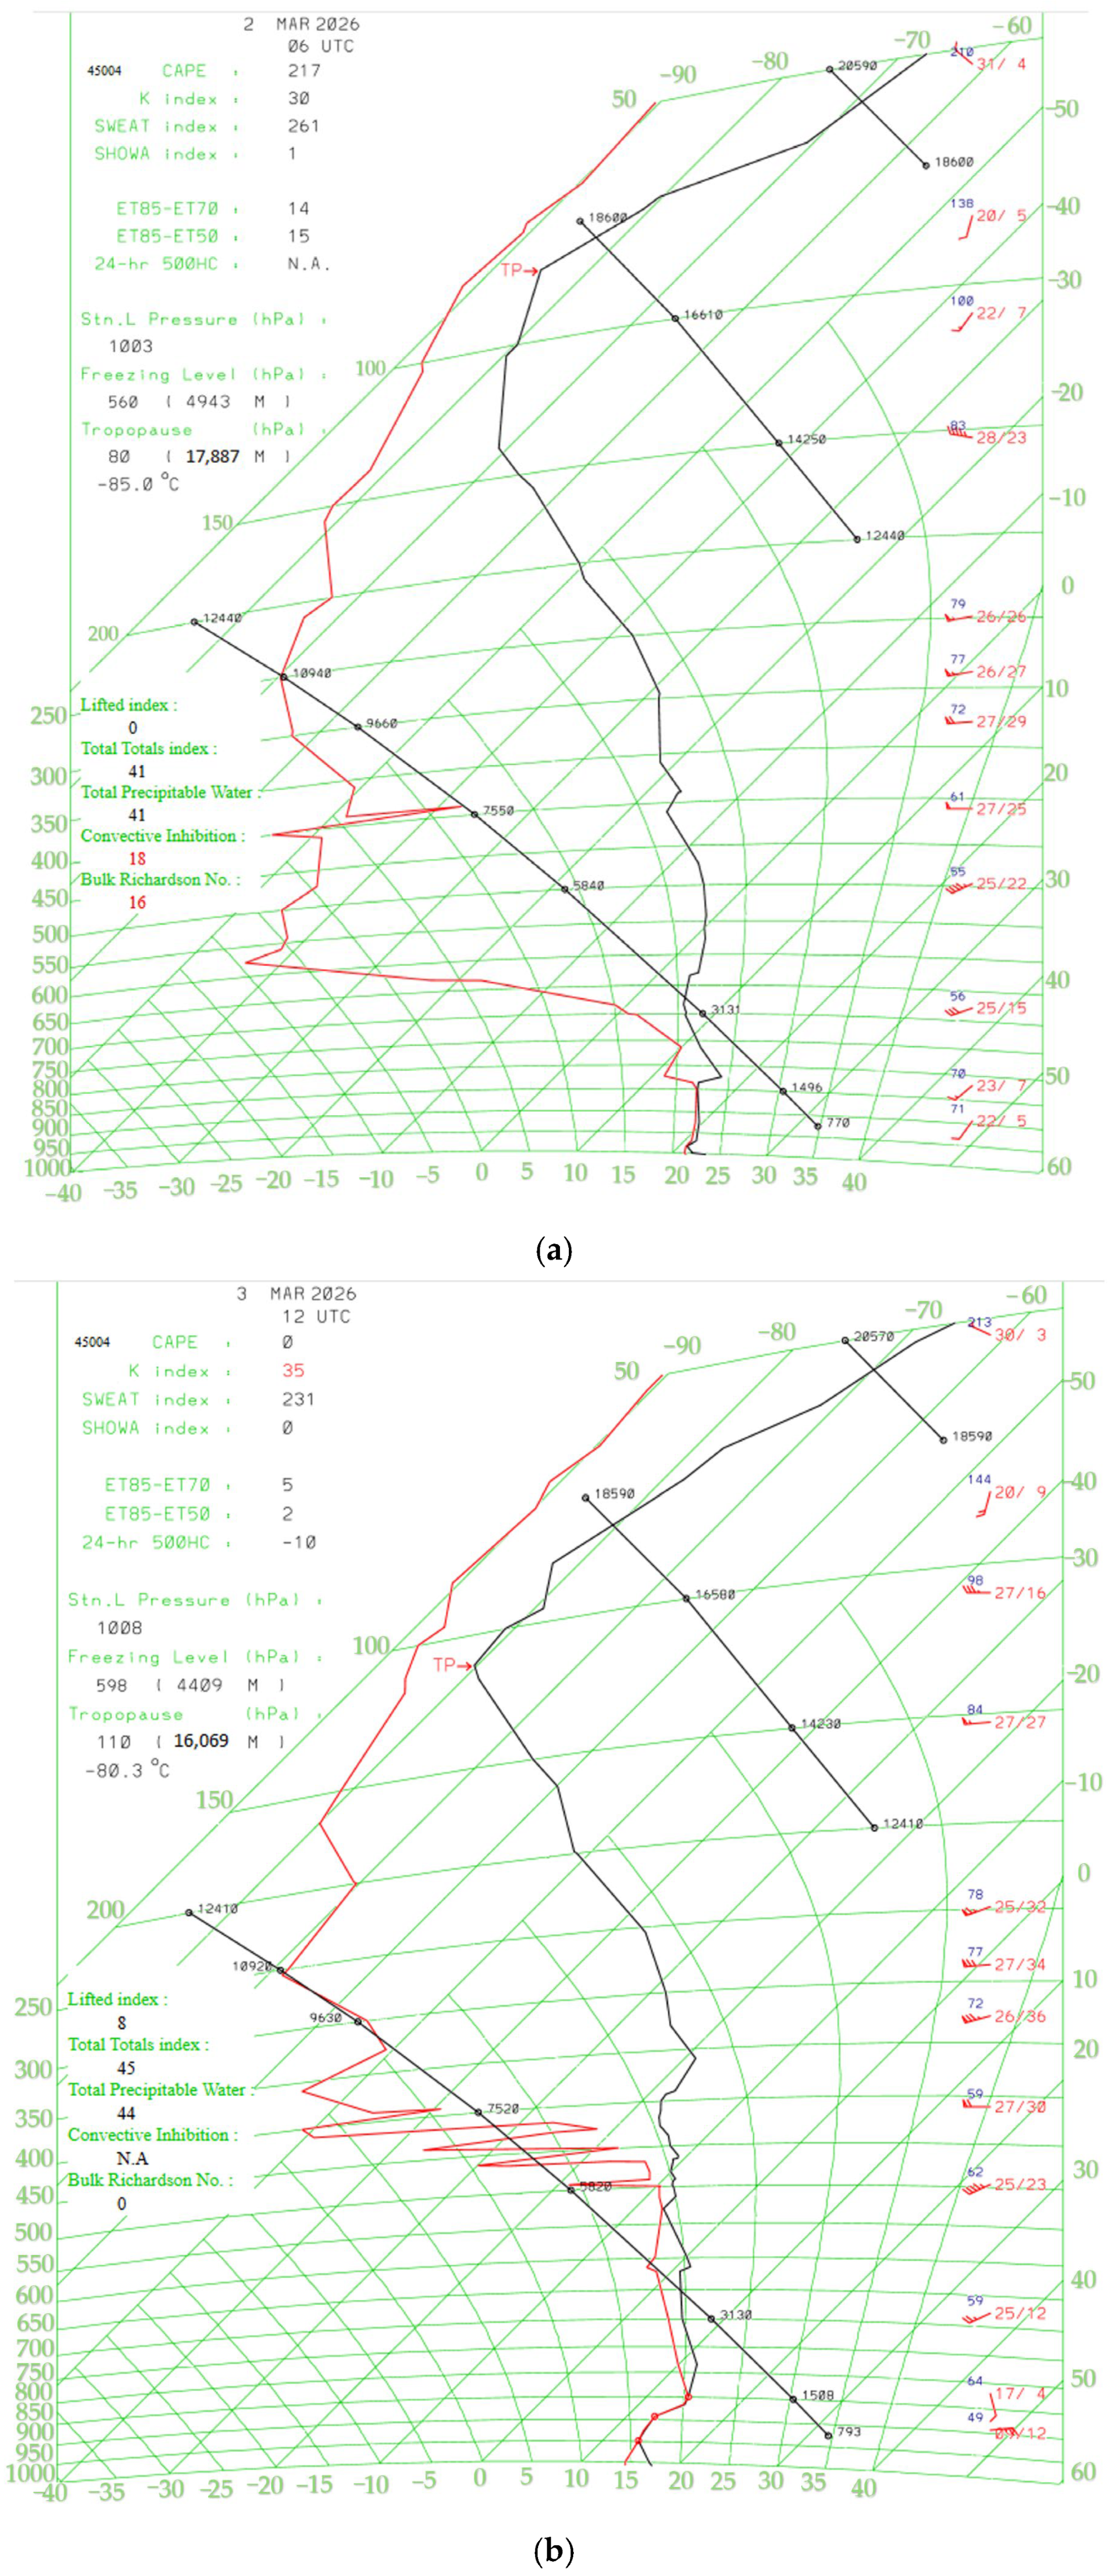
Before the arrival of the cold front over Hong Kong, a special radiosonde launch had been arranged at 06 UTC on 2 March 2026 (Figure 4a), in addition to the usual 00 and 12 UTC radiosonde launches for this “quieter” season for convection, in order to assess the chance of intense convective weather over the territory upon the arrival of the cold front a few hours later. It turns out that, though the K index was rather high following the moistening of the lower troposphere, the convective available potential energy (CAPE) was very low (only 217 J/kg). This is related to the occurrence of a temperature inversion of a few degrees Kelvin between 800 and 850 hPa levels (Figure 4a). This seems to be reminiscent of the capping inversion in other places in the world for the occurrence of intense convective weather under favorable weather conditions, e.g., a suitable triggering mechanism for upward motion of the air.
Figure 4.
Tephigrams for Hong Kong at (a) 06 UTC on 2 March 2026 and (b) 12 UTC on 3 March 2026.
On the following night (12 UTC on 3 March 2026, Figure 4b), with the dominance of the northeast monsoon, the atmospheric boundary layer was generally stable, as shown in the tephigram, with a CAPE value of 0 J/kg, though the K index was even higher than the previous day (reaching 35 degrees Celsius). The near-zero CAPE yet high K-index and moisture advection at the boundary-layer top are characteristic of environments favoring elevated rather than surface-based convection in pre-summer regimes over South China [17]. The southerly flow with moisture flux from the sea only occurs around the top of the atmospheric boundary layer. The air from the surface may be lifted up through (i) under-cutting of the warmer and moister air by the near-surface cooler air, and (ii) upward motion of the air ahead of the mid-tropospheric waves. As such, the air parcels at about 850 hPa may be lifted to the upper troposphere with the occurrence of intense convection. The data from the radiosonde seem to suggest a background atmosphere that may favor the occurrence of elevated thunderstorms [18].
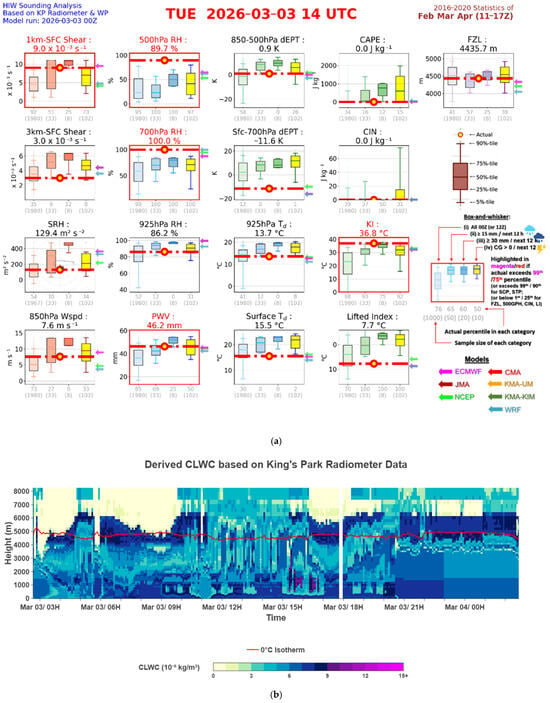
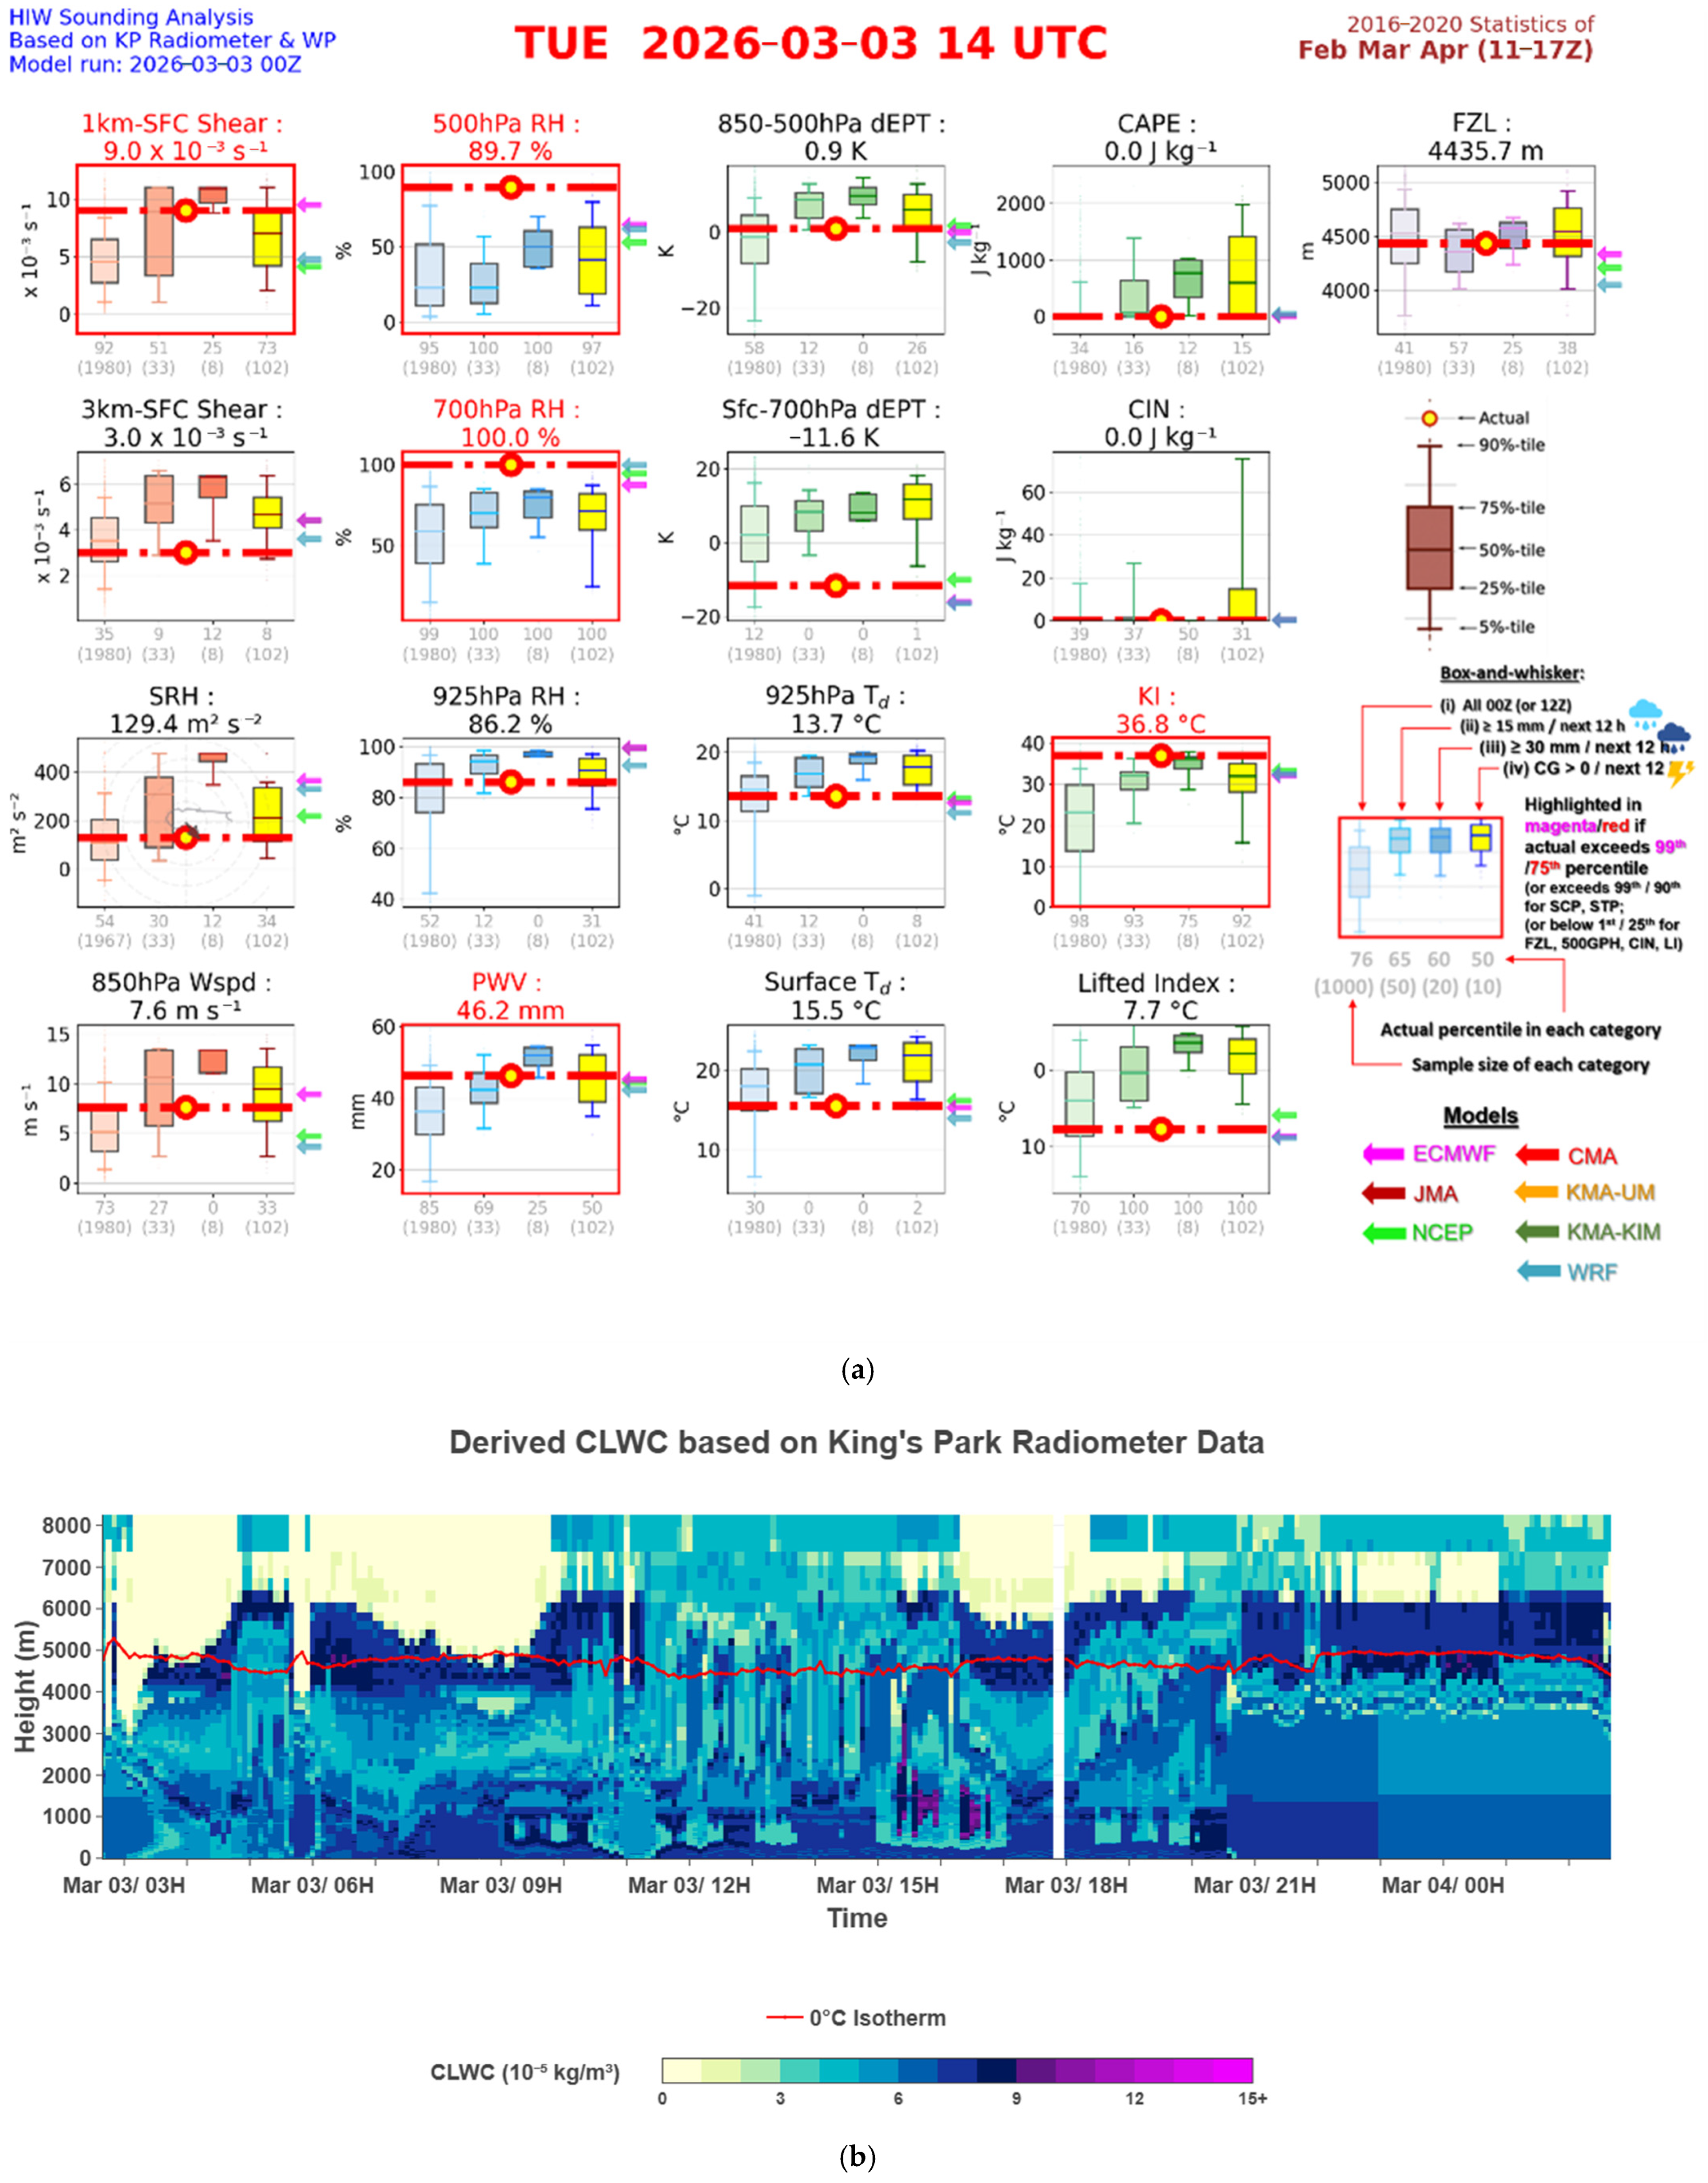
Hourly dynamic and thermodynamic parameters (Figure 5a, including shear and other dynamic factors (first column), water vapor contents (second and third columns), stability indices (fourth column), and freezing level (fifth column)) are calculated based on radiosonde or boundary wind profiler and microwave radiometer data as actual observations. They are listed along with the numerical weather prediction model outputs (including the ECMWF, Japan Meteorological Agency (JMA), Korea Meteorological Administration (KMA), etc.) and compared with the climatology for Hong Kong (over the period from February to April using box-and-whisker plots) to determine the extremity of the observed values (shown as horizontal broken lines). The climatological values have been classified according to the whole period (all), occurrence of daily rainfall of different classes (15 mm or above, and 30 mm or above), and the occurrence of cloud-to-ground lightning (CG). Once rather extreme values in terms of climatology are reached, the box of the relevant parameter is highlighted (in red). As shown in Figure 5a, just before the occurrence of heavy rain in Hong Kong in the evening of 3 March 2026, the PWV value is climatologically rather high (46.2 mm) for the season. In terms of stability indices, the K index is also high. On the other hand, the dynamic factors are not particularly extreme.
Figure 5.
(a) The dynamic and thermodynamic parameters in Hong Kong based on the wind profiler and microwave radiometer at 14 UTC on 3 March 2026. (b) CLWC time–height plot on 3 March 2026 (time is in Hong Kong time, UTC +8).
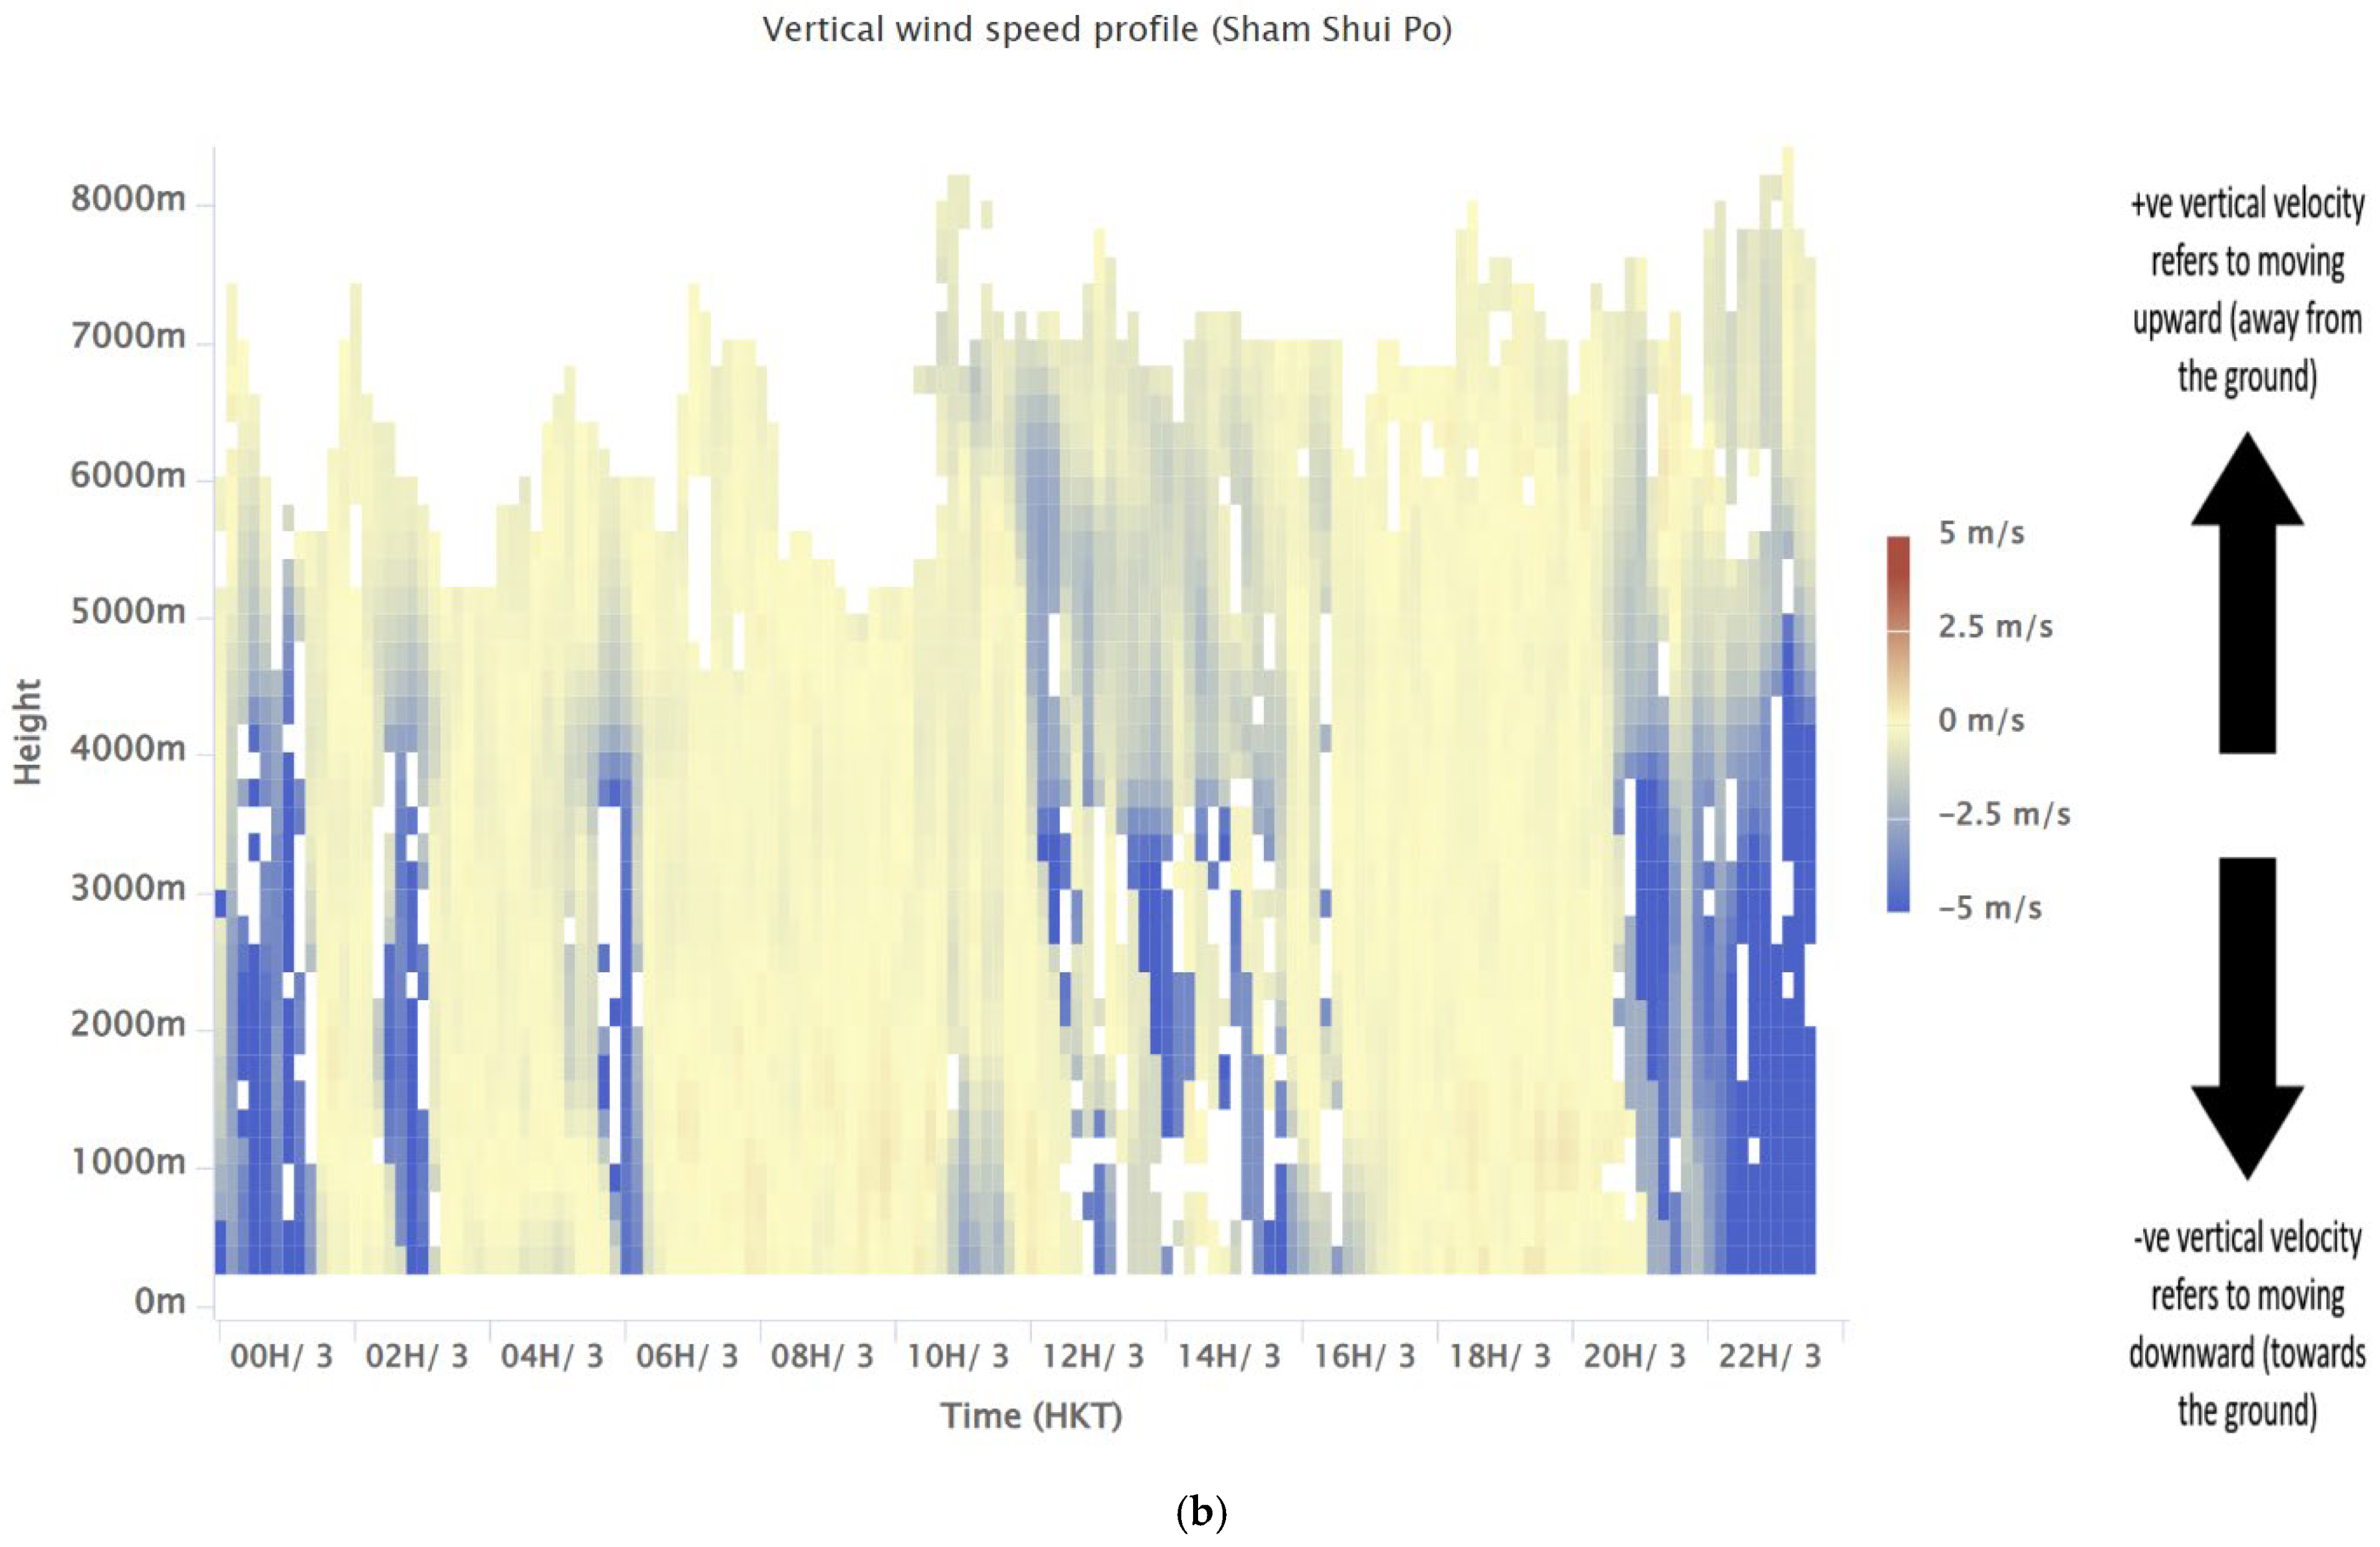
The time–height plot of CLWC is given in Figure 5b. For the heavy rain event in the evening of 3 March 2026, shortly before its occurrence (between 17:00 and 20:00 on 3 March 2026 local time), there is a signature of “upward motion” of the higher CLWC values (colored dark blue, about 9 × 10⁻⁵ kg/m3). Comparing this with the vertical velocity of the basically co-located radar wind profiler data, there seems to be rising motion in the lower troposphere, possibly also in the middle troposphere.
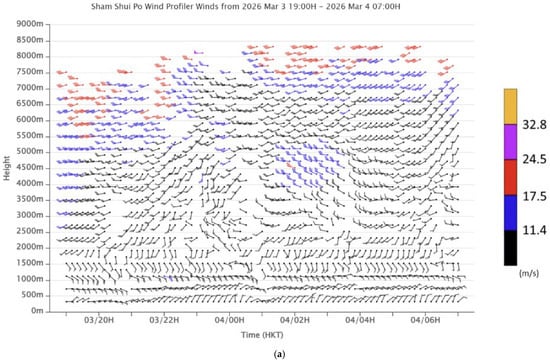
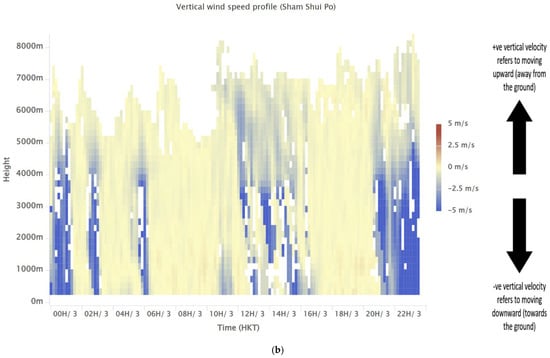
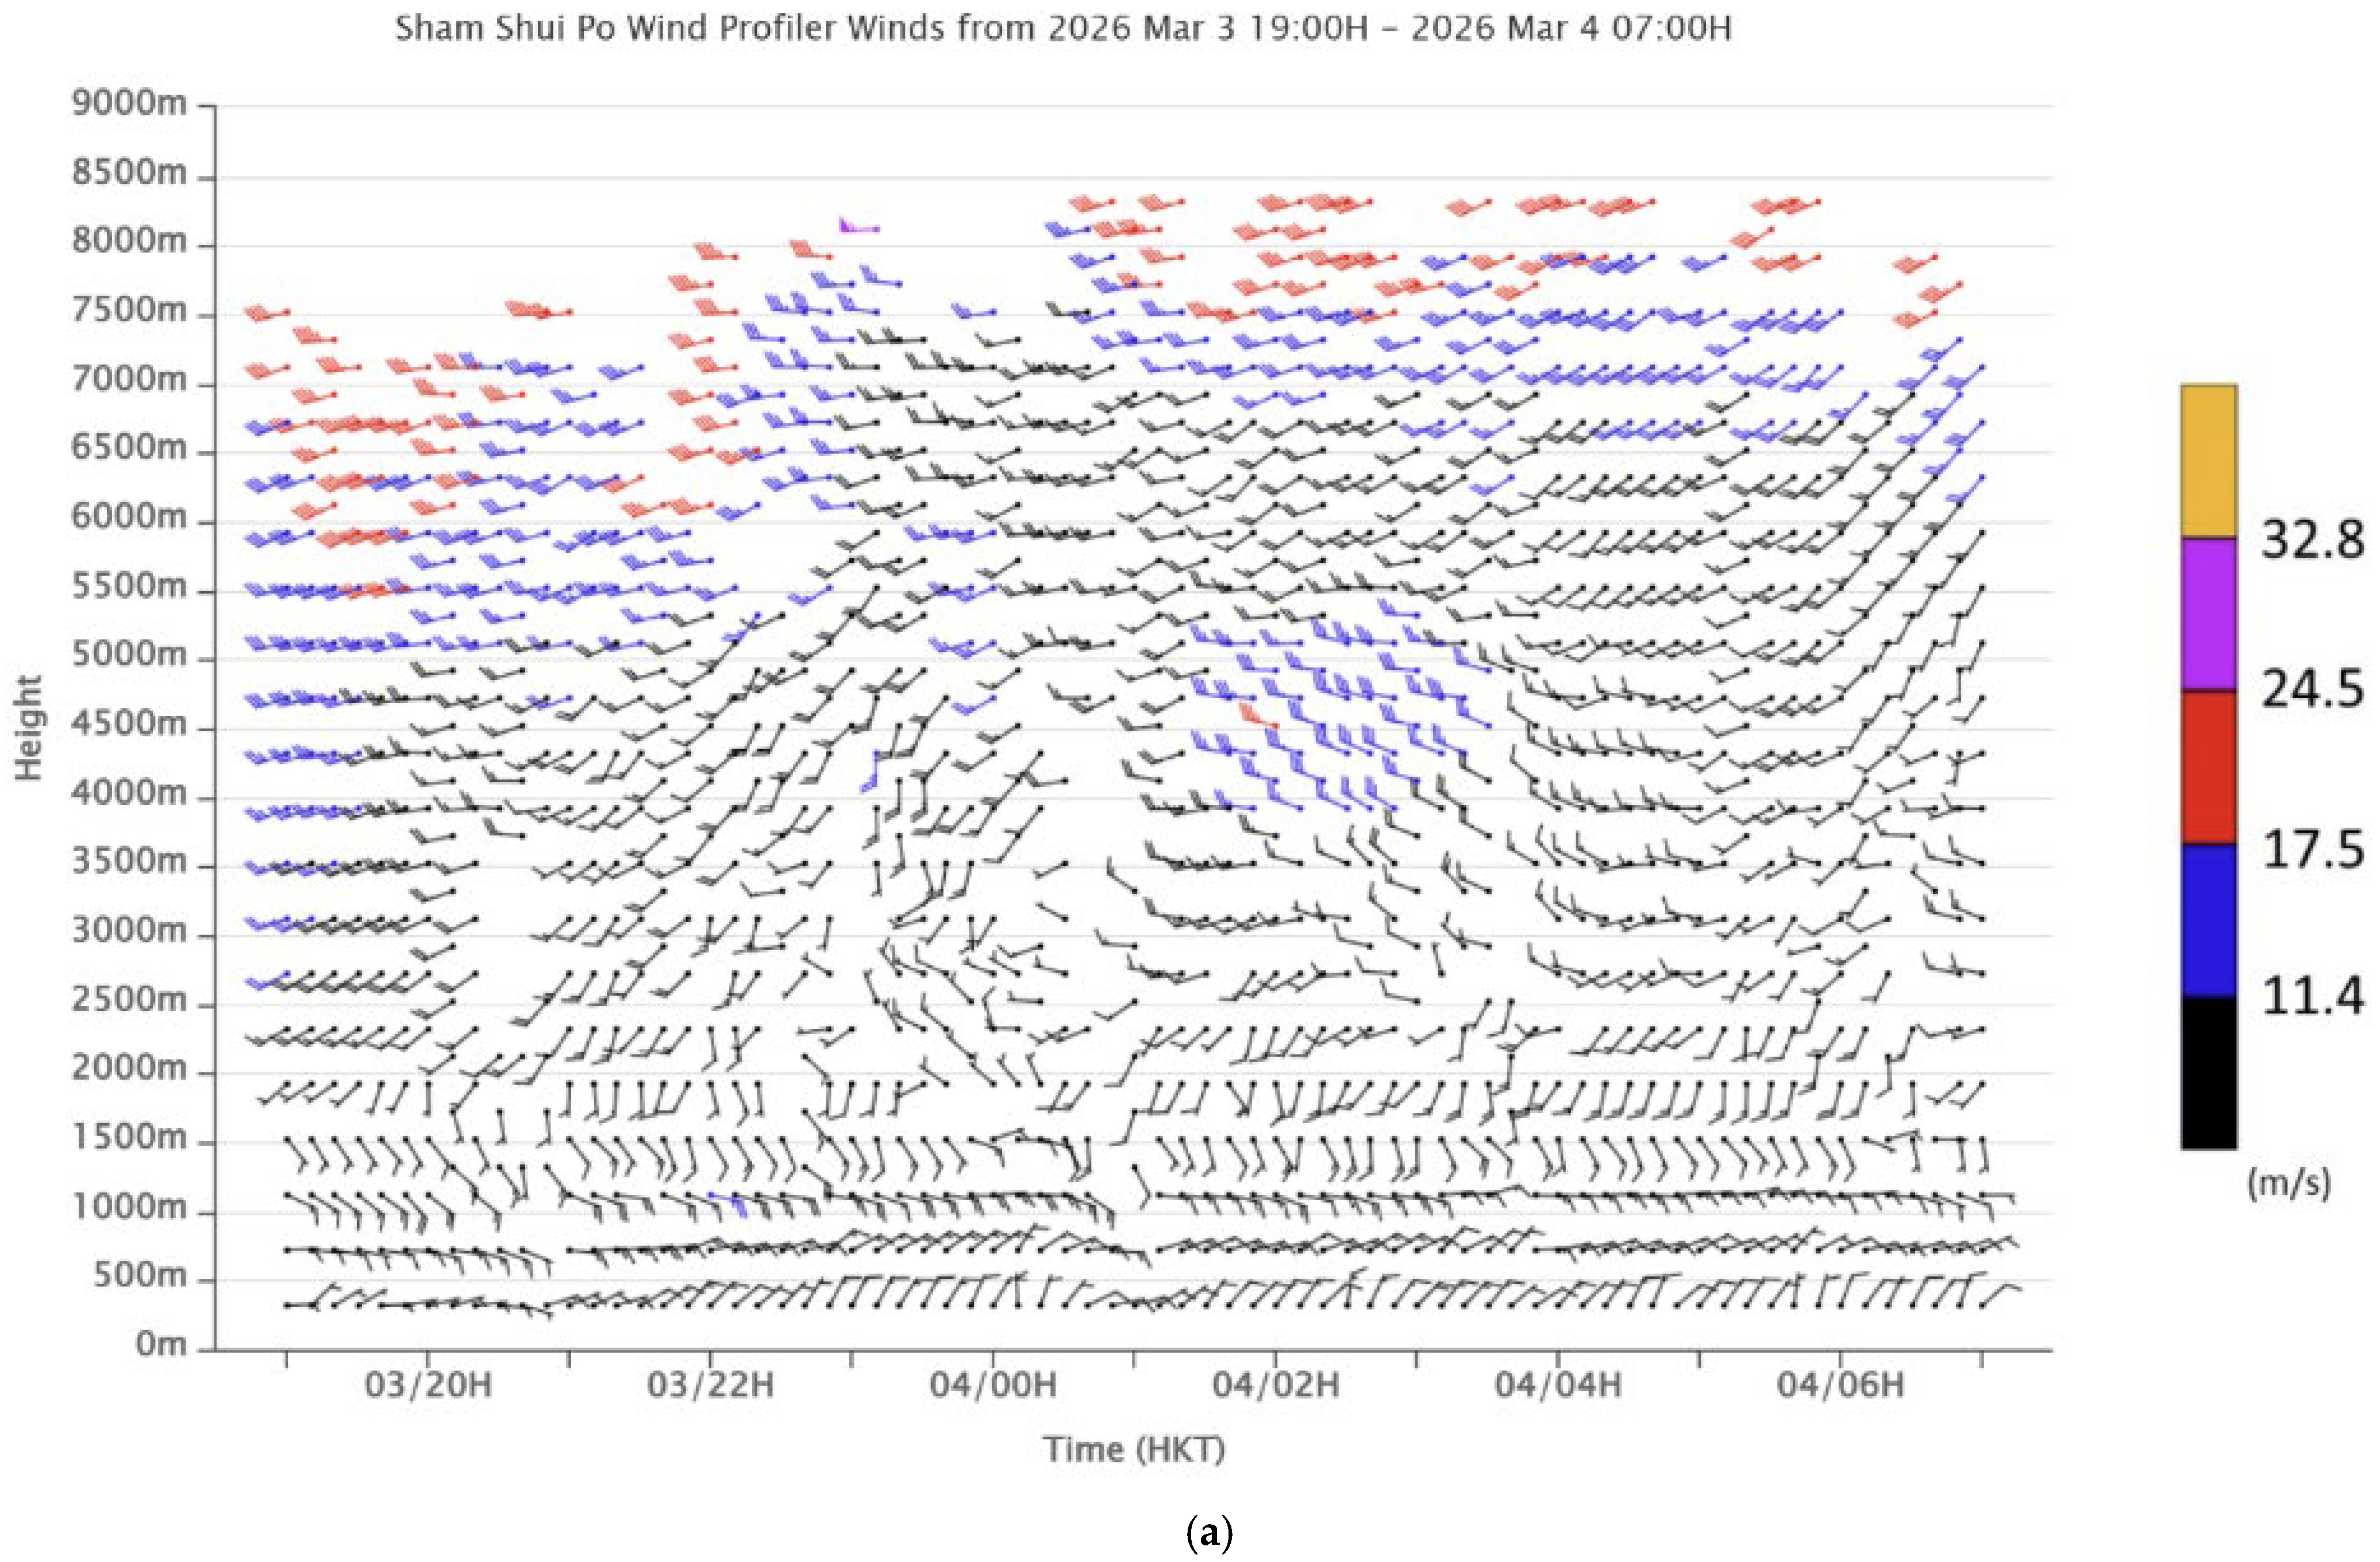
From the time–height plot of horizontal winds from the radar wind profiler (Figure 6a), the south-to-southeasterly flow at the top of the atmospheric boundary layer is apparent. Above that, there is a deep westerly wave between heights of 2000 m and 5500 m above sea level during the period 21:00 on 3 March 2026 to 05:00 on 4 March 2026. Before the arrival of this wave, in the atmospheric boundary layer (below a height of 1500 to 2000 m above sea level), there is rising motion of a couple of m/s between 16:00 and 20:00 on 3 March 2026. Based on all the above data, it appears that there is a mechanism of elevated convection for the heavy rain in the evening of 3 March 2026, namely, abundant moisture advection with rising motion of the air by undercutting at and below 850 hPa, together with a rising motion of the air in the lower to middle troposphere triggered by the westerly wave. The lifting of moist air at the top of the boundary layer by undercutting cooler air, combined with mid-tropospheric waves, aligns with studies highlighting the role of topography and frontal structures in initiating elevated thunderstorms on the cold side of fronts in southern China [19].
Figure 6.
Time–height plots of (a) horizontal wind and (b) vertical velocity for the radar wind profiler at downtown Hong Kong. Time is in Hong Kong time (UTC + 8).
5. Radar and Lightning Observations
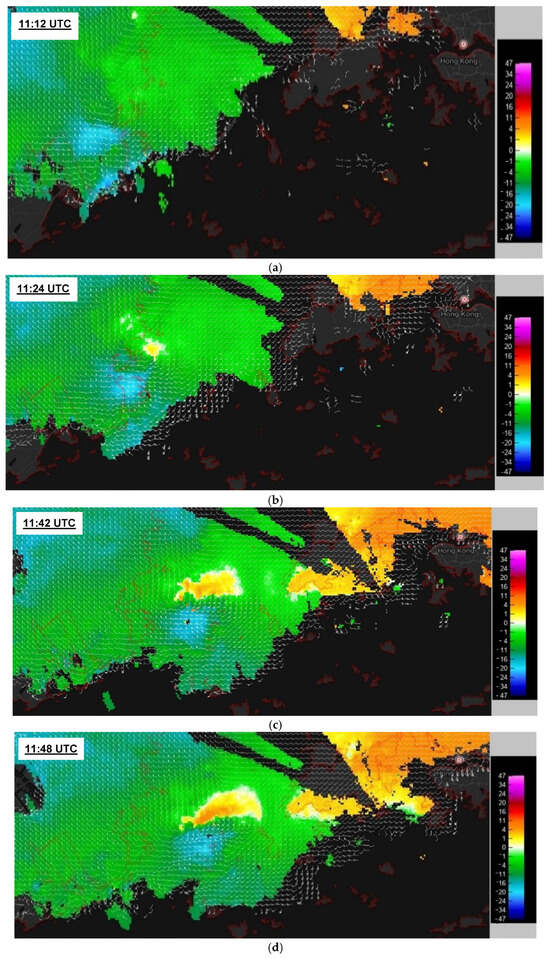
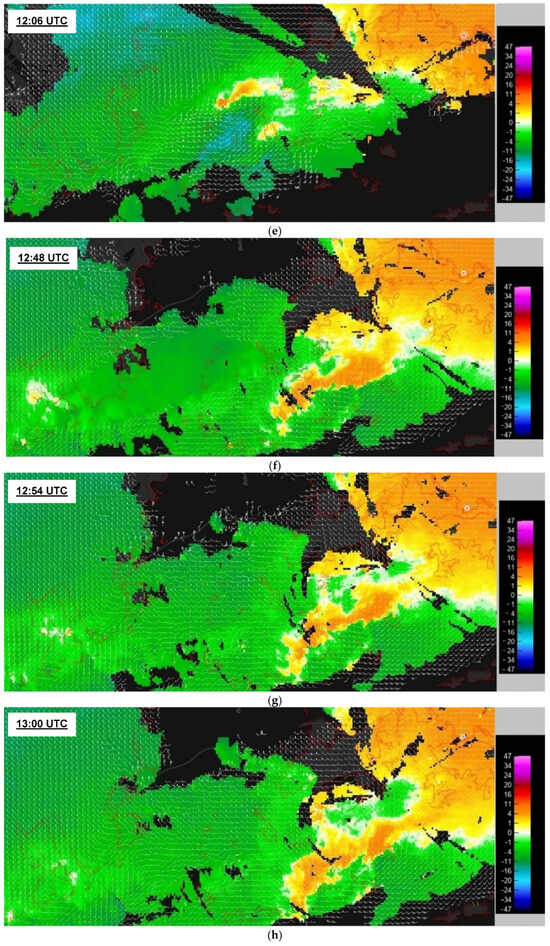
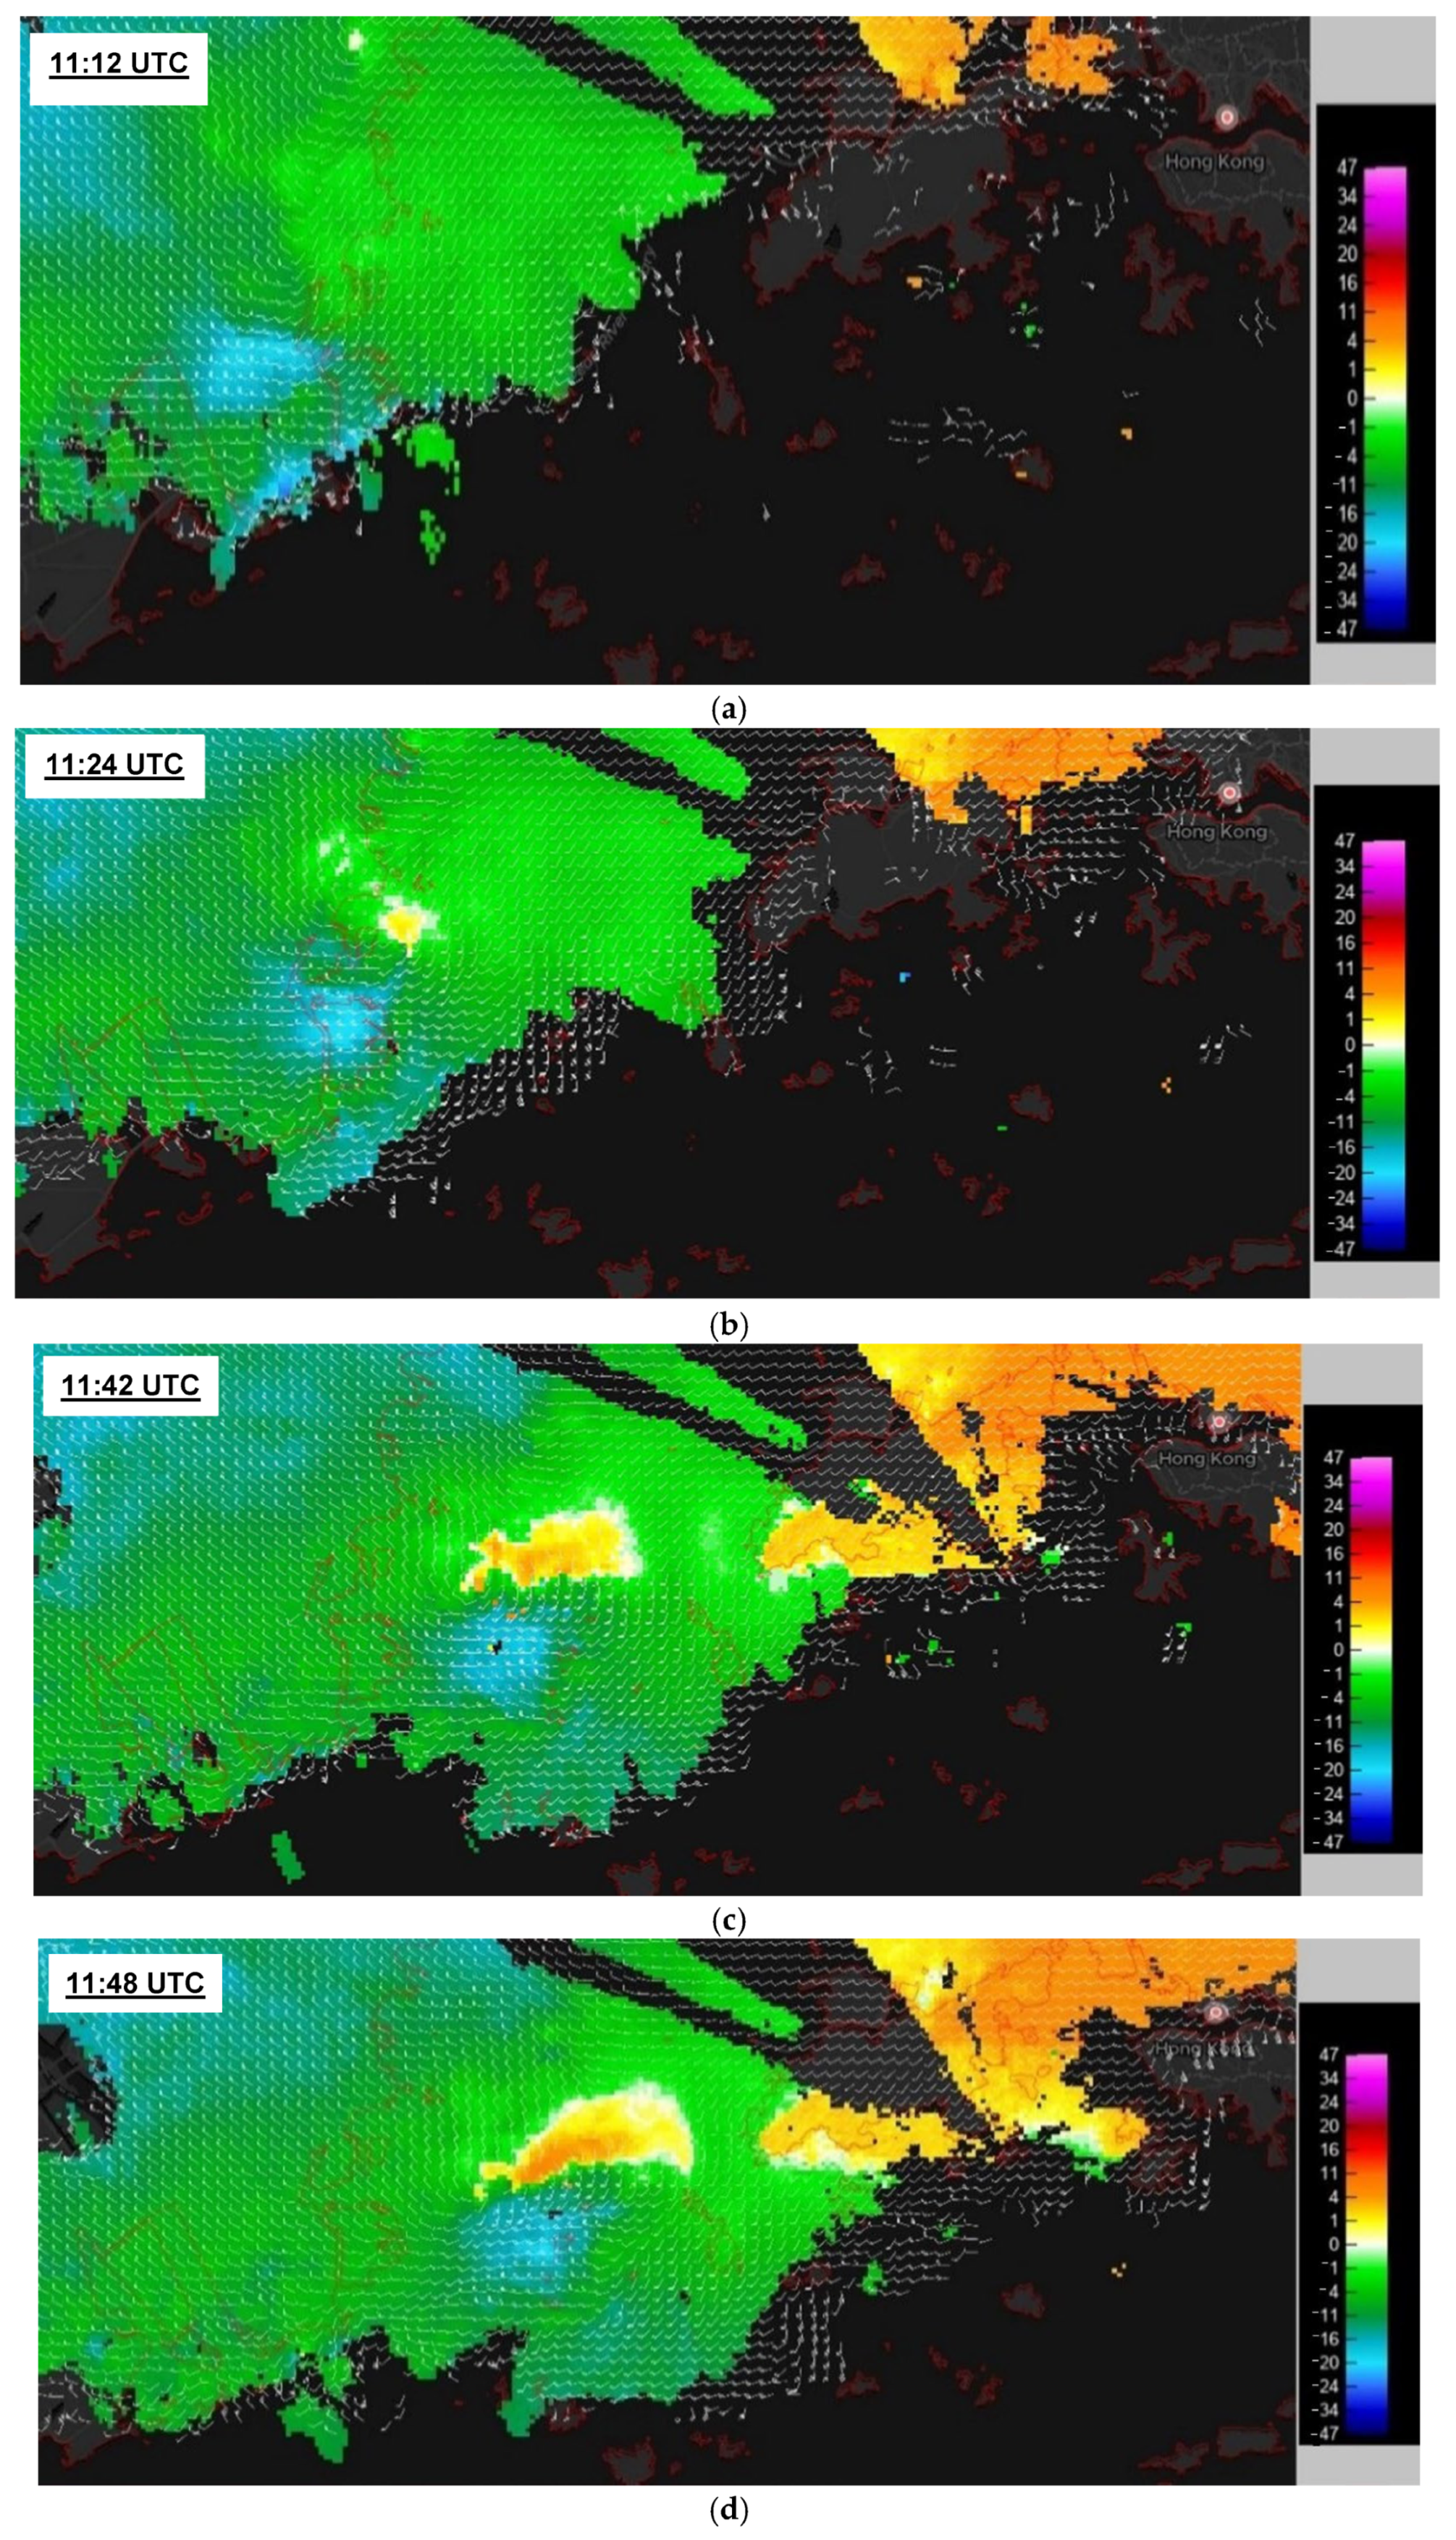
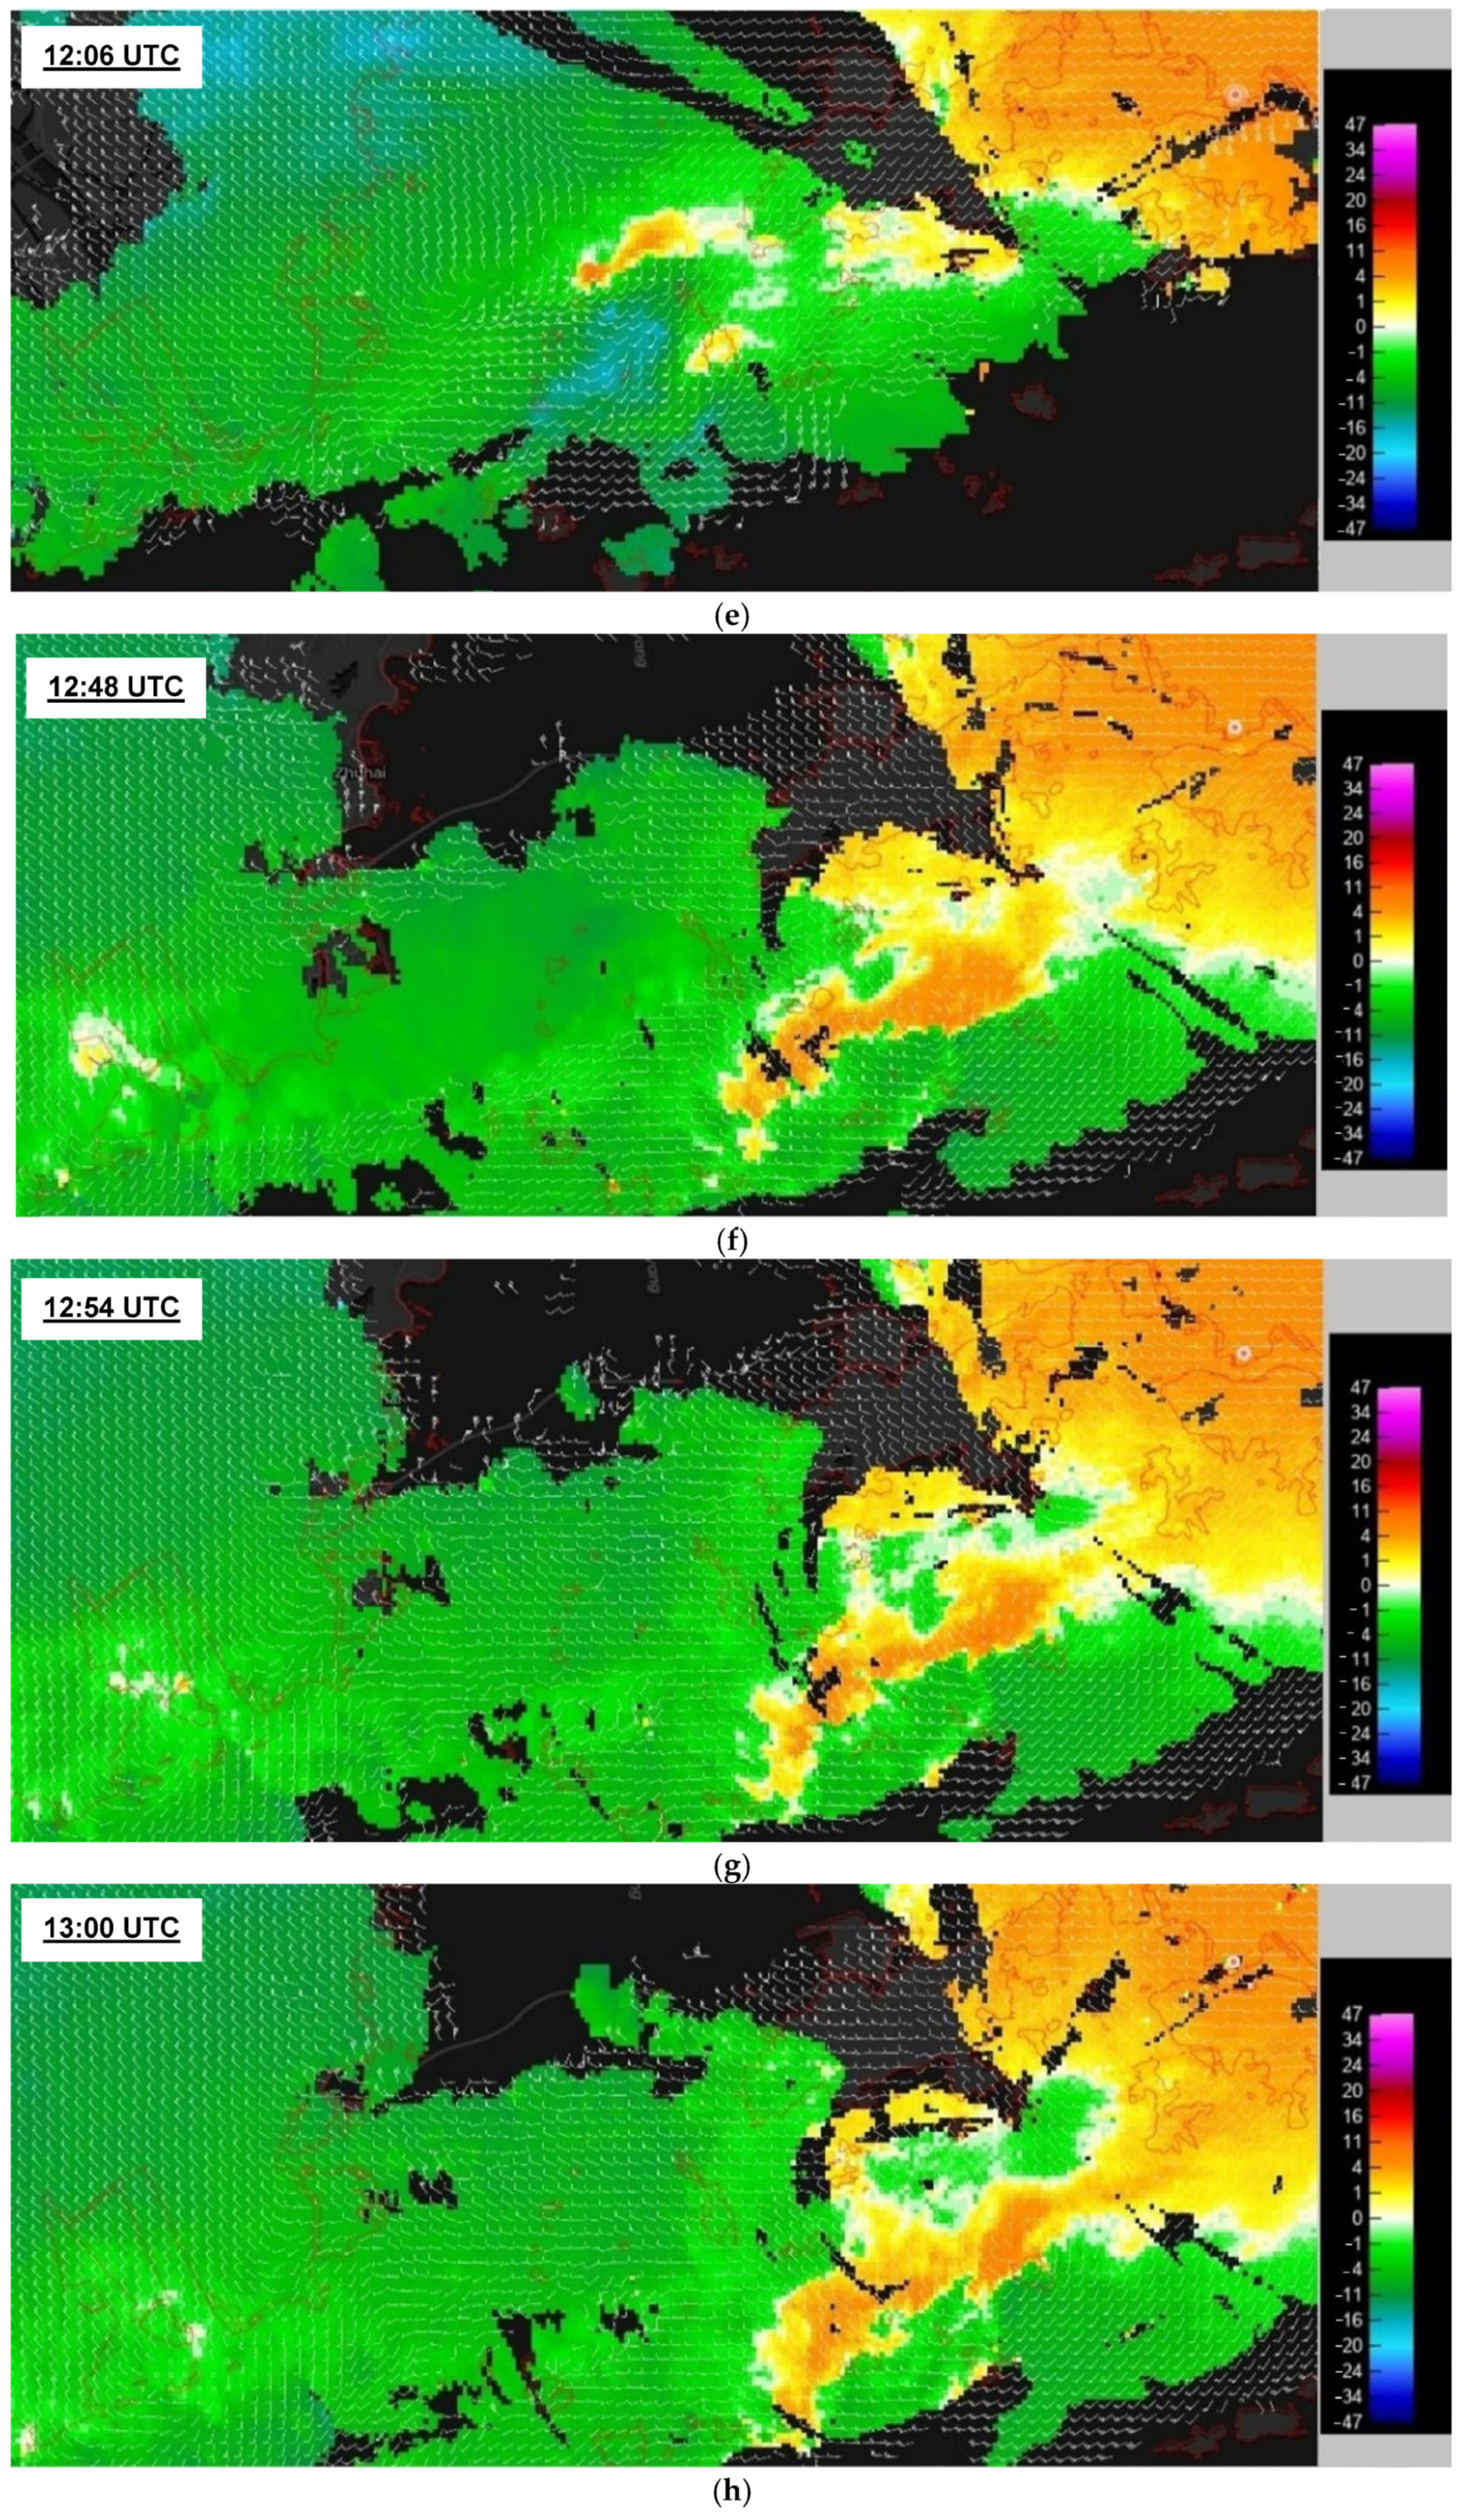
Against the above-described synoptic and mesoscale atmospheric patterns, as well as the dynamic and thermodynamic background of the atmosphere, the weather radars provide interesting observations of the microscale to storm-scale features of the convection. First, the focus is on the rainstorm in the evening of 2 March 2026. The Doppler velocity of the 1.4-degree plan position indicator (PPI) scan of the CCH radar is overlaid with the wind field at a height of 1 km from the 3D wind field retrieval in Figure 7 to show the evolution of a low-level vortex over the Pearl River Estuary (PRE). At first, two tiny jets of west to southwesterly winds are identified near Macao (colored light blue in Figure 7a, with a wind speed of about 20 knots). Some minutes later, a cyclonic circulation begins to form to the north of the tiny jet located to the north (occurrence of out-bound flow in yellow, Figure 7b), and it intensifies gradually (Figure 7c). The vortex reaches the climax of its intensity at the time of Figure 7d. Some minutes later, another vortex also forms for the tiny jet in the south (Figure 7e), and the two vortices later merge together (Figure 7f). The whole system eventually develops into a wave (Figure 7g), continues to move south (Figure 7h), and dissipates. The observed low-level vortex shares similarities with meso-γ-scale vortexes frequently documented in the Pearl River Delta during heavy rainfall events, which are often linked to extreme hourly precipitation through enhanced low-level convergence and vorticity stretching [20]. The intensification of the vortex and associated heavy rain is reminiscent of mesovortex-related extreme local rain rates documented in South China [21].
Figure 7.
Doppler velocity (in m/s) from a 1.4-degree PPI scan of the CCH radar and the 1-km wind field, as analyzed from the weather radars at (a) 11:12 UTC, (b) 11:24 UTC, (c) 11:42 UTC, (d) 11:48 UTC, (e) 12:06 UTC, (f) 12:48 UTC, (g) 12:54 UTC, and (h) 13:00 UTC for the low-level vortex in the evening of 2 March 2026.
The northeasterly winds near the surface and the south to southeasterly winds at around 850 hPa form a vertical circulation, which may be stretched vertically upward by the rising motion of the air associated with the mid-tropospheric westerly wave [22,23]. With the occurrence of the tiny jets near the top of the boundary layer, the vertical circulation is enhanced and may be more favorable for the upward stretching [24]. This may explain the occurrence of a low-level vortex, as shown in the Doppler velocity of the weather radars [25].
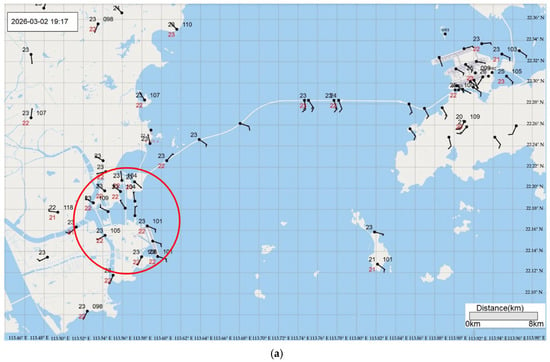
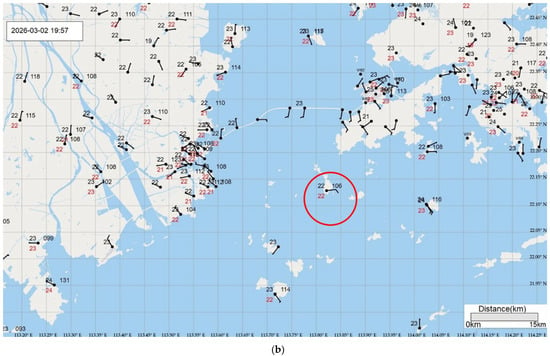
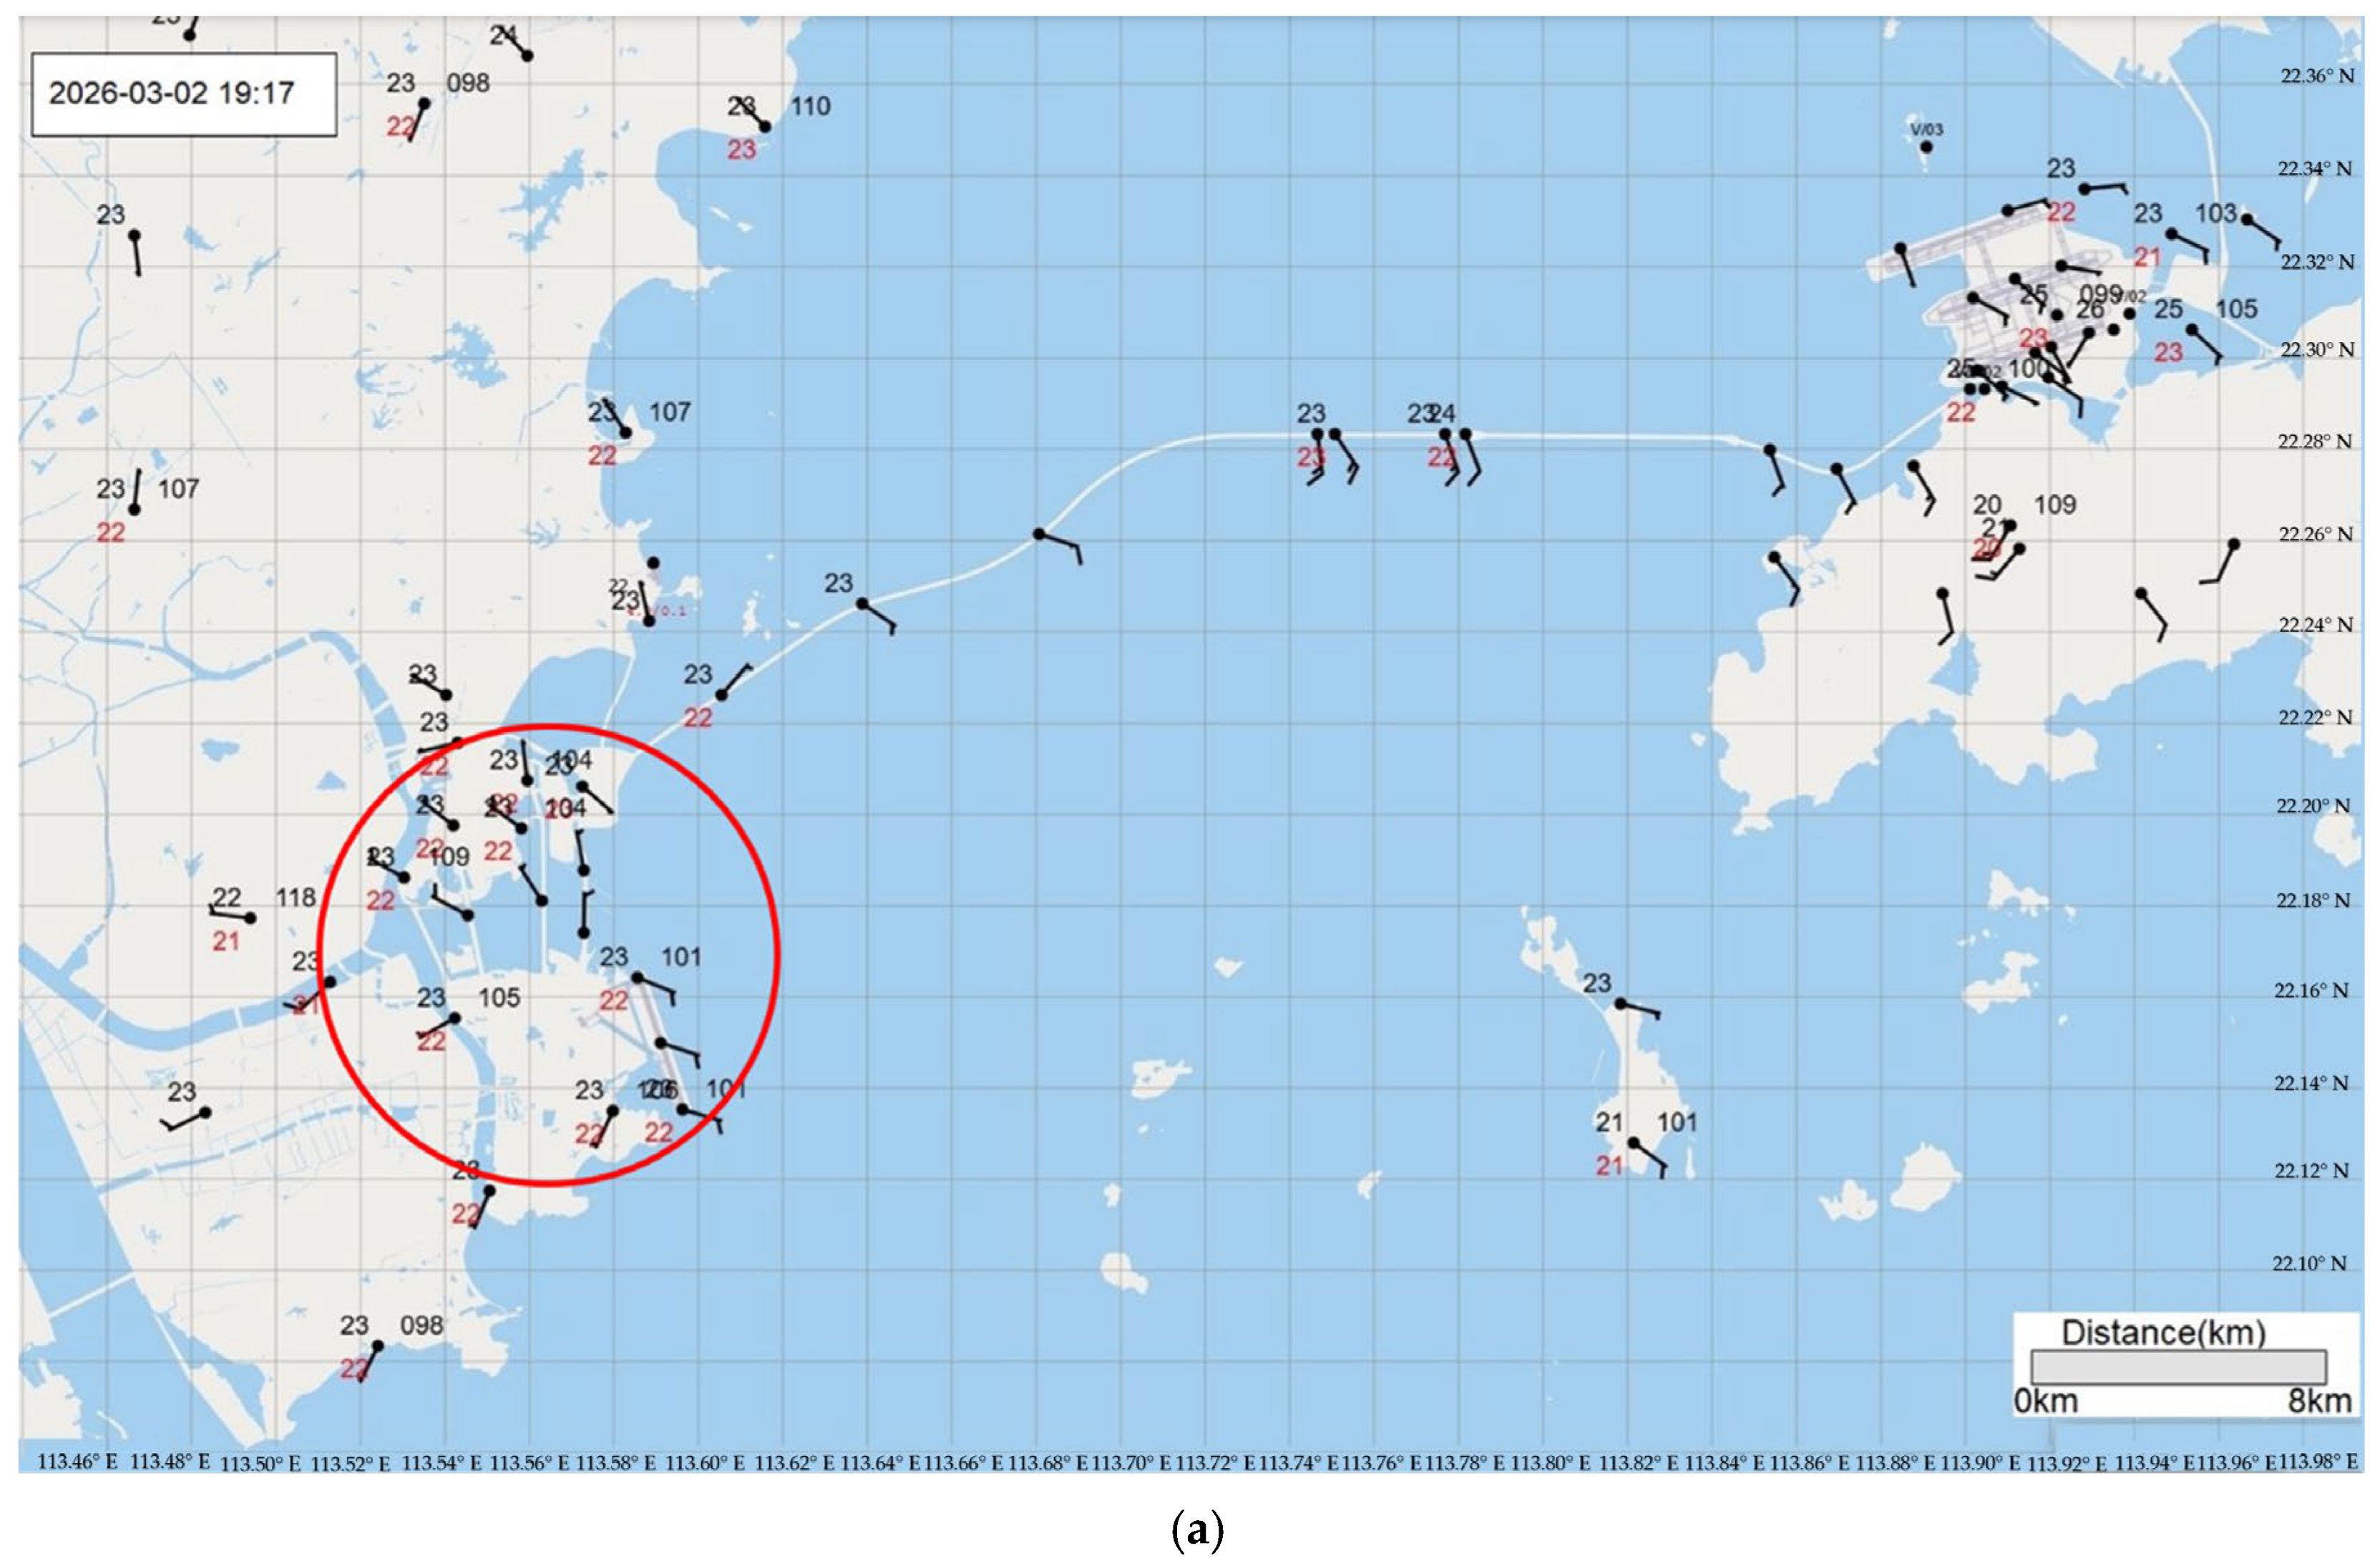
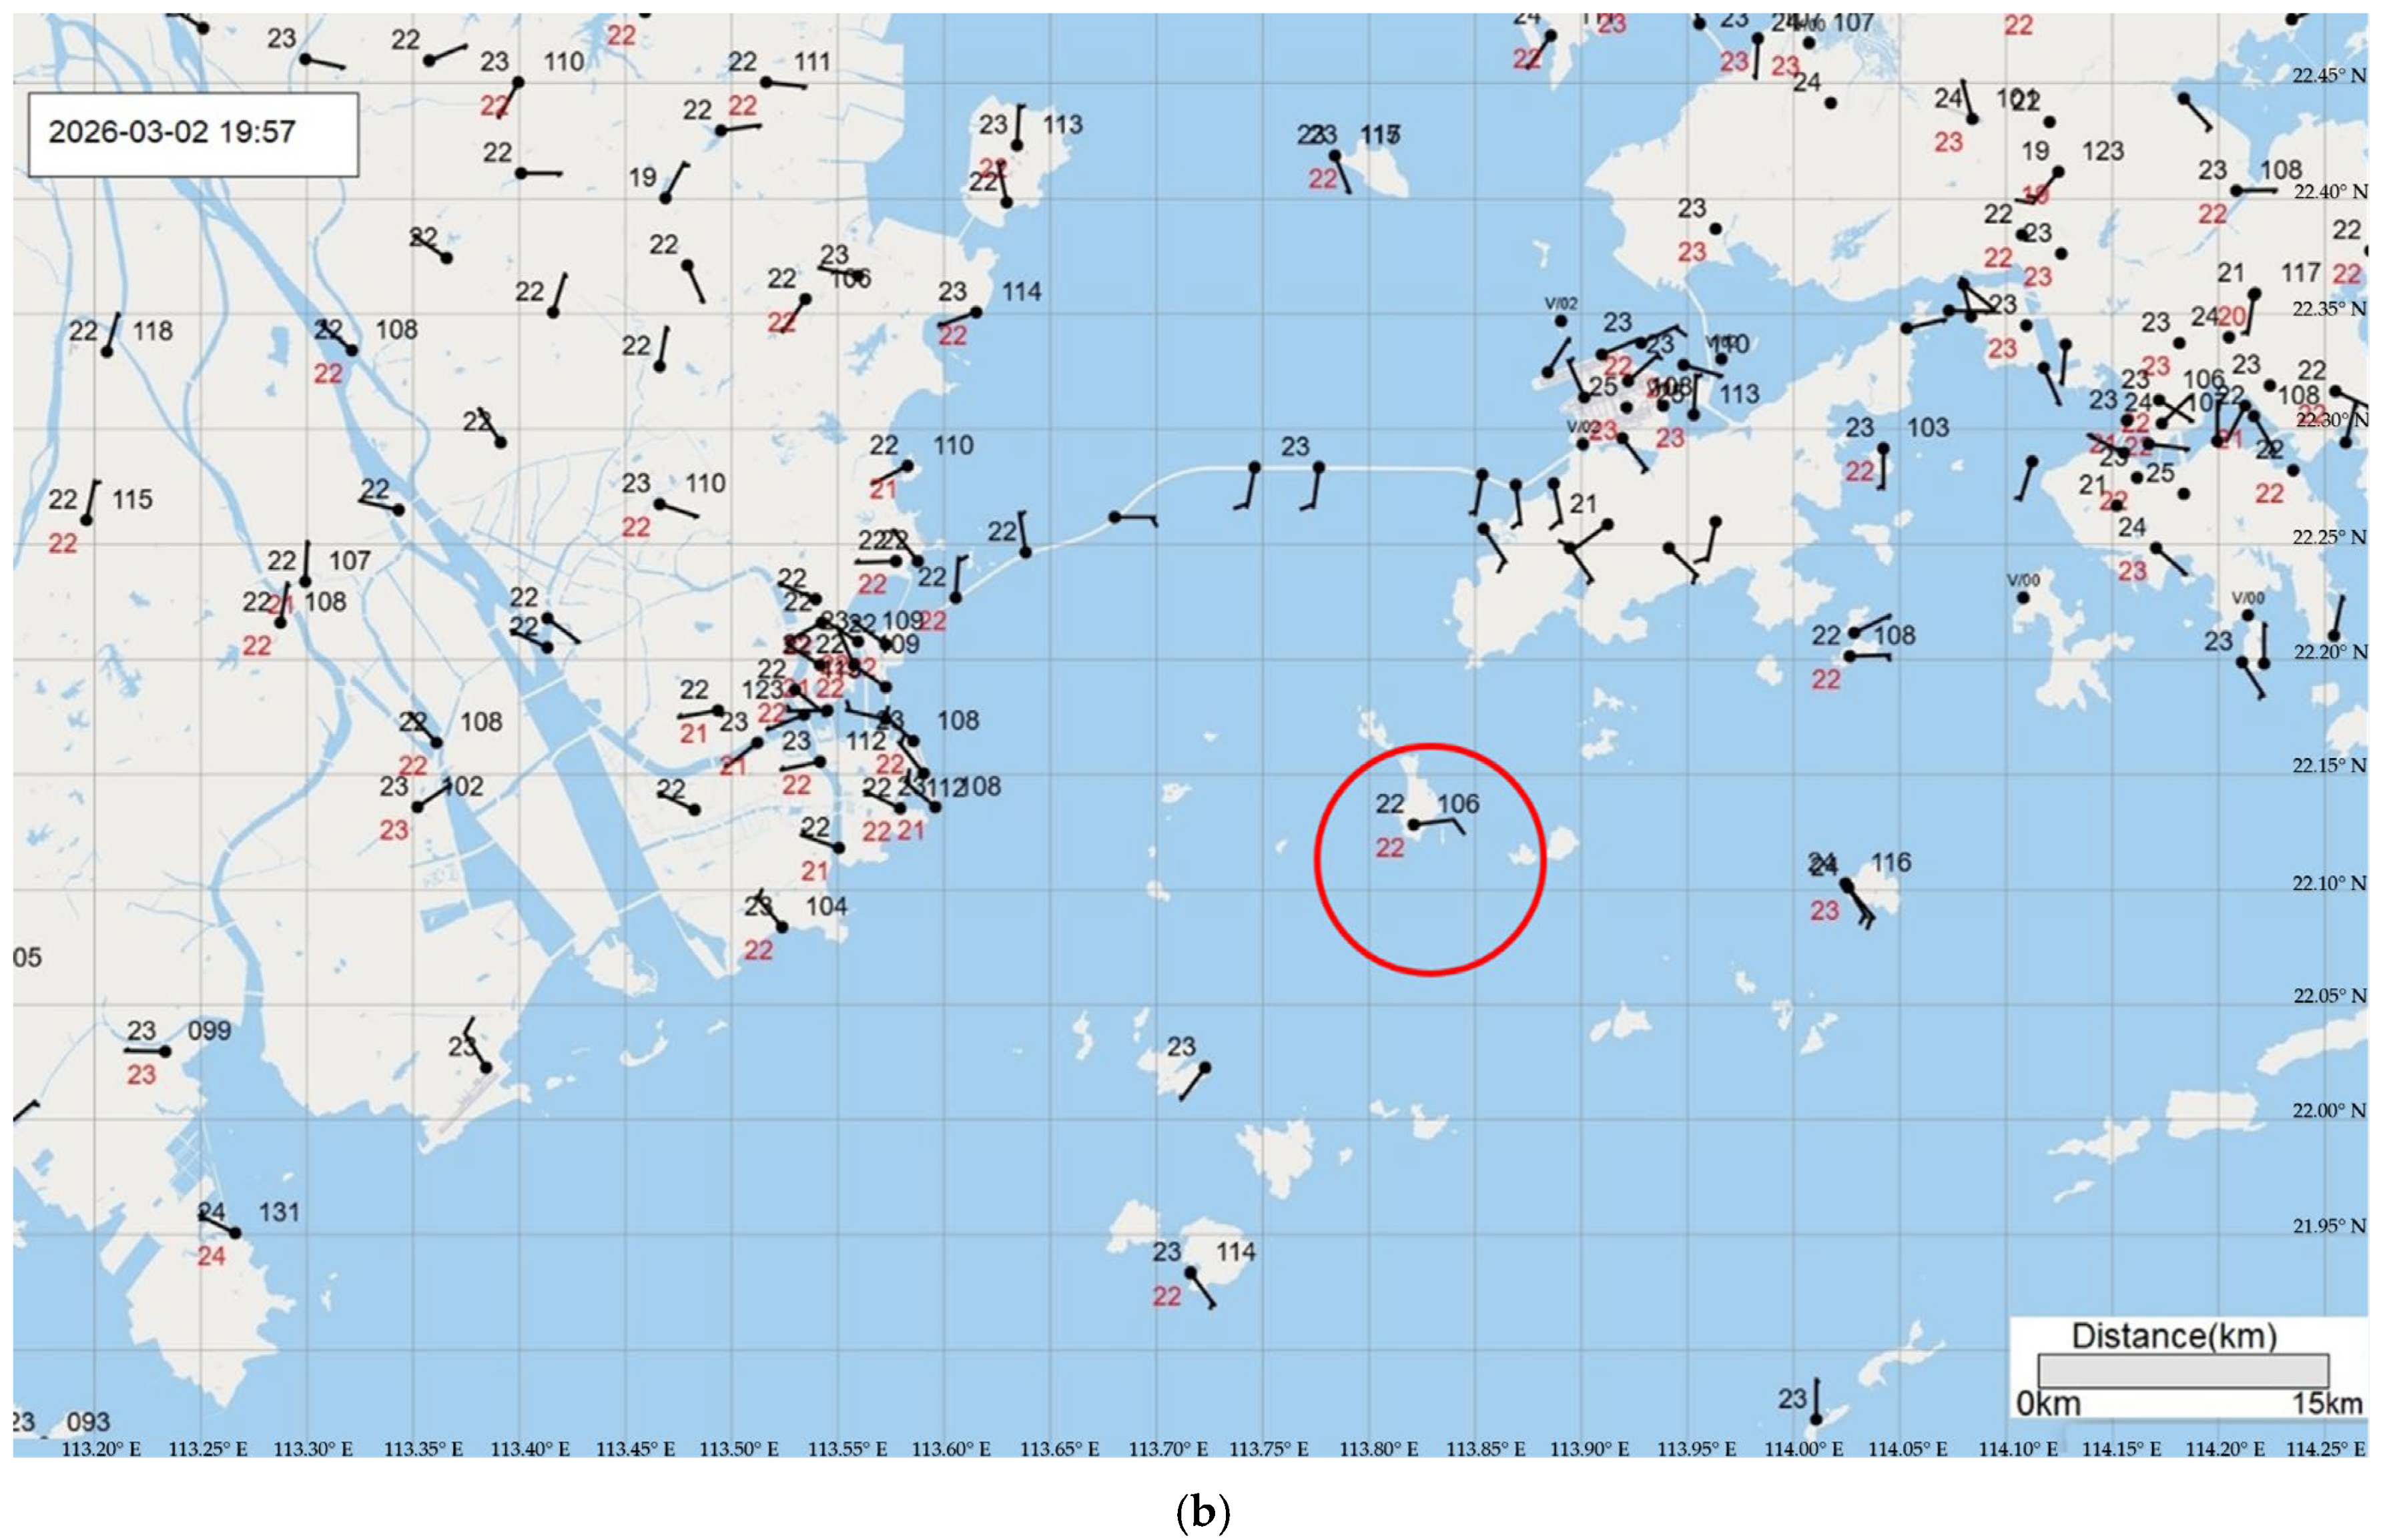
The surface observations from the automatic weather stations (AWSs) of the PRE provide independent validation of the CCH radar Doppler velocity measurements. Figure 8 shows AWS observations at two times corresponding to the radar observations in Figure 7. Figure 8a corresponds to around 11:17 UTC on 2 March 2026 (matching Figure 7a,b), and Figure 8b corresponds to around 11:57 UTC (matching Figure 7d,e).
Figure 8.
The observations from the surface weather stations at (a) 19:17 and (b) 19:57 (in Hong Kong time, UTC + 8), including the wind (barbs), temperature (black figure to the upper left), dew point (red figure to the lower left), and pressure (black figure to the upper right).
The AWS winds confirm the cyclonic circulation pattern observed in the CCH radar Doppler velocity. In Figure 8a, the AWS near Macao, indicated by the red circle in the figure, shows cyclonic circulations, consistent with the velocity dipole observed by the CCH radar at that location in Figure 7a. In Figure 8b, the surface pressure observation of 1010.6 hPa near the vortex center, as indicated by the red circle, is the lowest among the surrounding stations, providing additional meteorological confirmation of the mesoscale cyclonic feature.
While the AWS observations are at surface level (~10 m) and the CCH radar PPI scan is at approximately 1500 m and 500 m altitudes in Figure 8a,b, respectively, the consistent cyclonic pattern between the two independent measurement systems provides confidence in the radar data quality. The qualitative agreement in circulation pattern, combined with the physically consistent pressure decrease at the vortex center, supports the reliability of the CCH radar Doppler velocity for identifying mesoscale circulation features, even though comprehensive quantitative validation is still ongoing.
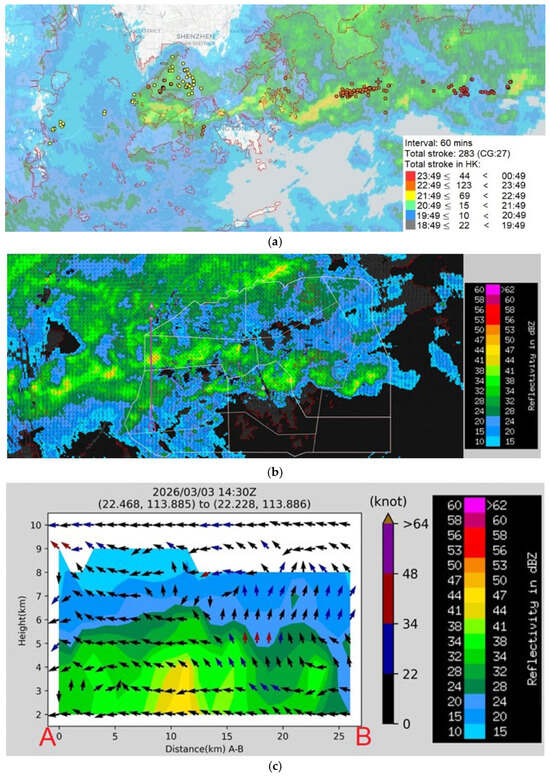
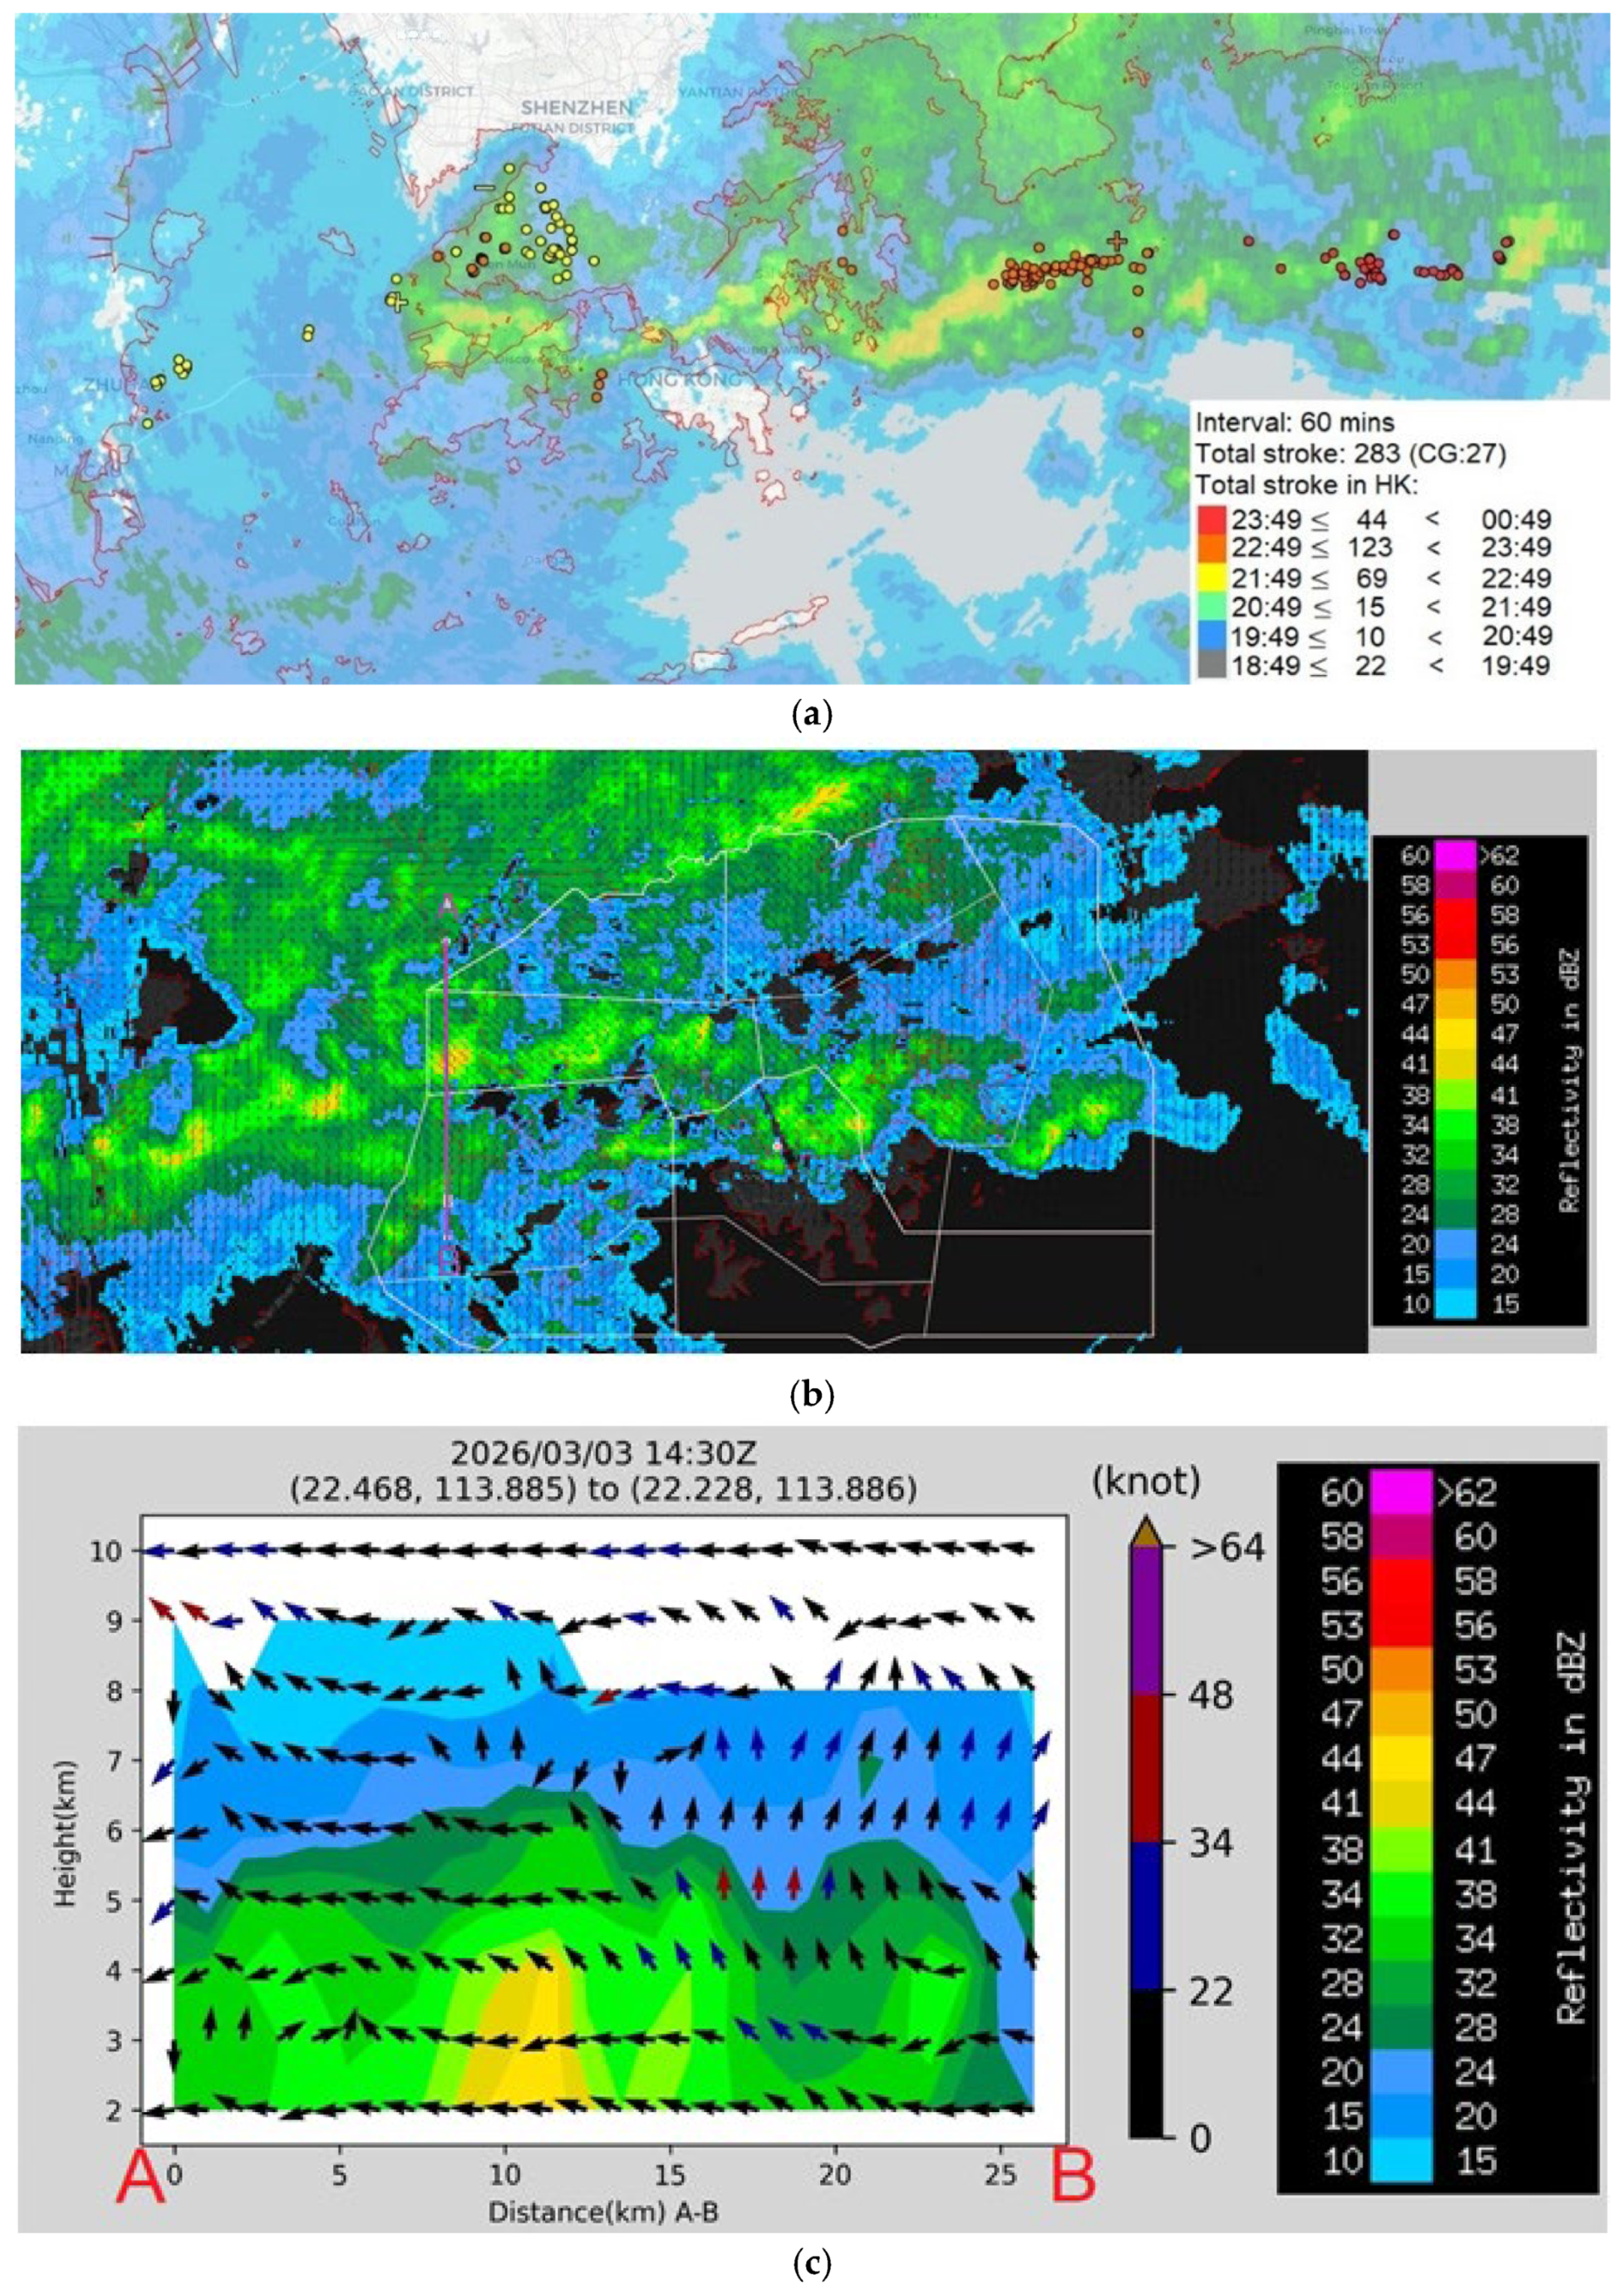
For the first event in the evening of 2 March 2026, there was no lightning strike in Hong Kong recorded by the lightning location network. The intense convection only occurred near Macao and then moved southeastwards to the seas to the south of Hong Kong, just skirting the territory. For the second rainstorm in the evening of 3 March 2026, cloud-to-cloud (C-C) lightning strikes and cloud-to-ground (C-G) strikes had been recorded inside and around Hong Kong, taking the form of an elongated band of west–east orientation (Figure 9a, with C-C strikes in dots and C-G strikes in “+” and “−” symbols for positive and negative strikes). Based on the TMS S-band radar, there is a west–east oriented and elongated band of higher radar reflectivity just along the coast (Figure 9b). From the 3D wind field at a height of 2 km above sea level, a troughing flow feature is apparent along this reflectivity band, namely, generally southerly flow to the south and generally southeasterly flow to the north (with some wind barbs having northerly wind component). A vertical cross-section is created across the band, and the vertical wind circulation is shown in Figure 9c. The southerly winds to the south of the stronger radar reflectivity show increasing depth of rising motion as they approach the band, consistent with the conceptual model of rising motion of the air due to the undercutting of the warmer and moister air from the sea by the cooler continental air near the surface [26]. The rising motion reaches a height of about 6 to 9 km above sea level at the location of the radar reflectivity core, signifying the occurrence of intense convection. The rising motion reaches a much lower height (about 4 km above sea level) to the north of the radar reflectivity band, which coincides with the area to the north of the 850 hPa shear-line. This explains the occurrence of an isolated, west–east oriented and elongated band of heavy rain along the coast. As the rain cells are advected to the east by the mid-tropospheric westerly flow, the rain is persistent and thus results in a rainstorm at a particular place [23].
Figure 9.
(a) The locations of C-C and C-G lightning strikes from 19H on 3 March 2026 to 01H on 4 March 2026 (following the color legend) in the vicinity of Hong Kong. (b) S-band radar reflectivity with a 2 km high wind field at 14:30 UTC on 3 March 2026. (c) Vertical cross-section of the wind field.
6. Forecasting Aspect
The forecasting performance for this event is assessed from two complementary perspectives: (i) short-range rainfall prediction by a high-resolution limited-area atmosphere–ocean–wave coupled model, and (ii) extended-range large-scale anomaly guidance from the ECMWF sub-seasonal forecast. Together, these products provide information on different aspects of predictability, including the timing and spatial distribution of the rainfall at short range, and the broader background favoring an anomalously wet period at lead times of 1–3 weeks.
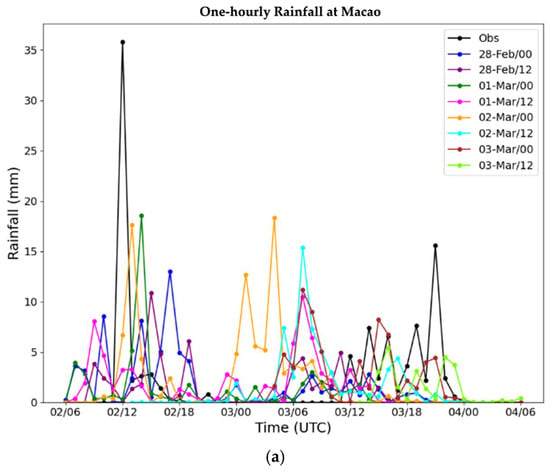
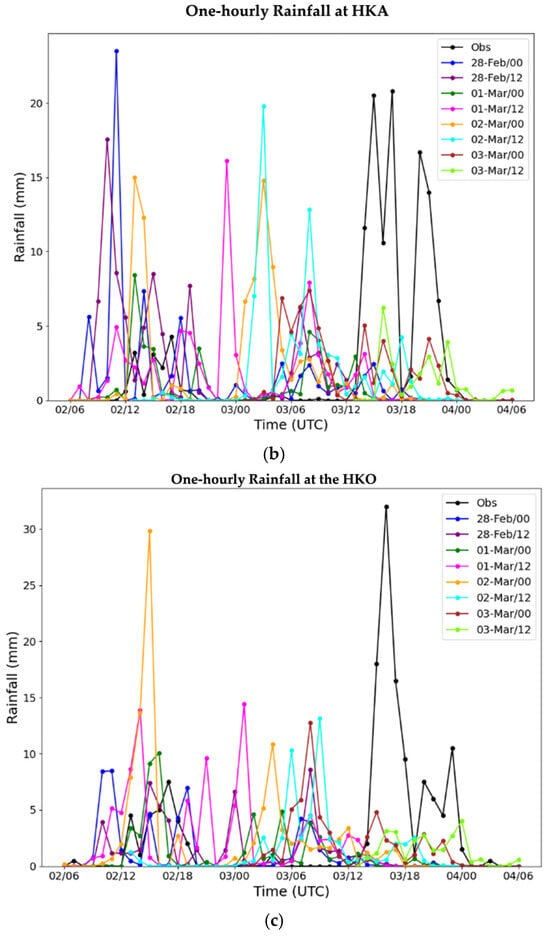
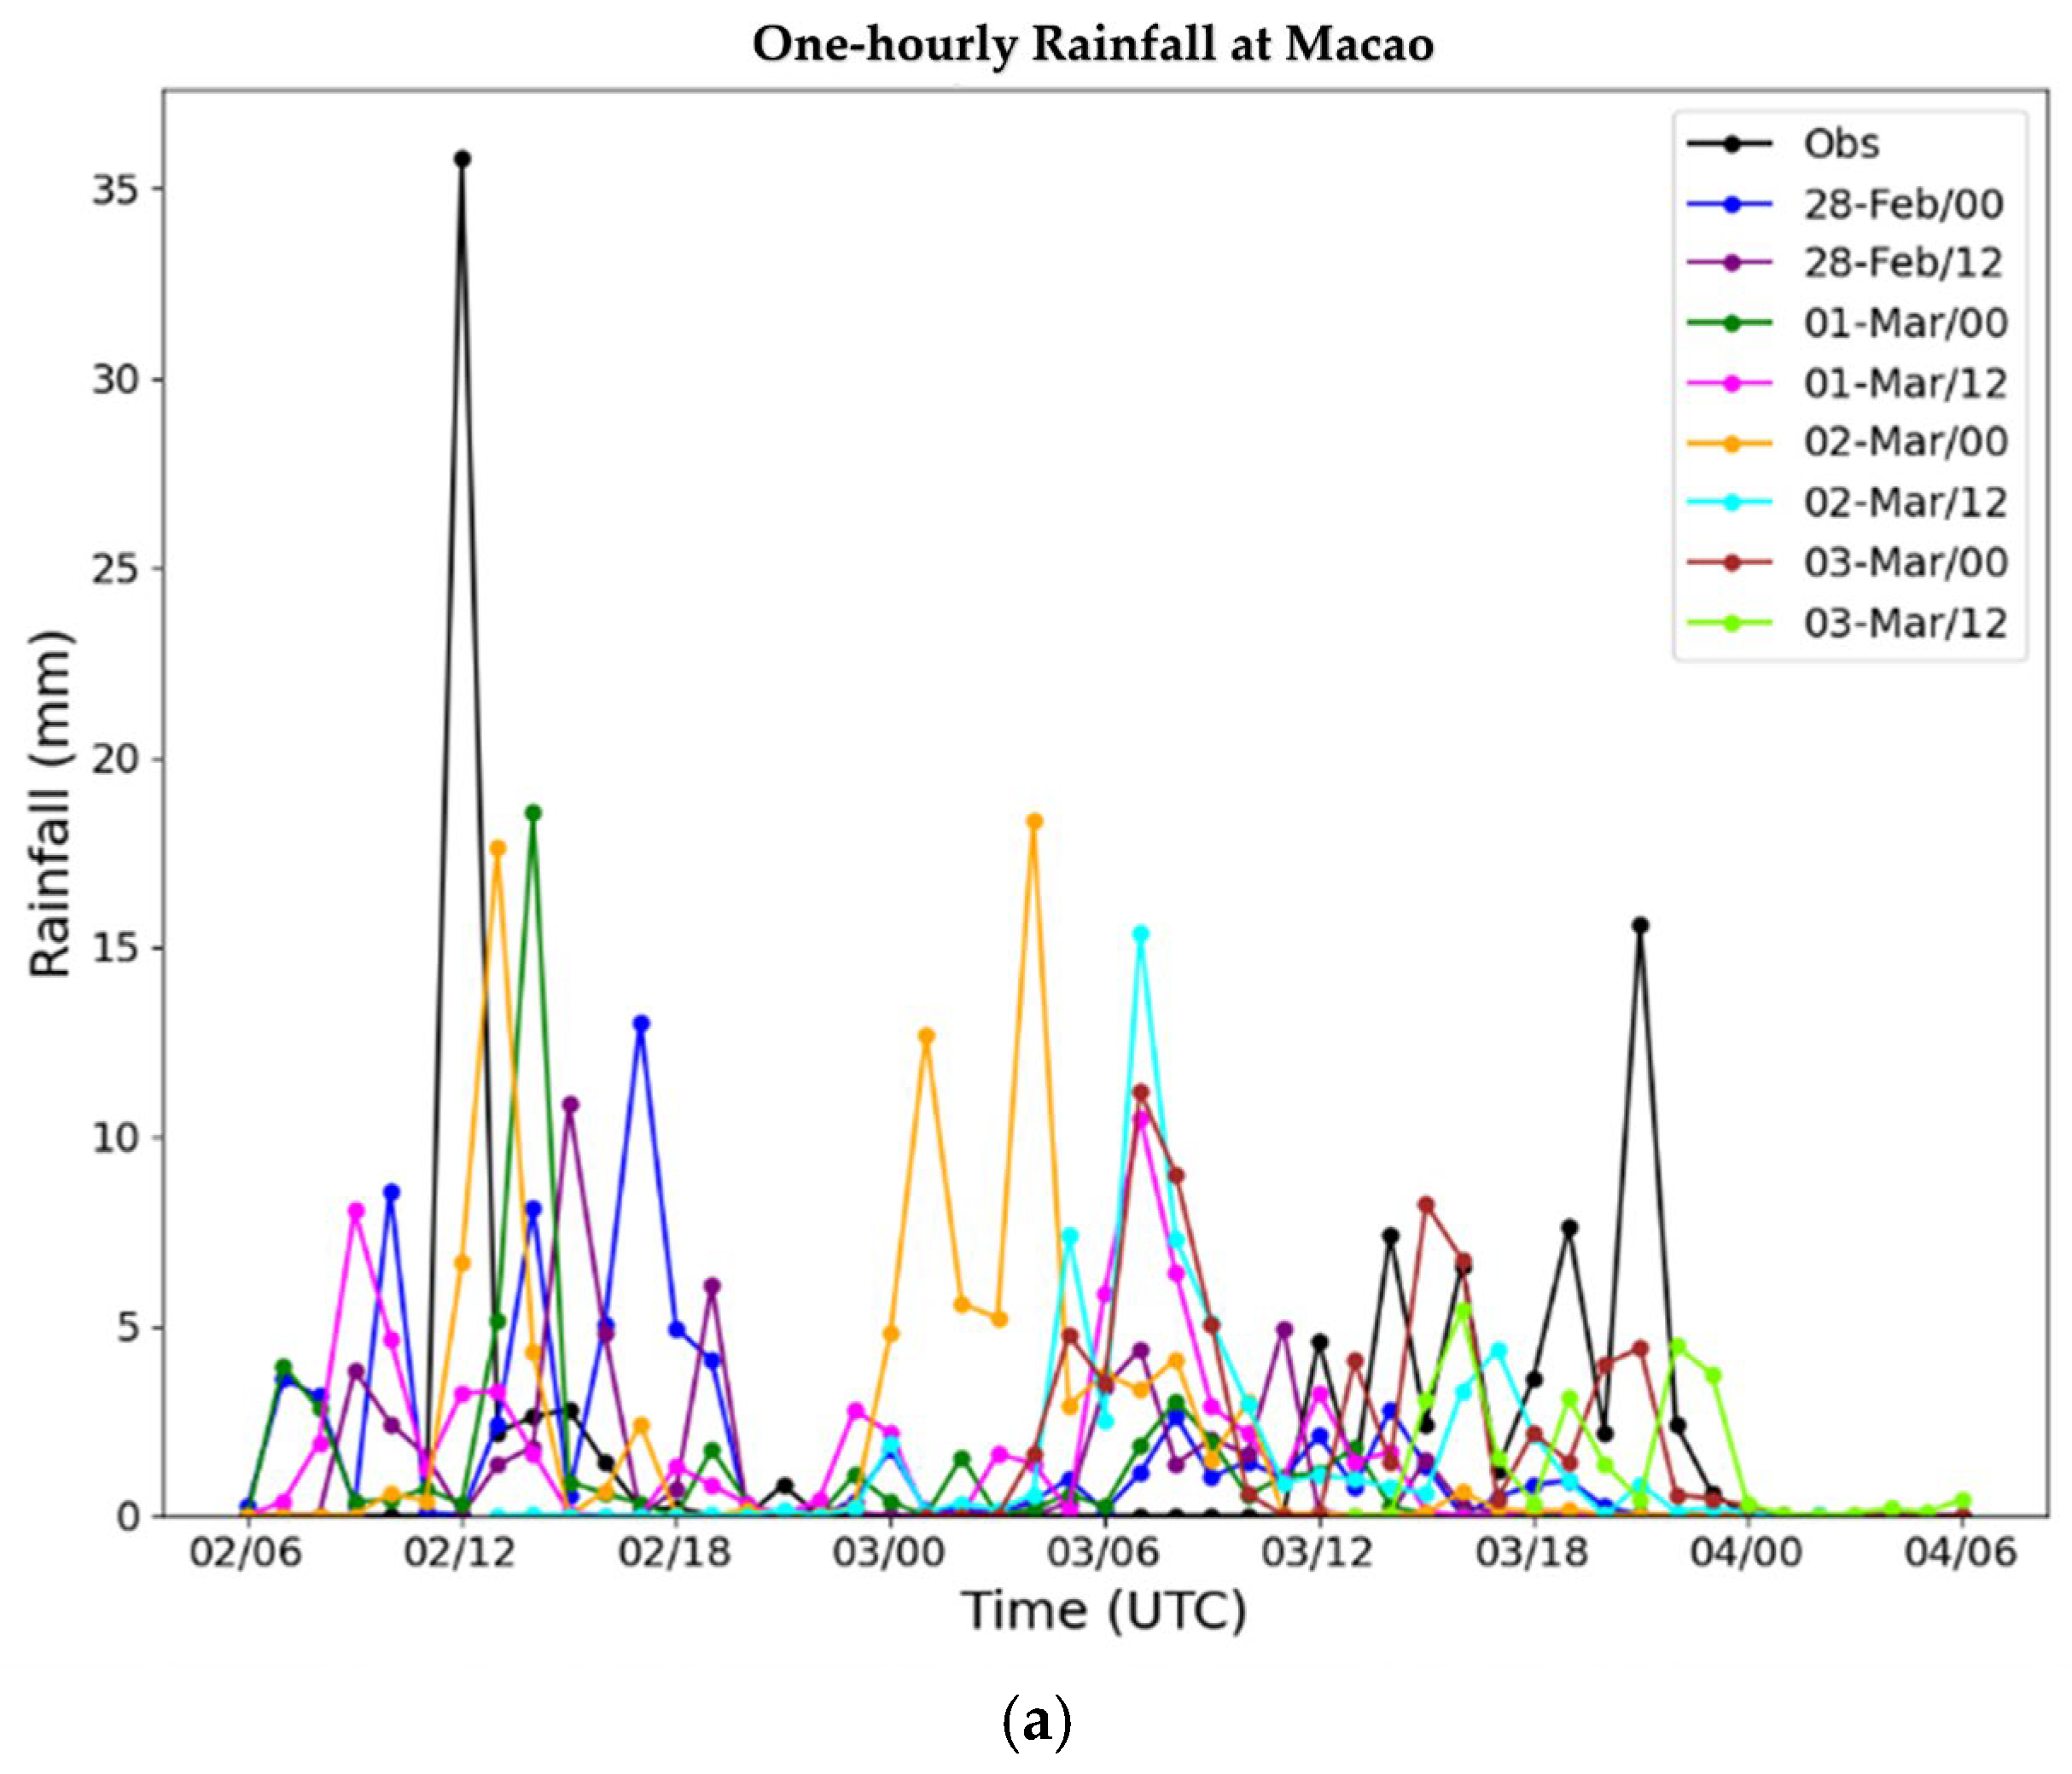
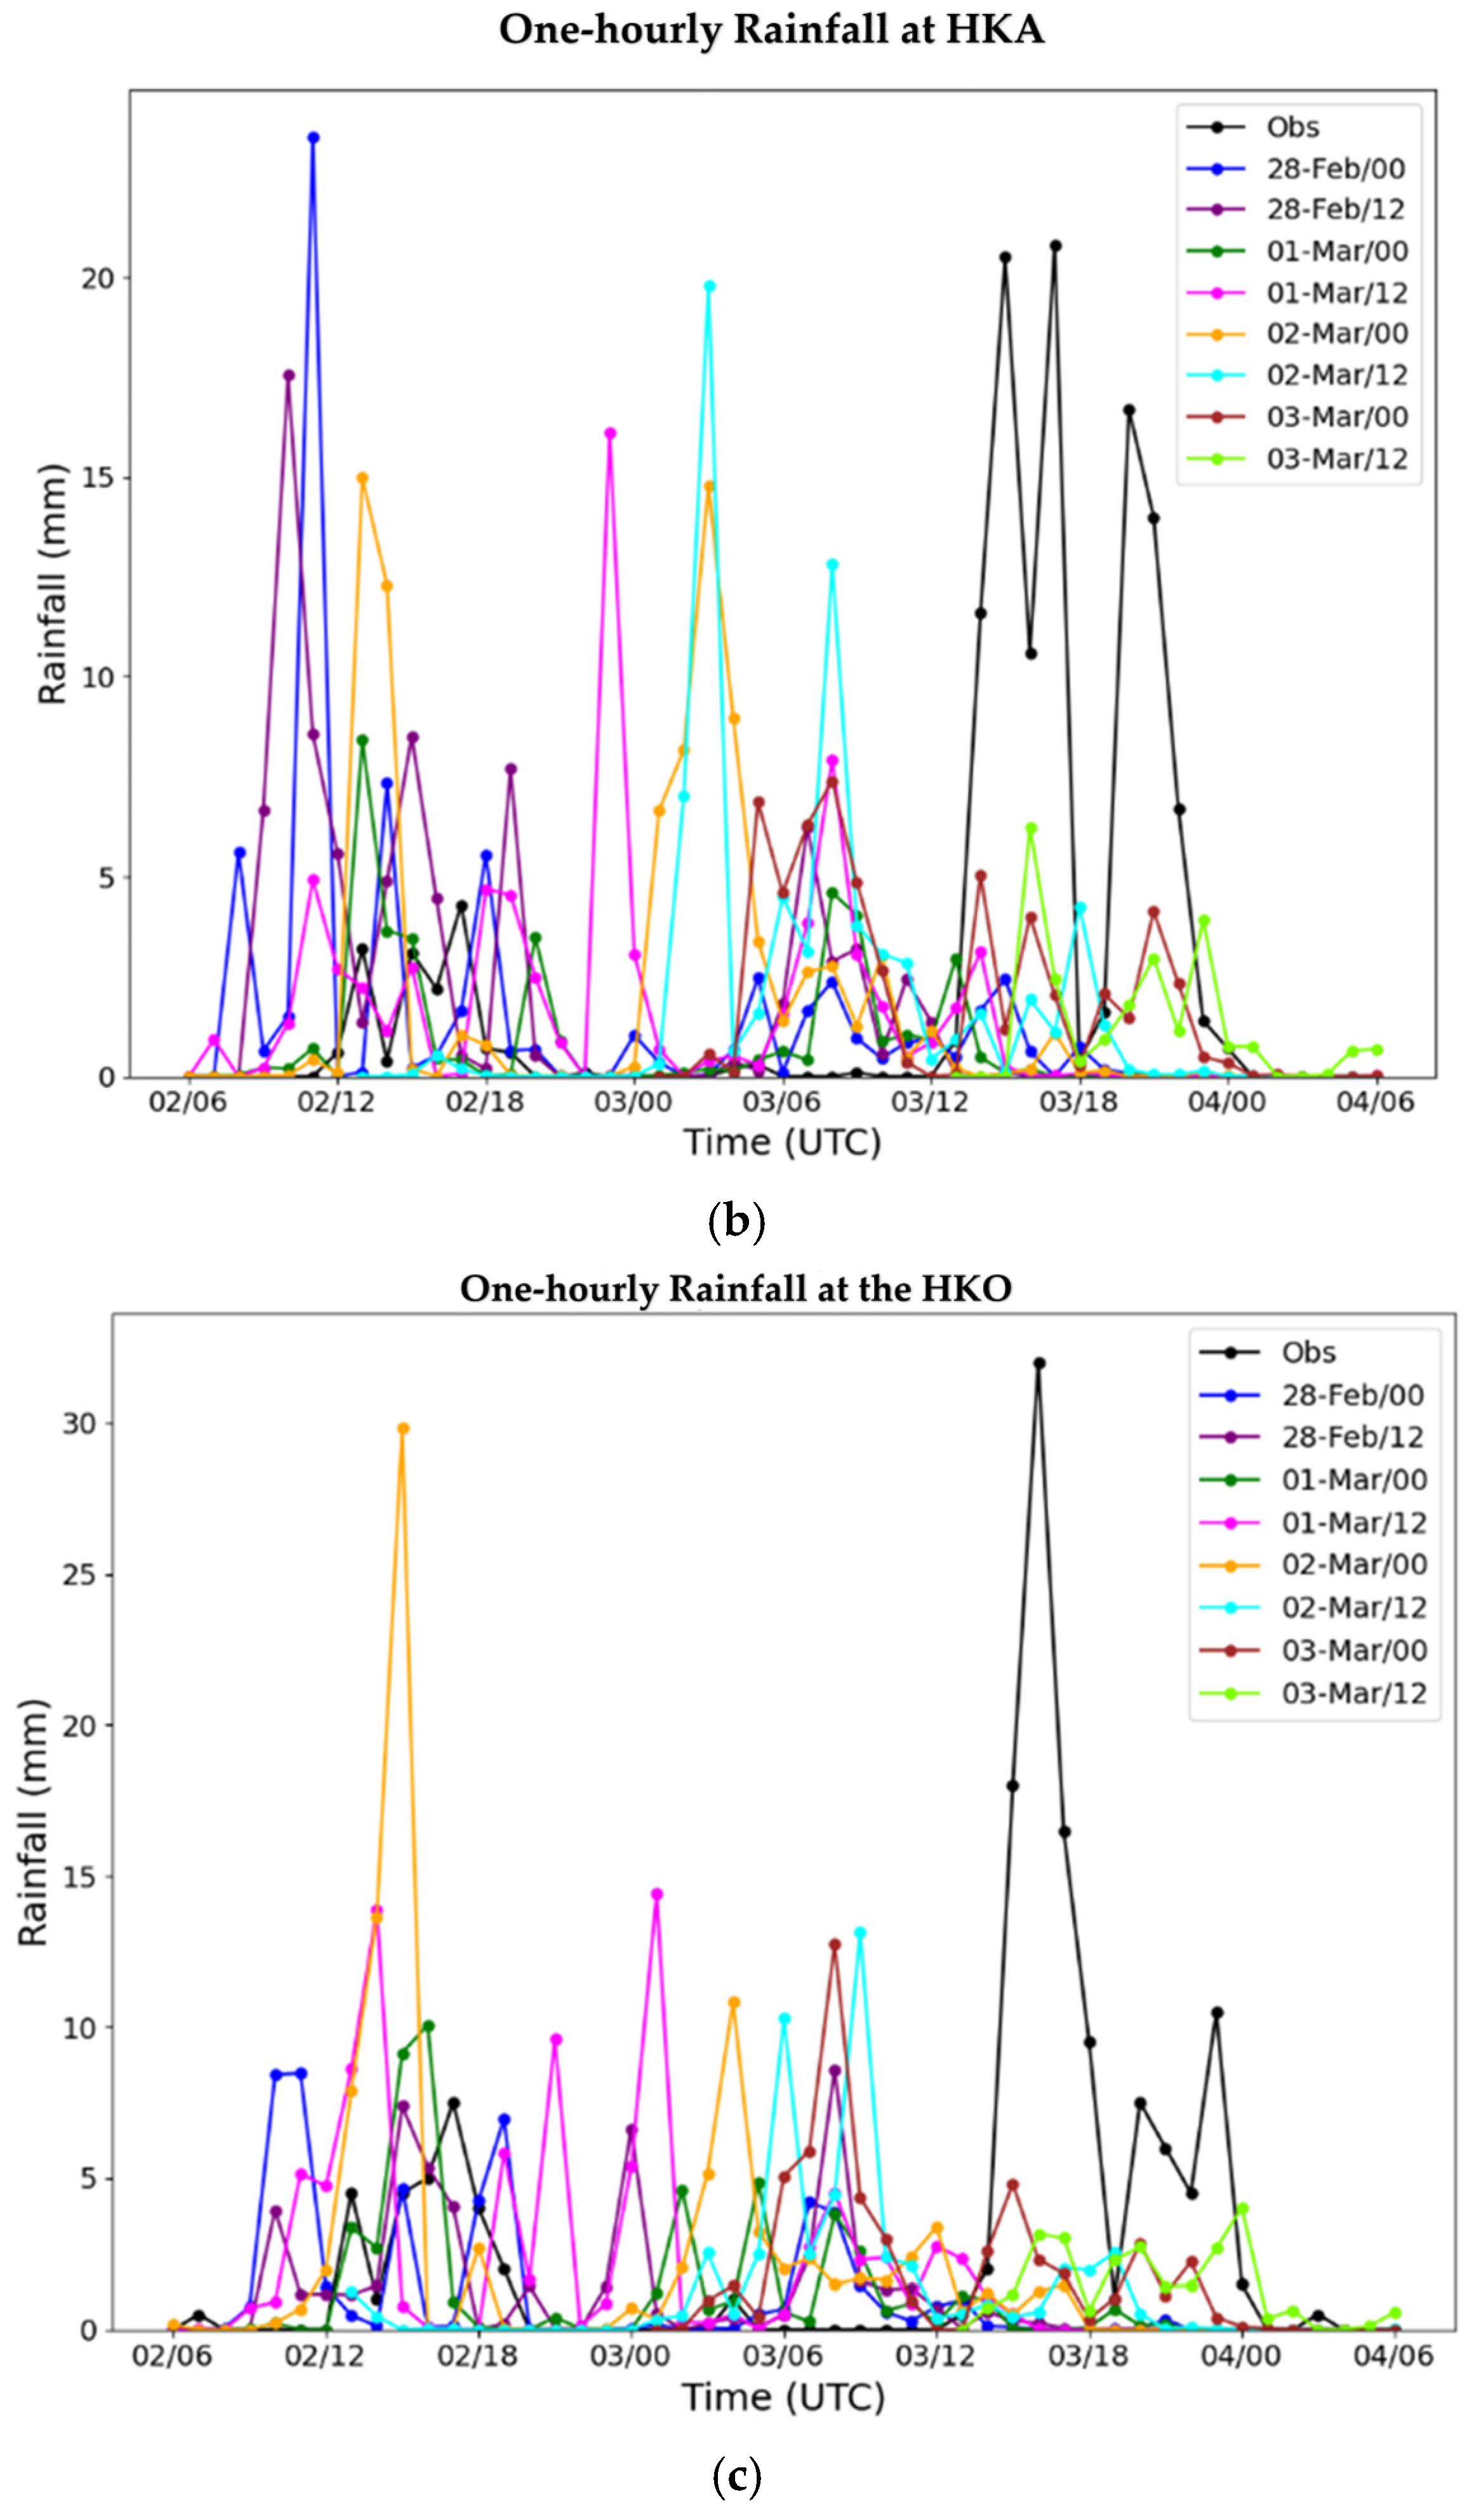
The atmosphere–ocean–wave coupled model was run operationally four times daily, with its innermost domain at a spatial resolution of approximately 1.33 km [8]. Figure 10 compares forecast hourly rainfall at three locations across the PRE from west to east, namely, Macao, Hong Kong International Airport, and the HKO headquarters, from various model runs, together with the observed hourly rainfall. In general, the forecasts indicate three episodes of rainfall events in the period concerned: around 12 UTC on 2 March 2026, from 00 to 09 UTC on 3 March 2026, and from 12 UTC on 3 March 2026 to 00 UTC on 4 March 2026. Of these forecast events, the first and the last events were observed, whereas the middle one was a false alarm. This behavior suggests that the model captured the overall synoptic-scale environment as favorable for repeated rainfall development but had difficulty in correctly discriminating between realized and non-realized convective episodes at meso- to local scales.
Figure 10.
The observed hourly rainfall (black) and the forecast rainfall from the various model runs of the atmosphere–ocean–wave coupled model for (a) Macao, (b) Hong Kong International Airport, and (c) the HKO headquarters. The date and time of the model initialization in UTC are indicated in the legend, for example, “28-Feb/00” means the model run initialized at 00 UTC on 28 February 2026.
A notable strength of the atmosphere–ocean–wave coupled model is that the first and last rainfall episodes were forecast with broadly correct timing. This indicates that the upstream disturbances leading to the events, for example, the middle-tropospheric westerly waves discussed in the sections above, were represented reasonably well in the driving analysis and propagated into the regional forecast with useful skills. For operational forecasting, such timing skill is important because it provides an early indication of the main windows of risk, even if the local rainfall maxima are not perfectly captured. However, the model performance is clearly less satisfactory in terms of rainfall magnitude and location precision. At all three stations, peak hourly rainfall is generally weaker in the forecasts than in the observations, and the underestimation is particularly important for the most intense convective periods. A likely explanation is not simply insufficient total rainfall but also a small spatial displacement of the strongest convective cores relative to the observation sites. For a small and topographically complex coastal city such as Hong Kong, even a positional error of a few kilometers can substantially reduce point rainfall verification, especially for narrow rainbands or small convective cells. Such challenges in accurately predicting the precise location and magnitude of localized heavy rain in the complex coastal terrain of the Pearl River Delta are well documented in convection-permitting model evaluations [27].
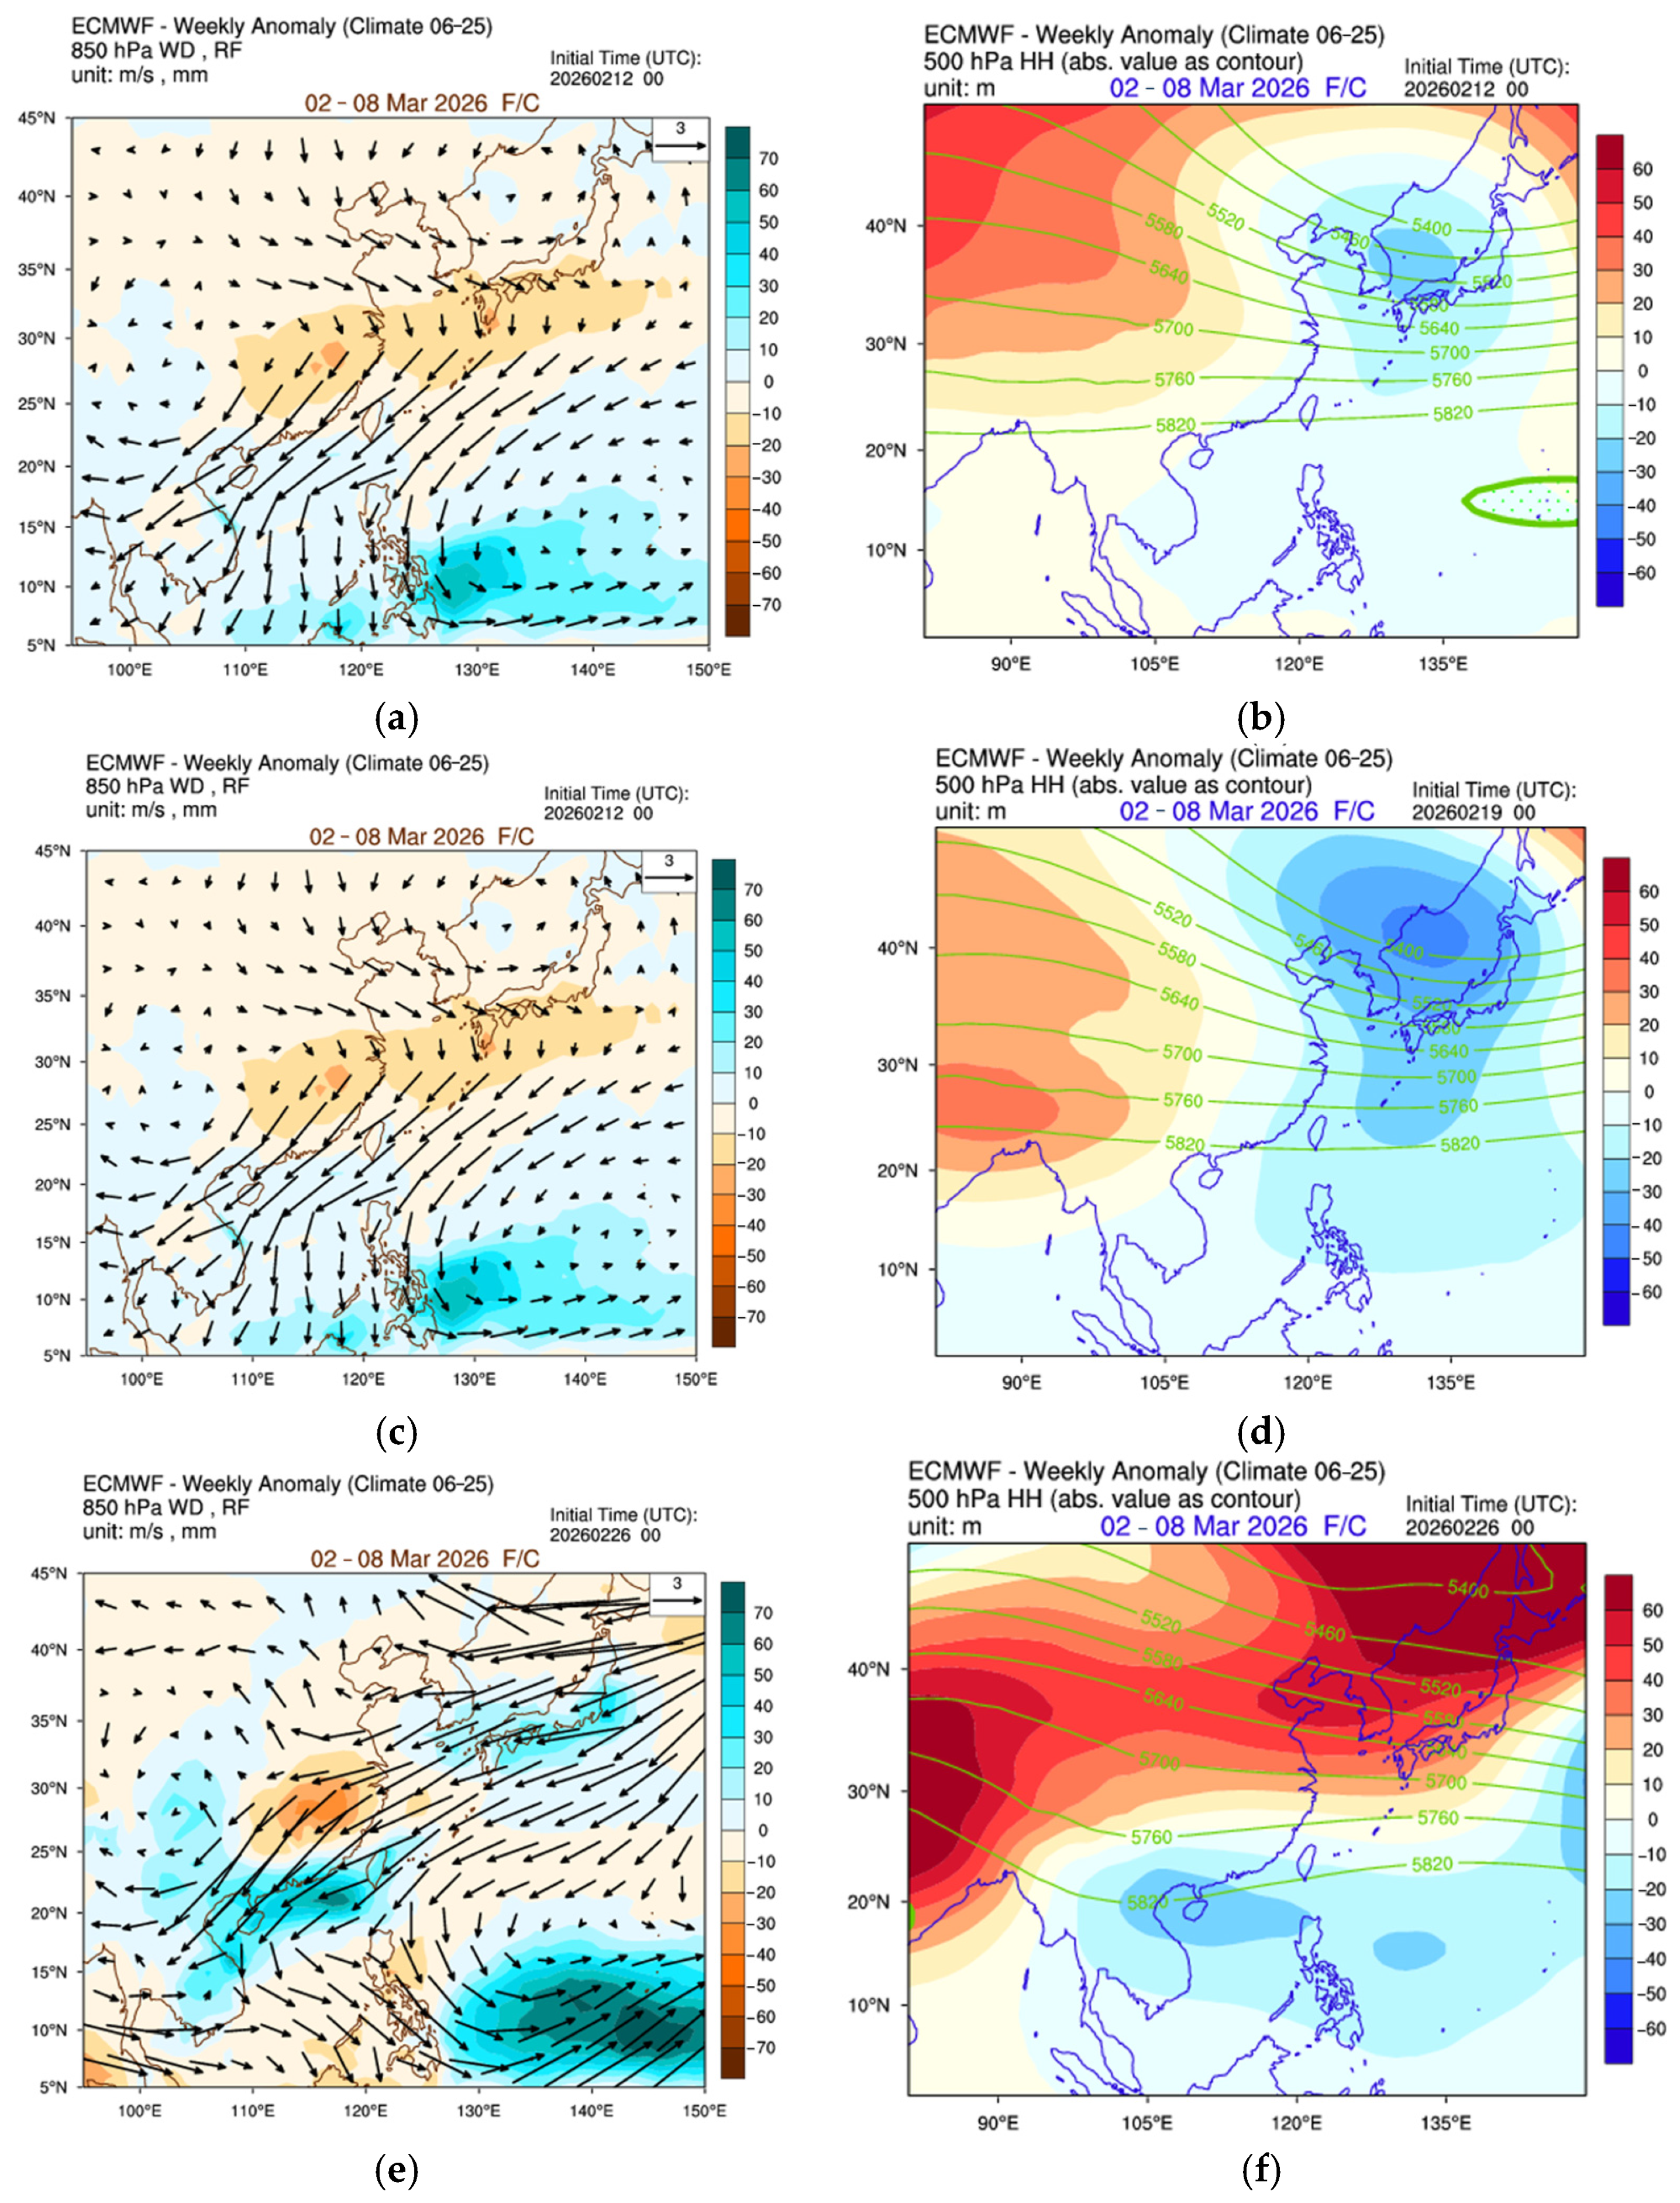
Three weeks before the rainstorms, the signals from the ECMWF sub-seasonal forecast are not strong, namely, a prevailing northeasterly flow without a troughing feature at 850 hPa (Figure 11a), and a small anomaly at 500 hPa over southern China (Figure 11b). One week later, a slight troughing flow at 850 hPa with above-normal rainfall is forecast (Figure 11c). At 500 hPa (Figure 11d), a positive height anomaly is forecast over India, and a negative height anomaly is forecast over southeastern China, resulting in a stationary westerly trough at a longitude of about 105 degrees east. The 850 hPa troughing flow feature (Figure 11e) and the 500 hPa height anomaly, as well as the stationary westerly trough (Figure 11f), become more significant in the 1-week forecast. The coast of the southern part of China is basically under the influence of a significant negative height anomaly at 500 hPa, ahead of a stationary westerly trough located at a longitude of about 97 degrees east. Significantly above-normal rainfall is forecast in the region (Figure 11e), which is consistent with actual observations. The sub-seasonal forecast is found to be useful in assessing the occurrence of above-normal rainfall about 2 weeks ahead. The useful indication from the ECMWF sub-seasonal model is consistent with recent studies demonstrating predictable patterns and sources for weekly precipitation anomalies over southern China at 2–4 week leads [28].
Figure 11.
From the ECMWF sub-seasonal forecast: (a) the 850 hPa wind field anomaly and rainfall anomaly, and (b) the 500 hPa height anomaly (shaded) and height field (green contours) for the 3-week forecast; the respective 2-week forecasts are given in (c,d), and 1-week forecasts in (e,f).
7. Simulation of the Micro-Cyclone near Hong Kong from a Real-Time Model
A high-resolution mesoscale model run based on the Weather Research and Forecasting (WRF) model with the assimilation of surface observations and a wind profiler has been run on a trial basis, starting in early 2026. The technical specifications of this model are similar to those found in [29]. The innermost domain (domain 03) has a spatial resolution of 1 km. Special features of this model setup, compared to the setup in [29], include (a) very dense vertical levels within the atmospheric boundary layer, including 36 levels below a height of 1200 m with a vertical spacing of less than 50 m, and (b) activation of BEP to improve dynamic and thermodynamic structures within the lower part of the urban boundary layer, with the use of the latest available land use data for 2024 from the MODIS/Terra + Aqua Land Cover Type Yearly L3 Global 500 m SIN Grid V006 (MCD12Q1). The successful reproduction of the microscale cyclone at 1 km resolution is consistent with findings that higher horizontal resolution significantly improves the simulation of meso-β-scale convective vortices in South China rainstorms [30].
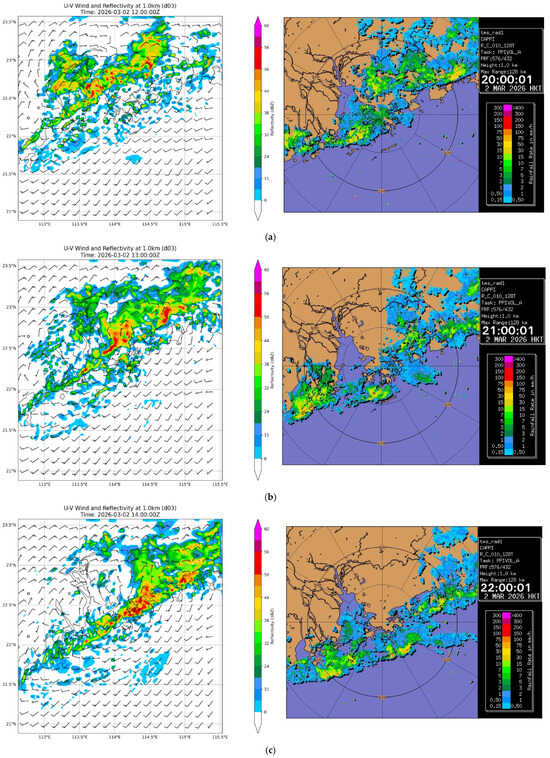
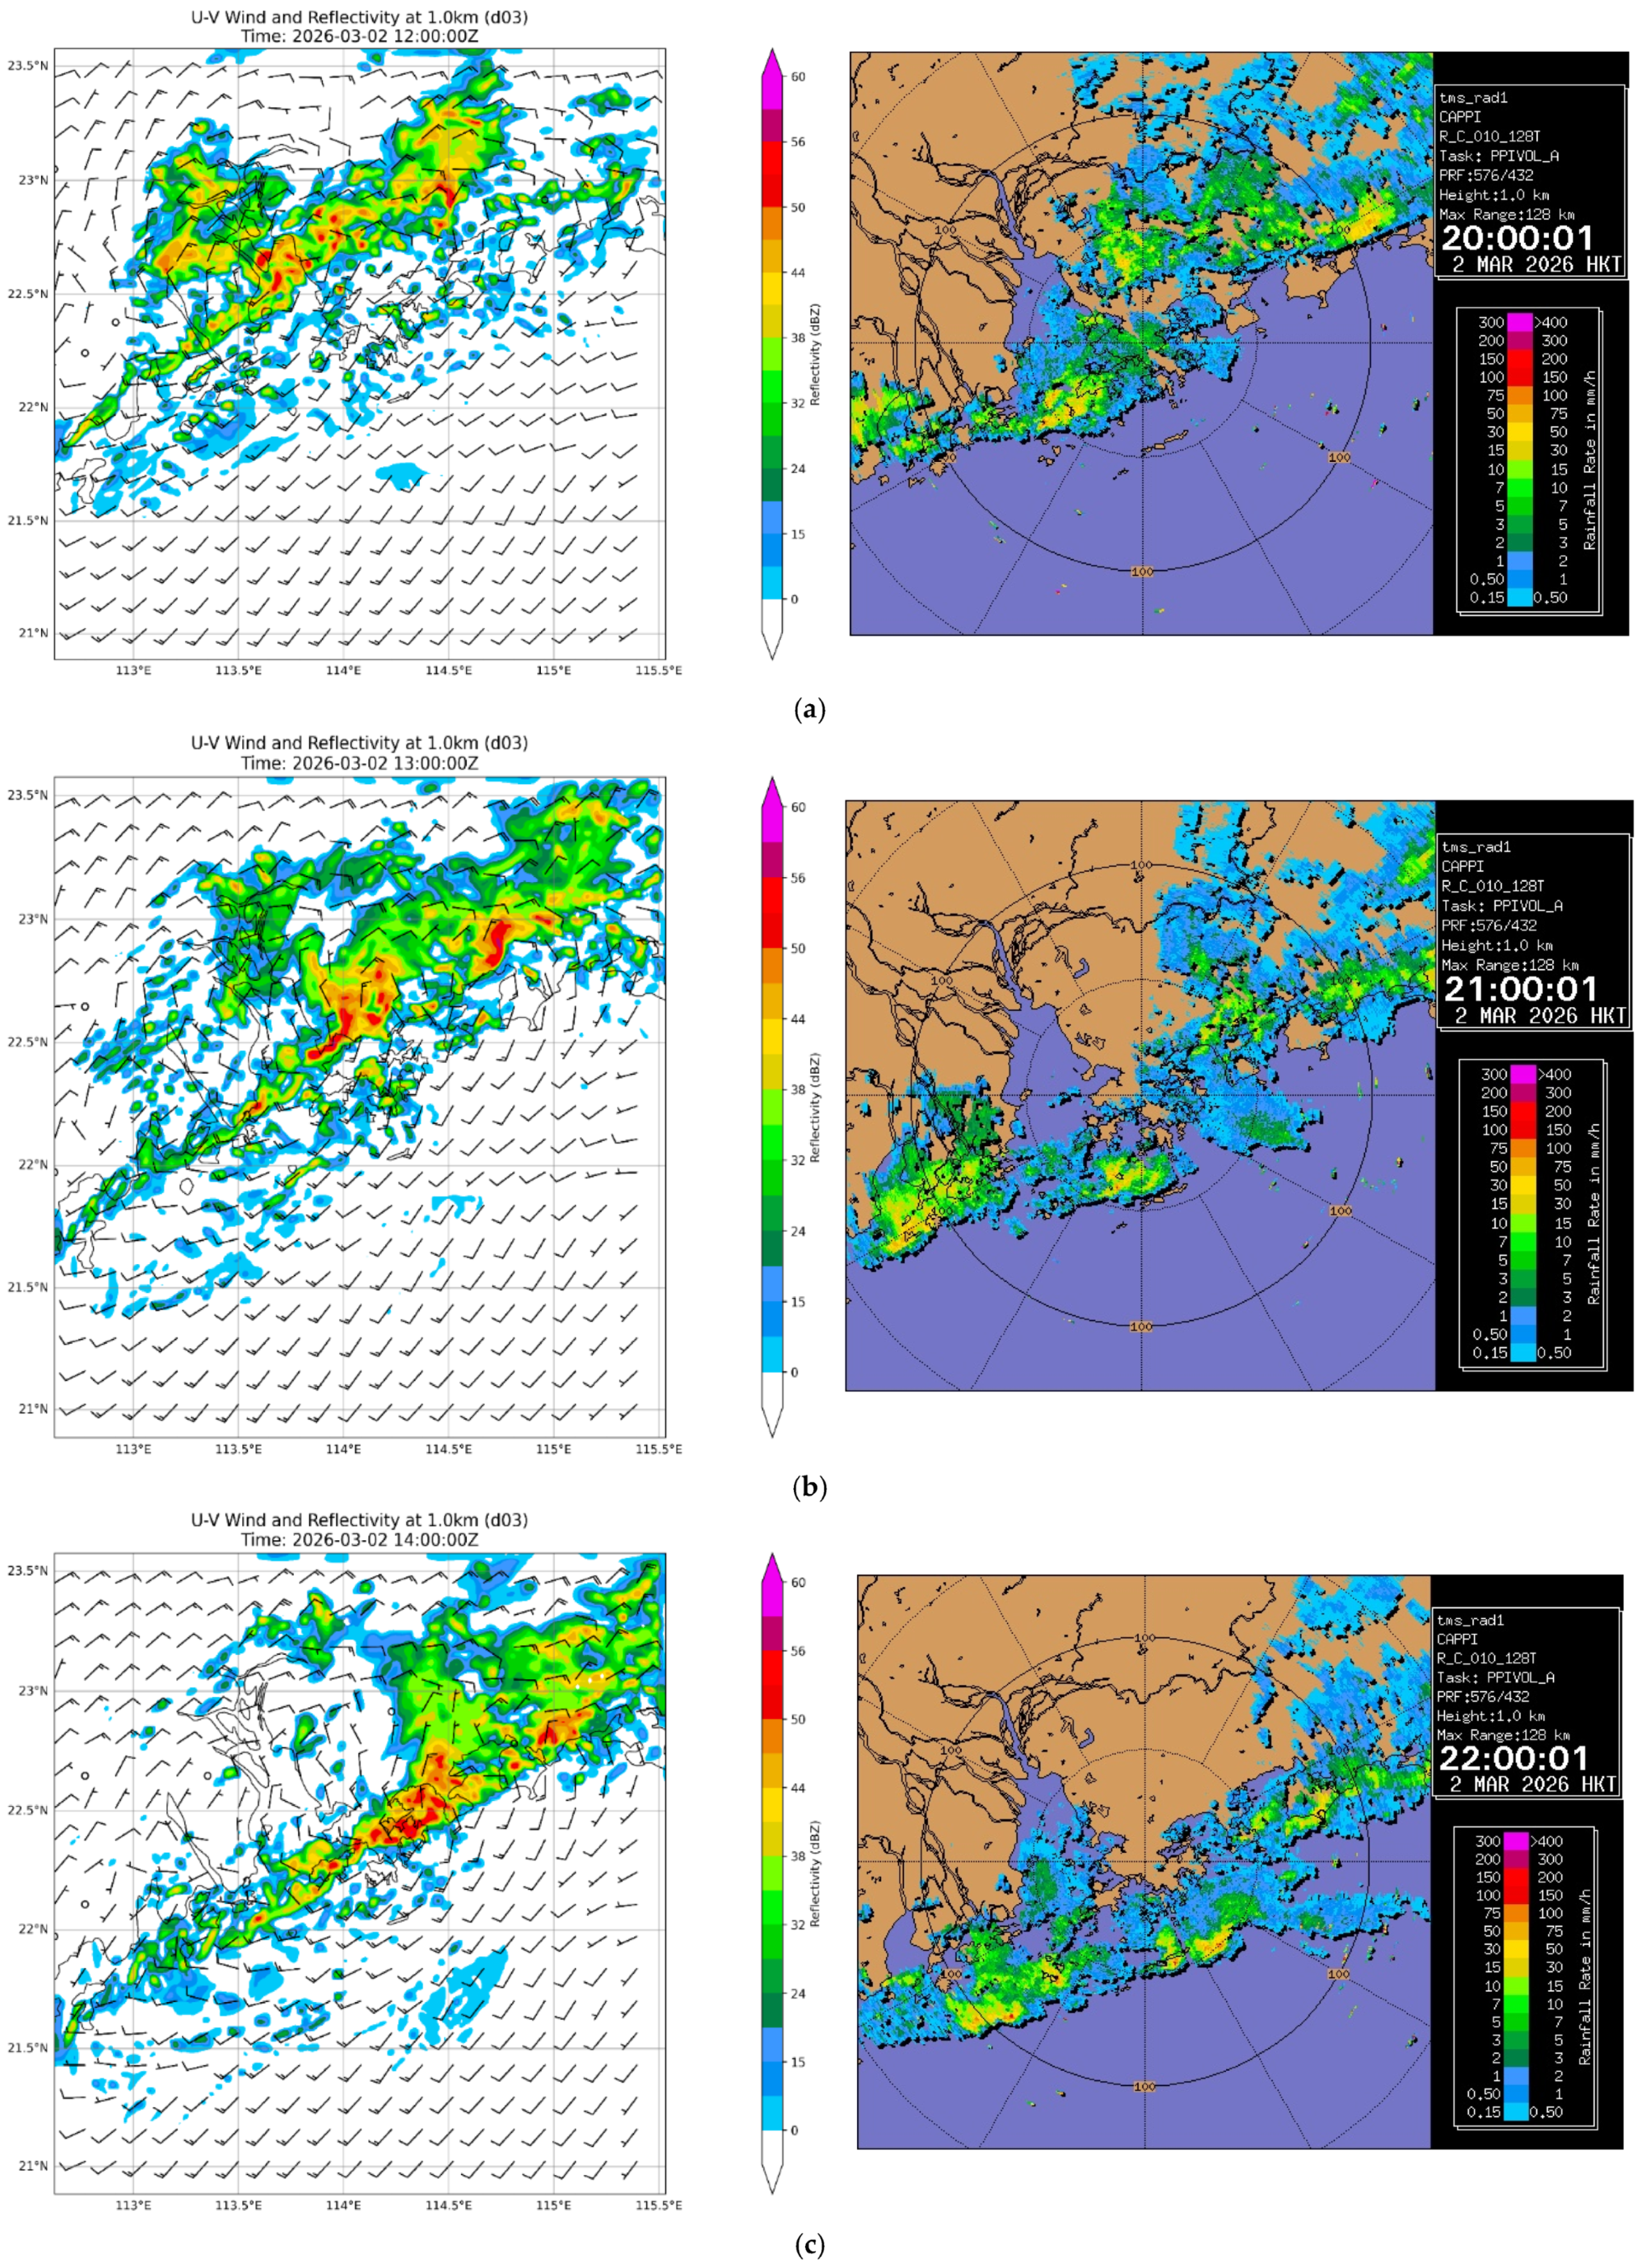
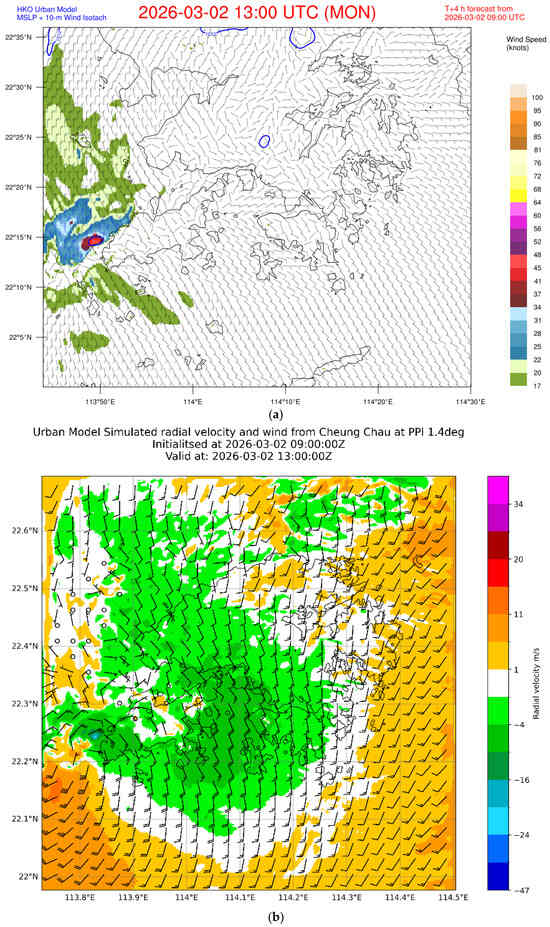
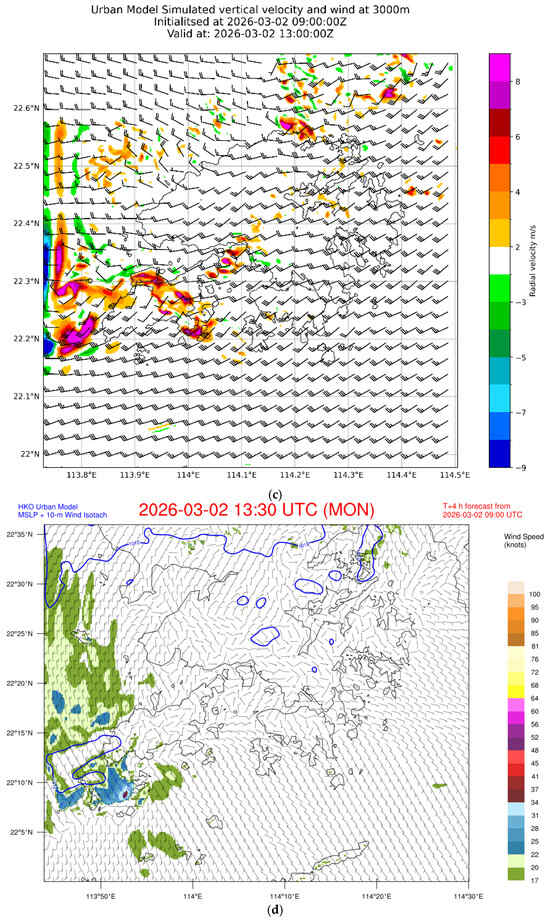
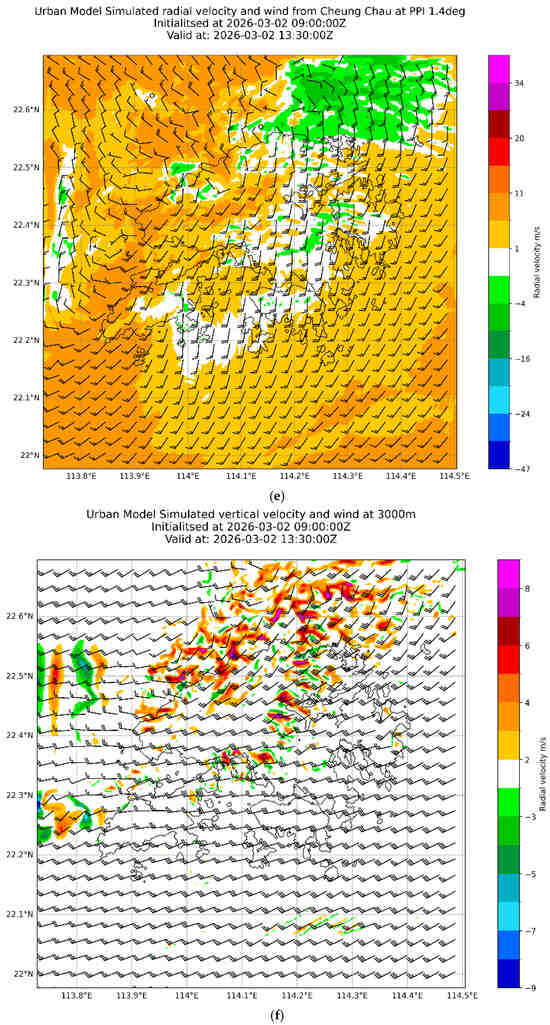
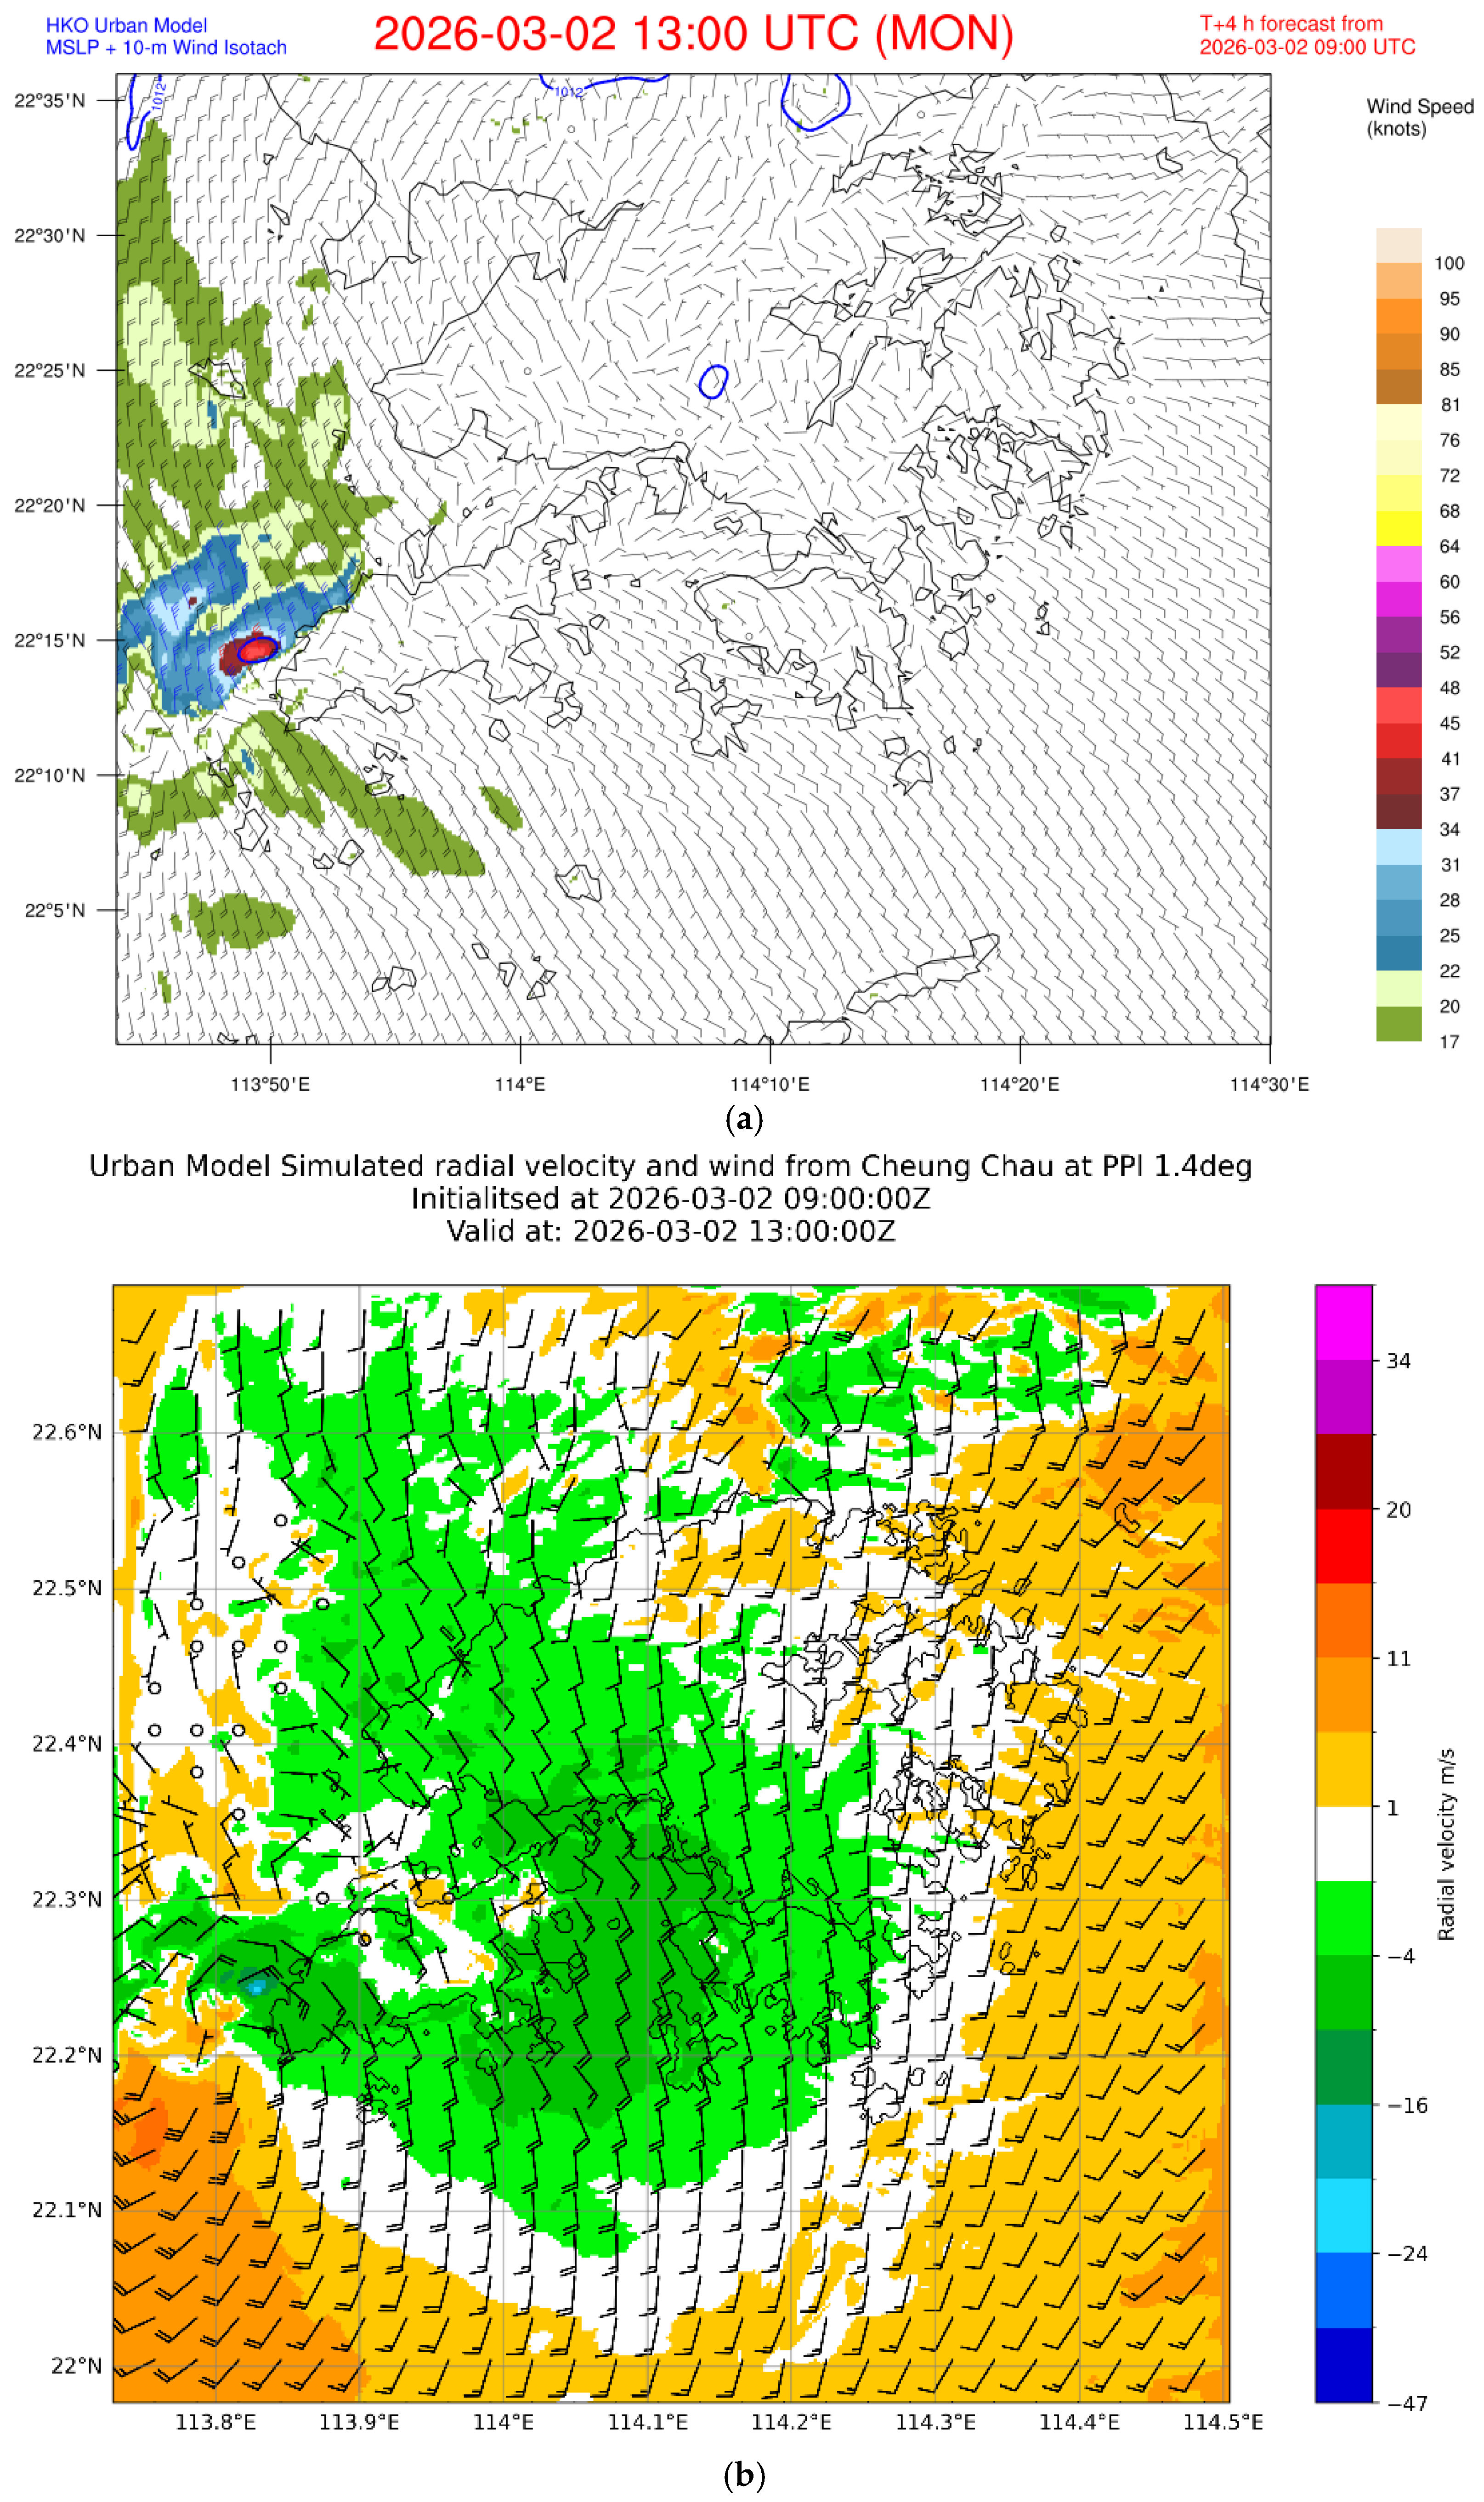
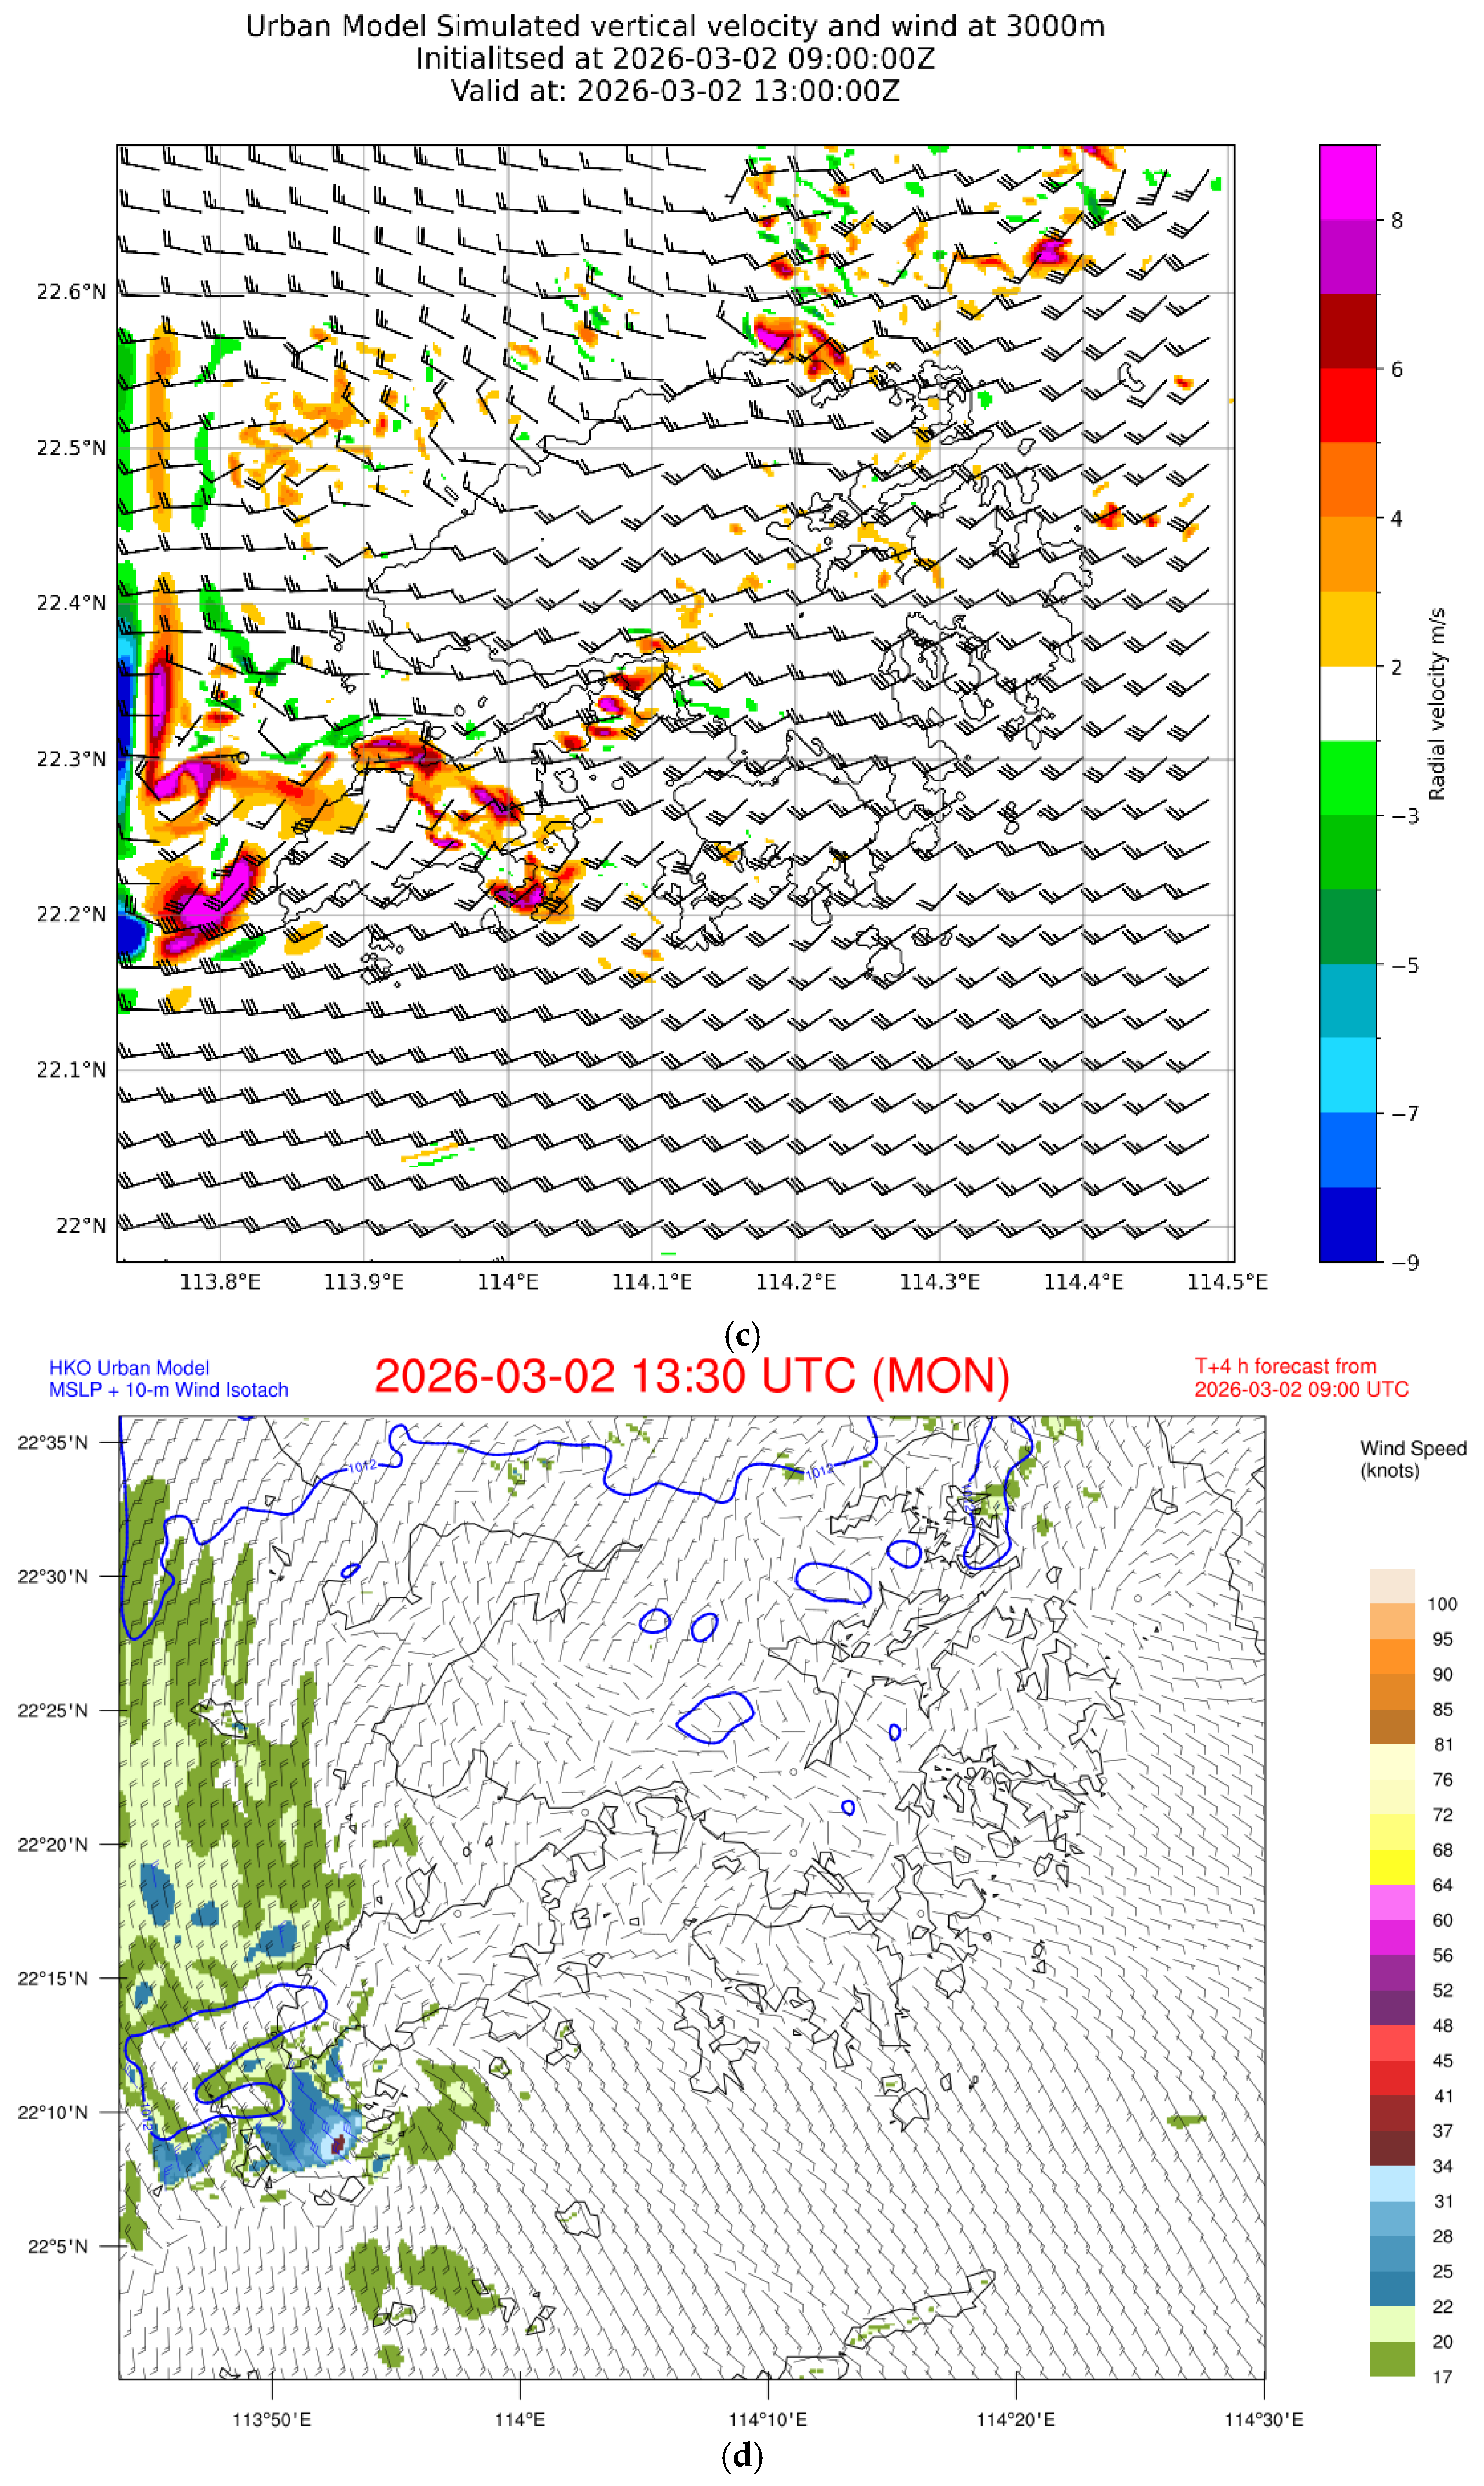
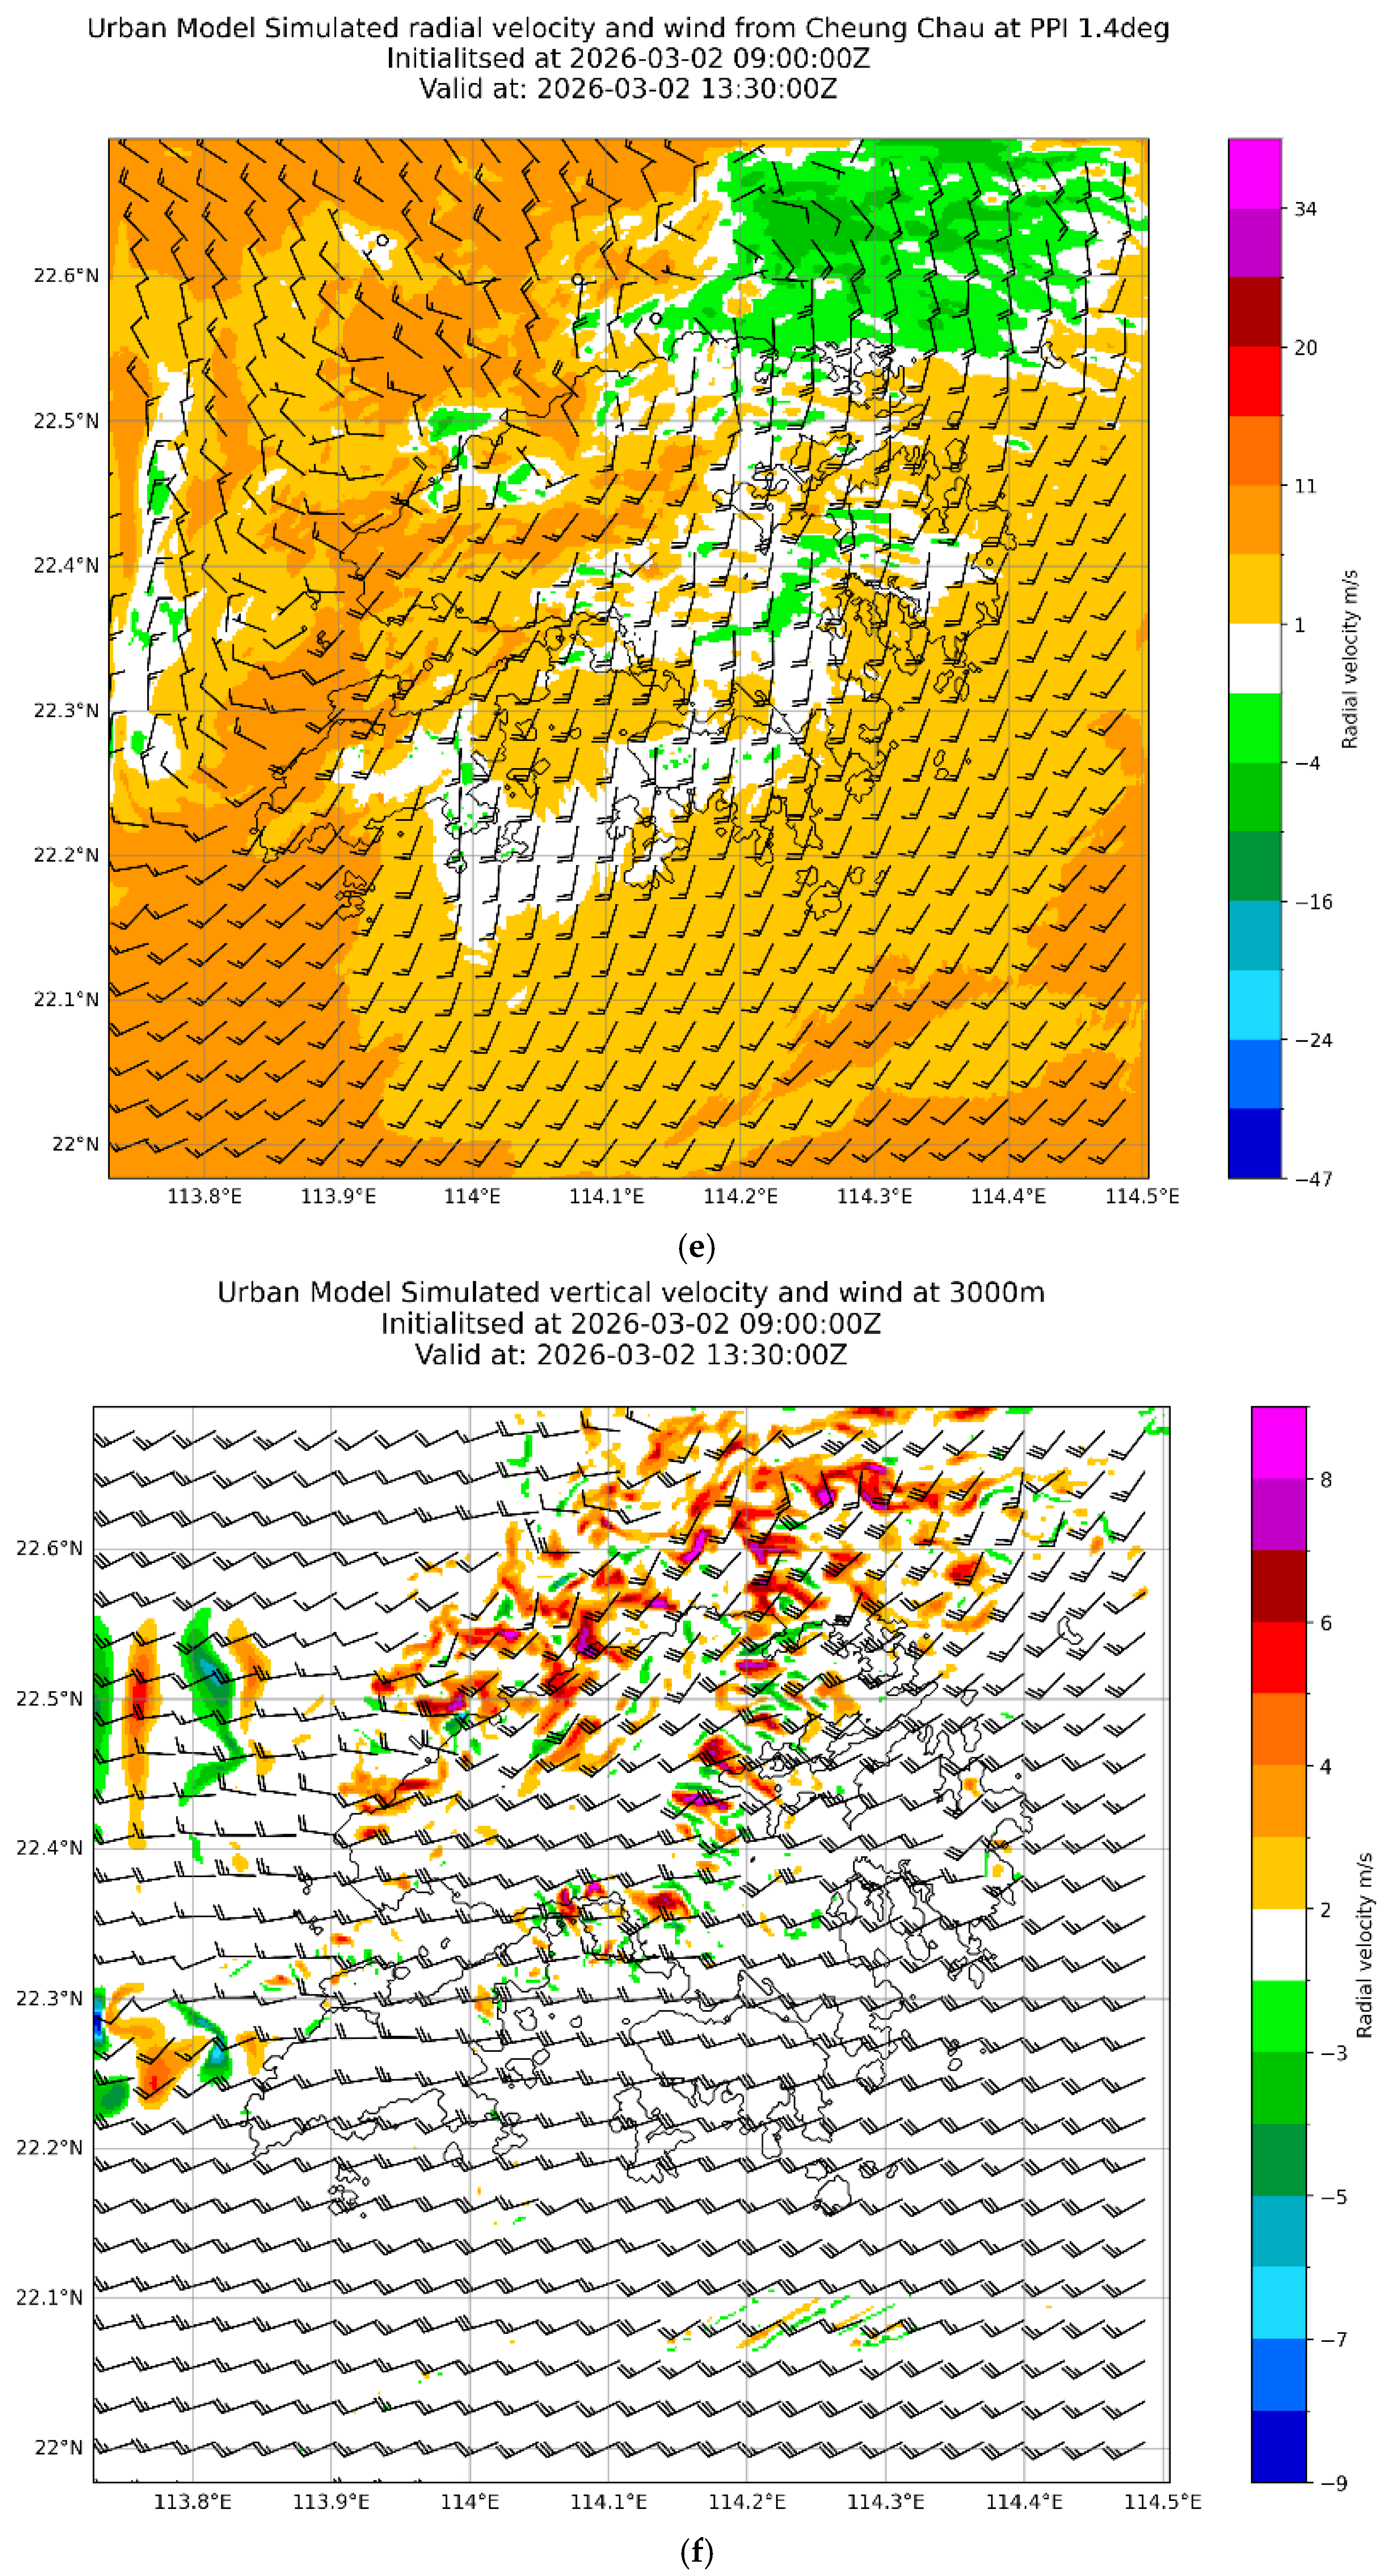
The model run initialized at 09 UTC on 2 March 2026 is considered. At that time, no cyclonic circulation was assimilated into the model from the available weather radar data. From the simulated wind and radar reflectivity at a height of 1 km (Figure 12), the convection associated with the cold front becomes more intense as it approaches the coast of Guangdong (a larger area containing the PRE and Hong Kong), consistent with the actual weather radar observations. Along this line of convection, a microscale cyclone is successfully simulated in the 4 h forecast at 13 UTC on 2 March 2026, just to the west of Lantau Island in the southwestern part of Hong Kong, as shown in the simulated 10 m wind (Figure 13a) and the simulated 1.4-degree PPI velocity image from the CCH radar (Figure 13b). The cyclone is forecast to track southeastward towards the waters to the south of Hong Kong and weaken gradually (Figure 13d for the wind speed isolines (isotachs) and Figure 13e for the simulated Doppler velocity). At the mid-level of 3000 m, it is observed that a disturbance coincides with the cyclone, where the southwesterly jet increases significantly, providing strong uplift (Figure 13c). Though the timing of the occurrence of this cyclone is different from the actual observations (around 11:50 UTC), the formation and movement of the cyclone are reproduced very well in this real-time WRF model run. The model result is useful for studying the dynamics of this microscale cyclone in the future. The purpose of this paper is to show that, with proper model setup and real-time weather radar data assimilation, it is possible to simulate the occurrence of storm-scale cyclones along a line of convection.
Figure 12.
(left) Forecast wind and radar reflectivity at a height of 1 km at (a) 12 UTC, (b) 13 UTC and (c) 14 UTC on 2 March 2026 based on the WRF model run initialized at 09 UTC. (right) The 1-km constant altitude PPI (CAPPI) radar imagery from the TMS radar at (a) 20:00, (b) 21:00, and (c) 22:00 (UTC + 8).
Figure 13.
(a) Forecast 10 m wind, 10 m isotach (shaded), and mean sea level pressure; (b) the simulated 1.4-degree plan position indicator velocity scan of the CCH radar; and (c) vertical velocity at 3000 m at 13 UTC on 2 March 2026 for the WRF model run initialized at 09 UTC on 2 March 2026. (d–f) The corresponding forecasts at 13:30 UTC on the same day.
8. Meteorological Service Aspect
At about 4 to 5 days ahead of the first rainstorm, a “weather note” article was published on the HKO’s website and social media page to alert the public to the possible occurrence of intense convective weather, such as thunderstorms or even squall lines in springtime (the so-called “shi-hu-feng” [31,32]) over southern China. This attracted wide coverage in the media in Hong Kong because of the proximity to the Spring Lantern Festival and its co-occurrence with the total lunar eclipse, with a “blood moon” observable in the territory (full moon appearing in dull red because the blue light component of the sunlight is scattered by the Earth’s atmosphere and the remaining red light is refracted onto the lunar surface). The HKO was under high pressure for accurate forecasting of cloud amounts and heavy rain in Hong Kong, even 4 days ahead, with refinements of more accurate timing closer to the time. The media presented widespread coverage of the possible occurrence of wind gusting to 135 km/hour because of a previous event in 2005 (as in [31,32]). With the use of sub-seasonal forecasts, medium-range forecast products from numerical weather prediction models and artificial intelligence models, and rainstorm nowcasting tools, the heavy rain episodes were largely captured with sufficient lead time for the public. The only “discrepancy” was the passage of the low-level cyclone just to the southwest and south of Hong Kong during the rainstorm on 2 March 2026, which missed the territory in the end, demonstrating the randomness of the location of intense convection, which was described as a caveat in the “weather note” article. However, even though heavy rain was successfully forecast for the rainstorm in the evening of 3 March 2026, the rain was considered to be mainly stratiform in nature just before the development of lightning strikes off and over the western coast of Hong Kong (yellow dots in Figure 9a for C-C lightning strikes in the period from 22:00 to 23:00 on 3 March 2026), with no signature of C-C or C-G strikes upstream of the territory at earlier times. Even though the current conceptual model of elevated thunderstorms may explain the occurrence of intense convection close to and over Hong Kong, it may not explain why convection does not occur earlier and upstream of the territory along the western coast of Guangdong. These subtle differences in spatial occurrence are not picked up by the numerical models either. This is still an area requiring further investigation.
9. Conclusions
The forecast of early-season rainstorms in Hong Kong on 2 to 4 March 2026 was operationally challenging. In particular, it is uncommon to have intense convective weather features such as lightning strikes and low-level vortices so early in the year. As such, the present paper is a novel documentation of such a rare rainstorm episode, with the latest applications of meteorological technology, such as frequently updated background atmosphere from a radar wind profiler and a ground-based microwave radiometer, Doppler velocity data from a newly installed C-band solid-state weather radar, and forecasts from an atmosphere–ocean–wave coupled model and a sub-seasonal model.
The first rainstorm appears to be related to a capping inversion, with convection triggered by a middle to lower tropospheric wave, without (climatologically) significant divergence in the upper troposphere. A low-level vortex is clearly observed for the first time from the surface weather station observations and Doppler velocity from a weather radar, with a 3D wind field reaching a height of 1 km above sea level. The vertical circulation in the atmospheric boundary layer may be stretched upward by the mid-tropospheric upward air motion to form the vortex. The microscale cyclone could be successfully simulated using a real-time WRF run with proper setup and data assimilation. These model results will be studied in a future paper to find out the dynamics of the formation of this small cyclone. In the second rainstorm, elevated thunderstorms and a persistent rainstorm occur over Hong Kong. The southerly winds with abundant moisture are uplifted by the cooler continental air near the surface. Again, upward air motion appears to be mostly triggered by middle tropospheric waves.
The March 2026 rainstorm episode differs fundamentally from the May 2005 squall line case documented by [32]. While the 2005 event represented a classic summer squall line with deep convection, strong cold pool formation, and extreme wind gusts, the 2026 episode featured elevated convection under low-CAPE conditions (0–217 J/kg), low-level vortex formation, and heavy rainfall as the primary hazard. The 2026 case occurred exceptionally early in the year, making it a rare example of early-season elevated convection in southern China. The integration of new observational technologies—including the C-band solid-state radar and 1 km wind field retrieval—provides unprecedented documentation of the mesoscale circulation features associated with this atypical event.
We acknowledge that the C-band solid-state radar at Cheung Chau was newly installed at the time of this event, and comprehensive quantitative validation is still ongoing. The multi-platform consistency demonstrated in this study—surface weather stations showing cyclonic circulation consistent with radar Doppler velocity, and an independent WRF model simulation reproducing similar features—provides confidence in the key conclusions. However, systematic long-term validation with accumulated cases is needed to establish the quantitative accuracy of the new radar system. Additionally, while this paper documents an important case of early-season convection under low-CAPE conditions, more systematic studies with larger sample sizes are required to establish the climatological frequency and predictability of such events in southern China.
Author Contributions
Conceptualization, P.W.C.; methodology, P.W.C.; investigation, P.W.C.; resources, H.Y.Y., C.K.H. and Y.-H.H.; data curation, T.K.L.; writing—original draft preparation, P.W.C.; writing—review and editing, T.K.L.; visualization, T.K.L., H.F.L., W.P.T. and S.K.L. All authors have read and agreed to the published version of the manuscript.
Funding
This research received no external funding.
Institutional Review Board Statement
Not applicable.
Informed Consent Statement
Not applicable.
Data Availability Statement
The data presented in this study are available on request from the corresponding author due to privacy.
Conflicts of Interest
The authors declare no conflicts of interest.
References
- Zhang, M.; Meng, Z. Warm-sector heavy rainfall in southern China and its WRF simulation evaluation: A low-level-jet perspective. Mon. Weather Rev. 2019, 147, 4461–4481. [Google Scholar] [CrossRef] [Scilit]
- Pu, Y.; Li, Y.; Huang, S.; Li, X.; Xiao, F.; Liu, H.; Guo, L. Multiscale perspectives on an extreme warm-sector rainfall event over coastal South China. Remote Sens. 2022, 14, 3110. [Google Scholar] [CrossRef] [Scilit]
- Tang, Y.; Xu, X.; Ju, Y.; Wu, Z.; Zhang, S.; Chen, X.; Xu, Q. Statistical analysis of mesovortices during the first rainy season in Guangdong, South China. Remote Sens. 2023, 15, 2176. [Google Scholar] [CrossRef] [Scilit]
- Zhao, S.; Bei, N.; Sun, J. Mesoscale analysis of a heavy rainfall event over Hong Kong during a pre-rainy season in South China. Adv. Atmos. Sci. 2007, 24, 555–572. [Google Scholar] [CrossRef] [Scilit]
- Chan, P.W.; Hon, K.K.; Li, Q. A rare winter thunderstorm event near Hong Kong. Atmósfera 2021, 34, 503–515. [Google Scholar] [CrossRef] [Scilit]
- Li, X.; Wang, D.; Zhou, W. Multiple-time-scale variations of the record-breaking pre-summer extreme rainfall over South China in 2022. J. Clim. 2024, 37, 1965–1980. [Google Scholar] [CrossRef] [Scilit]
- Amaireh, A.; Zhang, Y.; Chan, P.W.; Zrnic, D. A novel approach for improving cloud liquid water content profiling with machine learning. Remote Sens. 2025, 17, 1836. [Google Scholar] [CrossRef] [Scilit]
- Lai, S.K.; Chan, P.W.; He, Y.; Chen, S.S.; Kerns, B.W.; Su, H.; Mo, H. Real-time operational trial of atmosphere–ocean–wave coupled model for selected tropical cyclones in 2024. Atmosphere 2024, 15, 1509. [Google Scholar] [CrossRef] [Scilit]
- Potvin, C.K.; Shapiro, A.; Xue, M. Impact of a vertical vorticity constraint in variational dual-Doppler wind analysis: Tests with real and simulated supercell data. J. Atmos. Ocean. Technol. 2012, 29, 32–49. [Google Scholar] [CrossRef] [Scilit]
- Shapiro, A.; Potvin, C.K.; Gao, J. Use of a vertical vorticity equation in variational dual-Doppler wind analysis. J. Atmos. Ocean. Technol. 2009, 26, 2089–2106. [Google Scholar] [CrossRef] [Scilit]
- Chan, P.W.; Chan, Y.W.; Cheung, P.; Chong, M.L. An observational study of a severe squall line crossing Hong Kong on 15 March 2025 based on radar-retrieved three-dimensional winds and flight data. Appl. Sci. 2025, 15, 8562. [Google Scholar] [CrossRef] [Scilit]
- Ma, M.; Huang, X.; Fei, J.; Li, C.; Cheng, X. Characteristics of elevated thunderstorms on the cold side of fronts in China during the period 2017–21. Mon. Weather Rev. 2025, 153, 89–109. [Google Scholar] [CrossRef] [Scilit]
- Luo, X.; Huang, X.; Fei, J.; Wang, J.; Li, C.; Cheng, X. Influence of vortex couplets following cold fronts related to the lateral friction by mountains on elevated thunderstorm initiation. J. Geophys. Res. Atmos. 2025, 130, e2024JD041987. [Google Scholar] [CrossRef] [Scilit]
- Ding, J.; Cheng, B.; Xiao, H.; Bai, T.; Song, C.; Sha, X.; Liu, L.; Zhang, F.; Liu, Y. Microphysical characteristics of precipitation during a cold-season elevated thunderstorm event in Henan, China. Atmos. Res. 2025, 326, 108192. [Google Scholar] [CrossRef] [Scilit]
- Ma, M.; Qin, L. Analysis of the ducted gravity waves generated by elevated convection over complex terrain in China. Atmosphere 2025, 16, 1118. [Google Scholar] [CrossRef] [Scilit]
- Zuo, H.; Chen, Y.; Liu, T.; Zhang, A.; Chen, S.; Li, W. Frontal structure effects on precipitation microphysics in South China rain cells. J. Geophys. Res. Atmos. 2025, 130, e2024JD043270. [Google Scholar] [CrossRef] [Scilit]
- Ma, W.; Huang, W.; Yang, Z.; Wang, B.; Lin, D.; He, X. Dynamic and thermodynamic factors associated with different precipitation regimes over South China during the pre-summer rainy season. Atmosphere 2018, 9, 219. [Google Scholar] [CrossRef] [Scilit]
- Wan, Y.; Wang, D.; Wang, D. Comparison of preconvective environments between warm-sector and frontal heavy rainfall events in South China. Front. Earth Sci. 2025, 13, 1598866. [Google Scholar] [CrossRef] [Scilit]
- Luo, X.; Huang, X.; Fei, J.; Wang, J.; Li, C.; Cheng, X. Role of topography in triggering elevated thunderstorms on the cold side of fronts over southern China. J. Geophys. Res. Atmos. 2023, 128, e2023JD038640. [Google Scholar] [CrossRef] [Scilit]
- Zhang, J.; Luo, Y. Observational analysis of the characteristics of meso-γ-scale vortexes associated with the extreme hourly precipitation in the Pearl River Delta region. J. Meteorol. Res. 2025, 39, 814–832. [Google Scholar] [CrossRef] [Scilit]
- Zeng, Z.; Wang, D. On the local rain-rate extreme associated with a mesovortex over South China. Mon. Weather Rev. 2022, 150, 1269–1290. [Google Scholar] [CrossRef] [Scilit]
- Du, Y.; Chen, G.; Qian, W. Heavy rainfall associated with double low-level jets over southern China. Part I: Ensemble-based analysis. Mon. Weather Rev. 2018, 146, 3827–3846. [Google Scholar] [CrossRef] [Scilit]
- Du, Y.; Chen, G.; Qian, W. Heavy rainfall associated with double low-level jets over southern China. Part II: Convection initiation. Mon. Weather Rev. 2019, 147, 543–565. [Google Scholar] [CrossRef] [Scilit]
- Du, Y.; Chen, G.; Qian, W. Convection initiation and growth at the coast of South China. Part I: Effect of the marine boundary layer jet. Mon. Weather Rev. 2020, 148, 3847–3868. [Google Scholar] [CrossRef] [Scilit]
- Zhang, H.; Zhou, Y.; Lai, Z.; Deng, G. Overshooting convection and torrential precipitation associated with the mesoscale northerly low-level jets in the Sichuan Basin, China. Atmos. Res. 2024, 310, 107604. [Google Scholar] [CrossRef] [Scilit]
- Alpers, W.; Wong, W.K.; Dagestad, K.F.; Chan, P.W. Study of a wind front over the northern South China Sea generated by the freshening of the north-east monsoon. Bound.-Layer Meteorol. 2015, 157, 125–140. [Google Scholar] [CrossRef] [Scilit]
- Rao, X.; Luo, Y.; Meng, Z. Evaluation and error source analysis of convection-permitting forecasts for localized nocturnal rainfall over a complex mountainous region in Pearl River Delta, South China. J. Geophys. Res. Atmos. 2023, 128, e2023JD039065. [Google Scholar] [CrossRef] [Scilit]
- Lyu, Y.; Zhi, X.; Zhu, S.; Fan, Y.; Ji, Y. Subseasonal prediction of weekly precipitation anomalies over southern China during early summer based on predictability analysis and machine learning. Atmos. Res. 2025, 315, 107927. [Google Scholar] [CrossRef] [Scilit]
- Law, H.F.; Lai, K.K.; Chan, P.W.; Chau, H.C. Technical feasibility of forecasting thunderstorm-related microbursts: Case studies. Appl. Sci. 2026, 16, 3579. [Google Scholar] [CrossRef] [Scilit]
- Zhang, G.; Zhang, X.; Yang, Z. Effect of Horizontal Resolution on a Meso-β-Scale Vortex Simulation in an Extreme Rainstorm on 22 May 2020 Over South China: A Contrastive Study Based on Different-Resolution Ensembles. Earth Space Sci. 2024, 11, e2023EA002921. [Google Scholar] [CrossRef] [Scilit]
- Hong Kong Observatory. Squall Lines and “Shi Hu Feng”—What You Want to Know About the Violent Squalls Hitting Hong Kong on 9 May 2005. Available online: https://www.hko.gov.hk/en/education/weather/thunderstorm-and-lightning/00030-squall-lines-and-shi-hu-feng-what-you-want-to-know-about-the-violent-squalls-hitting-hong-kong-on-9-may-2005.html (accessed on 7 March 2026).
- Szeto, K.C.; Chan, P.W. Numerical simulation of a severe squall event in Hong Kong. In Proceedings of the 23rd Conference on Severe Local Storms, St. Louis, MO, USA, 6–10 November 2006; Available online: https://ams.confex.com/ams/23SLS/webprogram/Paper115178.html (accessed on 14 April 2026).
Disclaimer/Publisher’s Note: The statements, opinions and data contained in all publications are solely those of the individual author(s) and contributor(s) and not of MDPI and/or the editor(s). MDPI and/or the editor(s) disclaim responsibility for any injury to people or property resulting from any ideas, methods, instructions or products referred to in the content. |
© 2026 by the authors. Licensee MDPI, Basel, Switzerland. This article is an open access article distributed under the terms and conditions of the Creative Commons Attribution (CC BY) license.