


Abstract
Dust activity is controlled by multiple environmental factors and exhibits substantial spatiotemporal and interannual variability. In spring 2025, China experienced unusually frequent dust storms. Surface meteorological observations and PM10 levels show that dust events in 2025 were the most frequent and intense of the last decade. The dust event analysis indicates a pronounced change in transport pathways, with affected regions extending to Central, Southwest, and South China. This differs markedly from the 2021 and 2023 events, which impacted northern China more broadly. Source attribution indicates that the Gobi Desert was the dominant contributor to downstream dust, accounting for 80.0%, 83.1%, and 78.6% of dust concentrations in North, Southwest, and South China, respectively. In addition, enhanced surface winds over the Gobi Desert were identified as the primary drivers of intensified dust emissions, while concurrent changes in precipitation, soil moisture, and vegetation cover played secondary roles. An anomalous low-pressure system over the Bohai–Yellow Sea facilitated northerly wind anomalies, enabling long-range southward dust transport from the Gobi Desert all the way to southern China. These findings improve our understanding of extreme dust events and emphasize the need to consider both emission strength and transport efficiency in regional air quality assessments.
1. Introduction
Dust storms occur when strong winds mobilize mineral dust from dry, bare soil surfaces into the atmosphere [1,2,3,4,5,6]. East Asia is the world’s second-largest dust source, mainly originating from the Taklimakan Desert (TK) in northwestern China and the Gobi Desert (GB) across southern Mongolia and parts of northern and northeastern China [7,8,9]. East Asian dust can be transported to most parts of China, Korea, Japan, the Pacific Ocean, the Arctic, and even the west coast of the United States, where it degrades air quality, threatens human health and alters regional energy budget [9,10,11,12,13].
Dust activity exhibits complex spatiotemporal patterns, mainly controlled by land surface conditions and meteorological factors. Land surface conditions, including land cover type, vegetation cover type, soil particle size distribution, soil wetness and snow cover, play critical roles in dust emission processes [14,15,16]. Meteorological factors affect dust emission, deposition, and transport processes. Temperature, evaporation, and precipitation indirectly influence dust emissions by altering surface conditions [17,18,19]. Precipitation also affect dust transport through wet deposition [20]. Surface wind speeds are the most sensitive variable influencing dust emissions [2,21,22,23,24,25,26,27]. Despite considerable progress in understanding dust storm evolution and mechanisms over recent decades, knowledge of dust activity driving factors and predictability remains limited due to the complexity of multiple influencing factors [6,21].
East Asia has experienced a decline in dust activity since the 1970s, primarily due to long–term changes in meteorological conditions and land surface characteristics, such as weakened surface winds, increased vegetation cover, and wetter soil conditions [21,28,29]. However, in recent years, multiple extreme dust storms have afflicted East Asia. In the springs of 2021 and 2023, northern China experienced several extreme dust events. The frequent occurrence of Mongolian cyclones, combined with dry, loosely structured soils and unusually sparse vegetation cover, has been identified as the principal cause of these storms [8,17]. A numerical modeling study further indicates that during the spring of 2023, the dominant dust sources for northern China were the GB and TK, contributing approximately 42% and 26% of the total dust concentration, respectively [30].
In spring 2025, China experienced 14 dust activity episodes, the highest number recorded in the past decade, affecting approximately 5.8 × 10⁶ km2 area and 1.09 billion people. A severe dust storm that occurred from April 10 to 14 reached as far south as Hainan Island, marking the southernmost dust event in China since 2000 [31]. To date, few studies have investigated dust activity in China during spring 2025 [31,32]. Critical gaps remain in understanding the underlying causes, including the land surface and meteorological anomalies driving the unusually frequent events, the dynamical processes facilitating southward transport, and the extent to which the affected areas differed from those in previous years.
This study uses multiple datasets, including reanalysis data, satellite observations, and ground-based measurements to analyze the mechanisms of dust accumulation in China during spring 2025. This study uses dust event records and PM10 concentration data to characterize the spatiotemporal variations in dust activity and investigates the key factors influencing dust storm formation, such as surface wind speed, and vegetation cover. Additionally, this study quantifies the contributions of GB and TK to dust concentrations in China with numerical simulation experiments. The remainder of this paper is organized as follows: the model, data and methodology are presented in Section 2; the spatiotemporal variations in dust activity, the meteorological anomalies affecting dust activity and contributions from different deserts are listed in Section 3; discussion and conclusions are summarized in Section 4 and Section 5, respectively.
2. Materials and Methods
2.1. Dust Emission and Transport Models
In this study, FLEXPART (FLEXible PARTicle dispersion model) and FLEXDUST are used to quantify major Asian dust sources in China. FLEXPART version 10.4 is a Lagrangian particle dispersion model originally developed to simulate the long-range and mesoscale transport of hazardous materials released from point sources, such as nuclear power plant accidents. It has since been widely applied to a broad range of atmospheric tracers, including greenhouse gases, dust, black carbon, and volcanic ash [33,34,35,36,37]. FLEXDUST is a stand-alone dust emission model that generates mineral dust release files specifying the location and number of emitted particles at each time step, which can be directly read by FLEXPART as an input [36,38]. FLEXDUST provides the key emission step by converting meteorological forcing and surface susceptibility into gridded dust source fluxes, which largely control the magnitude and spatiotemporal pattern of simulated dust loading during extreme events. To simulate dust emission, deposition, and transport using FLEXDUST and FLEXPART, ERA5 meteorological fields with 137 vertical levels are retrieved and preprocessed using the Flex_extract software package (version 7.0.4) [39]. The data has a temporal resolution of 3 h and a horizontal resolution of 30 km.
The simulations span the period from 21 March to 17 April 2025 and are conducted with a 1 h time step. Simulation outputs before 1 April are used only to spin-up chemical initial conditions and are excluded from the analyses in Section 3. The model domain encompasses the major dust source regions of East Asia, extending from 40° E to 150° E and 18° N to 62° N. FLEXDUST and FLEXPART are running at a horizontal resolution of 0.1° × 0.1° and 25 vertical levels covering from 0.1 to 18 km. A maximum atmospheric dust lifetime of 20 days is prescribed. This choice is motivated by the fact that dust usually resides in the atmosphere for ~1 week, whereas a small fraction of fine particles may persist for 2–3 weeks [12,40,41], and it also prevents unrealistically long-lived dust that would otherwise not be removed by deposition in the model. FLEXPART is run in forward mode in this study. The option accounting for the effect of sub-grid-scale orographic variability on the planetary boundary-layer height is turned on, and convection parameterization is enabled [36,42].
In FLEXDUST, the two original dust emission schemes, Marticorena and Bergametti (1995, hereinafter MB95 [26]) and Kok et al. (2014, hereinafter KOK14 [27]), tend to underestimate dust concentrations over East Asia [42,43]. To improve the model’s performance in this region, we implement the GOCART dust emission scheme into FLEXDUST. The formula of vertical dust flux in GOCART is approximated as follows [2,44]:
where is the vertical dust flux at the surface; is an empirical proportionality constant, is the soil erodibility, with a value range of 0–1 (Supplementary Figure S1). represents no dust emission potential, and larger indicates higher erodibility, with being the maximum value permitted by the prescribed range. is the horizontal wind speed at 10 m, and is the threshold velocity below which the dust emission does not occur. is set to 6.5 m/s following Ginoux et al. [2], Chen et al. [44], Wang et al. [43]. The GOCART scheme produced a mean PM10 bias of −14.5 μg m−3, which was substantially smaller than the biases from the KOK14 (−65.8 μg m−3) and MB95 (−158.0 μg m−3) schemes (Supplementary Figure S2). The GOCART scheme also most accurately represents the spatial distribution of aerosol optical depth, whereas the KOK14 and MB95 substantially underestimate it (Supplementary Figure S3).
2.2. PM10 Observations
The China’s National Environmental Monitoring Center (CNEMC) has continuously monitored surface air pollutants (PM2.5, PM10, SO2, NO2) since 2012 [45]. Hourly real-time observations from more than 1000 monitoring stations are publicly available. Hourly surface observed PM10 is employed to assess interannual variations in dust-affected areas and evaluate model performance with different dust emission schemes (Table 1).
Table 1.
Datasets used in this work.
2.3. MODIS AOD
Daily mean aerosol optical depth (AOD) from the Moderate Resolution Imaging Spectroradiometer (MODIS) is used to compare with our simulated AOD from FELXDUST/FLEXPART [46]. In this study, Level 2 daily AOD data at 550 nm from the MODIS sensors aboard the Terra (MOD04_L2) and Aqua (MYD04_L2) satellites are used. Following the approach described by Gui et al. [8], AOD data from both satellites are interpolated onto a 0.1° × 0.1° grid and subsequently averaged to produce a combined daily AOD product.
2.4. ERA5 Reanalysis Dataset
This study employs the ERA5 reanalysis dataset by the European Centre for Medium-Range Weather Forecasts (ECMWF) [47]. ERA5 provides global atmospheric data four times daily at 0000, 0600, 1200, and 1800 UTC. We use air temperature, geopotential height, and horizontal winds at 500, 700, and 850 hPa, along with 10 m horizontal winds, sea level pressure, precipitation and soil moisture, all at a spatial resolution of 0.25° × 0.25° and an hourly temporal resolution. To investigate the climatic anomalies in 2025, we further use springtime monthly mean fields for the period 2005–2025, provided at a spatial resolution of 2° × 2°. These data include air temperature, geopotential height, and horizontal winds at 300, 500, and 850 hPa.
2.5. Leaf Area Index
The leaf area index (LAI), a crucial biophysical variable, represents the one-sided green leaf area per unit ground surface area. We use the Visible Infrared Imaging Radiometer Suite (VIIRS) LAI product to examine vegetation cover changes over the dust source regions of East Asia. The VIIRS LAI is generated by VIIRS instruments onboard the Suomi-NPP, NOAA-20, and NOAA-21 satellites [48]. The dataset has a spatial resolution of 0.05° × 0.05° and a temporal resolution of 1 day, covering the period from 2005 to the spring of 2025.
2.6. Dust Event Records
Dust weather observations from the Integrated Surface Database (ISD), provided by the National Oceanic and Atmospheric Administration [49], are used to evaluate the spatiotemporal variations in dust activity in China and Mongolia. The ISD is a global database comprising hourly and synoptic surface observations compiled from multiple sources into a single common ASCII format. It provides a wide range of parameters, including wind speed and direction, temperature, present weather, visibility and various other station-based measurements.
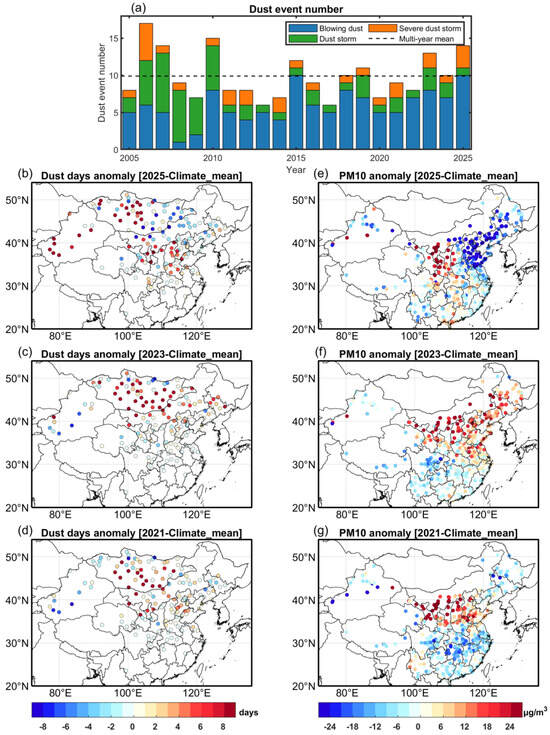
Present weather observations from manned stations (denoted as ww by the World Meteorological Organization, WMO) follow Code Table 4677, which classifies visually observed weather phenomena during the reporting period (typically the preceding hour). Dust weather observations are represented by 11 numeric codes (ww = 06–09, 30–35, 98; see Supplementary Table S1), describing near-surface dust conditions of varying intensity (slight, moderate, or heavy). A dust day is defined as a day on which at least one dust weather observation was reported. Following this definition, the number of dust days at multiple East Asian stations during spring is calculated for different years (Figure 1b–d).
Figure 1.
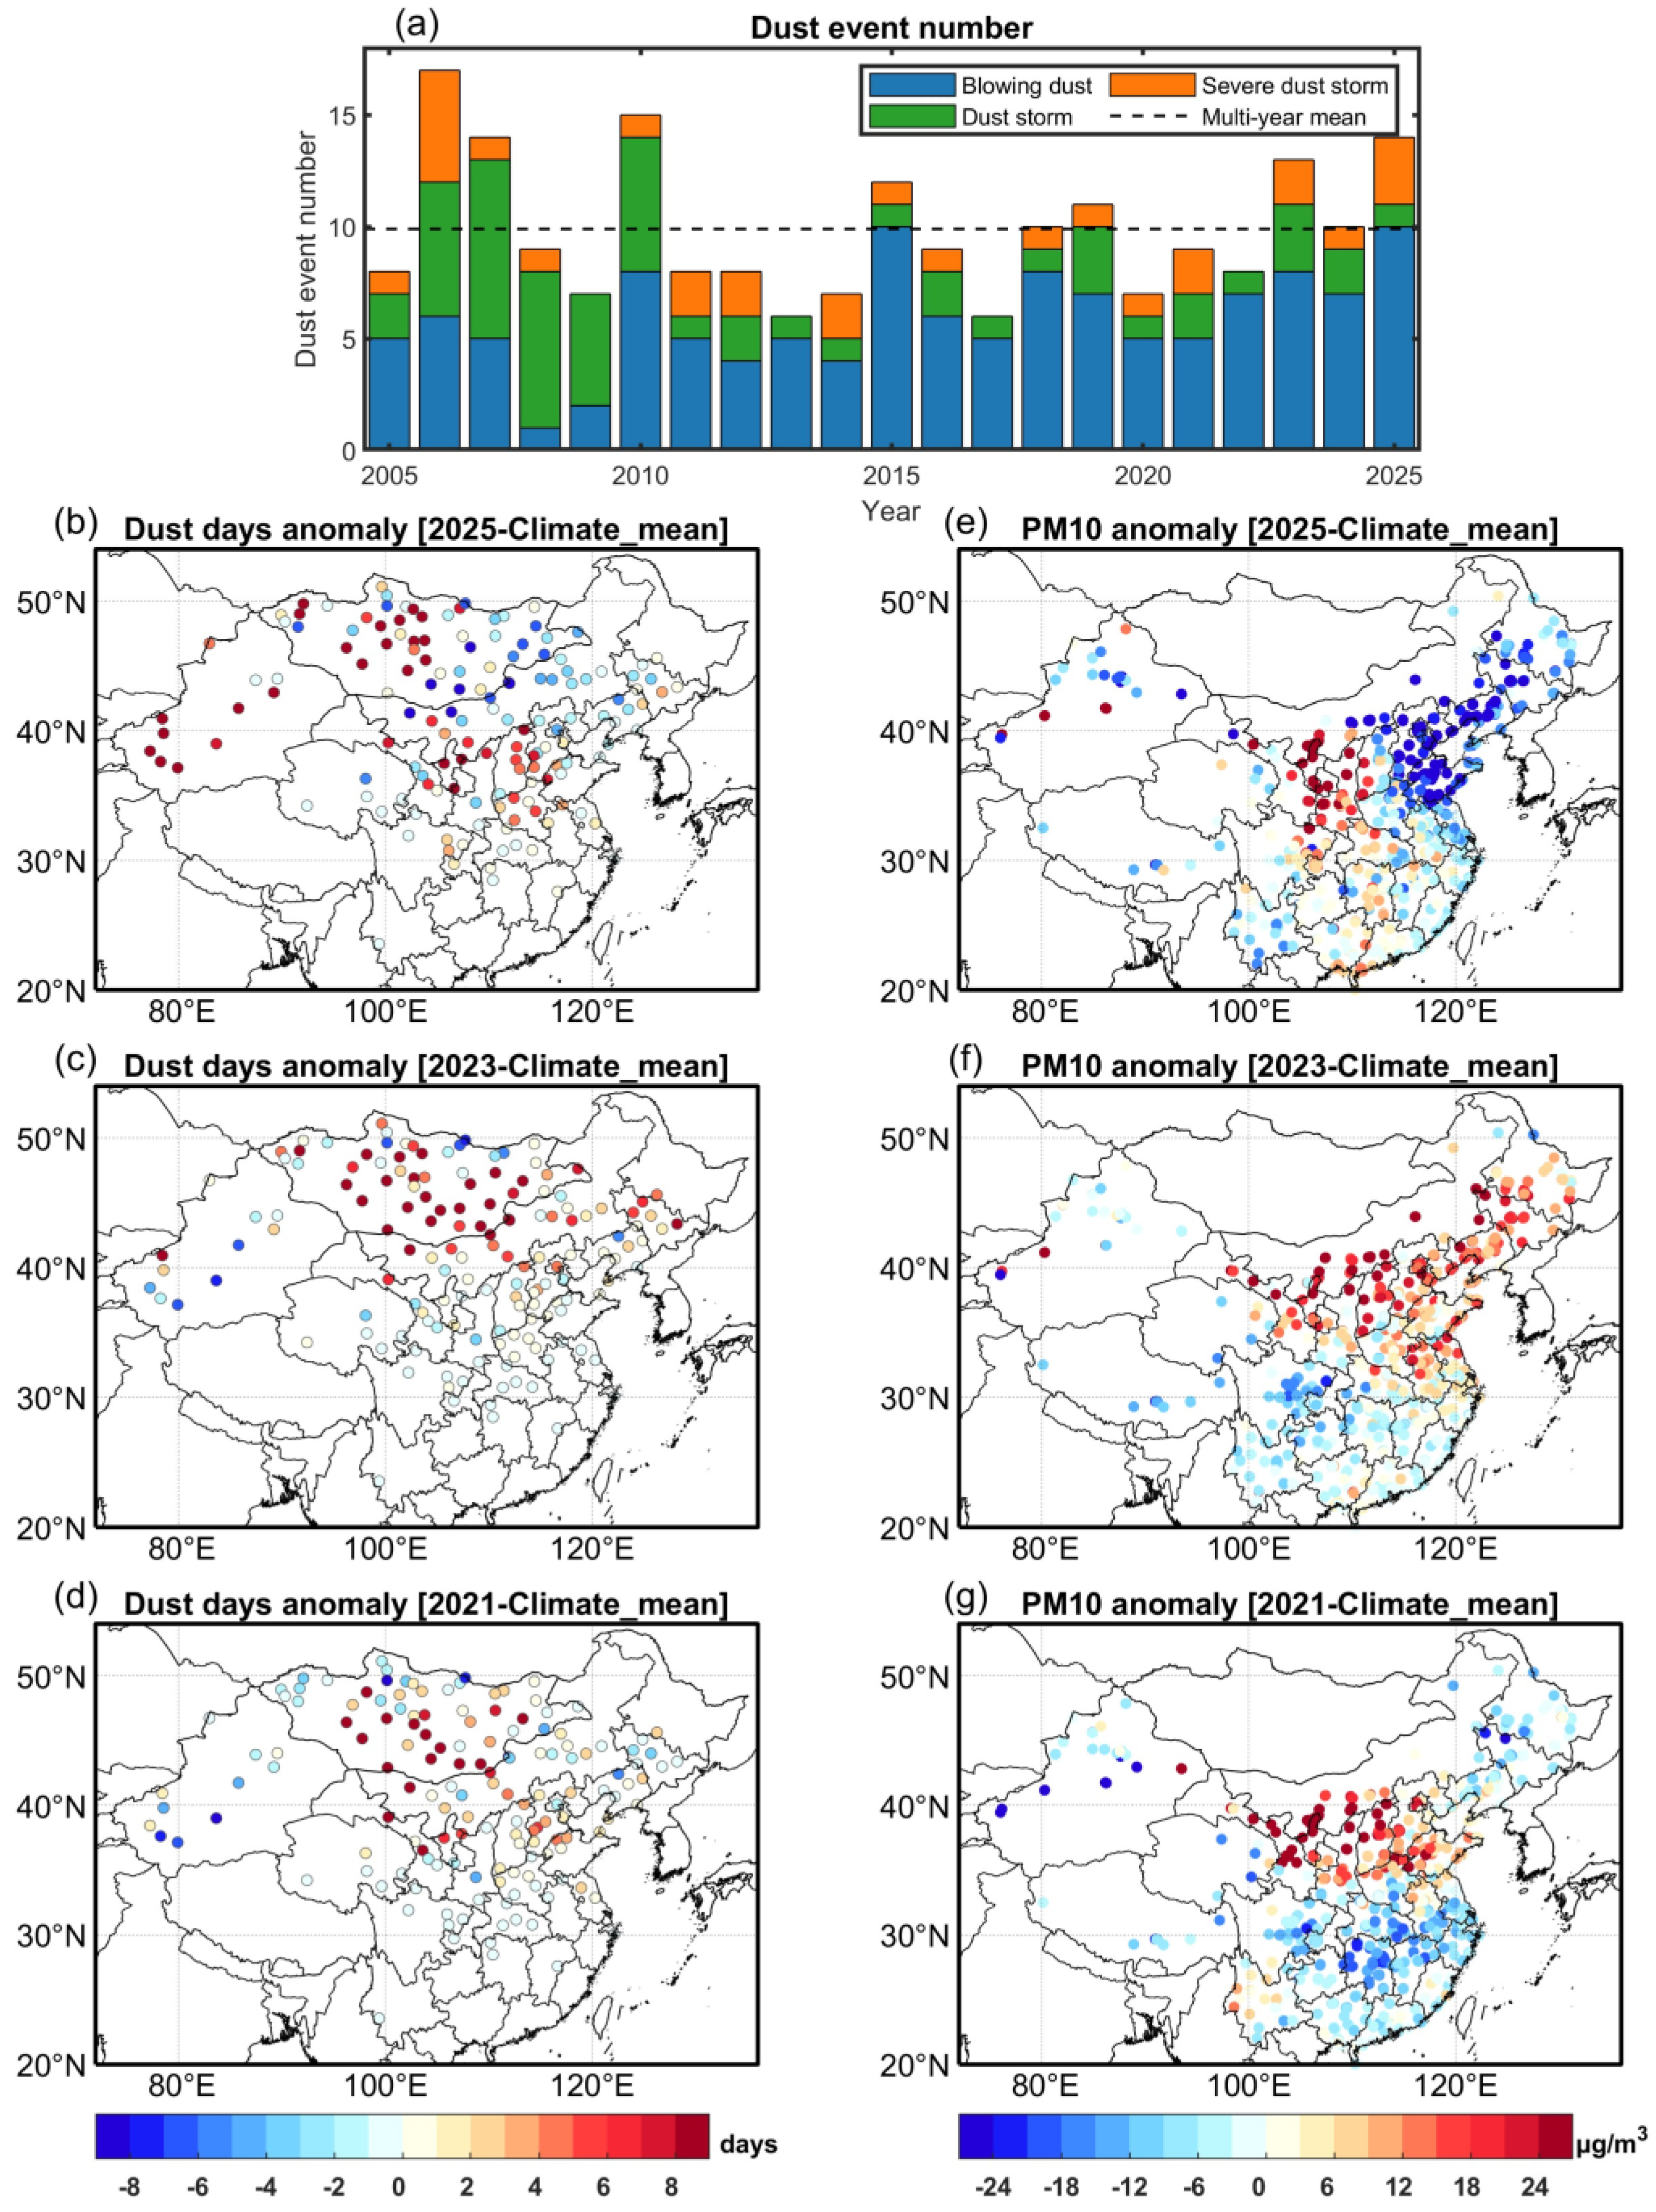
Dust events and their anomalies over China in Spring. (a) Temporal variation in the number of spring (March–May, MAM) dust events over China. Bar colors indicate dust events of different intensities, and the dashed line represents the climatological mean number of dust events. Panels (b–d) show the spatial distributions of dust day anomalies relative to the climatological mean for 2025, 2023, and 2021, respectively. The climatological mean of dust days is calculated over 2005–2024. Panels (e–g) show the spatial distributions of PM10 anomalies relative to the climatological mean for 2025, 2023, and 2021, respectively. The climatological mean of PM10 is calculated over the period 2015–2024.
Dust event records are collected from the Sand-dust Weather Almanac and Meteorological Bulletin of Atmospheric Environment compiled by the China Meteorological Administration. A dust event is defined as occurring when at least five nearby national meteorological stations in China record the same or stronger dust weather phenomenon. For instance, a Blowing Dust Event is identified when five or more stations experience Blowing Dust or stronger dust weather phenomena, such as a Dust Storm or Severe Dust Storm.
3. Results
3.1. Increased Dust Events and Southward Transport in China During 2025
During the spring of 2025, 14 dust events were recorded across China, making the highest frequency in the past decade and about 40% above the climatological mean (Figure 1a). Three dust events were classified as severe dust storms, ranking 2025 as the second most active year for such events in the past two decades.
The spatial distributions of dust-day and PM10 anomalies (Figure 1b,e) reveal pronounced positive anomalies across northwestern and northern China. The number of dust days increased markedly over the arid and semi-arid regions of northwestern China, extending southeastward into northern and southwestern China. Positive PM10 anomalies were observed across most of western and central China, while negative anomalies occurred in parts of northeastern and eastern China, indicating a clear west–east contrast in dust loading.
In contrast to the significant southward expansion of dust storm in 2025, the dust impact in the other years exhibit either spatial homogeneity or a south–north anomalous pattern. For example, both the years of 2023 and 2021 also experienced frequent dust activity [8,17,50], exhibiting broadly similar spatial patterns: reduced dust occurrence in TK but enhanced dust activity over the GB and North China Plain (Figure 1c,d). High PM10 anomalies were observed across northern China, while negative anomalies occurred south of the Yangtze River (Figure 1f,g).
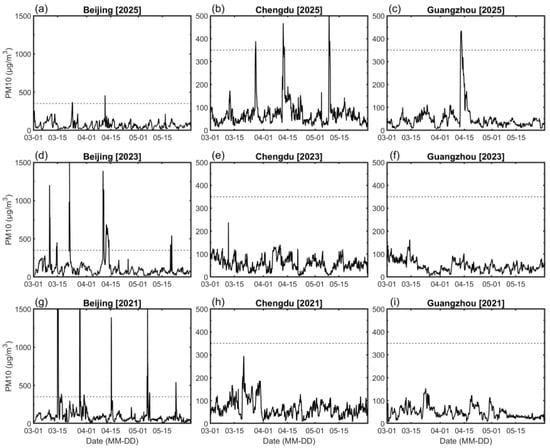
Hourly PM10 variations in Beijing (North China), Chengdu (Southwest China), and Guangzhou (South China) are shown to represent key receptor regions along the major transport pathways and to further illustrate the regional differences in dust impacts. (Figure 2). In Beijing, only two dust events in 2025 exceeded heavy pollution threshold of 350 μg m−3 [51], with a maximum PM10 of 500 μg m−3 (Figure 2a). In contrast, multiple events in 2023 and 2021 produced peaks above 1500 μg m−3 (Figure 2d,g). Chengdu typically experiences few dust events due to its complex surrounding mountains and humidity [52,53]. PM10 remained below 300 μg m−3 in 2023 and 2021 (Figure 2e,h), but exceeded 500 μg m−3 during several dust events in 2025 (Figure 2b). Remarkably even in the southern tip of China, Guangzhou still recorded a peak PM10 exceeding 400 μg m−3 during the 10–14 April 2025 extreme dust storm (Figure 2c), confirming an unprecedented southward intrusion of dust.
Figure 2.
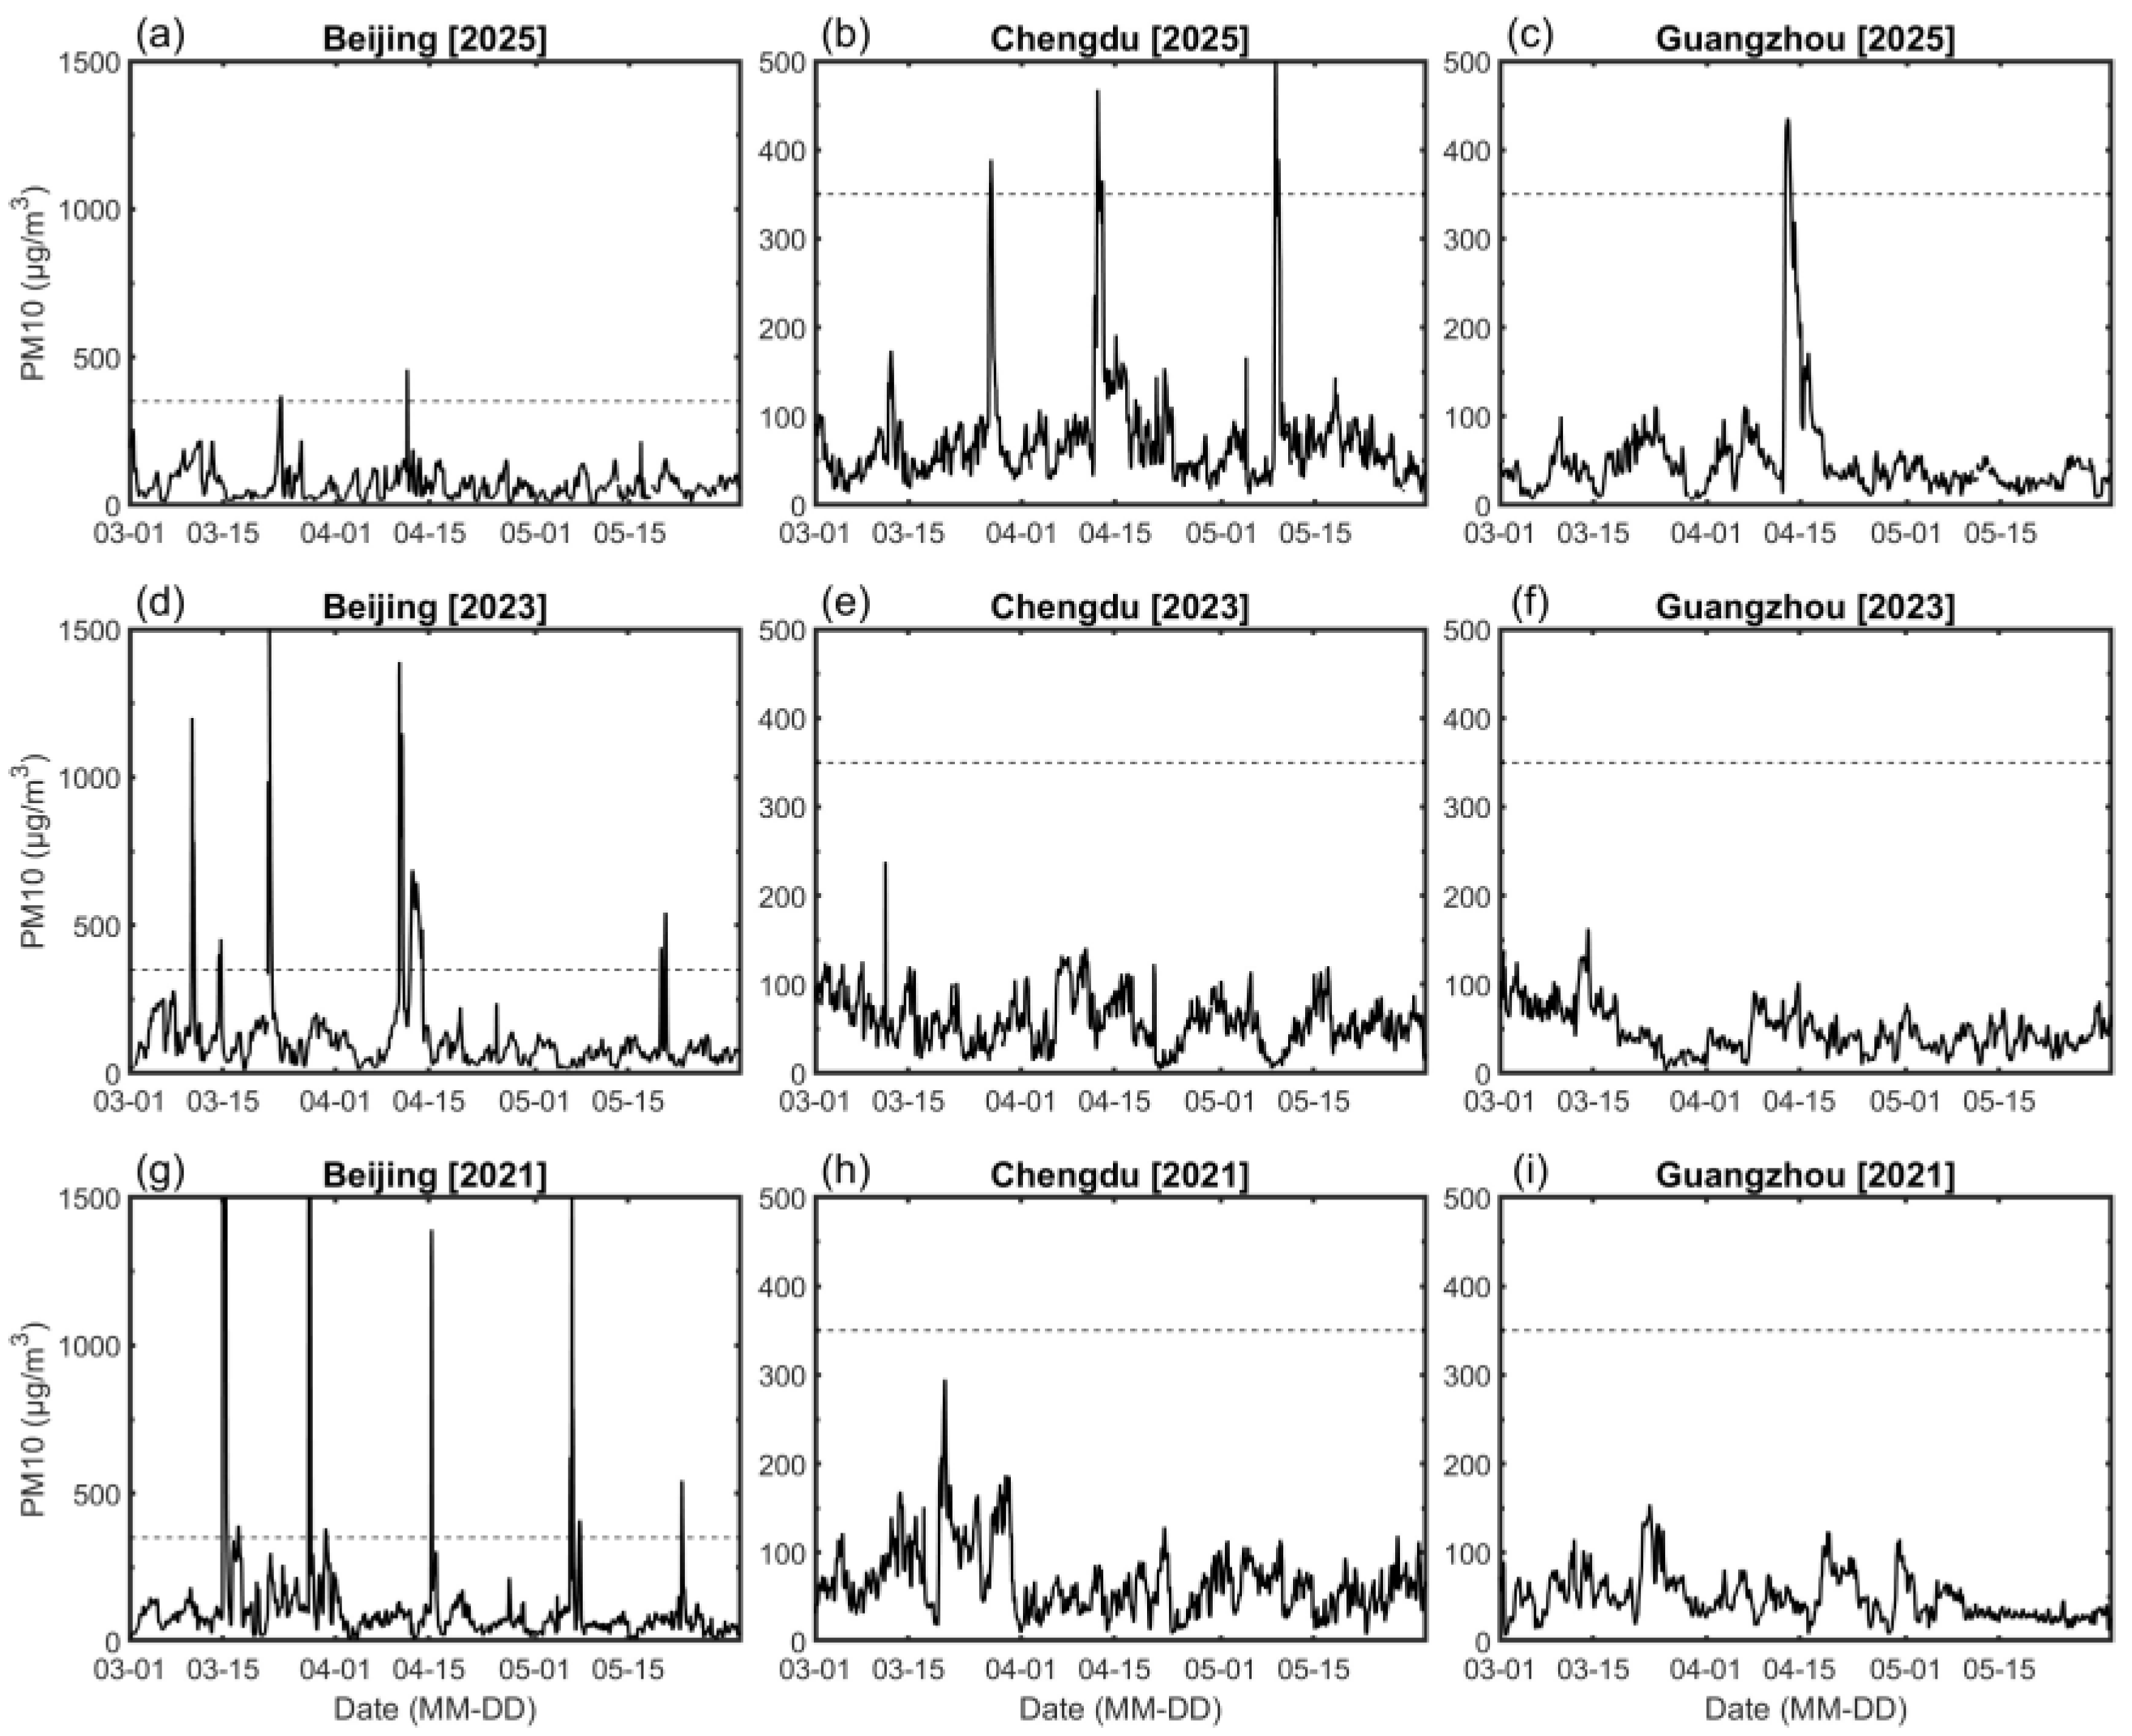
Hourly variations in PM10 in different cities. Panels (a–c) show the results for Beijing, Chengdu, and Guangzhou in 2025. Panels (d–f) and (g–i) are the same as (a–c), but for 2023 and 2021, respectively. The dashed line denotes 350 μg m−3, according to the Technical Regulation on Ambient Air Quality Index [51].
It should be noted that dust-day anomalies are derived from manual weather observations at WMO stations, whereas PM10 anomalies are based on measurements from CNEMC stations. Although the two observation networks differ in spatial coverage, they exhibit consistent regional variability, lending confidence to the interpretation of anomalous dust activity in 2025.
Overall, compared with 2023 and 2021, dust events in 2025 were more frequent, and exhibited farther southward transport. A dust event primarily involves dust emission and transport processes that are strongly controlled by meteorological conditions [22,44,54]. The following sections analyze the anomalies of meteorological factors to interpret the exceptional dust conditions in 2025.
3.2. Strong Near–Surface Winds Lead to Enhanced Dust Emission
Dust emission is the process of dust particles being lifted from the Earth’s surface by wind stress once the threshold velocity is exceeded. Dust emission can be characterized by aeolian erosivity (the wind’s capacity to cause erosion) and soil erodibility (the susceptibility of the soil to wind erosion) [55]. Soil erodibility is governed by multiple factors, including soil type, soil moisture, precipitation, and vegetation cover [14]. At present, the relative contributions of these factors to soil erodibility cannot be quantitatively distinguished through statistical analysis. A fixed soil erodibility is therefore assumed to evaluate the interannual variability of potential dust emissions based on Equation (1) (Supplementary Figure S1).
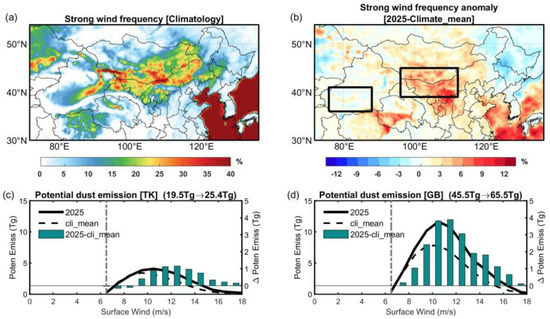
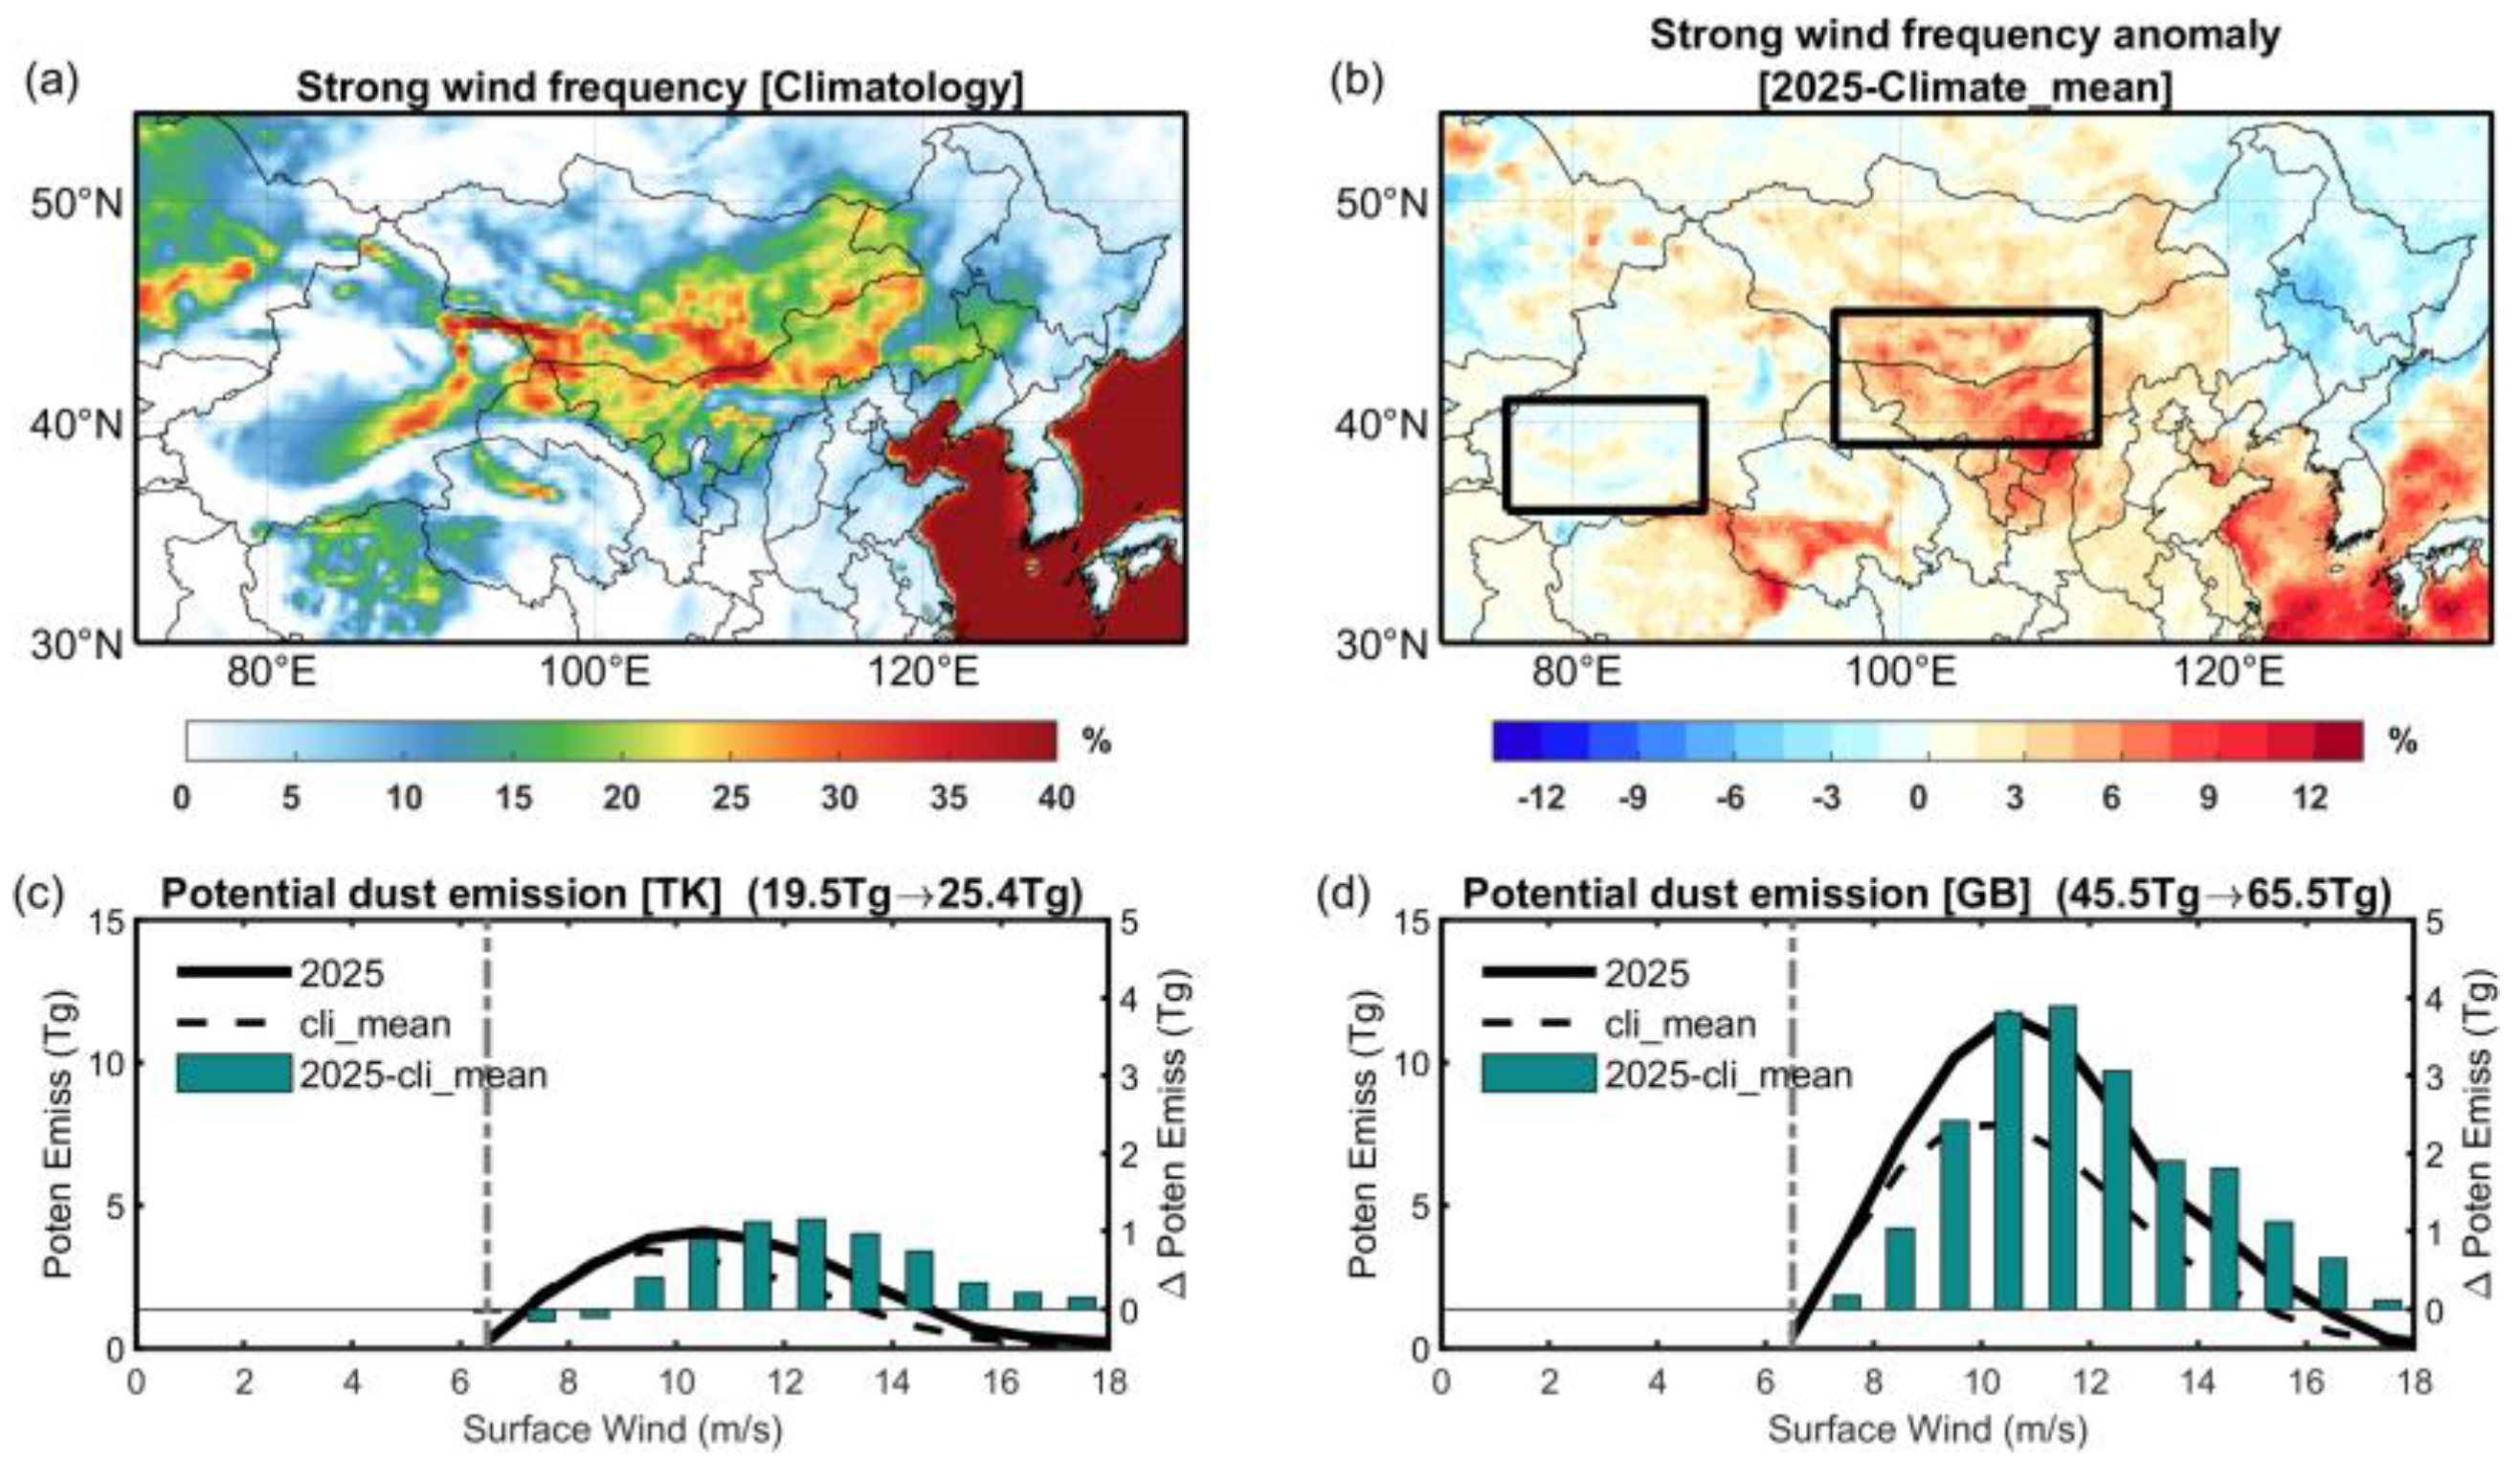
Figure 3 shows the anomalous spring strong surface wind (exceeding 6.5 m s−1) frequency (%) and potential dust emissions in 2025, in stark contrast to the 20-year climatological mean. Strong surface winds are primarily distributed over northwestern China, particularly in Xinjiang, and across the Mongolian Plateau along the China–Mongolia border, corresponding to the two major dust source regions—GB and TK (Figure 3a) [7,9]. In 2025, the frequency of strong winds increased markedly over GB, whereas TK exhibited a heterogeneous pattern, with both increases and decreases observed in different areas (Figure 3b). Relative to the climatological mean, potential dust emissions increased by 30.3% over TK (25.4/19.5) and by 44.0% over GB (65.5/45.5) (Figure 3c,d). The enhanced surface winds facilitated the entrainment of more dust particles into the atmosphere. It is noteworthy that although dust emission flux scales with the cube of wind speed according Equation (1), the contribution from extreme winds (>15 m/s) remains limited due to their low occurrence frequency.
Figure 3.
Comparison of wind and potential dust emission between 2025 and the climatological mean. Spatial distributions of the frequency (%) of strong surface winds (exceeding 6.5 m s−1) during spring (March–May, MAM) for the period 2005–2024 (a) and the corresponding anomalies in 2025 (b). The solid lines in (b) denote the Taklimakan Desert (TK) and the Gobi Desert (GB), respectively. (c) Potential dust emission over the Taklimakan Desert corresponding to different wind speeds for 2025 (solid black line) and the climatological mean (dashed black line), along with their differences in 2025 relative to the climatological mean (bars). (d) Same as (c), but for the Gobi Desert.
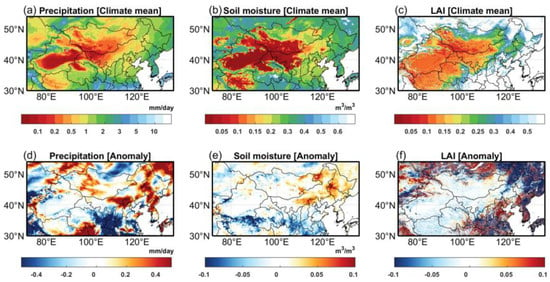
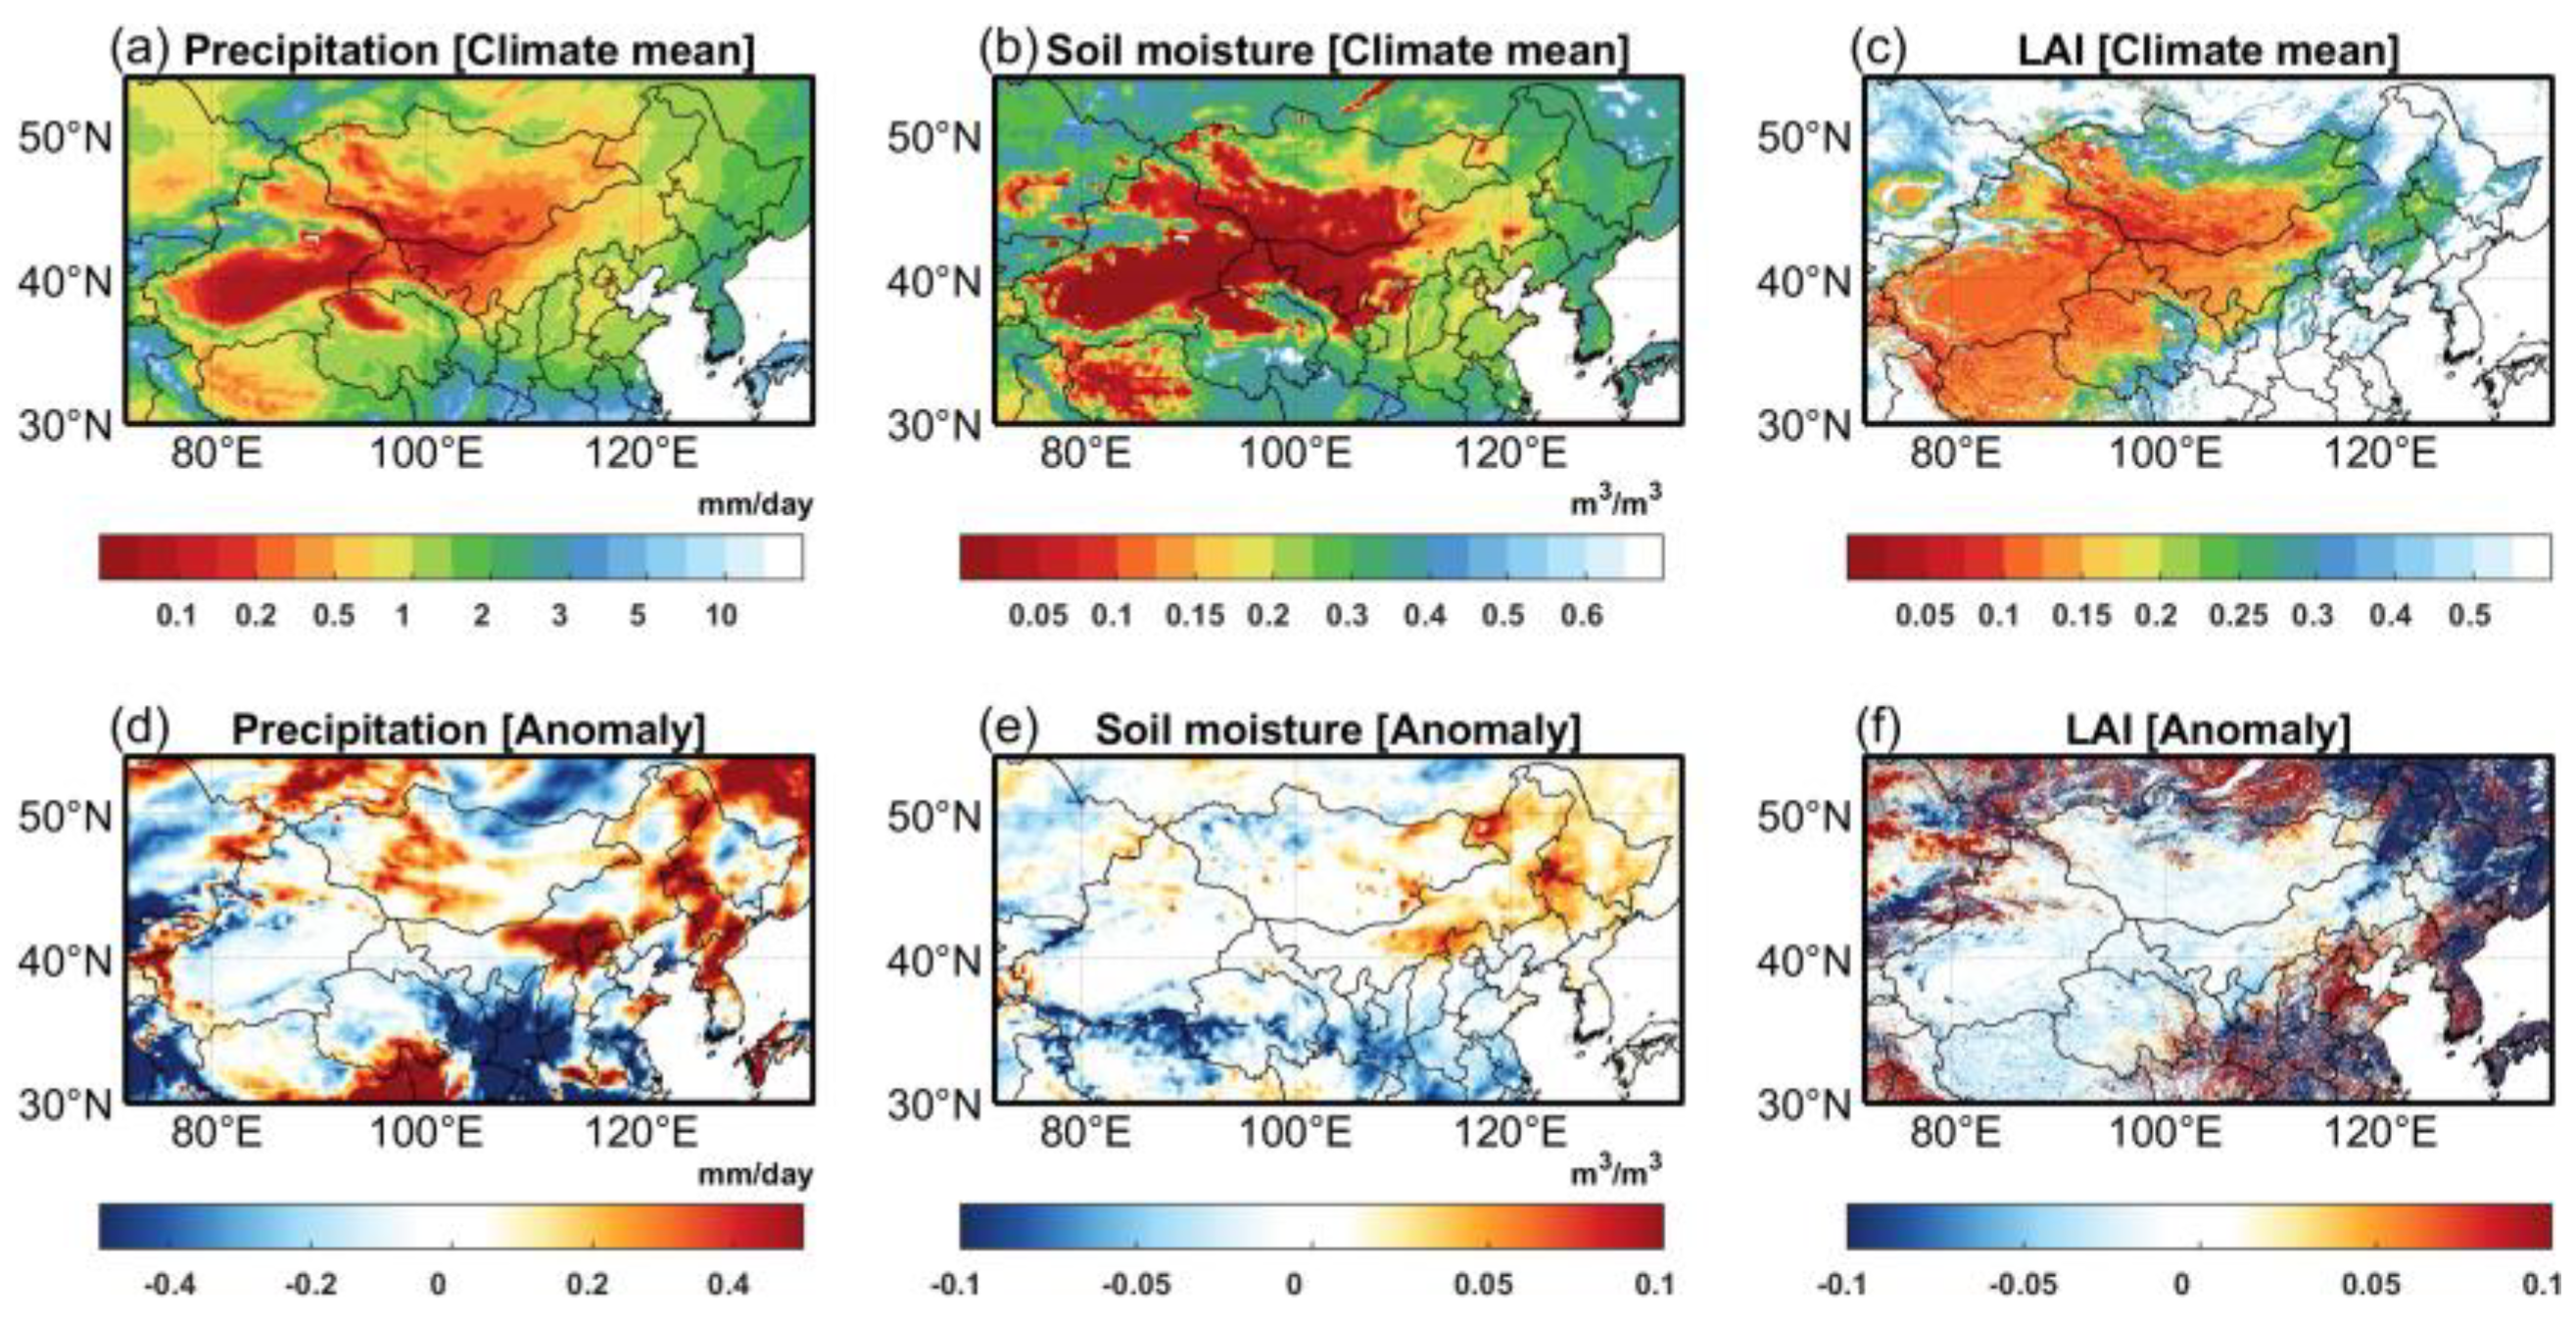
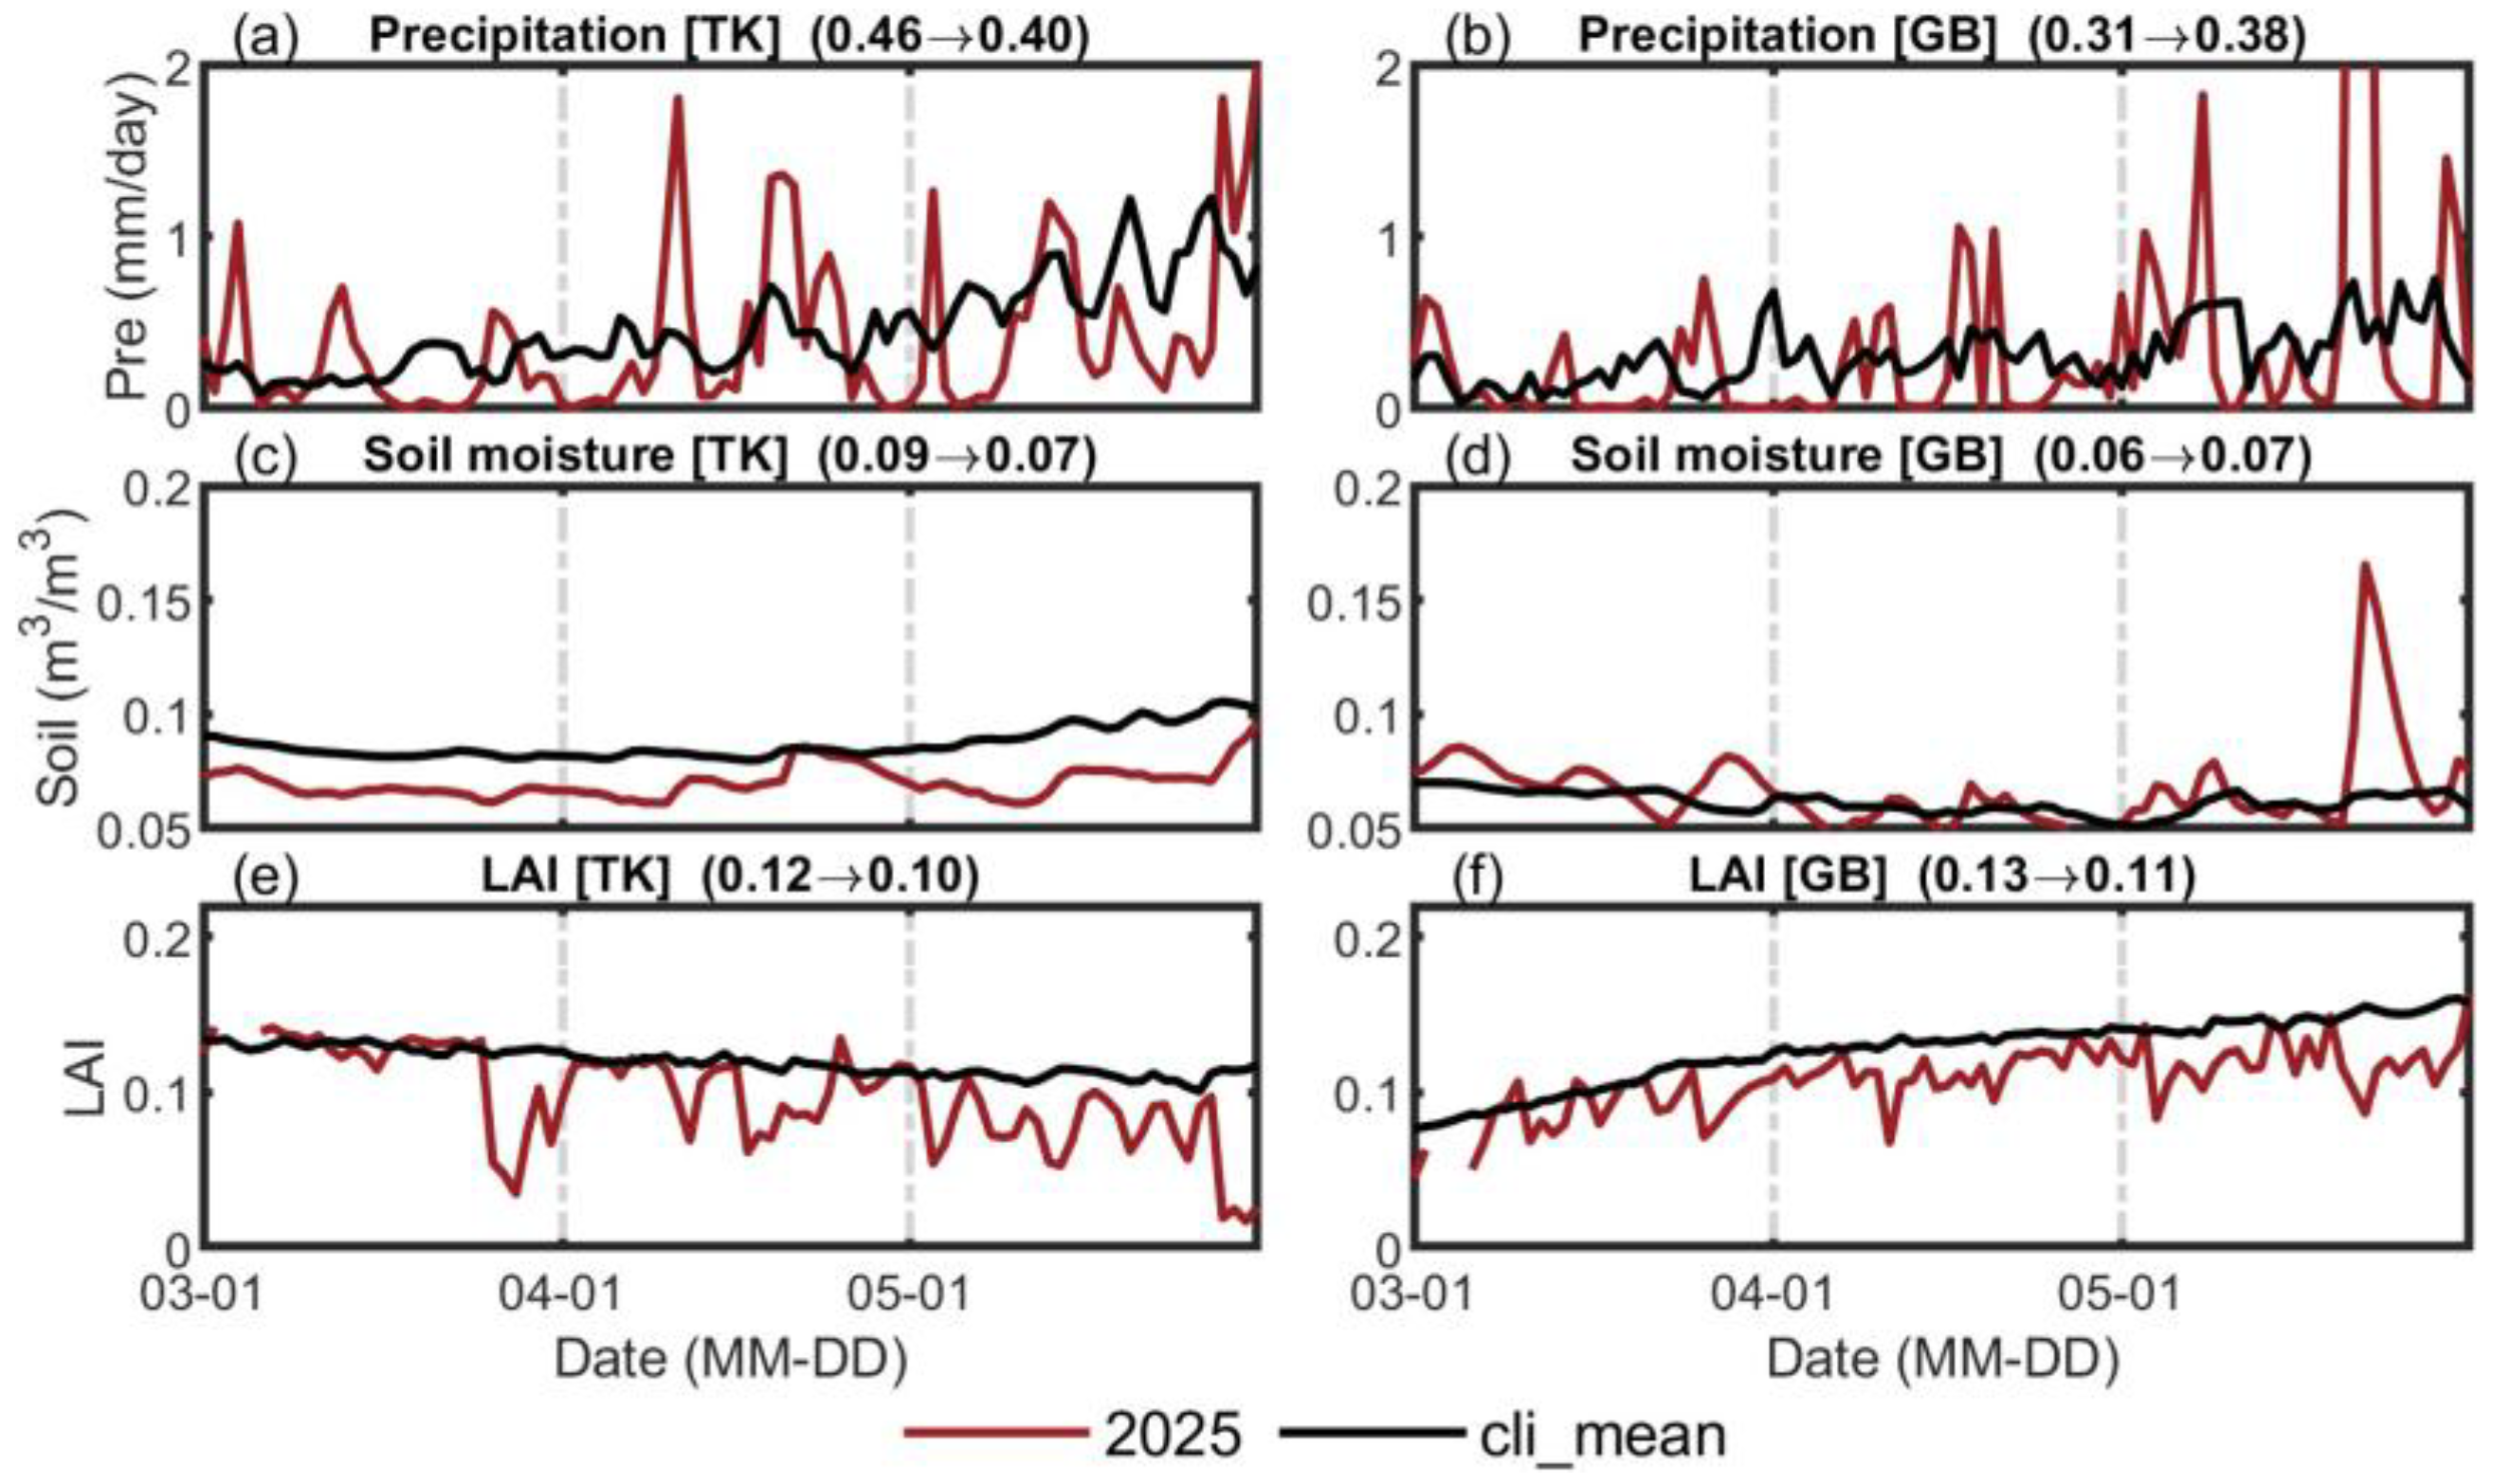
Precipitation, soil moisture, and vegetation cover regulate dust emissions primarily by modulating soil erodibility. Precipitation directly suppresses dust emission, whereas higher soil moisture and vegetation cover decrease soil erodibility and thus reduce the potential for dust emission. The TK and GB are in the arid and semi-arid regions of northwestern China and along the China–Mongolia border, where springtime precipitation is scarce and both soil moisture and LAI remain extremely low, providing abundant dust storm sources (Figure 4a–c).
Figure 4.
Comparison of land surface factors between the climatological mean and their anomalies. Spatial distributions of the climatological mean precipitation (a), soil moisture (b), and leaf area index (LAI) (c) during spring (March–May, MAM) for the period 2005–2024, and the corresponding anomalies of precipitation (d), soil moisture (e), and LAI (f) during spring (MAM) of 2025.
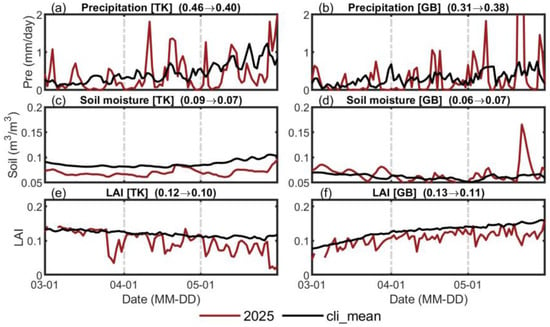
Compared with the climatological mean, precipitation over the TK decreased by 13.0% (0.40/0.46) in 2025, with negative anomalies mainly distributed along the northwestern and southeastern margins (Figure 4d and Figure 5a). Soil moisture decreased by 22.2% (0.07/0.09) (Figure 4e and Figure 5c), and LAI decreased by 16.7% (0.10/0.12), both remaining lower than their climatological means during spring (Figure 4f and Figure 5e). In contrast, precipitation over the GB increased by 22.6% (0.38/0.31) in 2025, mainly over its northern and eastern parts (Figure 4d and Figure 5b). Soil moisture increased by 16.7% (0.07/0.06) (Figure 4e and Figure 5d), whereas LAI decreased by 15.4% (0.11/0.13) (Figure 4f and Figure 5f).
Figure 5.
Time series of area-averaged land surface factors over two desert regions. Panels (a,c,e) show precipitation, soil moisture, and leaf area index (LAI) over the Taklimakan Desert (TK), respectively. The first number in each title denotes the climatological mean, and the second represents the 2025 average. Panels (b,d,f) are the same as (a,c,e), but for the Gobi Desert (GB).
For the TK, concurrent reductions in precipitation, soil moisture, and vegetation cover collectively decreased soil erodibility, resulting in intensified dust emissions. For the GB, although increased precipitation generally increases soil erodibility, the simultaneous decline in vegetation cover may offset this mitigating effect. According to Tai et al. [22], surface wind speed accounts for approximately 40–55% of the interannual variability in dust emissions over TK hotspots, whereas it explains up to about 70% of the variability over the GB. Precipitation contributes about 10–20% to dust-emission variability in both regions. Considering the relative and absolute changes in surface wind speed, precipitation, soil moisture, and vegetation cover over GB and TK, the enhanced surface winds were the primary driver of the elevated dust activity in 2025.
3.3. Southward Dust Transport Driven by an Anomalous Low-Pressure System over Bohai–Yellow Sea
In the previous section, we examined the impact of meteorological anomalies in desert on dust emission. This section focuses on the influence of atmospheric circulation anomalies on dust transport. Atmospheric circulation plays a crucial role in controlling wind direction and intensity, thereby determining dust transport pathways and influencing the spatial extent and duration of dust events.
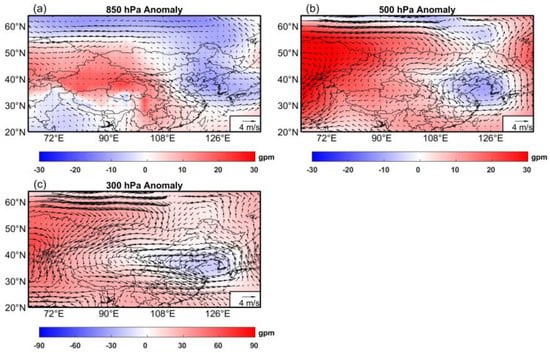
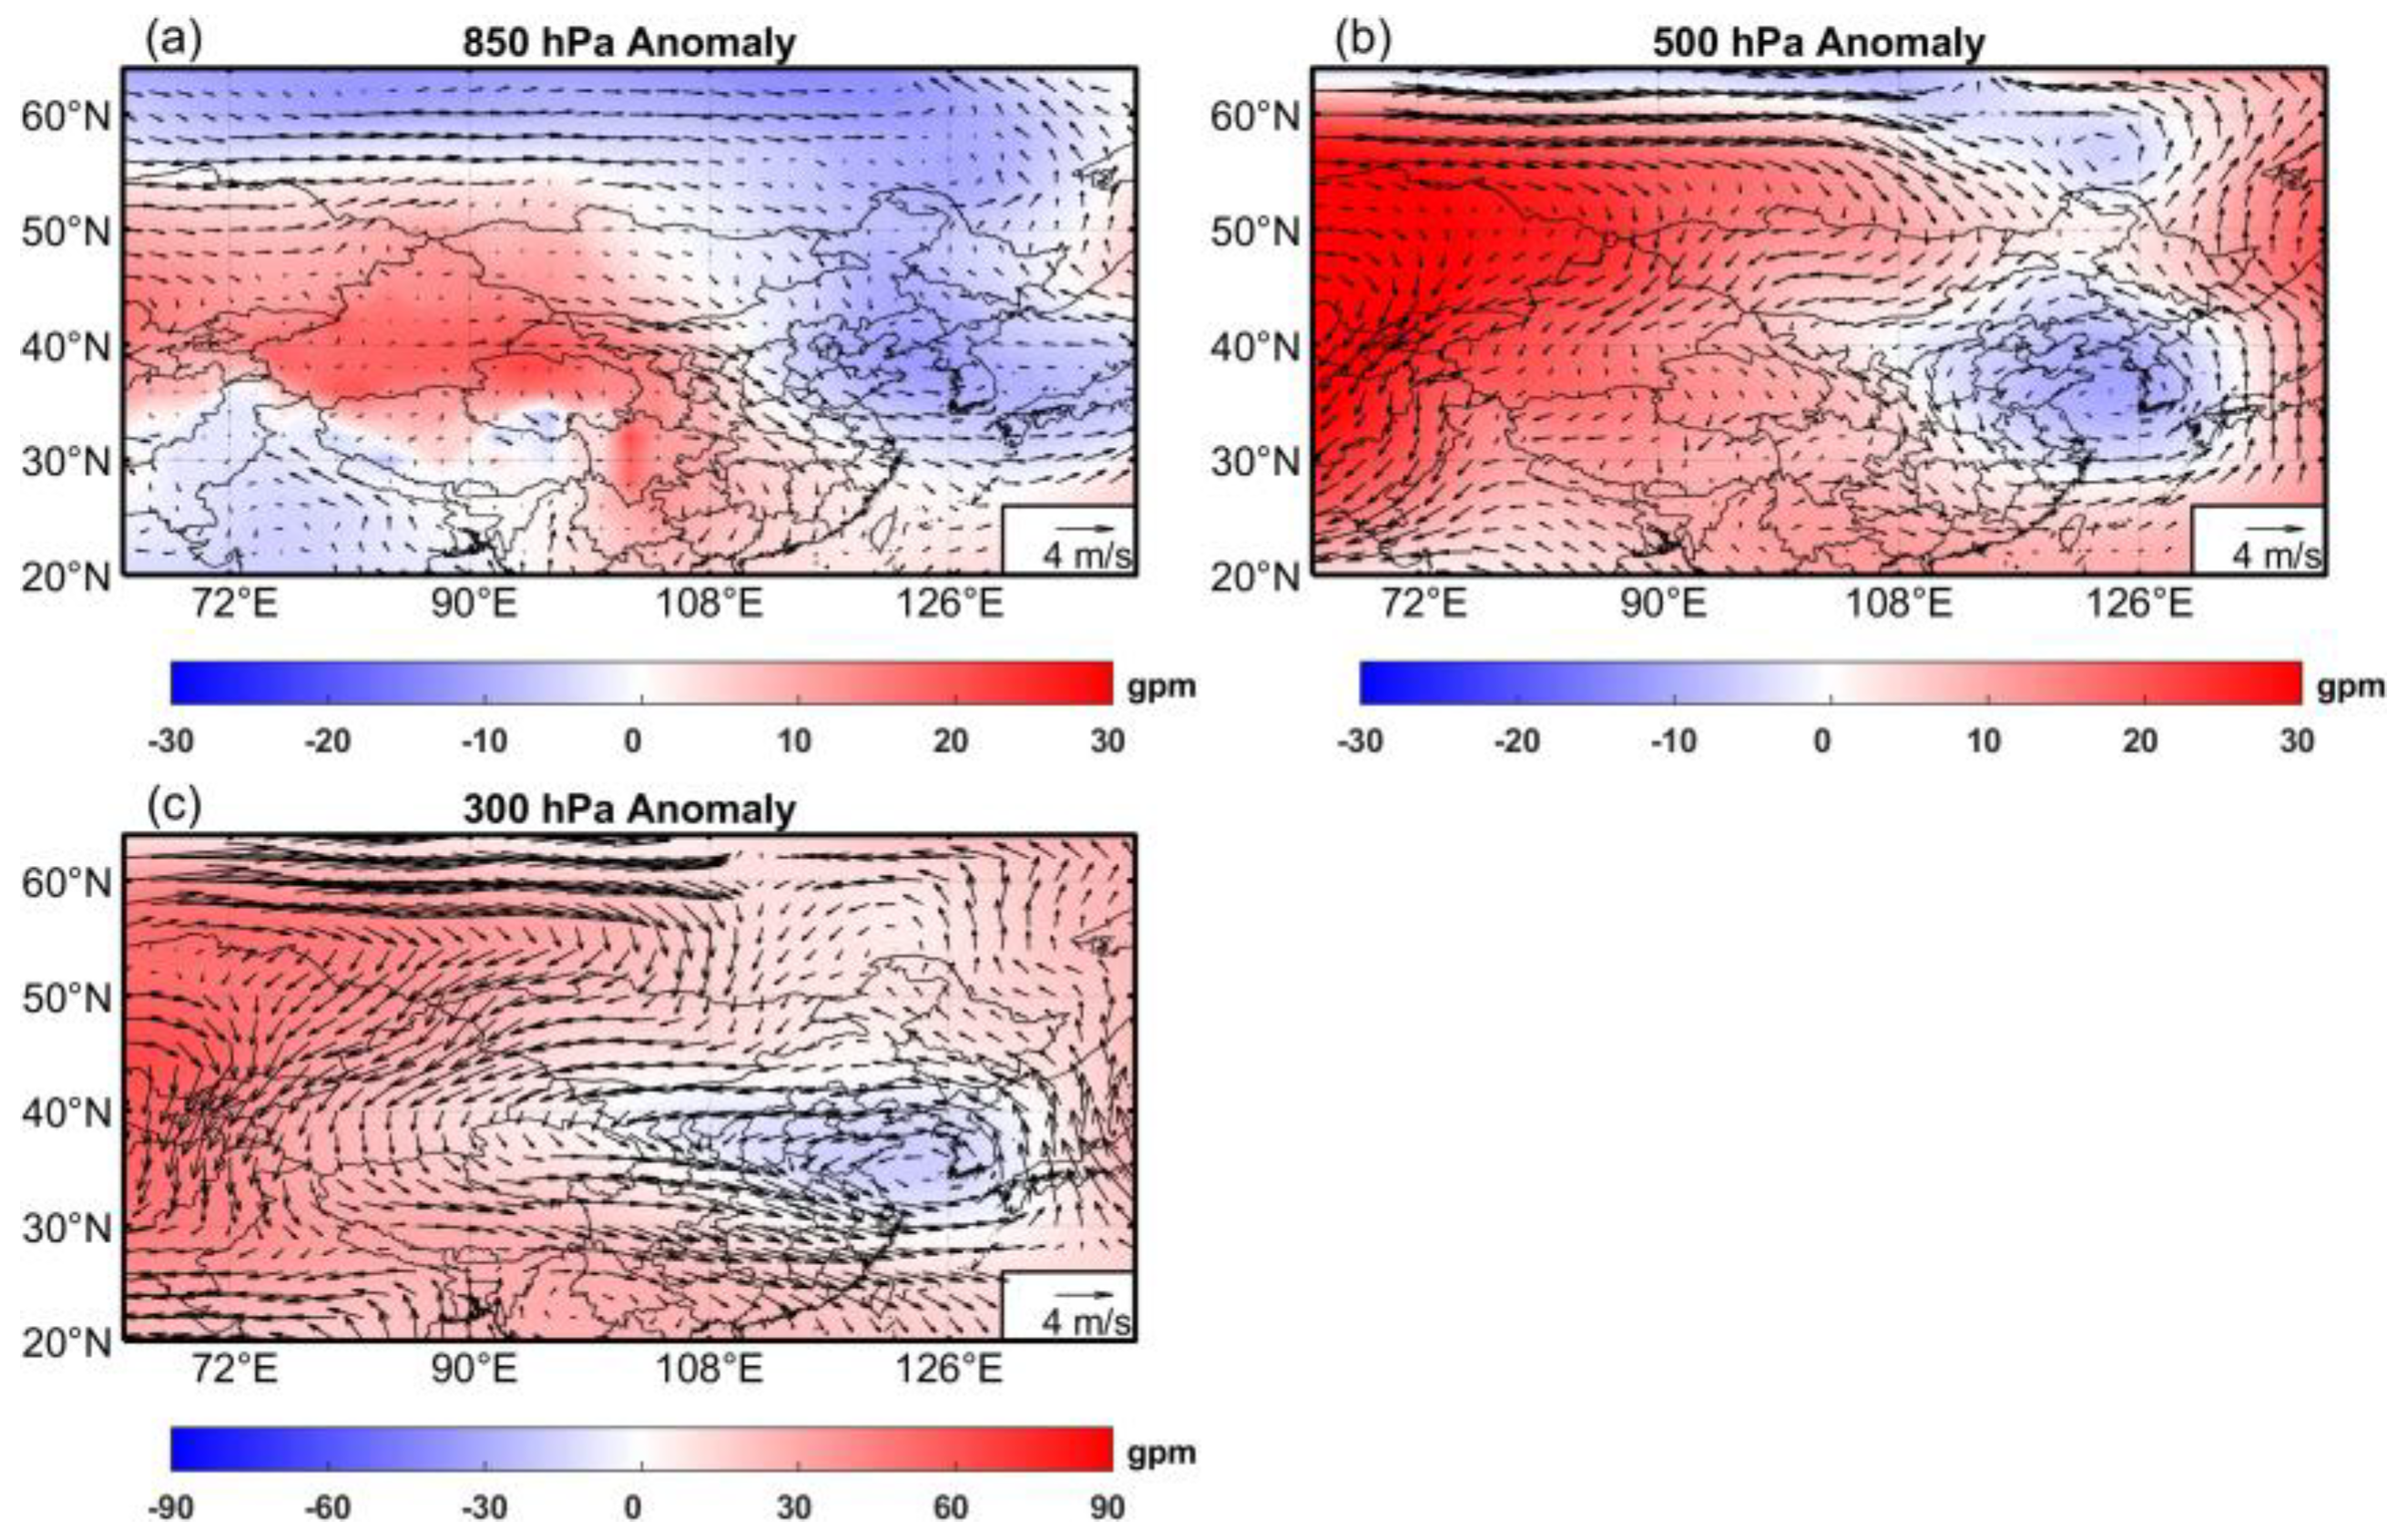
The spatial distribution of atmospheric circulation anomalies in the spring of 2025 reveals a significant anomalous low pressure over the Bohai and Yellow Sea regions at multiple pressure levels (Figure 6). To northeast of the anomalous low pressure, easterly and southerly wind anomalies are prominent, which suppress the transport of dust from the TK and GB toward northern and northeastern China, resulting in a negative dust anomaly in these regions. In contrast, most other areas in China experience northerly wind anomalies, particularly along the western part of Inner Mongolia, Shaanxi, Hunan, and Guangdong. These strong northerly winds facilitate the southward transport of dust, leading to a positive dust anomaly in southern China, including regions such as Hunan and Guangdong (Figure 1b,e and Figure 6).
Figure 6.
Atmospheric circulation anomalies in spring 2025. Panels (a–c) represent the 850 hPa, 500 hPa, and 300 hPa levels, respectively. Shading indicates geopotential height anomalies, and vectors denote wind anomalies.
In sharp contrast to 2025, the years 2023 and 2021 exhibit a distinct pattern characterized by prevailing southerly wind anomalies across China, which inhibit the southward transport of dust (Figure 1c,d,f,g, Figures S4 and S5). In 2023, negative geopotential height anomalies were observed over TK at both 500 hPa and 300 hPa levels, while positive geopotential height anomalies appeared over northern and northeastern China. These dual anomaly centers induced strong westerly wind anomalies, which facilitated the transport of dust from TK and GB toward northern and northeastern China, resulting in a pronounced positive dust anomaly in northeastern China during 2023 (Figure 1c,f and Figure S4).
3.4. A Case Study: Extreme Southward Transport Dust Event Highlighting the Role of the Gobi Desert
The weather systems that typically trigger dust storms over northern China are Mongolian cyclones and cold fronts [9,17,56,57]. However, the extreme dust storm that swept across southern China from 10 to 14 April 2025 is primarily driven by a Northeast cold vortex. On 12–13 April, a closed cold vortex developed between 850 hPa and 500 hPa, and the associated strong northerly winds transported dust from the source regions toward southern China (Supplementary Figure S6).
To investigate the contributions of different dust source regions during this anomalous dust event, we conduct three numerical experiments: one control experiment and two sensitivity experiments. In the control experiment, dust emissions from all deserts within the modeling domain are activated. The two sensitivity experiments activate dust emissions only from selected source regions—specifically, the GB and TK.
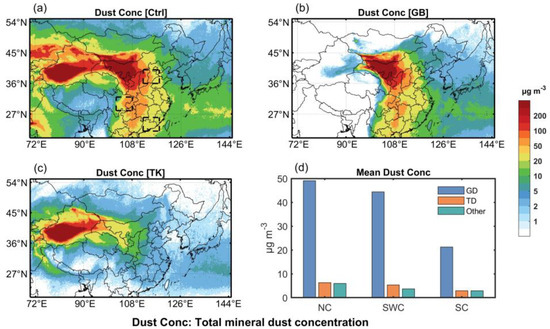
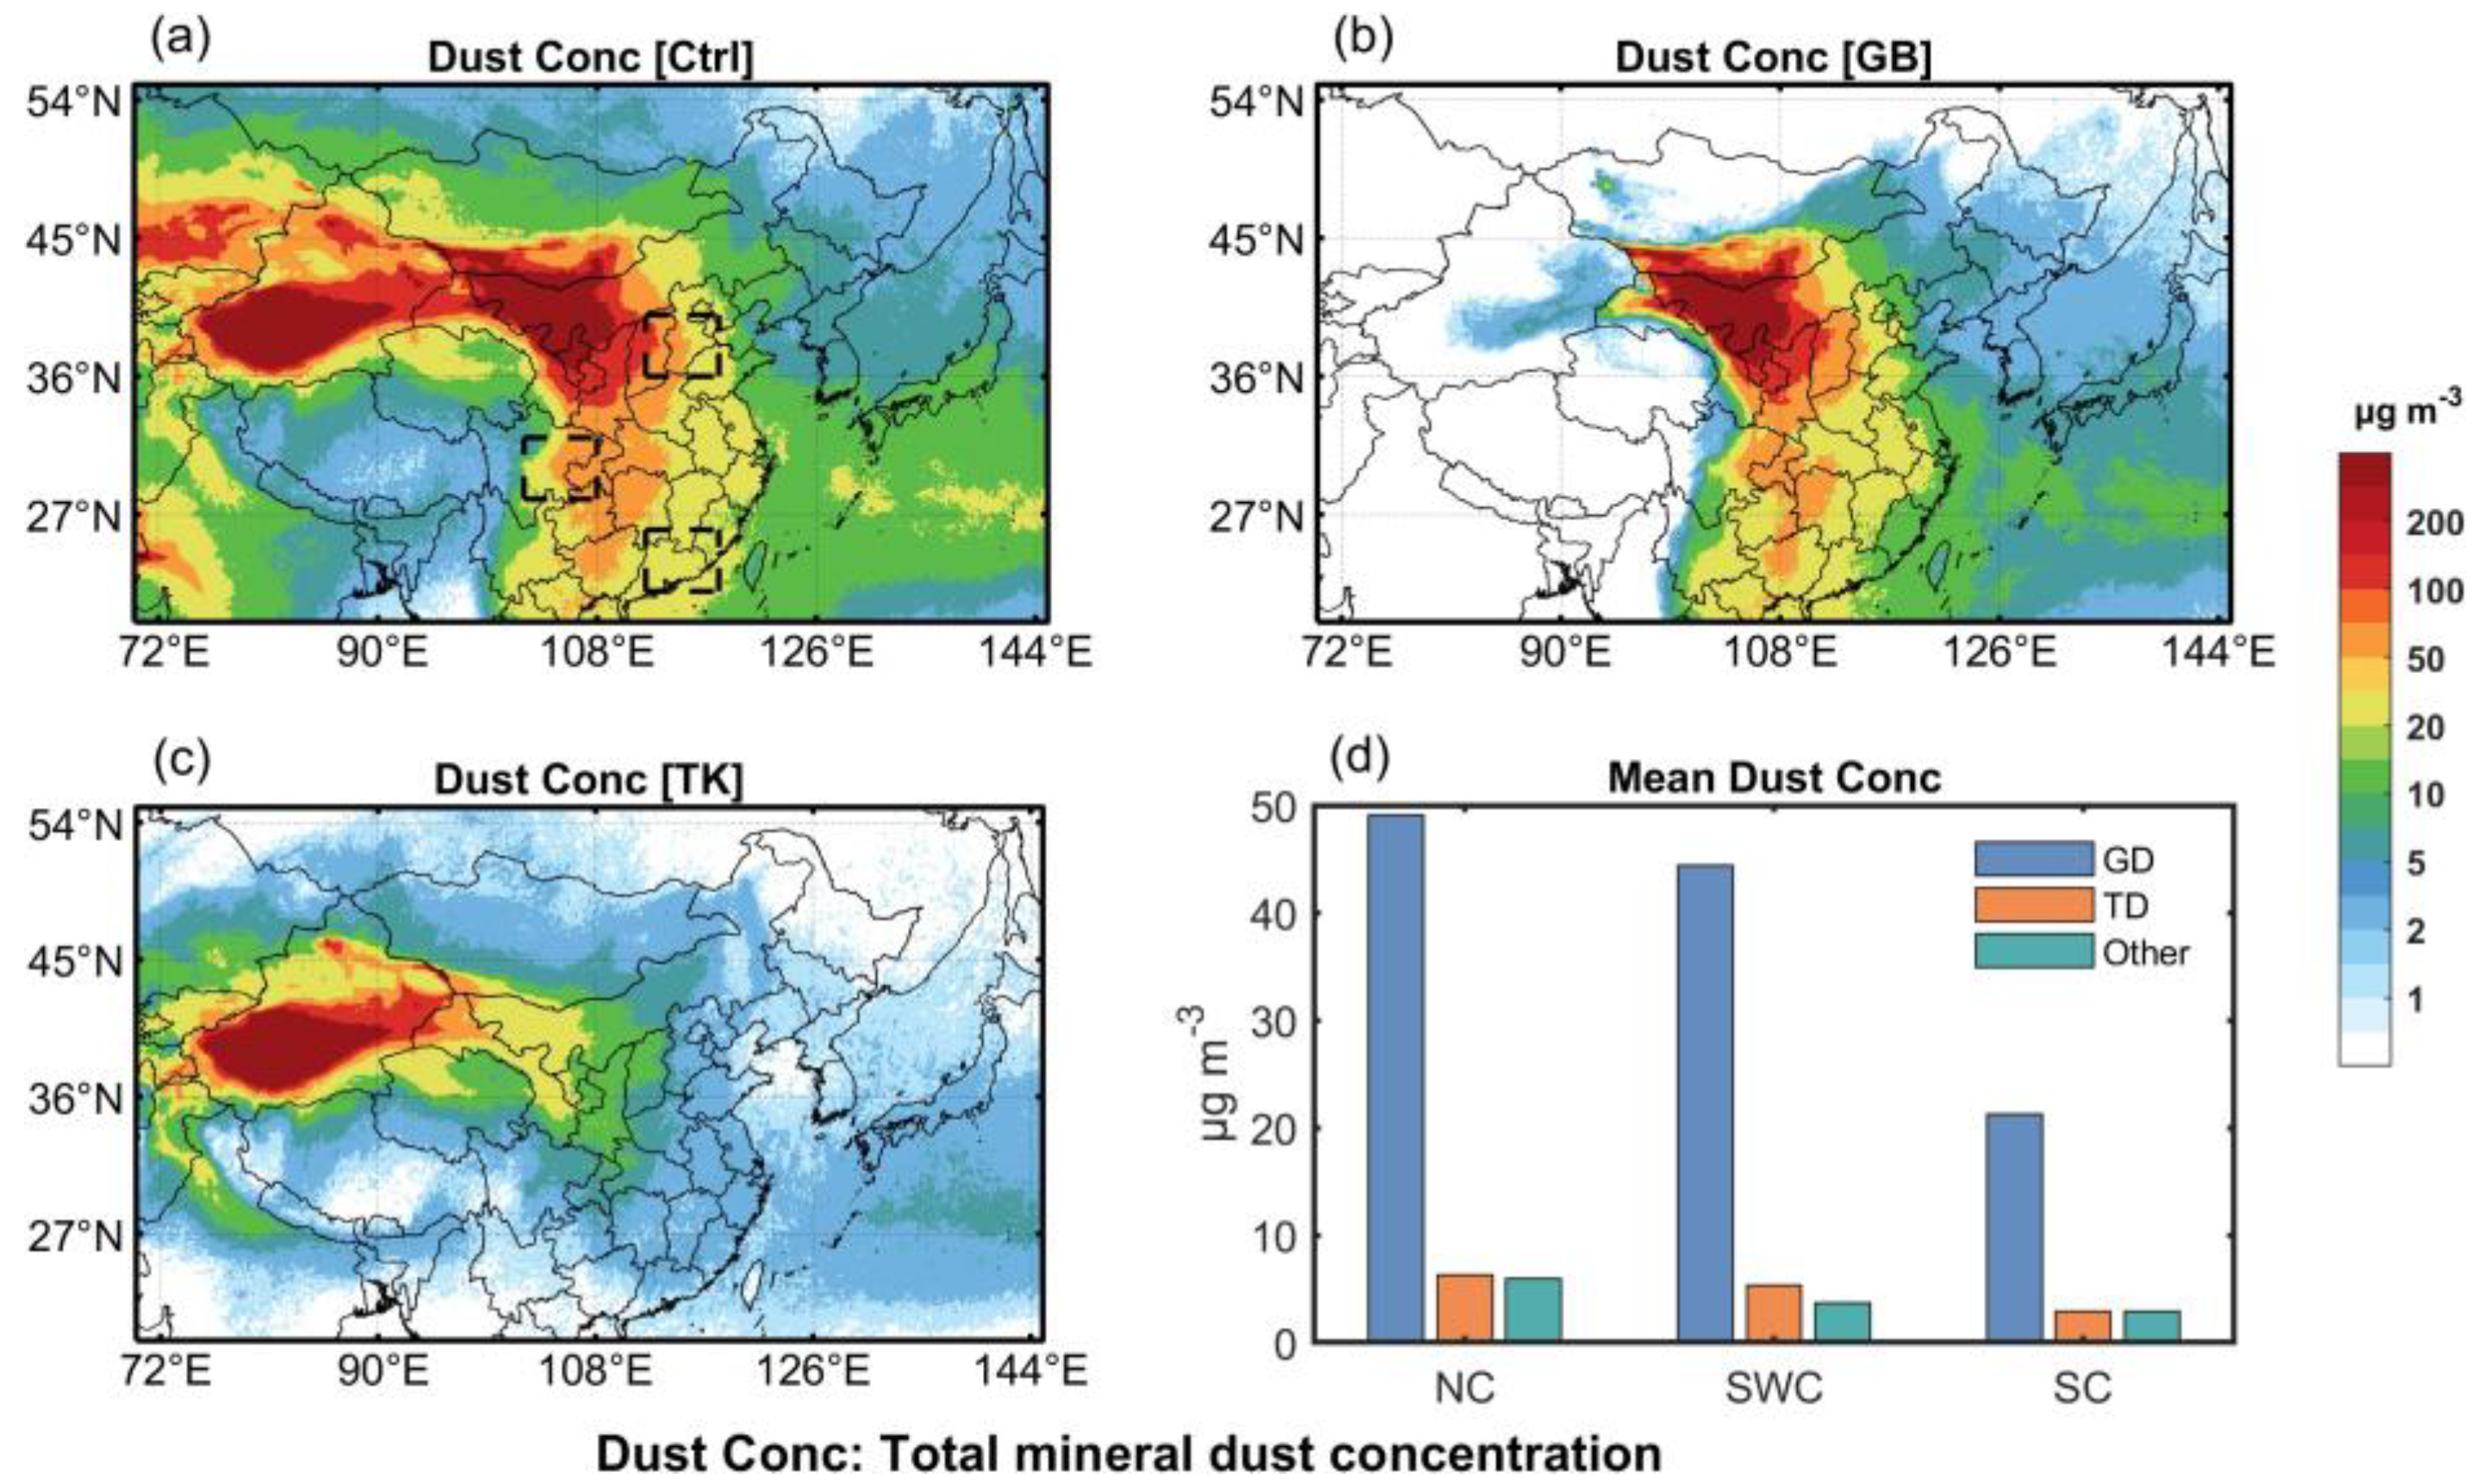
As shown in Figure 7a–c, it presents the spatial distribution of surface dust concentrations from the three experiments. The two major dust source regions (TK and GB) correspond to the areas of highest dust loading (Figure 7a). The GB exhibits strong downstream transport potential, with GB-derived dust extending over broad regions including North China, Central China, Southwest China, and South China (Figure 7b). In contrast, the TK is surrounded by high mountains as well as vast Tibetan Plateau, which restrict dust outflow [16,58]. Elevated dust concentrations remain largely confined to the TK region and parts of Inner Mongolia, Qinghai, and Gansu Province (Figure 7c).
Figure 7.
Impacts of different desert sources on China. Panels (a–c) show the spatial distribution of mean surface dust concentrations from 1 to 15 April 2025. Panel (a) shows the controlled experiment, in which dust emissions from all deserts within the simulation domain are activated. The dashed boxes in panel (a) indicate the locations of the North China (NC), Southwest China (SWC), and South China (SC), respectively. Panels (b,c) represent sensitivity experiments in which only the dust emissions from the Gobi Desert (GB) and the Taklimakan Desert (TK), respectively, are activated. Panel (d) illustrates the contributions of different dust source regions to surface dust concentrations in the receptor regions (NC, SWC, and SC) during 1–15 April 2025. Other represents dust sources within the simulation domain excluding the GB and TK.
To more clearly quantify the contributions of different source regions to dust levels over China, we focus on three dust-affected regions: North China, Southwest China, and South China (the dashed boxes in Figure 7a). Owing to its proximity to the GB, North China is particularly vulnerable to dust pollution. During the April dust event, the mean dust concentration in North China reach 61.3 μg m−3, of which GB contribute 49.1 μg m−3 (80.0%). The contribution from TK is 6.3 μg m−3 (10.3%), comparable to the aggregated contribution from the remaining source areas in the modeling domain (5.9 μg m−3, 9.7%).
For Southwest China and South China, GB also dominates the dust contributions, accounting for 44.4 μg m−3 (83.1%) and 21.2 μg m−3 (78.6%), respectively. Overall, during this extreme dust event, dust originating from GB is continuously transported downstream under the influence of the prevailing atmospheric circulation, and GB served as the primary source of dust over China.
4. Discussion
This study provides a comprehensive assessment of the interannual variability in dust activity in 2025 and the relative contributions of the two major East Asian dust source regions, GB and TK, to dust loading over China. The markedly enhanced dust activity in 2025 with its unusually strong southward transport, raises both scientific and societal questions regarding the drivers of extreme dust events amidst global climate change. Our findings highlight several key mechanisms and implications that warrant further discussion.
First, the elevated dust emissions in both the GB and TK during 2025 are closely linked to anomalous meteorological conditions, including strengthened surface winds, reduced soil moisture and vegetation cover. These results support previous studies suggesting that climate-induced shifts in circulation patterns may increase the frequency of extreme dust events [8,17]. However, due to limited observational constraints, it is currently not possible to quantify the relative contribution of each land surface factor to dust emission flux. To improve our understanding of the respective roles these drivers play, future efforts should apply quantitative approaches, such as numerical sensitivity experiments or coupled land–atmosphere modeling, to separate and evaluate the contribution of each factor to dust emission variability [21,23].
Second, our source attribution using FLEXDUST/FLEXPART shows that the GB contributed disproportionately to dust loading over North China, Southwest China, and South China during the extreme April event, despite its larger total emission relative to the TK. The relatively lower elevation and more open terrain of the GB facilitate efficient uplift and downstream advection once strong synoptic forcing is present [16,58]. Moreover, the anomalous northerly winds and enhanced meridional pressure gradients in 2025 created a highly effective southward transport corridor, enabling GB sourced dust to penetrate deep into central and southern China. In contrast, dust originating from the TK was more strongly modulated by local blocking patterns and complex terrain in northwestern China, which limited its longrange influence despite substantial emissions [16]. These findings highlight that transport efficiency, vertical mixing depth, and synoptic configuration can modulate regional dust impacts as strongly as, or even more than, dust emission magnitude itself.
Finally, the severe dust pollution in South China suggests that traditional perceptions of dust-affected regions may need to be updated. Historically, Southwest China and South China have been considered weakly influenced by dust, yet our results indicate that under certain circulation anomalies, dust can transported into these regions [16,52,59]. This has significant implications for regional air quality management and public-health preparedness, particularly as climate variability may increase the likelihood of such atypical pathways.
Overall, this study advances our understanding of dust variability in 2025 and emphasizes the critical roles of meteorological anomalies and source-region characteristics in shaping dust distributions across East Asia.
5. Conclusions
Based on meteorological station observations, PM10 concentrations, ERA5 reanalysis data, and FLEXDUST/FLEXPART, this study investigates the interannual variability and driving mechanisms of dust activity in 2025, and quantifies the contributions of different source regions during an extreme dust event. The main conclusions are as follows:
(1) In 2025, dust activity was markedly elevated, with dust exhibiting unusually extensive southward transport. Compared to the previous decade, 2025 was characterized by substantially elevated dust levels, a distinct west–east atmospheric pressure dipole, and unusually strong southward transport that carried dust plumes deep into Southwest and South China. Enhanced surface winds over both the GB and TK were the primary drivers of the intensified dust emissions in 2025, exceeding the influence of concurrent changes in precipitation, soil moisture, and vegetation cover. A significant anomalous low-pressure system over the Bohai–Yellow Sea region enhanced meridional wind anomalies and effectively opened a pathway for deep southward intrusion of dust. This circulation anomaly was essential in producing the 2025 event’s unprecedented spatial footprint.
(2) The Gobi Desert was the dominant contributor to downstream dust during an extreme event. Using FLEXDUST/FLEXPART, we conducted three numerical experiments to quantitatively assess the contributions of the GB and TK during an extreme southward-transport dust event in 2025. The results show that the GB was the primary contributor to dust concentrations in North China (80.0%), Southwest China (83.1%), and South China (78.6%).
Overall, these findings highlight the necessity of considering both emission dynamics and transport pathways when evaluating regional dust risks. While the 2025 anomaly may represent an episodic event, it raises important questions regarding whether similar patterns could become more common under future climate variability. Continued monitoring and high-resolution modeling will be essential for improving early-warning capabilities and informing air quality and public-health strategies in China and downstream regions.
Supplementary Materials
The following supporting information can be downloaded at: https://www.mdpi.com/article/10.3390/atmos17020213/s1, Figure S1: Spatial distribution of soil erodibility (shading), as well as surrounding 121 China’s National Environmental Monitoring Center (blue points) observation stations; Figure S2: Performance evaluation of FLEXDUST/FLEXPART simulations using three emission schemes (MB95, KOK14, and customized GOCART), compared against PM10 observations from China National Environmental Monitoring Centre for the period of April 1 to 17, 2025; Figure S3: Spatial distribution of (a) MODIS averaged AOD and (b–d) averaged DOD from MB95, KOK14 and GOCART for the period of April 1 to 15, 2025; Figure S4: Atmospheric circulation anomalies in 2023 spring; Figure S5: Atmospheric circulation anomalies in 2021 spring; Figure S6: Atmospheric circulation evolution during an extreme dust storm event for the period of April 11 to 15; Table S1: List of dust weather types in the present weather report from manned stations (ww) according to WMO Code Table 4677.
Author Contributions
Conceptualization, X.-Y.Y. and C.L.; methodology, X.-Y.Y. and C.L.; software, S.W.; validation, X.-Y.Y. and C.L.; data curation, S.W.; formal analysis, X.-Y.Y. and C.L.; investigation, S.W.; resources, X.-Y.Y. and C.L.; writing—original draft preparation, S.W.; writing—review and editing, X.-Y.Y. and C.L.; project administration, C.L. All authors have read and agreed to the published version of the manuscript.
Funding
This research has been supported by the Major Science and Technology Project of Fuzhou City (2024-ZD-018) and the Cooperation Project of Zhangzhou Meteorological Bureau (ZL202402).
Data Availability Statement
The datasets used in this study are publicly accessible. Surface PM10 concentrations are obtained from the China National Environmental Monitoring Centre (CNEMC) (http://www.cnemc.cn/ (accessed on 12 October 2025)). MODIS aerosol optical property products (MOD04_L2, MYD04_L2) are available at https://doi.org/10.5067/MODIS/MOD04_L2.061 and https://doi.org/10.5067/MODIS/MYD04_L2.061 (accessed on 20 October 2025). ERA5 data is obtained from https://cds.climate.copernicus.eu/#!/home (accessed on 20 October 2025). Leaf Area Index data is available at https://www.ncei.noaa.gov/data/land-leaf-area-index-and-fapar/access/ (accessed on 25 June 2025). The ISD data can be downloaded from https://www.ncei.noaa.gov/products/land-based-station/integrated-surface-database (accessed on 29 June 2025). The electronic version of Sand-dust Weather Almanac can be downloaded from the China Knowledge Network (https://www.cnki.net (accessed on 5 July 2025)). The electronic version of Meteorological Bulletin of Atmospheric Environment can be downloaded from the China Meteorological Administration (https://www.cma.gov.cn/zfxxgk/gknr/qxbg/ (accessed on 5 July 2025)).
Acknowledgments
We gratefully acknowledge the data providers whose efforts made this study possible. We acknowledge CNEMC, ECMWF, NOAA and NASA for providing the observational and reanalysis datasets used in this study.
Conflicts of Interest
The authors declare no conflicts of interest.
Abbreviations
The following abbreviations are used in this manuscript:
| GB | Gobi Desert |
| TK | Taklimakan Desert |
| CNEMC | China’s National Environmental Monitoring Center |
| LAI | Leaf Area Index |
| WMO | World Meteorological Organization |
| ISD | Integrated Surface Database |
| AOD | Aerosol Optical Depth |
References
- Tegen, I.; Fung, I. Contribution to the Atmospheric Mineral Aerosol Load from Land Surface Modification. J. Geophys. Res. 1995, 100, 18707–18726. [Google Scholar] [CrossRef] [Scilit]
- Ginoux, P.; Chin, M.; Tegen, I.; Prospero, J.M.; Holben, B.; Dubovik, O.; Lin, S. Sources and Distributions of Dust Aerosols Simulated with the GOCART Model. J. Geophys. Res. 2001, 106, 20255–20273. [Google Scholar] [CrossRef] [Scilit]
- Miller, R.L.; Perlwitz, J.; Tegen, I. Feedback upon Dust Emission by Dust Radiative Forcing through the Planetary Boundary Layer. J. Geophys. Res. 2004, 109, D24209. [Google Scholar] [CrossRef] [Scilit]
- Shao, Y.; Wyrwoll, K.-H.; Chappell, A.; Huang, J.; Lin, Z.; McTainsh, G.H.; Mikami, M.; Tanaka, T.Y.; Wang, X.; Yoon, S. Dust Cycle: An Emerging Core Theme in Earth System Science. Aeolian Res. 2011, 2, 181–204. [Google Scholar] [CrossRef] [Scilit]
- Huang, J.; Wang, T.; Wang, W.; Li, Z.; Yan, H. Climate Effects of Dust Aerosols over East Asian Arid and Semiarid Regions. J. Geophys. Res. Atmos. 2014, 119, 11,398–11,416. [Google Scholar] [CrossRef] [Scilit]
- Kok, J.F.; Storelvmo, T.; Karydis, V.A.; Adebiyi, A.A.; Mahowald, N.M.; Evan, A.T.; He, C.; Leung, D.M. Mineral Dust Aerosol Impacts on Global Climate and Climate Change. Nat. Rev. Earth Environ. 2023, 4, 71–86. [Google Scholar] [CrossRef] [Scilit]
- Sun, J.; Zhang, M.; Liu, T. Spatial and Temporal Characteristics of Dust Storms in China and Its Surrounding Regions, 1960–1999: Relations to Source Area and Climate. J. Geophys. Res. Atmos. 2001, 106, 10325–10333. [Google Scholar] [CrossRef] [Scilit]
- Gui, K.; Yao, W.; Che, H.; An, L.; Zheng, Y.; Li, L.; Zhao, H.; Zhang, L.; Zhong, J.; Wang, Y.; et al. Record-Breaking Dust Loading during Two Mega Dust Storm Events over Northern China in March 2021: Aerosol Optical and Radiative Properties and Meteorological Drivers. Atmos. Chem. Phys. 2022, 22, 7905–7932. [Google Scholar] [CrossRef] [Scilit]
- Li, J.; Hao, X.; Liao, H.; Yue, X.; Li, H.; Long, X.; Li, N. Predominant Type of Dust Storms That Influences Air Quality Over Northern China and Future Projections. Earth’s Future 2022, 10, e2022EF002649. [Google Scholar] [CrossRef] [Scilit]
- Gong, S.L.; Zhang, X.Y.; Zhao, T.L.; McKendry, I.G.; Jaffe, D.A.; Lu, N.M. Characterization of Soil Dust Aerosol in China and Its Transport and Distribution during 2001 ACE-Asia: 2. Model Simulation and Validation. J. Geophys. Res. Atmos. 2003, 108, 4262. [Google Scholar] [CrossRef] [Scilit]
- Zhao, X.; Huang, K.; Fu, J.S.; Abdullaev, S.F. Long-Range Transport of Asian Dust to the Arctic: Identification of Transport Pathways, Evolution of Aerosol Optical Properties, and Impact Assessment on Surface Albedo Changes. Atmos. Chem. Phys. 2022, 22, 10389–10407. [Google Scholar] [CrossRef] [Scilit]
- Uno, I.; Eguchi, K.; Yumimoto, K.; Takemura, T.; Shimizu, A.; Uematsu, M.; Liu, Z.; Wang, Z.; Hara, Y.; Sugimoto, N. Asian Dust Transported One Full Circuit around the Globe. Nature Geosci. 2009, 2, 557–560. [Google Scholar] [CrossRef] [Scilit]
- Guo, J.; Lou, M.; Miao, Y.; Wang, Y.; Zeng, Z.; Liu, H.; He, J.; Xu, H.; Wang, F.; Min, M.; et al. Trans-Pacific Transport of Dust Aerosols from East Asia: Insights Gained from Multiple Observations and Modeling. Environ. Pollut. 2017, 230, 1030–1039. [Google Scholar] [CrossRef] [Scilit] [PubMed]
- Kurosaki, Y.; Mikami, M. Threshold Wind Speed for Dust Emission in East Asia and Its Seasonal Variations. J. Geophys. Res. 2007, 112, D17202. [Google Scholar] [CrossRef] [Scilit]
- Fan, B.; Guo, L.; Li, N.; Chen, J.; Lin, H.; Zhang, X.; Shen, M.; Rao, Y.; Wang, C.; Ma, L. Earlier Vegetation Green-up Has Reduced Spring Dust Storms. Sci. Rep. 2014, 4, 6749. [Google Scholar] [CrossRef] [Scilit]
- Chen, S.; Huang, J.; Li, J.; Jia, R.; Jiang, N.; Kang, L.; Ma, X.; Xie, T. Comparison of Dust Emissions, Transport, and Deposition between the Taklimakan Desert and Gobi Desert from 2007 to 2011. Sci. China Earth Sci. 2017, 60, 1338–1355. [Google Scholar] [CrossRef] [Scilit]
- Yin, Z.; Wan, Y.; Zhang, Y.; Wang, H. Why Super Sandstorm 2021 in North China? Natl. Sci. Rev. 2022, 9, nwab165. [Google Scholar] [CrossRef] [Scilit]
- Shi, L.; Zhang, J.; Yao, F.; Zhang, D.; Guo, H. Temporal Variation of Dust Emissions in Dust Sources over Central Asia in Recent Decades and the Climate Linkages. Atmos. Environ. 2020, 222, 117176. [Google Scholar] [CrossRef] [Scilit]
- Liu, S.; Xing, J.; Sahu, S.K.; Liu, X.; Liu, S.; Jiang, Y.; Zhang, H.; Li, S.; Ding, D.; Chang, X.; et al. Wind-Blown Dust and Its Impacts on Particulate Matter Pollution in Northern China: Current and Future Scenarios. Environ. Res. Lett. 2021, 16, 114041. [Google Scholar] [CrossRef] [Scilit]
- Osada, K.; Ura, S.; Kagawa, M.; Mikami, M.; Tanaka, T.Y.; Matoba, S.; Aoki, K.; Shinoda, M.; Kurosaki, Y.; Hayashi, M.; et al. Wet and Dry Deposition of Mineral Dust Particles in Japan: Factors Related to Temporal Variation and Spatial Distribution. Atmos. Chem. Phys. 2014, 14, 1107–1121. [Google Scholar] [CrossRef] [Scilit]
- Wu, C.; Lin, Z.; Shao, Y.; Liu, X.; Li, Y. Drivers of Recent Decline in Dust Activity over East Asia. Nat. Commun. 2022, 13, 7105. [Google Scholar] [CrossRef] [Scilit]
- Tai, A.P.K.; Ma, P.H.L.; Chan, Y.-C.; Chow, M.-K.; Ridley, D.A.; Kok, J.F. Impacts of Climate and Land Cover Variability and Trends on Springtime East Asian Dust Emission over 1982–2010: A Modeling Study. Atmos. Environ. 2021, 254, 118348. [Google Scholar] [CrossRef] [Scilit]
- Wu, X.; Wu, C.; Lin, Z.; Yang, M. Intra-Seasonal Variations of Dust Activity over East Asia in Spring 2023 and Their Mechanisms. Glob. Planet. Change 2025, 244, 104638. [Google Scholar] [CrossRef] [Scilit]
- Bagnold, R.A. The Movement of Desert Sand. Proc. A 1936, 157, 594–620. [Google Scholar] [CrossRef] [Scilit]
- Sinclair, P.C. General Characteristics of Dust Devils. J. Appl. Meteorol. 1969, 8, 32–45. [Google Scholar] [CrossRef] [Scilit]
- Marticorena, B.; Bergametti, G. Modeling the Atmospheric Dust Cycle: 1. Design of a Soil-derived Dust Emission Scheme. J. Geophys. Res. 1995, 100, 16415–16430. [Google Scholar] [CrossRef] [Scilit]
- Kok, J.F.; Mahowald, N.M.; Fratini, G.; Gillies, J.A.; Ishizuka, M.; Leys, J.F.; Mikami, M.; Park, M.-S.; Park, S.-U.; Van Pelt, R.S.; et al. An Improved Dust Emission Model—Part 1: Model Description and Comparison against Measurements. Atmos. Chem. Phys. 2014, 14, 13023–13041. [Google Scholar] [CrossRef] [Scilit]
- Wang, S.; Yu, Y.; Zhang, X.-X.; Lu, H.; Zhang, X.-Y.; Xu, Z. Weakened Dust Activity over China and Mongolia from 2001 to 2020 Associated with Climate Change and Land-Use Management. Environ. Res. Lett. 2021, 16, 124056. [Google Scholar] [CrossRef] [Scilit]
- Guan, Q.; Sun, X.; Yang, J.; Pan, B.; Zhao, S.; Wang, L. Dust Storms in Northern China: Long-Term Spatiotemporal Characteristics and Climate Controls. J. Clim. 2017, 30, 6683–6700. [Google Scholar] [CrossRef] [Scilit]
- Chen, S.; Zhao, D.; Huang, J.; He, J.; Chen, Y.; Chen, J.; Bi, H.; Lou, G.; Du, S.; Zhang, Y.; et al. Mongolia Contributed More than 42% of the Dust Concentrations in Northern China in March and April 2023. Adv. Atmospheric Sci. 2023, 40, 1549–1557. [Google Scholar] [CrossRef] [Scilit]
- Chan, P.W.; Chan, Y.W.; Ho, C.K.; Tse, W.P.; Jin, J.Q.; Wong, M.S.; Lau, A.K.H. A Very Rare Event of Sand/Dust Weather in Hong Kong in Late Spring in 2025—Observational and Forecasting Aspects. Atmos. Environ. 2025, 362, 121575. [Google Scholar] [CrossRef] [Scilit]
- Zhang, G.; Wang, Y.; Liu, L.; Ma, Y.; Lin, Z.; Li, W.; Zhang, T.; Liu, S.; Zhang, X.; Wang, S.; et al. Process, Causes, and Loss Assessment of the Extreme Wind-Dust Compound Disaster in China in April 2025. Int. J. Disaster Risk Sci. 2025, 16, 781–800. [Google Scholar] [CrossRef] [Scilit]
- Stohl, A. Computation, Accuracy and Applications of Trajectories—A Review and Bibliography. Atmos. Environ. 1998, 32, 947–966. [Google Scholar] [CrossRef] [Scilit]
- Stohl, A.; Hittenberger, M.; Wotawa, G. Validation of the Lagrangian Particle Dispersion Model FLEXPART against Large-Scale Tracer Experiment Data. Atmos. Environ. 1998, 32, 4245–4264. [Google Scholar] [CrossRef] [Scilit]
- Stohl, A. Characteristics of Atmospheric Transport into the Arctic Troposphere. J. Geophys. Res. 2006, 111, D11306. [Google Scholar] [CrossRef] [Scilit]
- Pisso, I.; Sollum, E.; Grythe, H.; Kristiansen, N.I.; Cassiani, M.; Eckhardt, S.; Arnold, D.; Morton, D.; Thompson, R.L.; Groot Zwaaftink, C.D.; et al. The Lagrangian Particle Dispersion Model FLEXPART Version 10.4. Geosci. Model Dev. 2019, 12, 4955–4997. [Google Scholar] [CrossRef] [Scilit]
- Bakels, L.; Tatsii, D.; Tipka, A.; Thompson, R.; Dütsch, M.; Blaschek, M.; Seibert, P.; Baier, K.; Bucci, S.; Cassiani, M.; et al. FLEXPART Version 11: Improved Accuracy, Efficiency, and Flexibility. Geosci. Model Dev. 2024, 17, 7595–7627. [Google Scholar] [CrossRef] [Scilit]
- Groot Zwaaftink, C.D.; Grythe, H.; Skov, H.; Stohl, A. Substantial Contribution of Northern High-Latitude Sources to Mineral Dust in the Arctic. J. Geophys. Res. Atmos. 2016, 121, 13,678–13,697. [Google Scholar] [CrossRef] [Scilit]
- Tipka, A.; Haimberger, L.; Seibert, P. Flex_extract v7.1.2—A Software Package to Retrieve and Prepare ECMWF Data for Use in FLEXPART. Geosci. Model Dev. 2020, 13, 5277–5310. [Google Scholar] [CrossRef] [Scilit]
- Gliß, J.; Mortier, A.; Schulz, M.; Andrews, E.; Balkanski, Y.; Bauer, S.E.; Benedictow, A.M.K.; Bian, H.; Checa-Garcia, R.; Chin, M.; et al. AeroCom Phase III Multi-Model Evaluation of the Aerosol Life Cycle and Optical Properties Using Ground- and Space-Based Remote Sensing as Well as Surface in Situ Observations. Atmos. Chem. Phys. 2021, 21, 87–128. [Google Scholar] [CrossRef] [Scilit]
- Textor, C.; Schulz, M.; Guibert, S.; Kinne, S.; Balkanski, Y.; Bauer, S.; Berntsen, T.; Berglen, T.; Boucher, O.; Chin, M.; et al. Analysis and Quantification of the Diversities of Aerosol Life Cycles within AeroCom. Atmos. Chem. Phys. 2006, 6, 1777–1813. [Google Scholar] [CrossRef] [Scilit]
- Tang, H.; Haugvaldstad, O.W.; Stordal, F.; Bi, J.; Groot Zwaaftink, C.D.; Grythe, H.; Wang, B.; Rao, Z.; Zhang, Z.; Berntsen, T.; et al. Modelling the 2021 East Asia Super Dust Storm Using FLEXPART and FLEXDUST and Its Comparison with Reanalyses and Observations. Front. Environ. Sci. 2023, 10, 1013875. [Google Scholar] [CrossRef] [Scilit]
- Wang, S.; Yang, X.-Y.; Luo, C. Evaluating the Effect of Emission Schemes on Dust Simulation in East Asia During Spring 2023. Atmosphere 2026, 17, 154. [Google Scholar] [CrossRef] [Scilit]
- Chen, X.; Chong, M.; Lin, S.; Liang, Z.; Ginoux, P.; Liang, Y.; Zhang, B.; Song, Q.; Wang, S.; Li, J.; et al. The Efficient Integration of Dust and Numerical Weather Prediction for Renewable Energy Applications. J. Adv. Model. Earth Syst. 2025, 17, e2024MS004525. [Google Scholar] [CrossRef] [Scilit]
- CNEMC PM10 [Dataset]. 2023. Available online: https://air.cnemc.cn:18007/ (accessed on 28 June 2025).
- Levy, R.C.; Mattoo, S.; Munchak, L.A.; Remer, L.A.; Sayer, A.M.; Patadia, F.; Hsu, N.C. The Collection 6 MODIS Aerosol Products over Land and Ocean. Atmos. Meas. Tech. 2013, 6, 2989–3034. [Google Scholar] [CrossRef] [Scilit]
- Hersbach, H.; Bell, B.; Berrisford, P.; Hirahara, S.; Horányi, A.; Muñoz-Sabater, J.; Nicolas, J.; Peubey, C.; Radu, R.; Schepers, D.; et al. The ERA5 Global Reanalysis. Q. J. R. Meteorol. Soc. 2020, 146, 1999–2049. [Google Scholar] [CrossRef] [Scilit]
- Justice, C.O.; Román, M.O.; Csiszar, I.; Vermote, E.F.; Wolfe, R.E.; Hook, S.J.; Friedl, M.; Wang, Z.; Schaaf, C.B.; Miura, T.; et al. Land and Cryosphere Products from Suomi NPP VIIRS: Overview and Status. JGR Atmos. 2013, 118, 9753–9765. [Google Scholar] [CrossRef] [Scilit]
- Smith, A.; Lott, N.; Vose, R. The Integrated Surface Database: Recent Developments and Partnerships. Bull. Am. Meteorol. Soc. 2011, 92, 704–708. [Google Scholar] [CrossRef] [Scilit]
- Chen, Y.; Chen, S.; Zhou, J.; Zhao, D.; Bi, H.; Zhang, Y.; Alam, K.; Yu, H.; Yang, Y.; Chen, J. A Super Dust Storm Enhanced by Radiative Feedback. npj Clim. Atmos. Sci. 2023, 6, 90. [Google Scholar] [CrossRef] [Scilit]
- HJ 633–2012; Technical Regulation on Ambient Air Quality Index (on Trial). Ministry of Environmental Protection of the People’s Republic of China, China Environmental Science Press: Beijing, China, 2012.
- Chen, Y.; Luo, B.; Xie, S. Characteristics of the Long-Range Transport Dust Events in Chengdu, Southwest China. Atmos. Environ. 2015, 122, 713–722. [Google Scholar] [CrossRef] [Scilit]
- Liu, Y.; Shi, G.; Du, Y.; Lyu, M.; Zhang, W.; Yang, F. The Role of Cloud in the Transportation of Dust into Basin Area: A Case Study in Sichuan Basin, Southwesten China. Atmosphere 2022, 13, 1668. [Google Scholar] [CrossRef] [Scilit]
- Zeng, Y.; Wang, M.; Zhao, C.; Chen, S.; Liu, Z.; Huang, X.; Gao, Y. WRF-Chem v3.9 Simulations of the East Asian Dust Storm in May 2017: Modeling Sensitivities to Dust Emission and Dry Deposition Schemes. Geosci. Model Dev. 2020, 13, 2125–2147. [Google Scholar] [CrossRef] [Scilit]
- Kurosaki, Y.; Shinoda, M.; Mikami, M. What Caused a Recent Increase in Dust Outbreaks over East Asia?: CAUSES OF INCREASED DUST OVER EAST ASIA. Geophys. Res. Lett. 2011, 38, L11702. [Google Scholar] [CrossRef] [Scilit]
- Gao, J.; Ding, T.; Gao, H. Dominant Circulation Pattern and Moving Path of the Mongolian Cyclone for the Severe Sand and Dust Storm in China. Atmos. Res. 2024, 301, 107272. [Google Scholar] [CrossRef] [Scilit]
- Huo, Q.; Yin, Z.; Ma, X.; Wang, H. Distinctive Dust Weather Intensities in North China Resulted from Two Types of Atmospheric Circulation Anomalies. Atmos. Chem. Phys. 2025, 25, 1711–1724. [Google Scholar] [CrossRef] [Scilit]
- Chen, Y.; Chen, S.; Bi, H.; Zhou, J.; Zhang, Y. Where Is the Dust Source of 2023 Several Severe Dust Events in China? Bull. Am. Meteorol. Soc. 2024, 105, E2085–E2096. [Google Scholar] [CrossRef] [Scilit]
- Fan, Q.; Shen, C.; Wang, X.; Li, Y.; Huang, W.; Liang, G.; Wang, S.; Huang, Z. Impact of a Dust Storm on Characteristics of Particle Matter (PM) in Guangzhou, China. Asia-Pac. J. Atmos. Sci. 2013, 49, 121–131. [Google Scholar] [CrossRef] [Scilit]

Disclaimer/Publisher’s Note: The statements, opinions and data contained in all publications are solely those of the individual author(s) and contributor(s) and not of MDPI and/or the editor(s). MDPI and/or the editor(s) disclaim responsibility for any injury to people or property resulting from any ideas, methods, instructions or products referred to in the content. |
© 2026 by the authors. Licensee MDPI, Basel, Switzerland. This article is an open access article distributed under the terms and conditions of the Creative Commons Attribution (CC BY) license.