


Abstract
With the increasing frequency extreme weather events associated with climate change, real-time monitoring of rainfall intensity is critical for water resource management, disaster warning, and other applications. Traditional methods, such as ground-based rain gauges, radar, and satellites, face challenges like high costs, low resolution, and monitoring gaps. This study proposes a novel real-time rainfall intensity monitoring method based on deep learning and audio signal processing, using acoustic features from rainfall to predict intensity. Conducted in the semi-arid region of Northwest China, the study employed a custom-designed sound collection device to capture acoustic signals from raindrop-surface interactions. The method, combining multi-feature extraction and regression modeling, accurately predicted rainfall intensity. Experimental results revealed a strong linear relationship between sound pressure and rainfall intensity (r = 0.916, R2 = 0.838), with clear nonlinear enhancement of acoustic energy during heavy rainfall. Compared to traditional methods like CML and radio link techniques, the acoustic approach offers advantages in cost, high-density deployment, and adaptability to complex terrain. Despite some limitations, including regional and seasonal biases, the study lays the foundation for future improvements, such as expanding sample coverage, optimizing sensor design, and incorporating multi-source data. This method holds significant potential for applications in urban drainage, agricultural irrigation, and disaster early warning.
1. Introduction
Rainfall, as a core process in the Earth’s water cycle, plays a direct role in the exchange of energy and mass between the atmosphere, land surface, and water bodies, exerting a profound impact on both the natural environment and social systems [1]. Its intensity, frequency, and spatial distribution not only determine the spatiotemporal patterns of regional water resources but also play a critical role in agriculture, urban drainage, flood control, drought resistance, soil and water conservation, and ecological regulation [2]. Taking cities as an example, heavy rainfall events often lead to the overloading of drainage systems, which can result in urban flooding, traffic paralysis, and other public safety hazards. In the agricultural sector, uneven or sudden rainfall may disrupt planting schedules, damage crop root systems, and even trigger pest and disease outbreaks, leading to economic losses [3]. Therefore, accurate and real-time monitoring of rainfall processes is not only a crucial research topic in hydrology and meteorology but also a key technological support for enhancing the response capabilities of various disaster prevention and mitigation systems [4].
Currently, the mainstream precipitation monitoring technologies can be broadly classified into two categories: ground-based rain gauges and remote sensing observation equipment. Among these, ground-based rain gauges (such as tipping-bucket and weighing gauges) are widely deployed in meteorological stations and agricultural experimental areas due to their simple measurement principles and ease of operation, providing precise point rainfall data [2]. However, traditional rain gauges are limited by their low spatial coverage density, high deployment costs, and long maintenance cycles, making it difficult to meet the demand for high spatiotemporal resolution data in mountainous areas, remote regions, or urban microclimates [5]. Particularly under extreme weather conditions (such as typhoons or heavy rain), the stability and data continuity of mechanical rain gauges are often compromised, leading to reduced reliability [6].
In contrast, weather radar and satellite remote sensing technologies enable large-scale, multi-scale rainfall observations, particularly excelling in monitoring precipitation distribution within the troposphere [7]. Weather radar inversely estimates rainfall intensity by detecting the scattering echoes of electromagnetic waves from precipitation particles, offering high temporal resolution. However, its accuracy can be affected by factors such as terrain obstruction, beam attenuation, and the assumptions underlying the Z-R relationship [6,8]. Satellite remote sensing, on the other hand, can capture precipitation images across regions, making it suitable for global-scale rainfall trend analysis and disaster warning models. However, its spatial resolution still exhibits discrepancies with ground-level conditions [9]. Therefore, in areas with complex terrain or observation blind spots, the development of novel rainfall monitoring methods that offer high timeliness, flexible deployment, and cost advantages has become a focal point of interest for both academia and engineering fields [10,11]. In recent years, rainfall acoustic monitoring methods have gained increasing attention. Studies have found that raindrops generate acoustically distinct sounds when they impact the ground, water surface, or other objects. The acoustic parameters (such as sound pressure, energy density, frequency distribution, etc.) exhibit a high correlation with raindrop size, falling velocity, and rainfall intensity [12,13]. Ma and Nystuen were pioneers in conducting acoustic studies of rain in marine environments, proposing a theoretical model to identify different rainfall intensities through the shape of the water acoustic spectrum, thus laying the foundation for subsequent rainfall estimation based on acoustic signals. Set up a microphone system in terrestrial environments to record the sound waves generated by raindrop impacts on a standard steel plate and analyzed the relationship between these sounds and rainfall amounts [14]. However, the experimental results revealed a significant issue—elevated microphone structures are prone to picking up background noise, such as wind and traffic sounds [15]. The urban soundscape studies by Watts and Godfrey also indicated that the frequency bands of traffic and human noise overlap significantly with the raindrop sound spectrum in certain frequency ranges, severely interfering with the effectiveness of signal extraction [16]. Against this background, an increasing number of studies have attempted to combine environmental audio with artificial intelligence technologies to develop intelligent rainfall monitoring systems based on sound signals. Early methods primarily employed feature engineering techniques to extract both time-domain and frequency-domain features (such as spectral centroid, zero-crossing rate, energy density, entropy, etc.) from rainfall sounds, using machine learning algorithms for rainfall event recognition and classification [17,18]. With the rapid development of deep learning, structures such as Convolutional Neural Networks (CNN), Recurrent Neural Networks (RNN), and Long Short-Term Memory Networks (LSTM) have been gradually introduced into rainfall audio analysis, enhancing the model’s feature extraction and pattern recognition capabilities [19]. For example, Sun et al. constructed a lightweight CNN capable of real-time rain sound segment recognition on edge devices [20]; Used a time-frequency convolution model for rainfall intensity regression prediction, achieving high accuracy [21]. In addition, Liu Guangtong’s team has conducted a series of rainfall acoustic modeling experiments, proposing a rainfall sound feature collaborative encoding strategy, and validating its generalization performance across multiple scenario datasets [15,22]. Building on the aforementioned achievements, this study proposes an intelligent rainfall intensity perception system, “Sound-based Rainfall Detection.” The system is designed around a three-stage process: “ground-level sound collection—multi-feature extraction—model regression prediction.” In terms of hardware development, a custom-built audio collection node is used, with microphones placed approximately 50 cm above the ground to effectively avoid common wind noise issues associated with high-altitude sound collection, thereby enhancing the fidelity of the sound signals [23]. In the signal processing module, the system extracts seven types of features in real time, including sound pressure level, spectral centroid, energy density, zero-crossing rate, peak amplitude, bandwidth, and more. A rainfall intensity regression model based on convolutional structures and fully connected layers is then constructed. The model predicts the current and future rainfall intensity variations within a one-minute time window, with strong real-time response capabilities [24].
In the context outlined above, the computational overhead, high latency, and energy consumption associated with traditional deep models on embedded and edge devices have become key bottlenecks for the large-scale application of rainfall acoustic recognition. To address these challenges, this paper proposes a joint optimization strategy combining model pruning and feature dimensionality reduction, specifically designed for resource-constrained scenarios, built upon a near-ground passive acoustic perception framework. While preserving the integrity of key discriminative information (such as sound pressure level, subband energy, and time-frequency structure), channel/connection-level pruning is employed to achieve network sparsity, and low-redundancy feature subspace modeling is utilized to reduce the storage footprint of input dimensions and intermediate representations. This design significantly compresses both the number of parameters and computational load, enabling low-power, low-latency online inference without compromising core recognition capabilities. Furthermore, the system demonstrates enhanced stability and adaptability in complex soundscapes, including wind noise, traffic noise, raindrop spectra, and variations in the underlying surface. Coupled with a rolling inference strategy operating at a scale of one to ten seconds, the system can maintain fine-grained tracking of rainfall intensity variations while ensuring rapid response times.
The system also showcases robust network integration capabilities. It can serve as an edge node for urban rainfall sensing networks, agricultural intelligent scheduling systems, and remote mountainous rainfall early warning platforms, providing high-density, near-surface “ground truth” data under low-cost and low-maintenance constraints. Additionally, it can complement “opportunistic sensing” technologies such as electromagnetic links, radar, and satellite products, enabling spatiotemporal synergy and multi-source collaboration. This enhances the coverage and robustness of regional rainfall inversion, effectively addressing the limitations of traditional monitoring methods in complex terrains and observation blind spots. Based on this system-level co-design, this paper offers a replicable technical pathway for constructing a distributed, low-cost, and scalable smart meteorological observation network.
In summary, the innovative monitoring framework proposed in this paper, which integrates audio collection, signal analysis, and intelligent recognition, addresses the limitations of traditional rainfall monitoring methods in terms of complex terrain, large spatial coverage, and high deployment and maintenance costs. Through the use of lightweight models and feature engineering, the system enables efficient deployment on the edge side, providing a clear theoretical foundation and experimental support for achieving high-resolution, wide-coverage, and intelligent rainfall monitoring, while laying a solid foundation for future large-scale network applications and multi-source integration.
2. Materials and Methods
2.1. Study Area Overview
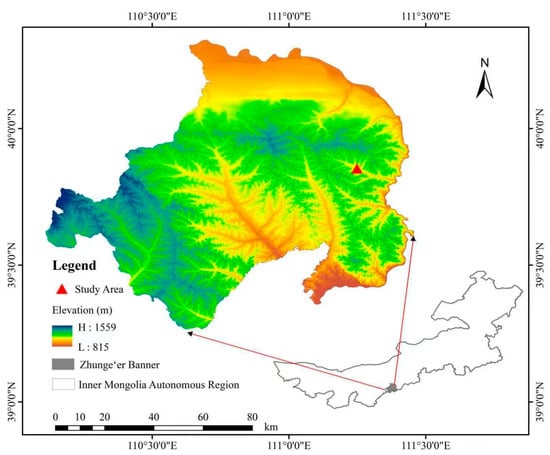
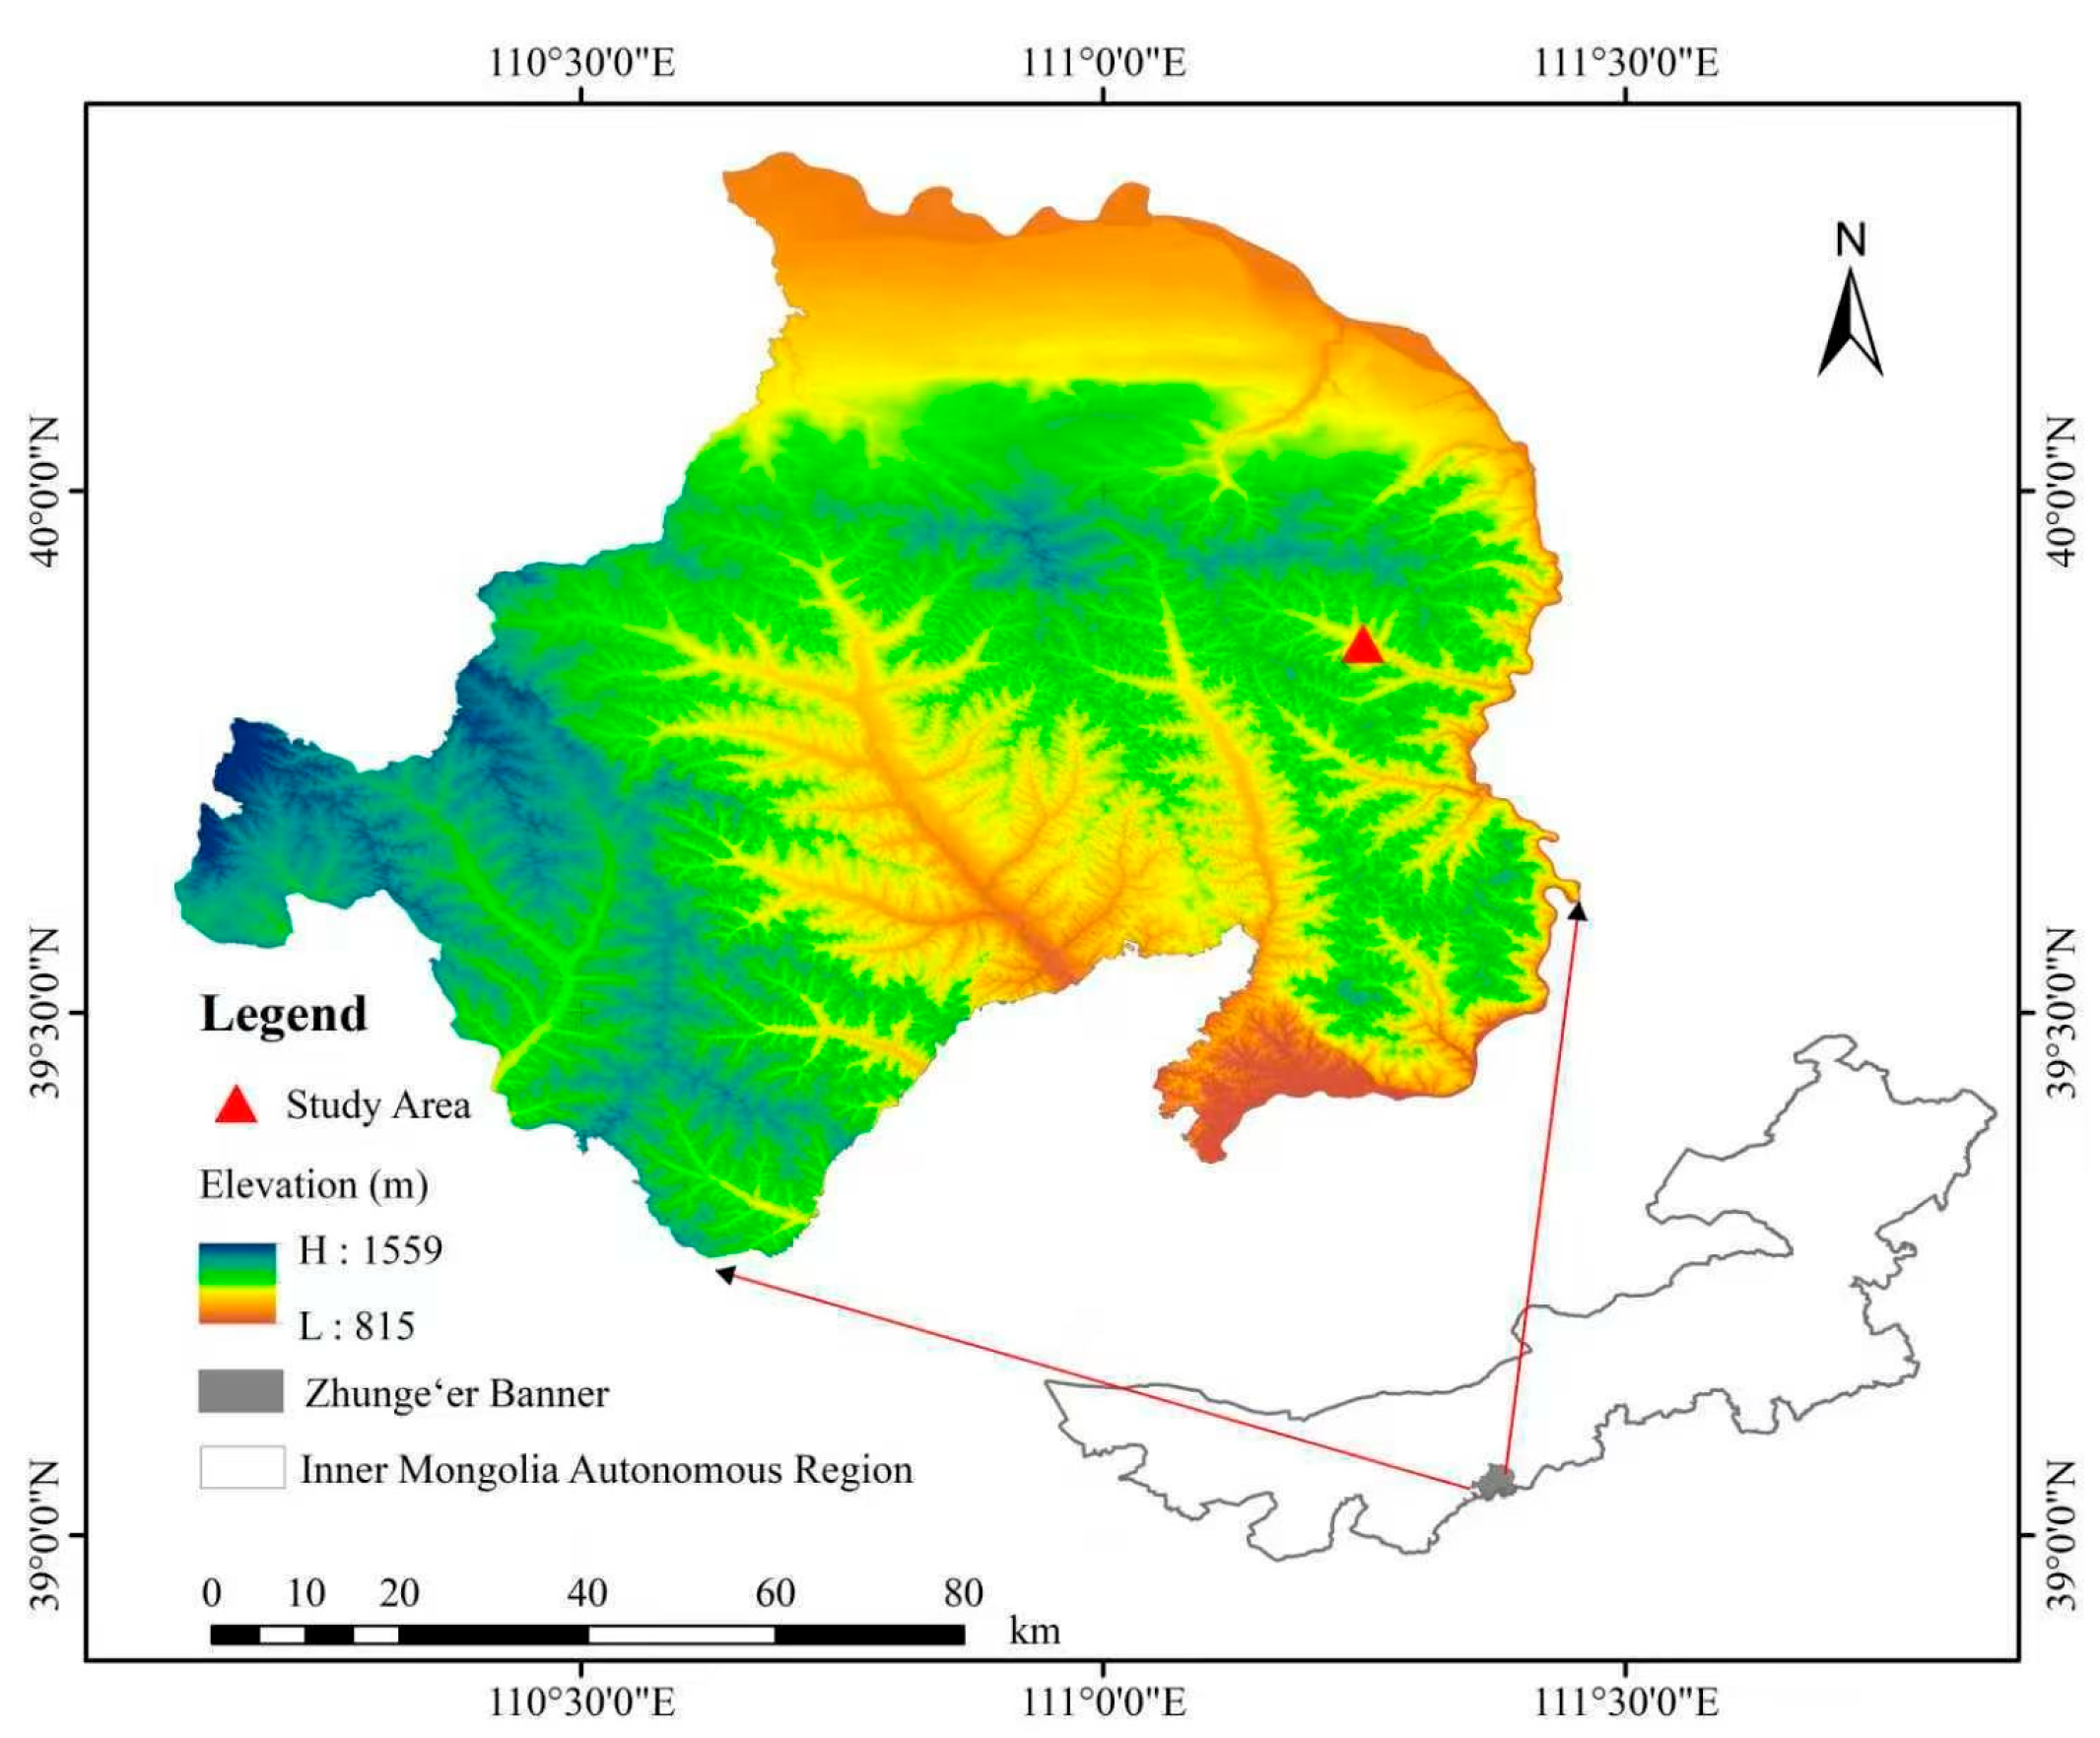
The study area is located in Xuejiawan Town in the northwest region, situated in the eastern part of Erdos City, Inner Mongolia Autonomous Region, and in the southeastern part of the Inner Mongolia Plateau, at the northern edge of the Loess Plateau. Its geographical coordinates are approximately between 39–40° N latitude and 110–111° E longitude (Figure 1). The region experiences a temperate semi-arid continental monsoon climate, with an average annual precipitation ranging from 350 to 400 mm. This value is significantly lower than the national average, reflecting its semi-arid climatic characteristics. Precipitation is concentrated in the summer months (June to August), particularly in July and August, when rainfall can account for more than 60% of the annual total, or even higher. Summer precipitation is mainly associated with short-duration, intense convective weather events, such as thunderstorms and heavy rain, which often have high intensity but short durations. The year 2025 is expected to be a once-in-sixty-years strong rainfall year for the region. From the perspective of regional climate background, the study area exhibits significant spatiotemporal variability in rainfall distribution, with a notable frequency of extreme rainfall events. Based on climate data released by the local meteorological station, this study specifically collected measured data from 60 rainfall events during the summer of 2025, covering all intensity levels from light rain to torrential rain. These data accurately reflect the rainfall characteristics of this extreme rainfall year, and their authenticity and timeliness can be traced, providing a highly representative empirical foundation for analyzing rainfall patterns.
Figure 1.
Overview of the Study Area.
2.2. Data Collection System Design and Construction
2.2.1. Overall Design Concept and System Composition
To achieve high-fidelity, low-noise collection of natural rainfall acoustic signals, this study independently designed and built a dedicated rainfall acoustic monitoring device. The core design concept of the device is to create an acoustically isolated environment, aimed at maximizing the capture of pure sound waves generated by raindrop impacts on a specific underlying surface, while systematically minimizing interference from environmental background noise. The entire device consists of three clearly defined functional components: the sound excitation and collection unit (umbrella top), the sound conduction and passive isolation unit (column body), and the core signal sensing unit (microphone). This integrated design ensures full-link optimization, from sound wave generation and conduction to collection.
2.2.2. Design and Selection of the Sound Excitation and Collection Unit
The core function of this unit is to provide a standardized, acoustically consistent, and reproducible rainfall impact surface. We selected industrial-grade aluminum foil with a thickness of 0.7 mm as the impact surface material, based on its comprehensive physical and acoustic properties. First, the aluminum foil is dense, effectively reducing lateral wave diffusion and energy loss. Second, its surface is extremely smooth, with a high sound wave reflection rate and very low absorption, particularly sensitive to high-frequency sound waves. Third, the material itself has good flexibility, making it easy to generate clear and consistent vibrations when excited by sound waves. Finally, aluminum foil offers excellent moisture resistance, corrosion resistance, and chemical stability, fully meeting the demands of long-term, complex environmental monitoring in outdoor settings. Structurally, the aluminum foil is precisely processed into a cone with a base perimeter of 77 cm and a constant slope angle of 35.5°. This uniform geometric shape is crucial for the reproducibility of the experiments, ensuring that the acoustic responses generated by raindrop impacts at different times have high comparability.
2.2.3. Construction of the Sound Conduction and Passive Noise Isolation Unit
This unit is the core of the system’s high signal-to-noise ratio (SNR) collection capability, designed to efficiently conduct sound waves along the axis while isolating wideband environmental noise. The sound conduction channel consists of a PVC pipe with an inner diameter of 75 mm, wall thickness of 2 mm, and height of 19 cm. The smooth inner wall of the PVC material, with its high sound wave reflection rate, effectively guides the sound waves along the pipe’s axial direction to the sensor at the bottom, minimizing signal attenuation. To isolate external noise, we designed a “sandwich” composite passive isolation system. First, a layer of high-density soundproof cotton, 2 cm thick and 15 cm high, is tightly wrapped around the outside of the PVC pipe. This layer primarily absorbs and attenuates high-frequency background noise from the environment. Next, six wooden strips, each with a cross-section of 1 cm × 1 cm, are equidistantly fixed around the outer side of the soundproof cotton. Another layer of soundproof cotton, of the same specification, is then wrapped around the wooden strips. This design ingeniously creates an annular sealed cavity between the two layers of soundproof cotton, supported by the wooden strips, effectively dissipating and isolating low-frequency environmental noise. Finally, a soundproof cotton ring with an outer diameter of 129 mm, an inner diameter of 79 mm, and a thickness of 2 cm is embedded from below, sealing the upper part of the annular cavity, thus forming a complete “inner-seal, outer-isolation” acoustic shield.
2.2.4. Integration of the Signal Sensing Unit and System Assembly
The signal sensing is carried out by a commercial high-sensitivity MEMS microphone with a sampling rate of 48 kHz. To minimize vibration noise transmitted through the structure, the microphone is mounted on a cylindrical soundproof cotton base with a diameter of 78 mm and a thickness of 6 cm, and then gently inserted from the bottom of the PVC pipe, positioned along the central axis of the pipe. The final step in system assembly involves sealing the top of the PVC pipe to the aluminum foil cone umbrella using neutral silicone sealant, ensuring that rainfall sound waves can only enter through the designated path. The system operates as follows: the sound waves generated by raindrops hitting the aluminum foil umbrella are efficiently conducted within the PVC pipe to the microphone at the bottom. Meanwhile, the composite barrier formed by soundproof cotton and the annular cavity on the outside of the device collaborates to filter out wideband environmental background noise, ranging from high to low frequencies, ultimately achieving ultra-high SNR collection of the target rainfall acoustic signal.
2.3. Field Experiments and Synchronous Data Collection Protocol
2.3.1. Sampling Site Selection and Environmental Assessment
To establish a universally applicable acoustic feature-rainfall intensity relationship model, the field data collection for this study was conducted at the standard sports field in the Zhungeer Coalfield Park, Inner Mongolia Autonomous Region. The selection of this sampling site underwent a rigorous evaluation: First, the site is completely flat and open, ensuring uniform precipitation collection and avoiding rainfall intensity distribution disparities caused by topography. Second, the site is located far from major traffic routes and densely populated residential areas, minimizing interference from human activity noise. Third, there are no tall buildings or trees nearby that could obstruct the rainfall, ensuring that the rainfall process remains undisturbed and represents typical precipitation scenarios in the open landscapes of the semi-arid region of Northwest China. This site selection maximizes the “purity” and regional representativeness of the collected data.
2.3.2. Synchronized Data Collection Protocol
To achieve precise temporal matching between audio signals and physical rainfall parameters, we established a strict synchronized data collection protocol. The core of the protocol is parallel dual measurement: First, the microphone within the monitoring device is activated to continuously record audio in WAV lossless format at a 48 kHz sampling rate. Second, a standard secondary cylindrical rain gauge with a known receiving area of 1256 cm2 is placed strictly level beside the acoustic device to collect physical rainfall data. Both measurements start and end simultaneously. After each collection event, the accumulated water volume in the rain gauge is immediately measured using a precise graduated cylinder (resolution 0.1 mL), and the average rainfall intensity (mm/h) during the recording period (usually 5–15 min) is calculated based on the exact duration of the recording.
2.3.3. Data Labeling and Dataset Construction
Each collection event generates a unique audio file along with its corresponding rainfall intensity value. We use the format “date_time_rainfall intensity” for consistent numbering and storage of the data, thereby constructing a strictly synchronized, one-to-one “audio-rainfall intensity” paired raw database. To enhance the dataset’s diversity and improve the model’s generalization ability, we conducted multiple rounds of sampling under various scenarios, deliberately covering a continuous intensity spectrum from light rainfall to moderate, heavy, and torrential rain. Additionally, to facilitate subsequent signal preprocessing, we collected long-duration pure environmental background noise samples on several dry days without rainfall, which were used to analyze the device’s baseline noise and inherent non-rainfall acoustic features from the environment.
2.3.4. Overview of the Raw Dataset
Through the systematic and standardized data collection approach outlined above, we ultimately constructed a high-quality, high-consistency foundational dataset. This dataset not only provides direct input for subsequent audio signal preprocessing (such as denoising and feature extraction) but also lays a solid and reliable data foundation for training deep learning models capable of accurately inverting rainfall intensity. The entire research methodology, from precision hardware design to rigorous field experiments, ensures the scientific and verifiable nature of the data representation, bridging the gap between physical phenomena and data characterization.
3. Results
3.1. Rainfall Audio Analysis
This study examines the relationship between rainfall intensity and acoustic features based on audio data from 60 rainfall events. The range of rainfall intensity spans from 0.19 mm/h to 132.4 mm/h, representing a wide distribution from light rain to extreme downpours. The average rainfall intensity of the data is 8.2 mm/h, with a standard deviation of 17.6 mm/h, indicating substantial variability in rainfall intensity, particularly during extreme rainfall events, where the intensity fluctuates significantly.
As shown in Table 1, there is a significant correlation between rainfall intensity and several acoustic features, such as sound pressure level and energy density. Specifically, as rainfall intensity increases, the total acoustic energy also increases notably, with a more pronounced change in acoustic energy during heavy and extreme rainfall events.
Table 1.
Statistical Data of Rainfall Intensity and Audio Features.
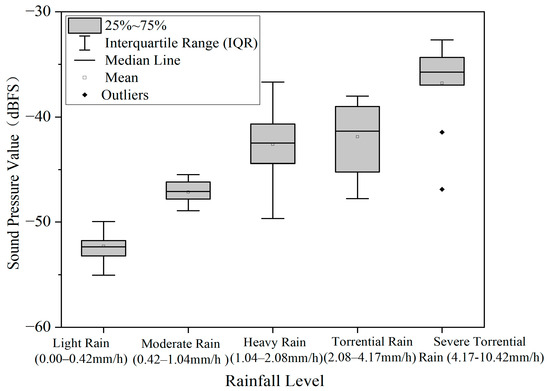
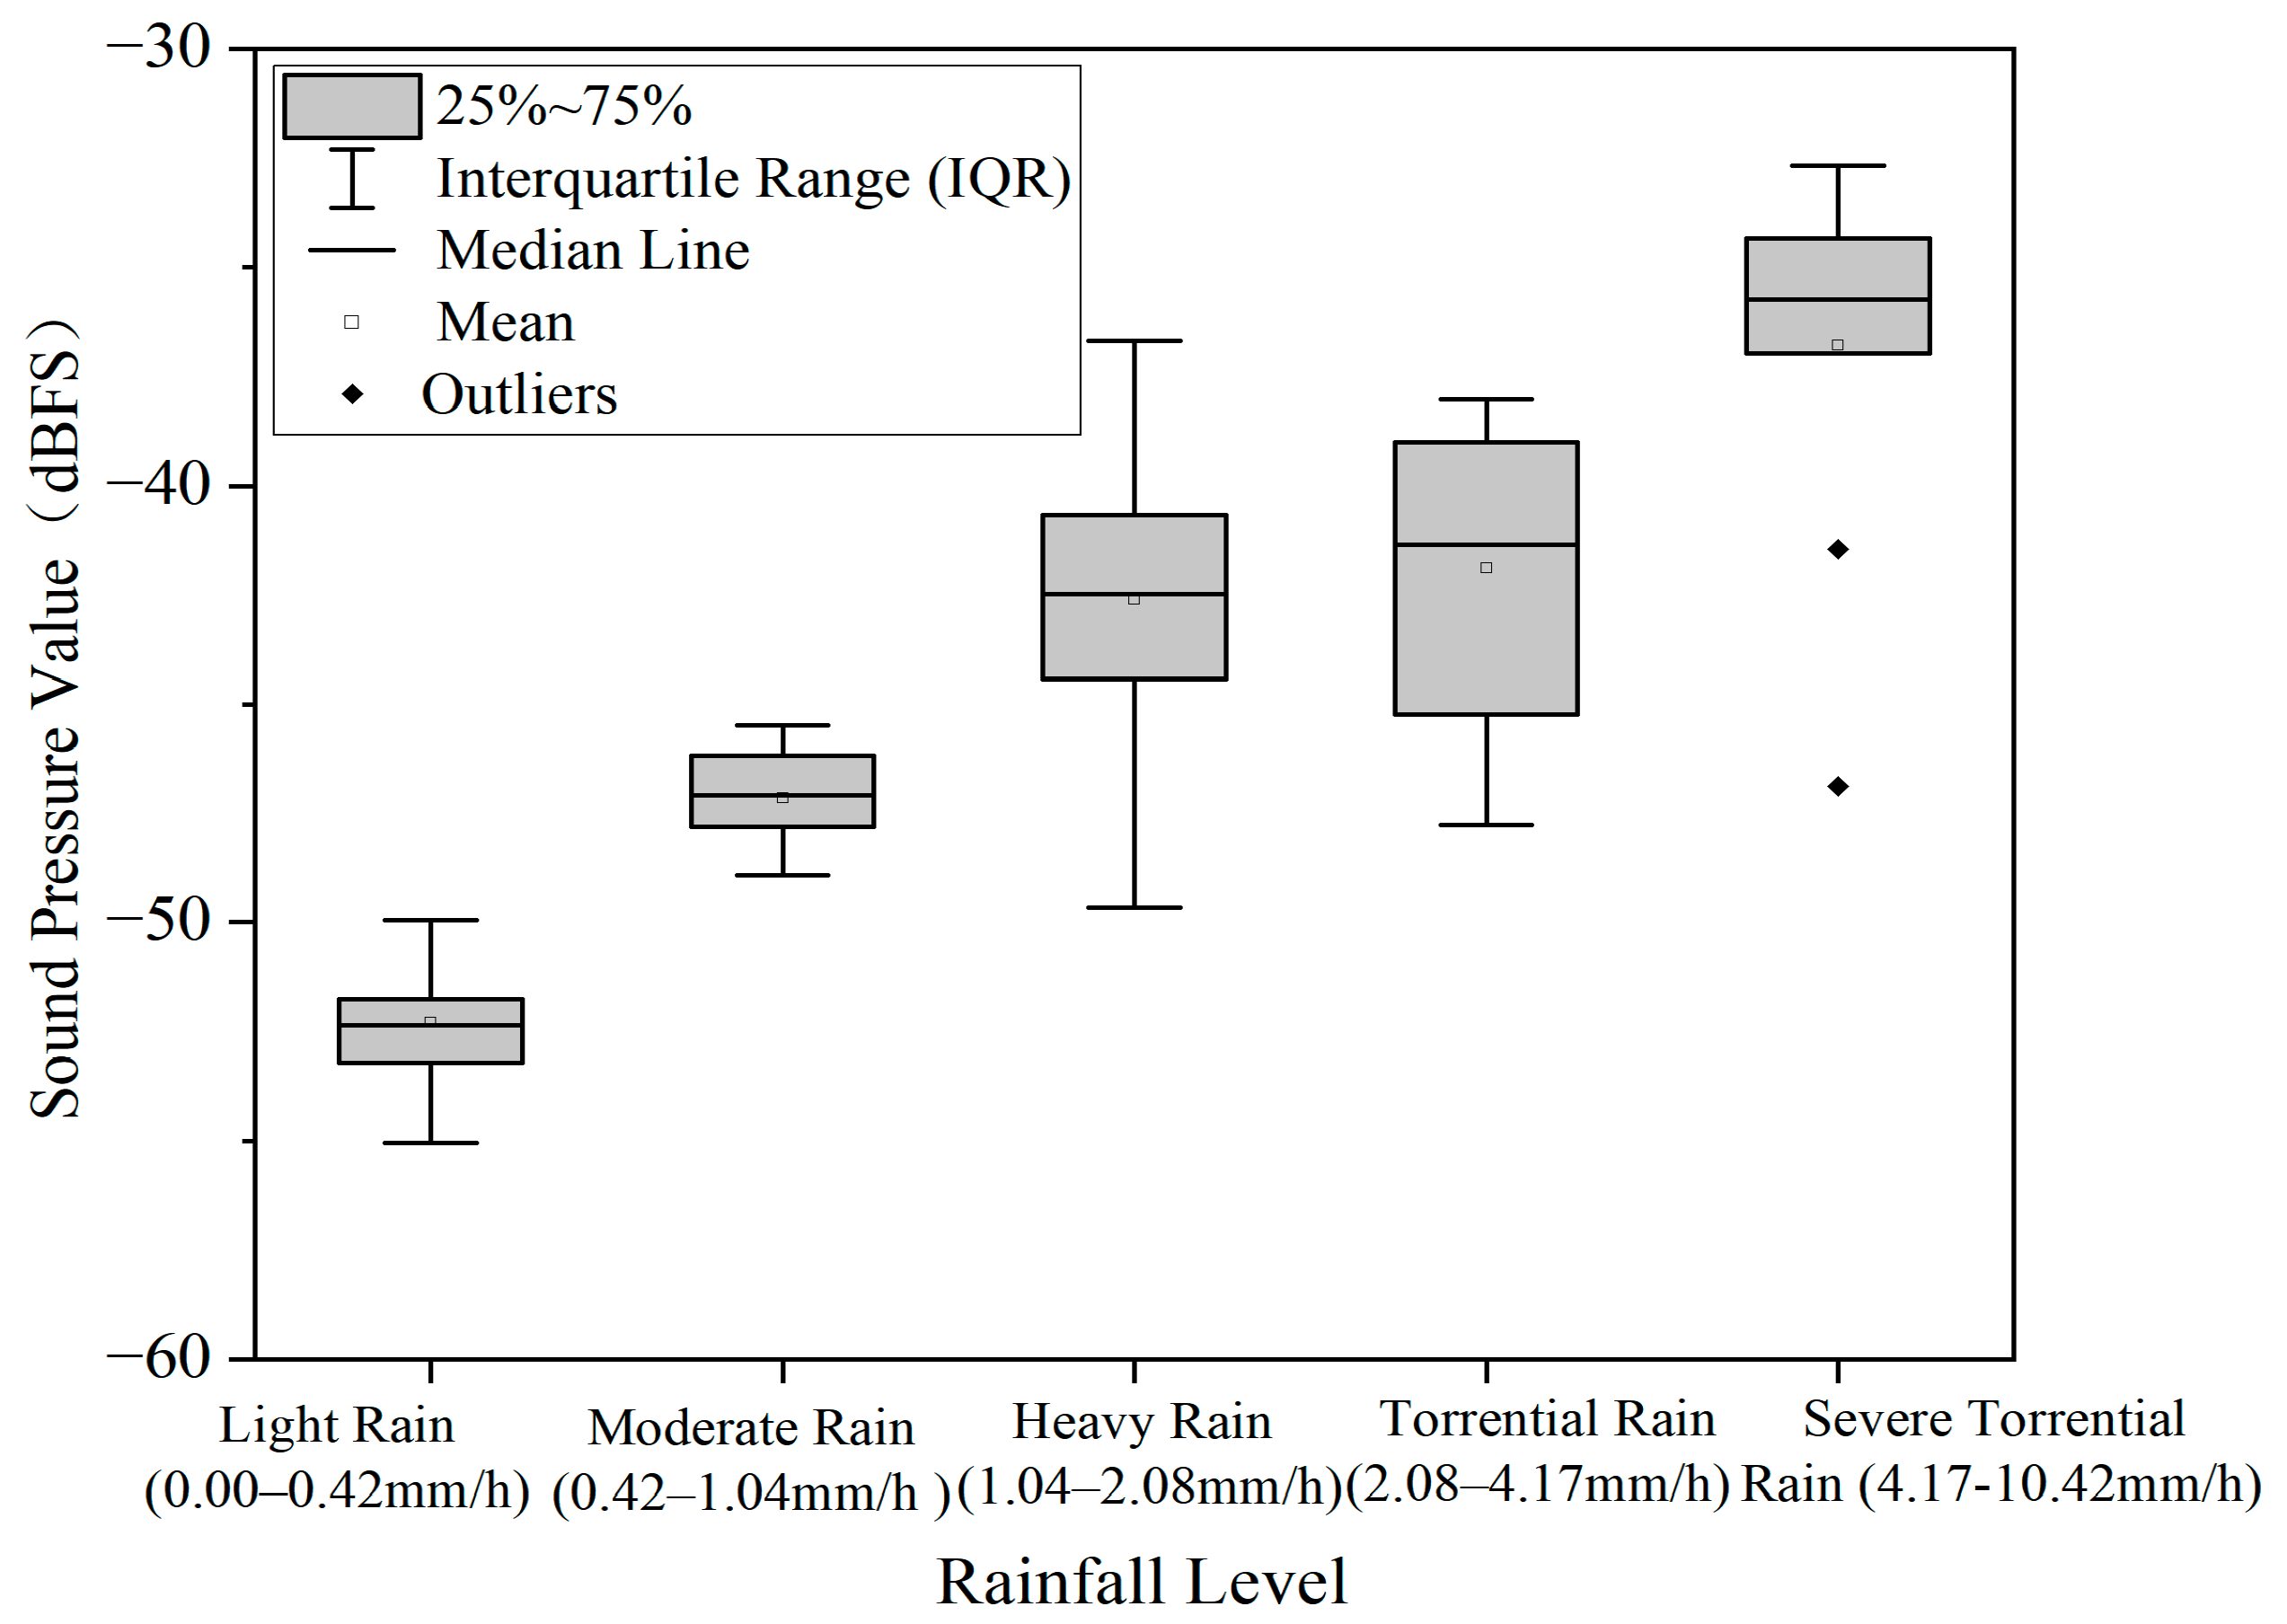
Further analysis of the relationship between rainfall intensity and sound pressure reveals a strong positive correlation, as shown in Figure 2 (r = 0.916, R2 = 0.838). From the figure, it can be observed that for every 1 mm/h increase in rainfall intensity, the sound pressure increases by an average of 0.31 dBFS. This indicates that sound pressure effectively reflects changes in rainfall intensity, particularly during extreme rainfall events (such as torrential rain), where the increase in sound pressure carries significant early warning implications. For example, the sound pressure of torrential rain (−38.12 dBFS) is 15.19 dBFS higher than that of light rain (−53.31 dBFS), representing an increase of 37.3%. This difference clearly demonstrates that sound pressure is an effective indicator for monitoring rainfall intensity.
Figure 2.
Sound Pressure Level at Different Rainfall Intensities.
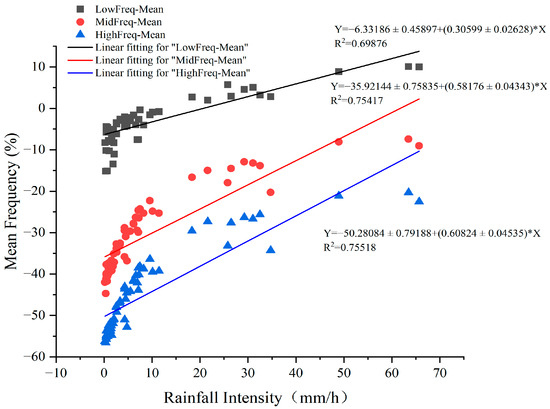
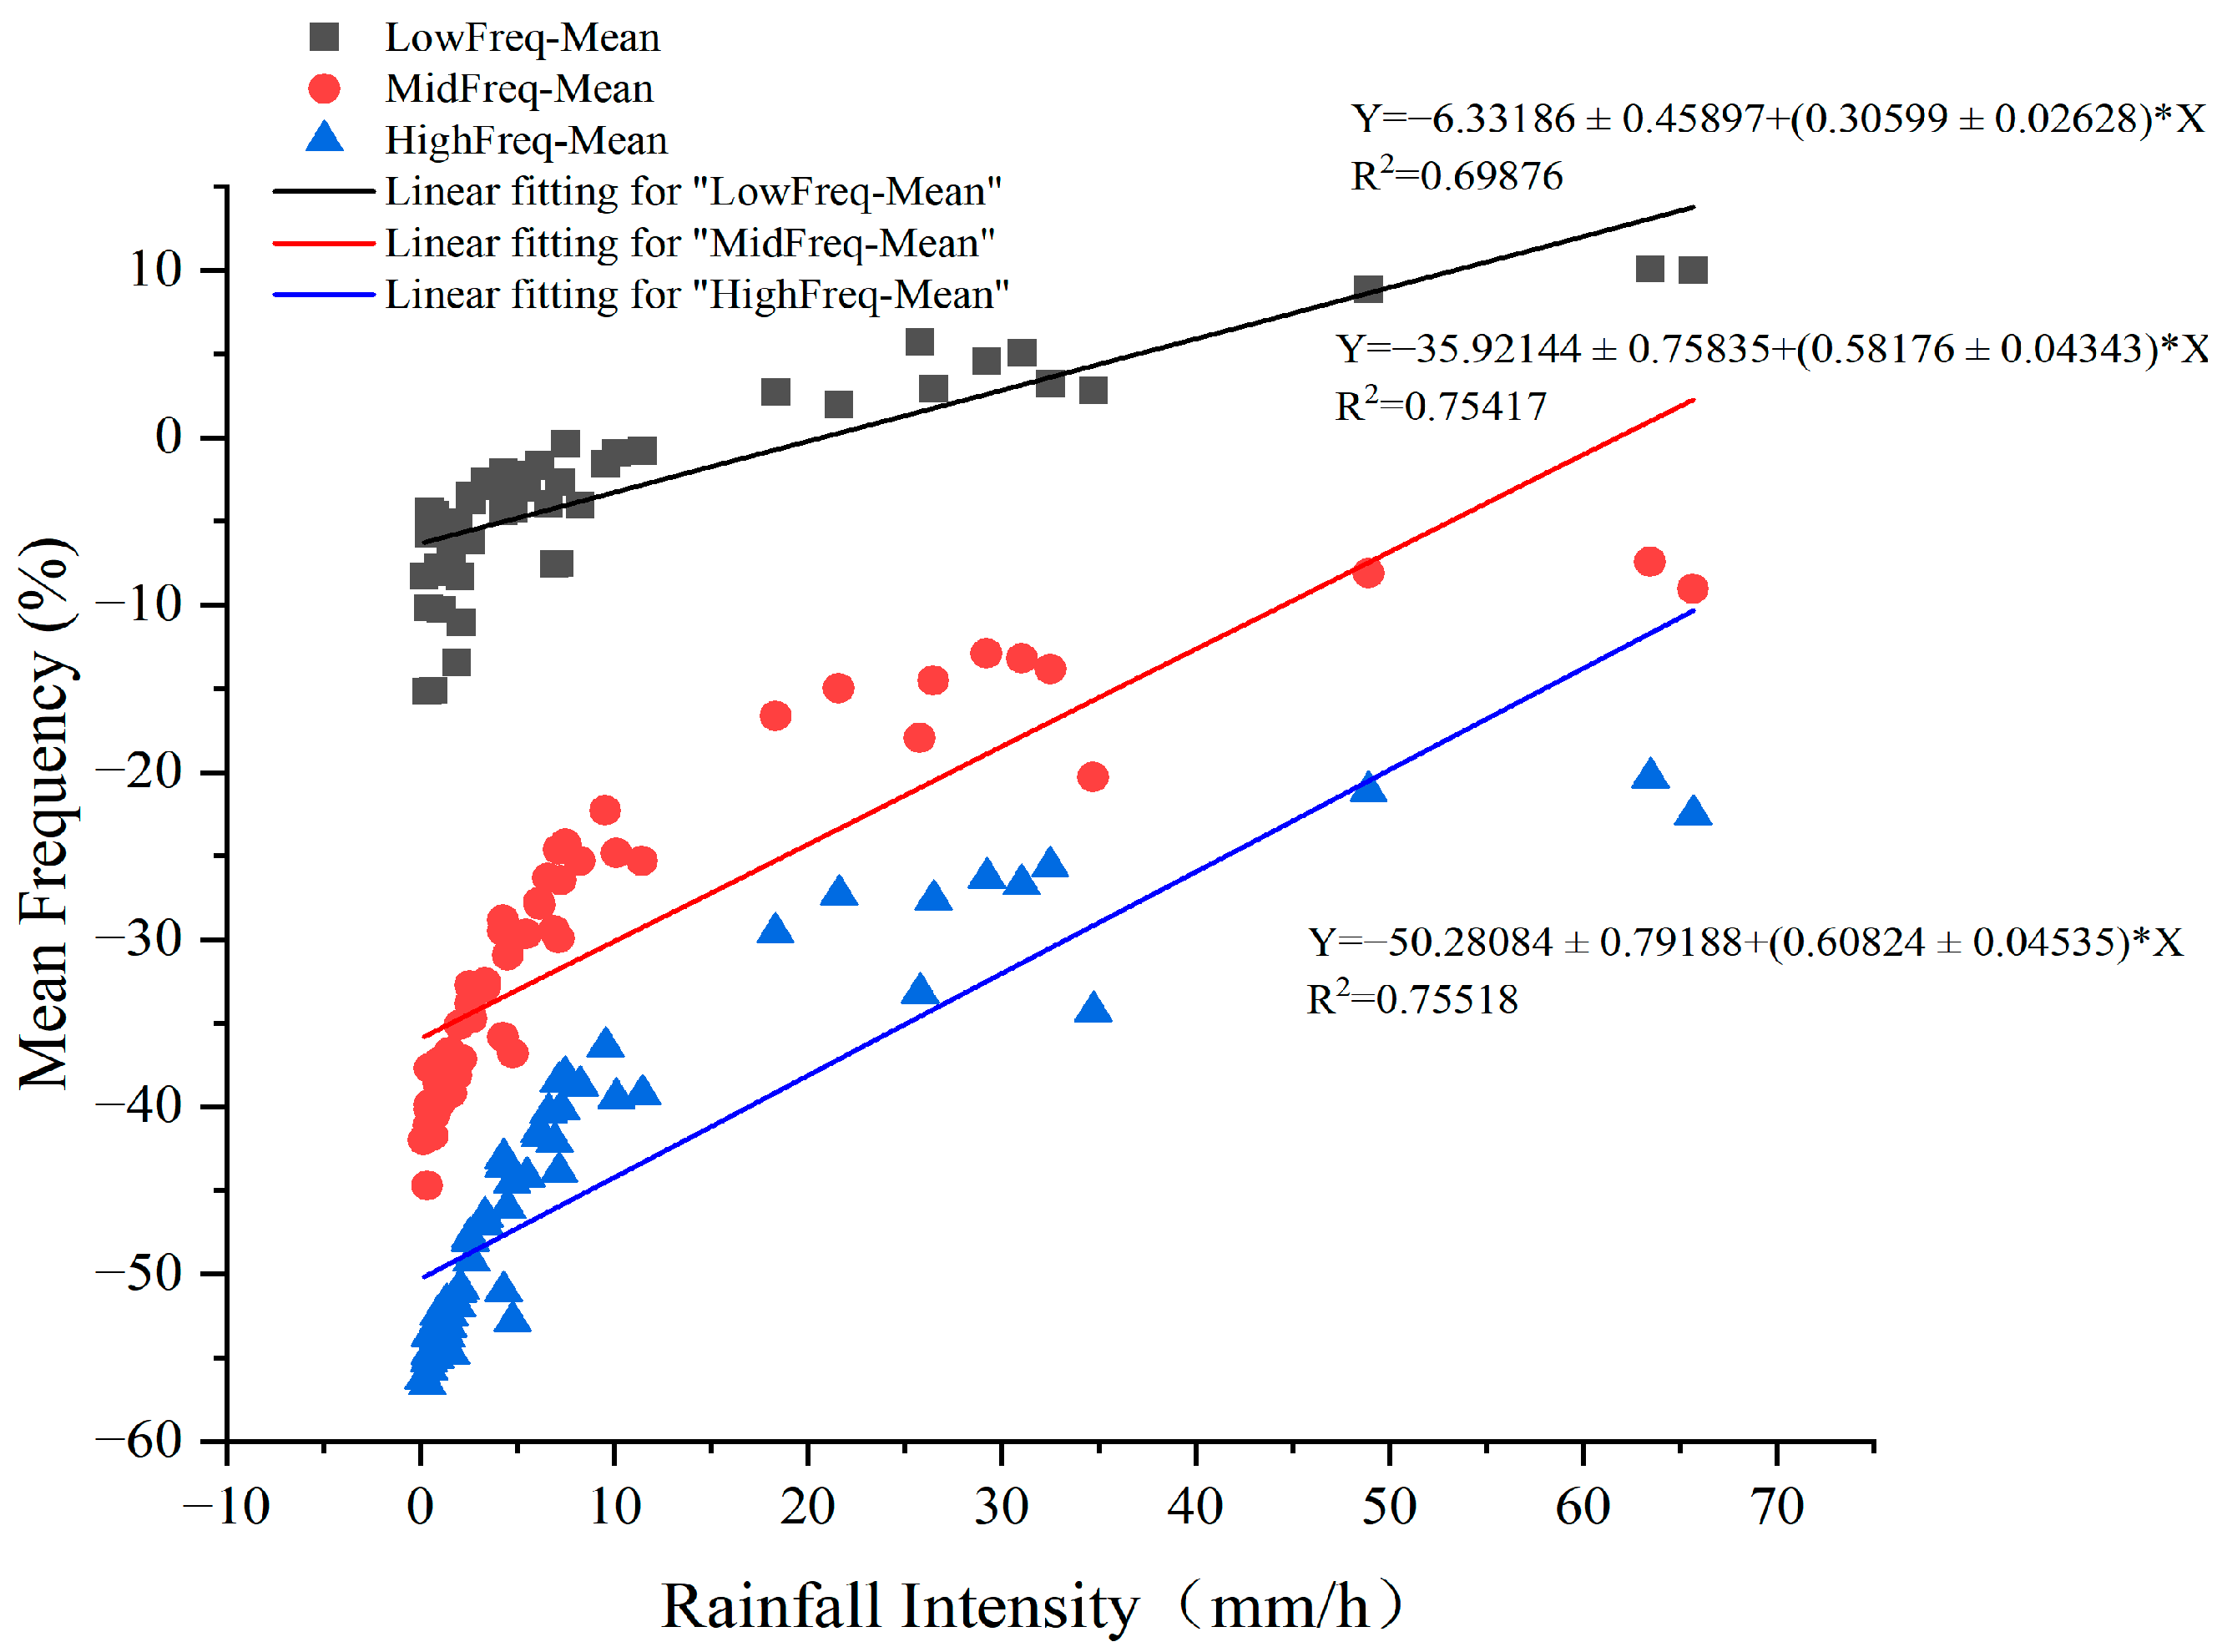
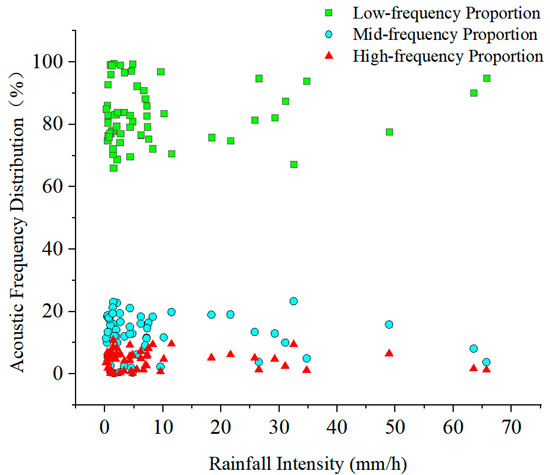
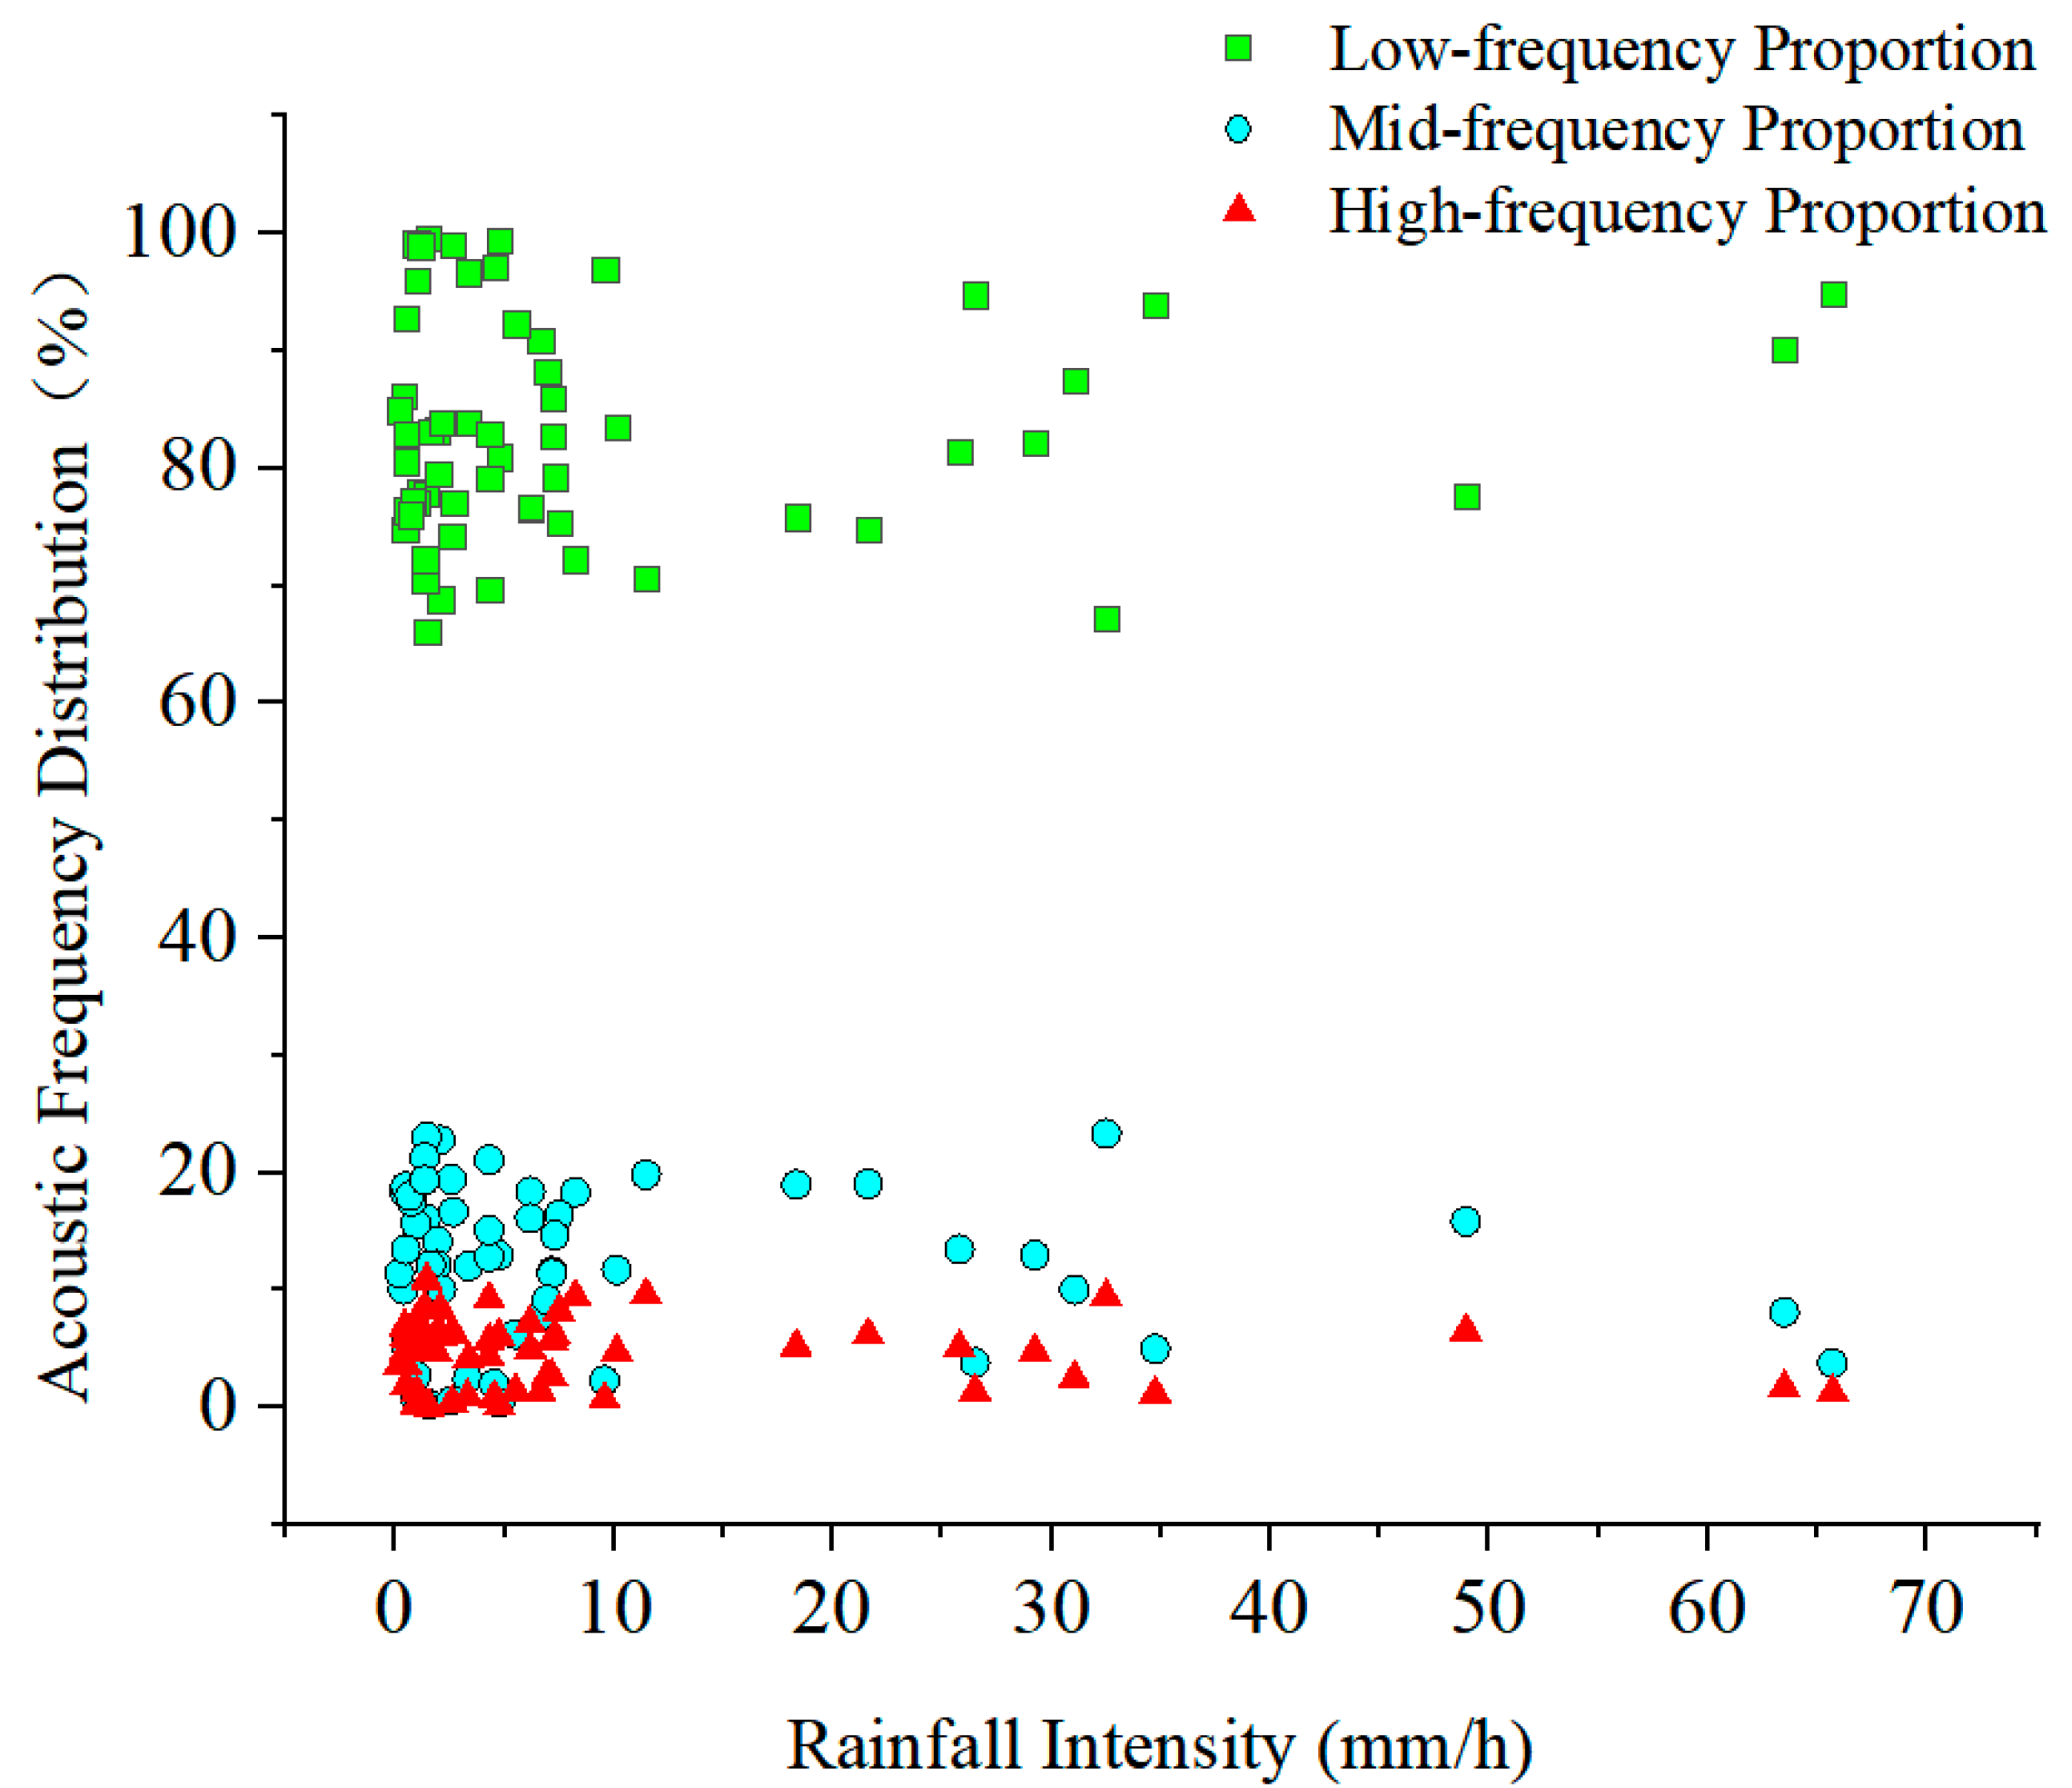
In addition to sound pressure, the impact of rainfall intensity on frequency band distribution is also noteworthy. Figure 3 shows the energy distribution across low, mid, and high frequencies under different rainfall intensities. As illustrated in the figure, low-frequency components dominate the acoustic signal of rainfall, with the average low-frequency ratio being 83.0%. However, as rainfall intensity increases, the proportion of energy in the mid-frequency range rises, especially during heavy rainfall, where the proportion of mid-frequency energy significantly increases. This indicates that during intense rainfall, the role of mid-frequency components becomes more pronounced, although low frequencies still remain dominant.
Figure 3.
Impact of Rainfall Intensity on Frequency Band Energy Ratio.
These changes are further validated by the statistical data in Table 1. The low-frequency ratio remains high and relatively stable, while the proportions of mid-frequency and high-frequency energy change with increasing rainfall intensity, particularly during heavy rainfall events. This further highlights the complex relationship between rainfall intensity and acoustic frequency distribution, with changes in frequency band structure being especially prominent under extreme rainfall conditions. In conclusion, there is a strong nonlinear relationship between rainfall intensity and acoustic features, with significant variations observed in acoustic parameters such as sound pressure level, energy density, and frequency distribution, especially during extreme rainfall events.
3.2. Analysis of the Relationship Between Rainfall Intensity, Energy Density, and Sound Pressure
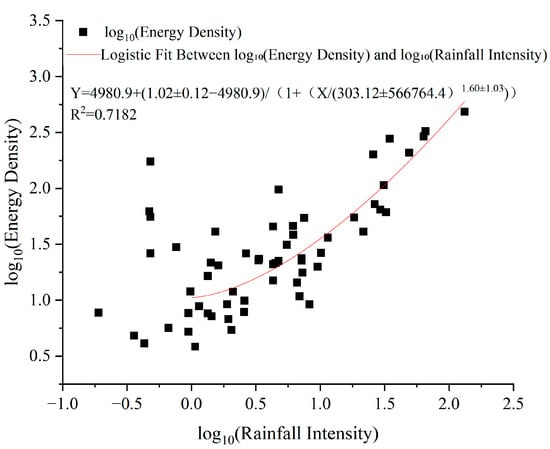
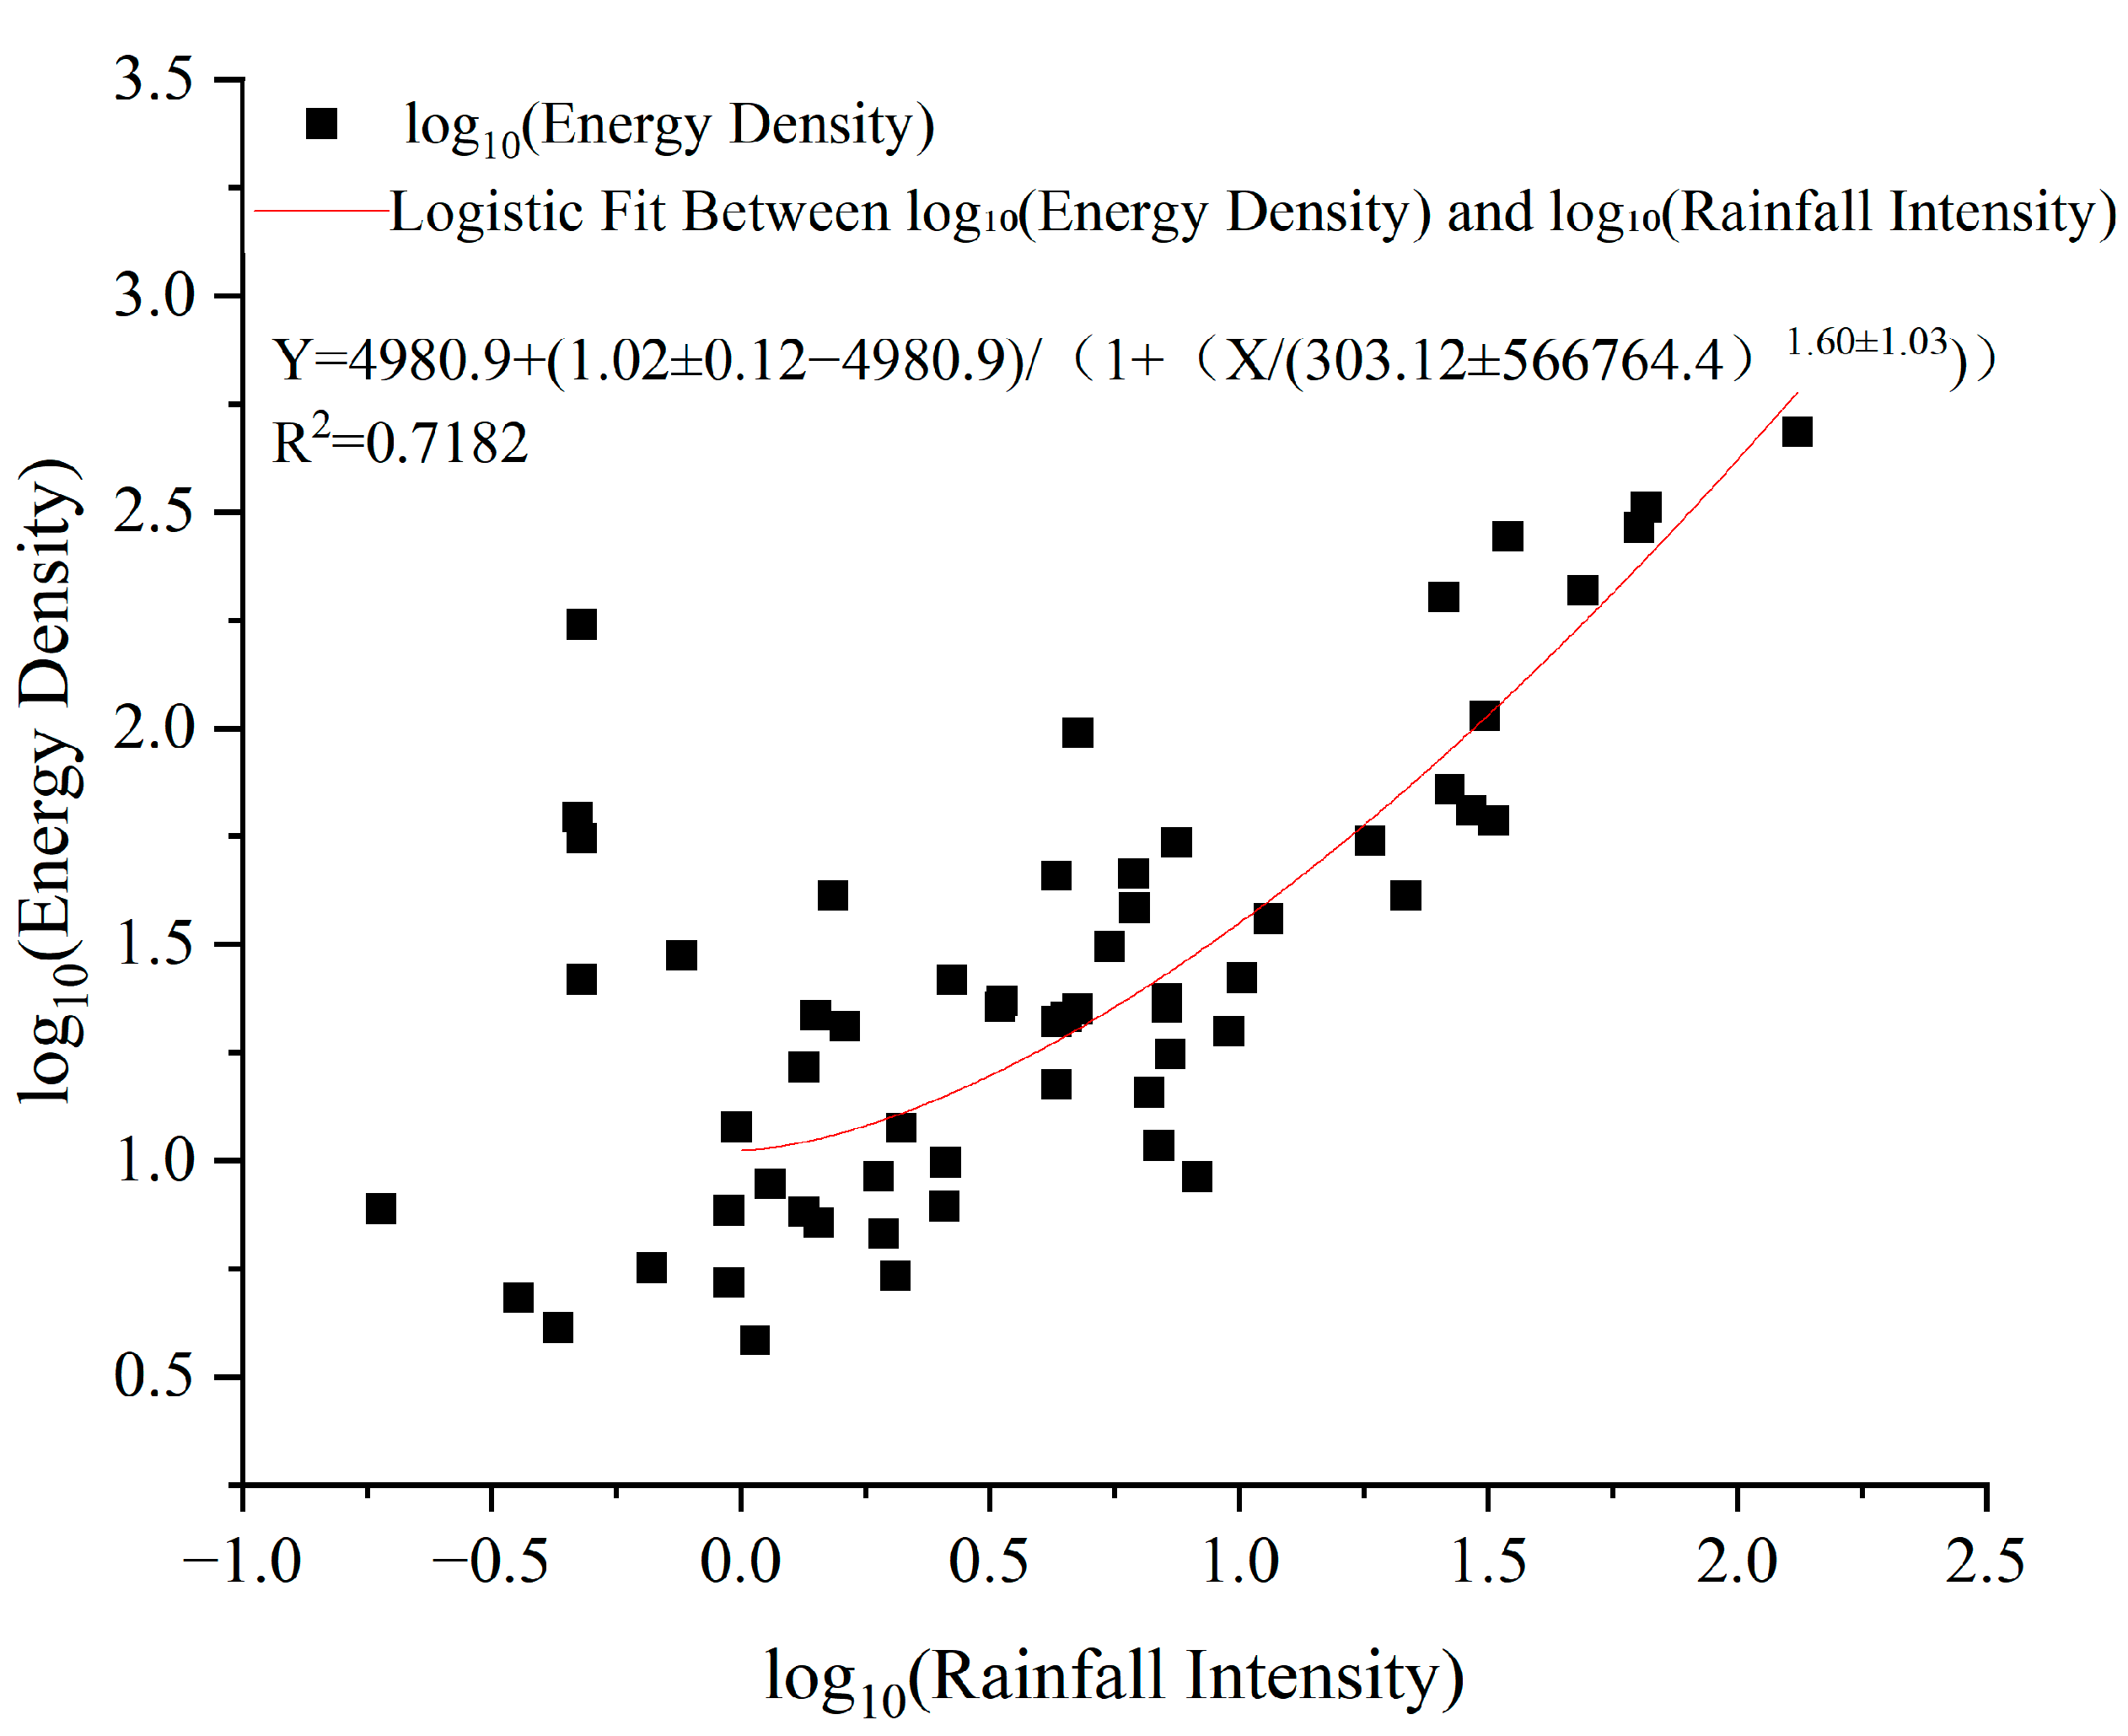
In this study, we observed a significant nonlinear relationship between energy density and rainfall intensity, particularly under extreme weather conditions. To better capture this relationship and ensure the accuracy of the model, we applied a logarithmic transformation to the raw data. The reasons for using a logarithmic transformation are as follows: First, it linearizes the nonlinear relationship. The raw data exhibited a clear nonlinear trend, especially when the range of changes in rainfall intensity and energy density was large. The logarithmic transformation can convert this nonlinear relationship into a linear one, making the fitting model simpler and more stable. In extreme cases, where rainfall intensity is either very high or low, the logarithmic transformation helps reduce the influence of outliers, stabilizing the variance of the data. Second, the model fitting improves with this transformation. When the data span is large (e.g., when rainfall intensity ranges from light to heavy rain), directly using the raw data can result in inaccurate fitting. By applying the logarithmic transformation, the relationship between energy density and rainfall intensity becomes clearer, leading to more accurate fitting and better explanatory power for the model. After the transformation, the coefficient of determination (R2) of the fitting results significantly increased, indicating that the transformed data better reflect the correlation between the two variables. Moreover, the transformation improved the interpretability and comparability of the data. Extreme values in the raw data may cause certain values to be overly prominent, affecting the overall model performance. The logarithmic transformation reduces these extreme values to a more suitable range, making the differences between data points easier to compare and analyze.
From the data in Figure 4, it can be observed that at lower rainfall intensities (<1 mm/h), the energy density changes relatively slowly. However, when the rainfall intensity exceeds 4 mm/h, the rate of increase in energy density accelerates significantly. This indicates a strong positive correlation between rainfall intensity and acoustic energy density, with higher rainfall intensities leading to a notable increase in acoustic energy.
Figure 4.
Rainfall-Driven Scaling of Acoustic Energy Density.
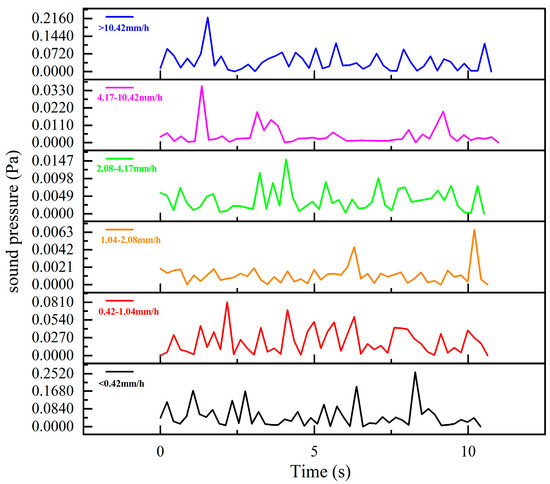
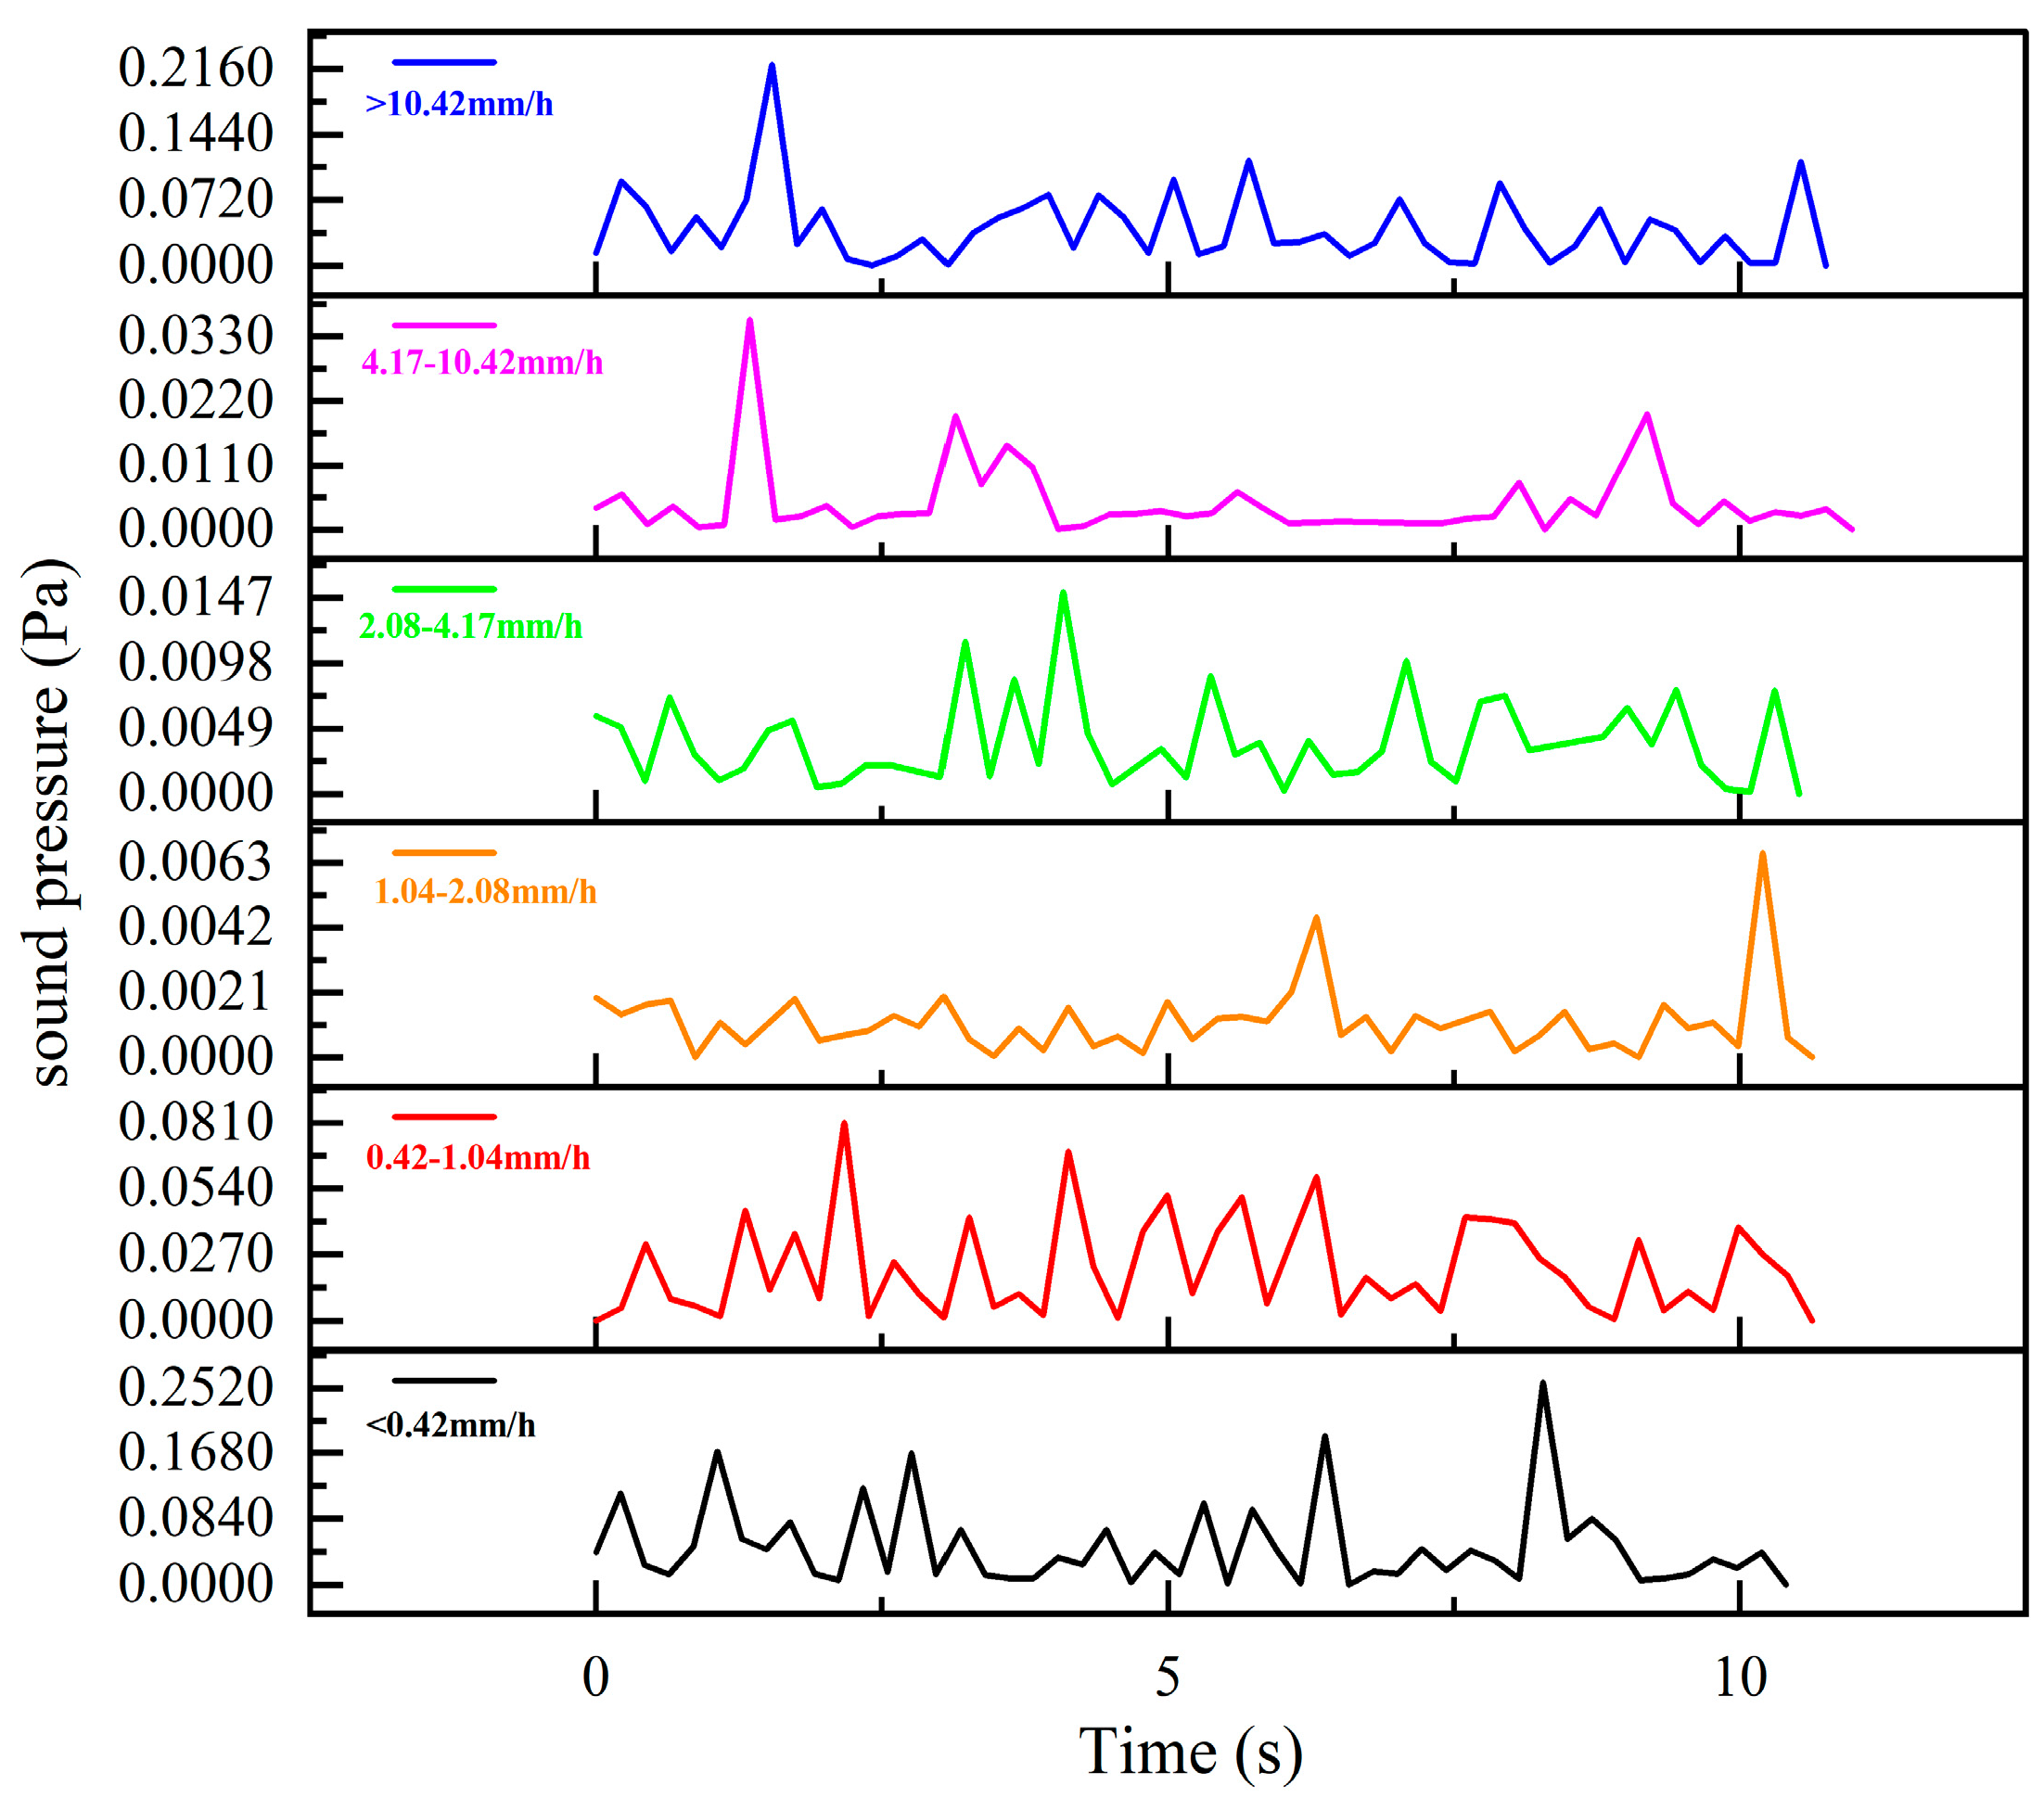
Further analysis in Figure 5 illustrates the variation in sound pressure over time at different rainfall intensities. As rainfall intensity increases, the fluctuation of sound pressure increases significantly, particularly during torrential rain (>10.42 mm/h), where the peak sound pressure is noticeably higher than in other rainfall categories. For example, during torrential rain, the maximum sound pressure can reach 0.2160 Pa, while during light rain, the sound pressure is only 0.0840 Pa. This difference suggests that higher rainfall intensity generates stronger acoustic signals with larger fluctuations.
Figure 5.
Time Series of Sound Pressure Under Different Rainfall Intensity Classes.
Based on the results from Figure 4 and Figure 5, the relationship between rainfall intensity, sound pressure, and energy density indicates that rainfall intensity not only affects the sound pressure level but also influences the overall strength of the rainfall signal by increasing acoustic energy density. Particularly during heavy and extreme rainfall, the significant changes in energy density and sound pressure provide an effective reference for real-time rainfall intensity monitoring.
3.3. Monitoring of Rainfall Intensity Based on Rainfall Acoustic Features
This study further explores the feasibility of constructing a rainfall intensity prediction model based on rainfall audio features, particularly sound pressure and frequency band distribution characteristics. Through systematic analysis of audio signal features under different rainfall intensities, we reveal the intrinsic relationship between audio signals and rainfall intensity, and based on this, we construct the corresponding prediction model.
Firstly, Figure 6 illustrates the relationship between rainfall intensity and frequency distribution, focusing on the distribution characteristics of low, mid, and high-frequency components. The study found that, in most rainfall events, low-frequency components dominate, especially when the rainfall intensity is low, with the low-frequency ratio significantly higher than that of mid and high frequencies. However, as rainfall intensity increases, the proportion of mid-frequency components gradually rises, showing a significant increase during heavy rainfall. The data in Figure 5 indicate that the low-frequency ratio is negatively correlated with rainfall intensity, while the proportions of mid and high frequencies increase progressively with the intensification of rainfall, further demonstrating the profound impact of rainfall intensity on the acoustic frequency spectrum distribution.
Figure 6.
Rainfall-Dependent Partitioning of Acoustic Frequency Bands.
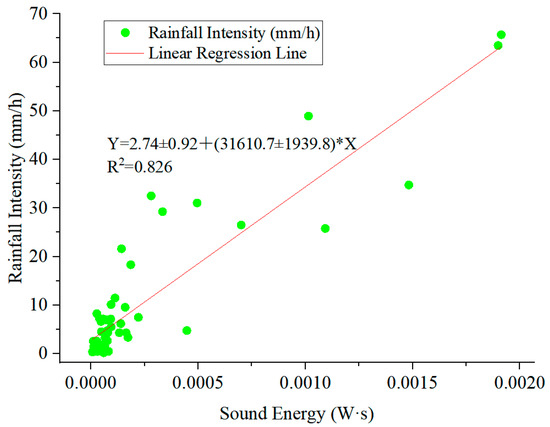
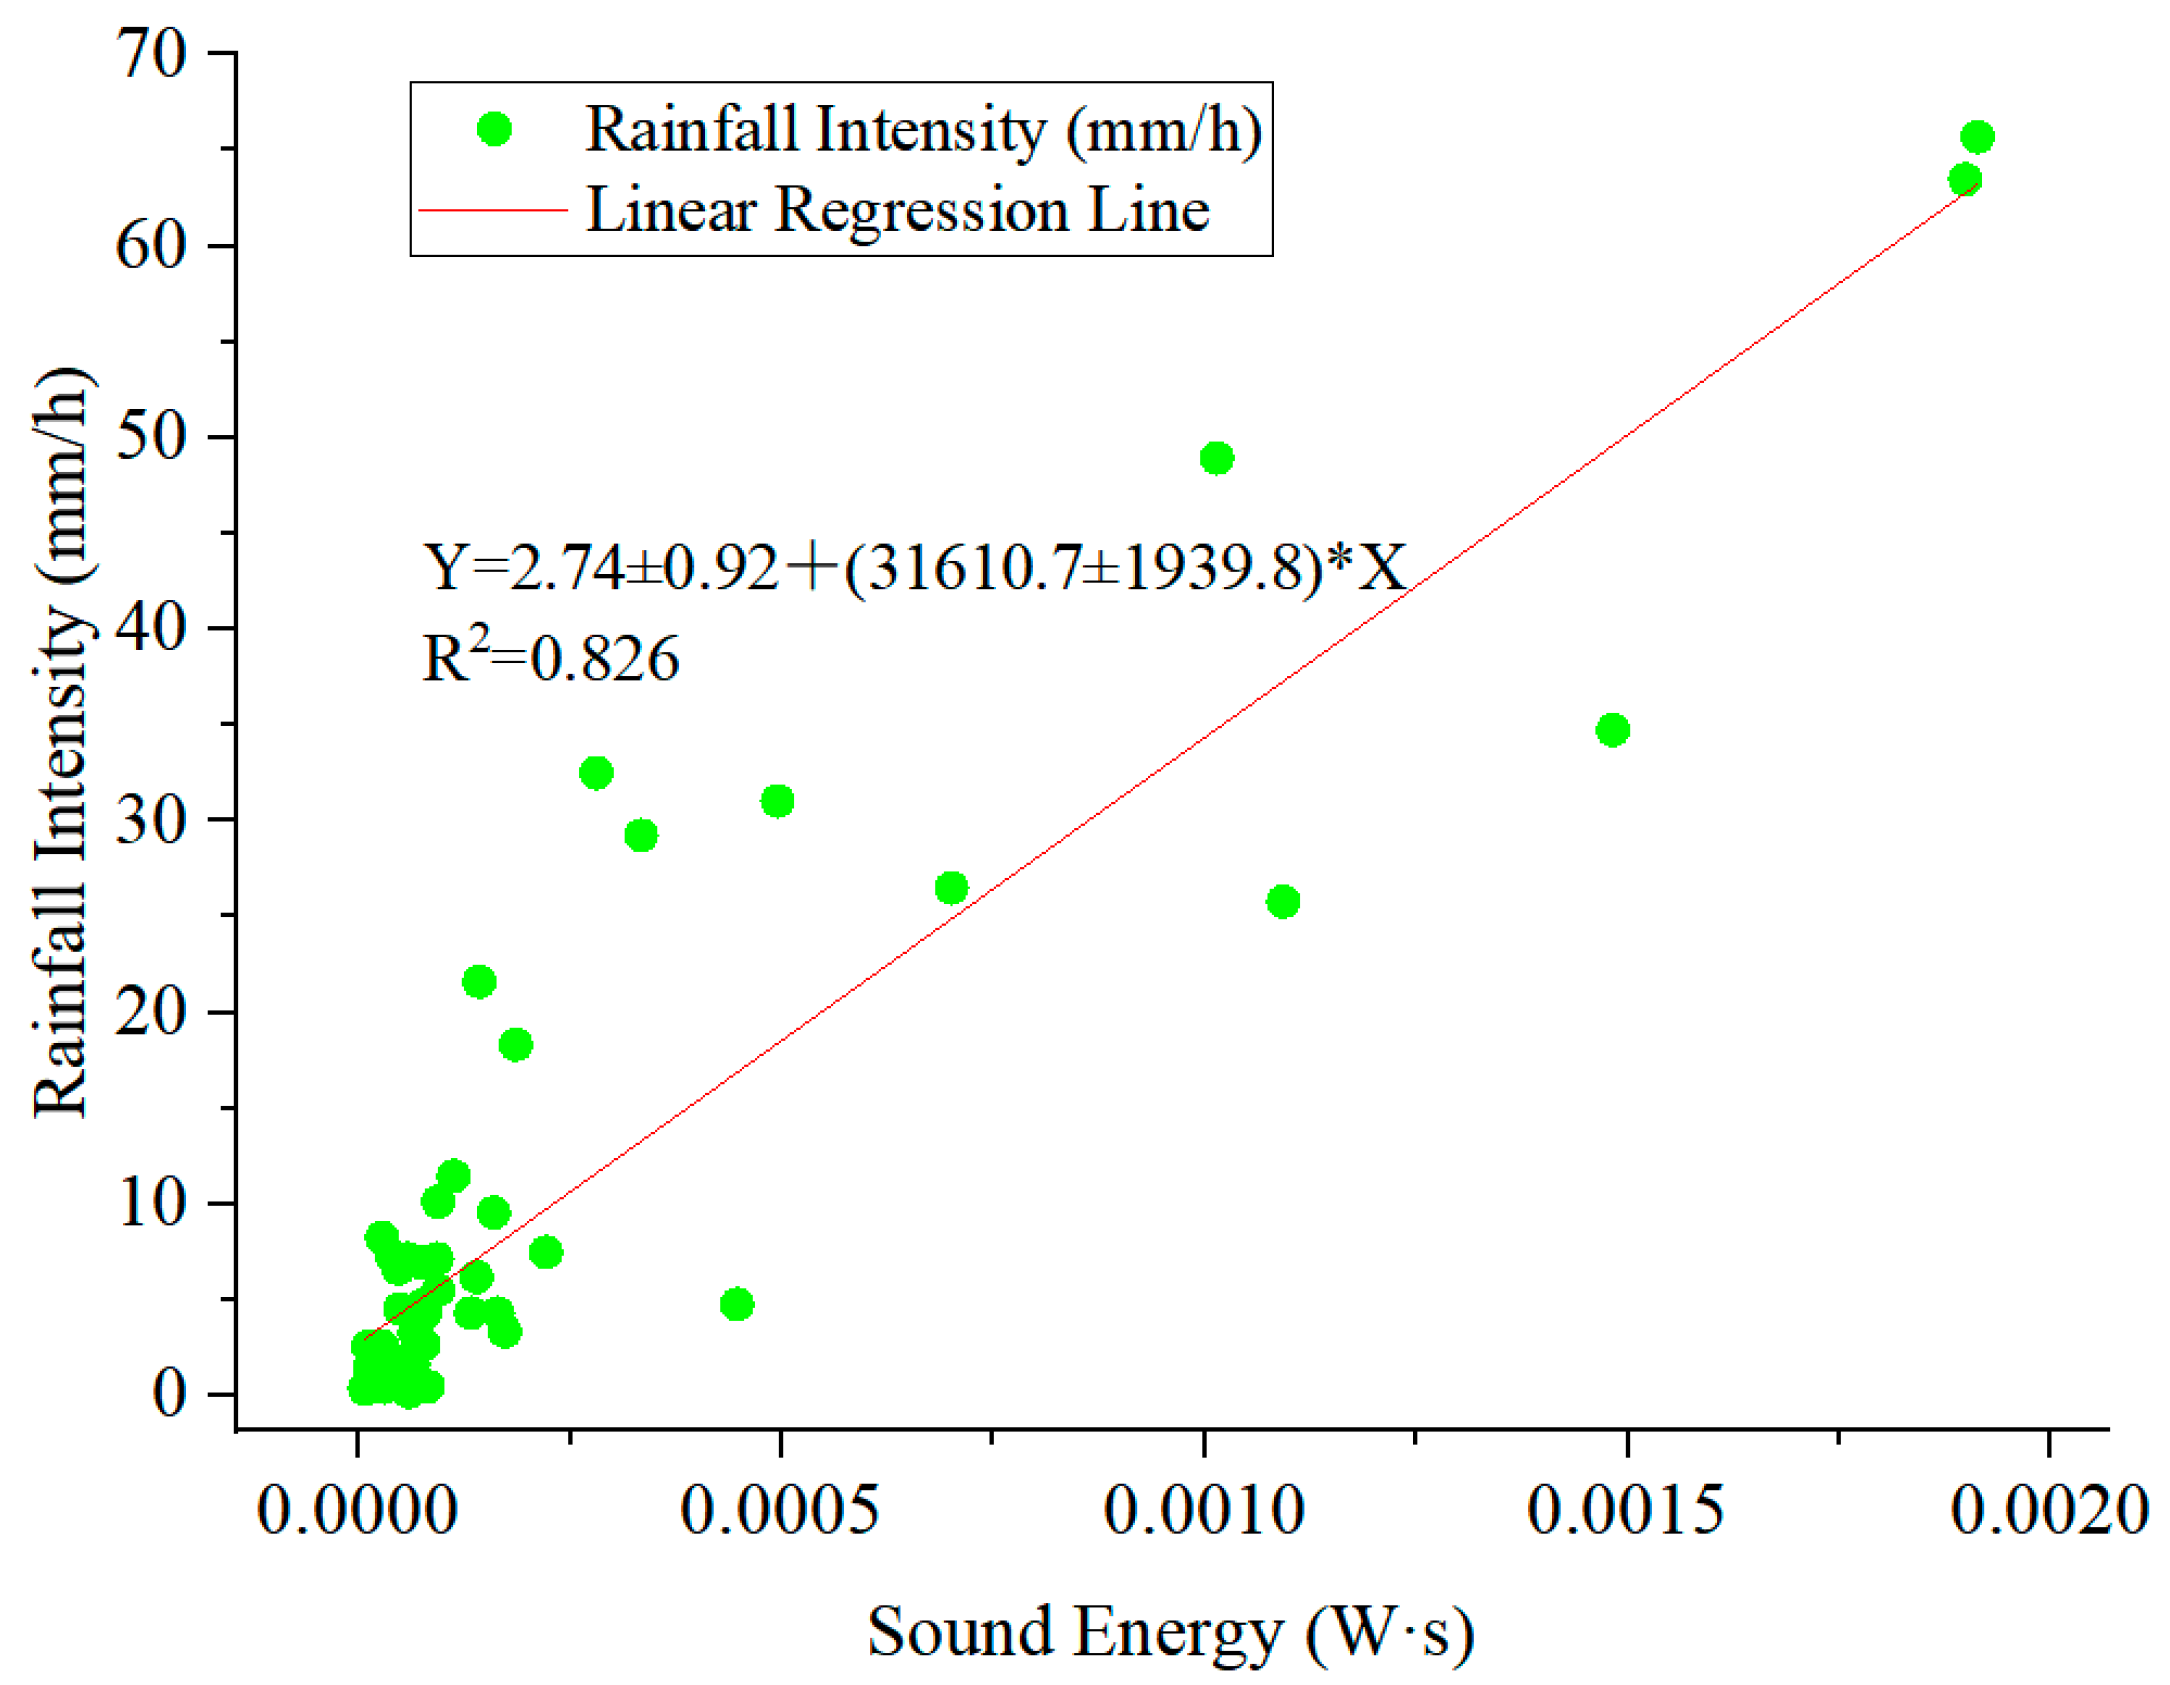
Furthermore, Figure 7 reveals the relationship between sound energy and rainfall intensity. Through regression analysis, we established a significant linear relationship between sound energy and rainfall intensity, with the regression equation achieving a high fit (R2 = 0.826). This finding indicates that sound energy is not only an important indicator of rainfall intensity but also exhibits a more predictable trend during heavy rainfall. The high degree of fit further validates the effectiveness of sound energy in real-time rainfall intensity prediction. Specifically, under heavy rainfall or extreme weather conditions, the dynamic changes in sound energy provide crucial data for evaluating rainfall intensity.
Figure 7.
Linear Relationship Between Sound Energy and Rainfall Intensity.
Based on the analysis of Figure 6 and Figure 7, a clear nonlinear relationship exists between rainfall intensity and the acoustic features of audio signals, with this relationship exhibiting different characteristics across various rainfall levels. Specifically, during periods of higher rainfall intensity, the changes in the audio signal demonstrate a more pronounced and predictable pattern, providing an effective basis for predicting rainfall intensity. By integrating audio features such as sound pressure, sound energy, and frequency distribution, this study has developed a rainfall intensity prediction model based on sound signals, which shows promising predictive performance and high accuracy.
Furthermore, the regression analysis results of this study further highlight the significant potential of the audio-based rainfall intensity prediction model for practical applications. Particularly during heavy rainfall events, the model has demonstrated strong adaptability and reliability, offering a scientific basis for real-time rainfall monitoring and disaster warning. Future research could incorporate additional dimensions of audio features to further optimize the model structure, improving its prediction accuracy and stability.
3.4. Validation and Application of the Rainfall Intensity Prediction Model
This study successfully developed a rainfall intensity prediction model based on audio signals through the analysis of the relationship between rainfall audio features and rainfall intensity. During the experimental validation phase, the model demonstrated excellent predictive capability, particularly under moderate and high rainfall intensity conditions, where it exhibited high accuracy. The strong positive correlation between sound pressure and rainfall intensity (r = 0.916, p = 0.010, R2 = 0.838) confirmed the effectiveness of sound pressure as an indicator for monitoring rainfall intensity. Through regression analysis, the model showed stable performance in predicting rainfall intensity across different levels, maintaining high prediction accuracy even under more complex climatic conditions.
Further experimental validation showed that the optimized multiple linear regression model achieved an R2 of 0.814, effectively handling noise interference in real-world environments and providing precise predictions for real-time rainfall intensity monitoring. Additionally, the significant power-law relationship between energy density and rainfall intensity (ρ = 0.82) further verified the potential of audio signals in rainfall intensity monitoring, especially during heavy and extreme rainfall, where the trend in energy density variation is particularly pronounced.
In practical deployment tests, the audio-based rainfall intensity prediction system demonstrated good stability and adaptability, enabling real-time inference under low-power and low-latency constraints, thus providing efficient support for disaster warning systems. In summary, this study not only validates the effectiveness of the audio-based rainfall intensity prediction model but also offers strong support for its application in various meteorological monitoring scenarios, highlighting the broad application prospects of this method.
4. Discussion
4.1. Systematic Validation and Mechanism Analysis of the Relationship Between Sound Pressure and Rainfall Intensity
This study successfully established a comprehensive evidence framework encompassing the “statistical—mechanistic—model—deployment” process based on 60 rainfall events in the semi-arid region of Northwest China. The study covered a wide range of rainfall intensities from 0.19 to 132.4 mm/h, with an average intensity of 8.2 mm/h and a standard deviation of 17.6 mm/h, indicating substantial variability in rainfall intensity. Acoustic feature analysis revealed that low-frequency components dominate, with an average low-frequency ratio of 83.0% and a standard deviation of 7.3%. Additionally, the energy in the mid-frequency range increases moderately with higher rainfall intensity (r ≈ 0.3).
In terms of the relationship between rainfall intensity and acoustic parameters, a strong linear correlation was observed between sound pressure and rainfall intensity. The regression equation for sound pressure level (SPL) and rainfall intensity is SPL(dBFS) = 0.31 × I(mm/h) + 43.64, with a correlation coefficient of r = 0.916 and R2 = 0.838. The physical basis for choosing this model lies in the fact that the sound energy generated by raindrop impacts is directly related to the kinetic energy of the raindrops, and the kinetic energy of the raindrops is positively correlated with the cube of the raindrop diameter (EK = 1/2 mv2, where mass m is proportional to the cube of the diameter). Therefore, a cubic polynomial can approximately reflect this physical relationship. Meanwhile, this study also attempted a power-law fit, which resulted in a goodness of fit (R2) of 0.82, slightly lower than that of the cubic polynomial, and exhibited larger residuals in the extreme rainfall range (>30 mm/h) (mean residual for cubic polynomial = 1.87 J/m3, mean residual for power-law fit = 3.21 J/m3). Thus, the cubic polynomial model was ultimately chosen, indicating that sound pressure effectively reflects changes in rainfall intensity, particularly during extreme rainfall events where the increase in sound pressure is especially pronounced [25]. Regarding energy characterization, rainfall sound energy increases significantly with higher rainfall intensity, with a particularly notable rise during heavy and extreme rainfall events. The cubic polynomial model provided the best fit for the nonlinear relationship between rainfall intensity and acoustic energy, with a representative R2 of 0.834. The energy density and rainfall intensity exhibit a significant power-law relationship (Spearman ρ = 0.82). These results are consistent with existing acoustic monitoring research [26].
In terms of prediction and deployment, a multiple linear regression model based on a small set of acoustic features (such as mean sound pressure, zero-crossing rate, sound energy, and peak amplitude) demonstrated high accuracy in predicting rainfall intensity, with an R2 of 0.841. The regression coefficient confidence interval (95%) for the model is [0.28, 0.34], which validates the statistical significance of the coefficients. The model’s bias on the validation set is 0.52 mm/h, and the root mean square error (RMSE) is 2.17 mm/h, significantly lower than those of the Random Forest (RF) (Bias = 3.89 mm/h, RMSE = 8.64 mm/h) and Support Vector Regression (SVR) (Bias = 5.12 mm/h, RMSE = 10.33 mm/h), further confirming the reliability of the lightweight model. The model outperforms both RF (R2 = 0.375) and SVR (R2 = 0.058). To ensure a fair comparison, this study performed systematic parameter optimization for RF and SVR: a 5-fold cross-validation combined with grid search strategy was used. The optimized parameters for RF include the number of decision trees (100–500 trees), maximum depth (5–20), and minimum samples per split (2–10). The optimal parameter combination was 300 decision trees, a maximum depth of 10, and a minimum sample split of 5. The optimized parameters for SVR include the kernel function (linear/polynomial/RBF), regularization parameter C (0.1–10), and gamma value (0.001–0.1), with the optimal parameters being the RBF kernel, C = 1.0, and gamma = 0.01. The core reason for the poor performance of both methods lies in the fact that the acoustic features in this dataset have a dominant linear relationship with rainfall intensity, which is better captured by MLR. RF tends to overfit due to data imbalance in the small sample (60 rainfall events), while SVR is sensitive to feature scaling and has not effectively adapted to the nonlinear modeling of extreme rainfall samples [27]. The comparison with existing research indicates that acoustic monitoring methods have already been validated for their high accuracy and potential for broad application in tropical rainforests and urban environments. For instance, studies in the Amazon region have shown that combining power spectral density with machine learning can achieve an R2 > 0.87 for hourly rainfall rates at training sites, and a 97% rain/no-rain recognition accuracy across sites with different vegetation types [28]. In comparison, this study further quantifies the relationship between rainfall intensity and acoustic features such as sound pressure, low-frequency dominance, and mid-frequency elevation in semi-arid regions, successfully applying this model for real-time rainfall intensity prediction within a 10 s time window. Compared to tropical cases, this study offers unique advantages in nonlinear rainfall intensity prediction and edge computing applications, providing a valuable complement to existing methods. On the other hand, although deep learning has been widely explored for acoustic rainfall monitoring, convolutional neural networks (CNNs) applied to audio data have primarily focused on classification tasks, with relatively limited discussion on the numerical regression of rainfall intensity and the boundaries of functional families. In contrast, this study employs a regression model based on features such as sound pressure, energy density, and frequency band ratios. By combining multiple linear regression with power-law and cubic regression, the study successfully achieves precise continuous rainfall intensity predictions, demonstrating higher adaptability and reliability under extreme rainfall conditions [29]. When compared to “opportunistic sensing” methods, such as CML/radio links, the acoustic monitoring system in this study exhibits high sensitivity at the point level, making it particularly suitable for monitoring “extreme transients” and “Surface-level contact processes”. It effectively complements the spatial coverage provided by CML systems, which are advantageous for large-scale rainfall monitoring, while the acoustic nodes in this study can provide fine-grained, near-surface rainfall data. This supports multi-source data fusion and enhances the spatiotemporal resolution and robustness of regional rainfall inversion [30].
In summary, this study has made significant advancements in the acoustic monitoring of rainfall intensity, particularly in terms of the strong linear relationship between sound pressure and rainfall intensity, the power-law correlation between energy density and rainfall intensity, and the development of a rainfall intensity prediction model based on audio features. These results provide new insights and technical support for future research and development. These findings not only offer a theoretical foundation for subsequent rainfall monitoring system development but also provide a technical pathway for practical engineering applications [31].
4.2. Comparative Analysis and Performance Validation of Acoustic Monitoring Methods
Existing research has identified the “opportunistic sensing” approach, which typically relies on commercial microwave links (CML) or radio propagation link attenuation to infer rainfall intensity. The core principle of this method is based on the relationship between changes in signal strength and raindrop extinction, aiming to improve the accuracy of accumulated rainfall estimation by optimizing detection thresholds and estimating errors, and proposing a “detection first, estimation later” framework [25]. This method has clear advantages in large-area coverage but faces challenges due to its reliance on communication network topology and frequency band configuration, as well as the high calibration costs associated with its application [31]. Subsequent research has pointed out that network density, frequency band heterogeneity, and the completeness of link metadata are key factors affecting the generalization and feasibility of this method in urban applications [26].
In contrast, this study adopts a near-surface acoustic sensing approach, using a custom-designed microphone device to capture the direct acoustic responses from raindrop-surface interactions, combined with multi-feature extraction and regression modeling for rainfall intensity inversion. Unlike traditional methods, this approach does not rely on external communication infrastructure, offering the advantages of low cost and high-density deployment, making it more suitable for addressing the “complex terrain/observation blind spots” problem [29]. Moreover, the advancements in the CML field have provided valuable insights for this study, particularly the “detection first, estimation later” strategy and threshold-cost joint optimization, which have inspired approaches to improve signal-to-noise ratio and achieve robust regression [32].
In recent years, acoustic monitoring research has not only made advancements in hardware design, such as waterproof/noise isolation structures, wind noise suppression, and optimal incident angle and substrate material selection [29], but also in deep learning-based automatic feature learning (e.g., CNN, Transformer), which has become a hot research direction [30]. In this study, the hardware design incorporates a “sealed inner, isolated outer” cylindrical cavity and multi-layer soundproof cotton structure to suppress wind and environmental noise. On the algorithmic level, we primarily use interpretable multiple linear regression models with polynomial/power-law fitting, complemented by random forest and support vector regression for comparison, balancing lightweight design, deployability, and interpretability [27]. This design is more suitable for real-time applications in embedded systems and edge computing.
In existing acoustic studies, some focus on classification tasks (e.g., rainfall intensity level classification, with accuracy >90%) [33], while others emphasize regression tasks for rainfall intensity (e.g., continuous intensity estimation, with R2 typically ranging from 0.76 to 0.87) [28,34]. CML and radio link approaches generally focus on the co-optimization of cumulative rainfall and event detection [25,31]. In contrast, this study centers on numerical regression while reporting related structured metrics (e.g., sound pressure, energy density, and frequency band ratios), which makes the findings more closely aligned with ground-based hydrological operations and mechanistic interpretations. Compared to the “electromagnetic attenuation—rainfall intensity” or “heavy models—automatic feature” approaches, the low cost, strong deployability, and feature interpretability of this study constitute its core advantages [35,36].
In the semi-arid region, a significant linear relationship was found: sound pressure (dBSPL) = 0.31 × rainfall intensity (mm/h) + 43.64, r = 0.916, R2 = 0.838, demonstrating the strong explanatory power of sound pressure for rainfall intensity. This monotonic result is consistent with findings from several acoustic studies conducted under various ecological and device conditions [34]. Regarding feature time windows, multiple studies have shown that a 10 s acoustic window achieves a good balance between stability and timeliness. This study also used a 10 s modeling window and obtained robust regression performance, validating the aforementioned conclusion [35]. The total acoustic energy showed a significant positive correlation with rainfall intensity, and the cubic polynomial and power-law models provided better fits for extreme processes than other models. This result aligns with the observation that “heavy rainfall → broader frequency band, higher energy density.” Additionally, in research on acoustic rainfall monitoring at the air–sea interface, stronger spectral energy and broader dominant frequency bands were observed during high-intensity rainfall, which is consistent with the findings in this study [37].
Regarding the regression errors of monitored audio, existing research indicates that deep learning-based rainfall intensity estimation can achieve an MAE < 1 mm/h, with correlation coefficients (R2) around 0.76–0.87 [34]. Compared to the multiple linear regression model in this study, which yields an R2 in the range of 0.814–0.841, this suggests that under favorable data collection and feature engineering conditions, lightweight models can also achieve high accuracy and generalization capability. The influence of frequency band dominance differs across regions (e.g., tropical rainforests and semi-arid areas). Tropical rainforest studies often report sensitivity to mid-high frequency bands such as 1.6–2.7 kHz [37], whereas the results from this study in the semi-arid region show an average low-frequency ratio of approximately 83%, with the combined mid-high frequency ratio positively correlated with rainfall intensity (r ≈ 0.3). In this study, the intensity distribution of the 60 rainfall events is as follows: light rain (<2.5 mm/h) for 18 events, moderate rain (2.5–10 mm/h) for 22 events, heavy rain (10–25 mm/h) for 11 events, rainstorm (25–50 mm/h) for 6 events, and torrential rain (>50 mm/h) for 3 events. The sample covers the main rainfall types in the study area, ensuring the representativeness of the model fitting. This difference can be reasonably explained by variations in substrate and structure, raindrop spectra and microclimates, as well as differences in tasks and feature specifications. Previous studies have indicated that acoustic methods may underestimate precipitation intensity during extreme rainfall events. However, this study achieved better fitting for the extreme range (>30 mm/h) using cubic nonlinear and power-law models, demonstrating the strong adaptability of the model [38,39].
By combining the “detection first, estimation later” framework with multiple regression models, this study demonstrates how acoustic monitoring, under low power consumption and low-cost deployment, can enable real-time rainfall intensity prediction and maintain high prediction accuracy in complex environments such as wind and traffic noise. This approach not only provides strong technical support for the hydrological monitoring field but also offers new insights for improving emergency response and disaster warning systems during extreme weather events. The comparative analysis with the CML approach shows the natural complementarity between acoustic monitoring’s high-sensitivity response at the “point level” and the broad-area monitoring provided by “spatial coverage.” By combining acoustic monitoring with other technologies, such as link attenuation, radar, and satellite data, the spatiotemporal resolution and robustness of hydrological monitoring can be further enhanced, providing stronger technical support for applications in water resource management, climate change research, and early warning systems for natural disasters.
4.3. Limitations and Future Directions
Although this study demonstrates the potential of acoustic signal-based rainfall monitoring methods for practical applications, several limitations remain and need to be addressed in future research. First, although the data used in this study cover a range of rainfall intensities from light rain to extreme rainfall, the data sources primarily focus on a single region and a limited seasonal period, without addressing cross-seasonal, cross-surface (such as hard surfaces, soil, vegetation, and water bodies), and varying wind field conditions [40]. The lack of data from different geographical and climatic conditions may affect the model’s generalizability in other environments, a concern also mentioned in existing literature [41]. Therefore, future research should include a broader range of scenarios, especially cross-regional and cross-season observations, to enhance the robustness and applicability of the model. Secondly, while the “aluminum foil cone + internal cavity noise isolation” device used in this study provides an ideal signal-to-noise ratio, its design still presents some structural biases, particularly in the dominance of low frequencies, which may affect the sensitivity of mid- and high-frequency bands [42]. Variations in surface conditions and raindrop spectra may exacerbate this bias, further impacting the accuracy of high-frequency signals. Therefore, structural optimization of the device, especially expanding its frequency response range, remains an important direction for future research. In addition to improving the physical structure of the device, future studies could also consider integrating more precise environmental variables such as wind speed and temperature-humidity conditions to enhance the system’s adaptability to external changes.
The current study also has certain limitations regarding the time window setting and model selection. This research used a 10 s time window and estimated rainfall intensity based on a combination of “linear/power-law/cubic terms” models [43]. Although this configuration performed well in the study area, the current model’s adaptability to different time scales of rainfall intensity, such as convective rainfall and continuous rainfall, is not fully established. Similar studies in the existing literature have pointed out that short time windows may lead to false alarms or poor fitting during low-intensity or intermittent rainfall events [44]. The accuracy of application linkage needs to be strengthened. The rainfall intensity information provided in this study, when deeply coupled with the rainfall duration dimension, can better assess disaster risk and is more beneficial for runoff simulation. Additionally, there is a trade-off between cost and monitoring effectiveness. The system relies primarily on a one-time hardware investment, with the cost of setting up a single point hardware being approximately 300 RMB (less than 300 RMB), much lower than the construction and operational costs of weather radar and slightly higher than traditional single-point rain gauges. The key advantage is its ability to support multi-point dense deployment, thereby obtaining rich spatial distribution information of rainfall. In the future, hardware costs can be further reduced through mass production, improving the economic feasibility of technology promotion. Therefore, future research should explore multi-scale models with different time window settings, particularly employing multi-scale pooling mechanisms with windows ranging from 2–5 s to 20–60 s, to further enhance the model’s adaptability to complex rainfall events [45]. Additionally, the integration of forecast intervals and uncertainty expression into business threshold logic should also become a focus of future work. In recent years, robust regression and uncertainty quantification techniques, such as quantile regression and conformal prediction, have made significant progress in related fields, and these methods are expected to play an important role in future models [46].
In addition to model optimization, the diversification of data sources is another important direction for future research. As the availability of monitoring video, audio, and other sensor data increases, multi-source data fusion will become a key technology for improving rainfall monitoring accuracy [47]. By combining acoustic monitoring with radar, satellite, and CML link data, spatial and temporal resolution can be effectively enhanced, improving the overall robustness of the monitoring system [48]. Furthermore, the current study primarily relies on video data for estimating rainfall intensity, while audio-based rainfall sensing remains a relatively new research field, and the fusion of multi-source data is still underdeveloped. Audio data can provide different dimensions of information, and future research could leverage the advantages of both video and audio to develop more accurate rainfall intensity monitoring systems.
Looking ahead, with the development of intelligent and low-cost operational technologies, camera-based rainfall monitoring technologies will be widely applied in urban drainage, agricultural scheduling, and disaster early warning systems. By combining edge-cloud collaborative frameworks with low-cost sensors and efficient data processing methods, system deployment and operational costs can be significantly reduced. At the same time, batch retraining and model drift monitoring in the cloud will ensure the long-term stability and accuracy of the system. Furthermore, with the advancement of big data technologies and machine learning methods, the prediction accuracy and real-time response capabilities for rainfall intensity will greatly improve, driving the development of distributed, scalable, and low-cost smart meteorological observation networks.
5. Conclusions
This study introduces a real-time rainfall intensity monitoring method based on deep learning and audio signal processing, validated in Northwest China’s semi-arid region. Using a custom microphone to capture acoustic signals from raindrop-surface interactions, and combining feature extraction with regression modeling, the study successfully estimates rainfall intensity. A strong linear relationship between sound pressure and rainfall intensity (r = 0.916, R2 = 0.838) was found, especially during extreme rainfall events.
Compared to traditional methods like CML and radio links, this approach offers low-cost, high-density deployment and strong adaptability to complex terrain. It operates without external communication infrastructure, ensuring stability and real-time responsiveness in noisy environments. While the study has shown promising results, limitations include region-specific data and the device’s sensitivity to low frequencies. Future research will expand data coverage, optimize device design, and integrate multi-source data (e.g., radar, satellite) to improve robustness and adaptability.
This method provides a new technical solution for rainfall monitoring, with potential applications in urban drainage, agricultural irrigation, and early disaster warning, supporting water resource management and climate change research.
Author Contributions
Conceptualization, Y.W. and H.J.; methodology, Y.W. and G.L.; software, Y.W. and Q.C.; validation, Y.W., H.J. and G.L.; formal analysis, Y.W. and G.L.; investigation, Y.W. and Q.C.; resources, G.L. and M.N.; data curation, Y.W. and Q.C.; writing—original draft preparation, Y.W.; writing—review and editing, Y.W., H.J. and G.L.; visualization, Q.C.; supervision, H.J.; project administration, H.J.; project implementation, M.N. All authors have read and agreed to the published version of the manuscript.
Funding
This research was funded by the Zhunkeqi Science and Technology Innovation Environmental Construction Program, project number 2024HJ-22, titled: Analysis of Atmospheric Aerosol Components and Sources in Zhunkeqi.
Institutional Review Board Statement
Not applicable.
Informed Consent Statement
Not applicable.
Data Availability Statement
No new data were created or analyzed in this study. Data sharing is not applicable to this article.
Acknowledgments
Yishu Wang was responsible for conceptualization, methodology development, and writing the original draft; Hongtao Jiang undertook data curation, formal analysis, and supervision; Guangtong Liu participated in investigation, resource coordination, and validation; Qiangqiang Chen was in charge of visualization, software implementation, and manuscript review and revision; Mengping Ni led project administration, funding acquisition, and investigation, and all authors have read and approved the published manuscript.
Conflicts of Interest
The authors declare no conflicts of interest.
References
- Zhang, Y.; Li, Y.; Chen, X. Rainfall estimation using weather radar. Atmos. Res. 2020, 240, 104944. [Google Scholar] [CrossRef] [Scilit]
- Zhu, Y.; Liu, Y. Advances in Measurement Techniques and Statistics Features. Prog. Earth Sci. 2013, 28, 685–694. [Google Scholar] [CrossRef]
- Kidd, C.; Becker, A.; Huffman, G.J.; Levizzani, V. Satellite rainfall estimation: Recent developments and future prospects. Remote Sens. 2017, 9, 1155. [Google Scholar] [CrossRef] [Scilit]
- Tokay, A.; Petersen, W.A.; Gatlin, P.; Wingo, M.T. Evaluation of rain gauge performance under different rainfall intensities and wind conditions. Hydrol. Process. 2014, 28, 1231–1240. [Google Scholar] [CrossRef] [Scilit]
- Fabry, F. The spatial variability of rain. Atmos. Res. 2006, 82, 100–113. [Google Scholar] [CrossRef] [Scilit]
- McCabe, M.F.; Rodell, M.; Alsdorf, D.E.; Miralles, D.G.; Uijlenhoet, R.; Wagner, W.; Lucieer, A.; Houborg, R.; Verhoest, N.E.C.; Franz, T.E.; et al. The future of Earth observation in hydrology. Hydrol. Earth Syst. Sci. 2017, 21, 3879–3914. [Google Scholar] [CrossRef] [Scilit]
- Pan, P.; Shi, Y.; Zhao, Z.; Wang, J.; Cao, J.; Bai, W.; Xie, H.; Wei, J. Research on the microphysical characteristics of rainfall under acoustic intervention in arid inland areas. Arid. Land Geogr. 2021, 44, 906–913. [Google Scholar]
- Chen, H.; Lin, X.; Wang, Y.; Wang, Z. Next-generation rainfall monitoring technologies: A review. Sensors 2022, 22, 1523. [Google Scholar] [CrossRef] [Scilit]
- Wen, Y.; Yu, W.; Zheng, F.; Huang, D.; Xiao, N. AdaNAS: Adaptively postprocessing with self-supervised neural architecture search for ensemble rainfall forecasts. IEEE Trans. Geosci. Remote Sens. 2024, 62, 1–10. [Google Scholar] [CrossRef] [Scilit]
- Cao, Y.; Li, Q.; Shan, H.; Huang, Z.; Chen, L.; Ma, L.; Zhang, J. Precipitation nowcasting with star-bridge networks. arXiv 2019, arXiv:1907.08069. [Google Scholar] [CrossRef] [Scilit]
- Depraetere, M.; Cauteruccio, A.; Poulain, P.M. Acoustic characterization of raindrop impact on different surfaces. Environ. Monit. Assess. 2016, 188, 243. [Google Scholar] [CrossRef] [Scilit]
- Watts, G.; Godfrey, N. Effects on the soundscape of an urban environment due to traffic management. J. Acoust. Soc. Am. 1999, 105, 1017–1024. [Google Scholar] [CrossRef] [Scilit]
- Zou, S.; Liu, Y.; Liu, Z.; Wang, J.; Zhou, J. Estimating rainfall intensity based on surveillance audio and deep-learning. Remote Sens. 2020, 12, 2047. [Google Scholar]
- Ebtehaj, A.M.; Bras, R.L.; Foufoula-Georgiou, E. Shrunken locally linear embedding for passive microwave retrieval of precipitation. IEEE Trans. Geosci. Remote Sens. 2015, 53, 3720–3736. [Google Scholar] [CrossRef] [Scilit]
- Zhang, K.; Su, Y.; Wang, J.; Wang, S.; Zhang, Y. Research on environmental sound classification system based on feature fusion and convolutional neural networks. J. Northwestern Polytech. Univ. 2020, 38, 162–169. [Google Scholar] [CrossRef] [Scilit]
- Lin, M.; Huang, X.; Lin, Z.; Hong, S.; Liu, J. Precipitation intensity recognition based on convolutional neural network fusion encoding and decoding features. Laser Optoelectron. Prog. 2023, 60, 0211003. [Google Scholar]
- Zhang, L.; Wu, J.; Xu, Y. Deep learning for environmental sound classification. Appl. Sci. 2019, 9, 133. [Google Scholar] [CrossRef] [Scilit]
- Shamanaev, S.V. Acoustic sounding of raindrop size distribution. J. Atmos. Ocean. Technol. 2003, 20, 152–158. [Google Scholar] [CrossRef] [Scilit]
- Thurai, M.; Bringi, V.N.; Petersen, W.A. Evaluation of satellite precipitation datasets for rainfall estimation. J. Hydrometeorol. 2014, 15, 1865–1877. [Google Scholar] [CrossRef] [Scilit]
- Zhang, W.; Sun, H.; Wang, Z. Prediction of Underwater Noise Spectrum Level Under Wind and Rain Conditions. Ph.D. Thesis, Harbin Engineering University, Harbin, China, 2011. [Google Scholar]
- Li, C.; Wang, H.; Zhao, J. Design of distributed rainfall monitoring node based on audio signal and low-power consumption. Sensors 2022, 22, 5123. [Google Scholar]
- Zhao, W.; Huang, J.; Zhang, S.; Liu, Y.; Wang, T. Rainfall intensity prediction based on acoustic spectrograms and convolutional neural networks. IEEE Trans. Geosci. Remote Sens. 2023, 61, 5502110. [Google Scholar]
- Wu, S.; Qin, J.; Qi, Y.; Li, Z. Progress in deep-sea acoustics and underwater sound source localization. Acta Acust. 2025, 50, 551–570. [Google Scholar]
- Zou, M.; He, X. Modeling the scattering characteristics of rainfall environments in radar frequency bands for autonomous driving. J. Syst. Simul. 2023, 35, 2161. [Google Scholar]
- Weiss, T.; Routtenberg, T.; Ostrometzky, J.; Messer, H. Intensity estimation after detection for accumulated rainfall estimation. Front. Signal Process. 2024, 4, 1291878. [Google Scholar] [CrossRef] [Scilit]
- Chwala, C.; Kunstmann, H. Commercial microwave link networks for rainfall observation: Assessment of the current status and future challenges. Water 2019, 6, e1337. [Google Scholar] [CrossRef] [Scilit]
- Wang, M.; Chen, M.; Wang, Z.; Guo, Y.; Wu, Y.; Zhao, W.; Liu, X. Estimating rainfall intensity based on surveillance audio and deep learning. Environ. Sci. Ecotechnology 2024, 22, 100450. [Google Scholar] [CrossRef] [Scilit]
- Xavier, R.S.; Gosset, M.; Maciel, T.F.; Bicudo, T.; do Nascimento, L.A.; Ramalho, E.; Fleischmann, A. Measuring Amazon rainfall intensity with sound recorders. Geophys. Res. Lett. 2024, 51, e2024GL108210. [Google Scholar] [CrossRef] [Scilit]
- Bradley, S.G.; Coulter, R.L. Acoustic radar studies of rain microphysics. J. Atmos. Ocean. Technol. 1997, 14, 547–558. [Google Scholar] [CrossRef] [Scilit]
- Wang, M.; Li, J.; Zhang, H. Rainfall intensity estimation using surveillance audio and transformer-based deep learning. IEEE Internet Things J. 2024, 11, 21567–21576. [Google Scholar]
- Zhang, P.; Liu, X.; Pu, K. Precipitation monitoring using commercial microwave links: Current status, challenges, and prospects. Remote Sens. 2023, 15, 4821. [Google Scholar] [CrossRef] [Scilit]
- Avanzato, R.; Beritelli, F. An innovative acoustic rain gauge based on convolutional neural networks. Information 2020, 11, 183. [Google Scholar] [CrossRef] [Scilit]
- Ejiagha, I.R.; Ahmed, M.R.; Dewan, A.; Gupta, A.; Rangelova, E.; Hassan, Q.K. Urban warming of the two most populated cities in the Canadian Province of Alberta, and its influencing factors. Sensors 2022, 22, 2894. [Google Scholar] [CrossRef] [Scilit]
- Lagarrigue, C.; Groby, J.; Tournat, V.; Dazel, O. Design of metaporous supercells by genetic algorithm for absorption optimization on a wide frequency band. Appl. Acoust. 2016, 102, 49–54. [Google Scholar] [CrossRef] [Scilit]
- Xu, B.; Zhang, Y. Integration of low-cost sensors and machine learning for high-resolution rainfall monitoring. Environ. Monit. 2024, 12, 115–126. [Google Scholar] [CrossRef] [Scilit]
- Hao, Y.; Li, X.; Zhang, C.; Lei, Z. Online inspection of browning in Yali pears using visible-near infrared spectroscopy and interpretable spectrogram-based CNN modeling. Biosensors 2023, 13, 203. [Google Scholar] [CrossRef] [Scilit] [PubMed]
- Wu, Q.; Song, C.; Liu, K.; Ke, L. Integration of TanDEM-X and SRTM DEMs and spectral imagery to improve the large-scale detection of opencast mining areas. Remote Sens. 2020, 12, 1451. [Google Scholar] [CrossRef] [Scilit]
- Chen, Y.P.; Jin, L.; Lu, H.Y.; Feng, Z.J.; Chen, Y.H. Application of spatial statistical methods in decomposition of machining errors for free-form surfaces. J. Beijing Inst. Technol. 2017, 37, 260–266. [Google Scholar]
- Min, J.; Wu, Z.; Zheng, L.; Cheng, Q. Radio propagation link-based precipitation environment recognition analysis using deep learning. J. Radio Sci. 2023, 3, 453–462+484. [Google Scholar] [CrossRef]
- Wei, C.-C.; Hsu, C.-C. Extreme gradient boosting model for rain retrieval using radar reflectivity from various elevation angles. Remote Sens. 2020, 12, 2203. [Google Scholar] [CrossRef] [Scilit]
- Huffman, G.J.; Adler, R.F.; Bolten, J.D.; Nelkin, E.J. The Global Precipitation Measurement (GPM) mission. Bull. Am. Meteorol. Soc. 2014, 95, 701–722. [Google Scholar]
- Bossu, J.; Hautière, N.; Tarel, J.P. Rain or snow detection in image sequences through use of a histogram of orientation of streaks. Int. J. Comput. Vis. 2011, 93, 348–367. [Google Scholar] [CrossRef] [Scilit]
- Garg, K.; Nayar, S.K. When does a camera see rain? In Proceedings of the Tenth IEEE International Conference on Computer Vision (ICCV’05), Washington, DC, USA, 17–20 October 2005; IEEE: New York, NY, USA, 2005; pp. 1067–1074. [Google Scholar]
- Fitzner, D.; Sester, M. Rain estimation from moving cars—A classification approach. In Proceedings of the 8th ACM SIGSPATIAL International Workshop on Computational Transportation Science, Seattle, WA, USA, 3–6 November 2015; IEEE: New York, NY, USA, 2015; pp. 19–24. [Google Scholar]
- Xie, J.; Hu, W.; Zhu, X.; Li, Y.; Wang, Z.; Chen, H.; Zhang, L.; Liu, S.; Guo, F.; Yang, M.; et al. A novel audio classification method based on multi-feature fusion and deep neural network. In Proceedings of the 2019 IEEE International Conference on Acoustics, Speech and Signal Processing (ICASSP), Brighton, UK, 12–17 May 2019; IEEE: New York, NY, USA, 2019; pp. 815–819. [Google Scholar]
- Yang, H.; Zhang, Q. Robust regression models for large datasets with application in weather forecasting. J. Appl. Meteorol. 2019, 58, 1462–1475. [Google Scholar]
- Ochoa-Rodriguez, S.; Wang, L.P.; Gires, A.; Pina, R.D.; Reinoso-Rondinel, R.; Bruni, G.; Ichiba, A.; Gaitan, S.; Cristiano, E.; van Assel, J.; et al. Impact of spatial and temporal resolution of rainfall inputs on urban hydrodynamic modelling outputs: A multi-catchment investigation. J. Hydrol. 2019, 531, 389–407. [Google Scholar] [CrossRef] [Scilit]
- Wang, X. Research on Rainfall Perception Methods Using Monitoring Audiovisual Data. Ph.D. Thesis, Nanjing Normal University, Nanjing, China, 2022. [Google Scholar]

Disclaimer/Publisher’s Note: The statements, opinions and data contained in all publications are solely those of the individual author(s) and contributor(s) and not of MDPI and/or the editor(s). MDPI and/or the editor(s) disclaim responsibility for any injury to people or property resulting from any ideas, methods, instructions or products referred to in the content. |
© 2026 by the authors. Licensee MDPI, Basel, Switzerland. This article is an open access article distributed under the terms and conditions of the Creative Commons Attribution (CC BY) license.