


Abstract
On 6 February 2023, two major earthquakes struck southern Türkiye, causing widespread destruction and challenges for environmental monitoring. This study aimed to characterize temporal and geographical patterns of ambient PM10 concentrations in 11 earthquake-affected provinces during 2023, using 2022 as a descriptive reference year, and to provide a complementary model-based assessment of the health burden associated with PM10 exposure. Daily PM10 data from 28 air-quality monitoring stations were descriptively compared between 2022 and 2023. Statistical analyses were performed using R software (version 4.2.0), and AirQ+ was used to estimate the attributable proportion (AP) of all-cause mortality associated with annual PM10 exposure. Annual mean PM10 concentrations increased in four provinces and decreased in seven provinces in 2023 compared with 2022. The greatest relative increase was observed in Kahramanmaraş (33.0%), while the greatest decrease occurred in Elazığ (13.4%). The number of days exceeding the national daily PM10 limit increased from 144 to 218 in Kahramanmaraş and from 109 to 143 in Hatay. Annual mean PM10 concentrations exceeded the WHO annual air-quality guideline of 15 µg m−3 in all provinces in both years. Using 40 µg m−3 as the counterfactual concentration, the modelled AP ranged from 0% to 17.36% in 2023. The findings demonstrate substantial geographical heterogeneity in PM10 patterns rather than a uniform regional increase. Because the analysis lacked unaffected comparison provinces and meteorological adjustment, the observed differences cannot be attributed specifically to the earthquakes. The modelled AP estimates represent potential PM10-associated health burdens rather than observed mortality outcomes. These findings highlight the importance of maintaining comprehensive air-quality monitoring during post-disaster recovery. What we already know: air pollution is an important environmental health problem. Particulate matter arises from both natural and anthropogenic sources. Disaster-related demolition, debris removal, and reconstruction can create additional challenges for air-quality surveillance. What this article adds: PM10 patterns across the 11 earthquake-affected provinces were heterogeneous rather than uniformly higher in 2023 than in 2022. The study documents the performance and limitations of routine monitoring data in a large post-disaster setting. AirQ+ estimates provide a complementary model-based description of PM10-associated health burden and are not observed mortality outcomes.
1. Introduction
On 6 February 2023, two major earthquakes struck southern Türkiye. The first earthquake, with a magnitude of Mw 7.7, occurred in Pazarcık (Kahramanmaraş) at a focal depth of approximately 8.6 km, followed approximately nine hours later by a second earthquake of Mw 7.6 in the Elbistan region at a depth of approximately 7.0 km. Both earthquakes were associated with predominantly left-lateral strike-slip faulting. The first event ruptured multiple segments of the East Anatolian Fault system, whereas the second involved the Çardak–Sürgü fault system. These events produced extensive surface ruptures across different fault segments, reflecting the complex tectonic characteristics of the affected region. On 20 February 2023, another earthquake of magnitude 6.4 occurred in the Hatay region, further affecting an area already severely damaged by the earlier events. The spatially extensive and complex nature of these earthquakes provides important geographical context for the heterogeneous damage patterns observed across the affected provinces [1]. In Türkiye, 11 provinces were substantially affected: Kahramanmaraş, Hatay, Gaziantep, Adıyaman, Elazığ, Adana, Malatya, Osmaniye, Şanlıurfa, Diyarbakır, and Kilis. According to official data, 53,537 people lost their lives and 107,213 were injured. Damage assessments in the affected provinces indicated that 35,355 buildings collapsed, 17,491 required urgent demolition, and many others sustained varying degrees of damage. Hatay, Kahramanmaraş, and Adıyaman were among the provinces with the greatest numbers of buildings requiring demolition [2]. The World Health Organization recognizes air pollution as an important environmental risk factor for noncommunicable diseases, including ischemic heart disease, chronic respiratory diseases, and cancer [3]. Epidemiological studies have associated air pollution exposure with increased risks of all-cause and cause-specific mortality and hospitalization [4]. Particulate matter originates from both anthropogenic and natural sources and may also be formed in the atmosphere through chemical reactions involving gaseous precursors. In 2013, the International Agency for Research on Cancer (IARC), the specialized cancer agency of the World Health Organization, classified outdoor air pollution and particulate matter in outdoor air pollution as carcinogenic to humans (Group 1) [5]. The associations between particulate matter with an aerodynamic diameter ≤ 10 µm (PM10) and mortality and morbidity have been extensively investigated. A systematic review and meta-analysis by Orellano et al. (2020), for example, reported associations between short-term PM10 exposure and all-cause as well as respiratory, cardiovascular, and cerebrovascular mortality [6]. Earthquakes and subsequent demolition, debris removal, and reconstruction activities may generate substantial quantities of dust and other airborne contaminants and may therefore alter ambient particulate matter concentrations. Following the 1995 Great Hanshin Earthquake in Japan, particulate concentrations in the affected region were reported to be approximately 1.5 times those measured in the previous year, and post-earthquake exposure to concrete dust was documented [7]. Air pollution following the 2015 Nepal earthquake was also reported as an important post-disaster environmental concern [8]. Following the 2011 Great East Japan Earthquake, increased hospitalizations for respiratory diseases were reported in the disaster area [9]. These findings indicate that post-earthquake changes in air quality and respiratory health warrant systematic assessment. Although previous studies have investigated particulate matter pollution and respiratory health outcomes following major earthquakes, evidence describing the geographical heterogeneity of ambient PM10 concentrations across multiple provinces affected by the same disaster remains limited. Furthermore, the availability and continuity of routine air-quality monitoring data during large-scale disasters present important challenges for environmental health surveillance. In this context, the present study provides a multi-province descriptive assessment of PM10 concentrations in the 11 provinces affected by the February 2023 Türkiye earthquakes, using 2022 as a descriptive reference year. By examining annual concentrations, daily exceedance patterns, and modelled attributable proportions of all-cause mortality associated with PM10 exposure, the study offers a complementary perspective on environmental monitoring and potential public-health burdens in a post-disaster setting. Given the absence of unaffected comparison provinces and comprehensive meteorological data, the analysis does not seek to establish earthquake-specific causal effects.
2. Material and Methods
2.1. Study Area
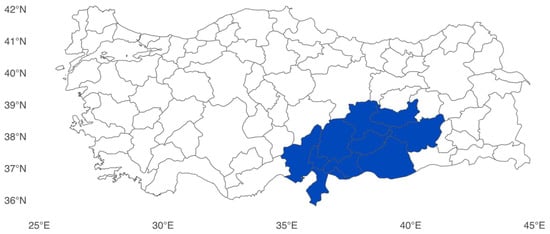
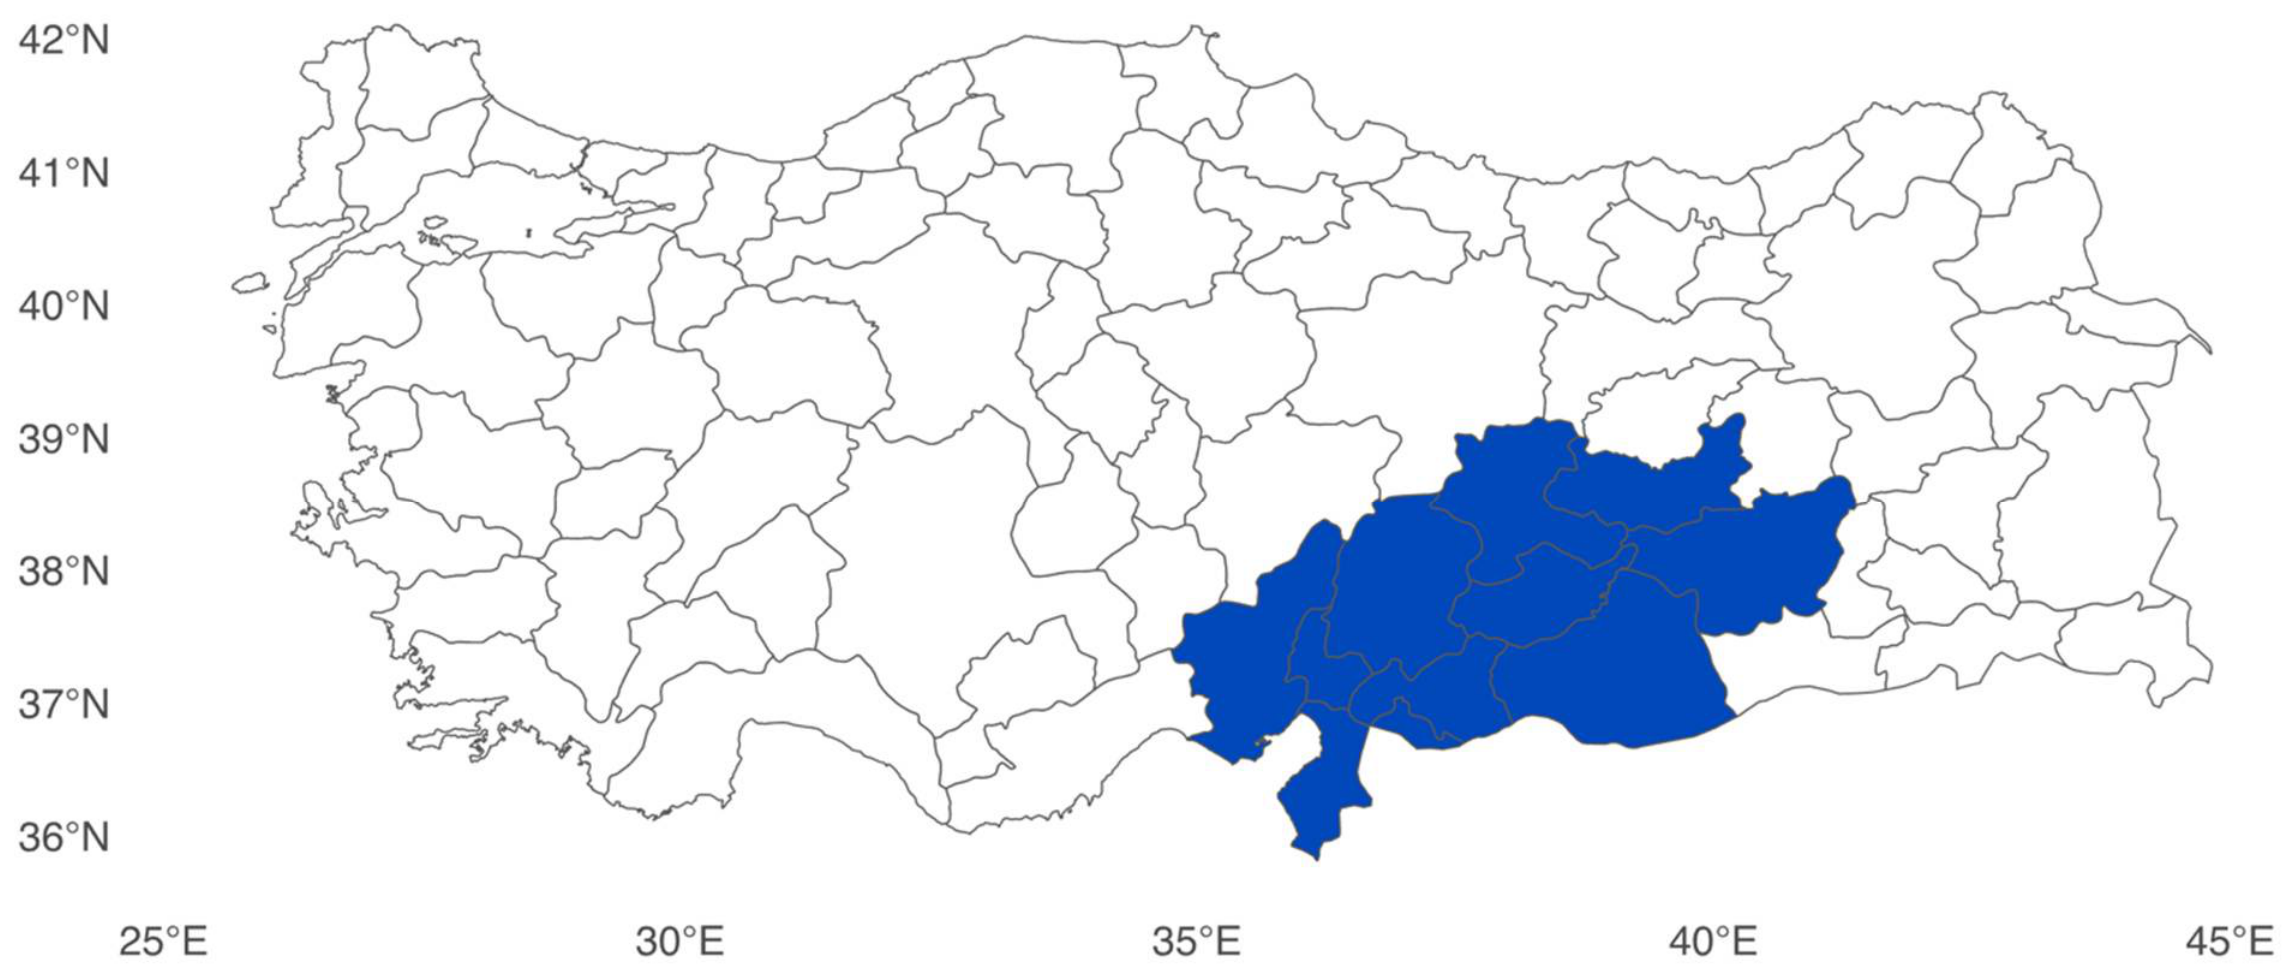
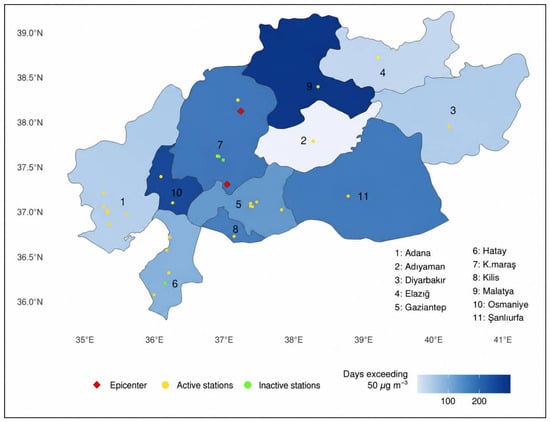
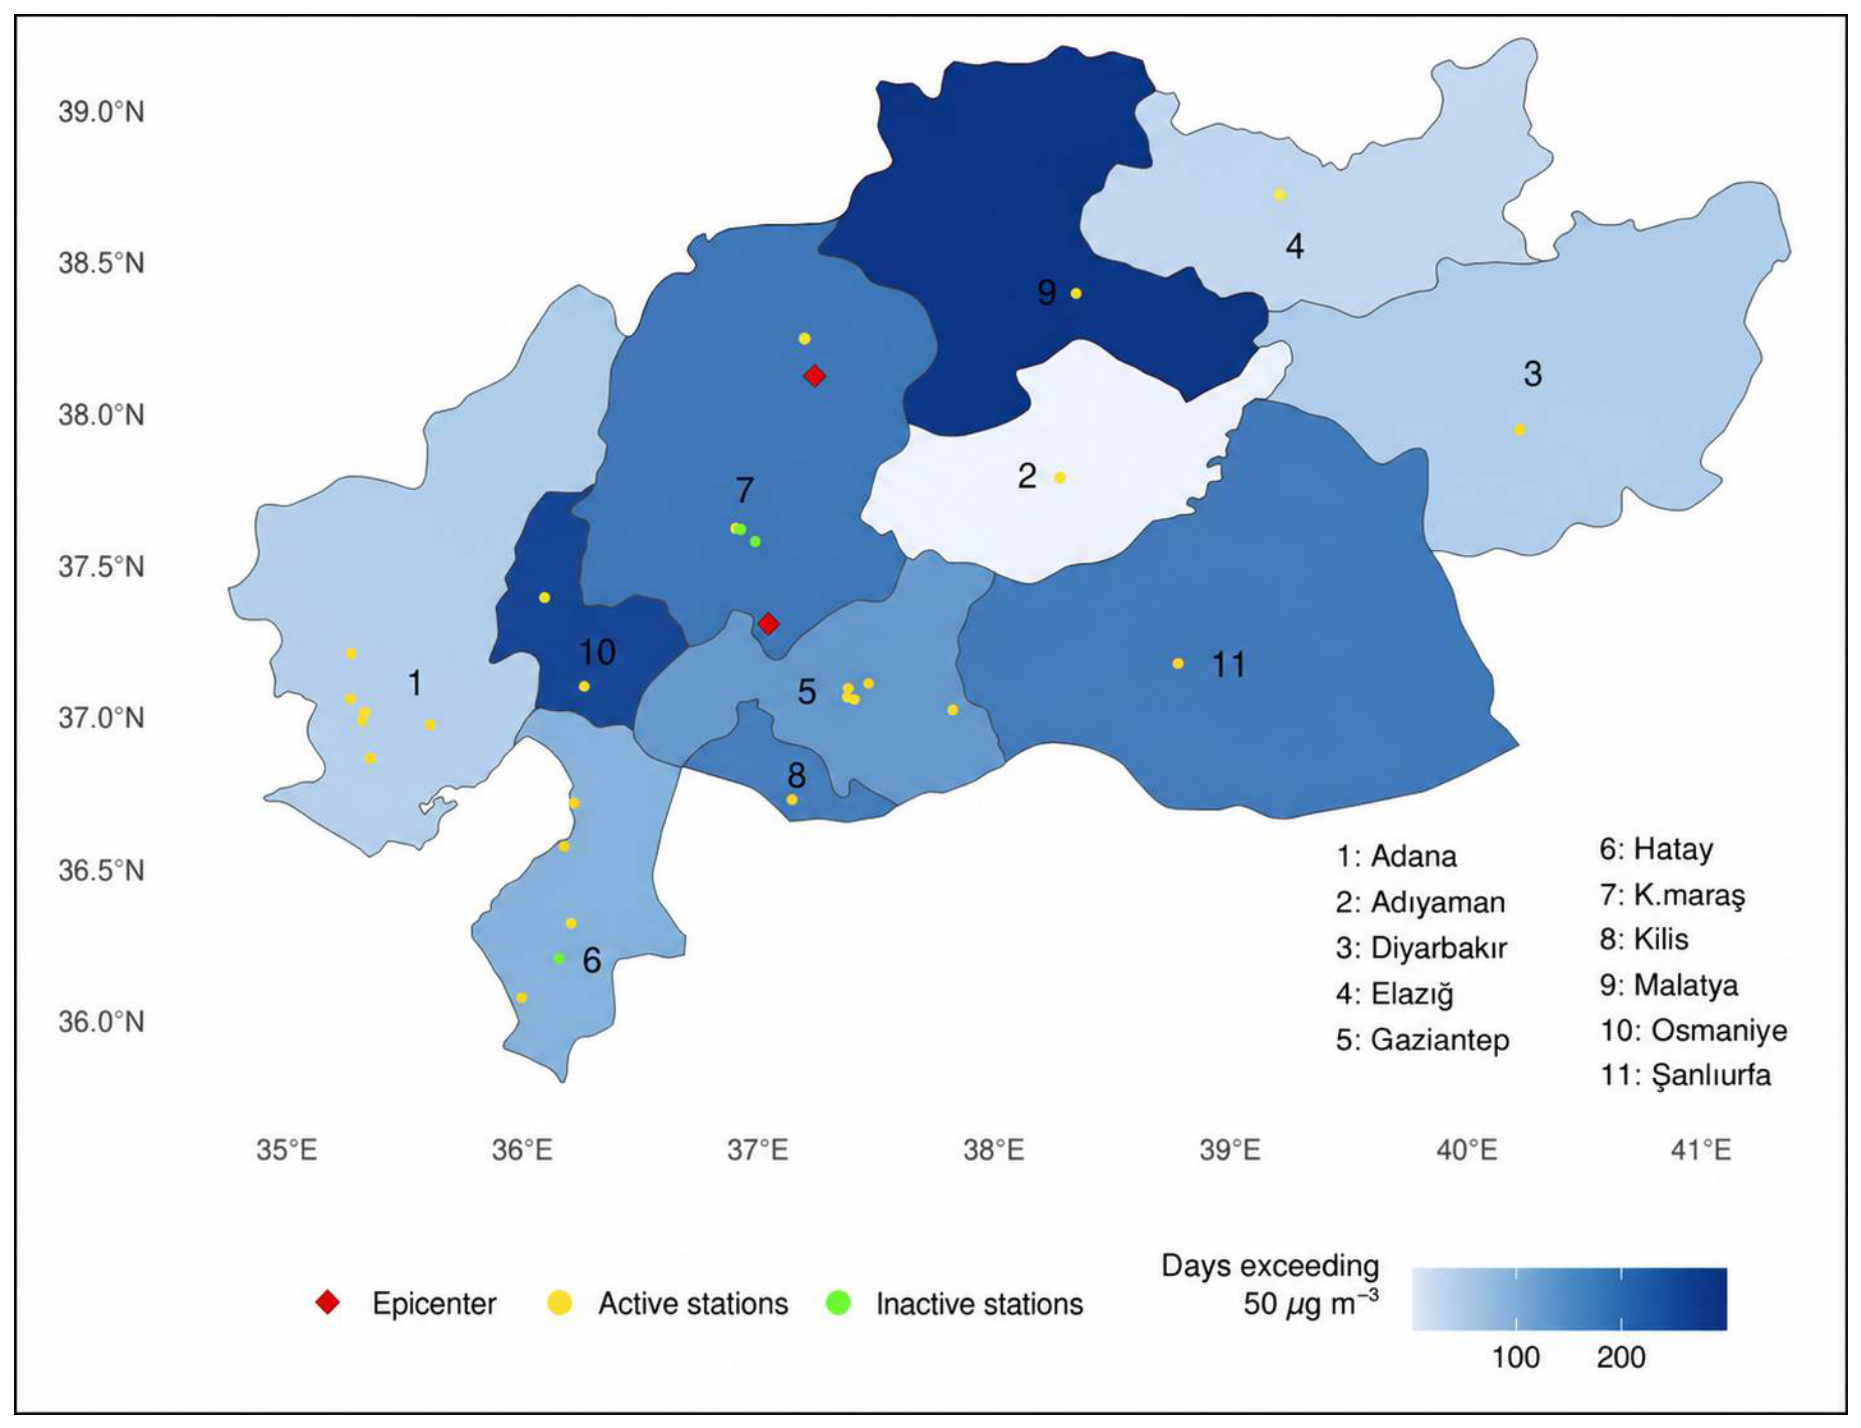
The earthquakes impacted a region spanning 108,812 km2, covering 11 provinces located in the southeastern region of Türkiye (Figure 1). The epicenters of the earthquakes were located in Kahramanmaraş Province (Figure 2). According to the 2022 population data, the total human population of this region is 14,013,196, which is 16.4% of the country’s population [10]. Among the population, 28.7% were in the 0–15 age group, 63.9% were in the 15–64 age group, and 7.4% were over the age of 65. Gaziantep (316 people km−2) and Hatay (289 people km−2) have the highest population densities in the region. The region’s geography consists mainly of plains, with hollows between them, and is surrounded by medium-height hills and mountains. Since it does not have a topography that can prevent desert dust from coming from Syria, the region may be exposed to it at certain times of the year.
Figure 1.
Area affected by earthquakes.
Figure 2.
Locations of the air quality stations, epicenters of the earthquakes and distribution of the number of days exceeding the national PM10 limit in 2023.
2.2. Air Quality Stations and Particulate Matter (PM10) Data
The region is home to 32 air quality monitoring stations, 8 in Adana, 6 in Gaziantep and Hatay, 4 in Kahramanmaraş, 2 in Osmaniye and 1 each in the remaining provinces, belonging to the Ministry of Environment, Urbanization and Climate Change (Figure 2). These stations measure particulate matter (PM10) hourly for 24 h, and these data can be monitored through the National Air Quality Monitoring Network of the Ministry of Environment, Urbanization and Climate Change. In this study, the average PM10 concentrations in 2022 and 2023 were compared. Pollutants like PM2.5, NO, SO2, and CO were not included in the study due to insufficient measurements, especially after the earthquake. Two stations in Hatay and Kahramanmaraş were out of service after the earthquake. Therefore, the data from these 4 stations were not used in the study. The remaining 28 stations had 9.7% (2022) and 9.2% (2023) of hourly values missing. At the province-day level, 8 of 4015 values (0.20%) in 2022 and 111 of 4015 (2.76%) in 2023 were missing. The longest consecutive gaps were 3 days in 2022 and 41 days in 2023 (Diyarbakır), and 95 of the 111 missing values in 2023 occurred on or after 6 February (Supplementary Table S1). Missing values were imputed with random forest imputation (missForest; 100 trees, up to 10 iterations), which predicts each province from the concurrent values of the other ten provinces and makes no distributional assumptions. To evaluate it, we masked 10% of the observed province-day values, either as isolated days or as consecutive blocks of 7, 14 or 30 days (40 repetitions per scenario and year), and compared the imputed values with the true values. Normalised RMSE was 0.57–0.62, the correlation was 0.79–0.82, and days above 50 µg/m3 were classified correctly in 83–85% of masked days. missForest matched linear interpolation for isolated days and outperformed linear interpolation, multiple imputation by predictive mean matching and mean substitution for gaps of 7 days or more (Supplementary Table S2). The number of days above 50 µg/m3, and the significance of every between-year comparison, were unchanged when imputed values were replaced by observed-days-only estimates, linear interpolation or multiple imputation (Supplementary Table S3). Data quality was assessed prior to analysis for the detection of possible anomalous values (zeros, negative values, one-time outliers) and consistency of the data set. The national PM10 limit was 50 µg m3 for the daily average and 40 µg m3 for the yearly average. The threshold for days surpassing the daily average limit was set at 35 days [11].
2.3. AirQ+ Software
The attributable proportion (AP) associated with PM10 exposure was estimated using AirQ+ software (version 2.2), developed by the World Health Organization Regional Office for Europe. AirQ+ applies externally derived epidemiological concentration–response functions to specified air-pollution exposure scenarios to estimate the associated health burden [12]. It does not establish causal relationships within the population being analysed.
In the present study, AirQ+ was used to estimate the AP of all-cause mortality associated with annual PM10 exposure among adults aged > 30 years. AP represents the proportion of the health outcome attributable to a specified exposure under the assumptions of the concentration–response function implemented in AirQ+. For a single exposure level, AP was calculated as:
where RR represents the relative risk corresponding to the specified PM10 exposure scenario. The relative-risk estimates and their 95% confidence intervals implemented in AirQ+ were used to derive the AP estimates and corresponding 95% confidence intervals reported.
Annual mean PM10 concentrations for 2022 and 2023 were evaluated using two counterfactual concentrations: 40 µg m−3, corresponding to the Turkish national annual PM10 limit, and 15 µg m−3, corresponding to the WHO annual air quality guideline value. The latter was used as a guideline-based counterfactual and should not be interpreted as a threshold below which no health risk exists.
Population and baseline mortality data for individuals aged > 30 years in 2022 were obtained from the Turkish Statistical Institute. These data were entered into AirQ+ for the health-impact assessment; however, the present study reports and compares AP rather than attributable numbers of deaths. For the 2023 exposure scenario, 2022 population and baseline mortality data were retained because substantial post-earthquake population displacement made the 2023 population denominator uncertain and official 2023 mortality data were not available at the time of the analysis.
Accordingly, differences in AP between the 2022 and 2023 exposure scenarios represent differences in the modelled proportion of all-cause mortality attributable to annual PM10 exposure under the specified assumptions and do not represent observed changes in mortality rates or observed numbers of deaths.
2.4. Statistical Analysis
Continuous variables are reported as mean ± standard deviation, while categorical variables are shown as frequencies (percentages). The number of days exceeding the daily threshold from 2022–2023 was compared using the Pearson chi-square test. The missForest v1.5 package, which has been shown to have high accuracy and low error rates in air pollution studies, was used to complete missing data [13,14]. To improve the readability and highlight underlying trends in the monthly distribution of PM10 exceedance days, a fourth-degree polynomial smoothing technique was applied to the data. In addition, graphs showing the raw distribution of daily PM10 averages were also included in the study. A p-value of less than 0.05 was regarded as significant. All statistical analyses were conducted using R software (version 4.2.0) (R: A language and environment for statistical computing, R Foundation for Statistical Computing, Vienna, Austria).
3. Results
3.1. Pm10 Value Results
According to the annual mean PM10 concentrations calculated from daily mean values, Malatya had the highest concentrations in both 2022 and 2023 (74.9 ± 38.2 µg m−3 and 88.6 ± 56.4 µg m−3, respectively), whereas Adıyaman had the lowest concentrations (25.6 ± 13.5 µg m−3 and 24.4 ± 11.1 µg m−3, respectively). Mean PM10 concentrations were lower in seven provinces and higher in four provinces in 2023 than in 2022. Among the provinces with higher PM10 concentrations in 2023, Hatay and Kahramanmaraş were also characterized by extensive structural damage following the earthquakes. The greatest decrease was observed in Elazığ (−13.4%), whereas the greatest increase was observed in Kahramanmaraş (33.0%). The Turkish national annual PM10 limit value of 40 µg m−3 was exceeded in both years in all provinces except Adıyaman and Elazığ; in Elazığ, the annual mean exceeded 40 µg m−3 in 2022 but not in 2023. Annual mean PM10 concentrations exceeded the WHO annual air quality guideline value of 15 µg m−3 in all provinces in both years.
For the mean of the daily maximum PM10 concentrations, Gaziantep had the highest value in 2022 (216.2 µg m−3), whereas Hatay had the highest value in 2023 (259.9 µg m−3). These values represent averages of daily maximum concentrations and should be distinguished from daily mean PM10 concentrations used for comparison with the 24-h air quality limit. The mean daily maximum concentrations were lower in three provinces and higher in eight provinces in 2023 than in 2022. The largest relative increases were observed in Kahramanmaraş (84.7%), Malatya (49.4%), and Hatay (37.0%). The highest mean daily minimum PM10 concentrations were observed in Kilis and Malatya in 2022 and in Malatya in 2023 (Table 1).
Table 1.
Mean, maximum and minimum values for the PM10 in 2022 and 2023 by province.
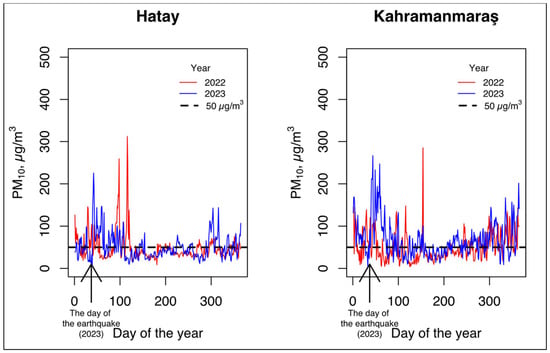
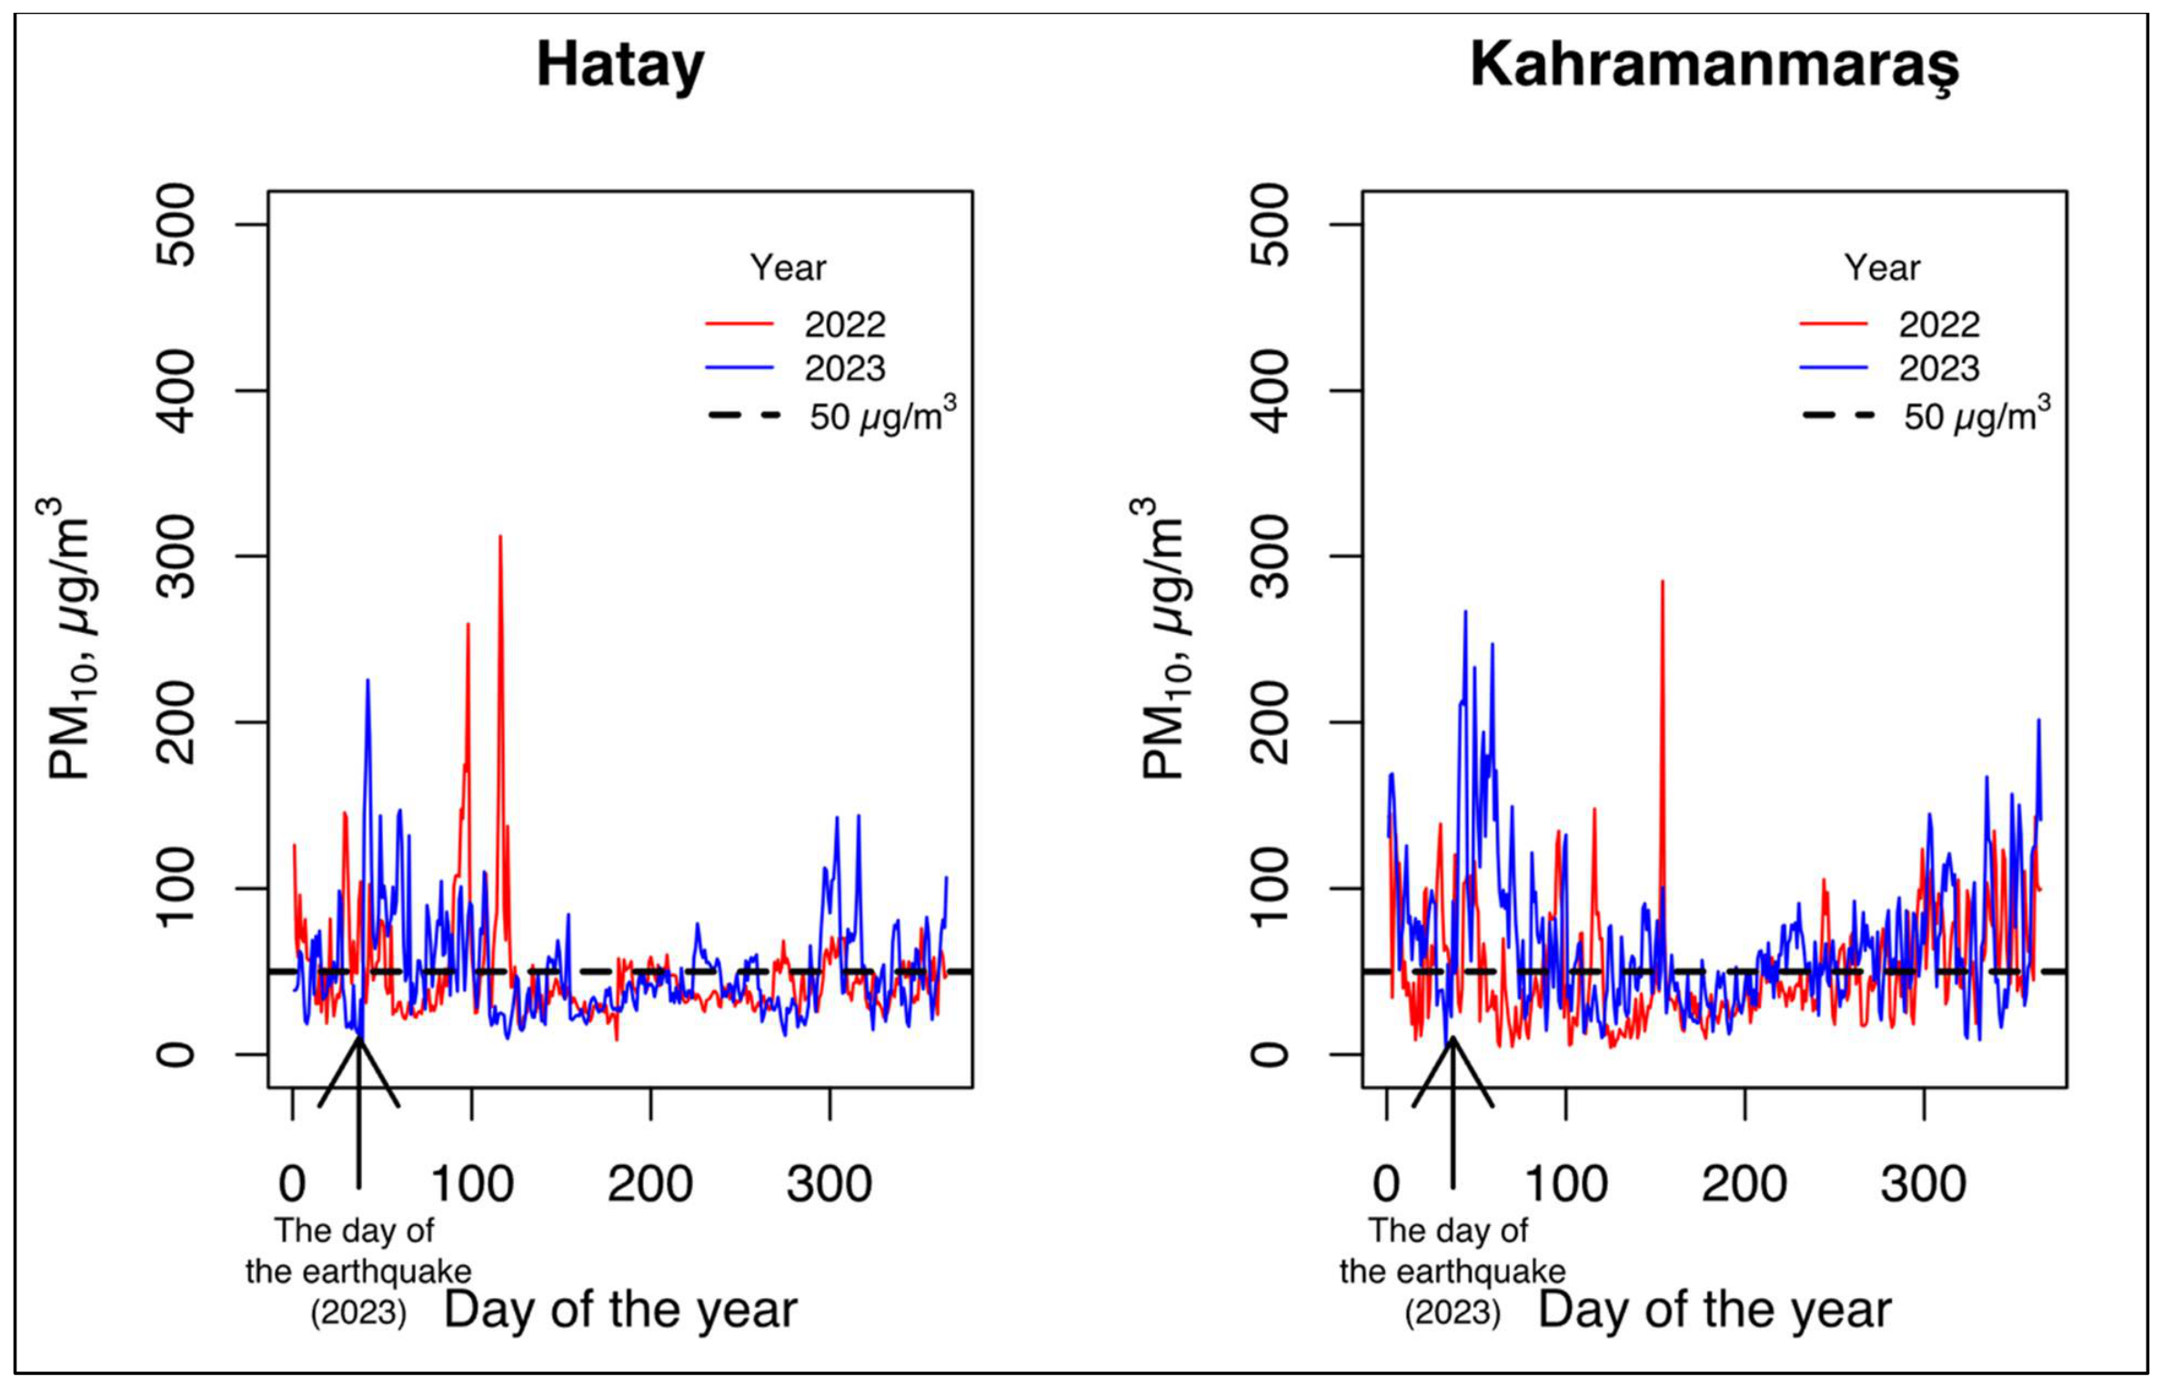
Figure 3 shows the daily mean PM10 concentrations in Hatay and Kahramanmaraş during 2022 and 2023. Considerable day-to-day variability was observed in both provinces. In 2022, days exceeding the national 24-h PM10 limit value of 50 µg m−3 occurred throughout the year, with frequent exceedances during winter and spring. In 2023, elevated PM10 concentrations and repeated exceedance days were also observed in both provinces. Several short-term peaks approached 300 µg m−3, while consecutive days with concentrations of approximately 200–250 µg m−3 were observed in Kahramanmaraş.
Figure 3.
PM10 levels by day in 2022 and 2023 for Hatay and Kahramanmaraş. These figures provide a descriptive representation of the temporal variation in PM10 concentrations; no formal analysis was performed to determine whether the timing or frequency of these peaks was specifically associated with the earthquakes.
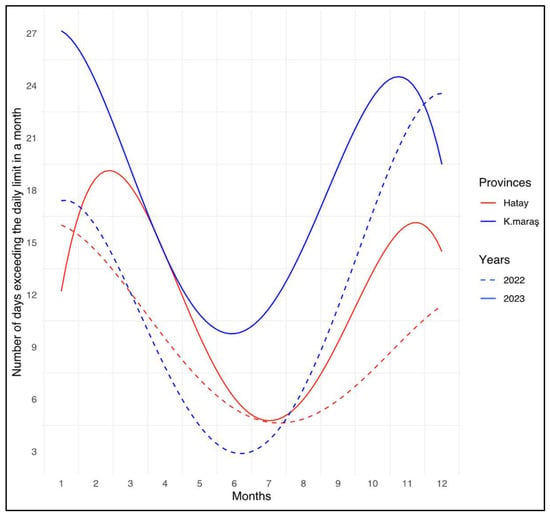
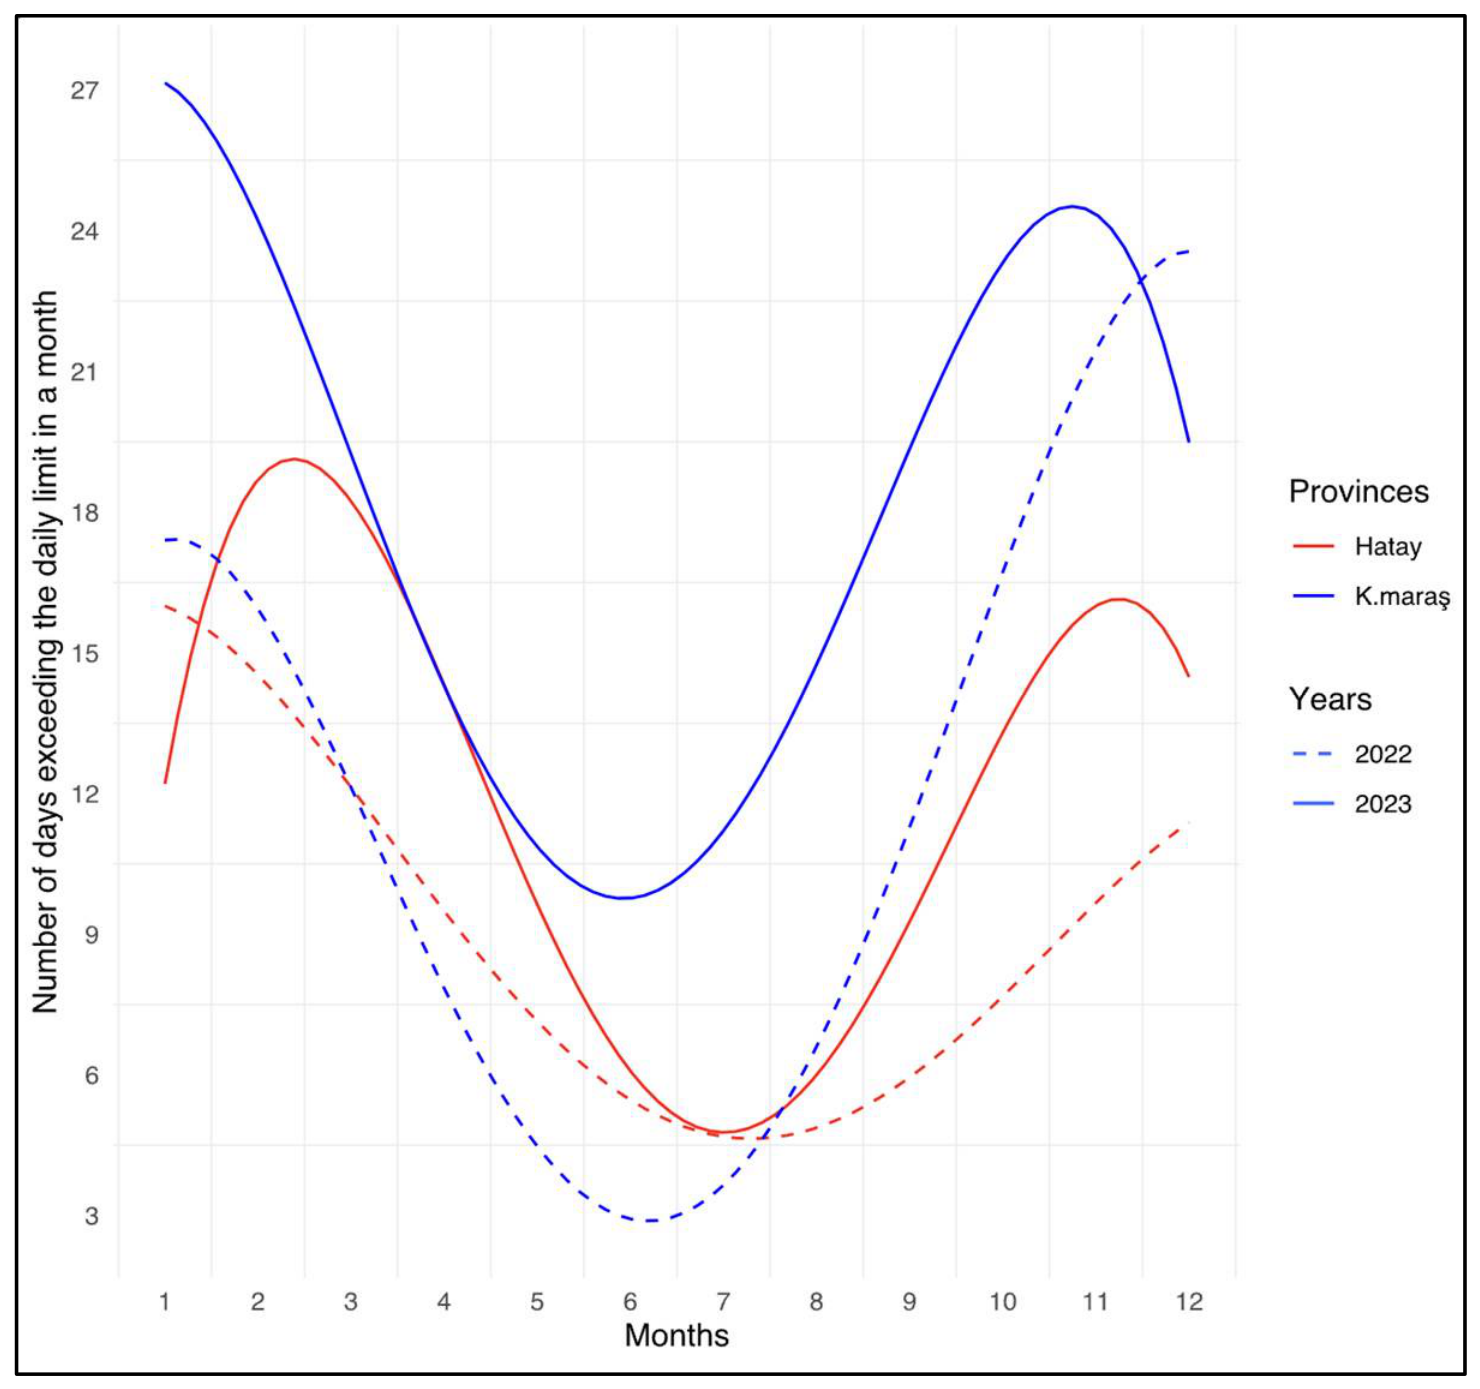
The number of days with daily mean PM10 concentrations exceeding the national 24-h limit value of 50 µg m−3 was greater than 35 days per year in both 2022 and 2023 in all provinces except Adıyaman. The number of exceedance days was lower in seven provinces in 2023 than in 2022; according to the Pearson chi-square comparisons, decreases in Adıyaman, Elazığ, and Kilis were statistically significant (p < 0.05). The number of exceedance days increased in four provinces, with statistically significant differences observed in Hatay, Kahramanmaraş, and Osmaniye (p < 0.05). Kilis had the highest number of exceedance days in 2022 (273 days), whereas Malatya had the highest number in 2023 (283 days). The greatest relative increase was observed in Kahramanmaraş (51.4%; from 144 to 218 days), followed by Hatay (33.2%; from 109 to 143 days) (Table 2). In Hatay and Kahramanmaraş, the number of exceedance days was higher in 2023 than in 2022 (Figure 4). The monthly distribution of exceedance days varied throughout 2023, with differences between the two years observed at several points during the year.
Table 2.
Comparison of the number of days exceeding the PM10 limit value in 2022 and 2023 by province.
Figure 4.
Distribution of the number of days in which the monthly PM10 value exceeds 50 µg m3 for Hatay and Kahramanmaraş in 2022 and 2023. These monthly patterns are presented descriptively and were not formally analysed to determine whether their timing was specifically associated with the earthquakes or subsequent recovery activities.
3.2. AirQ+ Software Results
Using 40 µg m−3 as the counterfactual concentration, the modelled attributable proportion (AP) of all-cause mortality associated with annual PM10 exposure ranged from 0% to 12.79% in 2022 and from 0% to 17.36% in 2023, with the lowest values in Adıyaman and the highest values in Malatya in both years. The greatest absolute increase in AP was observed in Kahramanmaraş (6.14 percentage points), followed by Osmaniye (4.87 percentage points). In 2023, the modelled AP was 2.48 times the 2022 value in Kahramanmaraş and 1.33 times the 2022 value in Hatay. Using 15 µg m−3, the WHO annual air quality guideline value, as the counterfactual concentration, the modelled AP ranged from 4.07% to 20.94% in 2022 and from 3.62% to 25.07% in 2023. The greatest absolute increases were observed in Kahramanmaraş and Osmaniye (5.60 and 4.41 percentage points, respectively). In 2023, the modelled AP was 1.42 times the 2022 value in Kahramanmaraş, 1.25 times in Osmaniye, and 1.07 times in Hatay (Table 3).
Table 3.
Modelled attributable proportion (%) of all-cause mortality among adults aged > 30 years associated with annual PM10 exposure, using counterfactual concentrations of 40 µg m−3 (national annual limit) and 15 µg m−3 (WHO annual air quality guideline), in 2022 and 2023 (95% confidence intervals).
4. Discussion
This study provides a descriptive assessment of PM10 patterns in 11 provinces affected by the 2023 Türkiye earthquakes, using 2022 as a reference year, together with a complementary AirQ+ health-impact assessment. The principal finding was geographical heterogeneity rather than a consistent regional increase. Annual mean PM10 concentrations were higher in four provinces and lower in seven provinces in 2023 than in 2022. The modelled attributable proportion also varied among provinces, reaching 17.36% in 2023 when 40 µg m−3 was used as the counterfactual concentration. These findings should be interpreted as a characterization of monitored air-quality conditions in the affected region, not as an estimate of the causal effect of the earthquakes.
Among the provinces with higher annual mean PM10 concentrations in 2023, Hatay and Kahramanmaraş were among those with extensive earthquake-related destruction. The number of days exceeding the national 24-h PM10 limit value of 50 µg m−3 was also higher in Hatay, Kahramanmaraş, and Osmaniye in 2023 than in 2022. However, these differences cannot be attributed specifically to the earthquakes because the present study did not control for meteorological conditions, regional dust transport, changes in human activity, or other time-varying factors. Previous studies provide context for the possibility of changes in particulate pollution following major earthquakes. Alver Şahin and Kaynak (2024) reported substantial dust pollution in several provinces affected by the February 2023 earthquakes in association with destruction, debris removal, and reconstruction activities [15]. International evidence provides a broader context for interpreting the geographical variability observed in the present study. Following the 1995 Great Hanshin Earthquake in Japan, particulate concentrations were reported to be approximately 1.5 times those measured in the preceding year [7]. Changes in particulate pollution were also documented following the Chi-Chi earthquake in Taiwan [16], while environmental air-quality changes associated with post-earthquake reconstruction were reported following the L’Aquila earthquake in Italy [17]. In contrast to studies emphasizing increased particulate pollution in specific disaster-affected locations, the present assessment identified heterogeneous patterns across 11 provinces, with annual mean PM10 concentrations increasing in four provinces and decreasing in seven between 2022 and 2023. These differences highlight the importance of geographical coverage and local environmental conditions when interpreting post-disaster air-quality measurements. However, differences in study design, monitoring periods, pollutant indicators, and environmental conditions limit direct comparisons across earthquake settings. Furthermore, the present study cannot determine whether the observed between-year differences were caused by earthquake-related activities or other contributing factors.
In contrast, the number of PM10 exceedance days was lower in seven provinces in 2023 than in 2022. This heterogeneity is important because it indicates that a uniform increase in PM10 was not observed across the earthquake-affected region. Reduced human activity, changes in industrial or transportation-related emissions, meteorological variability, regional dust transport, and differences in monitoring-station coverage may all have contributed to the observed patterns. In some provinces, measurements were obtained from only one monitoring station, limiting their spatial representativeness. Moreover, reports from the region raised concerns regarding whether available monitoring data fully represented local exposure conditions. These considerations reinforce the need for caution when interpreting province-level differences.
Meteorological and regional dust conditions are particularly important when comparing PM10 concentrations between years. PM10 levels may vary with temperature, precipitation, wind speed and direction, relative humidity, atmospheric mixing conditions, and regional dust transport. In 2022, for example, regional dust-transport events were reported during periods in which high PM10 concentrations were observed [18]. Because sufficiently complete meteorological data were not available for the study locations and periods, these factors could not be incorporated into the analysis. Consequently, differences between 2022 and 2023 should be interpreted as temporal differences observed in earthquake-affected provinces rather than earthquake-specific effects.
PM10 remains an important air-quality indicator because of both its concentration and frequency of exceedance. Zeydan and Pekkaya (2021) identified PM10 as an important pollutant in their evaluation of air-quality monitoring stations in Türkiye, considering both pollutant concentrations and exceedance frequencies [18]. Particulate matter exposure has also been associated with a range of adverse health outcomes. Zanobetti et al. (2000), for example, reported increases in hospital admissions for respiratory and cardiovascular conditions associated with increases in PM10 concentrations [19]. Ciabattini et al. (2021) reported an association between PM10 exposure and lung cancer risk in a systematic review and meta-analysis, while other epidemiological studies have examined associations between particulate exposure and cardiovascular and cerebrovascular outcomes [20,21] (Butland et al., 2017). These epidemiological findings provide a broader health context for assessing PM10 exposure but should not be interpreted as health outcomes directly observed in the present study.
In the present study, the modelled attributable proportion of all-cause mortality associated with annual PM10 exposure was higher in 2023 than in 2022 in several provinces. These estimates represent model-based differences in potential health burden obtained by applying an externally derived concentration–response function and should not be interpreted as observed increases in mortality or as evidence that long-term health effects caused by the earthquakes occurred during 2023. Previous applications of AirQ+ have similarly been used to quantify health burdens associated with particulate-matter exposure. Luo et al. (2020) assessed the health burden associated with several air pollutants in six urban areas in China, while Barzeghar et al. (2020) and Fallahizadeh et al. (2021) used AirQ+-based approaches to assess health outcomes associated with particulate-matter exposure [22,23,24]. Together, these studies illustrate the use of health-impact assessment models for estimating population-level burdens associated with air pollution rather than directly measuring individual health outcomes.
The present results also have implications for post-disaster air-quality surveillance. Maintaining monitoring capacity should be a priority, particularly in heavily affected areas, because several monitoring stations were unable to transmit data during and after the earthquakes and some provinces had limited spatial coverage. Contingency monitoring capacity, including mobile monitoring stations, may help maintain surveillance when fixed stations become unavailable. Monitoring should also include PM2.5 and other relevant pollutants in addition to PM10, because insufficient PM2.5 measurements prevented its evaluation in the present study. Where demolition and debris-removal activities are occurring, established dust-control practices, including dust suppression, appropriate containment and transport of debris, and protection of populations living or working near these activities, may help reduce particulate exposure. However, because the present study did not perform source-apportionment analysis, these activities should not be assumed to explain the observed PM10 patterns in individual provinces.
The scope of the present study is defined by several important data and design constraints. First, the analysis was based on a comparison of only 2022 and 2023 and did not include multiple pre-earthquake years; consequently, 2022 is used as a descriptive reference year rather than as a causal counterfactual, and background interannual variability cannot be characterized. Second, no unaffected comparison provinces were included. Because all 11 provinces in the study were affected by the earthquakes, changes specific to the affected region cannot be distinguished from broader temporal or regional trends. Third, meteorological variables and regional dust events could not be incorporated because sufficiently complete data were unavailable. These factors may substantially influence annual mean concentrations, daily peaks, and exceedance counts. These limitations are not merely residual sources of uncertainty; they delimit the research question that can be addressed by the available data. Accordingly, the present analysis is intended to document and characterize PM10 patterns in earthquake-affected provinces, not to estimate an earthquake-specific causal effect. Fourth, monitoring-station availability and spatial representativeness differed among provinces. Several stations became nonoperational following the earthquakes, and some provinces were represented by only one monitoring station, limiting the spatial representativeness of province-level estimates. Missing observations were addressed using the missForest imputation algorithm. The performance of this approach was evaluated through repeated masking experiments involving both isolated missing observations and consecutive missing-data blocks of varying lengths. Furthermore, sensitivity analyses comparing missForest with alternative imputation approaches demonstrated that the principal findings regarding PM10 exceedance days and the statistical significance of between-year comparisons were generally robust to the choice of imputation method (Supplementary Tables S2 and S3). Nevertheless, missing observations may not have occurred randomly, particularly in areas where monitoring infrastructure was disrupted by the earthquakes. Although the validation and sensitivity analyses support the robustness of the imputation procedure, they cannot fully exclude potential bias arising from nonrandom missingness or prolonged monitoring interruptions. In addition, the uneven distribution of monitoring stations may limit the representativeness of province-level PM10 estimates. Fifth, only PM10 could be evaluated consistently across the study region; other pollutants of public-health relevance, particularly PM2.5, could not be adequately assessed. Sixth, the Pearson chi-square comparisons of exceedance days should be interpreted as exploratory. Daily air-pollution observations may exhibit seasonality and serial autocorrelation, potentially violating the assumption of independence underlying these comparisons, and multiple province-level comparisons were performed without adjustment for multiple testing. The reported p-values therefore describe between-year differences within the available data and should not be interpreted as evidence of an earthquake-specific effect.
Finally, the AirQ+ results represent modelled attributable proportions rather than observed mortality outcomes. Although 2022 population and baseline mortality data were entered into the AirQ+ assessment, attributable case counts were not used in the present comparison because reliable 2023 population denominators were uncertain owing to substantial population displacement and official 2023 mortality data were unavailable at the time of analysis. The comparison therefore focused on AP under the specified annual PM10 exposure scenarios. The selected counterfactual concentrations of 40 µg m−3 and 15 µg m−3 represent the Turkish national annual limit and the WHO annual air quality guideline value, respectively. An AP of zero when the observed concentration is below a selected counterfactual is a consequence of the specified exposure scenario and should not be interpreted as indicating the absence of health risk below that concentration.
The present descriptive dataset provides a regional record of PM10 conditions during the first year following a major disaster and identifies important gaps in routine environmental surveillance. Establishing earthquake-specific effects would require a different analytical design, including multiple pre-earthquake years, suitable unaffected comparison regions, meteorological and regional dust indicators, more comprehensive station-level information, and time-series methods accounting for seasonality and autocorrelation. Additional monitoring of PM2.5 and other pollutants and source-apportionment analyses would further improve characterization of air pollution during disaster recovery. These requirements define a distinct causal research question beyond the descriptive scope of the present study.
5. Conclusions
This descriptive assessment of routine air-quality monitoring data revealed substantial geographical heterogeneity in ambient PM10 concentrations across the 11 provinces affected by the February 2023 Türkiye earthquakes. Compared with the 2022 descriptive reference year, annual mean PM10 concentrations increased in four provinces and decreased in seven in 2023, indicating that a uniform regional increase was not observed. The greatest relative increase occurred in Kahramanmaraş (33.0%), whereas the greatest decrease was observed in Elazığ (13.4%). The number of days exceeding the national daily PM10 limit increased from 144 to 218 in Kahramanmaraş and from 109 to 143 in Hatay. Furthermore, annual mean PM10 concentrations exceeded the WHO annual air-quality guideline of 15 µg m−3 in all provinces in both years, indicating persistent air-quality concerns throughout the study region.
The complementary AirQ+ assessment showed that the modelled attributable proportion of all-cause mortality associated with annual PM10 exposure varied considerably across provinces. Using the national annual limit of 40 µg m−3 as the counterfactual concentration, the modelled attributable proportion ranged from 0% to 17.36% in 2023, with the highest estimate observed in Malatya. These estimates represent model-based assessments of PM10-associated health burden rather than observed mortality outcomes or deaths attributable to the earthquakes.
Several methodological limitations should be considered when interpreting these findings. The analysis included only one pre-earthquake reference year, lacked unaffected comparison provinces and meteorological adjustment, and was affected by differences in monitoring-station coverage and missing observations. Furthermore, the absence of source-apportionment data prevented the identification of specific contributors to the observed PM10 patterns. Consequently, the differences between 2022 and 2023 cannot be interpreted as causal effects of the earthquakes or subsequent recovery activities.
Despite these limitations, the study provides a descriptive overview of ambient PM10 patterns and modelled health burdens across a large disaster-affected region. The findings highlight the importance of maintaining resilient, spatially representative, and continuous air-quality monitoring systems during disaster recovery. Strengthening monitoring infrastructure, expanding measurements to include additional pollutants such as PM2.5, and incorporating meteorological and source-specific information in future studies may improve environmental health surveillance and support evidence-informed public-health planning in disaster-prone regions.
Supplementary Materials
The following supporting information can be downloaded at: https://www.mdpi.com/article/10.3390/atmos17111132/s1, Table S1: Imputed province-day PM10 values by province, 2022–2023; Table S2. Validation of imputation methods by masking known values; Table S3. Sensitivity of the exceedance analysis to the imputation method (The significant or non-significant verdict (p < 0.05) was identical for every province under all four approaches.).
Author Contributions
S.N.A., A.U. and G.C. designed the study. S.N.A., H.E.A. and B.K. collated the data. A.U. and U.S. performed the statistical analysis. S.N.A., A.U., H.E.A. and B.K. interpreted the results. S.N.A., A.U., H.E.A. and B.K. wrote the manuscript. A.U. and G.C. created the tables and figures. S.N.A., A.U., H.E.A., B.K. and U.S. revised the manuscript. G.C. and U.S. supervised the whole study. All authors have read and agreed to the published version of the manuscript.
Funding
The authors report that no funding has been received for the study.
Institutional Review Board Statement
Ethics committee permission was not obtained because the data used in the study were made publicly available by the relevant institutions.
Informed Consent Statement
Not applicable.
Data Availability Statement
The datasets generated during and/or analyzed during the current study are available from the corresponding author upon reasonable request.
Acknowledgments
The authors would like to thank the Turkish Statistical Institute (TurkStat) and the Ministry of Environment, Urbanization and Climate Change for providing the relevant data. We would like to take a moment to remember and pay our deepest respect to the victims of the earthquake. The devastation caused by this disaster underscores the importance of continued research and preparedness in earthquake-prone areas. Our thoughts remain with the affected communities as we work for recovery and resilience in the face of adversity.
Conflicts of Interest
The authors declare that they have no competing interests.
References
- AFAD. 06 February 2023 Pazarcık-Elbistan (Kahramanmaraş) Mw 7.7–Mw 7.6 Earthquakes Report; AFAD: Ankara, Türkiye, 2023. Available online: https://deprem.afad.gov.tr/assets/pdf/Kahramanmara%C5%9F%20Depremi%20%20Raporu_02.06.2023.pdf?utm_source=chatgpt.com (accessed on 10 March 2024).
- T.C. Cumhurbaşkanlığı Strateji ve Bütçe Başkanlığı. 2023 Kahramanmaraş ve Hatay Depremleri Raporu; T.C. Cumhurbaşkanlığı Strateji ve Bütçe Başkanlığı: Ankara, Türkiye, 2023. Available online: https://www.sbb.gov.tr/wp-content/uploads/2023/03/2023-Kahramanmaras-ve-Hatay-Depremleri-Raporu.pdf (accessed on 10 March 2024).
- World Health Organization. WHO Global Air Quality Guidelines: Particulate Matter (PM2.5 and PM10), Ozone, Nitrogen Dioxide, Sulfur Dioxide and Carbon Monoxide; World Health Organization: Geneva, Switzerland, 2021. [Google Scholar]
- Gouveia, N. Time series analysis of air pollution and mortality: Effects by cause, age and socioeconomic status. J. Epidemiol. Community Health 2000, 54, 750–755. [Google Scholar] [CrossRef] [Scilit]
- International Agency for Research on Cancer (IARC). IARC: Outdoor Air Pollution a Leading Environmental Cause of Cancer Deaths. 2013. Available online: https://www.iarc.who.int/news-events/iarc-outdoor-air-pollution-a-leading-environmental-cause-of-cancer-deaths (accessed on 30 March 2024).
- Orellano, P.; Reynoso, J.; Quaranta, N.; Bardach, A.; Ciapponi, A. Short-term exposure to particulate matter (PM10 and PM2.5), nitrogen dioxide (NO2), and ozone (O3) and all-cause and cause-specific mortality: Systematic review and meta-analysis. Environ. Int. 2020, 142, 105876. [Google Scholar] [CrossRef] [Scilit]
- Gotoh, T.; Nishimura, T.; Nakata, M.; Nakaguchi, Y.; Hiraki, K. Air pollution by concrete dust from the Great Hanshin Earthquake. J. Environ. Qual. 2002, 31, 718–723. [Google Scholar] [CrossRef] [Scilit]
- Uprety, A.; Ozaki, A.; Higuchi, A.; Leppold, C.; Tanimoto, T. The 2015 Nepal earthquake and worsening air pollution in Kathmandu. Lancet Planet. Health 2019, 3, e8–e9. [Google Scholar] [CrossRef] [Scilit]
- Yamanda, S.; Hanagama, M.; Kobayashi, S.; Satou, H.; Tokuda, S.; Niu, K.; Yanai, M. The impact of the 2011 Great East Japan Earthquake on hospitalisation for respiratory disease in a rapidly aging society: A retrospective descriptive and cross-sectional study at the disaster base hospital in Ishinomaki. BMJ Open 2013, 3, e000865. [Google Scholar] [CrossRef] [Scilit]
- Turkish Statistical Institute. Population and Demography. Available online: https://veriportali.tuik.gov.tr (accessed on 10 March 2024).
- Resmî Gazete. Hava Kalitesi Değerlendirme ve Yönetimi Yönetmeliği. Resmî Gazete, 6 June 2008, No. 26898. Available online: https://havakalitesi.ibb.gov.tr (accessed on 21 March 2024).
- World Health Organization Regional Office for Europe. AirQ+: Software Tool for Health Risk Assessment of Air Pollution. Available online: https://www.who.int/europe/tools-and-toolkits/airq---software-tool-for-health-risk-assessment-of-air-pollution (accessed on 10 March 2024).
- Alsaber, A.R.; Pan, J.; Al-Hurban, A. Handling complex missing data using random forest approach for an air quality monitoring dataset: A case study of Kuwait environmental data (2012 to 2018). Int. J. Environ. Res. Public Health 2021, 18, 1333. [Google Scholar] [CrossRef] [Scilit]
- Stekhoven, D.J.; Bühlmann, P. MissForest—Non-parametric missing value imputation for mixed-type data. Bioinformatics 2012, 28, 112–118. [Google Scholar] [CrossRef] [Scilit]
- Alver Şahin, Ü.; Kaynak, B. Questioning whether there was a short-term interaction between the 6 February 2023 earthquakes and air quality parameters in Türkiye. Chemosphere 2024, 347, 140616. [Google Scholar] [CrossRef] [Scilit]
- Fang, G.C.; Chang, C.N.; Wu, Y.S.; Fu, P.P.C.; Yuen, W.H.; Cheng, C.D.; Chen, S.C. The study of Central Taiwan particles concentration variations during earthquake period. Environ. Int. 2001, 26, 561–566. [Google Scholar] [CrossRef] [Scilit]
- Di Biase, L.; Di Lisio, P.; Pace, L.; Arrizza, L.; Fattorini, S. Use of lichens to evaluate the impact of post-earthquake reconstruction activities on air quality: A case study from the city of L’Aquila. Biology 2022, 11, 1199. [Google Scholar] [CrossRef] [Scilit]
- Zeydan, Ö.; Pekkaya, M. Evaluating air quality monitoring stations in Turkey by using multi criteria decision making. Atmos. Pollut. Res. 2021, 12, 101046. [Google Scholar] [CrossRef] [Scilit]
- Zanobetti, A.; Schwartz, J.; Dockery, D.W. Airborne particles are a risk factor for hospital admissions for heart and lung disease. Environ. Health Perspect. 2000, 108, 1071–1077. [Google Scholar] [CrossRef]
- Ciabattini, M.; Rizzello, E.; Lucaroni, F.; Palombi, L.; Boffetta, P. Systematic review and meta-analysis of recent high-quality studies on exposure to particulate matter and risk of lung cancer. Environ. Res. 2021, 196, 110440. [Google Scholar] [CrossRef] [Scilit]
- Butland, B.K.; Atkinson, R.W.; Crichton, S.; Barratt, B.; Beevers, S.; Spiridou, A.; Hoang, U.; Kelly, F.J.; Wolfe, C.D.A. Air pollution and the incidence of ischaemic and haemorrhagic stroke in the South London Stroke Register: A case–cross-over analysis. J. Epidemiol. Community Health 2017, 71, 707–712. [Google Scholar] [CrossRef] [Scilit]
- Luo, H.; Guan, Q.; Lin, J.; Wang, Q.; Yang, L.; Tan, Z.; Wang, N. Air pollution characteristics and human health risks in key cities of Northwest China. J. Environ. Manag. 2020, 269, 110791. [Google Scholar] [CrossRef] [Scilit]
- Barzeghar, V.; Sarbakhsh, P.; Hassanvand, M.S.; Faridi, S.; Gholampour, A. Long-term trend of ambient air PM10, PM2.5, and O3 and their health effects in Tabriz city, Iran, during 2006–2017. Sustain. Cities Soc. 2020, 54, 101988. [Google Scholar] [CrossRef] [Scilit]
- Fallahizadeh, S.; Kermani, M.; Esrafili, A.; Asadgol, Z.; Gholami, M. The effects of meteorological parameters on PM10: Health impacts assessment using AirQ+ model and prediction by an artificial neural network (ANN). Urban Clim. 2021, 38, 100905. [Google Scholar] [CrossRef] [Scilit]

Disclaimer/Publisher’s Note: The statements, opinions and data contained in all publications are solely those of the individual author(s) and contributor(s) and not of MDPI and/or the editor(s). MDPI and/or the editor(s) disclaim responsibility for any injury to people or property resulting from any ideas, methods, instructions or products referred to in the content. |
© 2026 by the authors. Licensee MDPI, Basel, Switzerland. This article is an open access article distributed under the terms and conditions of the Creative Commons Attribution (CC BY) license.