


Abstract
The climate-relevant emission burden of internationally attended sporting events is rarely quantified. The data that determine it, namely where spectators come from and how they travel, are also rarely collected. We develop a transparent activity-based framework for event-scale greenhouse gas and co-pollutant inventories. The framework grades every parameter by provenance, separates person-times from unique attendees, propagates uncertainty by Monte Carlo simulation and attributes mitigation with exact Shapley values. We also list the event-specific data that an application requires. We illustrate the framework with the 2024 Shanghai Formula 1 Chinese Grand Prix (about 200,000 spectator person-times), combining official attendance data with documented assumptions. Under these assumptions, the event emitted 24,306 t CO2e (uncertainty interval 20,656–32,980 t), of which aviation contributed 78.7% and race-car fuel 0.4%. Aviation also supplied 94% of the 96.5 t of NOX; only 5–6 t of this was released in landing-and-take-off cycles. Ambitious 2030 measures cut gross emissions by 27.6–43.9%, leaving 56% of a frozen-technology baseline. The results depend on unverified spectator travel assumptions, which dominate the uncertainty. A spectator origin-and-mode survey would therefore be the most valuable addition to future event inventories.
1. Introduction
Large international sporting events are short, spatially concentrated perturbations of the atmosphere. A single event weekend can move hundreds of thousands of people across a metropolitan region, a country and, increasingly, the world within two or three days. Because the associated demand is temporally compressed and spatially focused, mega events have long been used as natural experiments in atmospheric science, most often to study the air quality response to temporary emission control measures [1,2,3,4]. Work on the 2008 Beijing Olympics, the 2010 Guangzhou Asian Games and subsequent Chinese events documents measurable short-term improvements in criteria pollutants when traffic and industrial activity are restricted [2,3,4]. A recent evaluation of a Chinese national games, which used machine learning weather normalisation and an augmented synthetic control method, found that traffic-focused measures reduced NO2 substantially but had limited and sometimes counterproductive effects on PM2.5 and O3 [1].
The same compression that makes these events useful as air quality experiments also makes them concentrated sources of climate-relevant emissions, although the causal chain behind them has attracted far less attention. An international event creates a temporary, spatially focused concentration of transport and venue energy demand. Within a few days, this demand is met overwhelmingly by fossil fuel combustion. The combustion releases CO2 together with NOX, water vapour and aerosol, a large share of it from aircraft at cruise altitude. The resulting radiative forcing constitutes an atmospheric burden that is neither local nor short-lived, even though the activity that produced it was both. A major internationally attended event therefore behaves as a temporary emission hotspot whose imprint on the atmosphere long outlasts the event itself. Quantifying that burden requires knowing where combustion occurs, in which energy carrier and on whose behalf. Aggregate event carbon reporting does not provide this information, which is why current event accounting systematically understates the aviation-related component.
The greenhouse gas dimension of mega events has been studied far less systematically than their air quality, and the existing literature is methodologically heterogeneous. Huang and Lin [5] quantified the carbon emissions associated with the preparatory work for the Beijing Winter Olympics. Wicker [6] showed that the carbon footprint of active sport participants is dominated by travel rather than by facility use. Gandola and Asdrubali [7] proposed a general accounting methodology for large sports events spanning participant travel, accommodation, event energy, food and waste. McCullough et al. [8] analysed the Council for Responsible Sport standard across running events and reported that participant and spectator travel routinely accounts for most reported emissions but is the least well-measured category. In the Chinese context, Wang et al. [9] produced a life-cycle carbon footprint and uncertainty analysis of a mega sporting event, providing transferable parameter values for accommodation, catering and waste. Despite these advances, four gaps persist. First, most event studies report a single aggregate number without an explicit energy system representation, so the result cannot be interrogated for mitigation policy. Second, uncertainty is either omitted or handled qualitatively, even though the underlying activity data are largely unobserved. Third, almost no study distinguishes emissions that an organiser can act on from emissions determined by exogenous transport and power systems—a distinction that decides whether carbon-neutrality claims are credible. Fourth, and most relevant to the atmospheric literature, event inventories report combustion CO2 alone. Yet the total CO2-equivalent emissions of aviation, which dominate these inventories, are 1.0 to 4.0 times CO2 emissions alone, depending on the emission metric and time horizon [10]. The carbon inventory of an internationally attended event therefore understates its climate-relevant burden.
Motorsport is an informative and under-studied case. Formula 1 (F1) has committed to Net Zero by 2030 and reported a 2024 footprint of 168,720 t CO2e, 26% below its re-baselined 2018 value of 228,793 t CO2e; this reduction was achieved while the calendar expanded from 21 to 24 races [11]. Much of that reduction came from factories and facilities (−59%) and from sustainable aviation fuel (SAF) in freight logistics, which saved more than 8000 t CO2e in 2024, roughly 19% of the associated air freight emissions [11]. However, the F1 corporate inventory excludes spectator travel. The emissions generated by an audience travelling to a race are attributed to nobody: not to the promoter, whose boundary excludes them, and not to the host city, whose territorial inventory misses inbound aviation. Yet this accounting gap is where the largest emissions lie.
The 2024 Shanghai Chinese Grand Prix offers an unusually well-documented case. Held on 19–21 April 2024 at the Shanghai International Circuit, it marked the return of the event after a four-year hiatus and the twentieth anniversary of the Chinese Grand Prix. It was also the first sprint weekend of the 2024 season, comprising a 19-lap sprint and a 56-lap, 305.066 km grand prix on a 5.451 km circuit [12]. Municipal authorities reported approximately 200,000 spectator person-times over three days, of which about 80% came from outside Shanghai and about 10% from overseas. This was the highest non-local share in the event’s twenty-year history, compared with 45.82% in 2019 [13,14]. The event was assessed to have generated CNY 1.406 billion in direct economic impact [15]. In parallel, Shanghai has published official 2024 public-grid and residual-mix electricity CO2 emission factors [16]. These factors remove one of the largest sources of arbitrariness in Chinese event-scale carbon accounting.
Here, we develop a bottom–up activity-based carbon accounting (ABCA) framework for internationally attended events. The framework is coupled to life-cycle emission factors, Monte Carlo uncertainty propagation and scenario analysis, and we illustrate it with the 2024 Shanghai Chinese Grand Prix. It follows the demand-driven activity → energy → emissions logic of energy system accounting platforms such as LEAP [17], which are widely applied to city and provincial decarbonisation planning in China [18,19,20]. Unlike these platforms, it works at event resolution, so that every activity level, intensity and factor is explicit, auditable and reproducible. This matters because the decisive quantities at event scale—spectator origins, mode shares and trip distances—are unobserved, and they must be carried through the calculation as distributions rather than point values. Because no spectator travel survey exists for this event, the application relies on documented assumptions for spectator mode shares, trip distances and attendance days. We therefore present it as an illustration of the framework under stated assumptions, not as a measured inventory of the event. We test the assumptions against external evidence (Section 2.3.4) and specify the event-specific data that an application requires and how they can be collected (Section 4.6). The model code is provided with instructions for applying it to other events (Code S1). We address four questions. (RQ1) What are the major energy-consuming activities and emission sources of an internationally attended motorsport event, and how are they distributed across sectors and energy carriers? (RQ2) How much larger is the climate-relevant burden once non-CO2 aviation effects are included? (RQ3) How much can mobility, procurement, logistics and efficiency interventions plausibly reduce those emissions by 2030? (RQ4) Can any combination of measures available to an event organiser deliver carbon neutrality without offsets and, if not, how large is the irreducible residual?
2. Materials and Methods
2.1. Case Description and System Boundary
The Shanghai International Circuit is located in Jiading District, approximately 30 km northwest of the Shanghai city centre, and is served by Line 11 of the Shanghai Metro. The 2024 Chinese Grand Prix ran a sprint format: free practice and sprint qualifying on 19 April, the sprint race and grand prix qualifying on 20 April, and the grand prix on 21 April, with 10 teams and 20 drivers entered [12].
We adopt a cradle-to-event-gate boundary covering the six-day operational window (two days of build-up, three race days and one day of teardown). The inventory covers eight demand sectors: (i) spectator travel, disaggregated into inter-city and local access legs; (ii) team, official and media travel; (iii) accommodation; (iv) circuit operation; (v) freight and logistics; (vi) race operation; (vii) catering; and (viii) waste. In GHG Protocol terms the boundary spans Scope 1 (on-site fuel combustion, generators, race and support vehicles), Scope 2 (purchased electricity at the circuit) and the material Scope 3 categories (spectator and staff travel, accommodation, upstream freight, waste treatment) [21,22]. Embodied carbon in circuit construction, permanent infrastructure and team factory operations is excluded. These emissions are amortised over decades, and including them would turn an event footprint into a full life-cycle assessment of the sport. Figure 1 summarises the boundary and the model chain.
Figure 1.
System boundary and computational chain of the activity-based carbon accounting model for the 2024 Shanghai Formula 1 Chinese Grand Prix. Activity levels in each demand sector are converted to final energy by carrier-specific intensities and then to CO2e using IPCC default combustion factors and officially published Chinese grid emission factors.
2.2. The Activity-Based Carbon Accounting Framework
The model is a bottom–up accounting structure in which final energy demand is built from activity levels and energy intensities, and emissions follow from carrier-specific life-cycle factors. For transport, the calculation chain is as follows:
where Ai is passenger-kilometre demand on mode i, N the number of travellers, Si the mode share, Di the round-trip distance, EIi the energy intensity per passenger-kilometre, EFi the emission factor of the carrier and Ci the resulting CO2e. For road modes, the intensity is not asserted per passenger-kilometre but derived from a vehicle-level fuel or electricity consumption εi and an explicit occupancy oi,
which avoids the order-of-magnitude errors that arise when vehicle-level consumption is applied directly per passenger.
Ai = N × Si × Di, Ei = Ai × EIi, Ci = Ei × EFi
Inter-city travel is charged to unique travellers rather than to daily admissions. Writing Pg for the spectator person-times of origin group g and dg for the mean number of days a member of that group attends, the number of unique attendees is
so that long-distance round trips are allocated to Ug while local access travel is charged per attendance day. With P = 200,000 person-times, group shares of 20%, 70% and 10% and dg = 1.5, 2.0 and 2.5 for local, domestic non-Shanghai and international spectators, this gives 26,667, 70,000 and 8000 unique attendees, respectively (104,667 in total). Omitting this step over-counts inter-city travel by a factor equal to the average number of days attended. This error is easily made when an inventory works directly from published attendance figures.
Accommodation, circuit operation and catering follow the same chain, with the transport activity variable replaced by an activity quantity Qj—person-nights, operational days and meals served:
Ej = Qj × EIj, Cj = Ej × EFj
Freight is computed on tonne-kilometres by summing over transport modes m the shipped tonnage T, its modal split ψm, the leg length Lm and the mode-specific factor EFm,
The inventory is closed by the following:
where k indexes the eight demand sectors, σk is the share of sector k, R the purchased carbon removals and I the emission intensity per spectator person-time. The model is implemented in Python 3.12 and mirrored in a fourteen-sheet spreadsheet (Table S1). In the spreadsheet, the deterministic modules recalculate live from the input and emission factor sheets, so the inventory can be re-run without executing code; the Monte Carlo, scenario and co-pollutant sheets report the output of the accompanying Python model. The Python model is the reference implementation. It reads an optional parameter file, so the framework can be applied to another event by replacing the event-specific inputs. It also regenerates every table and figure of this paper (Code S1).
2.3. Activity Data, Parameterisation and Data Quality Grading
Because event-scale inventories mix official statistics with modelling assumptions, we grade every parameter by provenance: A, official or event-organiser data; B, derived arithmetically from grade A data; C, literature or standard values; D, scenario assumptions in the absence of public data. The grading is reported alongside every parameter (Table 1) and carried through to the uncertainty analysis, in which grade C and grade D parameters receive the widest distributions. No grade D value is described anywhere in this paper as an observation.
Spectator numbers and the two published origin shares are grade A [13,14]. The municipal releases state both “about 80% from outside Shanghai” and “about 10% from overseas”. We therefore treat the categories as mutually exclusive (20% Shanghai residents, 70% domestic non-Shanghai and 10% international) rather than summing the two published shares, so the 70% and 20% shares are derived from them (grade B). Domestic non-Shanghai attendees are further split 55:45 between the Yangtze River Delta (250 km one-way) and other provinces (1000 km by surface mode, 1400 km by air), because a single national average distance would misrepresent both groups. The evidence for these distances is given in Section 2.3.4. Circuit length, lap counts, race distance and driver numbers are grade A [12]. Team, official and media headcounts, circuit electricity, freight tonnage and race-car fuel intensity are not publicly disclosed for this event. They are therefore grade D and are parameterised at central values with wide bounds. Accommodation energy intensities follow Wang et al. [9]. Table 1 lists the principal parameters; the complete 78-parameter database is given in Table S1.
Table 1.
Principal model parameters for the 2024 Shanghai Formula 1 Chinese Grand Prix, with data quality grades (A: official; B: derived; C: literature; D: scenario assumption). pkm = passenger-kilometre; vkm = vehicle-kilometre; pn = person-night. Domestic-travel mode shares are attendance-weighted blends of the Yangtze River Delta and other province segments, whose separate baseline settings are given in Table 2. The full parameter database is provided in Table S1; the evidence for the spectator travel distances is given in Table S2.
Table 2.
Scenario definitions. S0 is the 2024 event as delivered. The frozen-technology 2030 baseline scales the 2024 structure to 2030 attendance without technological or behavioural change and serves as the counterfactual for the attribution analysis. Effective electricity factors combine the background grid trajectory with market-based renewable procurement.
2.3.1. Emission Factors
Fuel combustion factors are IPCC 2006 defaults [21]: 71.5 kg CO2 GJ−1 for jet kerosene, 69.3 for gasoline, 74.1 for diesel and 56.1 for natural gas. Jet kerosene, gasoline and diesel are converted from volume to energy with lower heating values of 34.8, 32.2 and 35.9 MJ L−1, respectively; natural gas is accounted for directly on an energy basis. Electricity consumed in Shanghai—circuit operation, metro, hotels, catering—uses the officially released 2024 Shanghai public-grid factor of 0.4701 kg CO2 kWh−1; the corresponding residual-mix factor is 0.4840 kg CO2 kWh−1 [16]. Electricity consumed outside Shanghai, principally by inter-provincial rail, uses the 2023 national average factor of 0.5306 kg CO2 kWh−1 [28]. Under the market-based convention applied by the Shanghai ecology and environment authority, procured green electricity is accounted at zero [16]; this is how renewable procurement enters the scenarios. Freight uses mode-level factors of 0.602, 0.016 and 0.062 kg CO2 t-km−1 for air, sea and road [22,29]; air freight is represented through its implied jet-fuel demand so that SAF blending acts on the carrier rather than on an aggregate factor. Waste treatment uses 0.55, 0.35 and 0.02 t CO2e t−1 for landfill, incineration and recycling [9,21]. SAF is credited on a life-cycle basis at a 70% reduction against conventional jet kerosene, consistent with certified pathways under CORSIA [30], so that a blend share β acts on the carrier factor as
where κ is the residual life-cycle intensity of the sustainable fraction relative to conventional kerosene. Renewable electricity procurement enters in the same way: under the market-based convention a procured share ρ is credited at zero [16], so that the effective factor is
with the location-based result being recovered by setting ρ = 0. Both conventions are reported in Table 2.
EFjet,eff = EFjet[1 − β(1 − κ)], κ = 0.30,
EFel,eff = (1 − ρ) × EFel,grid,
2.3.2. Illustrative Adjustment for Non-CO2 Aviation Effects
Because aviation dominates the inventory, and because aviation’s climate effect is not confined to CO2, we report an illustrative non-CO2-adjusted indicator alongside the carbon inventory. Contrail cirrus, NOX-driven ozone and methane changes, water vapour and aerosol together give global aviation an effective radiative forcing (ERF) about three times that of its accumulated CO2 [10]. However, that ratio describes historical forcing rather than the effect of a given emission, so it is not an emission metric. We instead use emission weighting factors (EWF), defined as the ratios of total aviation CO2-equivalent emissions to aviation CO2 emissions under a stated emission metric. Taken from Table 5 of Lee et al. [10], they are 1.1 for GTP100, 1.7 for GWP100, 2.3 for GWP50 and 3.0 for GWP*100. The GWP100-based value of 1.7 is used as the central case. The GWP* value describes the current warming rate of a growing global fleet rather than the effect of a single emission and is shown only as an upper bound [10]. Contrail cirrus and the high-altitude NOX and water-vapour effects arise at cruise level. The factor is therefore applied only to the cruise share of aviation CO2, excluding the landing-and-take-off (LTO) fuel estimated by stage length in Section 2.3.3. This gives short domestic flights, whose LTO share is about 12%, a lower effective weighting than long-haul flights (about 4%). The same factors are applied to passenger and freight flights, because the non-CO2 effects depend on the fuel burned and the flight altitude rather than on the payload:
where Cav is the cruise-phase component of aviation CO2, λ the emission weighting factor and Cadj the non-CO2-adjusted indicator; λ = 1 recovers the CO2e inventory exactly. This quantity is an order-of-magnitude indicator of climate relevance, not an emission inventory. The factors are global averages that do not resolve how contrail formation depends on route, season and time of day; emission metrics are not additive across gases with different lifetimes; and their application to individual flights or events remains contested [10]. All headline results, scenarios and mitigation analyses are computed on the CO2e basis. The non-CO2-adjusted indicator is reported only in Section 3.2, where it is varied across emission metrics to test whether any conclusion depends on the value chosen, and is discussed in Section 4.1.
Cadj(λ) = λ × Cav + (Cgross − Cav)
2.3.3. Co-Pollutant Emission Factors
Air pollutant emissions are computed from the same fuel and electricity quantities that drive the carbon inventory, so the two inventories are consistent by construction. Aviation factors are taken from the EUROCONTROL Standard Inputs for Economic Analyses [31]: 14.8 kg NOX, 3.25 kg CO, 0.32 kg total hydrocarbons (reported as NMVOC in Section 3.3) and 0.092 kg PM per tonne of jet kerosene, together with 0.84 kg SO2 per tonne at a fuel sulphur content of 440 ppm. Road factors are the EMEP/EEA Tier 1 fuel-specific values [27]: for petrol passenger cars, 3.98 g NOX, 48.36 g CO, 7.75 g NMVOC and 0.02 g PM per kilogram of fuel; for heavy-duty diesel, 25.95 g NOX, 6.10 g CO, 0.90 g NMVOC and 0.55 g PM per kilogram. On-site generators use the EMEP/EEA non-road Tier 1 factors for gas oil [32], 32.63 g NOX, 10.77 g CO, 3.38 g NMVOC and 2.10 g PM per kilogram; an SO2 factor of 0.02 g per kilogram is applied to all road and non-road liquid fuels. Black carbon follows from the EMEP/EEA black-carbon fractions of PM (0.12 for petrol, 0.53 for heavy-duty diesel and 0.62 for non-road diesel [27,32]) and from an assumed black-carbon fraction of 0.10 for jet kerosene. For electricity, the Chinese thermal power pollutant intensities of 133 mg NOX, 83 mg SO2 and 17 mg PM per kilowatt-hour [33] are scaled by the fossil share of the grid, taken as the ratio of the applicable grid CO2 factor to the national fossil-power factor of 0.8273 kg CO2 kWh−1 [28]. This gives 75.6 mg NOX kWh−1 for the Shanghai grid and 85.3 mg NOX kWh−1 for the national grid. Because the Tier 1 road factors describe an older European fleet, they are upper estimates for the China 6 vehicles operating in Shanghai. The road contribution is, however, too small for this to affect any conclusion drawn here.
The partition of aviation emissions between the LTO cycle, which by convention covers aircraft operations below 3000 ft (914 m) above ground level, and the climb, cruise and descent phases is estimated by stage length (Table S3). The 914 m ceiling is a regulatory convention, not a property of the atmosphere. We use it only as an approximate proxy for near-surface release, since the actual mixing-layer height varies with location, season and time of day and may lie well below or above it. Each air segment of the model is assigned a representative aircraft: an A320 for domestic flights of about 1400 km, an A330-200/300 for regional flights of 1000–2500 km and a 777-200/300 for long-haul passenger and freighter flights. Its number of flights follows from its passenger-kilometres and an assumed 130–160 passengers per narrow-body and 240–300 per wide-body departure, or 80–100 t of payload per freighter. Multiplying the number of flights by the fuel and NOX per LTO cycle of the IPCC Tier 2 aircraft table [21] (770 kg of fuel and 9.01 kg of NOX for the A320, 2230 kg and 35.57 kg for the A330 and 2560 kg and 52.81 kg for the 777) gives the LTO fuel and LTO NOX of each segment. Cruise NOX is the remainder of the fuel-based aviation total. Each flight contains one LTO cycle, half of it at each end, so half of the LTO emissions of a round trip occur at Shanghai’s airports.
2.3.4. Evidence for the Spectator Travel Assumptions
The spectator travel parameters that have no event-specific source were checked against external evidence (Table S2; distance_evidence.py in Code S1). For distances, we computed great-circle distances from Shanghai. The 26 other cities of the central area of the Yangtze River Delta [34] lie 81–428 km from Shanghai (median 247 km), consistent with the one-way distance of 250 km and its range of 150–400 km. The 27 provincial-level capitals outside the delta lie 610–3267 km away, with a mean of 1402 km and an interquartile range of 960–1670 km, consistent with the air distance of 1400 km and its range of 1000–2000 km. The eight capitals within 1000 km of Shanghai, from which surface travel is realistic, correspond to road or rail distances of about 950–1020 km for detour factors of 1.2–1.3, consistent with the surface distance of 1000 km. The domestic mode shares (Table 1) were set so that high-speed rail dominates within the delta, while air and high-speed rail share the longer trips. This is the pattern documented for Chinese domestic routes, where competition between the two modes depends on route distance and rail travel time [35,36]. They have not, however, been observed for this event.
The international long-haul distance of 7000 km is the least constrained distance in the model. The main long-haul markets lie 7900–11,900 km from Shanghai (Sydney to New York), whereas Hong Kong, Macao and Taipei lie 690–1275 km away and accounted for about 28% of Shanghai’s 6.7 million inbound tourist trips in 2024 [37]. If international spectators followed this mix, with 28% of them travelling about 1000 km, the event total would be 10.2% lower (21,832 t CO2e) and aviation would still contribute 76.3% of it. We report this as an alternative origin case rather than adopting it, because the origins of motorsport spectators need not follow those of general inbound tourism.
No public source reports how many days each spectator attended. The values of 1.5, 2.0 and 2.5 days are bounded by the three-day race weekend and assume that visitors who travel further attend more of it. Because the number of unique attendees, and hence of inter-city round trips, is inversely proportional to the days attended, this parameter cannot be derived from attendance statistics. It requires ticket or survey data, which studies of sport-event travel show can be collected at modest cost [38,39]. Such data matter because travel has been identified as the largest component of the environmental footprint of major sports events [40,41]. For the operational grade D parameters (personnel, freight and circuit electricity), the only external evidence is Formula 1’s own disclosure, which is used as an order-of-magnitude check in Section 3.4 rather than for calibration. All of these parameters are propagated with the ranges of Table S1 in the uncertainty analysis.
2.4. Scenario Design
Three scenarios plus a frozen-technology reference are constructed (Table 2). Both forward scenarios grow attendance to 220,000 person-times, consistent with the observed trajectory, so that mitigation is measured against a growing rather than a static event. Background grid decarbonisation follows an independent trajectory for the Shanghai public grid (0.4701 kg CO2 kWh−1 in 2024 to 0.400 in 2030), reflecting the decline observed since the 2022 peak of 0.4850 kg CO2 kWh−1 [16] and national power-sector targets. The national average factor applied to electricity consumed outside Shanghai follows a parallel path from 0.5306 to 0.445 on the same basis. Renewable procurement by the event is modelled separately, so that the two effects can be attributed independently.
S0 Business-as-Usual is the 2024 event as delivered. The frozen-technology 2030 baseline scales that structure to 2030 attendance with no technological or behavioural change. It is the appropriate counterfactual for judging mitigation, because a reduction measured against 2024 would implicitly credit the event for growth it did not avoid. S1 Green F1 combines mobility, venue and supply chain measures: rail and public transport shares rise while private car and domestic aviation shares fall, road electrification reaches 60%, 60% of event electricity is procured renewably, SAF reaches 15% for passenger flights and 30% for freight, air freight shifts to sea, and hotels and venue systems gain 18–20% in efficiency. S2 Net-Zero F1 pushes every lever to its plausible technical limit—100% renewable procurement, 80% road electrification, 35% passenger SAF and 50% freight SAF, 30% air freight, fully sustainable race fuel—and neutralises the residual with carbon removal. Ambition levels are deliberately aligned with F1’s own Net Zero 2030 commitment [11], so that the results relate to a stated corporate target rather than to an abstract construct.
2.5. Uncertainty, Sensitivity and Attribution Analysis
Three complementary analyses probe the robustness of the results. First, a Monte Carlo simulation of 10,000 draws propagates uncertainty in 33 parameters—attendance, origin shares, attendance days, trip distances, energy intensities, stay rates and nights, personnel counts, freight tonnage, race fuel intensity, circuit electricity and waste generation—using triangular distributions defined by the low, central and high values in Table S1, while mode-share vectors are perturbed jointly with Dirichlet draws so that shares remain a valid simplex:
where s0(v) is the baseline share vector v and κD the Dirichlet concentration parameter. Results are reported as medians with 2.5th–97.5th percentile uncertainty intervals, and the S2 Net-Zero F1 scenario is propagated with 4000 draws under the same specification. Second, a one-at-a-time sensitivity analysis varies each of fourteen parameters p by ±20% around its baseline, holding all others fixed, and reports the normalised half-swing,
for both S0 and S2, where Cref is gross emissions in the scenario concerned; domestic aviation mode share is varied with rebalancing onto high-speed rail so that shares remain normalised.
Two further Monte Carlo variants test the shape of the input distributions (Table S4). In the first, each triangular distribution is replaced by a symmetric one of the same width centred on its central value. In the second, five pairs of plausibly linked parameters are sampled with rank correlations through a Gaussian copula: attendance days and nights for domestic (0.6) and international (0.6) visitors, team personnel with officials (0.5) and with freight tonnage (0.5), and long-haul distance with aviation energy intensity (−0.4), because longer flights burn less fuel per passenger-kilometre. The reference ensemble samples all parameters independently.
Third, we attribute the mitigation wedge between the frozen-technology 2030 baseline and the S2 Net-Zero F1 scenario to seven measure groups using exact Shapley values. For measure set M with |M| = 7, the value of measure m is
where v (S) is total gross emissions when only the measures in S are activated. All 27 = 128 coalitions are evaluated exactly, so the decomposition is order-independent and exhaustive: the seven φm sum precisely to the total wedge. This is preferable to sequential wedge-by-wedge attribution, which assigns arbitrary credit depending on the order in which measures are applied. Order dependence is a serious problem here, because renewable electricity, road electrification and modal shift interact strongly.
3. Results
3.1. Baseline Energy Consumption and Emissions
Under the parameter values of Table 1, the illustrative application gives a final energy consumption of 316.9 TJ and emissions of 24,306 t CO2e for the 2024 Shanghai Chinese Grand Prix under the cradle-to-event-gate boundary (Table 3). Normalised, this is 122 kg CO2e per spectator person-time, or 232 kg CO2e per unique attendee. Jet kerosene supplied 84.4% of final energy (267.4 TJ), electricity 7.7% (24.4 TJ, equivalent to 6.8 GWh), gasoline 5.4%, diesel 1.6% and natural gas 0.9%.
Table 3.
Baseline (S0 Business-as-Usual, 2024) energy consumption and greenhouse gas emissions by sector. Monte Carlo intervals are the 2.5th–97.5th percentiles of 10,000 draws. Waste emissions are treatment process emissions and carry no final energy demand within the boundary. pt = spectator person-time.
The sectoral distribution is strongly skewed (Figure 2a). Spectator travel contributed 15,976 t CO2e (65.7%), team, official and media travel 3138 t (12.9%), freight and logistics 2732 t (11.2%), accommodation 1369 t (5.6%) and circuit operation 697 t (2.9%). Catering, waste and race operation together accounted for only 1.6%. The most policy-relevant of these is race operation. Burning racing fuel in twenty Formula 1 cars across practice, qualifying, the sprint and the grand prix (26,473 vehicle-kilometres and roughly 50,300 L of E10 fuel) produced 103 t CO2e, or 0.4% of the event total. In carbon terms, the cars are negligible compared with the audience that comes to watch them.
Figure 2.
(a) Baseline (S0, 2024) emissions by sector, with each sector’s share of 24,306 t CO2e total. (b) Structure of inter-city spectator travel demand by mode, as share of 195.4 million passenger-kilometres.
The reason is visible in the travel-demand structure (Figure 2b). The event generated 195.4 million inter-city passenger-kilometres. Aviation carried 68.5% of them and high-speed rail 20.4%. At current grid factors, however, aviation is roughly four times as carbon-intensive per passenger-kilometre as Chinese high-speed rail (0.0995 versus 0.0239 kg CO2e pkm−1), so it produced 83.4% of spectator travel emissions. Adding accredited-personnel aviation (98.7% of the team and staff sector) and air freight, total aviation-related emissions reach 19,122 t CO2e, or 78.7% of the event footprint. Roughly eight thousand international spectators (7.6% of unique attendees) generate 10,431 t CO2e of aviation emissions on their own, or 42.9% of the event total.
3.2. Illustrative Non-CO2-Adjusted Burden and Its Sensitivity to the Emission Metric
The carbon inventory understates the event’s climate relevance because its dominant component is emitted at cruise altitude. Of the 19,122 t CO2e of aviation emissions, 18,149 t is emitted outside the LTO cycle. Weighting this cruise component with the GWP100-based factor of 1.7 [10] and leaving the remaining 6157 t unweighted gives an illustrative non-CO2-adjusted indicator of 37,010 t CO2e. This is 1.52 times the CO2e inventory, or 185 kg per spectator person-time, and aviation accounts for 86.0% of the indicator. The indicator is illustrative, not an inventory quantity: emission metrics are not additive across gases with different atmospheric lifetimes, and the application of global-average factors at the scale of an individual event is contested [10,42].
Because the choice of metric is the weakest element of the calculation, we vary it (Table 4). For emission weighting factors from 1.1 (GTP100) to 3.0 (GWP *100), the indicator ranges from 26,121 to 60,604 t CO2e, whereas aviation’s share moves only from 80.2% to 91.4%; it is 78.7% when no adjustment is applied. Over the plausible range of LTO shares the GWP100 indicator changes by less than 0.5% (36,928–37,077 t CO2e). Under every treatment of non-CO2 effects considered here, including none, aviation is the dominant source. The metric changes the magnitude of the burden but not its attribution. All scenario, sensitivity and attribution results reported elsewhere in this paper are computed on the unadjusted CO2e basis.
Table 4.
The sensitivity of the illustrative non-CO2-adjusted burden to the emission weighting factor (EWF) applied to the cruise component of aviation CO2 (18,149 t CO2e); LTO-cycle aviation emissions and non-aviation emissions (6157 t CO2e together) are left unweighted. The EWFs are the ratios of total aviation CO2-equivalent emissions to aviation CO2 emissions in 2018 under the stated metric [10]; the GWP*100 value describes the warming rate of a growing global fleet and is shown as an upper bound only. The first row is the unadjusted CO2e inventory.
3.3. Co-Pollutant Emissions and Their Vertical Distribution
Because the activity data that drive the carbon inventory are resolved by fuel and by mode, the same accounting chain yields an air-pollutant inventory at no additional data cost. Applying the fuel-specific factors of Section 2.3.3 to the 6148 t of jet kerosene, 393 t of petrol, 118 t of diesel and 6.77 GWh of electricity consumed by the event gives 96.5 t of NOX, 5.51 t of SO2, 0.78 t of PM2.5, 0.14 t of black carbon, 39.9 t of CO and 5.24 t of NMVOC (Table 5). Normalised by attendance, the event released 482 g of NOX, 28 g of SO2 and 3.9 g of PM2.5 per spectator person-time.
Table 5.
Co-pollutant emissions of the 2024 Shanghai Formula 1 Chinese Grand Prix by emission stream, computed from the same activity data as the carbon inventory using the emission factors of Section 2.3.3. Electricity rows carry no CO or NMVOC because the factors applied are power-sector intensities for NOX, SO2 and PM only. Black carbon (0.143 t in total, 46.0% of it from non-road diesel) is reported in the text.
The structure mirrors that of the carbon inventory and is even more extreme for the climatically active species. Aviation contributes 94.3% of NOX and 93.8% of SO2, against 78.7% of CO2e, because jet kerosene both dominates fuel use and carries a high-temperature combustion NOX index. Only among the products of incomplete combustion does the road fleet compete: petrol vehicles supply 47.6% of CO and 58.1% of NMVOC. The most disproportionate source in the inventory is the on-site diesel generator fleet, which accounts for 0.7% of the carbon inventory but 13.5% of primary PM2.5 and 46.0% of black carbon. This is because uncontrolled off-road engines emit roughly a hundred times as much particulate per unit of fuel as the light-duty petrol fleet. Temporary power generation is therefore the one venue-level source whose air quality significance is much larger than its carbon significance. Event operators can act on this directly, yet a carbon-only inventory conceals it.
The distinction that matters atmospherically is vertical. Of the 91.0 t of aviation NOX, only the landing-and-take-off portion is released below 914 m, the conventional LTO ceiling that we use as an approximate proxy for near-surface release (Section 2.3.3). Resolving the LTO cycle by stage length (Section 2.3.3, Table S3) shows that its share of fuel burn differs widely between segments: about 12% for domestic flights of 1400 km, 10% for regional flights of 2500 km, 3.5–4.2% for long-haul passenger flights of 7000–8500 km and 1.8% for long-haul freighters. Weighted by fuel, the LTO cycle accounts for 4.6–5.7% of the event’s jet fuel. Using the aircraft-specific LTO emissions of the IPCC Tier 2 table, 4.9–6.1 t of NOX (central 5.4 t) is released below 914 m at the airports concerned, about half of it (2.4–3.0 t) at Shanghai’s airports. The remaining 85–86 t is emitted above 914 m. Domestic flights, with 18% of passenger jet fuel, contribute 24% of the LTO NOX. Adding the surface-level road, generator and power-sector contributions gives a total near-surface release (below 914 m) of approximately 10.3–11.5 t of NOX, spread over six days and over an entire national catchment rather than concentrated at the circuit. For a host city whose annual NOX emissions are of the order of 105 t, this is a negligible local perturbation. This explains why mega-event air quality studies detect effects only where large traffic volumes are restricted [1,2,3,4]. The atmospheric significance of an internationally attended race lies almost entirely at cruise altitude in the free troposphere. There, the same NOX drives ozone formation and methane depletion, and the contrail cirrus that motivates the non-CO2 adjustment of Section 3.2 is formed [10]. The carbon and co-pollutant inventories therefore agree: the problem lies not at the circuit, but along the flight corridors that feed it.
3.4. Order-of-Magnitude Consistency Check Against the Promoter Disclosure
No official carbon disclosure exists for the Shanghai race itself, so we benchmark the model against Formula 1’s own reporting, which covers logistics, event operations and organisational travel but excludes spectator travel and spectator accommodation [11]. A like-for-like comparison requires two steps. First, the promoter-boundary subset of our inventory is assembled by summing team and staff travel, freight, circuit operation, race operation, catering and the venue share of waste, which gives 6852 t CO2e. Second, the disclosed corporate total must be split into race-attributable and non-race-attributable components, because it includes factories and facilities, whose emissions are incurred whether or not any particular race is staged. Formula 1 reported 168,720 t CO2e across 24 races in 2024 against a re-baselined 2018 value of 228,793 t CO2e, together with category-level changes of −34,000 t CO2e (−59%) for factories and facilities, −20,000 t (−25%) for travel, −6438 t (−9%) for logistics and +247 t for event operations [11]. Inverting these gives 2024 category totals of 23,627 t CO2e for factories and facilities, 60,000 t for travel, 65,095 t for logistics and 19,880 t for event operations. The reconstruction is internally consistent: the four categories sum to 168,602 t CO2e, within 0.07% of the disclosed total, and they independently reproduce Formula 1’s stated per-race reduction in event operations (we obtain −11.4% against a stated 12%). Excluding factories and facilities, the race-attributable disclosure is 6041 t CO2e per race, against which our reconstruction of 6852 t CO2e is 13.4% high (Table 6).
Table 6.
Category-level consistency check of the bottom–up reconstruction against a race-attributable reconstruction of Formula 1’s disclosed 2024 carbon footprint, and the resulting attribution gap. The Formula 1 column excludes factories and facilities (23,627 t CO2e in 2024), which are not attributable to staging an individual race.
The category-level agreement is the more informative test. Freight and logistics agree to within 0.7% (2732 against 2712 t CO2e), event operations to within 18.7% (983 against 828 t) and personnel travel to within 25.5% (3138 against 2500 t). None of the parameters were calibrated to any Formula 1 figure, and the three categories are built from independent assumptions about personnel counts, flight distances, freight tonnage and venue electricity. Agreement at this level is therefore a check rather than a tautology, although a weak one. The direction of the two larger residuals is also what the case would predict: Shanghai is a long-haul flyaway round, so both personnel travel and air freight should exceed a 24-race average that includes European rounds served by road freight and short-haul travel. Two caveats apply. Comparing a single long-haul race with a 24-race average reconstructed from rounded percentage changes is a weak test. The average mixes European rounds with flyaway rounds, so agreement in any one category may be partly coincidental, and residuals of 19–26% are within what such averaging can produce. The exercise should therefore be read only as a check on structure and order of magnitude, not as a validation of individual parameters or of the inventory as a whole. The comparison also quantifies the accounting gap that motivates this study. The promoter-boundary total is 28.2% of the emissions actually caused by staging the event in Shanghai. The remaining 71.8%, from spectator travel and accommodation, appears in no corporate inventory. Because most of it is international aviation departing from other jurisdictions, it appears in no municipal territorial inventory either.
3.5. Scenario Pathways
With attendance growing to 220,000 person-times and no technological change, emissions rise to 26,053 t CO2e. This is the frozen-technology 2030 baseline (Figure 3a, Table 7). Against this counterfactual, S1 Green F1 delivers a 27.6% reduction and S2 Net-Zero F1 a 43.9% reduction on a gross basis before removals; measured against the 2024 event as delivered, the gross reductions are 22.4% and 39.9%, respectively. Emission intensity falls more steeply than absolute emissions because attendance grows: from 122 kg CO2e per person-time in S0 to 86 kg in S1 and 66 kg in S2 (Figure 3b).
Figure 3.
(a) Gross emissions by sector and net emissions after removals across the four scenarios; “other operations” aggregates race operation, catering and waste. (b) Gross emission intensity per spectator person-time; in-bar labels give the reduction in net emissions relative to the frozen-technology 2030 baseline.
Table 7.
Scenario results. Reductions are reported against both the 2024 event as delivered and the frozen-technology 2030 baseline; the latter is the appropriate counterfactual because attendance grows in all forward scenarios.
The composition of the residual changes remarkably little. Spectator travel rises from 65.7% of the total in S0 to 77.8% in S2. It becomes more dominant because the sectors that respond well to event-level intervention are the small ones. Relative to the frozen baseline, accommodation emissions drop by 97.1% (1491 → 43 t) and circuit operation by 93.2% (697 → 47 t) once electricity is fully decarbonised. Together, however, these two sectors made up only 8.4% of that baseline, whereas spectator travel falls by just 35.3% even under maximal ambition. In final energy terms (Figure 4), total demand declines by only 20.7% from the frozen baseline, from 339.5 to 269.0 TJ, and jet kerosene still supplies 86.6% of it in S2. The event decarbonises faster than it dematerialises, because the decisive change is in the carbon content of aviation fuel and electricity rather than in the volume of travel.
Figure 4.
Final energy demand by carrier across the four scenarios. Jet kerosene remains dominant throughout, and total final energy falls far less than emissions.
3.6. Uncertainty
The Monte Carlo analysis gives a median gross footprint of 25,974 t CO2e with a 95% uncertainty interval of 20,656–32,980 t CO2e (Figure 5). The coefficient of variation is 12.1%, and the 95% interval spans 47.4% of the median. The distribution is right-skewed (the mean of 26,180 t exceeds the median), and the deterministic baseline of 24,306 t CO2e lies at the 29th percentile. This position reflects the shape of the input ranges rather than the nonlinearity of the model. A total of the 33 triangular distributions have a longer upper than lower tail (for example aviation energy intensity, 0.035–0.040–0.055 L pkm−1, and generator diesel, 30,000–60,000–100,000 L), and only one has a longer lower tail, so the mean of each such distribution lies above its central value. Evaluating the model at the means rather than the modes of all triangular distributions gives 26,091 t CO2e, close to the ensemble median. With symmetric distributions of the same widths, the deterministic value moves to the 52nd percentile (median 24,132 t, interval 19,085–30,568 t; Table S4). The central values are thus modal values, and the skew is a property of the assumed ranges, which were widened upwards where underestimation appeared more likely than overestimation. The headline result is therefore best stated as 24,306 t CO2e with an uncertainty interval of 20,656–32,980 t CO2e (2.5th–97.5th percentiles of the ensemble). We describe this as an uncertainty interval rather than a confidence interval because it propagates assumed parameter distributions, not sampling error.
Figure 5.
Monte Carlo distributions of gross event emissions for S0 Business-as-Usual (10,000 draws) and S2 Net-Zero F1 (4000 draws), propagating triangular uncertainty in 33 parameters and Dirichlet uncertainty in four mode-share vectors. UI, uncertainty interval (2.5th–97.5th percentiles). The solid green and blue vertical lines mark the medians of the S2 and S0 ensembles, respectively; the shaded bands of the same colours mark their 95% UIs, and the black dashed line marks the deterministic S0 estimate.
Correlations between parameters were not imposed in the reference ensemble. Sampling the five linked pairs of Section 2.5 leaves the median almost unchanged (25,932 t CO2e) and narrows the 95% interval to 21,325–31,828 t, mainly because the negative correlation between long-haul distance and aviation energy intensity offsets the two most influential parameters. With symmetric and correlated distributions combined, the interval is 19,763–29,787 t. The reference interval is, therefore, if anything, slightly wide with respect to correlation.
Uncertainty is highly unevenly distributed across sectors (Table 3). Spectator travel spans 12,385–23,552 t CO2e, a range that alone exceeds the entire non-travel inventory, whereas catering is known to within ±5% and race operation, though spanning 86–146 t, is negligible in absolute terms. This has a practical implication for future event inventories. Refining venue electricity metering or race fuel accounting, where data collection is easiest, cannot materially narrow the total. By contrast, a single well-designed spectator origin-and-mode survey would be expected to reduce the interval more than all other data improvements combined. Under S2 Net-Zero F1 the 95% interval is 10,945–19,454 t CO2e, so even the optimistic tail of the most ambitious pathway does not approach zero gross emissions.
3.7. Sensitivity
The ±20% one-at-a-time analysis (Figure 6) gives a clear ranking under the assumed ranges. In S0, aviation energy intensity swings the total by ±13.5% (6570 t CO2e between the low and high cases) and international air trip distance by ±8.3% (4013 t). No other parameter reaches ±5%: staff long-haul distance and domestic air trip distance each contribute about ±2.5%, freight tonnage ±2.2%, domestic aviation mode share ±2.0% and team personnel ±1.7%. Parameters that dominate public discussion of motorsport sustainability are negligible: race-car fuel intensity moves the total by ±0.08% and on-site generator diesel by ±0.13%.
Figure 6.
Tornado sensitivity of gross emissions to ±20% variation in individual parameters for (a) the S0 Business-as-Usual scenario and (b) the S2 Net-Zero F1 scenario. Dark bars: −20%; light bars: +20%. Percentages give the half-swing relative to the scenario base.
Importantly, the ranking does not change under deep decarbonisation; it intensifies. In the S2 Net-Zero F1 scenario, aviation energy intensity swings the total by ±16.3% and international trip distance by ±11.4%, because every other source has been substantially abated while aviation demand persists. In both its baseline and its most ambitious form, the model is principally a model of aviation. Any credible improvement in event-scale accounting must begin by measuring where spectators come from and how far they fly.
3.8. Attribution of the Mitigation Wedge
The Shapley decomposition (Figure 7, Table 8) apportions the 11,449 t CO2e wedge between the frozen-technology 2030 baseline and the S2 Net-Zero F1 scenario. Sustainable aviation fuel is the largest single contributor at 4736 t CO2e (41.4% of the wedge, 18.2% of the frozen baseline), followed by renewable electricity procurement at 2057 t (18.0%), modal shift at 1754 t (15.3%) and logistics optimisation at 1402 t (12.2%). Energy efficiency and circularity (618 t, 5.4%), road electrification (465 t, 4.1%) and background grid decarbonisation (416 t, 3.6%) are comparatively minor.
Figure 7.
Exact Shapley decomposition of the mitigation wedge between the frozen-technology 2030 baseline and S2 Net-Zero F1, evaluating all 128 coalitions of the seven measure groups. Values are in kt CO2e; percentages in brackets give each group’s share of the 11,449 t CO2e wedge; the bottom bar is the residual that must be neutralised by carbon removal.
Table 8.
Shapley attribution of the mitigation wedge (frozen-technology 2030 → S2 Net-Zero F1). Contributions are order-independent and sum exactly to the total wedge.
Two features of this ranking deserve emphasis. First, the top contributor is a lever the event organiser does not control: SAF availability, price and certification are determined by aviation fuel markets and international policy, not by a race promoter or a host city. Second, the levers most visible to spectators and most emphasised in event sustainability communication (electric shuttle fleets, LED lighting, waste sorting and sustainable race fuel) jointly account for under 10% of the wedge. Renewable electricity procurement performs well largely because it acts on a market-based accounting convention [16] rather than on physical dispatch; we return to this point in Section 4.4.
The residual is the central result. After all seven measure groups are applied at their maximum plausible 2030 levels, 14,604 t CO2e remain, or 56.1% of the frozen-technology baseline. Achieving net zero therefore requires purchasing removals equivalent to more than half of the unabated footprint. No plausible combination of measures within the organiser’s reach closes this gap, because the residual is overwhelmingly the kerosene burned by spectators and personnel flying to Shanghai.
4. Discussion
4.1. An Internationally Attended Race Is, Atmospherically, an Aviation Event
Under the assumed spectator travel parameters, the same result recurs across every analysis in this study (the baseline decomposition, the illustrative non-CO2 adjustment, the sensitivity ranking, the uncertainty attribution and the Shapley decomposition): an internationally attended motorsport event is, in atmospheric terms, an aviation event. Aviation supplied 78.7% of baseline CO2e and 84.4% of final energy. Its share rises to 80–91% of the burden under the illustrative non-CO2 adjustment for emission weighting factors between 1.1 and 3.0 (Section 3.2) and remains 76.3% in the alternative origin case (Section 2.3.4). Aviation also dominates the sensitivity ranking in both the baseline and the deepest mitigation scenario, supplies 94.3% of the event’s NOX and 93.8% of its SO2, and makes up essentially all of the irreducible residual. This is consistent with the broader sport literature, in which travel is repeatedly identified as the dominant category [6,7,8], but the concentration is far more extreme here than in the domestically attended events those studies mostly examine. It also relocates the environmental question: the emissions that matter are not released at the circuit, where mitigation effort and public attention are concentrated, but along intercontinental flight corridors, where neither the promoter nor the host city has jurisdiction.
The 2024 edition illustrates how quickly this exposure can grow. The share of non-local spectators rose from 45.82% in 2019 to about 80% in 2024 [14], and the international share reached 10% [13]. The same internationalisation that generated CNY 1.406 billion of direct economic impact [15] also increased the event’s atmospheric burden, because the same long-distance visitors generate both the economic value and the aviation emissions. Event strategy in Chinese host cities is currently oriented towards raising exactly this share. Our results imply that such a strategy carries an unpriced carbon cost of roughly 1.34 t CO2e per additional international attendee, compared with about 0.026 t for an additional Yangtze River Delta attendee travelling by high-speed rail and staying two nights, a ratio of more than fifty to one.
We emphasise what this study does and does not establish about the atmosphere. It quantifies the climate-relevant emission burden of the event, its energy carrier composition, and its co-pollutant emissions together with their approximate vertical partition. It does not model dispersion, atmospheric chemistry or population exposure, which would require a chemical transport model driven by meteorological fields for the event window. Emission inventories and dispersion modelling are complementary. The same activity data (vehicle-kilometres by mode, generator fuel use and aircraft movements) are the inputs that an air quality assessment would require. Event-scale inventories of the kind built here are therefore a natural bridge between the mega-event air quality literature [1,2,3,4] and event climate accounting.
4.2. What Organisers Control and What They Do Not
Our consistency check quantifies a structural accounting problem. The promoter-boundary reconstruction (6852 t CO2e) matches a race-attributable reconstruction of F1’s disclosure to within 13.4%. This order-of-magnitude check is consistent with both accounts but validates neither. However, that boundary captures only 28.2% of the emissions the event causes. The remaining 71.8% falls between reporting regimes: it is Scope 3 for a promoter that does not report it, and it is largely extraterritorial for a host city whose inventory is production-based. Sport-event sustainability standards [8,22] increasingly require spectator travel to be estimated, but they leave the estimation method to the reporter. Given the ±13.5% leverage of a single aviation parameter (Section 3.7), this permits wide latitude. The same problem is documented for corporate carbon reporting in general, where omitted Scope 3 categories make reported footprints incomplete and difficult to compare [43], and where market-based renewable electricity claims can overstate physical reductions [44]. Any event making a carbon-neutrality claim should be required to publish its spectator origin distribution, its assumed mode shares and its aviation energy intensity, because these three items determine the answer almost entirely.
The corollary is more constructive than it may appear. Because organiser-controlled sectors are small, they can be abated almost completely at modest cost: our scenarios eliminate 97.1% of accommodation emissions and 93.2% of circuit operation emissions by 2030. What organisers should not do is present that success as evidence that the event has been decarbonised. A promoter can legitimately claim to have decarbonised its operations; it cannot claim to have decarbonised the event.
4.3. Comparison with Other Events and with the Sport’s Own Trajectory
Our per capita figure of 122 kg CO2e per spectator person-time (232 kg per unique attendee) sits between values reported for domestically and globally attended events. Wang et al. [9] report approximately 0.26 t CO2e per capita for a Chinese mega sporting event over its full life-cycle. That figure includes construction and preparation phases that we exclude, but it involves a mostly domestic audience. Studies of running events under the Council for Responsible Sport standard [8] typically report far lower per-participant values, again reflecting shorter travel distances. The distinguishing feature of the Shanghai Grand Prix is not that it is a motorsport event but that, in our parameterisation, one attendee in thirteen arrives by intercontinental flight.
At the level of the sport, F1 reduced its reported footprint by 26% between the re-baselined 2018 value and 2024 while adding three races, with SAF in air freight contributing more than 8000 t CO2e of savings in 2024 alone [11]. Our Shapley result, with SAF as the largest single lever at 41.4% of the wedge, is consistent with that strategy and suggests that it is the right priority. However, our residual result qualifies the target. If the promoter-boundary share of a race is roughly 28%, then a sport that reaches net zero within its own boundary will have addressed under a third of the emissions its events generate. Extending the reporting boundary would be a more meaningful commitment than accelerating reductions within the present one.
4.4. Policy Implications
Three implications follow for host cities. First, schedule for rail substitutability: High-speed rail already carries 20.4% of inter-city passenger-kilometres to this event. At the Chinese grid factors used here, it emits roughly a quarter as much as aviation per passenger-kilometre [24,25]. Modal shift delivered 15.3% of our mitigation wedge, and the Yangtze River Delta catchment—55% of domestic non-local attendees—lies entirely within high-speed rail range of Shanghai. Ticketing integrated with rail booking and scheduling that avoids forcing same-day return travel act directly on the second- and third-ranked levers. Second, treat renewable procurement carefully: Market-based procurement contributed 18.0% of the wedge under the accounting convention in which purchased green electricity is credited at zero [16]. This is a legitimate and officially sanctioned convention, but it does not by itself change physical dispatch [44]. The background grid trajectory, which does affect dispatch, contributed only 3.6%. Reporting both location-based and market-based results, as we do in Table 2, is the honest presentation. Third, be explicit about removals: Reaching net zero in our most ambitious scenario requires neutralising 14,604 t CO2e, 56.1% of the frozen baseline. An event that purchases removals on this scale should disclose their full amount.
For the sport, the implication is that the Net Zero 2030 commitment [11] is achievable within its declared boundary but, with current technology, not outside it. Closing the remaining gap depends on the pace of aviation decarbonisation, which neither promoters nor host cities control. This strengthens the case for regional scheduling: a geographically clustered race calendar reduces both freight and personnel aviation, the two components most directly within the sport’s control.
4.5. Limitations
Six limitations should temper interpretation. First, and most importantly, no spectator travel survey exists for this event. Origin shares are based on official releases [13,14], but mode shares, trip distances and attendance day distributions are grade D assumptions. Section 2.3.4 shows that the domestic distances agree with the geography of the catchment, but the international distances and the mode shares cannot be checked against event data, and the alternative origin case alone changes the total by 10%. The Monte Carlo and sensitivity analyses bound the consequence (the 95% interval spans 47.4% of the median) but cannot substitute for measurement. The quantitative results should therefore be read as an illustration of the framework under stated assumptions, not as a measured inventory of the 2024 Grand Prix. Second, circuit electricity consumption, accredited-personnel counts and Shanghai-specific freight tonnage are not publicly disclosed and are parameterised with central values and wide bounds; the comparison with Formula 1’s per-race figures (Section 3.4) checks only their order of magnitude. Third, the non-CO2 indicator of Section 3.2 relies on global-average emission weighting factors that do not resolve contrail formation by route, season or time of day. The total climate burden of the event, as opposed to its carbon burden, therefore remains indicative. Non-CO2 effects are excluded from all scenario and attribution results; including them would strengthen rather than weaken the qualitative conclusions. Fourth, the scenario trajectories for SAF penetration and grid decarbonisation and the 70% life-cycle SAF credit are plausible assumptions rather than forecasts; they depend on feedstock availability, prices and certification pathways [30]. With a credit of 50% or 80% instead of 70%, S2 reduces gross emissions by 39.4% or 46.2% against the frozen baseline and SAF supplies 33.0% or 44.9% of the wedge. The ranking of the levers and the size of the residual (54–61% of the frozen baseline) are therefore robust to this choice. Fifth, the co-pollutant inventory is an emission inventory only. The Tier 1 road factors describe an older European fleet and therefore overestimate the road contribution of the China 6 fleet in Shanghai, which is in any case less than 4% of NOX. The LTO partition uses representative aircraft and assumed passenger loads rather than recorded aircraft movements. No dispersion, chemistry or exposure modelling is attempted, so the inventory cannot be used to assess local air quality or health effects. Sixth, the empirical results refer to one event. Percentage breakdowns depend on the geography of the catchment and on the share of international visitors. They should not be transferred directly to flyaway races in other regions, although the framework itself can be (Section 4.6). We have accordingly framed the scenarios as bounded explorations of what event-level action can and cannot achieve, not as predictions.
4.6. Data Requirements for Event-Specific Applications
Table 9 separates the inputs of the framework into well-established parameters, which can be taken from official statistics or the literature, and event-specific data, which an organiser has to collect, and indicates how each can be obtained. The order follows the sensitivity and uncertainty analyses: the first four items determine most of the total and of its uncertainty, whereas the operational items are the easiest to measure but matter little for the carbon total. The first four items could be obtained from a short set of questions on origin, travel mode and days attended at ticket purchase, supplemented by a random on-site intercept survey of the kind used for spectator travel at university and collegiate sports events [38,39]. The model code (Code S1) accepts these data as a parameter file and regenerates every table and figure of this paper for the new event. Its README describes the parameter file, the commands and the outputs, and a separate script converts origin cities into trip distances.
Table 9.
Inputs of the framework, their status in the Shanghai application, their influence on the result and how they can be obtained for an event-specific inventory. Influence refers to the one-at-a-time and Monte Carlo analyses of Section 3.6 and Section 3.7.
5. Conclusions
We developed a bottom–up activity-based carbon accounting framework for internationally attended events and illustrated it with the 2024 Shanghai Formula 1 Chinese Grand Prix. The inventory spans eight demand sectors under a cradle-to-event-gate boundary and is coupled to life-cycle emission factors, Monte Carlo uncertainty propagation and scenario analysis. It uses IPCC default combustion factors together with the officially released 2024 Shanghai grid emission factor. We also extended the same activity data to a co-pollutant emission inventory. Because the spectator travel inputs are documented assumptions rather than observations, the following four conclusions hold under those assumptions.
- (1)
- In the illustrative application, and under the assumed spectator travel and operational parameters, the event is estimated to have consumed 316.9 TJ of final energy and emitted 24,306 t CO2e (uncertainty interval 20,656–32,980 t), equivalent to 122 kg CO2e per spectator person-time; this is an illustrative estimate, not a measured inventory of the 2024 Grand Prix. Aviation accounted for 78.7% of that total, and for 80–91% of an illustrative non-CO2-adjusted indicator across emission weighting factors of 1.1–3.0, while burning racing fuel in the cars contributed 0.4%. Public and policy attention to motorsport’s fuel is directed at less than half a percent of the problem. The co-pollutant inventory tells the same story more sharply. Of the 96.5 t of NOX, 94.3% comes from aviation, and 85–86 t is released above the 914 m LTO ceiling, mostly at cruise altitude, rather than near the surface of the host city.
- (2)
- Restricting the inventory to the promoter’s reporting boundary yields 6852 t CO2e, within 13% of a like-for-like reconstruction of Formula 1’s disclosed 2024 per-race footprint. Category-level agreement (to within 0.7% for freight, 18.7% for event operations and 25.5% for personnel travel) is consistent with the model at the order-of-magnitude level, although a single long-haul race cannot be validated against a season average. The comparison also shows that 71.8% of the event’s emissions fall outside the reporting boundaries considered and are attributed neither to the promoter nor to the host city.
- (3)
- Ambitious but plausible 2030 measures reduce gross emissions by 27.6% (S1 Green F1) to 43.9% (S2 Net-Zero F1) against a frozen-technology baseline. A Shapley decomposition attributes 41.4% of the mitigation wedge to sustainable aviation fuel, 18.0% to renewable electricity procurement and 15.3% to modal shift, while the interventions most prominent in event sustainability communication jointly deliver under 10%.
- (4)
- After every lever is pushed to its plausible limit, 14,604 t CO2e—56.1% of the frozen baseline—remain. Carbon neutrality for an internationally attended motorsport event is therefore not achievable through event-level operational measures under the assumed 2030 conditions. It depends on aviation-sector decarbonisation and on carbon removals, whose magnitude should be disclosed rather than absorbed into a neutrality claim.
The methodological contribution generalises beyond motorsport. Its main elements are distinguishing person-times from unique attendees; grading every parameter by provenance; cross-checking against an independent corporate disclosure at category level; reporting the burden on both a CO2e and an illustrative non-CO2-adjusted basis with the emission metric varied; specifying the event-specific data that an application requires; and decomposing mitigation with exact Shapley values rather than sequential wedges. Together, these elements provide a template for event-scale atmospheric emission inventories that can withstand scrutiny. Future work should prioritise a spectator origin-and-mode survey at a major Chinese event, since spectator travel parameters account for most of the uncertainty in our analysis.
Supplementary Materials
The following supporting information can be downloaded at: https://www.mdpi.com/article/10.3390/atmos17111102/s1, Table S1: Activity-based accounting workbook (fourteen sheets) with the complete parameter database, low, central and high values, units, data quality grades and sources; Table S2: Great-circle distances from Shanghai to the cities of the Yangtze River Delta, the provincial capitals and the main international markets; Table S3: Landing-and-take-off partition of aviation fuel and NOX by stage length; Table S4: Monte Carlo diagnostics, alternative international origin case and SAF credit sensitivity; Code S1: Python model, figure script, distance script, results and a README with instructions and a parameter template for applying the framework to other events. References [9,11,12,13,14,16,21,23,27,28,29,30,31,32,33] are cited in the Supplementary Materials.
Author Contributions
Conceptualization, X.W. and X.P.; methodology, X.W. and X.P.; software, X.W.; validation, H.Z. and X.P.; formal analysis, X.W. and Y.L.; investigation, X.W.; data curation, X.W. and H.Z.; writing—original draft preparation, X.W. and Y.L.; writing—review and editing, H.Z. and X.P.; visualization, X.W. and B.W.; supervision, X.P.; project administration, X.P.; funding acquisition, X.P. All authors have read and agreed to the published version of the manuscript.
Funding
This research received no external funding.
Institutional Review Board Statement
Not applicable.
Informed Consent Statement
Not applicable.
Data Availability Statement
The model combines three kinds of input, and the source and data quality grade of every parameter are listed in Table 1 and Table S1. (i) Publicly available data: spectator attendance and the published origin shares [13,14], circuit and race data [12], grid emission factors [16,28] and Shanghai inbound tourism statistics [37] (grade A, or grade B where derived arithmetically from them). (ii) Parameters from the literature and standard guidebooks, such as combustion, freight, waste and co-pollutant emission factors, aircraft LTO data, emission weighting factors and accommodation energy intensities (grade C; e.g., [9,10,21,27,32]). (iii) Scenario assumptions set by the authors where no public data exist (grade D), including spectator mode shares, trip distances and attendance days, personnel headcounts, freight tonnage, circuit electricity and the 2030 scenario trajectories; these are not observations of the event. The Python model code, the accounting workbook and all derived results, including the co-pollutant inventory, are provided in the Supplementary Materials.
Acknowledgments
The authors would like to express their gratitude to the School of Physical Education, Baoshan University and Faculty of Engineering, Mahasarakham University, for their support with facilities.
Conflicts of Interest
The authors declare no conflicts of interest.
References
- Guo, J.; Xu, R.; Liu, B.; Kong, M.; Yang, Y.; Shi, Z.; Zhang, R.; Dai, Y. Evaluating policy interventions for air quality during a national sports event with machine learning and causal framework. Atmosphere 2025, 16, 557. [Google Scholar] [CrossRef] [Scilit]
- Wang, S.; Zhao, M.; Xing, J.; Wu, Y.; Zhou, Y.; Lei, Y.; He, K.; Fu, L.; Hao, J. Quantifying the air pollutant emission reduction during the 2008 Olympic Games in Beijing. Environ. Sci. Technol. 2010, 44, 2490–2496. [Google Scholar] [CrossRef] [Scilit] [PubMed]
- Liu, H.; Wang, X.M.; Zhang, J.P.; He, K.B.; Wu, Y.; Xu, J.Y. Emission controls and changes in air quality in Guangzhou during the Asian Games. Atmos. Environ. 2013, 76, 81–93. [Google Scholar] [CrossRef] [Scilit]
- Zhang, S.; Wu, Y.; Liu, H.; Wu, X.; Zhou, Y.; Yao, Z.; Fu, L.; He, K.; Hao, J. Historical evaluation of vehicle emission control in Guangzhou based on a multi-year emission inventory. Atmos. Environ. 2013, 76, 32–42. [Google Scholar] [CrossRef] [Scilit]
- Huang, J.; Lin, R. The impact of preparatory work for mega sports events on carbon emissions: A case study of the Beijing Winter Olympics. Front. Environ. Sci. 2025, 13, 1665438. [Google Scholar] [CrossRef] [Scilit]
- Wicker, P. The carbon footprint of active sport participants. Sport Manag. Rev. 2019, 22, 513–526. [Google Scholar] [CrossRef] [Scilit]
- Gandola, D.M.; Asdrubali, F. A methodology to evaluate GHG emissions for large sports events. Sustainability 2024, 16, 1504. [Google Scholar] [CrossRef] [Scilit]
- McCullough, B.P.; Collins, A.; Roberts, J.; Villalobos, S. Sport events and emissions reporting: An analysis of the Council for Responsible Sport standard in running events. Sustainability 2023, 15, 14375. [Google Scholar] [CrossRef] [Scilit]
- Wang, H.; Tian, J.; Li, Y.; Wang, Y.; Lu, Y.; Zhang, J.; Lei, C.; Li, C. Study on life-cycle carbon footprints and an uncertainty analysis of mega sporting events: An analysis in China. Buildings 2024, 14, 2510. [Google Scholar] [CrossRef] [Scilit]
- Lee, D.S.; Fahey, D.W.; Skowron, A.; Allen, M.R.; Burkhardt, U.; Chen, Q.; Doherty, S.J.; Freeman, S.; Forster, P.M.; Fuglestvedt, J.; et al. The contribution of global aviation to anthropogenic climate forcing for 2000 to 2018. Atmos. Environ. 2021, 244, 117834. [Google Scholar] [CrossRef] [Scilit] [PubMed]
- Formula One World Championship Limited. Formula 1 on Track to Be Net Zero Carbon by 2030 with 26% Reduction in Carbon Footprint. 2025. Available online: https://corp.formula1.com/formula-1-on-track-to-be-net-zero-carbon-by-2030-with-26-reduction-in-carbon-footprint/ (accessed on 21 August 2026).
- Formula One World Championship Limited. 2024 Chinese Grand Prix. Available online: https://www.formula1.com/en/racing/2024/china (accessed on 21 August 2026).
- Shanghai Municipal People’s Government. Nearly 200,000 Spectator Person-Times Attended the F1 Chinese Grand Prix over Three Days; Out-of-Town and Overseas Spectators Accounted for 80%. 2024. Available online: https://www.shanghai.gov.cn/nw4411/20240421/6ec24b1ced7b460c8a072c34b4c7e2c5.html (accessed on 21 August 2026).
- Shanghai Municipal People’s Government. Promoting China and Shanghai’s Image Globally: Twenty Years of the Formula 1 Chinese Grand Prix. 2024. Available online: https://www.shanghai.gov.cn/nw4411/20240422/ca85bb87660f45219c7988ed2611ee6d.html (accessed on 21 August 2026).
- General Administration of Sport of China. The Formula 1 Chinese Grand Prix Again Drives the Consumption Engine. 2025. Available online: https://www.sport.gov.cn/n20001280/n20067608/n20067635/c28562719/content.html (accessed on 21 August 2026). (In Chinese)
- Shanghai Municipal Bureau of Ecology and Environment; Shanghai Municipal Bureau of Statistics. Notice on the Release of the 2020–2024 Shanghai Public Grid Electricity and Heat Carbon Dioxide Emission Factors (Hu Huan Qi Hou [2026] No. 5). 12 January 2026. Available online: https://sthj.sh.gov.cn/hbzhywpt1098/ydqhbhgl/20260113/e8a1be0f8c91444581036739c1aff7ac.html (accessed on 21 August 2026). (In Chinese)
- Heaps, C.G. LEAP: The Low Emissions Analysis Platform, Version 2024; Stockholm Environment Institute: Somerville, MA, USA, 2024; Available online: https://leap.sei.org (accessed on 21 August 2026).
- Zhang, Z.; Jia, J.; Guo, Y.; Wu, B.; Chen, C. Scenario of carbon dioxide (CO2) emission peaking and reduction path implication in five northwestern provinces of China by the low emissions analysis platform (LEAP) model. Front. Energy Res. 2022, 10, 983751. [Google Scholar] [CrossRef] [Scilit]
- Chen, M.; Zhang, C.; Chen, C.; Li, J.; Cui, W. Main pathways of carbon reduction in cities under the target of carbon peaking: A case study of Nanjing, China. Sustainability 2023, 15, 8917. [Google Scholar] [CrossRef] [Scilit]
- Xie, X.; Li, Y.; Zhang, H.; Chang, Z.; Zhan, Y. Pathway simulation and evaluation of carbon neutrality in the Sichuan–Chongqing region based on the LEAP model. Sustainability 2025, 17, 3233. [Google Scholar] [CrossRef] [Scilit]
- Intergovernmental Panel on Climate Change. 2006 IPCC Guidelines for National Greenhouse Gas Inventories, Volume 2: Energy; Institute for Global Environmental Strategies: Hayama, Japan, 2006; Available online: https://www.ipcc-nggip.iges.or.jp/public/2006gl/vol2.html (accessed on 21 August 2026).
- World Resources Institute; World Business Council for Sustainable Development. Corporate Value Chain (Scope 3) Accounting and Reporting Standard; World Resources Institute: Washington, DC, USA, 2011; Available online: https://www.wri.org/research/greenhouse-gas-protocol-corporate-value-chain-scope-3-accounting-and-reporting-standard (accessed on 21 August 2026).
- International Energy Agency. Energy Technology Perspectives 2024; OECD Publishing: Paris, France, 2024; Available online: https://www.iea.org/reports/energy-technology-perspectives-2024 (accessed on 21 August 2026).
- Yue, Y.; Wang, T.; Liang, S.; Yang, J.; Hou, P.; Qu, S.; Zhou, J.; Jia, X.; Wang, H.; Xu, M. Life cycle assessment of high speed rail in China. Transp. Res. Part D Transp. Environ. 2015, 41, 367–376. [Google Scholar] [CrossRef] [Scilit]
- Jiang, C.; Wan, Y.; Yang, H.; Zhang, A. Impacts of high-speed rail projects on CO2 emissions due to modal interactions: A review. Transp. Res. Part D Transp. Environ. 2021, 100, 103081. [Google Scholar] [CrossRef] [Scilit]
- International Council on Clean Transportation. Evaluation of Real-World Fuel Consumption of Light-Duty Vehicles in China: A 2021 Update; ICCT: Washington, DC, USA, 2021; Available online: https://theicct.org/publication/evaluation-of-real-world-fuel-consumption-of-light-duty-vehicles-in-china-a-2021-update/ (accessed on 21 August 2026).
- European Environment Agency. EMEP/EEA Air Pollutant Emission Inventory Guidebook 2023—Update 2024, 1.A.3.b.i–iv Road Transport; Publications Office of the European Union: Luxembourg, 2024; Available online: https://www.eea.europa.eu/publications/emep-eea-guidebook-2023 (accessed on 21 August 2026).
- Ministry of Ecology and Environment of the People’s Republic of China; National Bureau of Statistics of China. Announcement on the Release of 2023 Electricity Carbon Dioxide Emission Factors (Announcement No. 47 of 2025). 2025. Available online: https://www.mee.gov.cn/xxgk2018/xxgk/xxgk01/202512/t20251231_1139517.html (accessed on 21 August 2026).
- International Maritime Organization. Fourth IMO Greenhouse Gas Study 2020; International Maritime Organization: London, UK, 2021; Available online: https://www.imo.org/en/ourwork/environment/pages/imo-ghg-studies.aspx (accessed on 21 August 2026).
- International Civil Aviation Organization. CORSIA Methodology for Calculating Actual Life Cycle Emissions Values, 5th ed.; ICAO: Montreal, QC, Canada, 2024; Available online: https://canadacommons.ca/artifacts/37722403/corsia-methodology-for-calculating-actual-life-cycle-emissions-values/38621556/ (accessed on 21 August 2026).
- EUROCONTROL. Standard Inputs for Economic Analyses, 10th ed.; EUROCONTROL: Brussels, Belgium, 2024; Available online: https://ansperformance.eu/economics/cba/standard-inputs/ (accessed on 21 August 2026).
- European Environment Agency. EMEP/EEA Air Pollutant Emission Inventory Guidebook 2023—1.A.4 Non-Road Mobile Sources and Machinery; Publications Office of the European Union: Luxembourg, 2023; Available online: https://www.eea.europa.eu/en/analysis/publications/emep-eea-guidebook-2023/part-b-sectoral-guidance-chapters/1-energy/1-a-combustion/1-a-4-non-road (accessed on 21 August 2026).
- China Electricity Council. Annual Development Report of China’s Power Industry 2023; China Electricity Council: Beijing, China, 2023. (In Chinese) [Google Scholar]
- Central Committee of the Communist Party of China; State Council of the People’s Republic of China. Outline of the Yangtze River Delta Regional Integration Development Plan; Beijing, China, 2019. (In Chinese) [Google Scholar]
- Chen, Z. Impacts of high-speed rail on domestic air transportation in China. J. Transp. Geogr. 2017, 62, 184–196. [Google Scholar] [CrossRef] [Scilit] [PubMed]
- Li, H.; Strauss, J.; Lu, L. The impact of high-speed rail on civil aviation in China. Transp. Policy 2019, 74, 187–200. [Google Scholar] [CrossRef] [Scilit]
- Xinhua News Agency. Shanghai Receives over 6.7 Million Inbound Tourists in 2024; Shanghai Municipal People’s Government. 24 January 2025. Available online: https://english.shanghai.gov.cn/en-Latest-WhatsNew/20250124/fac0685353e64db4bde4db6c09ad43f1.html (accessed on 20 October 2026).
- Dolf, M.; Teehan, P. Reducing the carbon footprint of spectator and team travel at the University of British Columbia’s varsity sports events. Sport Manag. Rev. 2015, 18, 244–255. [Google Scholar] [CrossRef] [Scilit]
- Triantafyllidis, S.; Ries, R.; Kaplanidou, K. Carbon dioxide emissions of spectators’ transportation in collegiate sporting events: Comparing on-campus and off-campus stadium locations. Sustainability 2018, 10, 241. [Google Scholar] [CrossRef] [Scilit]
- Collins, A.; Flynn, A.; Munday, M.; Roberts, A. Assessing the environmental consequences of major sporting events: The 2003/04 FA Cup Final. Urban Stud. 2007, 44, 457–476. [Google Scholar] [CrossRef] [Scilit]
- Collins, A.; Jones, C.; Munday, M. Assessing the environmental impacts of mega sporting events: Two options? Tour. Manag. 2009, 30, 828–837. [Google Scholar] [CrossRef] [Scilit]
- Megill, L.; Deck, K.; Grewe, V. Alternative climate metrics to the Global Warming Potential are more suitable for assessing aviation non-CO2 effects. Commun. Earth Environ. 2024, 5, 249. [Google Scholar] [CrossRef] [Scilit]
- Klaaßen, L.; Stoll, C. Harmonizing corporate carbon footprints. Nat. Commun. 2021, 12, 6149. [Google Scholar] [CrossRef] [Scilit] [PubMed]
- Bjørn, A.; Lloyd, S.M.; Brander, M.; Matthews, H.D. Renewable energy certificates threaten the integrity of corporate science-based targets. Nat. Clim. Change 2022, 12, 539–546. [Google Scholar] [CrossRef] [Scilit]
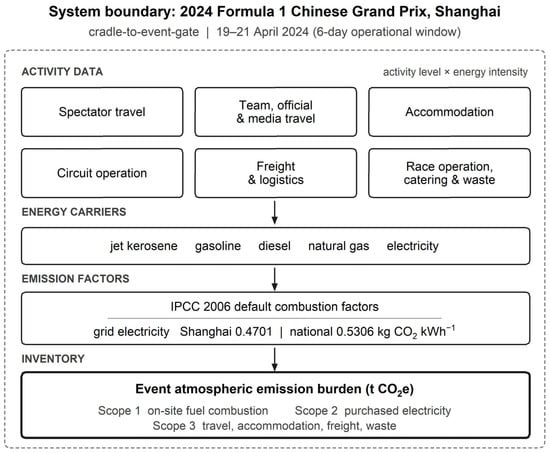
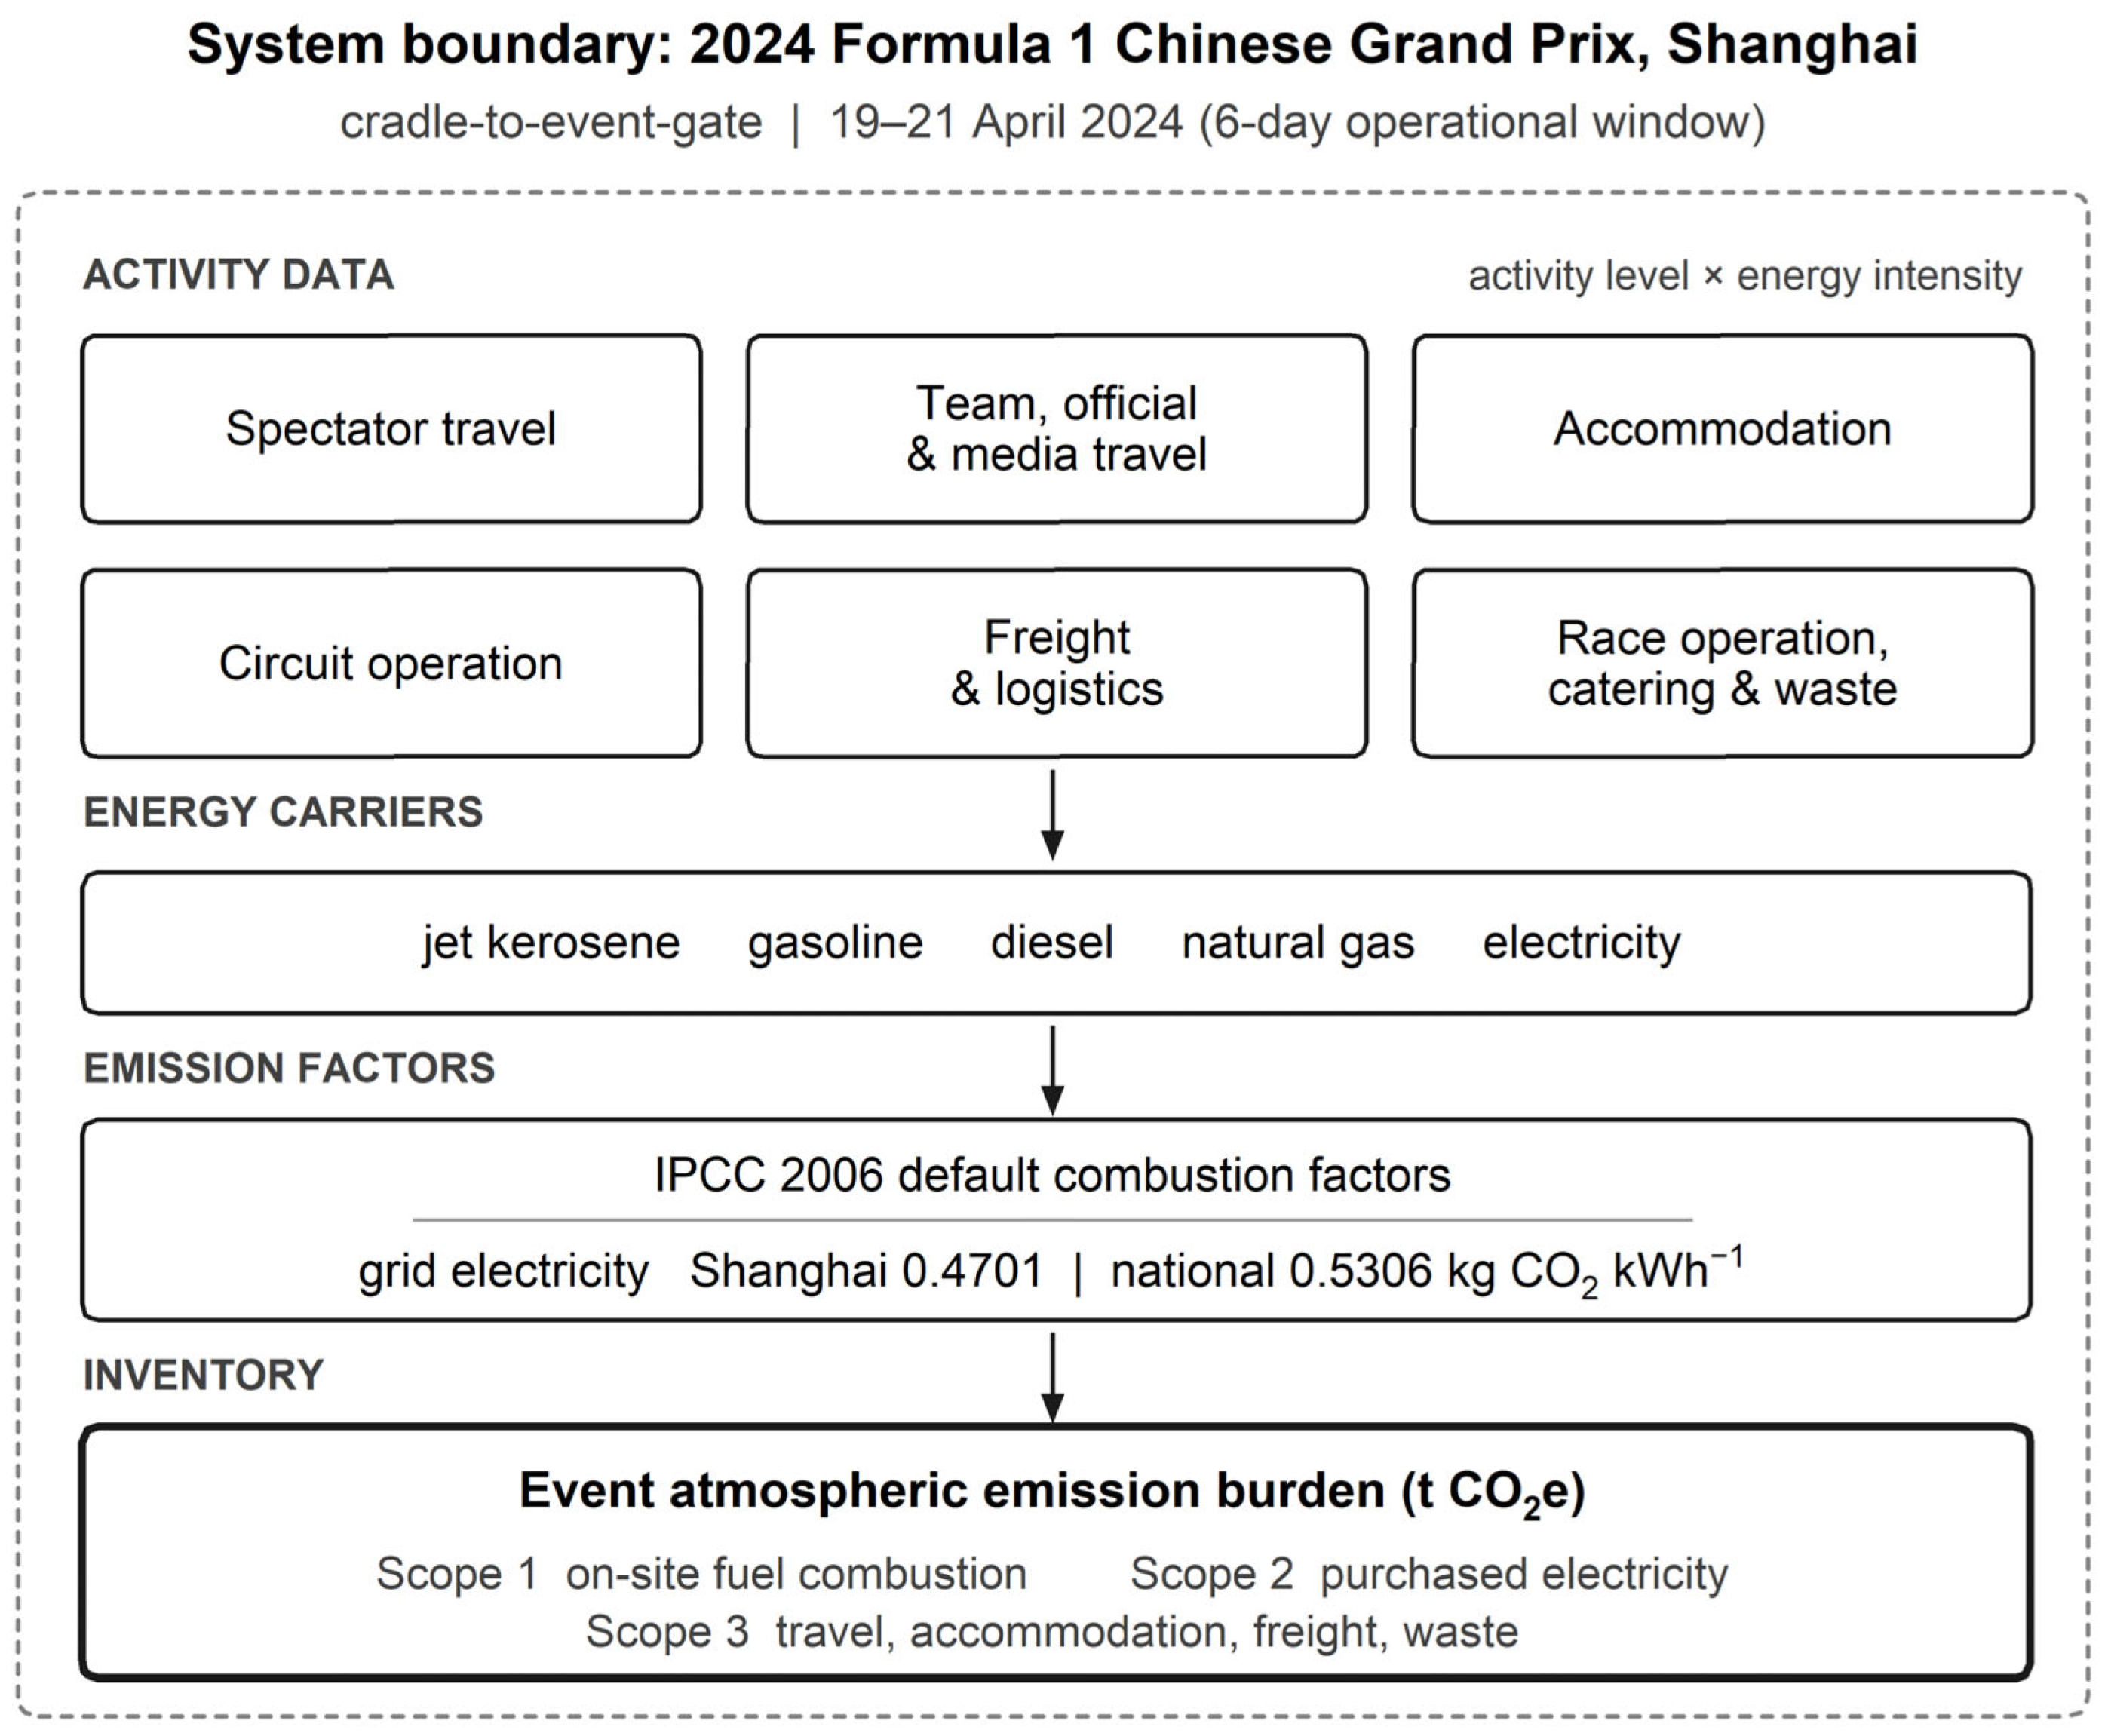
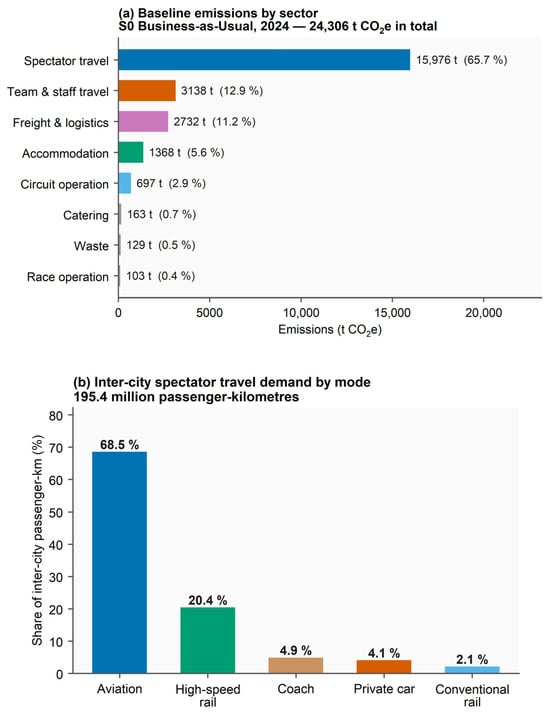
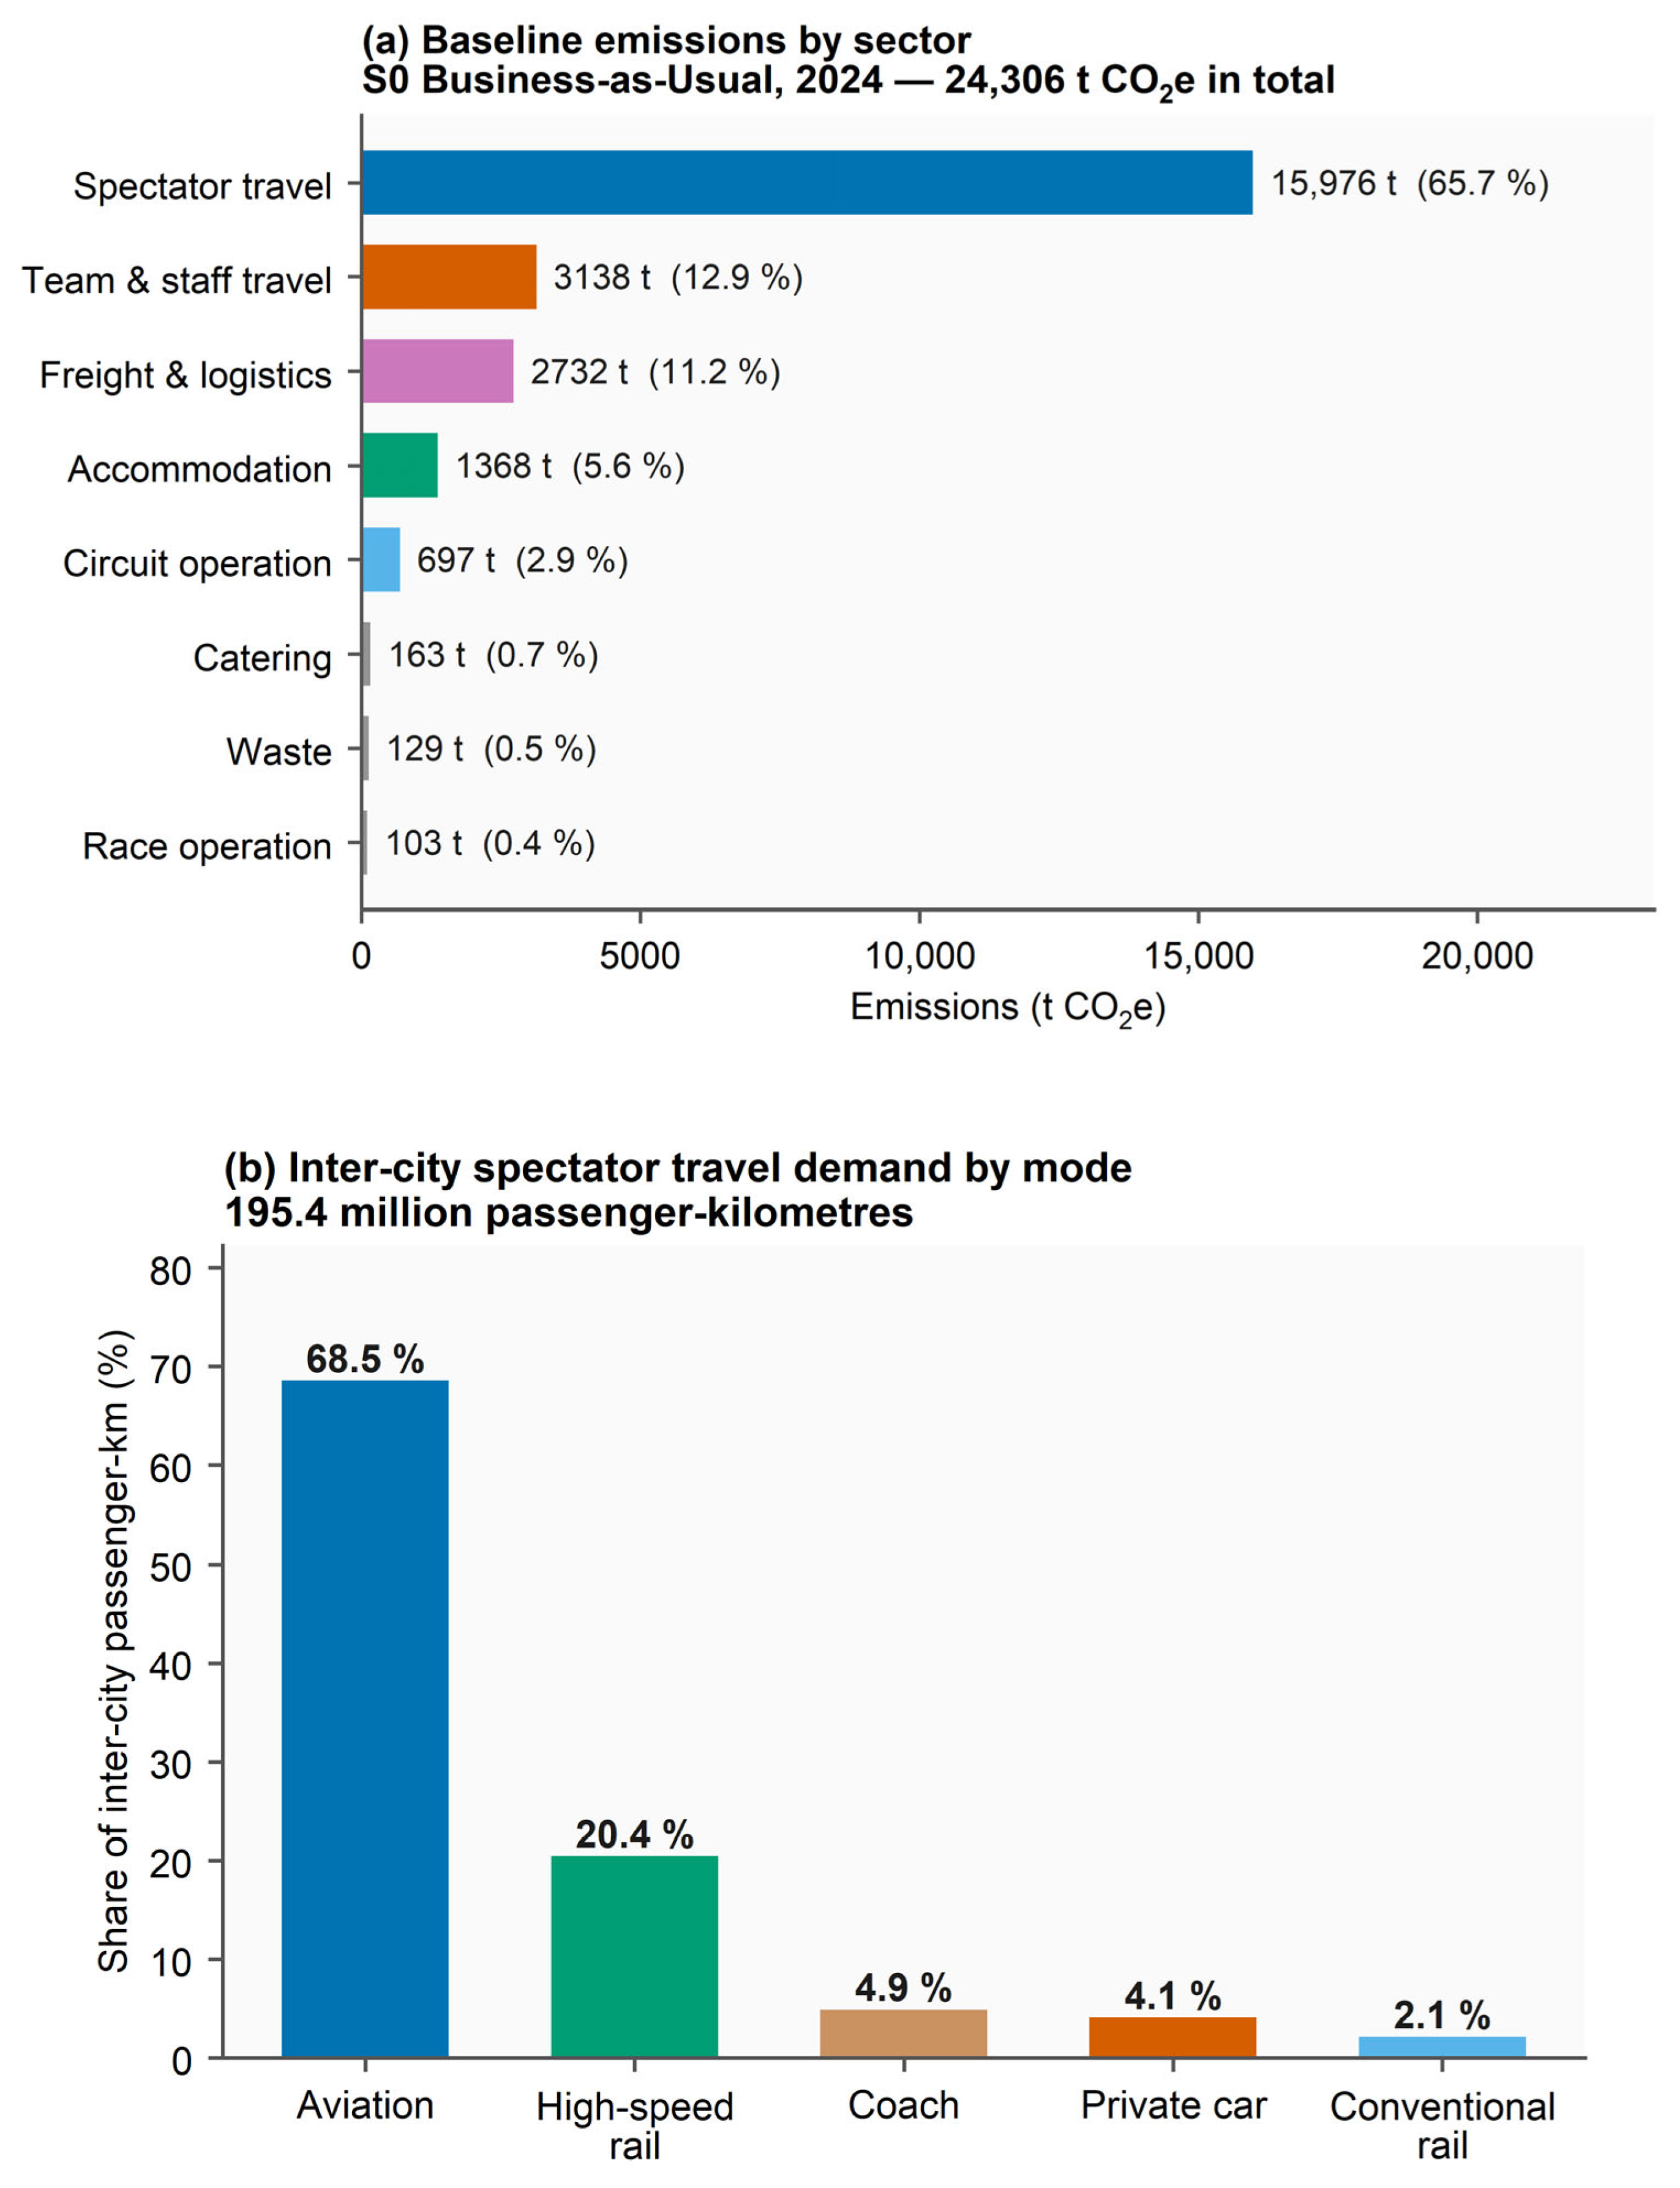
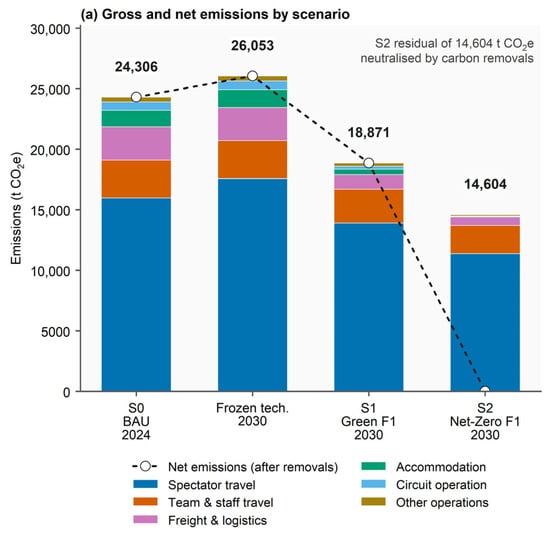
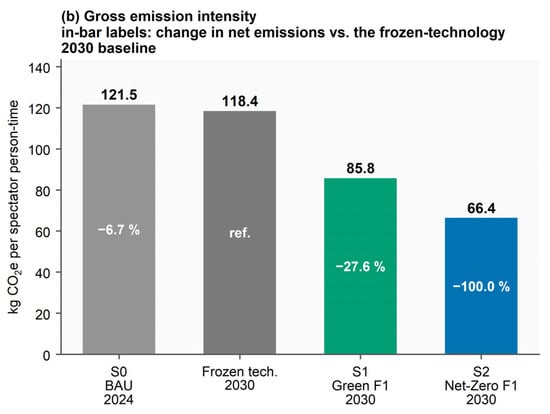
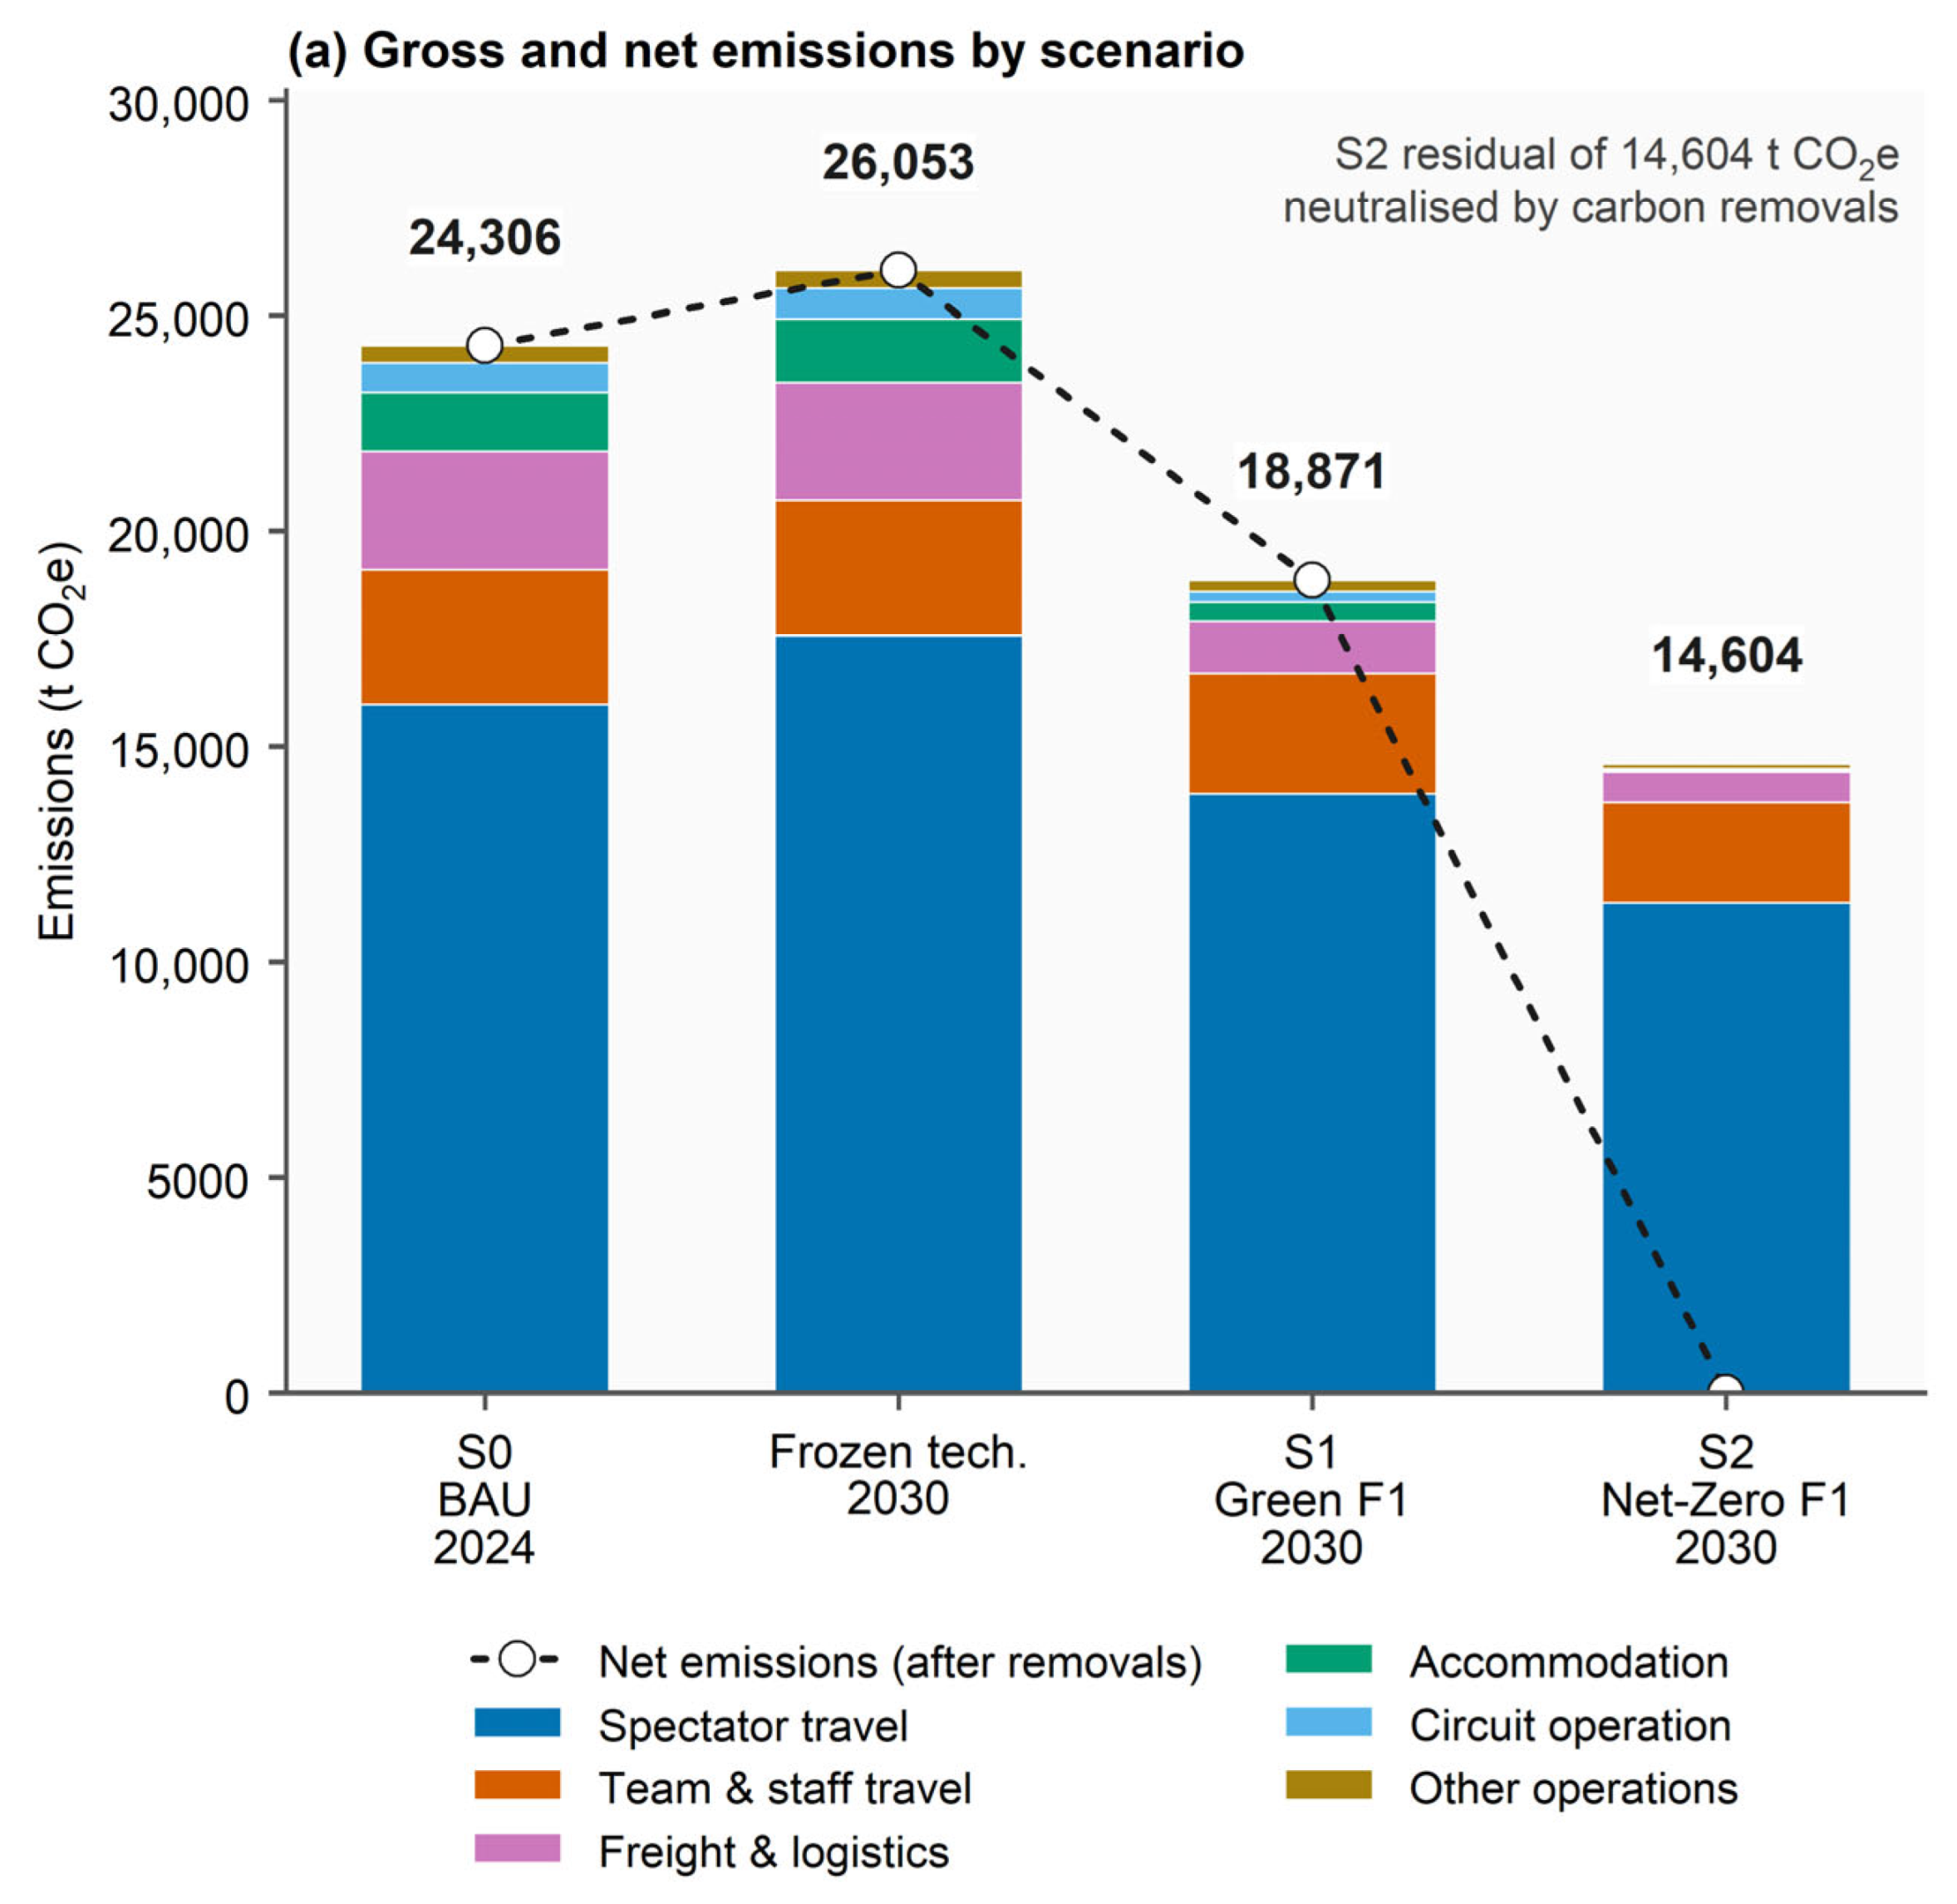
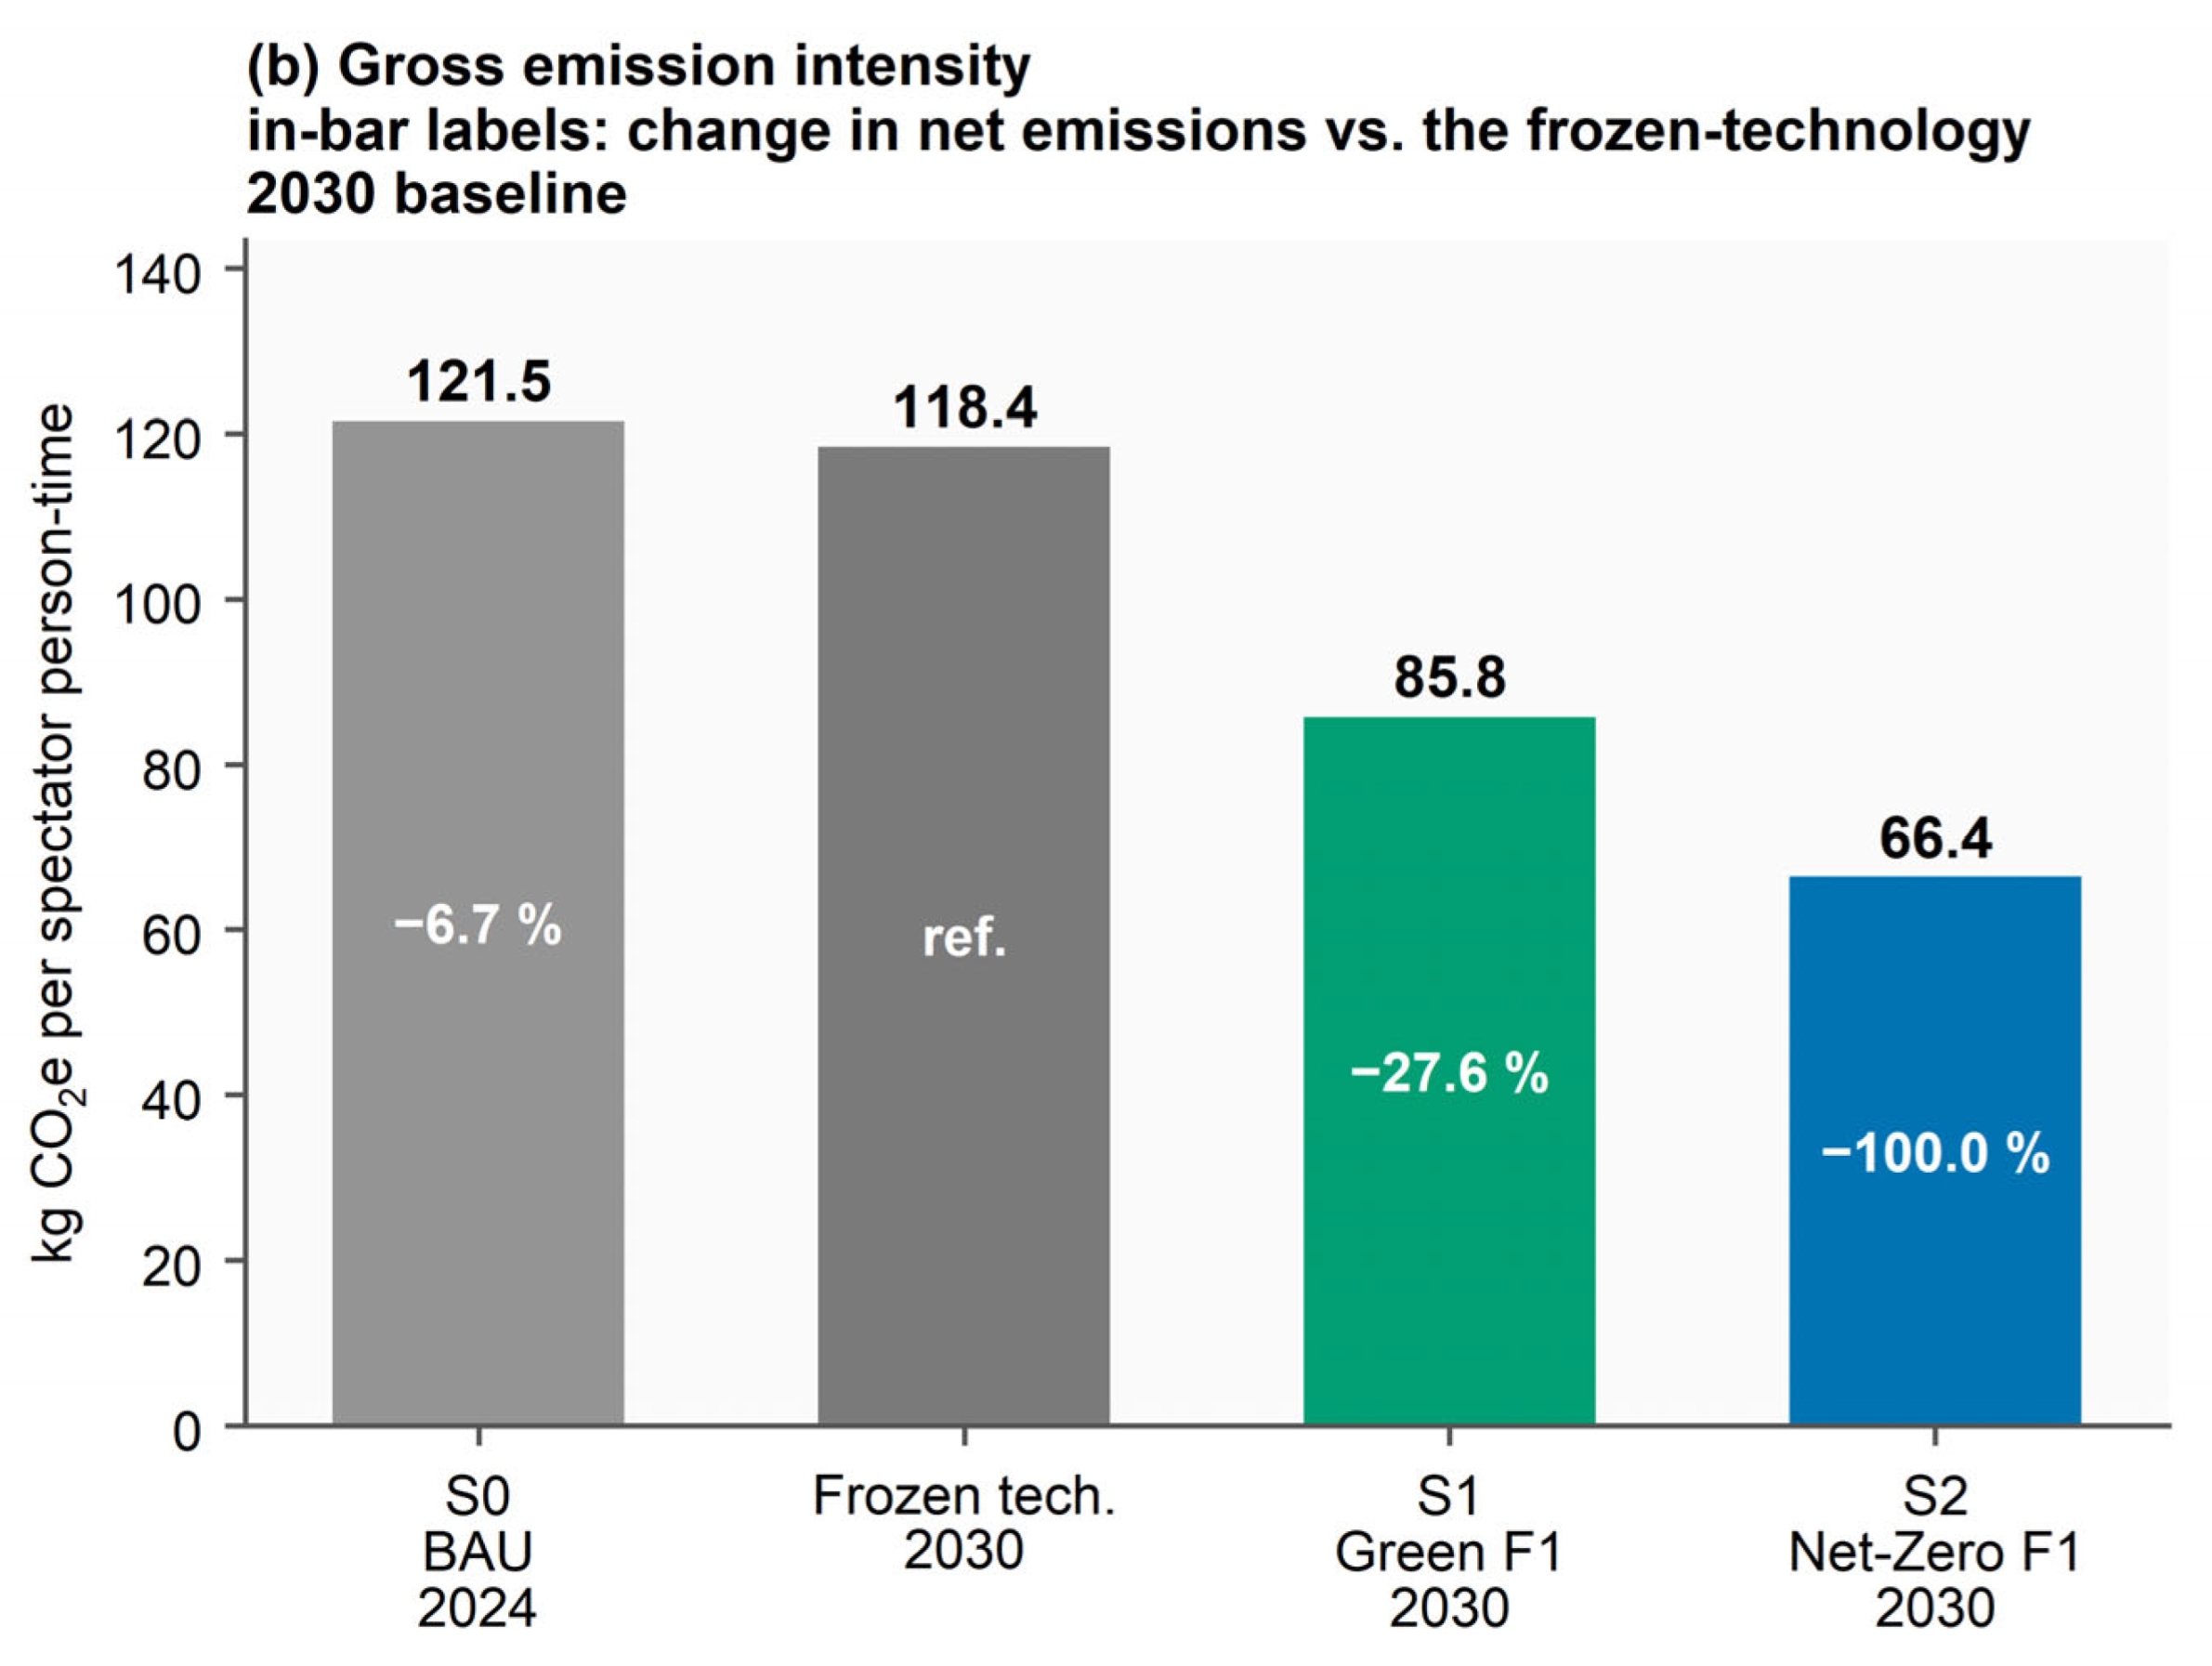
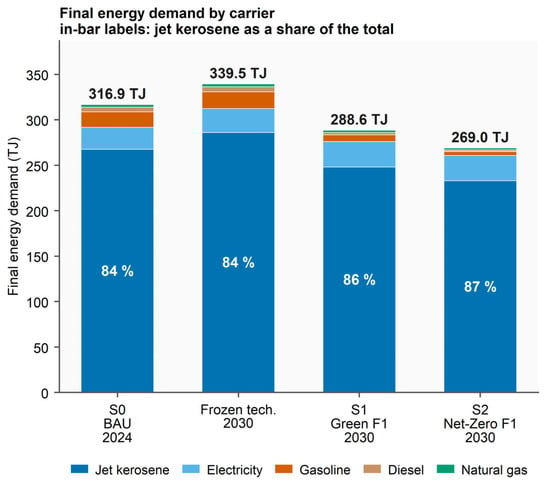
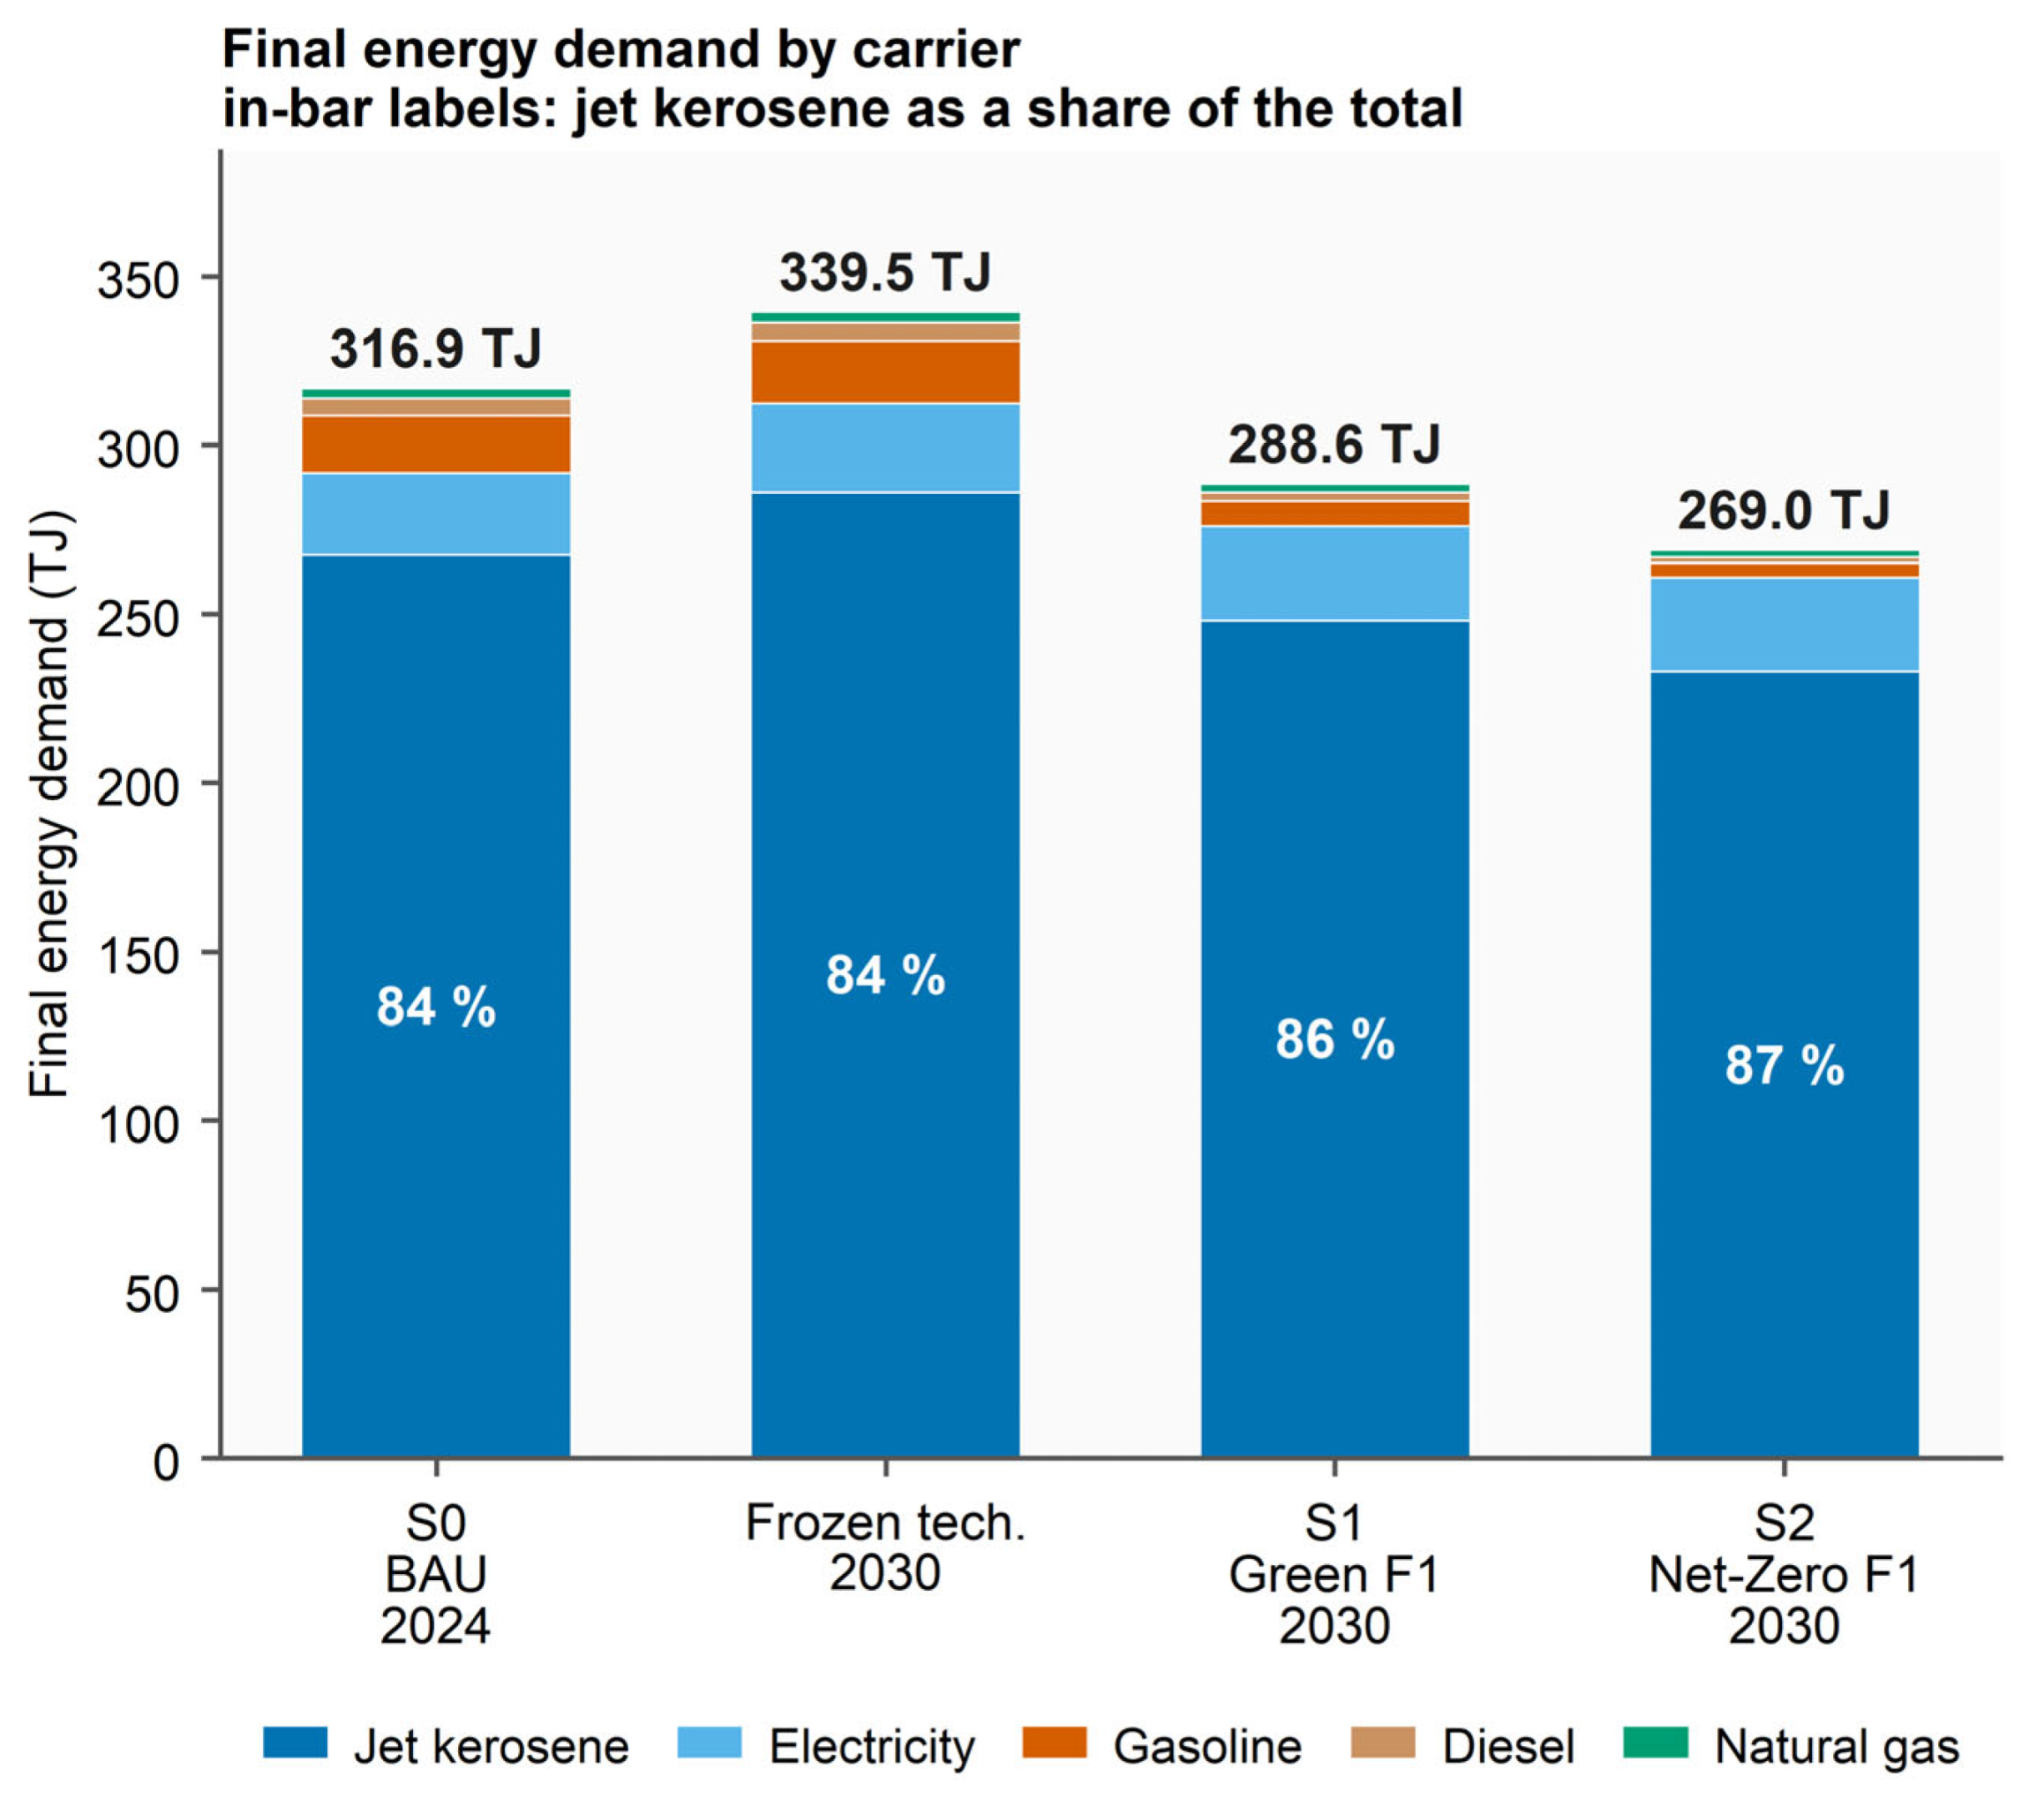
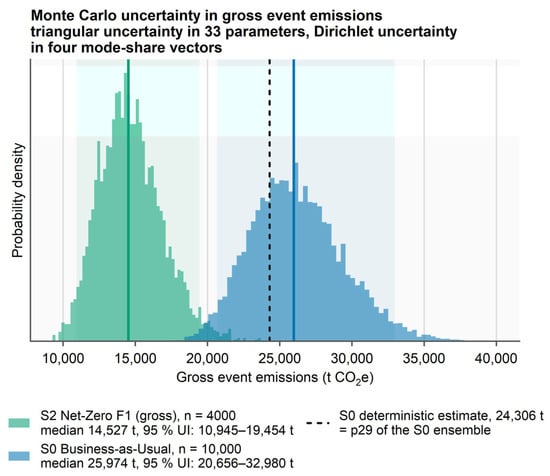
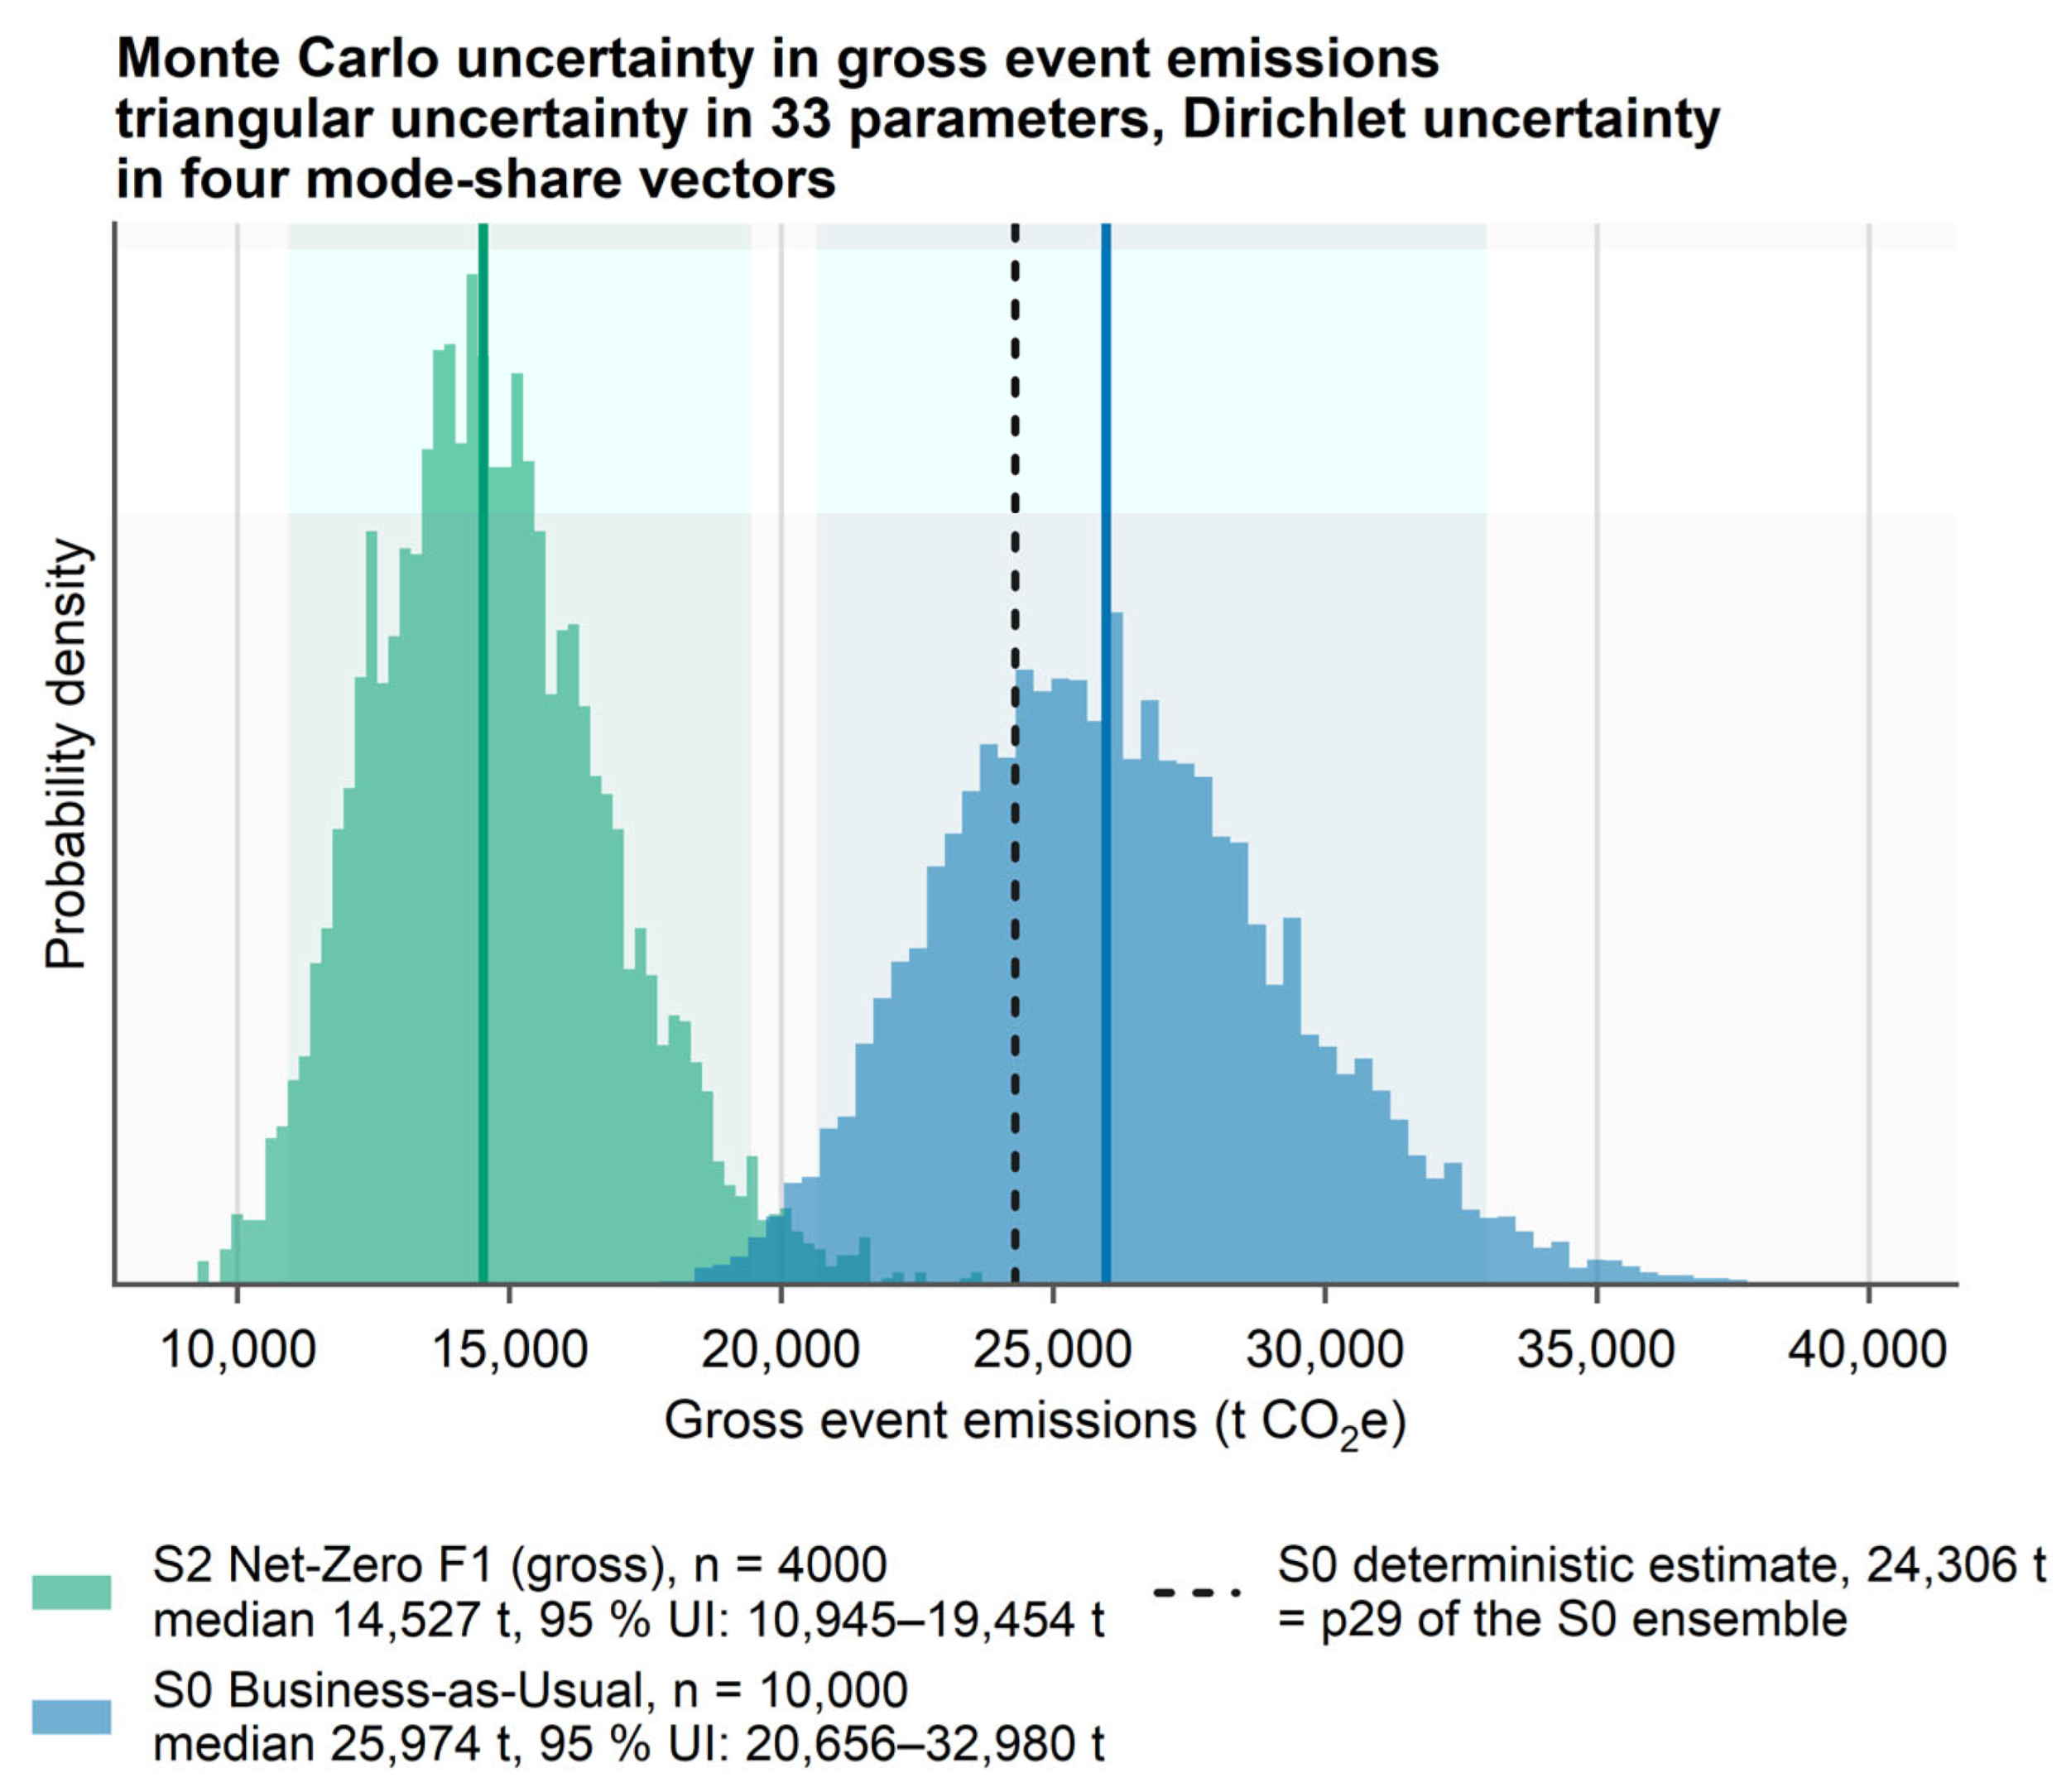
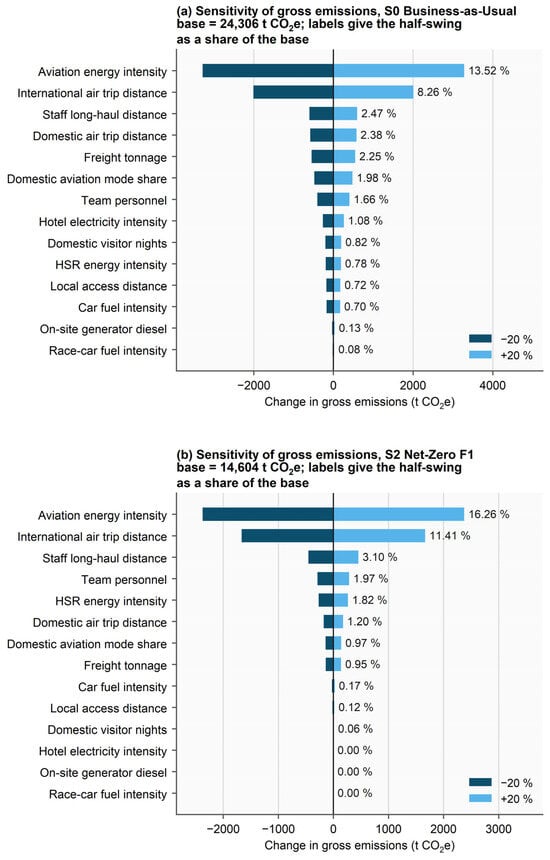
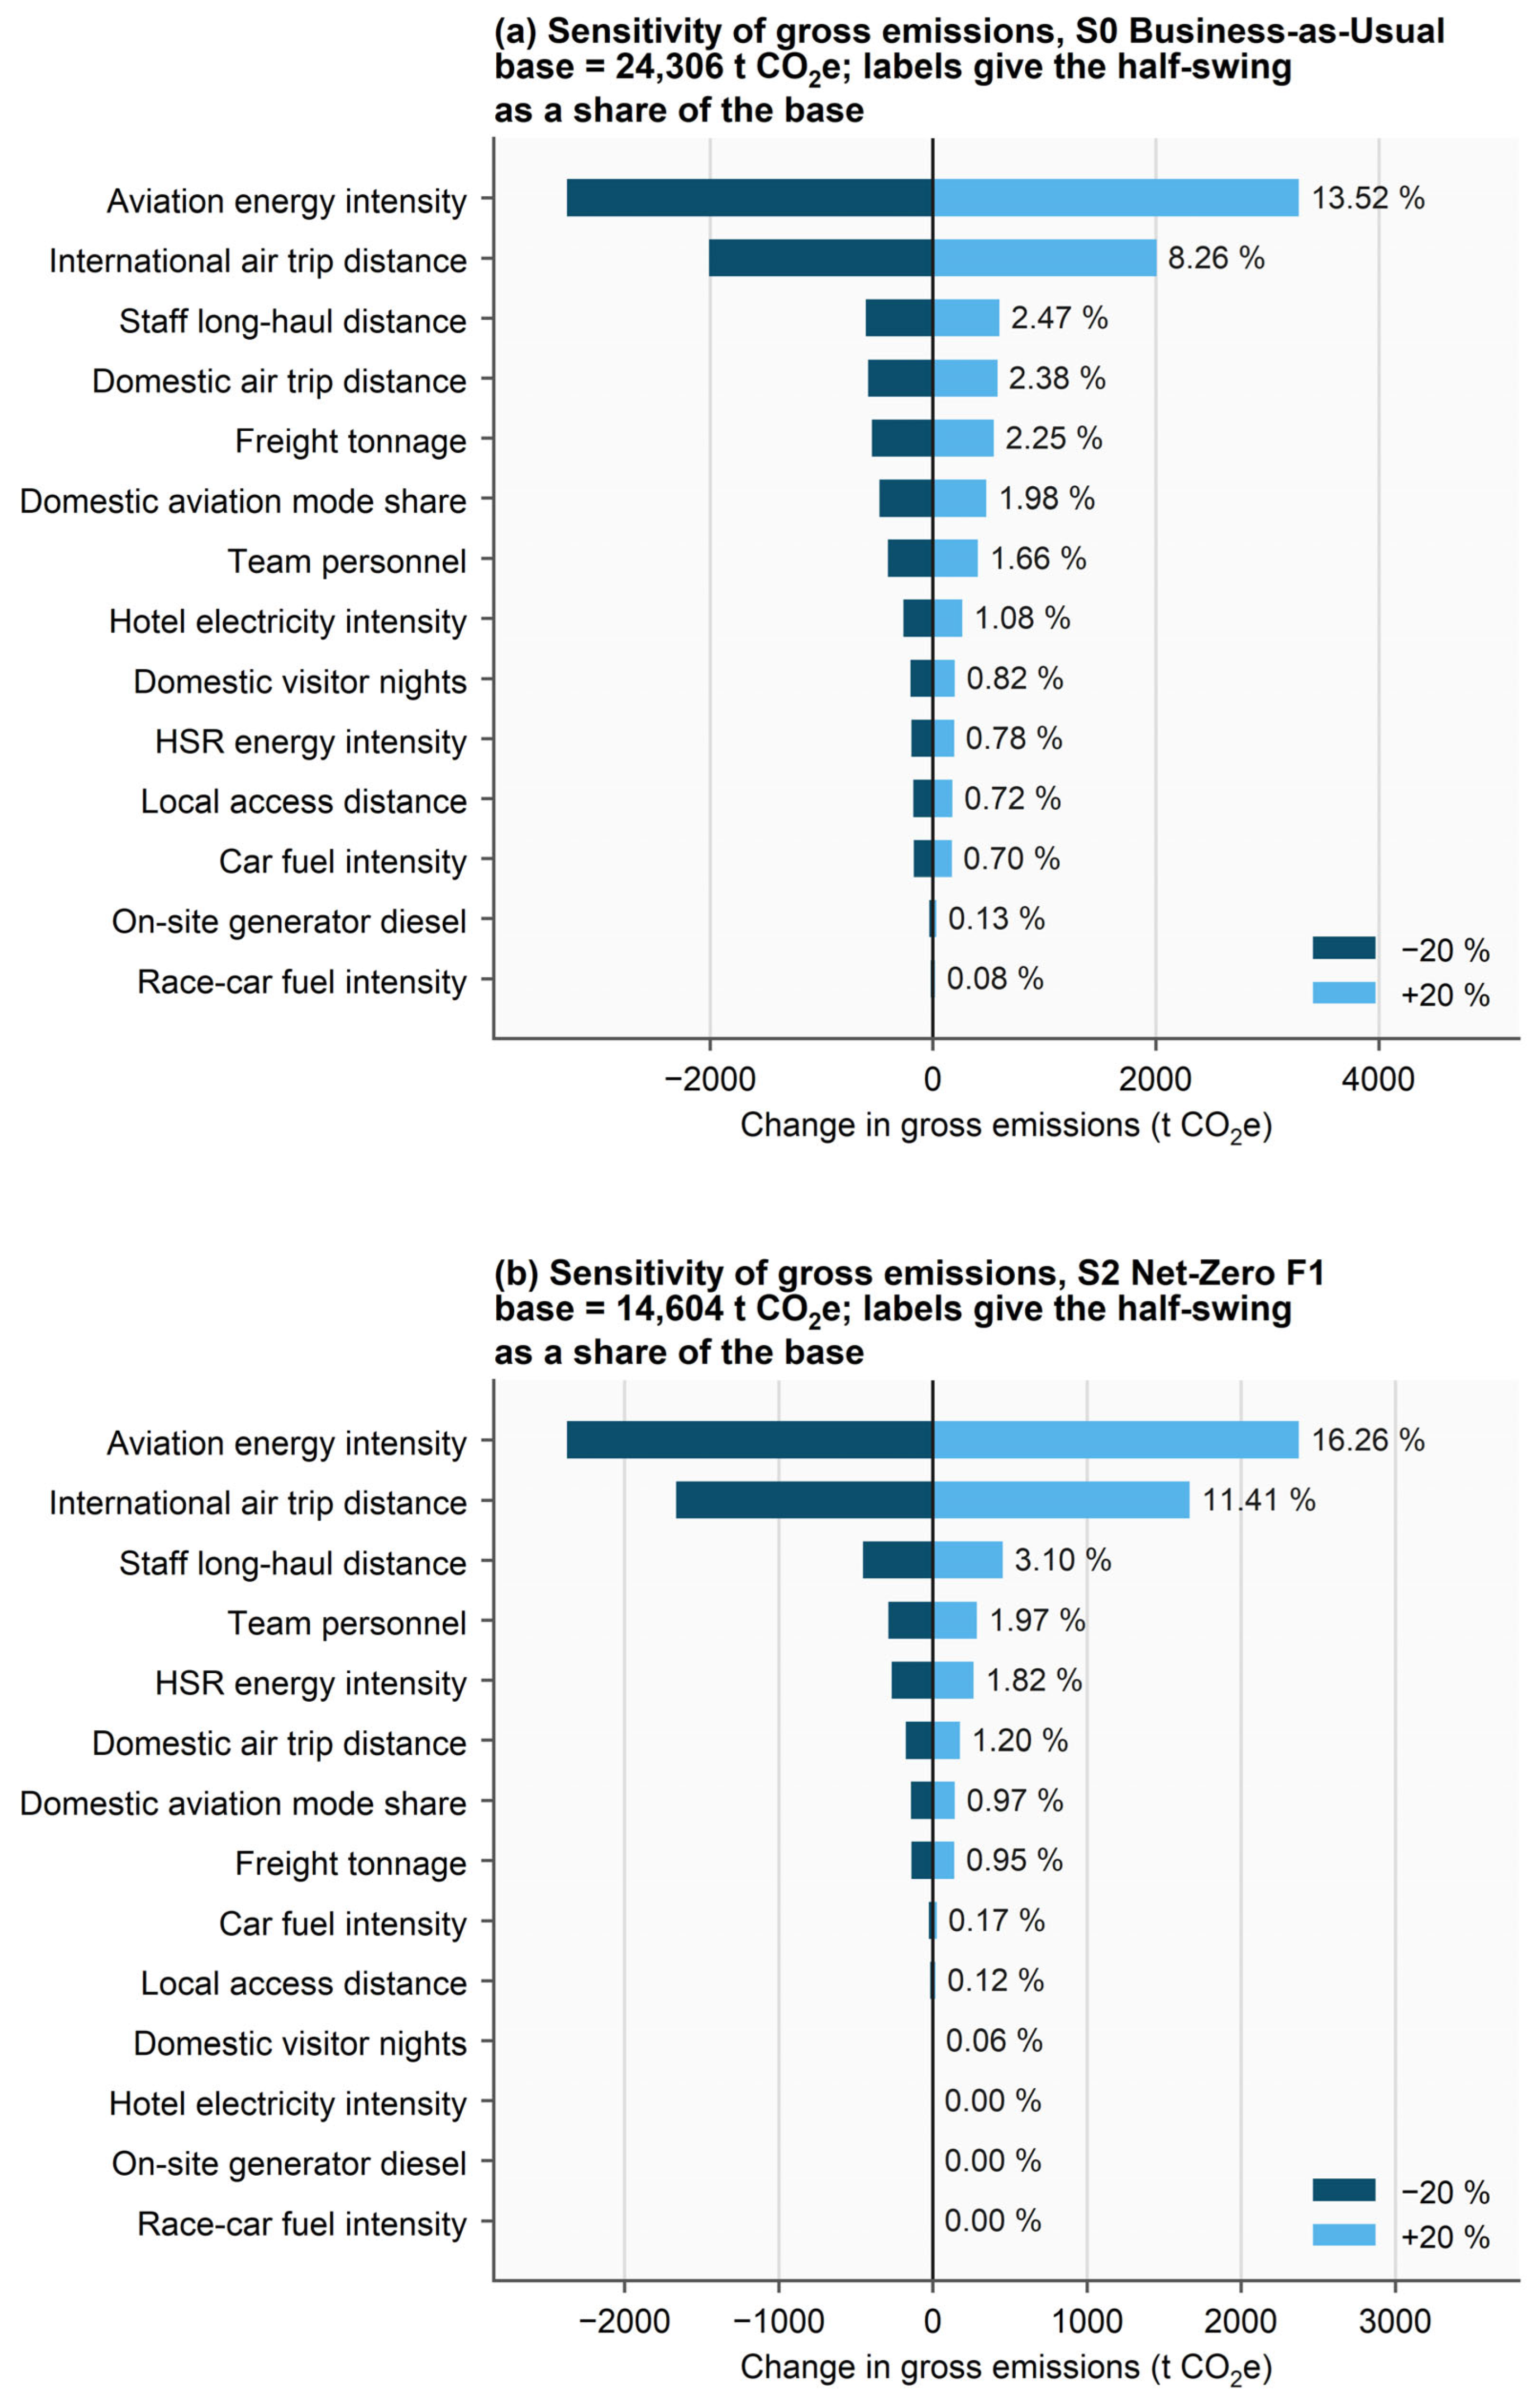
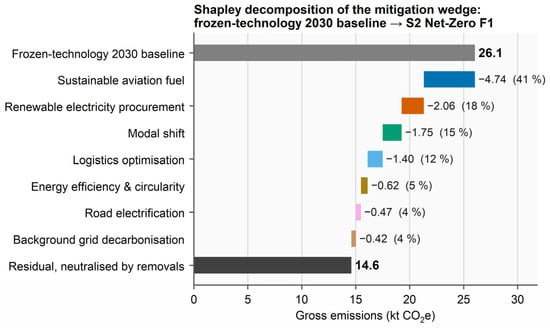
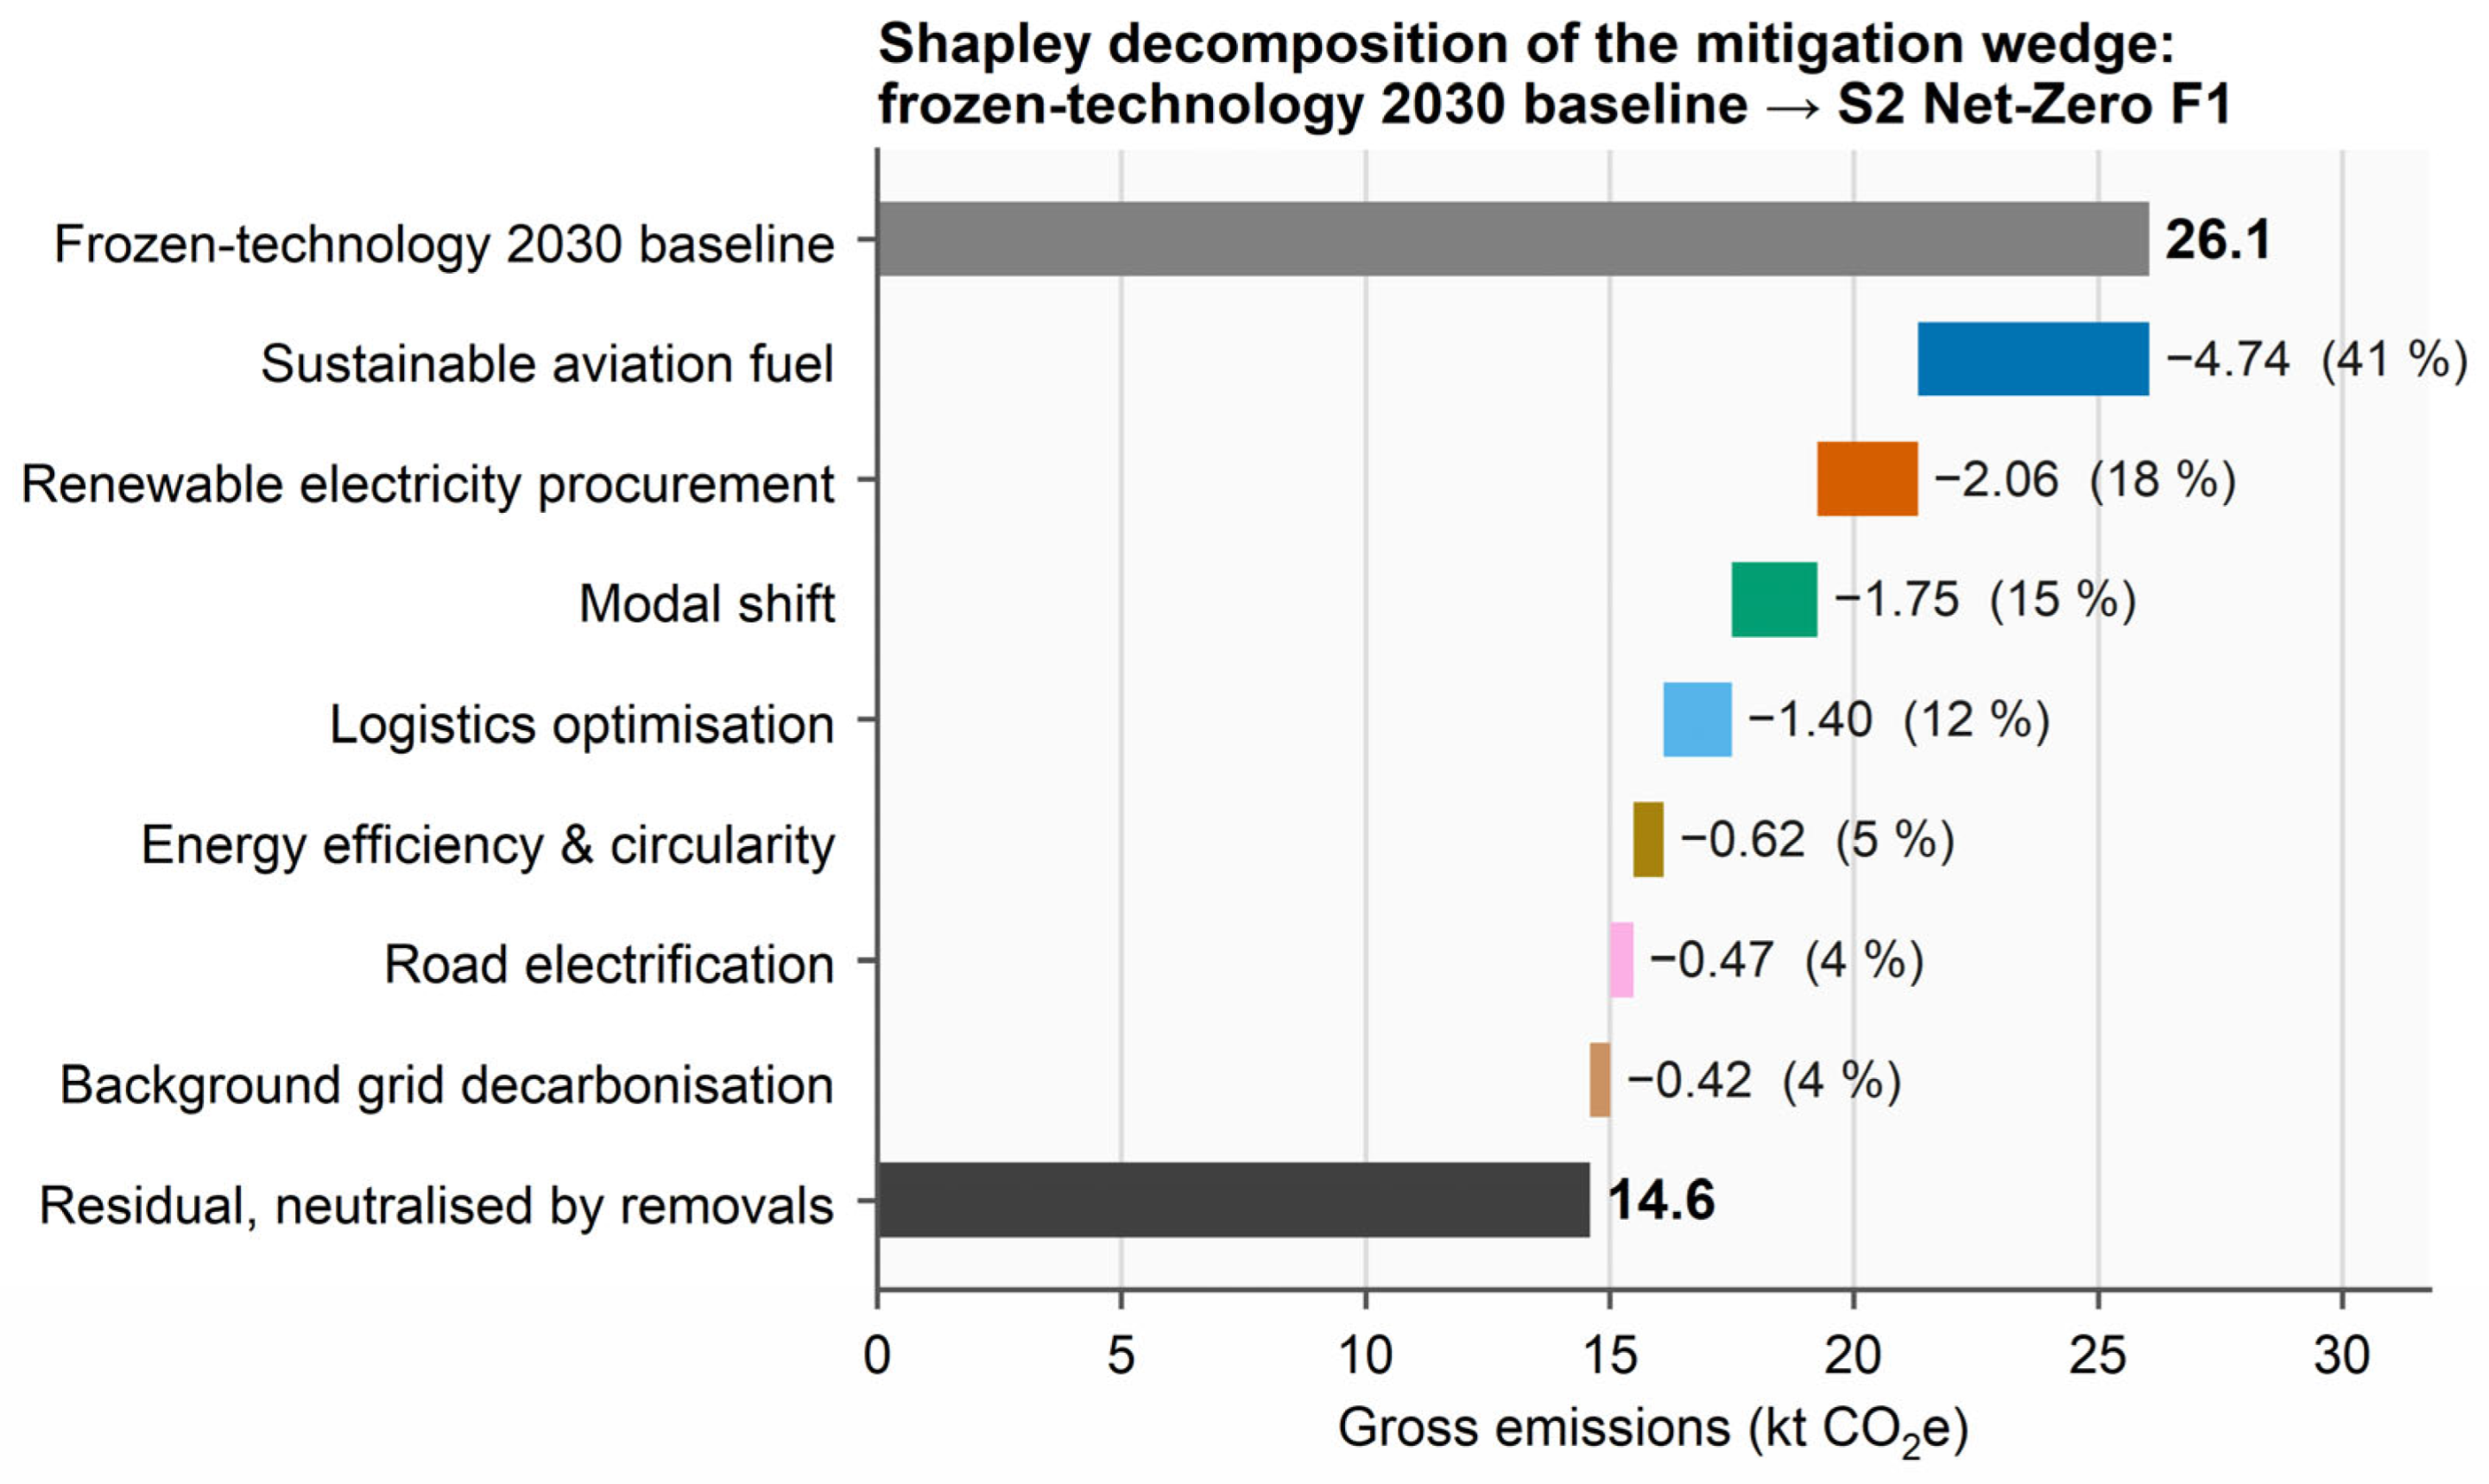

Disclaimer/Publisher’s Note: The statements, opinions and data contained in all publications are solely those of the individual author(s) and contributor(s) and not of MDPI and/or the editor(s). MDPI and/or the editor(s) disclaim responsibility for any injury to people or property resulting from any ideas, methods, instructions or products referred to in the content. |
© 2026 by the authors. Licensee MDPI, Basel, Switzerland. This article is an open access article distributed under the terms and conditions of the Creative Commons Attribution (CC BY) license.