


Abstract
Urbanization significantly affects regional climate, and accurately representing urban canopy processes is crucial for simulating heatwaves in highly urbanized regions such as North China. To evaluate the impacts of different urban canopy schemes on surface parameter simulation, this study compares the No Urban Canopy Model (NOUCM), Single-Layer Urban Canopy Model (SLUCM), and Multi-Layer Urban Canopy Model (MLUCM) during a heatwave in North China from 5 to 7 July 2023. The simulations use WRFv4.6.1 and are verified against observations from 141 urban stations. NOUCM shows a positive bias in 10 m wind speed. SLUCM introduces a building drag effect, but its single-layer representation cannot resolve the vertical distribution of drag, leading to a 15.8% increase in RMSE relative to NOUCM. MLUCM explicitly represents the building drag effect and reduces RMSE by 29.5%. For 2 m temperature, all schemes show positive biases. SLUCM produces cooler daytime and warmer nighttime temperatures, with a large nighttime bias. MLUCM more realistically simulates shading and radiation trapping, reducing the daytime RMSE by 18.2% and yielding nighttime biases close to zero. For 2 m specific humidity, SLUCM and MLUCM reduce RMSE by 1.8% and 0.7%, respectively. For urban heat island (UHI) intensity, MLUCM achieves an overall RMSE of 0.721 °C, which is 30.2% and 33.2% lower than NOUCM and SLUCM, respectively. It also produces the smallest daytime and nighttime biases, with good agreement with observations during 12–20 h. SLUCM shows a nighttime UHI bias of +1.094 °C, while NOUCM shows a daytime bias of +1.176 °C. Overall, MLUCM demonstrates superior performance in simulating wind speed, temperature, and UHI intensity, though its advantage in 2 m specific humidity is limited. These findings provide a reference for selecting urban canopy schemes in operational numerical weather prediction over highly urbanized regions.
1. Introduction
Urbanization is a major form of human-induced land surface change and has profound effects on regional climate, especially in rapidly urbanizing regions. North China is one of the regions with the most rapid urbanization in China. The Beijing–Tianjin–Hebei urban agglomeration, the largest urban agglomeration in northern China, has expanded rapidly over the past two decades, profoundly affecting the regional climate [1,2]. As urban areas continue to expand and the proportion of impervious surfaces increases, drastic changes in land cover have significantly disturbed the regional energy balance and water cycle [3]. Observational studies indicate that the urban heat island effect induced by urbanization has led to a warming of approximately 0.11 °C/10 a in the annual mean temperature at national base and reference stations in North China, accounting for about 37.9% of the observed warming [1,2]. The synergistic effect of urbanization and climate change has amplified the risk of extreme heat events [4], and the relationship between reduced precipitation and extreme heat has strengthened over the past 50 years, with urbanization significantly enhancing the link between summer drought and heatwaves [5]. Similar challenges have been reported in other rapidly urbanizing regions, where urban canopy schemes strongly affect the simulation of heatwaves and urban heat islands [6]. These changes make North China an ideal region for evaluating and improving urban canopy models (UCMs) [7,8,9].
Urban surface processes directly control the exchange of momentum, heat, and water vapor between the land surface and the atmosphere, and the accurate parameterization of complex urban features remains a major challenge in numerical weather prediction [10,11,12]. Previous studies have shown that model simulations are more sensitive to the urban canopy scheme than to the planetary boundary layer scheme [13,14]. UCMs quantitatively characterize urban surface features by introducing parameters such as building density, street width, and vegetation fraction, and their development has been closely associated with the wider use of local climate zone (LCZ) frameworks in urban climate modeling [15]. Two schemes are widely used: the Single-Layer Urban Canopy Model (SLUCM) [16,17] and the Multi-Layer Building Environment Parameterization (MLUCM) [18]. SLUCM subdivides urban land use according to building density, street width, and vegetation fraction, and parameterizes radiation shading and trapping between buildings, the wind profile within the canopy, and heat conduction across roofs, walls, and roads [16,17]. MLUCM adopts multi-layer vertical discretization and explicitly resolves the heat capacity of building walls and roofs, providing a more refined representation of urban heat islands, ventilation, and building energy consumption [18]. The two schemes can be viewed as two-dimensional and three-dimensional parameterizations of the urban environment, respectively, and their effects are transferred to the WRF model through fluxes of sensible heat and momentum. However, their relative performance is region-dependent. For example, MLUCM has been found to better reproduce urban heat island intensity in Toronto [19], whereas SLUCM showed smaller biases in Bengaluru, where daytime radiation trapping in MLUCM led to overestimated surface temperatures [20]. Furthermore, recent global evaluations have highlighted the sensitivity of WRF to surface urban physics [21] and the necessity of high-resolution simulations incorporating Local Climate Zones (LCZ) in complex urban environments [22,23,24].
The WRF model has continuously improved its representation of urban physical processes. Version 4.6.1 addresses several key issues in urban canopy models, including the correction of stability functions, improvement of the shortwave radiation balance of walls, and optimization of near-surface momentum flux calculations [25,26]. In addition, the timeliness and accuracy of land use data are crucial for urban simulations. Early studies often used land use data from the 1992 US Geological Survey (USGS) or the 2001 MODIS dataset, which cannot capture the drastic changes in the underlying surface caused by rapid urbanization in North China over the past two decades. In this study, 2020 MODIS land use data are used. These data are more up-to-date and compatible with WRF, with a spatial resolution of 500 m, allowing a more realistic representation of impervious surfaces and land surface types after recent urban expansion, and reducing biases caused by outdated land use data [27].
This study evaluates the performance of three urban canopy configurations, namely NOUCM (no urban canopy), SLUCM, and MLUCM, in simulating a typical heatwave event over North China in July 2023, using WRFv4.6.1 with 2020 MODIS land use data and observations from national automatic meteorological stations, with particular attention to their ability to reproduce urban heat island intensity. The main conclusions are as follows: MLUCM reduces the 10 m wind speed RMSE by 29.5% relative to NOUCM, reduces daytime temperature RMSE by 18.2%, and yields nighttime temperature biases closest to observations; for UHI intensity, MLUCM achieves an overall RMSE of 0.721 °C, which is 30.2% and 33.2% lower than NOUCM and SLUCM, respectively. These results highlight the value of multi-layer urban canopy schemes for fine-scale urban weather and thermal environment forecasting.
2. Materials and Methods
2.1. Experimental Design
To investigate the effects of urban canopy models on the simulation of surface parameters during a heatwave event over North China, simulations were conducted using the mesoscale numerical weather prediction model WRFv4.6.1. A single-domain configuration was adopted with a horizontal resolution of 3 km. The simulation domain covers approximately 5800 km × 4500 km, corresponding to 1945 × 1497 grid points, and the integration time step is 25 s. A total of 60 vertical levels were used, with the lowest model level approximately 25 m above the ground and a resolution of about 500 m near the model top (10 hPa, about 31 km). These configurations are consistent with the current operational setup of the Rapid-refresh Multi-scale Analysis and Prediction System-Short Term (RMAPS-ST), ensuring that the evaluation reflects real-world operational forecasting conditions over North China. The simulation period is 5–7 July 2023, with a new simulation initialized at 00:00 UTC each day and integrated for 42 h. The first 6 h of each simulation are treated as the spin-up period and are excluded from the verification. Initial and lateral boundary conditions were provided by the European Centre for Medium-Range Weather Forecasts (ECMWF) forecast dataset, with a spatial resolution of 0.25° × 0.25° and a temporal resolution of 6 h. Other physical parameterization schemes include the Yonsei University planetary boundary layer scheme, the Rapid Radiative Transfer Model for both shortwave and longwave radiation, and the Noah land surface model.
Three sensitivity experiments were designed: NOUCM, SLUCM, and MLUCM. NOUCM is a bulk scheme rather than an urban canopy model, in which urban effects are represented by modifying roughness length, surface albedo, surface heat capacity, soil thermal conductivity, and vegetation fraction in the land surface model. SLUCM treats the urban canopy as a single homogeneous layer and parameterizes radiation shading between buildings, the wind profile, and heat transfer across roofs, walls, and roads. It uses an infinitely long street canyon to represent urban morphology, accounts for building shadows and radiation reflection, and describes the wind profile within the canopy using a prescribed exponential function. SLUCM can simulate surface temperatures, heat fluxes, and internal temperature profiles for roofs, walls, and roads. MLUCM adopts a vertical discretization framework and explicitly resolves the thermal mass of building walls and roofs, providing a more accurate representation of urban heat island effects, ventilation, and building energy consumption. Multiple model levels (15 by default) are used within the canopy, which increases the computational cost. MLUCM accounts for the three-dimensional urban morphology, the dynamic and thermal effects of building and road surfaces, and their impact on turbulent kinetic energy. It can simulate the vertical variations in heat, momentum, and water vapor within the canopy, and the indoor building temperature is set to a constant value.
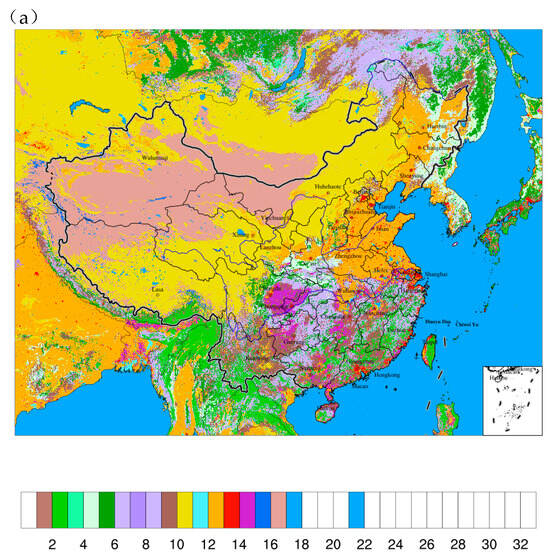
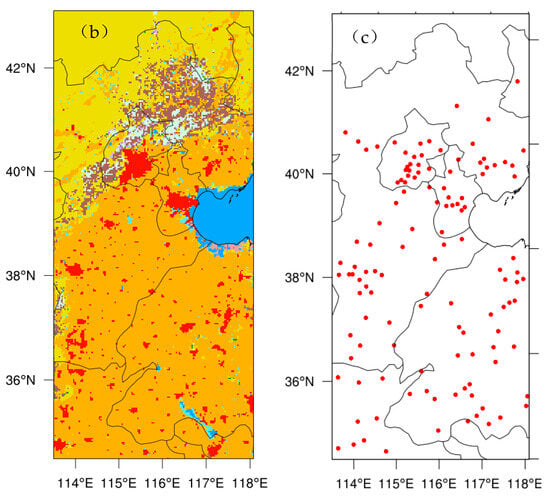
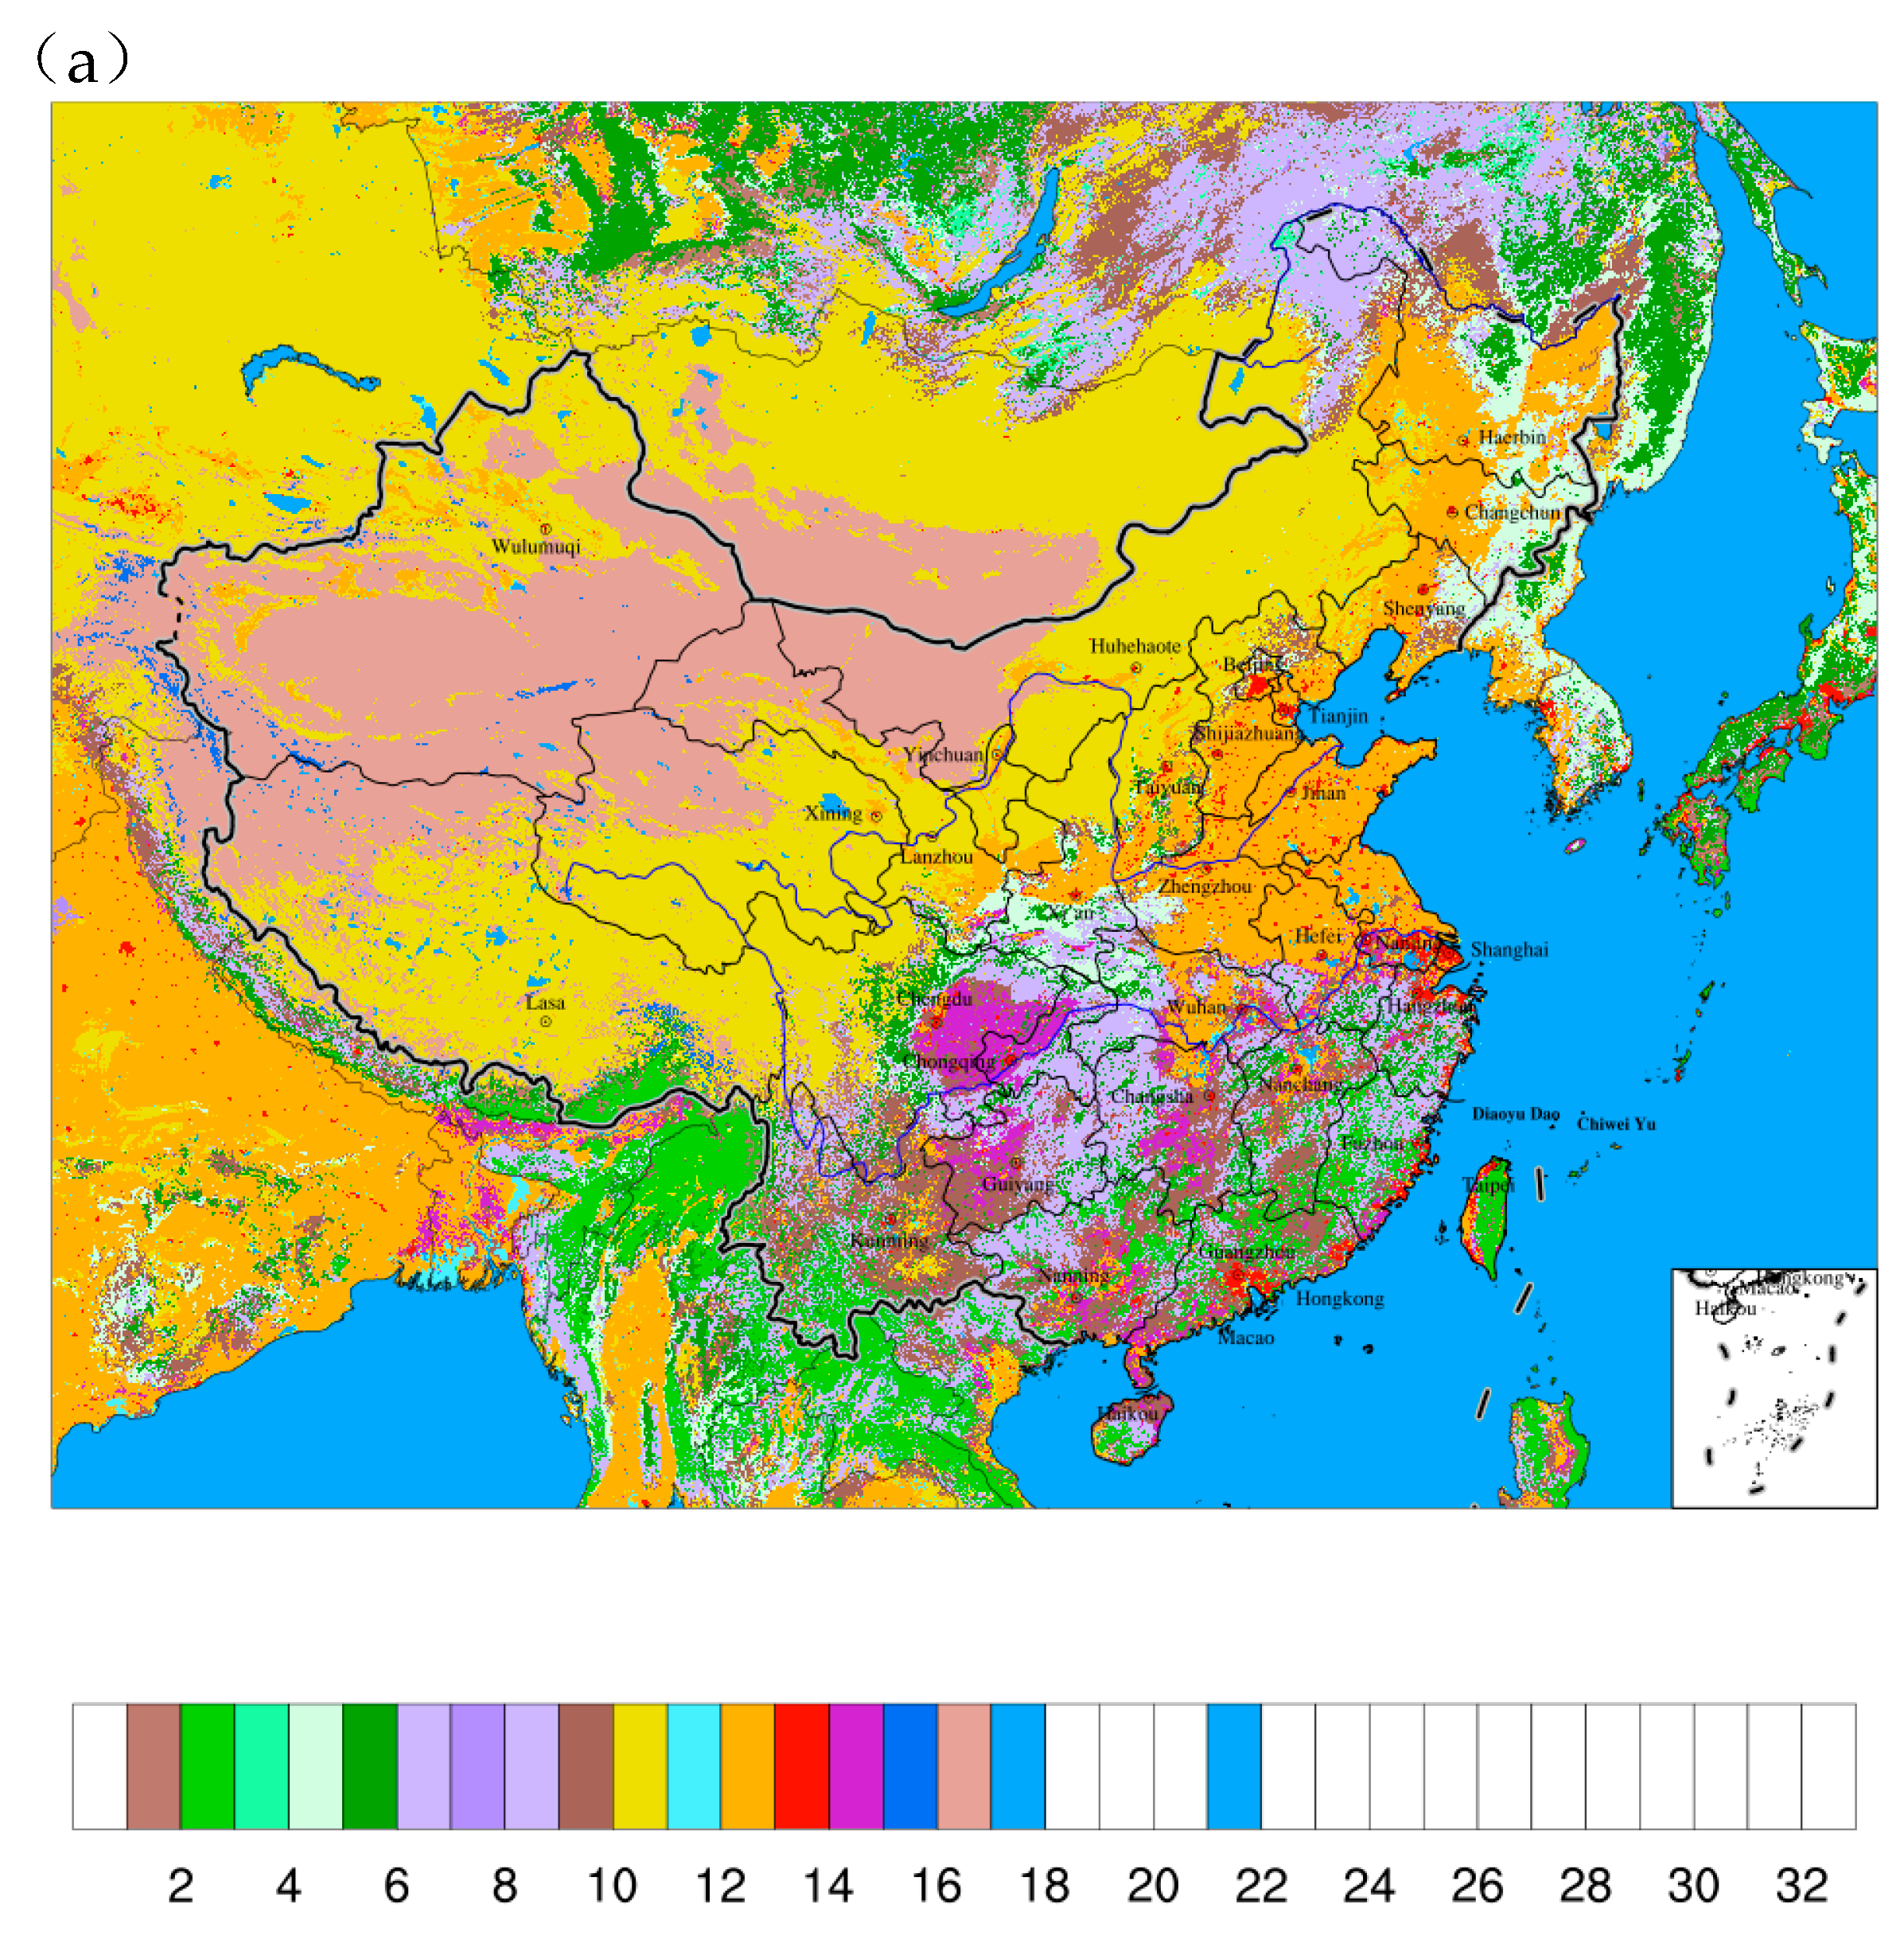
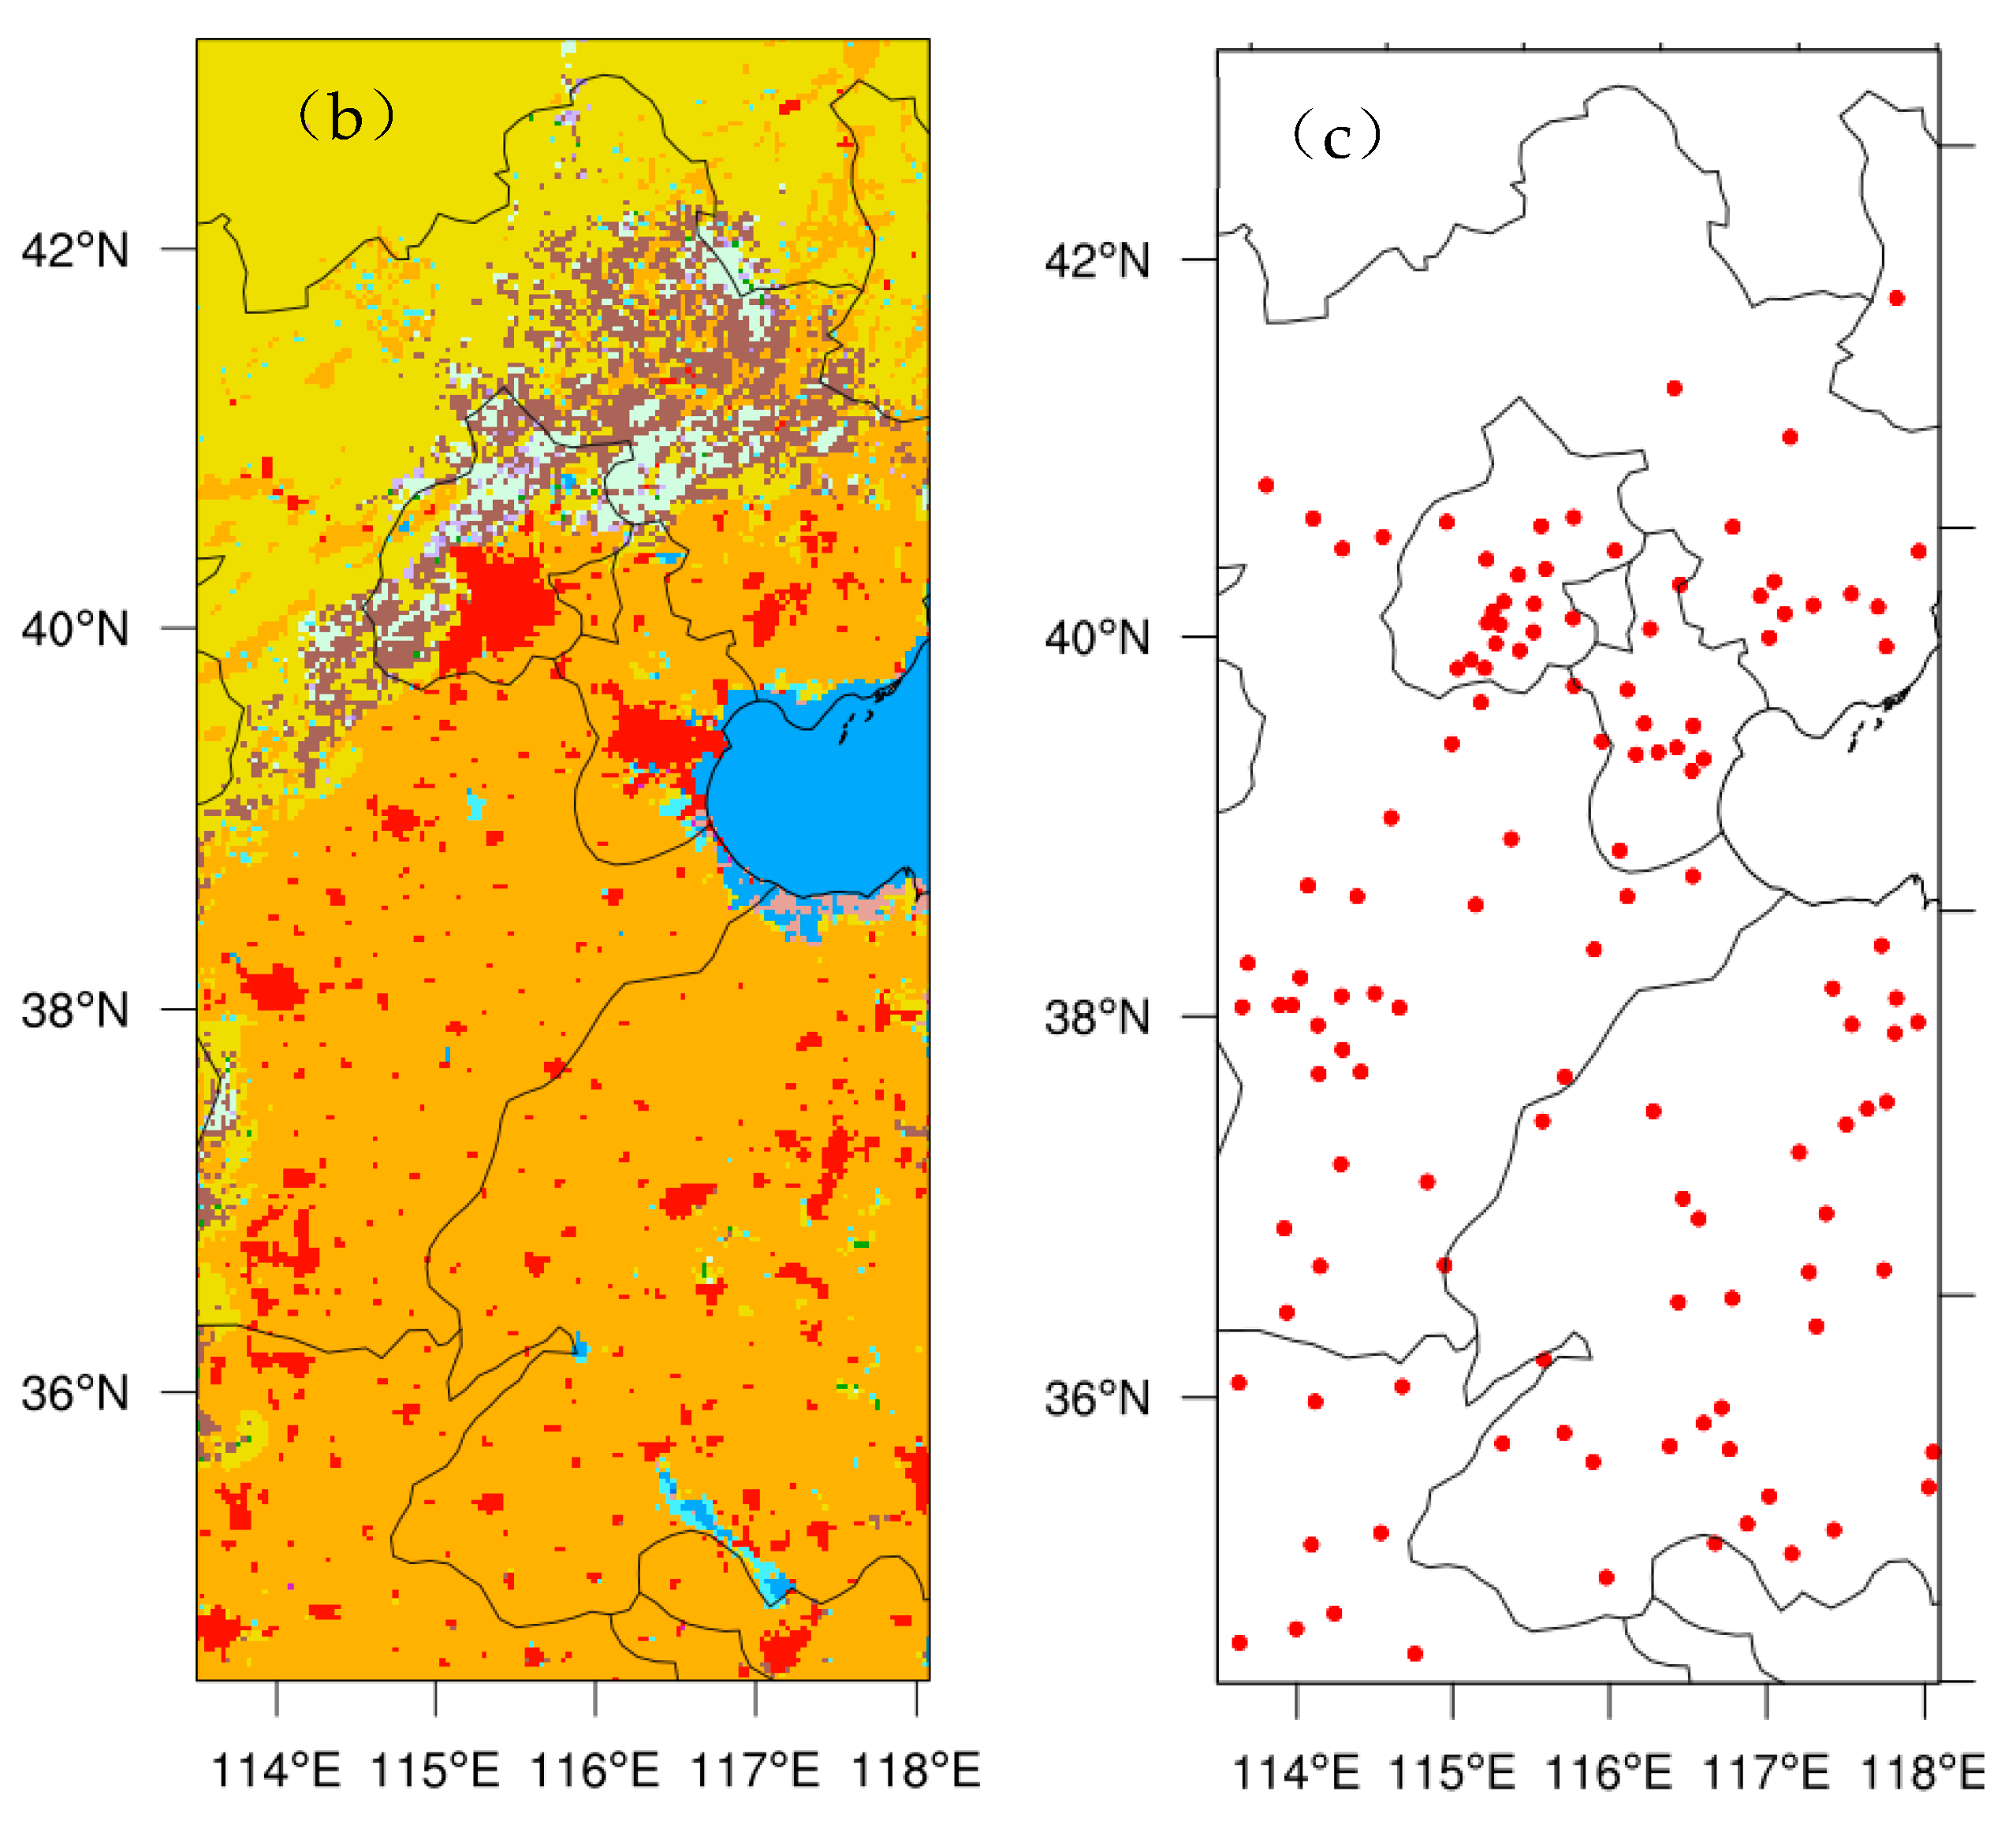
In SLUCM, the building height is uniformly set to 7.5 m, and the building spacing and width are both 9.4 m. In MLUCM, a differentiated height distribution is used: 10 m (20%), 15 m (60%), and 20 m (20%), with corresponding building spacing and width of 25 m and 17 m, respectively. The urban morphological parameters used in SLUCM and MLUCM are based on the default URBPARM.TBL in WRF v4.6.1. SLUCM and MLUCM represent two-dimensional and three-dimensional parameterizations of urban morphology, respectively. All three experiments use the 2020 MODIS land use and vegetation fraction data (https://www.earthdata.nasa.gov/data/catalog/lpcloud-mcd12q1-006, accessed on 1 September 2026) to replace the default land surface data in the model, with a spatial resolution of 500 m. The land use types in the simulation domain are shown in Figure 1a, and the corresponding serial numbers and category descriptions are listed in Table 1. Figure 1b shows the land use classification over North China, where red represents urban and built-up land, and Figure 1c shows the distribution of urban stations over North China. To better understand the effects of the urban canopy schemes, all statistical analyses in this study were performed at urban stations within North China.
Figure 1.
(a) Distribution of MODIS land use types in the simulation area (the black box indicates the study area); (b) land use classification of the study area, where red represents built-up and urban land; (c) spatial distribution of urban meteorological stations included in the statistical analysis of this study.
Table 1.
MODIS land use type serial numbers and category descriptions.
2.2. Case Study and Verification Methods
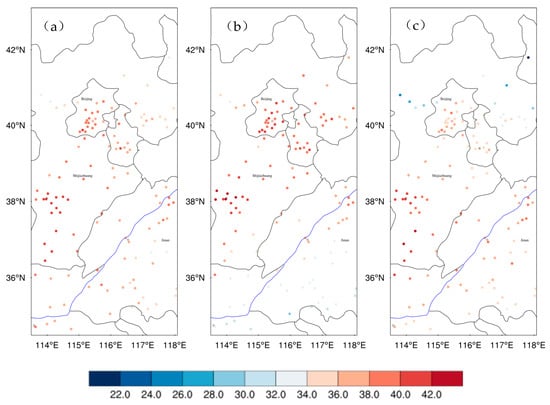
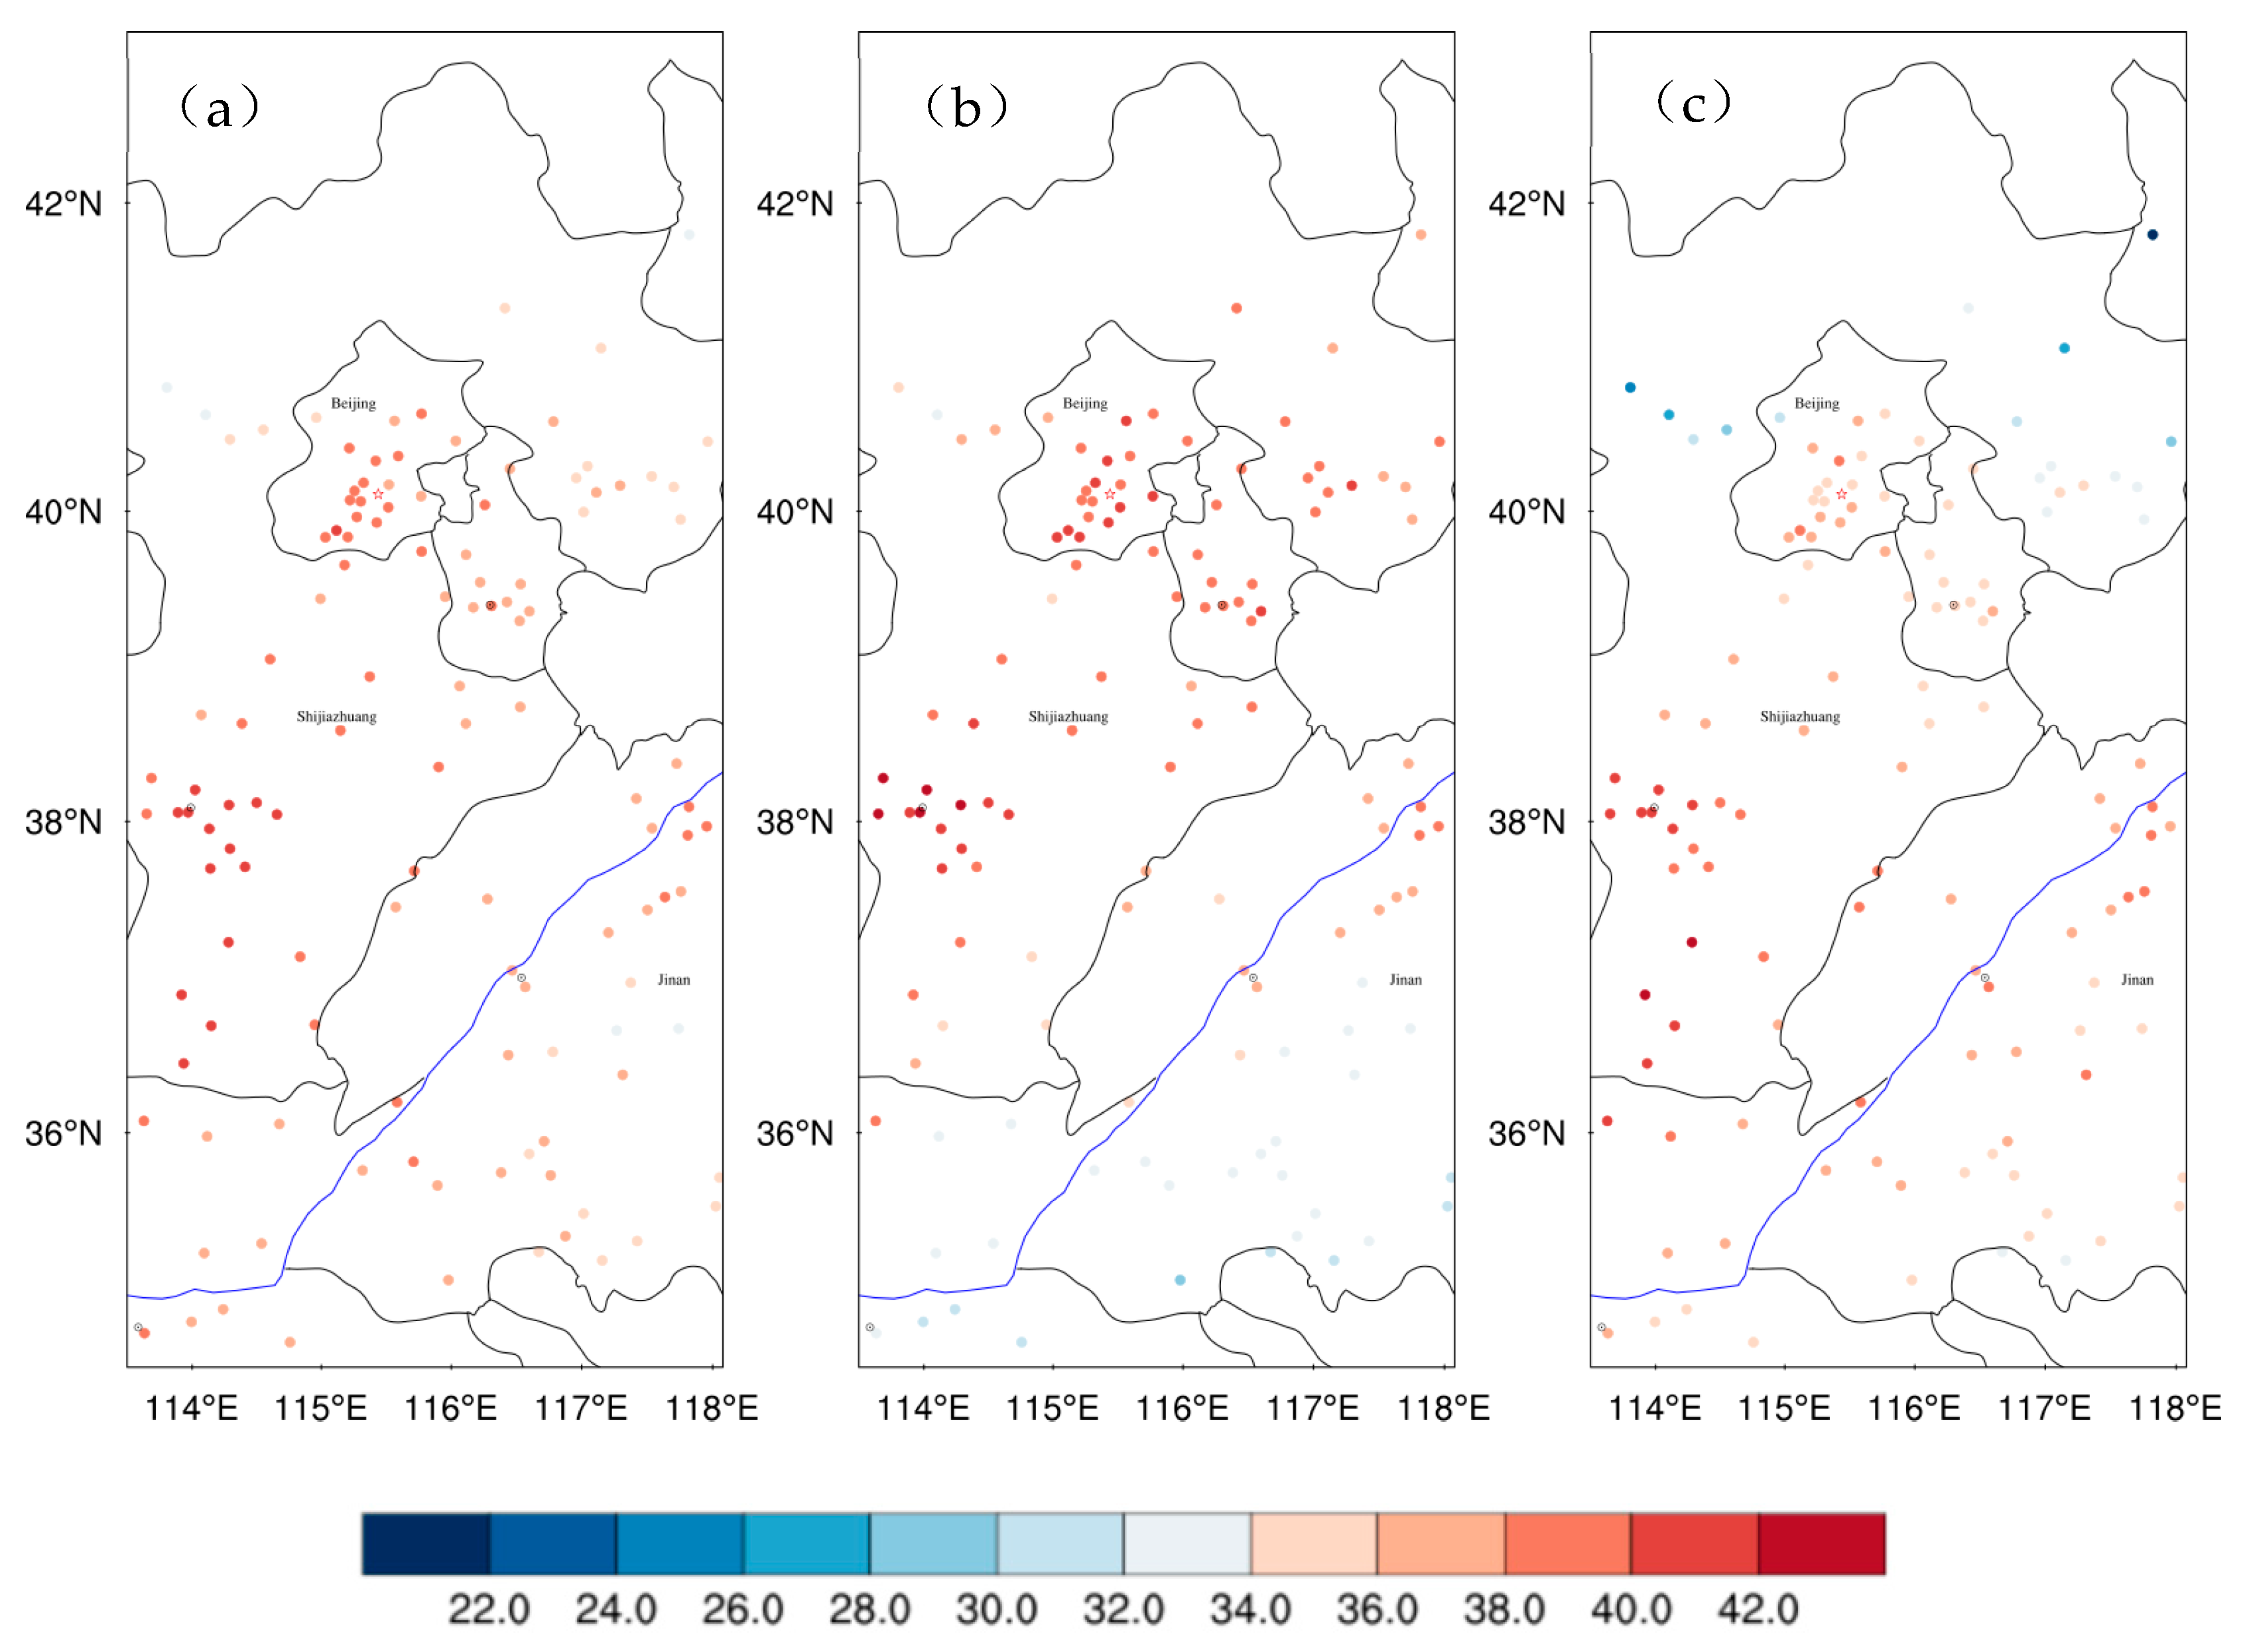
Since 2023, summer temperatures have repeatedly broken records, indicating an accelerated warming trend [28]. This study focuses on a severe heatwave event that occurred over North China in July 2023. The period of 5–7 July was specifically selected because it covers the onset and peak of the strongest heatwave process in Hebei Province that month. According to Xiang et al. [29], the 5–11 July process had the largest mean daily maximum temperature at stations higher than 35 °C in the past 50 years, with its comprehensive disaster risk index ranking second in the last decade. The synoptic background was characterized by an anomalously westward and northward extension of the western Pacific subtropical high, combined with a continental high and a strong South Asian high, leading to strong subsidence and dry-hot conditions over North China. This event is representative of typical heatwave processes over North China. At 07:00 on 5 July, high-temperature orange warnings were issued by several meteorological stations in Beijing, and these were upgraded to red warnings the following day, with temperatures at multiple stations exceeding 40 °C [29,30]. Figure 2 shows the observed temperature at 14:00 Beijing Time at national meteorological stations with a land use index of 13 (urban and built-up). During the three-day heatwave, the number of stations with temperatures exceeding 35 °C (40 °C) was 119 (14), 102 (20), and 87 (13), accounting for 84% (9.9%), 72% (14.1%), and 61% (9.2%) of 141 urban stations, respectively.
Figure 2.
Observed temperature (°C) at urban stations in North China at 14:00 Beijing Time on (a) 5, (b) 6, and (c) 7 July 2023.
The verification data consist of hourly surface observations from the national meteorological station network, including 10 m wind speed, 2 m temperature, and 2 m specific humidity. All observational data were subjected to strict quality control, and stations with missing data or insignificant temporal variability were excluded. To quantitatively evaluate the performance of the three experiments, the Model Evaluation Tools (MET) developed by the National Center for Atmospheric Research (NCAR) Developmental Testbed Center (https://dtcenter.org/software-tools/model-evaluation-tools-met, accessed on 1 September 2026) were used. The verification was performed at 141 urban stations in North China. MET interpolates the gridded model output to the station locations, generates the model forecast values at the stations, and compares them with the corresponding observations. The evaluation metrics used in this study are bias (BIAS) and root mean square error (RMSE), calculated as follows:
where is the model forecast at station , and is the corresponding observation. A bias closer to zero and a smaller RMSE indicate better forecast performance.
In addition, the urban heat island (UHI) intensity was calculated as the mean 2 m temperature difference between urban and rural stations. Urban stations were defined as those with a land use index of 13, while rural stations were defined as those with land use types including forests, shrublands, grasslands, croplands, and mosaics, excluding water bodies, snow/ice, bare land, and tundra. A total of 141 urban and 856 rural stations were identified within the study area. The imbalance in station numbers reflects the actual land surface composition of North China, where non-urban surfaces dominate. This does not bias the UHI calculation, because both urban and rural temperatures are represented by their respective ensemble means. Using a large ensemble of rural stations rather than a single station pair helps reduce the uncertainty associated with individual station representativeness. The urban heat island (UHI) calculations were performed for each forecast lead time, and the results were averaged over the three forecast initializations (5–7 July 2023).
3. Results
3.1. Near-Surface Wind Speed
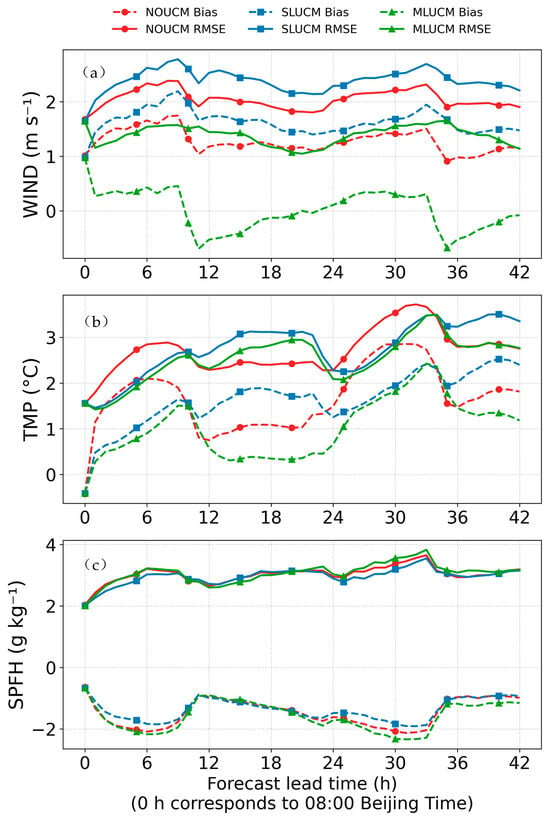
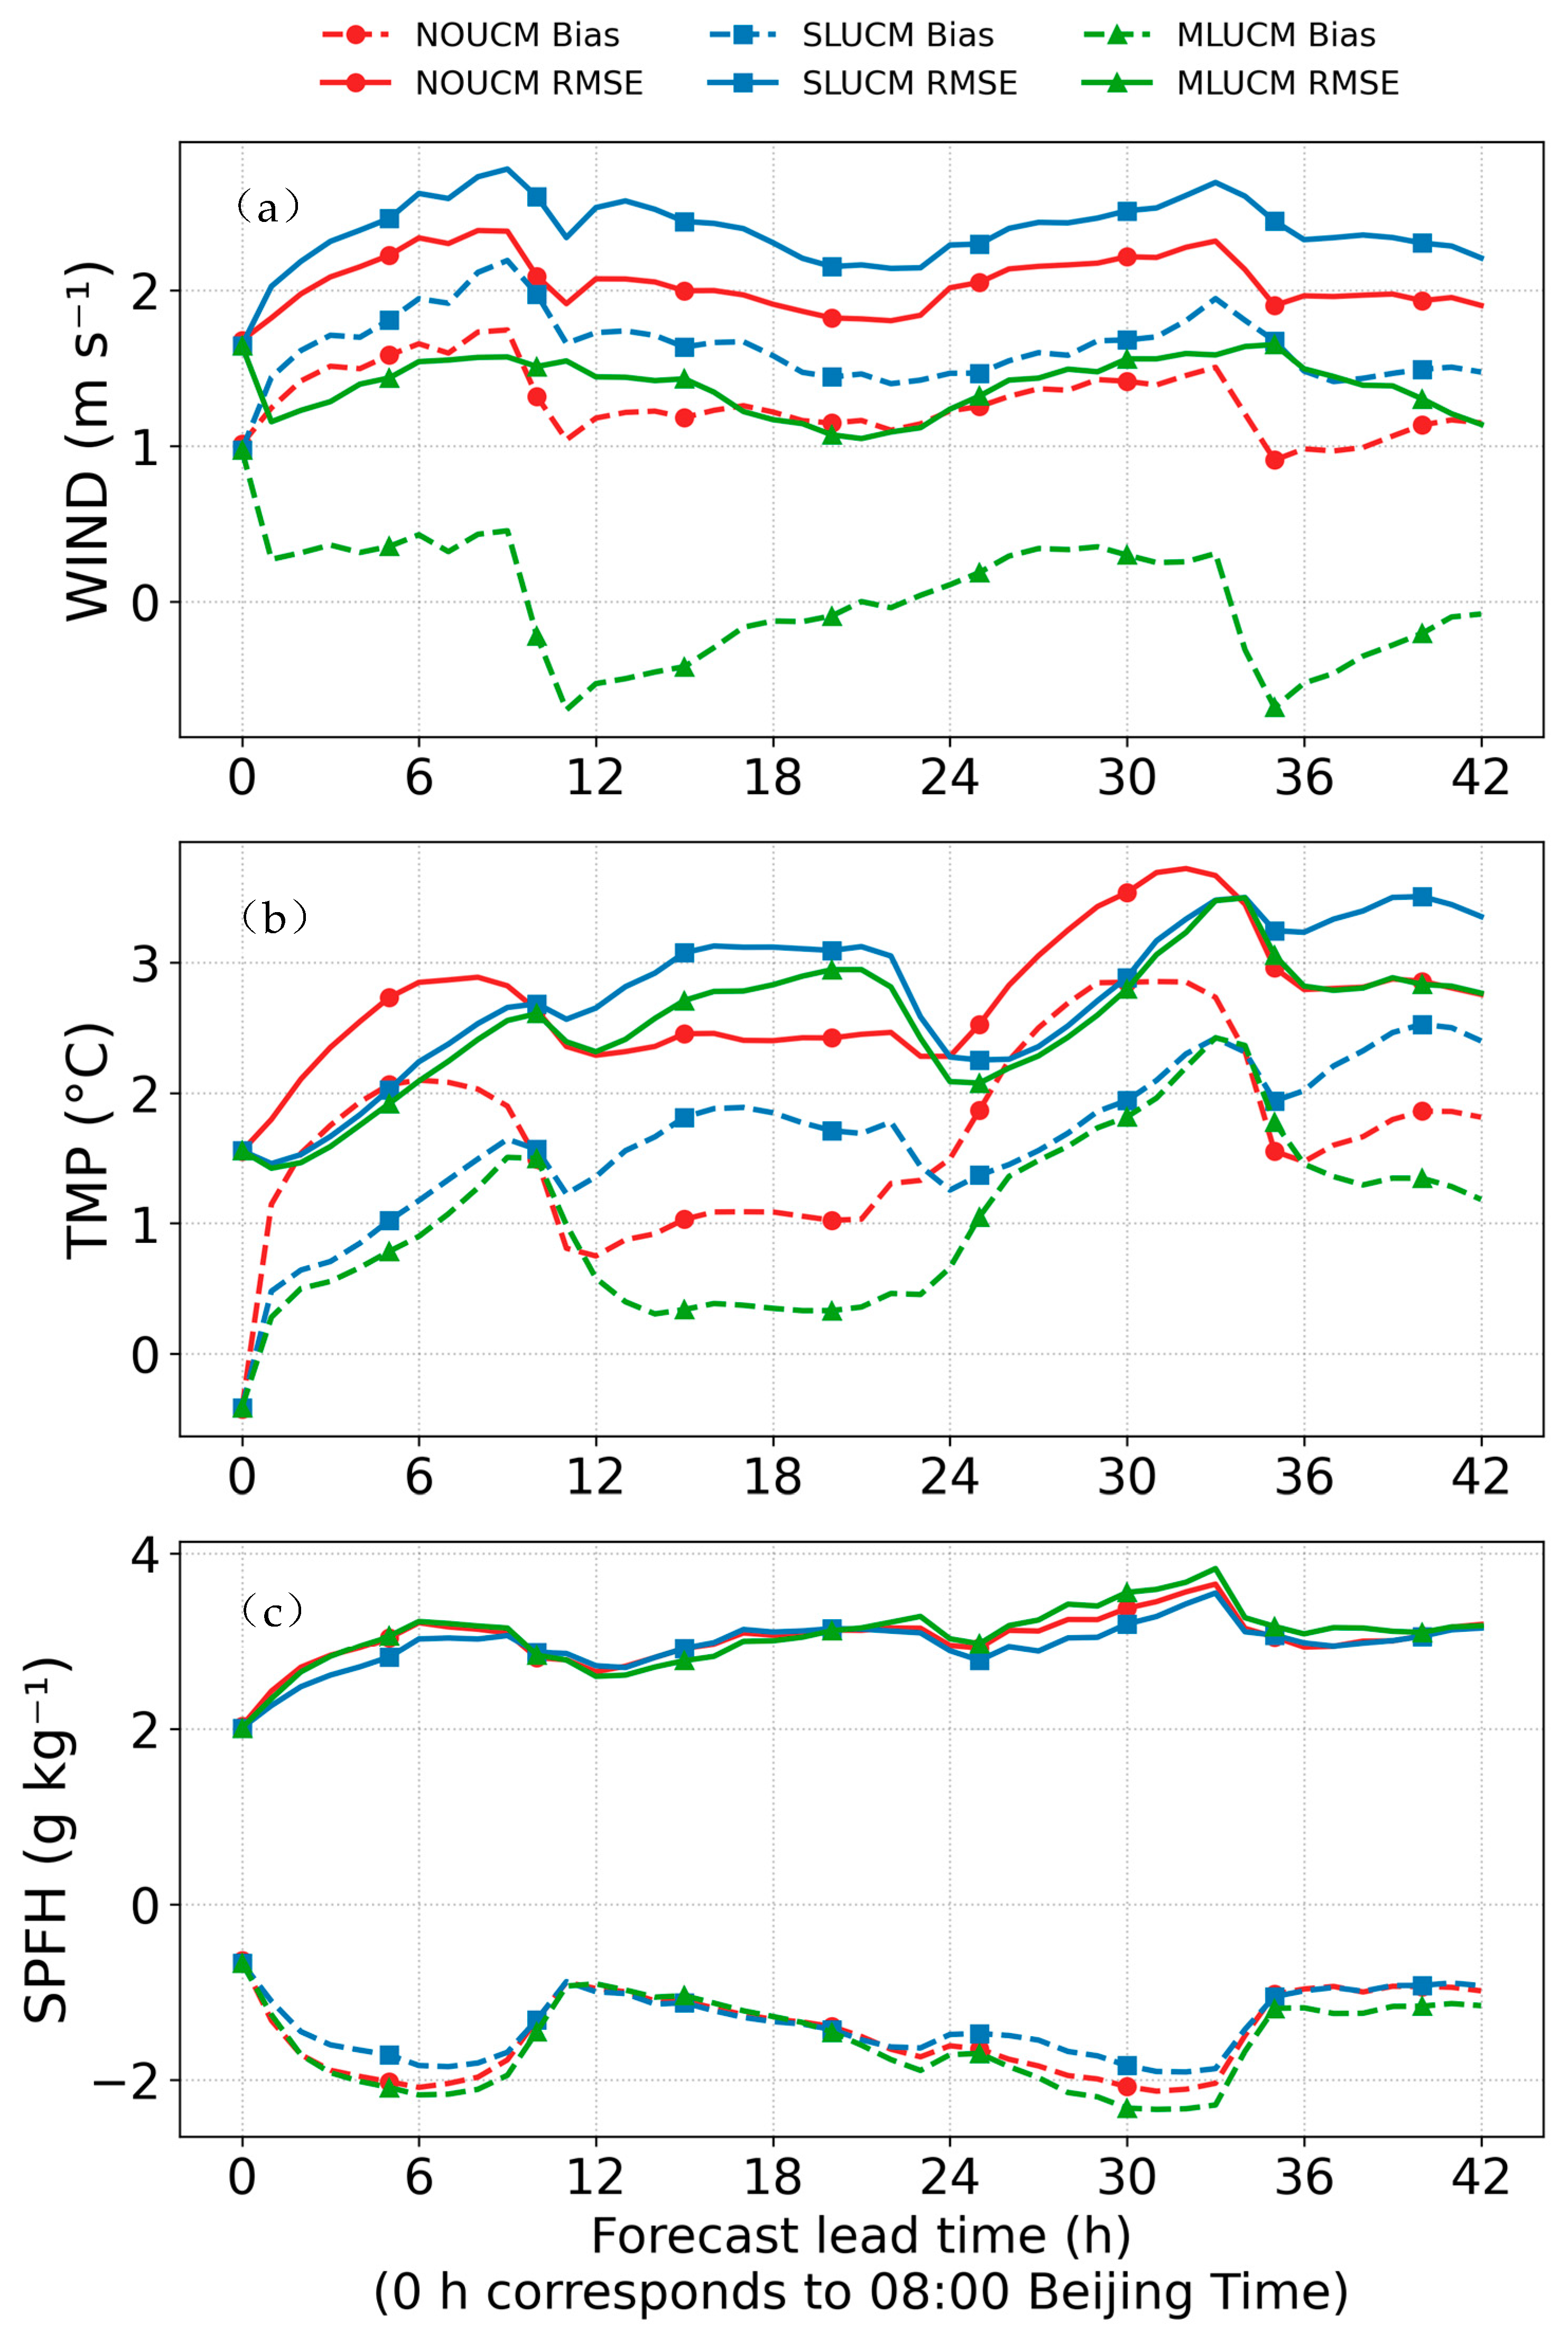
Figure 3a shows the bias and RMSE of 10 m wind speed at urban stations for the three experiments as a function of forecast lead time. All three schemes exhibit a positive bias, but the magnitude differs considerably. The MLUCM experiment (green solid line) consistently produces the lowest RMSE throughout the entire simulated period, indicating a systematic improvement. Both NOUCM and SLUCM show relatively large biases with a pronounced diurnal cycle. Notably, the RMSE of SLUCM (blue solid line) is even higher than that of NOUCM (red solid line) for most of the simulated period, corresponding to a 15.8% increase. This indicates that the single-layer drag effect in SLUCM fails to improve the wind speed simulation compared to the no-canopy scheme at any time of the day. MLUCM explicitly represents the three-dimensional dynamical drag of buildings and effectively reduces the overestimation of wind speed, decreasing the RMSE by 29.5% relative to NOUCM.
Figure 3.
Comparison of forecast bias (dashed lines) and RMSE (solid lines) for (a) 10 m wind speed, (b) 2 m temperature, and (c) 2 m specific humidity among three experiments (red: NOUCM; blue: SLUCM; green: MLUCM) at urban stations in North China from 5 to 7 July 2023. The forecast lead time 0 h corresponds to 08:00 Beijing Time (00:00 UTC).
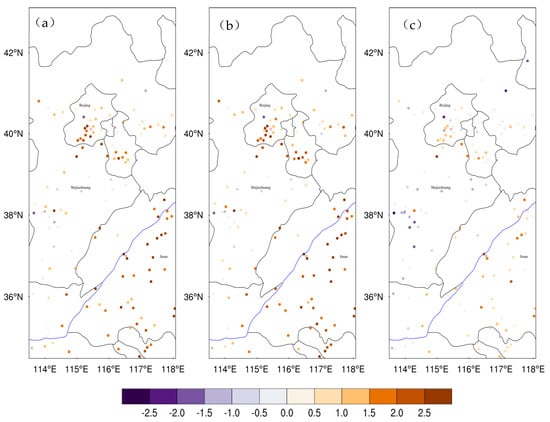
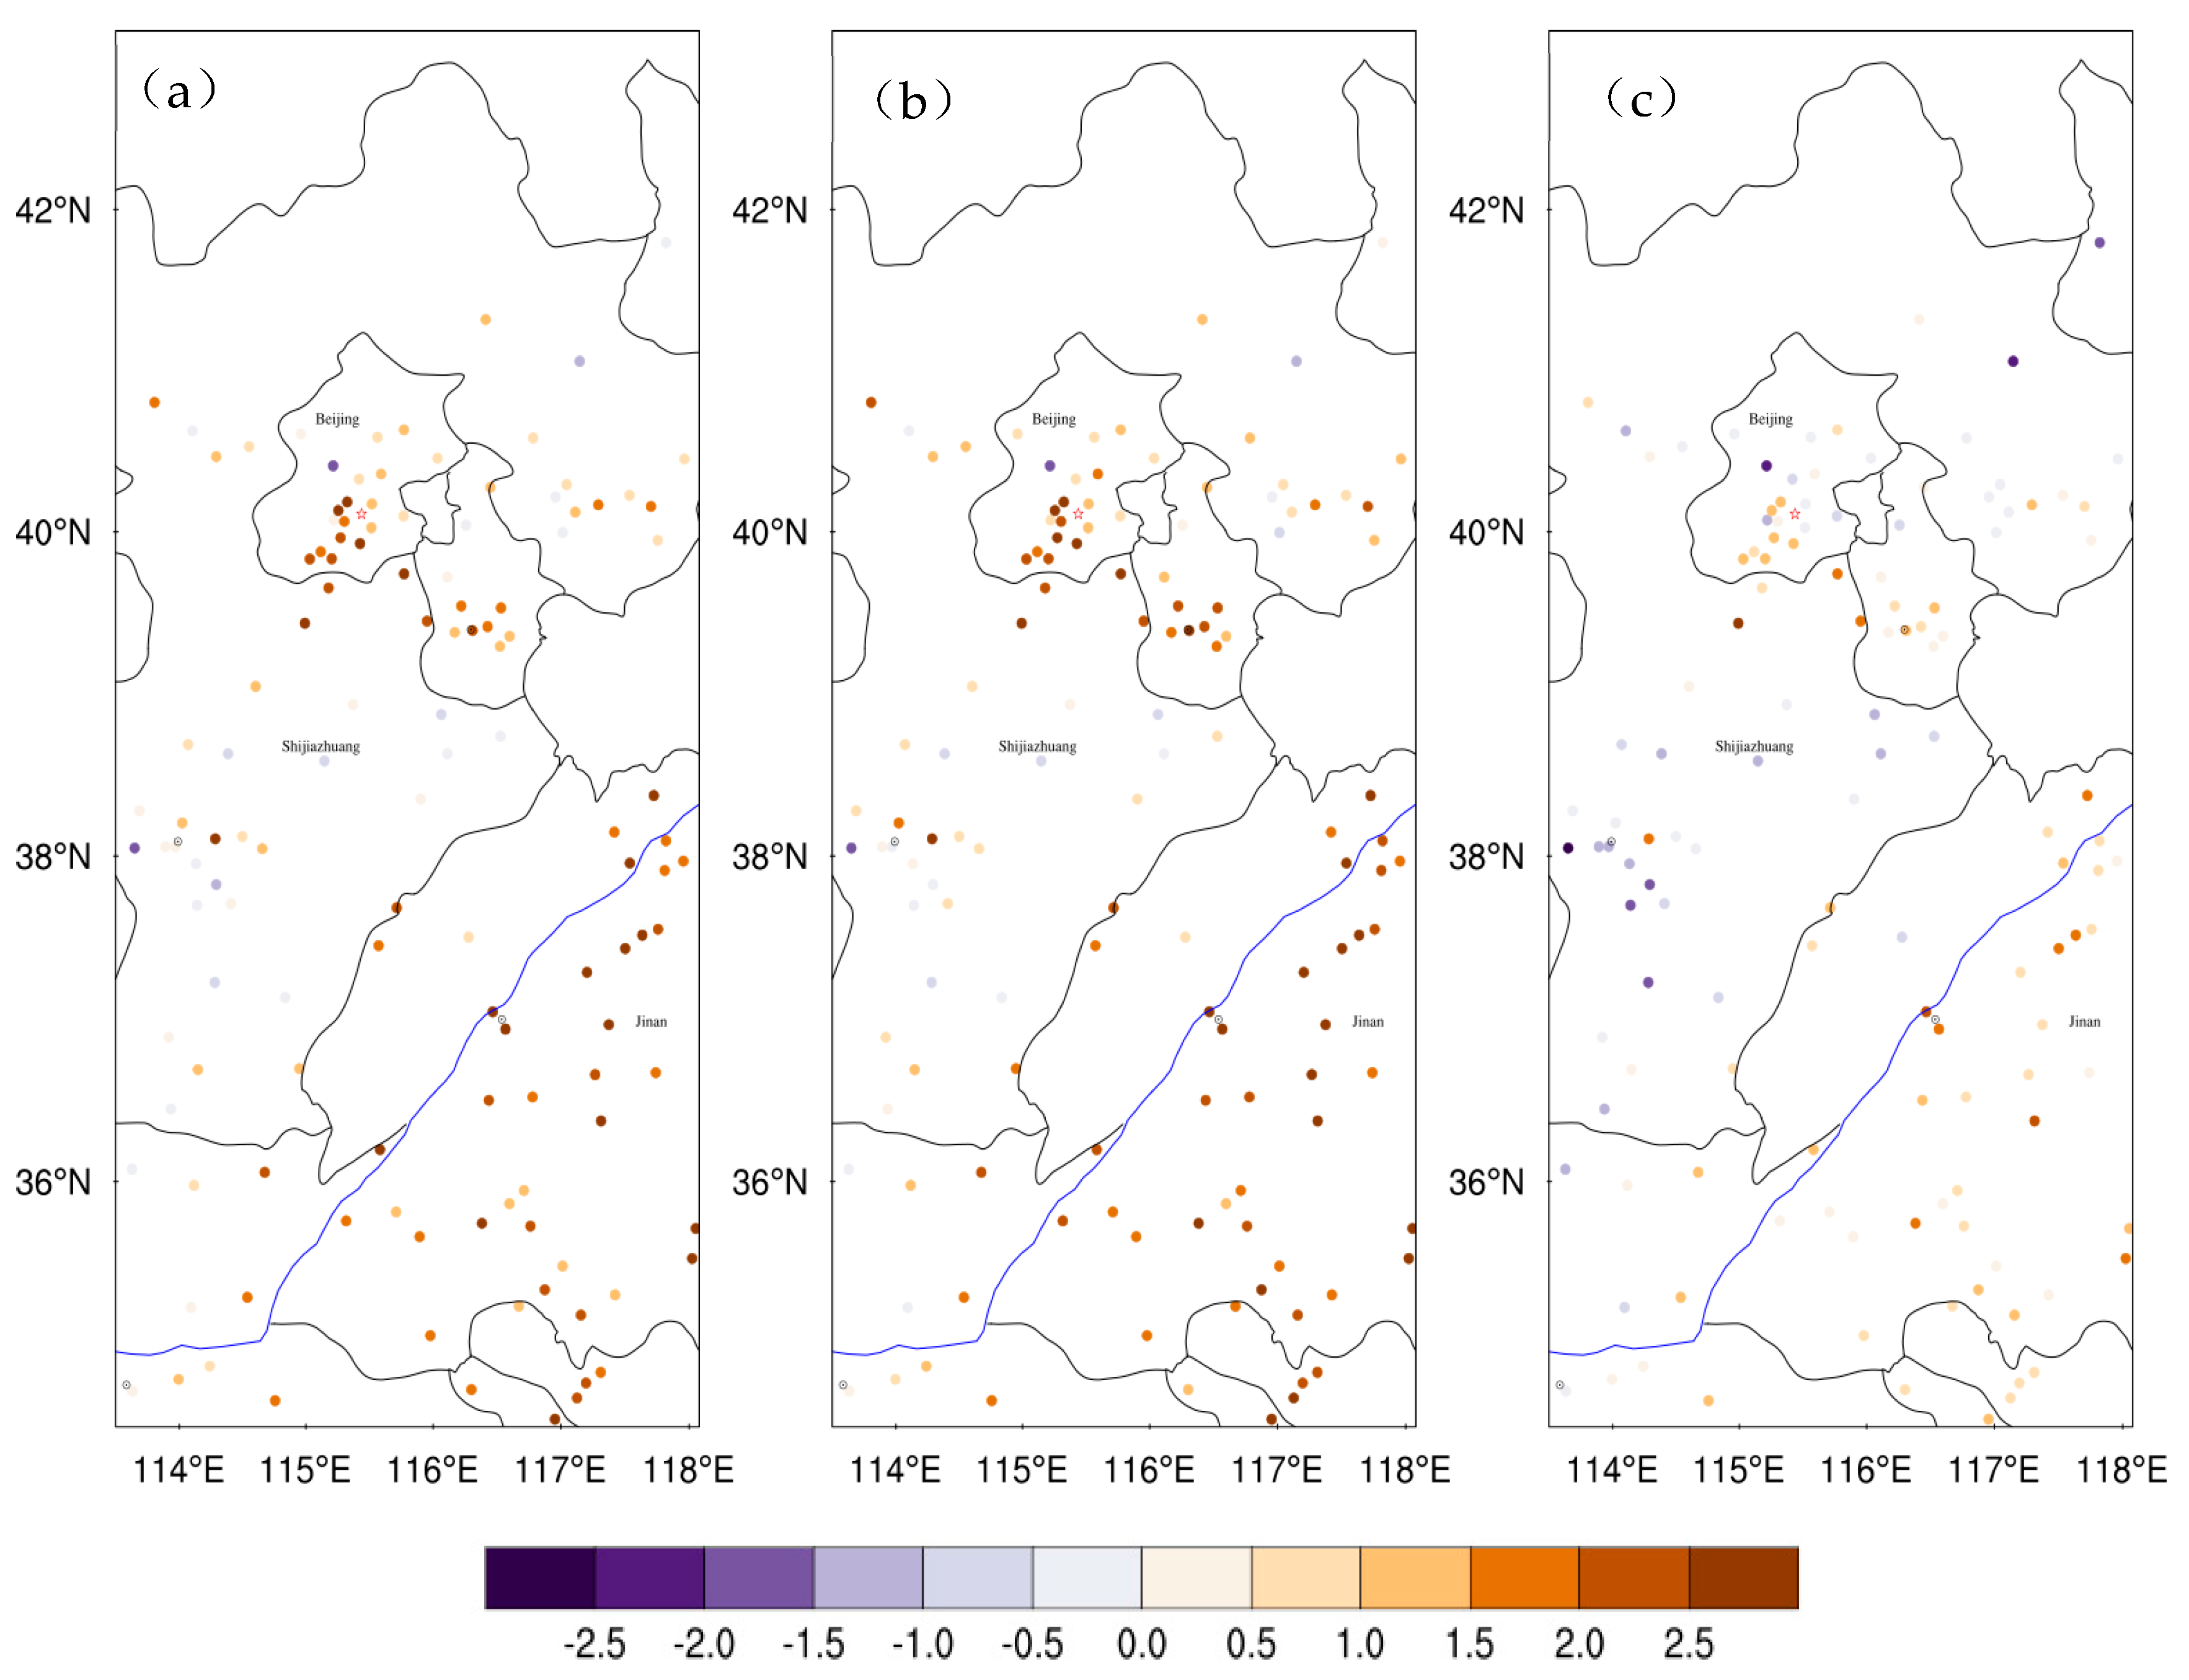
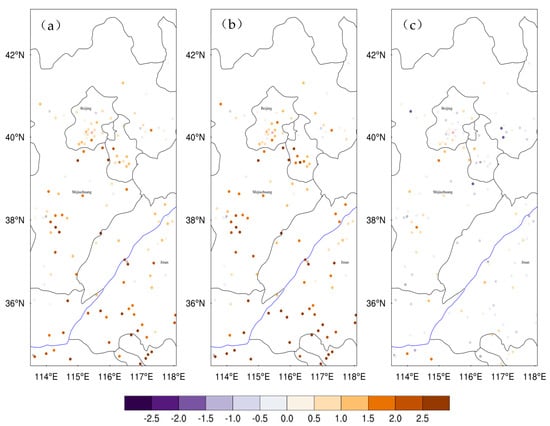
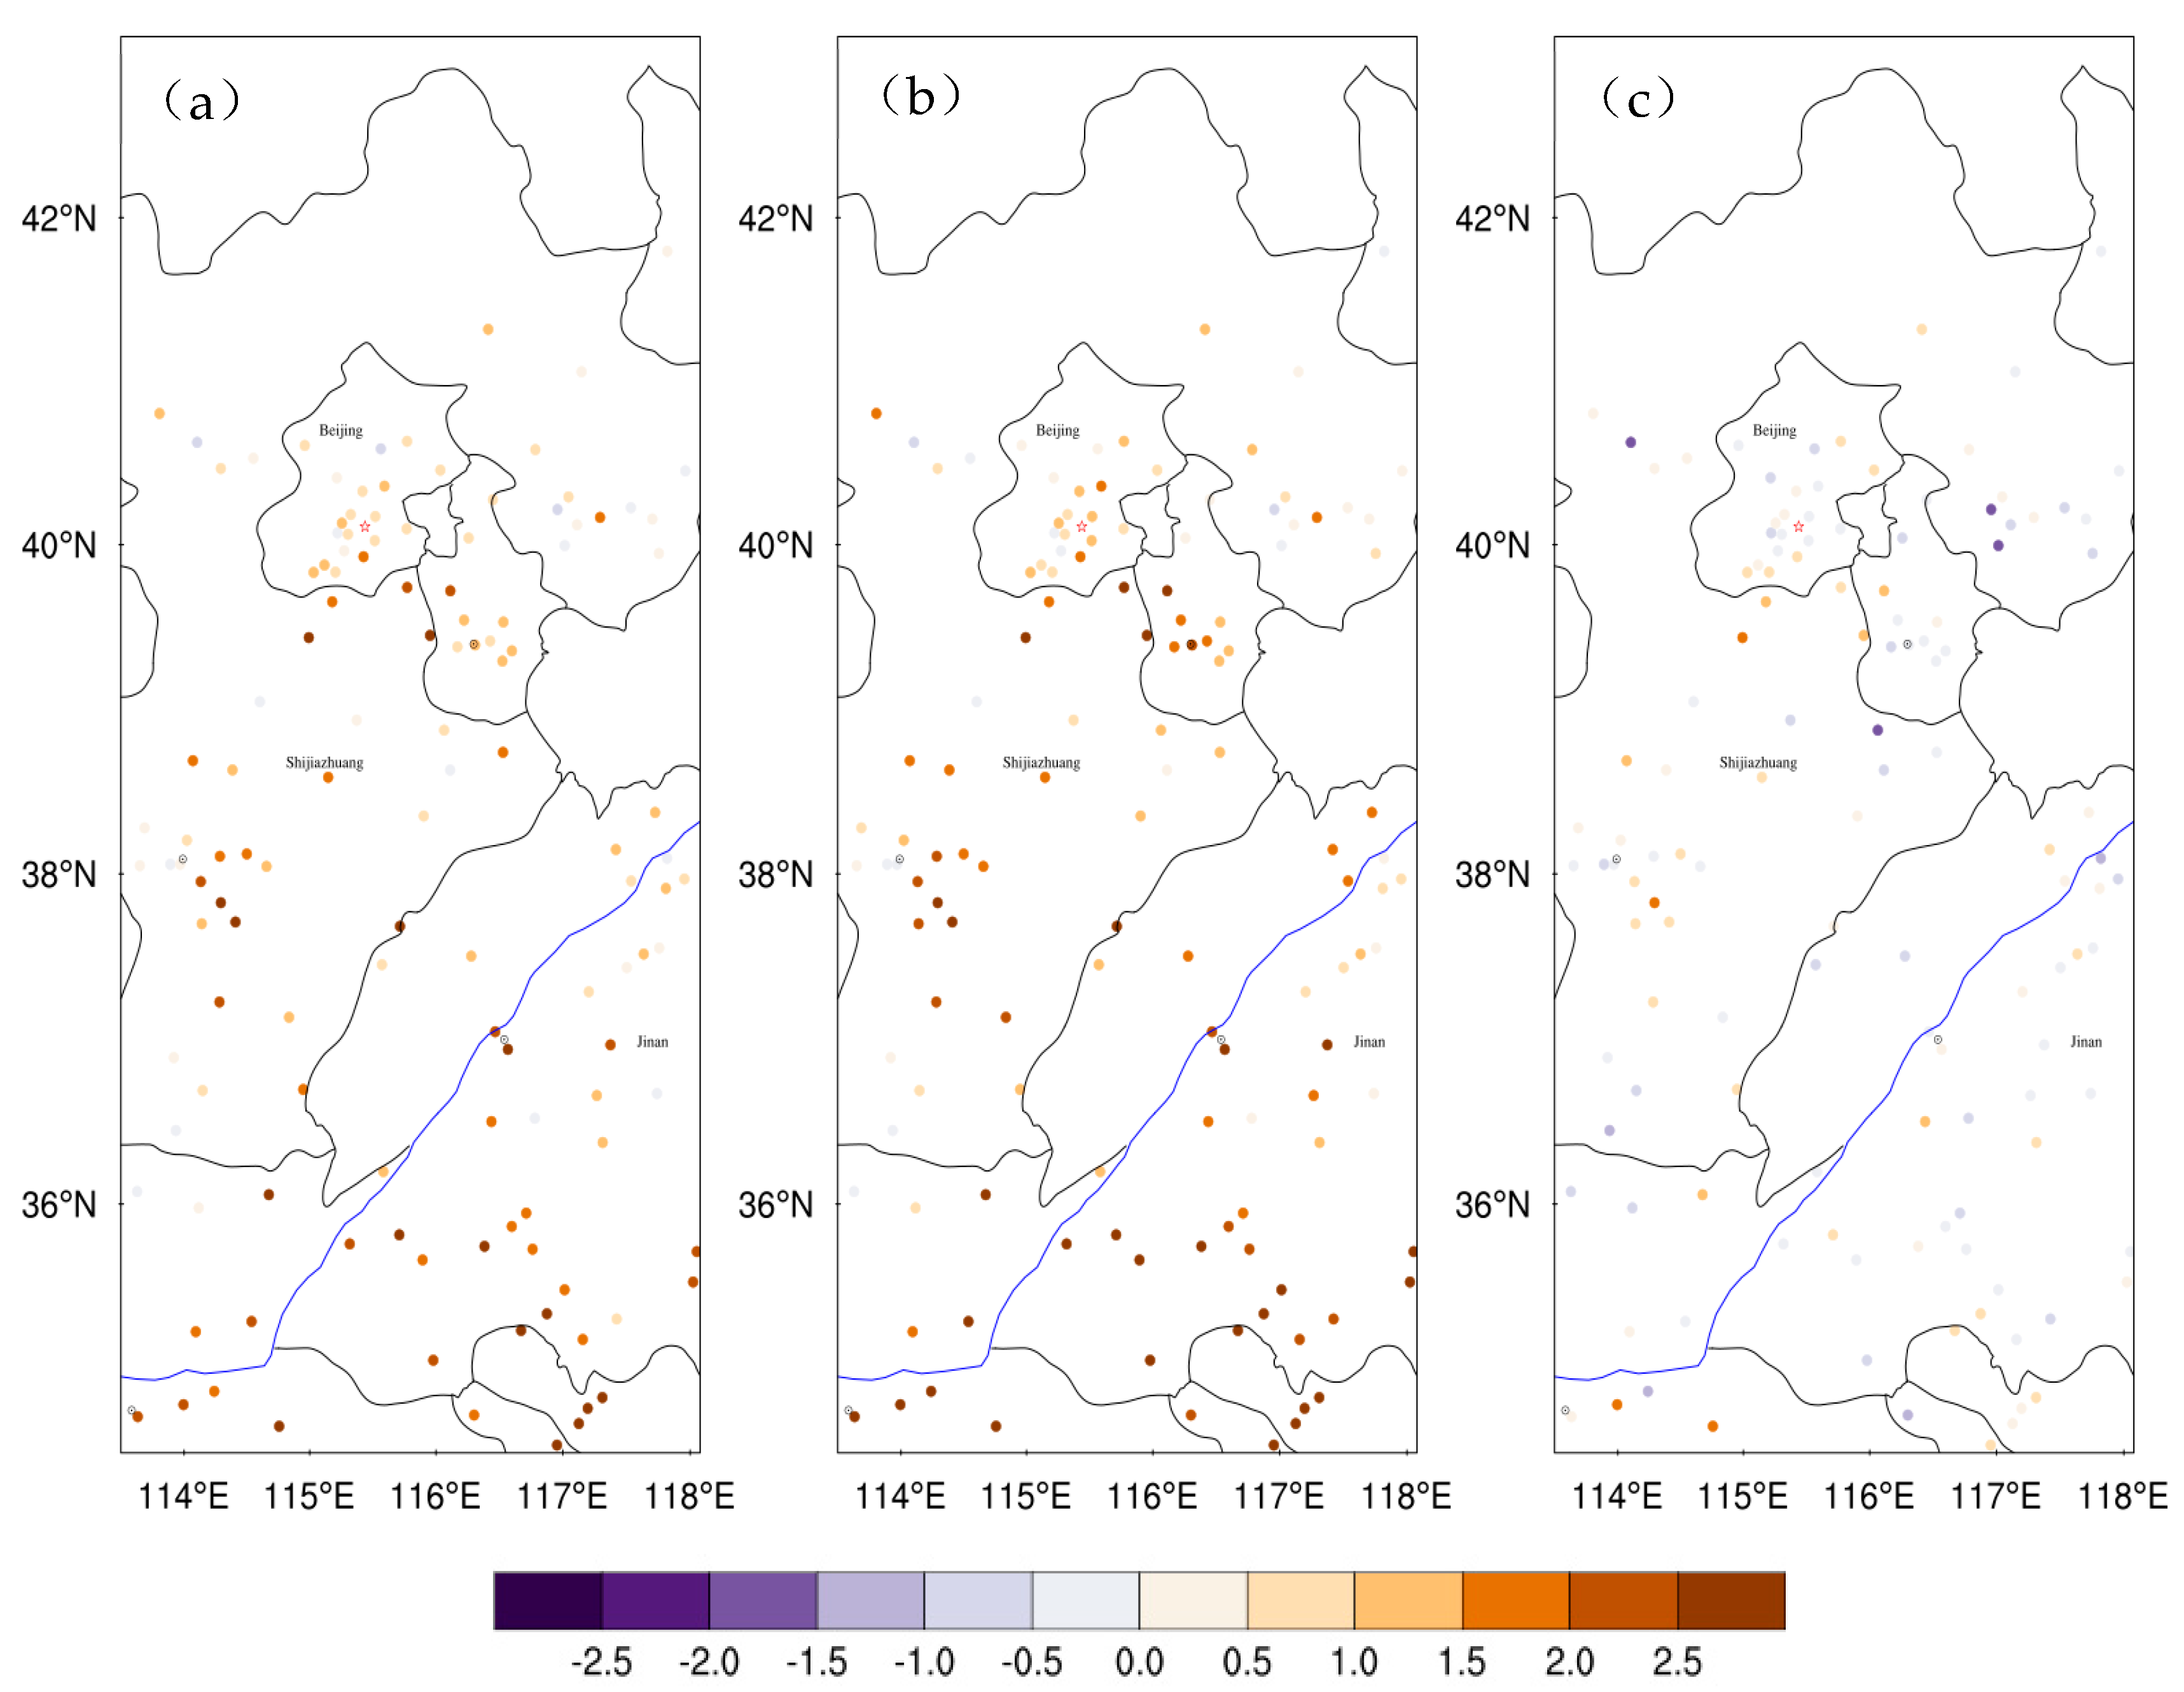
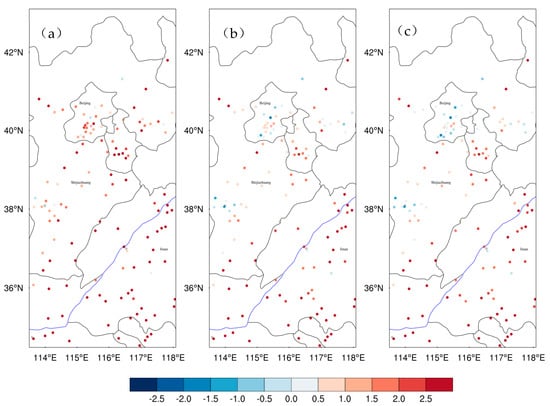
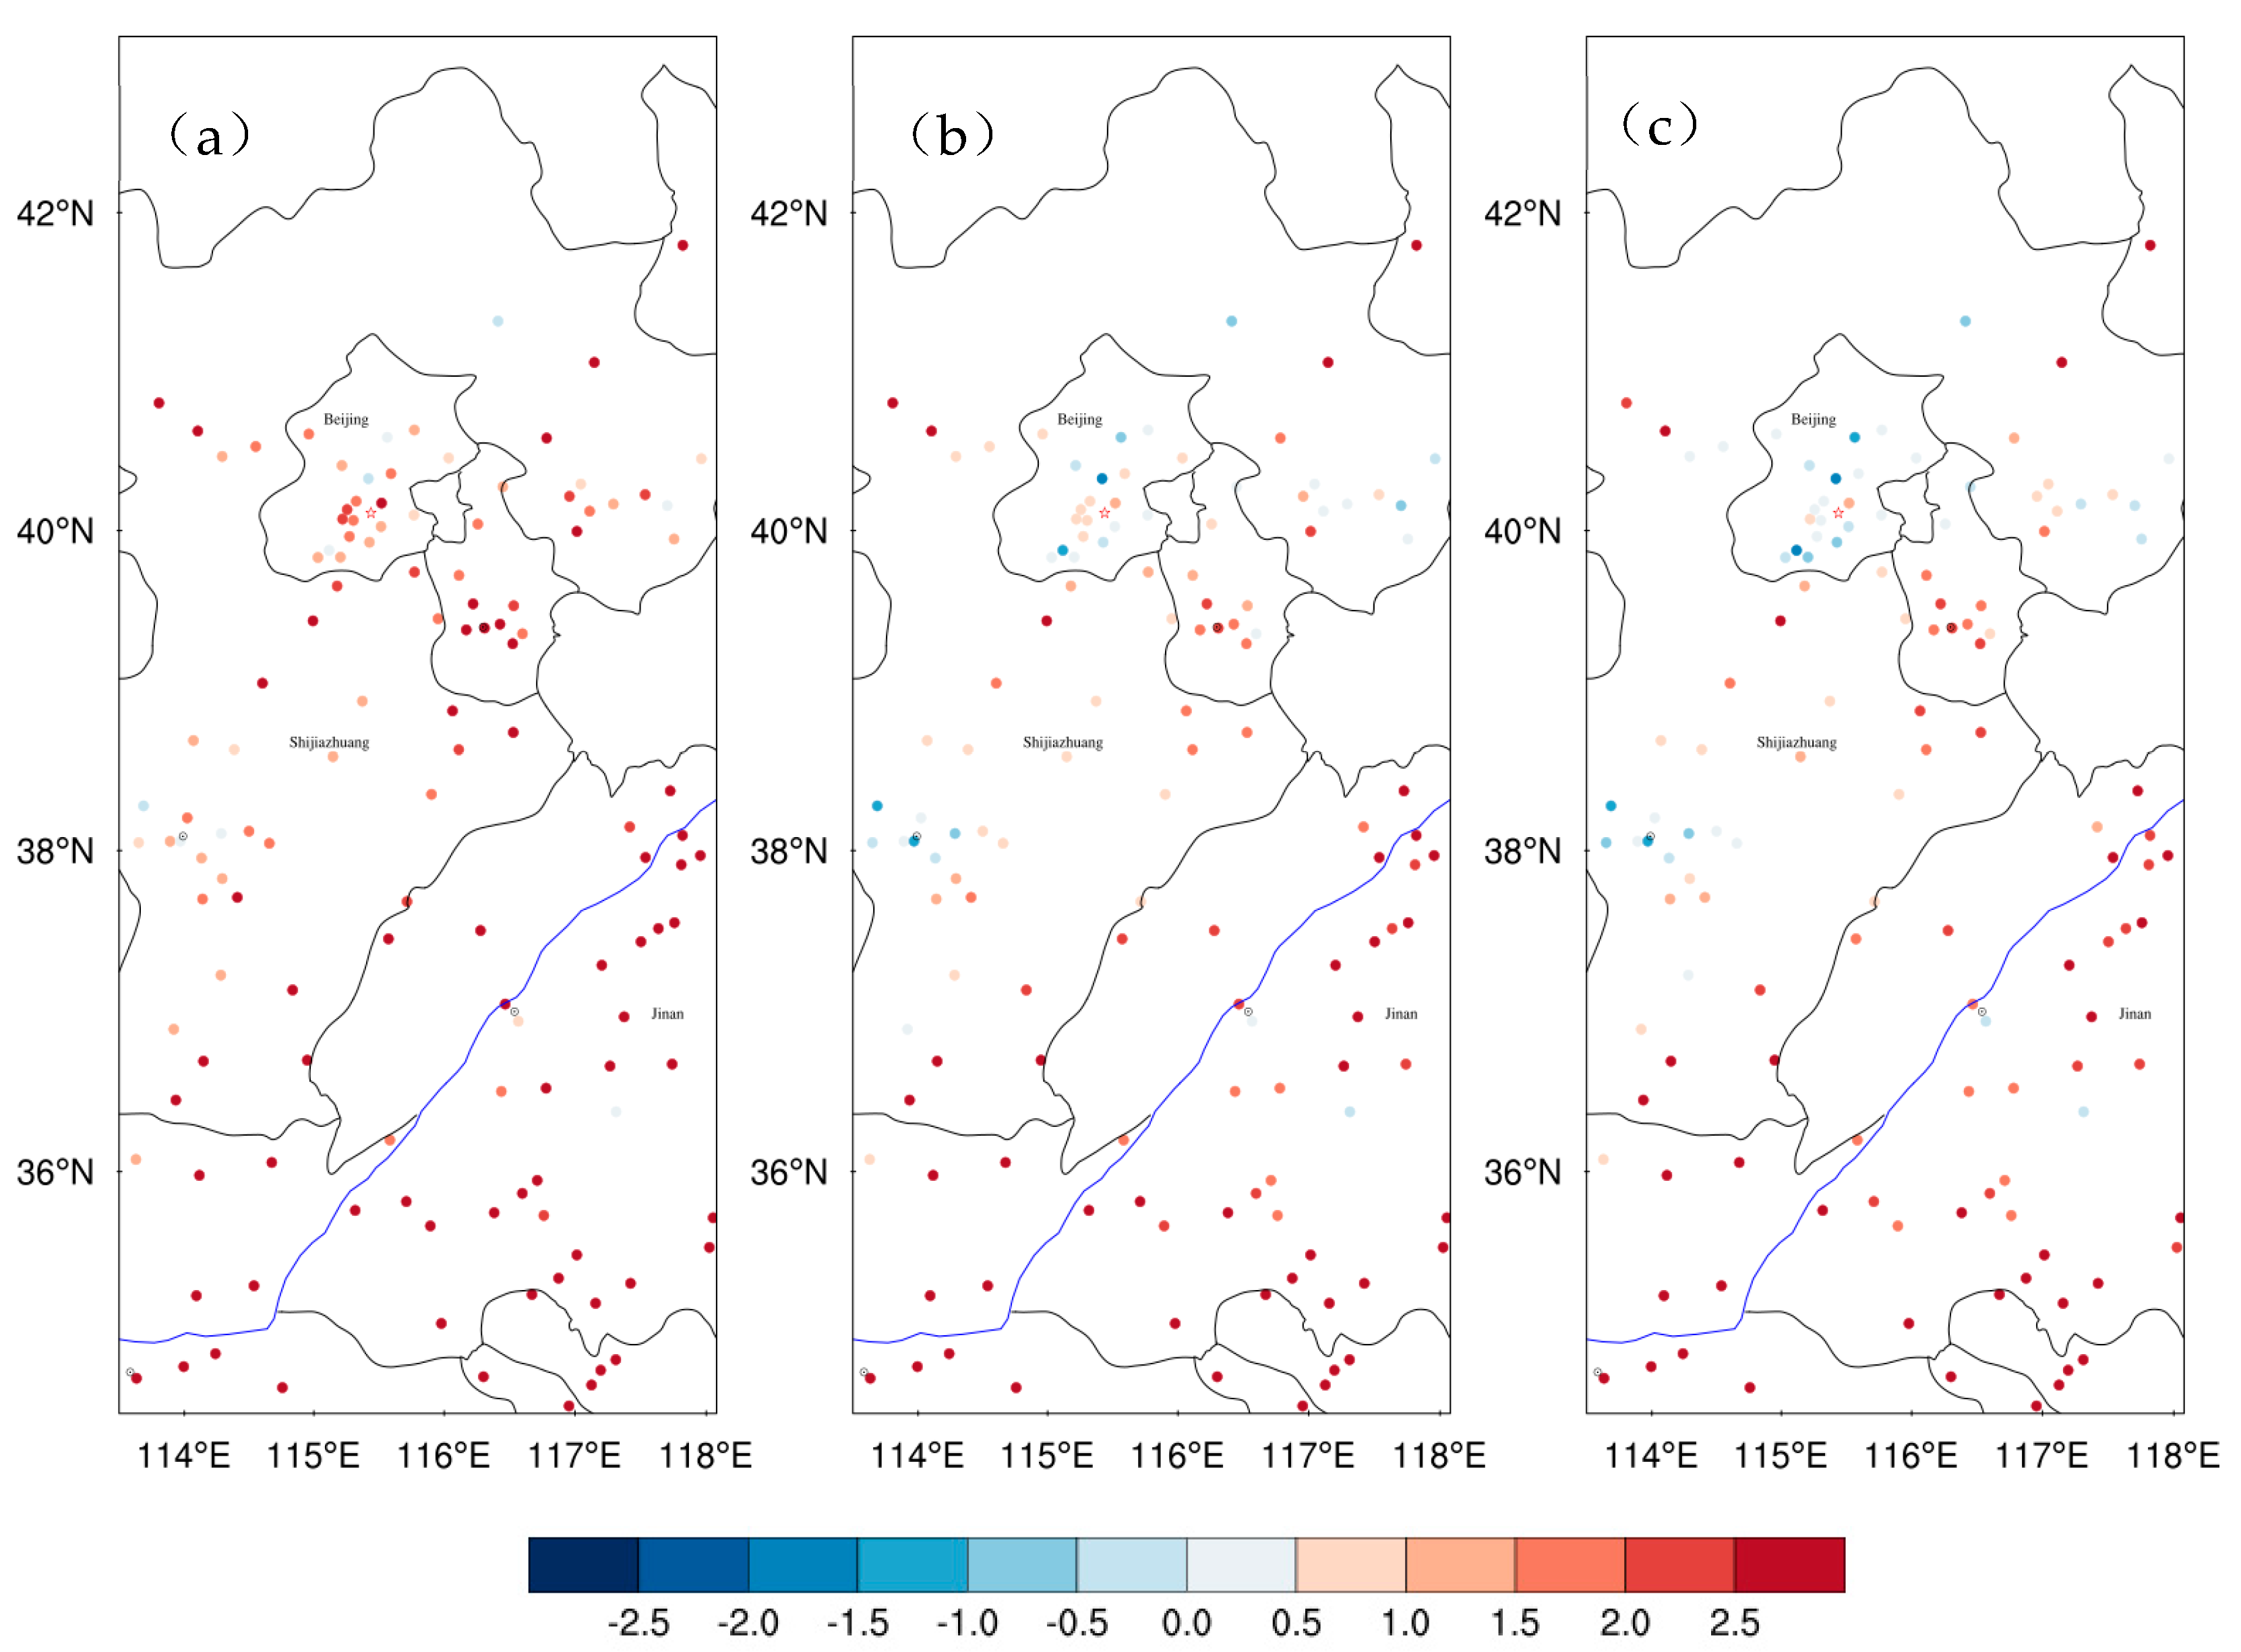
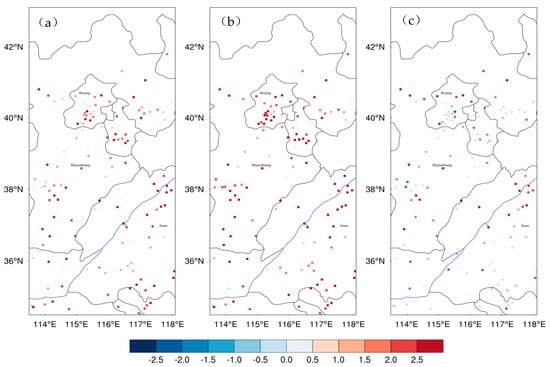
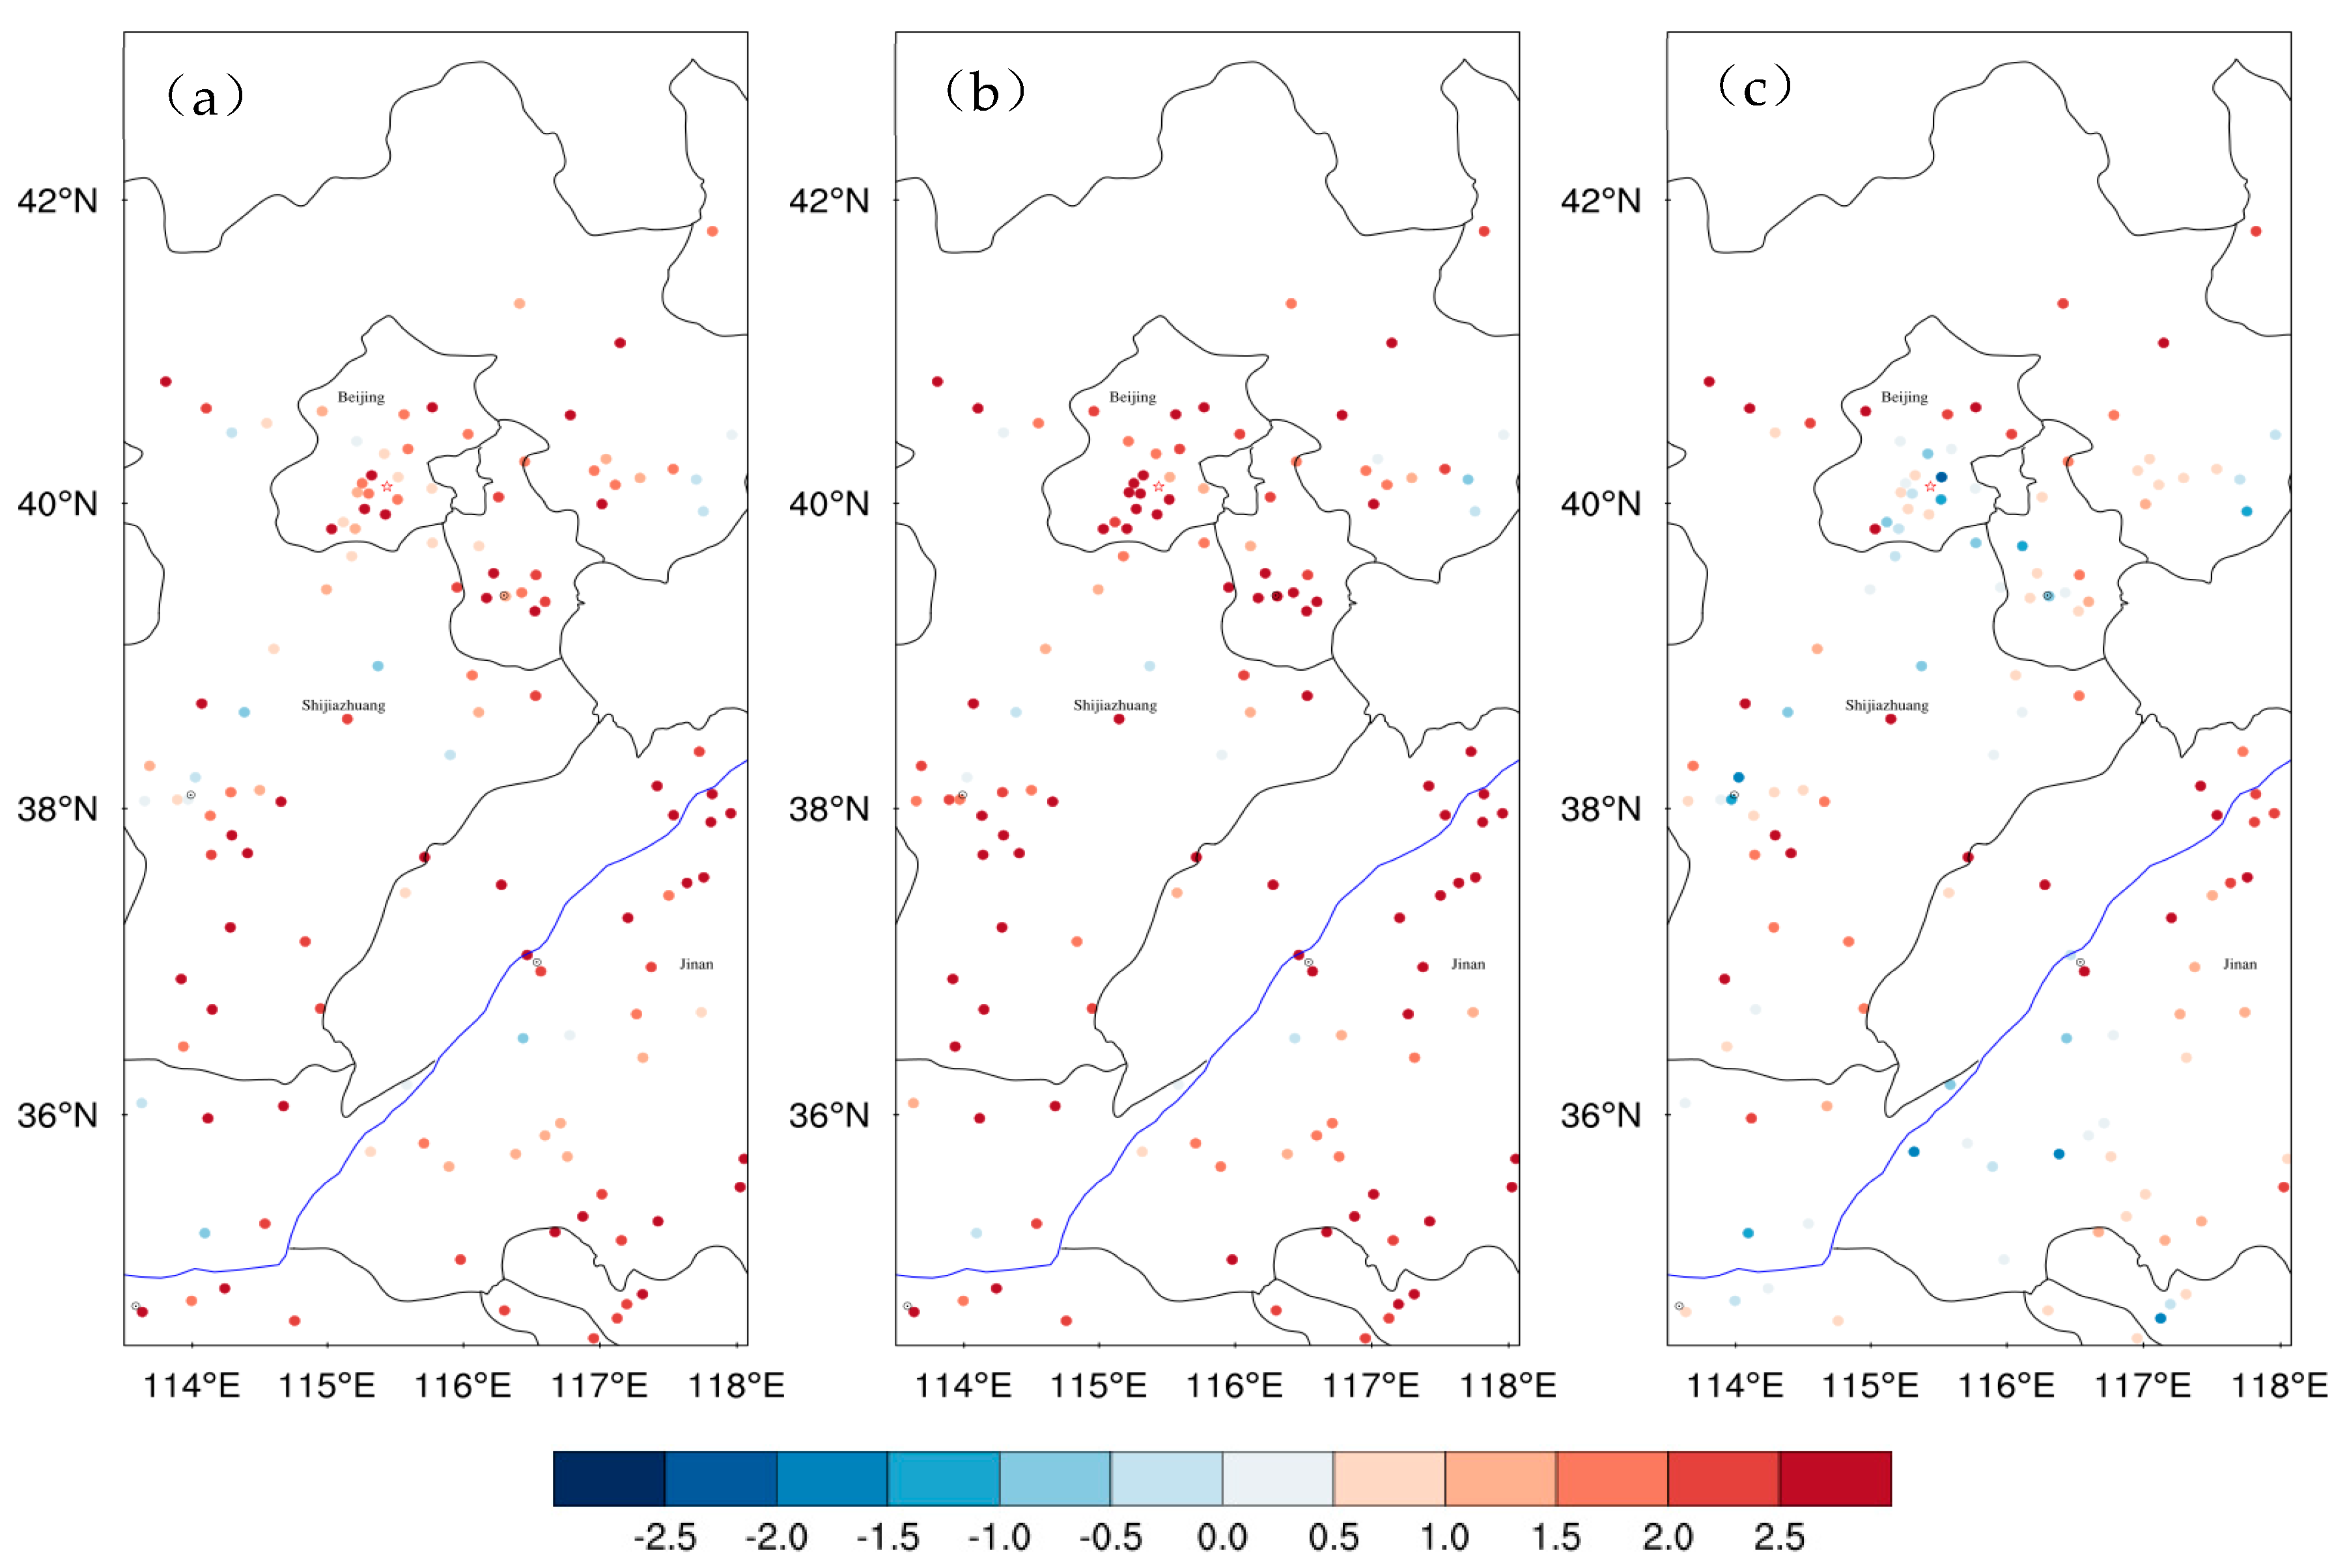
Figure 4 and Figure 5 show the spatial distribution of 10 m wind speed bias at urban stations at forecast lead times of 6 h (14:00 Beijing Time, daytime) and 18 h (02:00 Beijing Time the next day, nighttime), respectively. During daytime (Figure 4), both NOUCM and SLUCM exhibit a widespread positive bias across the North China Plain. The bias in SLUCM is generally similar to that in NOUCM at most stations, but is notably larger at several stations in Tianjin. In contrast, MLUCM produces a notable reduction in wind speed, with the positive bias substantially decreased and even turning into a slight negative bias in some areas. During nighttime (Figure 5), the wind speed simulated by MLUCM is much closer to the actual wind speed within the canopy, whereas the overestimation in NOUCM and SLUCM remains evident. This improvement arises because MLUCM explicitly resolves the three-dimensional building structure and calculates the drag force at each model level, thereby providing a more realistic representation of the momentum sink within the urban canopy and effectively suppressing the positive bias in near-surface wind speed [30].
Figure 4.
Spatial distribution of bias of 10 m wind speed (unit: m s−1) for the (a) NOUCM, (b) SLUCM, and (c) MLUCM simulations at a lead time of 6 h (14:00 Beijing Time), averaged from 5 to 7 July 2023.
Figure 5.
Same as Figure 4, but at a lead time of 18 h (02:00 Beijing Time the next day). Subfigures (a–c) correspond to the NOUCM, SLUCM, and MLUCM simulations, respectively.
3.2. Near-Surface Temperature
Figure 3b shows the bias and RMSE of 2 m temperature at urban stations for the three experiments. All three schemes exhibit a positive bias throughout the forecast period, with NOUCM showing the largest bias. The peak bias in NOUCM reaches 2.85 °C, followed by SLUCM, while MLUCM produces the smallest overall bias, with a peak value of 2.42 °C. This indicates that ignoring the urban canopy effect entirely leads to a substantial overestimation of near-surface temperature during the heatwave, whereas the inclusion of an urban canopy scheme effectively reduces this positive bias, with the multi-layer scheme performing best.
Compared with NOUCM, SLUCM produces lower temperatures during daytime and higher temperatures at night. This diurnal pattern arises from the parameterization of urban physical processes in SLUCM. On the one hand, SLUCM considers the shading effect of buildings on shortwave radiation, which reduces the shortwave radiation reaching the surface during daytime and weakens sensible heat flux (Figure 9), thereby reducing the daytime positive bias. On the other hand, SLUCM simulates the slow release of heat stored in the urban surface at night, producing a typical urban heat island effect. Since NOUCM lacks this mechanism, it cools too quickly at night. As a result, SLUCM shows a larger positive bias at night relative to NOUCM.
MLUCM reduces the temperature bias throughout the forecast period. Its advantage lies in the vertical multi-layer structure, which allows a more detailed representation of radiation absorption at different heights and the vertical distribution of turbulent mixing. During daytime, MLUCM more effectively transports absorbed heat to the upper boundary layer, reducing heat accumulation near the surface and significantly lowering the daytime positive bias. Unlike SLUCM, which shows pronounced nighttime warming, MLUCM substantially reduces the nighttime bias, with values close to zero during some periods. As shown in Figure 3b, the RMSE of SLUCM (blue solid line) is lower than that of NOUCM (red solid line) during daytime, indicating an improvement in daytime simulation due to the shading effect. However, during the nighttime periods, the RMSE of SLUCM becomes significantly higher than that of NOUCM. This nocturnal deterioration confirms that the single-layer scheme fails to provide any improvement over NOUCM at night. This suggests that SLUCM, as a single-layer model, may overestimate both the intensity and duration of heat release from urban storage, whereas MLUCM, through vertical layering and a more realistic turbulence parameterization, avoids excessive nighttime warming and produces temperatures closer to observations. Figure 6 and Figure 7 show the spatial distribution of 2 m temperature bias at forecast lead times of 6 h (14:00 Beijing Time, daytime) and 18 h (02:00 Beijing Time the next day, nighttime), respectively. NOUCM shows a pronounced positive bias over North China, with many stations exceeding 2 °C. After introducing an urban canopy scheme, the daytime positive bias (Figure 6) is reduced in both SLUCM and MLUCM, especially at stations in Beijing and southern Hebei, where temperatures are closer to observations. At night (Figure 7), the positive bias in SLUCM becomes more pronounced, whereas MLUCM shows the smallest bias and agrees best with observations.
Figure 6.
Spatial distribution of Bias of 2 m temperature (unit: °C) for the (a) NOUCM, (b) SLUCM, and (c) MLUCM simulations at a lead time of 6 h (14:00 Beijing Time), averaged from 5 to 7 July 2023.
Figure 7.
Same as Figure 6, but at a lead time of 18 h (02:00 Beijing Time the next day). Subfigures (a–c) correspond to the NOUCM, SLUCM, and MLUCM simulations, respectively.
3.3. Near-Surface Specific Humidity
Figure 3c shows the bias and RMSE of 2 m specific humidity. The RMSE curves (solid lines) of the three experiments almost completely overlap throughout the forecast period, indicating that the choice of urban canopy scheme has a limited impact on the overall simulation of specific humidity. However, a systematic negative bias (dry bias) is evident in all three schemes, and this negative bias is more pronounced during daytime. During the heatwave, MLUCM shows a systematic dry bias, with a daytime peak of approximately −2.3 g kg−1. It should be noted that MLUCM does not show a clear advantage over the other schemes in simulating specific humidity; in fact, its dry bias is slightly more pronounced (though the difference is generally less than 0.5 g kg−1). This may be related to the strong vertical mixing in MLUCM, which tends to transport water vapor upward and reduce near-surface specific humidity. Furthermore, none of the schemes includes a realistic representation of urban water storage or anthropogenic moisture sources. Although the magnitude of dry bias is relatively small (relative humidity bias of about 5–10%), and the overall simulation of the hot and humid environment remains acceptable, it indicates that the representation of urban hydrological processes remains a major source of uncertainty.
3.4. Surface Energy Fluxes
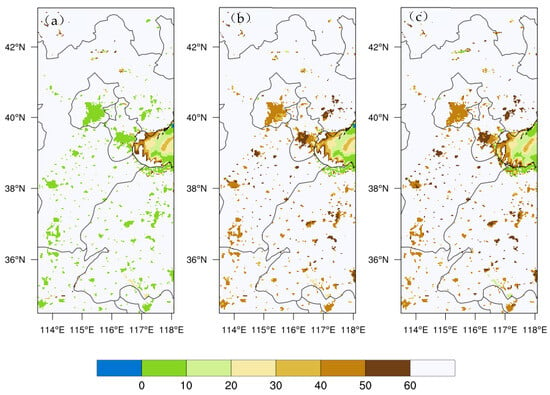
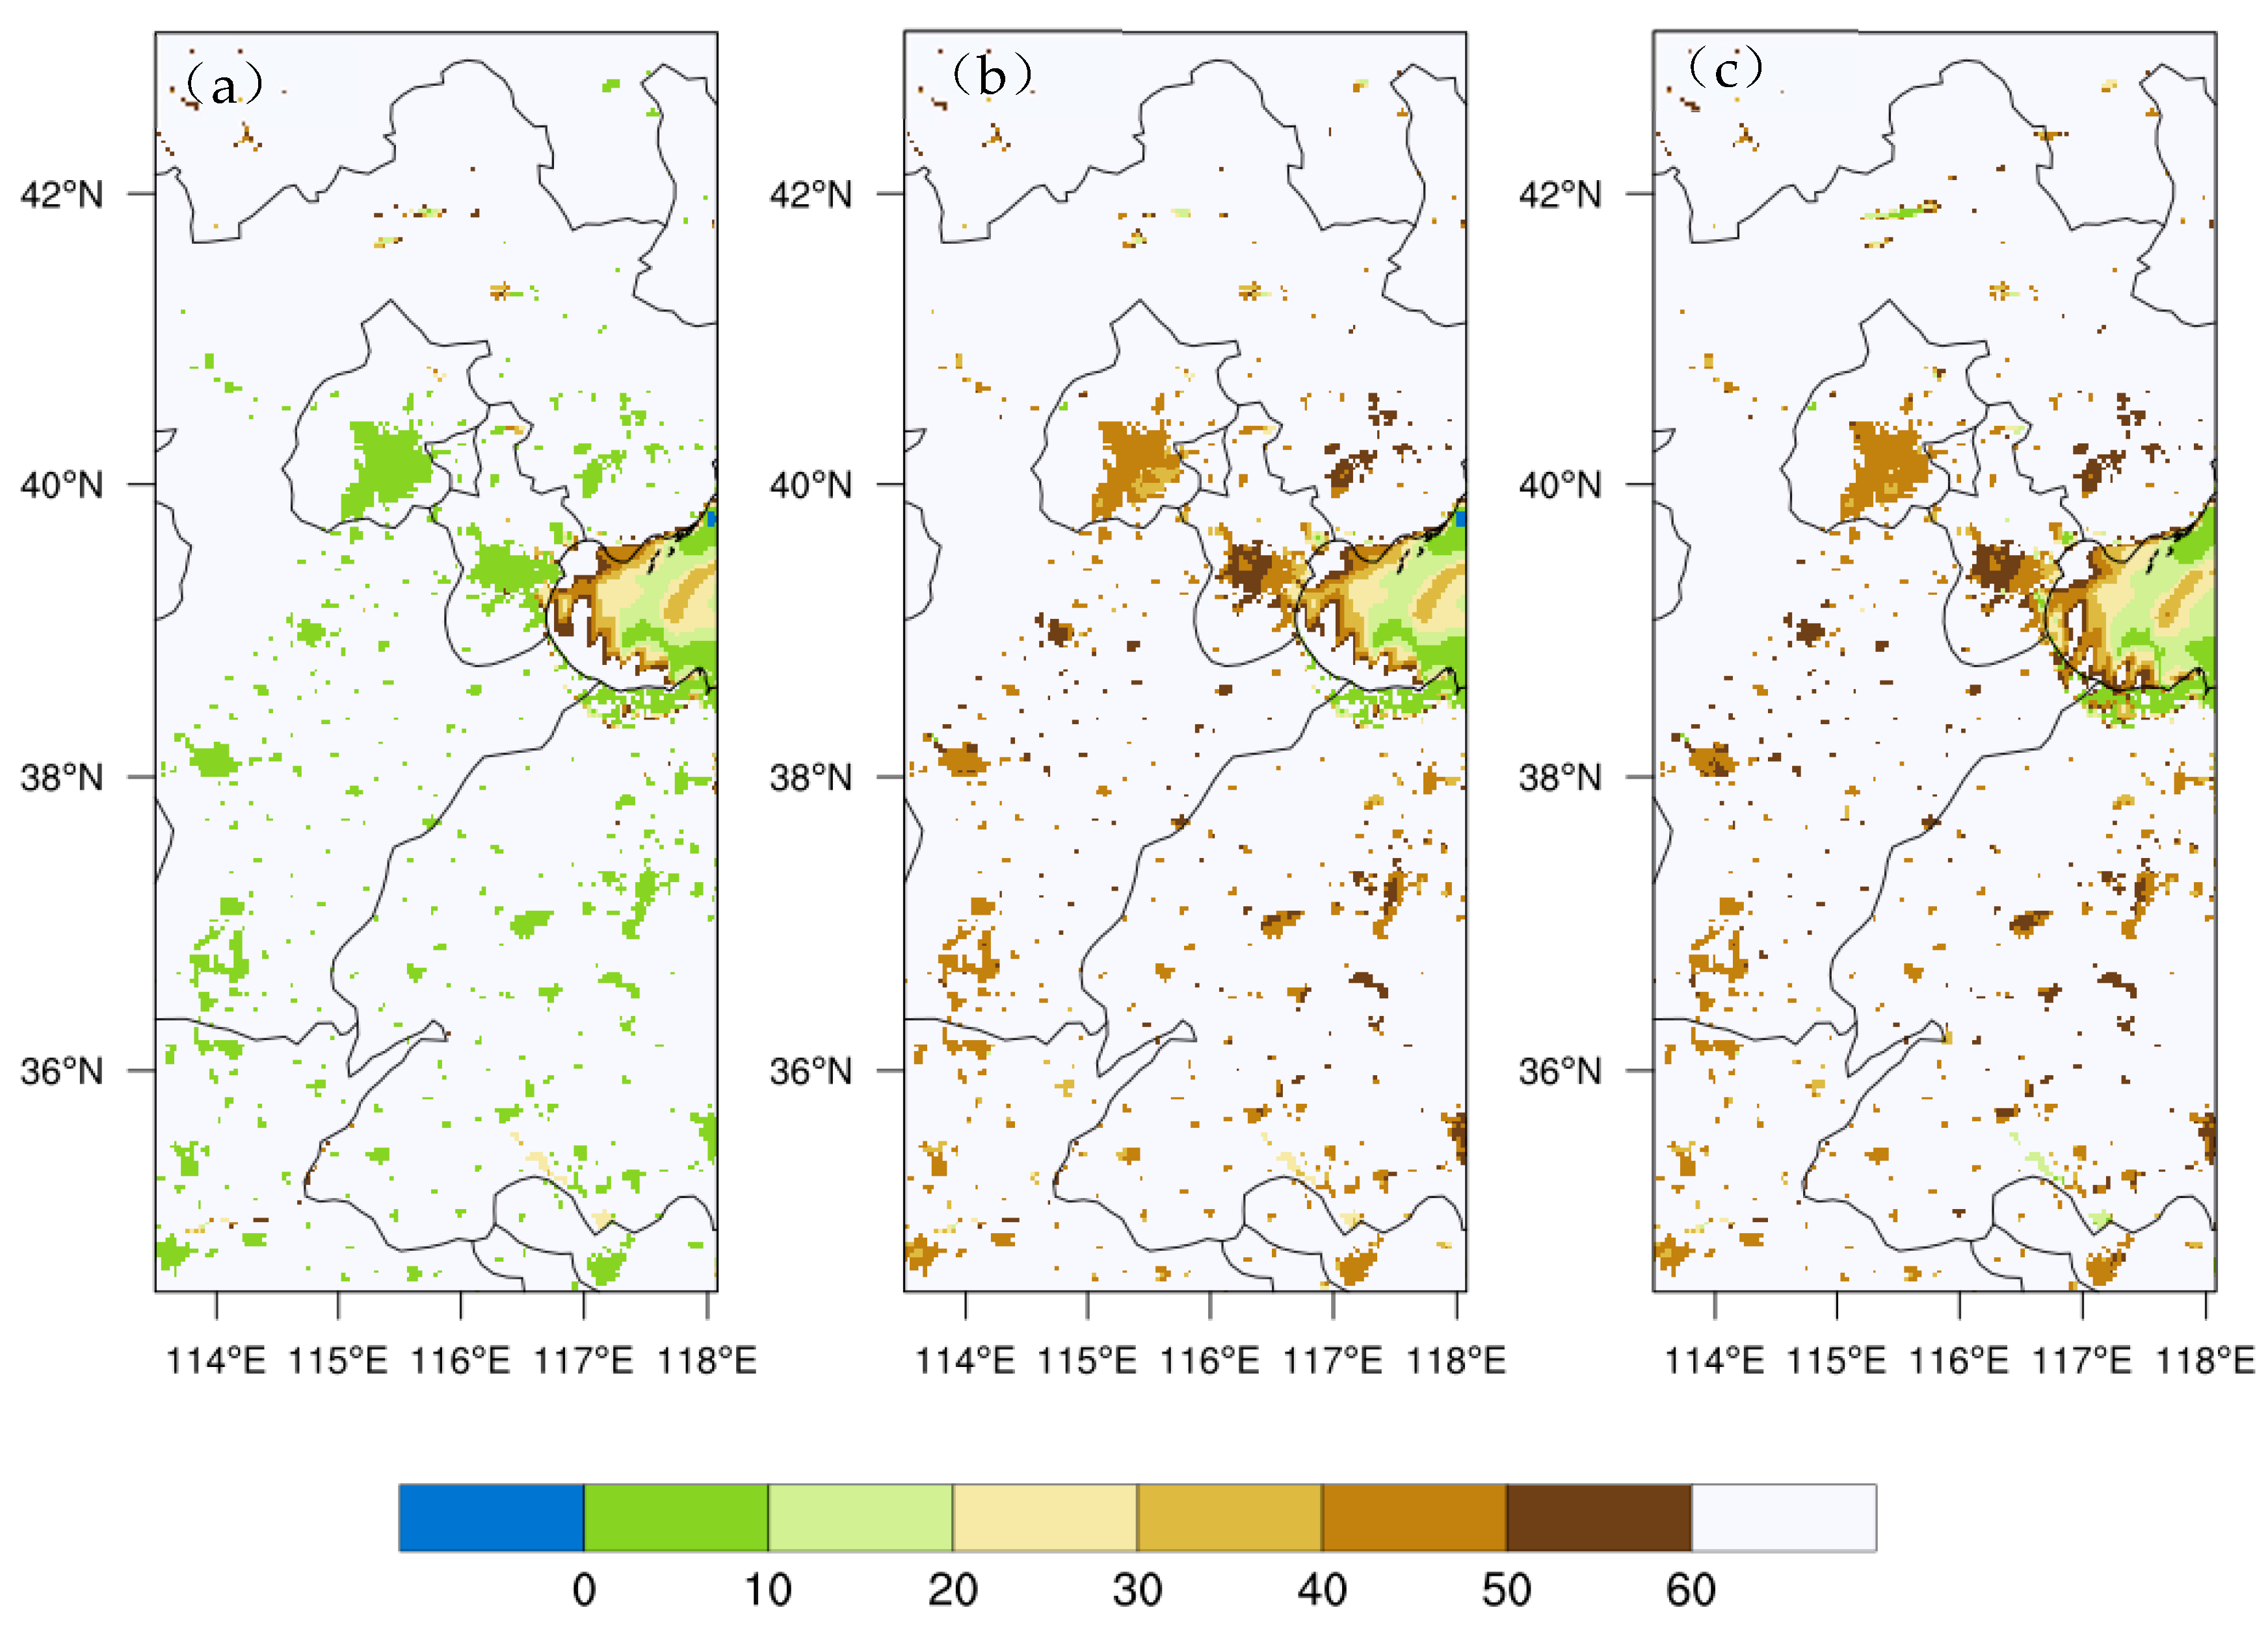
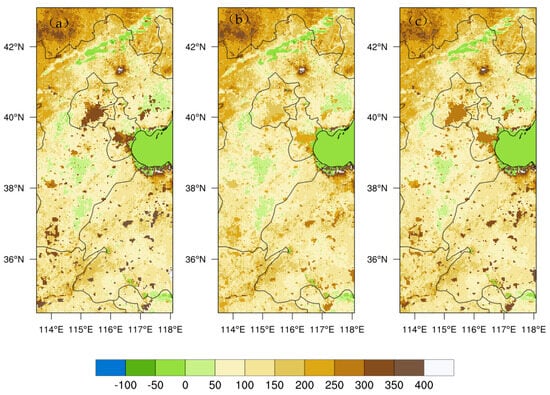
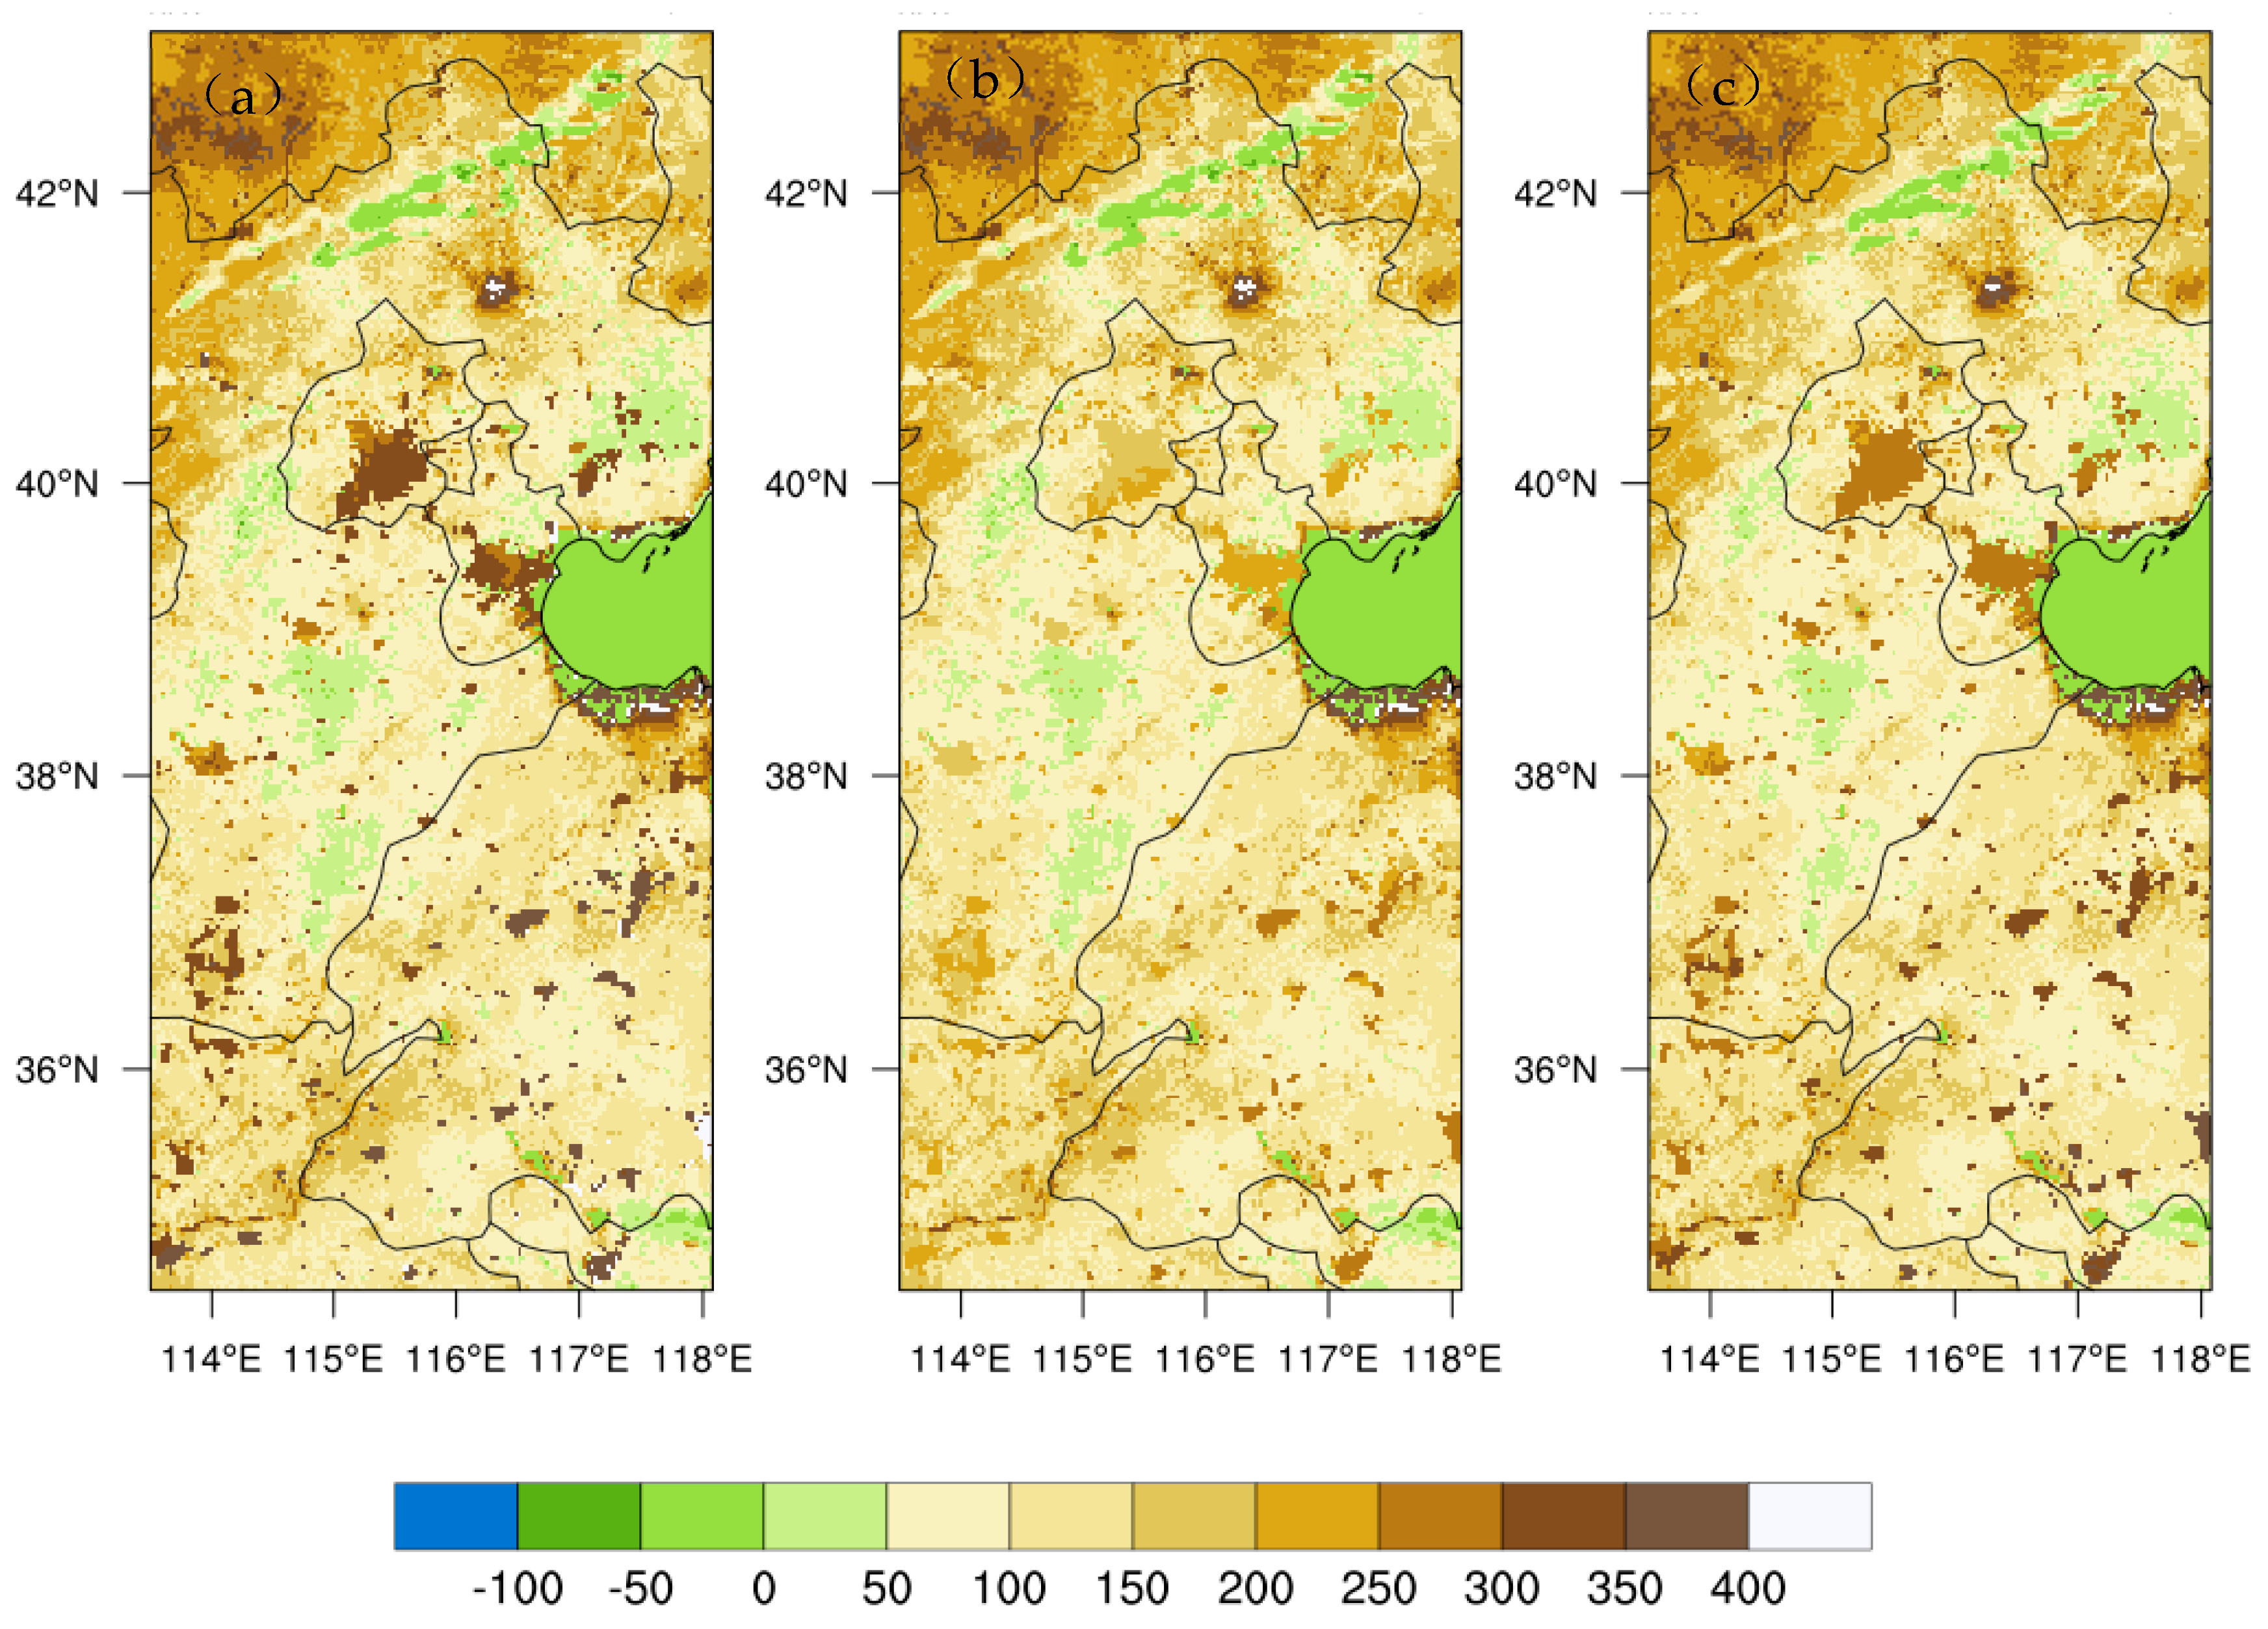
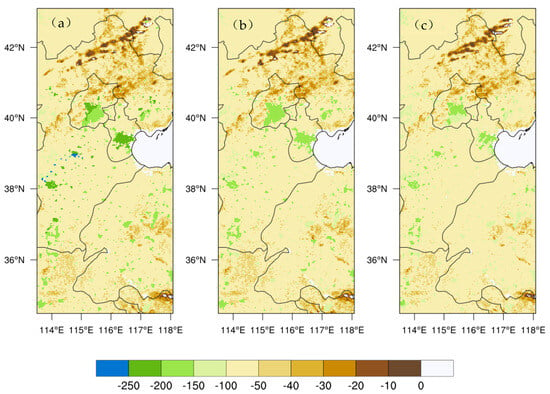
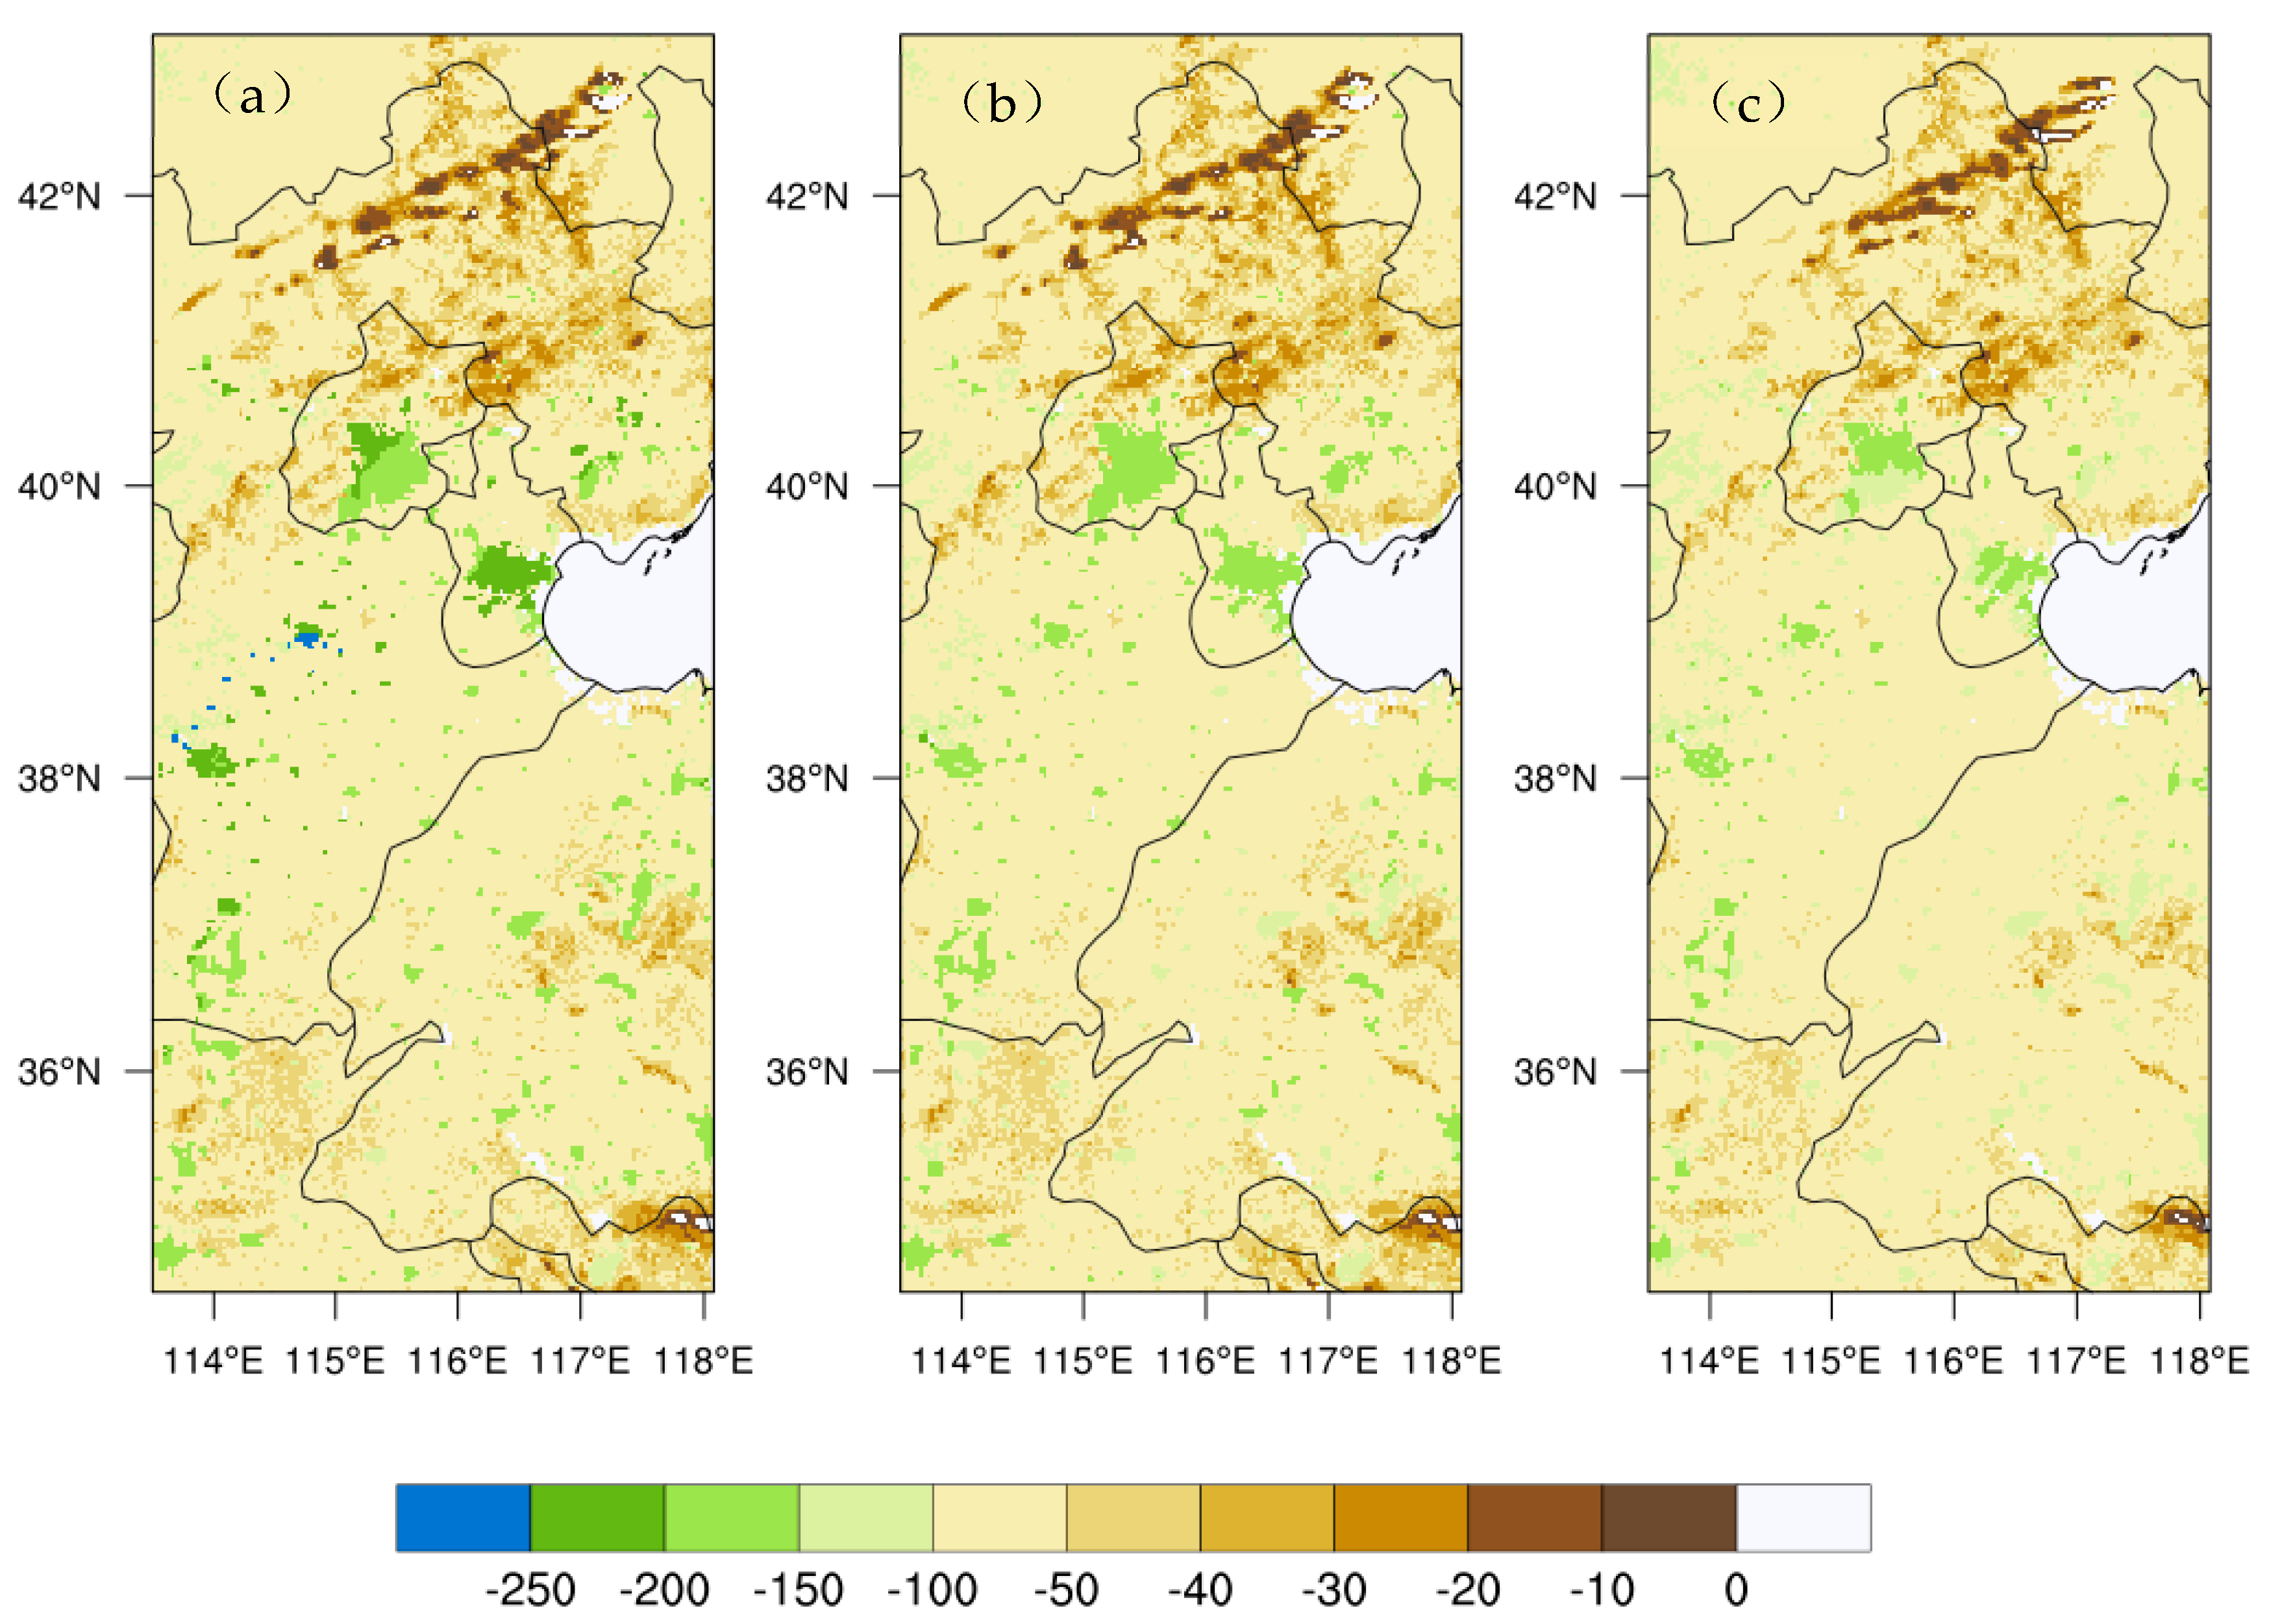
The differences described above can also be interpreted in terms of surface heat fluxes. Figure 8, Figure 9 and Figure 10 show the daytime sensible heat flux (HFX), latent heat flux (LH), and downward ground heat flux (GRDFLX) at 14:00 Beijing Time for the three experiments. In NOUCM, the latent heat flux is close to zero over urban areas because the urban surface is treated as an impervious, flat medium, so evaporation is essentially absent. In contrast, both SLUCM and MLUCM show non-zero latent heat fluxes, as they account for the evaporation from vegetation within the urban canyon.
Figure 8.
Spatial distribution of latent heat flux (unit: W m−2) for the (a) NOUCM, (b) SLUCM, (c) MLUCM simulations at a lead time of 6 h (14:00 Beijing Time) averaged from 5 to 7 July 2023.
Figure 9.
Same as Figure 8, but for sensible heat flux (unit: W m−2). Subfigures (a–c) correspond to the NOUCM, SLUCM, and MLUCM simulations, respectively.
Figure 10.
Same as Figure 8, but for ground heat flux (unit: W m−2). Subfigures (a–c) correspond to the NOUCM, SLUCM, and MLUCM simulations, respectively.
During daytime, the sensible heat flux in MLUCM is notably higher than in SLUCM, which is consistent with its stronger vertical mixing. Consequently, the absolute magnitude of the negative GRDFLX (representing heat storage into the ground) in MLUCM is significantly smaller. This combination reveals the distinct energy partitioning mechanisms of the two schemes. On the one hand, the larger sensible heat flux in MLUCM is related to its refined dynamical drag and turbulence parameterization, which enhance vertical mixing and rapidly transport heat to higher levels, reducing near-surface accumulation. On the other hand, the smaller GRDFLX in MLUCM indicates that less heat is stored in the deeper subsurface. Although MLUCM transports more sensible heat to the atmosphere, the efficient vertical mixing prevents excessive near-surface warming, thereby suppressing the daytime positive temperature bias [11,16].
These distinct daytime heat storage patterns directly determine the nighttime thermal conditions. At night, both sensible and latent heat fluxes are significantly reduced. Because MLUCM stored less heat during the day, its positive GRDFLX (heat release from the ground) at night has the smallest absolute magnitude among the three schemes. As a result, the nighttime sensible heat flux in MLUCM approaches zero, radiative cooling dominates, temperature decreases rapidly, and the positive temperature bias is small. In contrast, SLUCM exhibits a large negative GRDFLX during the day and a large positive GRDFLX at night. Combined with weak nocturnal turbulent mixing, the continuous release of stored heat in SLUCM results in persistent nighttime sensible heat heating and a significantly larger nighttime temperature bias. These flux differences ultimately shape the simulated urban heat island intensity, which will be discussed in the following section.
3.5. Urban Heat Island Intensity
The energy flux analysis above shows that the three urban canopy schemes differ significantly in their representation of daytime heat storage and nighttime heat release. These differences are ultimately reflected in the simulated UHI intensity. To quantify the ability of each scheme to reproduce the urban thermal environment, the UHI intensity was calculated as the mean 2 m temperature difference between urban and rural stations, and compared with the UHI computed based on observations.
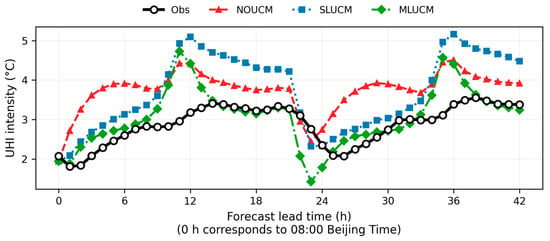
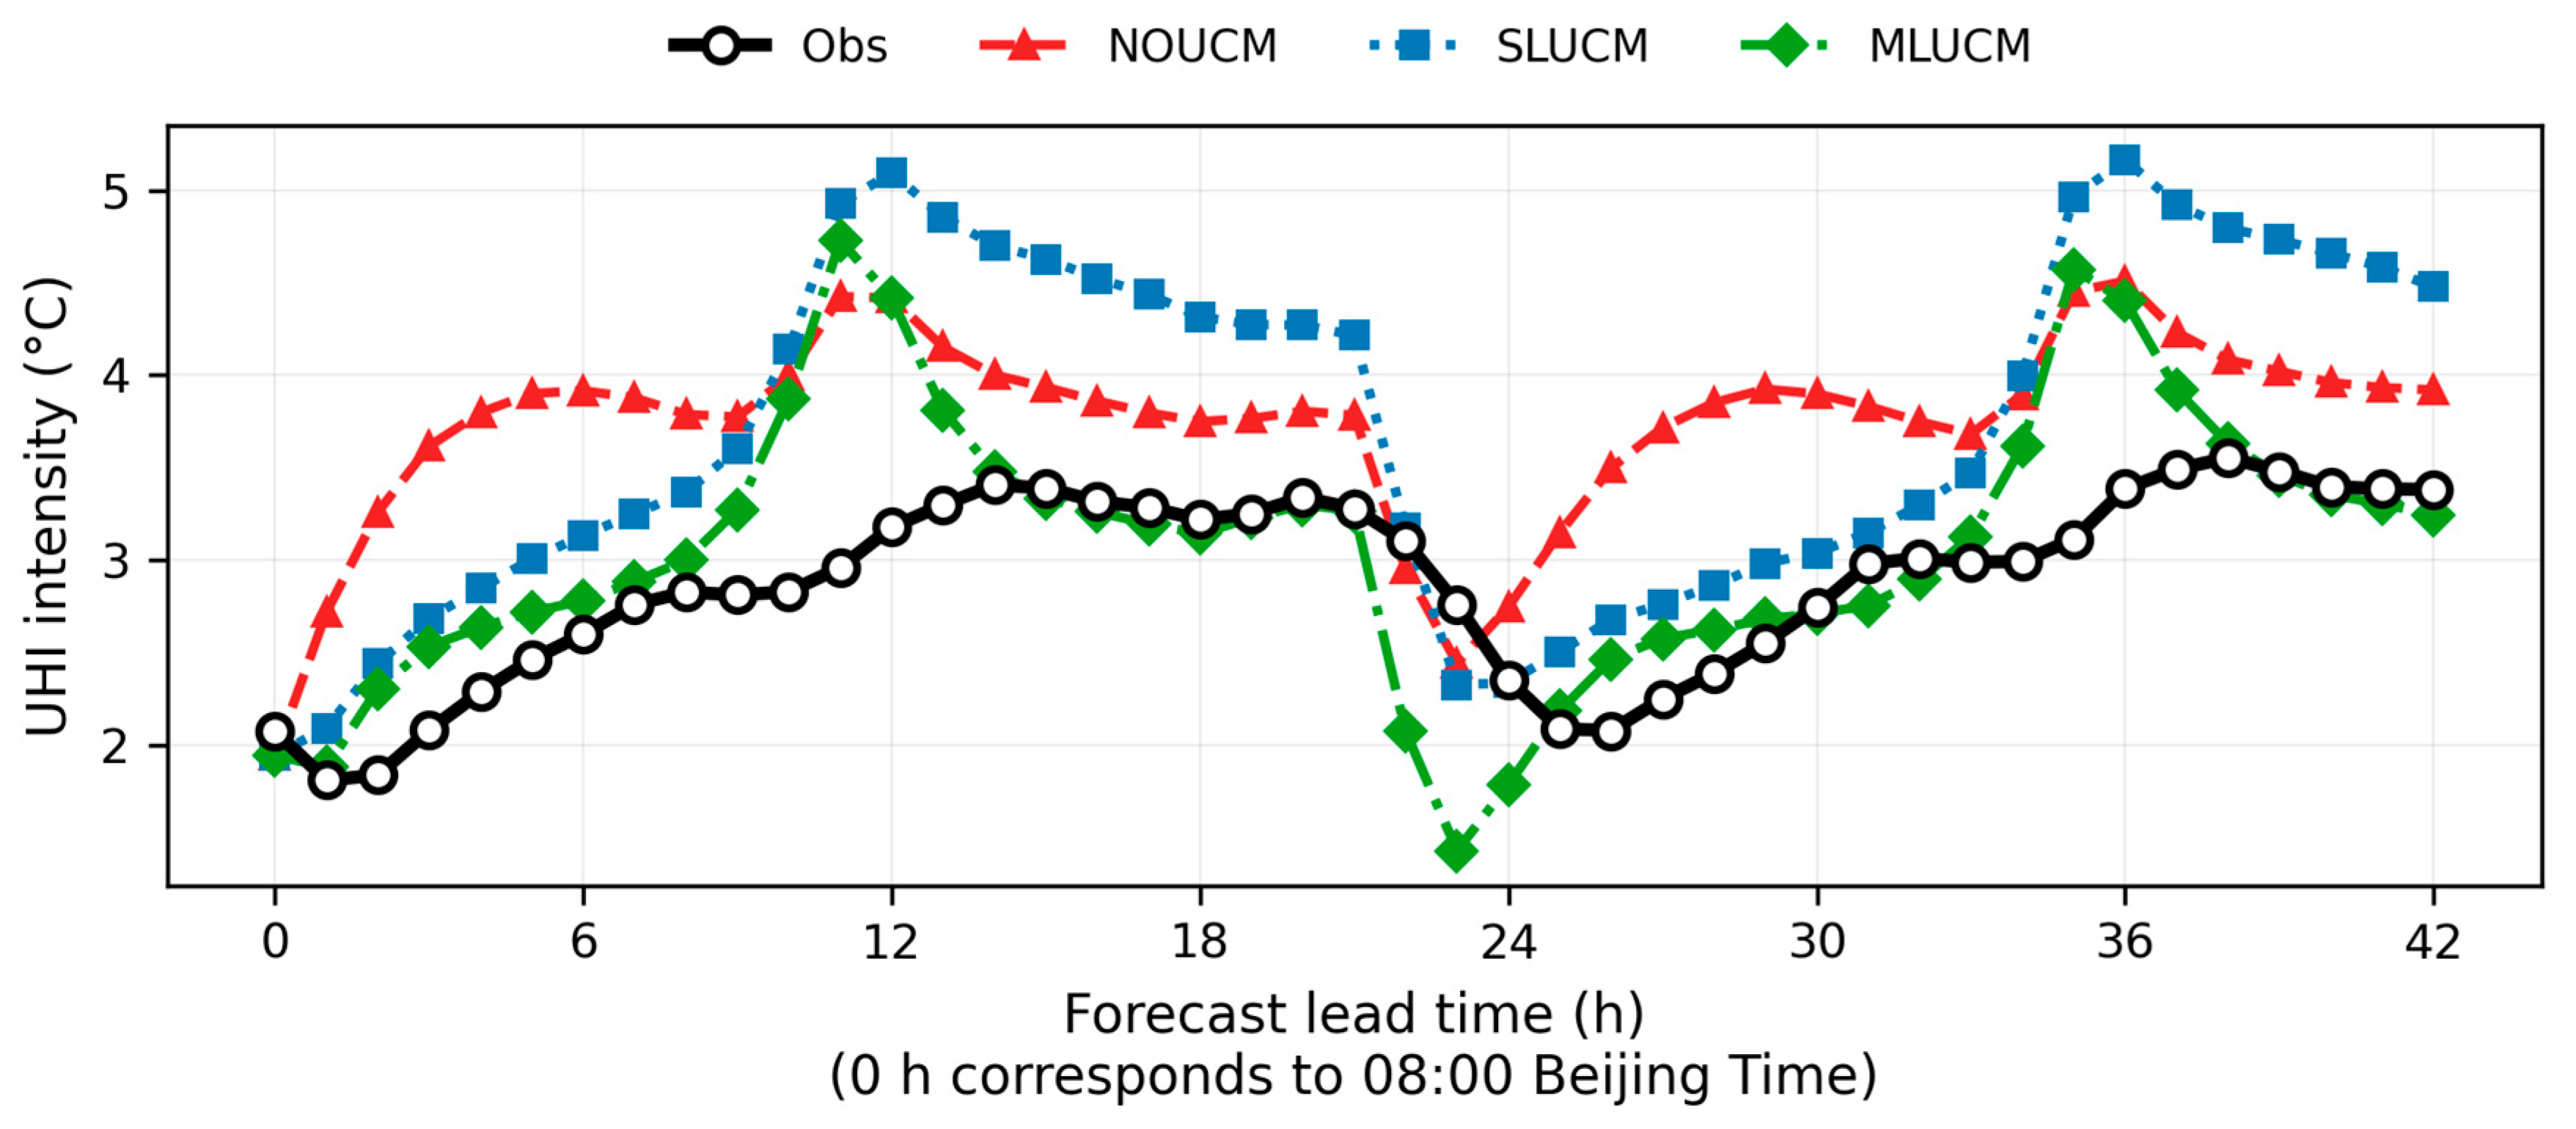
Figure 11 shows the UHI intensity as a function of forecast lead time, averaged over the three initializations (5–7 July 2023), together with the observed values. Note that lead time 0 h corresponds to 08:00 Beijing Time. MLUCM produces UHI intensities closest to observations during most of the forecast period. In particular, between 12 and 20 h, the MLUCM curve almost coincides with the observed curve, with a bias of less than 0.2 °C. During the daytime peaks (12 h and 36 h, corresponding to 14:00 Beijing Time), SLUCM shows pronounced peaks (5.1 °C and 5.2 °C, respectively). During nighttime periods (18–24 h and 30–42 h), SLUCM does not show a clear improvement over NOUCM and even exhibits a more persistent positive bias, consistent with the excessive nighttime heat release in the single-layer scheme. NOUCM shows a positive bias throughout the forecast period, with values between +0.5 °C and +1.0 °C during 12–20 h and 36–42 h. A dip appears near 24 h in all three schemes, which corresponds to the boundary layer transition period; the dip is most pronounced in MLUCM (1.4 °C), but this single-point deviation does not affect the overall conclusion.
Figure 11.
UHI intensity as a function of forecast lead time for the NOUCM (red dashed line with triangles), SLUCM (blue dotted line with squares), and MLUCM (green dash-dotted line with diamonds) experiments, averaged over three forecast initializations during 5–7 July 2023. The black solid line with open circles indicates observations. Forecast lead time 0 h corresponds to 08:00 Beijing Time (00:00 UTC).
Statistically, the daytime and nighttime UHI biases in MLUCM are +0.349 °C and +0.094 °C, respectively, both the smallest among the three schemes. The overall UHI RMSE in MLUCM is 0.721 °C, which is 30.2% lower than NOUCM (1.033 °C) and 33.2% lower than SLUCM (1.079 °C). The nighttime UHI bias in SLUCM reaches +1.094 °C, which is even larger than that of NOUCM, further confirming the single-layer scheme’s limitation in representing nocturnal urban thermal storage. Meanwhile, the daytime UHI bias in NOUCM reaches +1.176 °C, reflecting the overly strong daytime thermal effect in the no-canopy scheme.
These results are consistent with the energy flux analysis: MLUCM partitions daytime heat storage and nighttime heat release more reasonably through its multi-layer vertical structure, storing less heat during the day and releasing less at night, so that the UHI intensity is closer to observations throughout the forecast period. SLUCM stores more heat during the day and releases it continuously at night, leading to a significant overestimation of nighttime UHI. NOUCM lacks a heat storage mechanism, and the daytime urban sensible heat heating is too strong, resulting in the largest daytime UHI bias. Overall, MLUCM demonstrates superior performance in simulating temperature, wind speed, and energy flux and UHI intensity, although its advantage in 2 m specific humidity is limited (as discussed in Section 3.3). These findings indicate that while MLUCM has good potential for fine-scale urban thermal environment forecasting, its higher computational cost should be carefully weighed in operational applications.
4. Discussion
This study evaluated three urban canopy configurations, namely NOUCM, SLUCM, and MLUCM, in simulating a heatwave event over North China in July 2023, using WRFv4.6.1 with updated 2020 MODIS land use data. The results show that MLUCM consistently outperforms NOUCM and SLUCM in simulating 10 m wind speed, 2 m temperature, surface energy fluxes, and urban heat island intensity, while the improvement in 2 m specific humidity is limited.
The better performance of MLUCM in wind speed can be attributed to its explicit representation of three-dimensional building drag. SLUCM uses a single homogeneous layer and a uniform building height of 7.5 m, which underestimates the dynamical roughness of the urban surface and therefore produces a larger positive wind speed bias, even larger than that of NOUCM. This is consistent with previous studies reporting that single-layer schemes have limited ability to represent momentum exchange within tall and dense urban canopies [30,31]. MLUCM calculates the drag force at each model level and thus provides a more realistic representation of the momentum sink, which effectively reduces the near-surface wind speed bias.
The temperature and UHI results further support the mechanism revealed by the surface energy flux analysis. MLUCM stores less heat during daytime and releases less at night, because its multi-layer structure allows a more realistic vertical distribution of radiation absorption and turbulent mixing. This is consistent with the design philosophy of MLUCM proposed by Martilli et al. [18] and with recent findings that multi-layer schemes reduce the nighttime warm bias often produced by single-layer schemes [19]. In contrast, SLUCM stores more heat during the day and releases it continuously at night, leading to a pronounced nighttime UHI overestimation. NOUCM lacks any heat storage mechanism, so its daytime thermal effect is too strong, resulting in the largest daytime UHI bias. These differences indicate that the UHI bias in urban climate simulations is not only a matter of surface parameter values but also a consequence of how the vertical structure of the urban canopy is represented.
It should be noted that the relative performance of SLUCM and MLUCM is region-dependent. In the Bengaluru study, SLUCM showed smaller biases in surface temperature and UHI intensity than MLUCM, because the relatively low urbanization level and two-dimensional street canyon structure of that city were better represented by the single-layer assumption [20]. In contrast, the Beijing–Tianjin–Hebei urban agglomeration is characterized by high building density and large height variability, which is better represented by the three-dimensional structure of MLUCM. This regional dependence suggests that the choice of urban canopy scheme should be adapted to the local urban morphology rather than applied uniformly [32].
The dry bias in 2 m specific humidity is a common feature of all three schemes, and MLUCM does not show a clear advantage. This may be related to the fact that the urban surface is treated as largely impervious in all schemes, and none of them includes a realistic representation of urban water storage, irrigation, or anthropogenic moisture sources. In addition, the strong vertical mixing in MLUCM tends to transport water vapor upward, reducing near-surface specific humidity. Similar dry biases have been reported in other WRF urban simulations [11], suggesting that the representation of urban hydrological processes remains a major source of uncertainty in urban canopy modeling. This also implies that the improved temperature and UHI simulations in MLUCM should not be interpreted as a general improvement in all surface variables.
Several limitations of this study should be acknowledged. First, only one heatwave event was examined, and the conclusions may not be directly transferable to other weather conditions or seasons. Second, the urban morphological parameters used in SLUCM and MLUCM are prescribed rather than derived from local building datasets, which may affect the generality of the results. Third, the simulations do not include anthropogenic heat emissions, which are known to be important during heatwaves in large urban agglomerations. Fourth, the UHI intensity was calculated from urban and rural station pairs, and the choice of rural stations may influence the magnitude of the estimated UHI.
Future research will focus on several directions. First, additional heatwave and non-heatwave cases should be simulated to test whether the advantage of MLUCM is robust across different synoptic conditions. Second, to overcome the limitations of default urban parameters and the coarse 3 km resolution, future studies will incorporate localized urban morphological parameters (e.g., LCZ-based data) and employ finer nested grids (e.g., 1 km) in key urban areas to better resolve fine-scale intra-urban heterogeneity. Our sensitivity test indicates that building height differences have a minimal impact, but localized parameters remain essential for further refinement. Third, the combination of MLUCM with urban hydrological parameterizations should be explored to reduce the dry bias in near-surface specific humidity. Finally, the UHI calculation could be further refined by pairing urban stations with strictly defined LCZ rural stations. These comprehensive improvements are expected to significantly enhance the capability of urban canopy models for fine-scale urban weather and heat-risk forecasting.
Author Contributions
Conceptualization, Y.Q. and X.Z.; methodology, Y.Q.; software, Y.Q.; validation, Y.Q., J.W. and J.X.; formal analysis, Y.Q.; investigation, Y.Q.; resources, X.Z.; data curation, Y.Q.; writing—original draft preparation, Y.Q.; writing—review and editing, X.Z., J.W., J.X. and W.T.; visualization, Y.Q.; supervision, X.Z.; project administration, X.Z.; funding acquisition, X.Z. All authors have read and agreed to the published version of the manuscript.
Funding
This research was funded by the Open Project of the State Key Laboratory of Low-Carbon Smart Coal-Fired Power Generation and Ultra-Clean Emission, grant number D2023FK088, and the Joint Fund Project of the National Natural Science Foundation of China, grant number U2342221.
Institutional Review Board Statement
Not applicable.
Informed Consent Statement
Not applicable.
Data Availability Statement
The WRF model version 4.6.1 is publicly available at https://github.com/wrf-model/WRF/releases (accessed on 22 September 2026). The 2020 MODIS land use and vegetation fraction data are available at https://search.earthdata.nasa.gov (accessed on 22 September 2026). The MET verification tool is available at https://dtcenter.org/software-tools/model-evaluation-tools-met (accessed on 22 September 2026). The observational data used in this study were provided by the national meteorological station network (https://data.cma.cn/).
Acknowledgments
The authors thank the anonymous reviewers for their valuable comments.
Conflicts of Interest
X.Z., J.W., J.X. and W.T. were employed by China Energy Science and Technology Research Institute Co., Ltd. The remaining authors declare that the research was conducted in the absence of any commercial or financial relationships that could be construed as a potential conflict of interest. The funders had no role in the design of the study; in the collection, analyses, or interpretation of data; in the writing of the manuscript; or in the decision to publish the results.
References
- Zhou, Y.Q.; Ren, G.Y. Detection and correction of urbanization influence on surface air temperature observations in North China. Clim. Environ. Res. 2005, 10, 743–753. (In Chinese) [Google Scholar]
- Zhou, Y.Q.; Ren, G.Y. The effect of urbanization on maximum, minimum temperatures and diurnal range in North China. Plateau Meteorol. 2009, 28, 1158–1166. (In Chinese) [Google Scholar]
- Zhu, T.F. Land Use/Cover Change and Its Water Resources Effects in Mountainous Areas of North China. Ph.D. Thesis, China Agricultural University, Beijing, China, 2014. (In Chinese) [Google Scholar]
- Wang, J.; Yan, X.; Liu, J.; Zhang, X. The contribution of urbanization to recent extreme heat events and white roof mitigation strategy in the Beijing–Tianjin–Hebei metropolitan area. In Proceedings of the EGU General Assembly Conference, Vienna, Austria, 12–17 April 2015; p. 404. [Google Scholar]
- Qiao, Z.; Wei, Q.; Gao, H.; Liu, L.; Xu, X.; Han, D. Urbanization-driven and intercity interaction-induced warming effects in the Beijing–Tianjin–Hebei urban agglomeration: A comparison of heatwave and non-heatwave scenarios. Appl. Geogr. 2025, 177, 103561. [Google Scholar] [CrossRef] [Scilit]
- Bilang, R.G.J.P.; Blanco, A.C.; Santos, J.A.S.; Olaguera, L.M.P. Simulation of urban heat island during a high-heat event using WRF urban canopy models: A case study for Metro Manila. Atmosphere 2022, 13, 1658. [Google Scholar] [CrossRef] [Scilit]
- Qi, Y.J.; Chen, M.; Zhong, J.Q.; Fan, S.; Liu, R.; Guo, C. Evaluation of short-term forecast of surface meteorological elements in North China by RMAPS-ST coupled with urban canopy model. J. Arid Meteorol. 2020, 38, 859–867. (In Chinese) [Google Scholar]
- Xuan, C.Y. Study on the impact of Beijing urbanization on urban heat island. Chin. J. Geophys. 2006, 49, 69–77. (In Chinese) [Google Scholar]
- Yang, H.Y.; Yang, F.; Dewan, A. Responses of surface and canopy heat islands to extreme temperatures: A synergistic analysis in the Beijing–Tianjin–Hebei urban agglomeration. Urban Clim. 2025, 59, 102712. [Google Scholar] [CrossRef] [Scilit]
- Sun, Y.; Zhang, N.; Miao, S.; Kong, F.; Zhang, Y.; Li, N. Urban morphological parameters of the main cities in China and their application in the WRF model. J. Adv. Model. Earth Syst. 2021, 13, e2020MS002382. [Google Scholar] [CrossRef] [Scilit]
- Li, C.; Zhang, N.; Wang, Y.; Chen, Y. Modeling urban heat islands and thermal comfort during a heat wave event in East China with CLM5 incorporating local climate zones. J. Geophys. Res. Atmos. 2023, 128, e2023JD038883. [Google Scholar] [CrossRef] [Scilit]
- Qian, Y.; Chakraborty, T.C.; Li, J.; Li, D.; He, C.; Sarangi, C.; Chen, F.; Yang, X.; Leung, L.R. Urbanization impact on regional climate and extreme weather: Current understanding, uncertainties, and future research directions. Adv. Atmos. Sci. 2022, 39, 819–860. [Google Scholar] [CrossRef] [Scilit] [PubMed]
- Huang, M.; Gao, Z.Q.; Miao, S.G.; Chen, F. Sensitivity of urban boundary layer simulation to urban canopy models and PBL schemes in Beijing. Meteorol. Atmos. Phys. 2019, 131, 1235–1248. [Google Scholar] [CrossRef] [Scilit]
- Barlage, M.; Miao, S.G.; Chen, F. Impact of physics parameterizations on high-resolution weather prediction over two Chinese megacities. J. Geophys. Res. Atmos. 2016, 121, 4487–4498. [Google Scholar] [CrossRef] [Scilit]
- Gál, T.M.; Alinasab, N.; Abdulhaq, H.; Skarbit, N. A structured literature review of the application of Local Climate Zones (LCZ) in urban climate modelling. Earth 2026, 7, 3. [Google Scholar] [CrossRef] [Scilit]
- Kusaka, H.; Kondo, H.; Kikegawa, Y.; Kimura, F. A simple single-layer urban canopy model for atmospheric models: Comparison with multi-layer and slab models. Bound.-Layer Meteorol. 2001, 101, 329–358. [Google Scholar] [CrossRef] [Scilit]
- Kusaka, H.; Kimura, F. Thermal effects of urban canyon structure on the nocturnal heat island: Numerical experiment using a mesoscale model coupled with an urban canopy model. J. Appl. Meteorol. 2004, 43, 1899–1910. [Google Scholar] [CrossRef] [Scilit]
- Martilli, A.; Clappier, A.; Rotach, M.W. An urban surface exchange parameterisation for mesoscale models. Bound.-Layer Meteorol. 2002, 104, 261–304. [Google Scholar] [CrossRef] [Scilit]
- Jandaghian, Z.; Berardi, U. Comparing urban canopy models for microclimate simulations in Weather Research and Forecasting Models. Sustain. Cities Soc. 2020, 55, 102025. [Google Scholar] [CrossRef] [Scilit]
- Sussman, H.S.; Dai, A.; Raghavendra, A.; Zhou, L. An evaluation of WRF urban canopy models over Bengaluru, India. Model. Earth Syst. Environ. 2024, 10, 1783–1802. [Google Scholar] [CrossRef] [Scilit]
- Kyriakidis, I.; Pavlidis, V.; Gkolemi, M.; Mitraka, Z.; Chrysoulakis, N.; Katragkou, E. Assessing the Sensitivity of WRF to Surface Urban Physics. Environ. Earth Sci. Proc. 2025, 35, 67. [Google Scholar] [CrossRef] [Scilit]
- Xu, Y.; Gao, W.; Fan, J.; Zhao, Z.; Zhang, H.; Ma, H.; Wang, Z.; Li, Y.; Yu, L. Comparison of Urban Canopy Schemes and Surface Layer Schemes in the Simulation of a Heatwave in the Xiongan New Area. Atmosphere 2022, 13, 1472. [Google Scholar] [CrossRef] [Scilit]
- Rafael, S.; Rodrigues, V.; Fernandes, A.P.; Augusto, B.; Borrego, C.; Lopes, M. Evaluation of urban surface parameterizations in WRF model using energy fluxes measurements in Portugal. Urban Clim. 2019, 28, 100465. [Google Scholar] [CrossRef] [Scilit]
- Ribeiro, I.; Martilli, A.; Falls, M.; Zonato, A.; Villalba, G. Highly resolved WRF-BEP/BEM simulations over Barcelona urban area with LCZ. Atmos. Res. 2021, 248, 105220. [Google Scholar] [CrossRef] [Scilit]
- National Center for Atmospheric Research (NCAR). WRF Model User’s Guide, Version 4.6.1; NCAR: Boulder, CO, USA, 2023. [Google Scholar]
- Joshi, P.; Lin, T.-S.; He, C.; Lamer, K. Urban weather modeling using WRF: Linking physical assumptions, code implementation, and observational needs. Geosci. Model Dev. 2025, 18, 7869–7890. [Google Scholar] [CrossRef] [Scilit]
- Li, T.; Li, H.G.; He, J.J.; Zheng, L.N.; He, P.C. Impact of different land surface data on temperature and precipitation simulation over complex terrain: Take city of Ji’nan as an example. J. Southwest Univ. (Nat. Sci. Ed.) 2023, 45, 124–131. (In Chinese) [Google Scholar] [CrossRef]
- Sun, L.H.; Zhao, L.; Li, W.; Ai, W.X.; Zou, X.K.; Li, Y.; Dai, T.L. Preliminary study on climatic characteristics and causes of extreme high temperature and heatwave events in North China and Huanghuai in 2023. China Flood Drought Manag. 2023, 33, 8–12. (In Chinese) [Google Scholar]
- Xiang, L.; Sun, W.Y.; Du, H.Y.; Che, S.; Han, S.; Li, X.; Zhang, J. Cause and forecast study of persistent high temperature process in Hebei Province in July 2023. Clim. Environ. Res. 2025, 30, 39–50. (In Chinese) [Google Scholar] [CrossRef]
- Chen, J.; Zheng, Y.G.; Deng, L.T. Effects of urban buildings on 3-dimensional PBL structures: WRF simulation study. J. Peking Univ. (Nat. Sci. Ed.) 2007, 43, 343–350. (In Chinese) [Google Scholar]
- Wang, Y.W.; Jiang, W.M.; Liu, H.N. Advances in parameterization of urban effect in atmospheric numerical models. Adv. Earth Sci. 2008, 23, 371–381. (In Chinese) [Google Scholar]
- Liu, J.X.; Wang, Y.; Hao, Y.X.; Dong, F.Y.; Zhou, Y.Y. Effects of different urban canopy schemes in WRF on near-surface meteorological elements in Lanzhou New Area in winter. J. Lanzhou Univ. (Nat. Sci.) 2026, 62, 285–295. (In Chinese) [Google Scholar] [CrossRef]

Disclaimer/Publisher’s Note: The statements, opinions and data contained in all publications are solely those of the individual author(s) and contributor(s) and not of MDPI and/or the editor(s). MDPI and/or the editor(s) disclaim responsibility for any injury to people or property resulting from any ideas, methods, instructions or products referred to in the content. |
© 2026 by the authors. Licensee MDPI, Basel, Switzerland. This article is an open access article distributed under the terms and conditions of the Creative Commons Attribution (CC BY) license.