


Abstract
Mountainous rainfall exhibits strong spatial heterogeneity associated with topographic effects. Understanding modulating patterns and non-linear responses of rainfall to terrain factors supports mountain storm-disaster mitigation. Taking the Yanshan Mountains in Huairou (Beijing) as the study area, we divided the region by watershed divides into northern and southern zones. Elevation, slope, and sine-cosine transformed aspect served as independent variables, while annual, flood-season, maximum-daily, and maximum-3-day extreme rainfall were dependent variables. We applied Kriging interpolation, quadratic-polynomial ordinary least-squares (OLS), multiscale geographically weighted regression (MGWR), and XGBoost-SHAP to characterize terrain-rainfall statistical associations from global-linear, spatial-non-stationary, and non-linear empirical transition perspectives. Elevation and slope dominated rainfall spatial patterns, whereas aspect exerted minor local modulation. Southern rainfall generally corresponds to higher values with rising elevation, while northern rainfall presented a U-shaped non-linear elevation response. Extreme rainfall was more sensitive to slope than routine rainfall; empirical transition-response features lie at 700–800 m elevation and 20° slope. Multi-model coupling mitigated single-model limitations and provides references for extreme-precipitation understanding and geohazard risk assessment in the North China Yanshan Mountains.
1. Introduction
Complex topography in the Yanshan Mountains of North China creates prominent spatial heterogeneity in mountain rainfall and frequent extreme storm-driven geohazards, including collapses, landslides, and debris flows [1,2,3,4]. As a typical piedmont-mountain transition area within the Yanshan range, Huairou District features obvious north-south geomorphic divergence. This makes it a valuable natural case for investigating topographic controls on rainfall and associated geohazard risks, while relevant quantitative investigations targeting this specific region remain inadequate. Terrain modulates water-vapor transport and condensation-precipitation processes via dynamic lifting, airflow blocking, and local circulation, and acts as a fundamental underlying-surface driver governing spatial patterns of mountain rainfall [5,6,7,8]. Quantifying terrain-induced modulation effects and non-linear rainfall-response signatures under different rainfall regimes therefore provides an essential foundation for mountain precipitation research and geohazard risk mitigation [9,10].
Existing literature has demonstrated that elevation, slope-aspect, and terrain ruggedness largely govern orographic-precipitation spatial variability [11,12,13]. Early international work clarified dual dynamic-thermal terrain controls on mountain rainfall and how complex topography modifies moisture convergence and vertical upward motion [14,15,16,17]. Most hazard-oriented studies adopt correlation or global-regression statistics and mainly focus on macroscopic responses of mean annual rainfall [18]. Nevertheless, critical research gaps persist. Although abundant insights have been obtained for large-scale mountain systems, small-to-medium piedmont mountain settings have received comparatively limited attention. Many existing studies separate ordinary rainfall from extreme-rainfall events and overlook the unique non-linear threshold behaviors of extreme precipitation [19]; conventional global stationary models cannot capture spatial non-stationarity and scale-dependent heterogeneity in topographic forcing [20]. For northern Chinese piedmont mountain environments such as Huairou, quantitative understanding of micro-topographic amplification effects on local extreme rainfall remains insufficient [11,21,22]. More importantly, few studies integrate multi-scale spatial-regression tools and machine-learning algorithms to disentangle linear spatial patterns and non-linear terrain-rainfall responses at local watershed scales [23,24].
Accordingly, this paper selects the Yanshan mountainous area of Huairou District as the case study. Benefiting from natural watershed divides that form geomorphologically distinct northern and southern sub-zones, this study enables comparative analysis of divergent terrain-rainfall responses across contrasting landforms. Quadratic Polynomial Ordinary Least Squares (OLS), Multiscale Geographically Weighted Regression (MGWR), and Extreme Gradient Boosting (XGBoost) models are combined to characterize statistical associations between terrain and rainfall for diverse rainfall metrics, including global linear associations, spatially heterogeneous patterns, and non-linear empirical transition-response dimensions. Through comparative analysis of outputs from these complementary models, this study aims to reconcile global linear trends, location-dependent spatial variability, and non-linear threshold responses of rainfall to topographic predictors. Differentiated terrain-response features between northern and southern sub-regions are clarified, and model strengths and limitations are compared. Outcomes aim to support extreme-precipitation mechanism research and storm-triggered geological-hazard risk evaluation in North China mountainous terrain.
2. Materials and Methods
2.1. Study Area
Huairou District lies in the transition zone between mountainous northern Beijing and the piedmont plain, with geographic coordinates ranging from 116°17′ E to 116°53′ E and 40°07′ N to 40°47′ N. Its geomorphology is characterized by a general pattern of being high in the north and low in the south, dominated by mountains interspersed with numerous valleys and gullies. The northern part is dominated by medium-low mountains and canyon landforms with rugged, highly fragmented terrain. The southern area consists of piedmont hills and river-valley alluvial zones featuring gentler topography and relatively homogeneous landforms.
The study area has a temperate continental monsoon climate, with extremely uneven intra-annual rainfall distribution. More than 70% of annual precipitation occurs during the flood season from June to September, and short-duration heavy rainfall and successive extreme rain-storm events occur frequently [25,26,27]. Landslides, debris flows and other geological hazards in this region are predominantly triggered by intense rainfall. The spatial distribution of geological hazards is strongly constrained by topographic patterns, and steep slopes and deeply incised gullies represent the main hazard-prone geomorphic units.
2.2. Data Sources and Pre-Processing
Daily rainfall records were obtained from two monitoring networks, including 319 geohazard rain gauges constructed by our institute and 69 meteorological stations provided by the Beijing Meteorological Service. The raw rain-gauge observations and derived terrain attribute samples supporting this study have been archived on Zenodo with the reserved DOI: 10.5281/zenodo.22825239 (https://doi.org/10.5281/zenodo.22825239). Daily rainfall observations spanning 2020–2025 are collected from rain-gauge stations. Stations with >10% missing daily records in any calendar year were excluded. For each valid station, annual total, flood-season (June-September) total, annual maximum daily rainfall, and annual maximum-3-day cumulative rainfall were computed from daily time series. Afterwards, arithmetic multi-year mean values of the four rainfall indicators over 2020–2025 were derived for each station; these multi-year averaged station values served as inputs for subsequent Ordinary Kriging interpolation. For each valid station-year record, annual total, flood-season total, annual maximum daily rainfall, and annual maximum-3-day cumulative rainfall were computed from daily time series. After quality control, the temporal completeness of the retained station-year records generally exceeds 90%. Four rainfall indicators were derived from daily observations: annual rainfall, flood-season rainfall, maximum daily rainfall, and maximum 3-day cumulative rainfall, representing mean background conditions and relative extreme-rainfall characteristics. Extreme rainfall in this study uses site-scale yearly relative maxima rather than uniform regional magnitude thresholds. It should be noted that the extreme-rainfall metrics in this work are derived from site-level annual relative maxima over a limited observation period. These statistical outputs do not represent long-term climatological extreme-rainfall states for the study region.
Modelling samples (n = 927) were extracted from ordinary-Kriging interpolated rainfall grids combined with terrain rasters to support continuous spatial pattern analysis. We acknowledge that grid-derived samples inherit spatial smoothing effects from Kriging interpolation and may introduce pseudo-replication. Therefore, original rain-gauge station observations are further adopted for external validation to assess model performance without interpolation-derived artefacts.
The 0.5 m high-resolution Digital Elevation Model (DEM) and remote sensing imagery were obtained from 21st Century Aerospace Technology Co., Ltd., Beijing, China. It was employed to depict micro-landscape undulations. Pre-processing steps included sink filling, clipping, and noise reduction. Topographic variables including elevation, slope gradient, slope-aspect and terrain ruggedness were extracted. Ruggedness was calculated using a 5 × 5-pixel focal-statistics window; aspect values were reclassified into eight compass directions for zonal comparison.
Auxiliary vector datasets contained Huairou administrative boundaries and geological-hazard-inventory points for boundary clipping [28,29], spatial overlay, and hazard-zone validation. Uniform fishnet sampling points were generated; terrain and rainfall attributes were extracted at sample locations. Samples with null or abnormal values were filtered. Variance-inflation factor (VIF) multicollinearity tests eliminated highly redundant predictors to build a stable modelling dataset [30,31].
Data preprocessing, terrain factor extraction, and spatial interpolation were performed using ArcGIS 10.8 (Esri, Redlands, CA, USA). OLS regression and multiscale geographically weighted regression (MGWR) analysis were implemented via MGWR 2.2 software. Extreme Gradient Boosting (XGBoost) and SHAP interpretability analysis were conducted using Python 3.9 with the xgboost and shap libraries. OriginPro 2022 was used for data statistics and graphical visualization.
2.3. Research Methods
This study adopted a multi-dimensional analytical framework comprising ordinary Kriging spatial interpolation, quadratic-polynomial ordinary least-squares (OLS), multiscale geographically weighted regression (MGWR), and XGBoost-SHAP interpretable machine learning [32]. Single-model approaches are constrained by inherent theoretical assumptions and can only capture partial features of terrain-rainfall associations. Therefore, this multi-method combination is applied to jointly characterize global-scale trends, spatially heterogeneous patterns, and non-linear threshold signals of terrain-rainfall relationships.
2.3.1. Ordinary Kriging
Ordinary Kriging is an optimal unbiased interpolation method based on the spatial correlation of regionalized variables [33]. In this study, this interpolation method serves to convert discrete point-based rain-gauge observations into spatially continuous gridded rainfall datasets, which constitute essential input for subsequent zonal statistics and model-driven analysis across the mountainous study domain. It makes full use of spatial structural features of rainfall observation stations and conforms to the non-linear and autocorrelated geographical characteristics of mountain rainfall spatial interpolation, representing a mainstream technique for fine-scale spatial simulation of mountain precipitation [34]. Its core principle derives from regionalized variable theory: assuming rainfall variables possess spatial correlation and variability, the semivariogram is fitted to characterize spatial structure, and optimal estimates of rainfall values at unknown grid points are obtained [35,36]:
where Z(x0) = predicted rainfall at target grid; Z(xi) = observed rainfall at gauge station I; λi = interpolation weight solved under unbiased-minimum-variance constraints. Semivariogram function:
where γ(h) = semivariance; h = spatial lag distance; N(h) = sample-pair count separated by lag distance h.
In this study, ordinary Kriging was implemented at 30 m spatial resolution. For each rainfall variable, the fitted variogram model, nugget, sill, range, anisotropy setting, and leave-one-out cross-validation errors are summarized in Table A1.
2.3.2. Quadratic-Polynomial Ordinary Least-Squares Regression
Quadratic-polynomial ordinary least-squares regression is an extended form of conventional linear OLS regression [37]. Simple linear regression cannot capture turning-point and threshold-like non-linear behaviors frequently observed in terrain-precipitation relationships. This quadratic-polynomial variant is adopted to quantify global-scale linear and quadratic-curvature responses and provide baseline statistical references for interpreting regional terrain-rainfall patterns. Its formula is expressed as [18,38,39]:
where Y = rainfall-related dependent variable, including annual rainfall, flood-season rainfall, maximum-daily rainfall, and maximum-3-day extreme rainfall; β(0) = model intercept term; β(i) = first-order regression coefficient of each topographic factor, representing linear modulating effects; αI = quadratic-term regression coefficient of each topographic factor, representing non-linear curvature effects; Xi = topographic explanatory variable; ε = model random residual. Note that only elevation includes a quadratic term in this study; slope, sine of aspect, and cosine of aspect enter the model as linear predictors only.
Three core metrics including coefficient of determination (R2), mean absolute error (MAE), and root-mean-square error (RMSE) were used to comprehensively evaluate model-fitting performance and explanatory capacity [31]. The calculation formulas are as follows:
where yi = observed rainfall value; = model-predicted rainfall value; = sample-mean rainfall value; n = total number of valid samples. Values of R2 closer to 1 and smaller MAE and RMSE values indicate better model-fitting quality and stronger explanatory ability.
All explanatory topographic predictors were centered prior to quadratic-polynomial OLS fitting.
2.3.3. Multiscale Geographically Weighted Regression (MGWR)
MGWR breaks the spatial-stationarity assumption of conventional global-regression models. Unlike classic Geographically Weighted Regression (GWR), which uses a single uniform bandwidth for all predictors, MGWR assigns variable-specific spatial bandwidths. This capability allows us to detect location-dependent topographic modulating effects that homogeneous global regression models cannot capture, revealing spatial-differentiation patterns between northern and southern mountainous zones in Huairou [40,41]. The model formula is [42,43]:
where (ui, vi) = planar coordinate of sample point i; βi0 = local intercept term; βij (ui, vi) = local regression coefficient of the j-th topographic factor at sample point i; Xij = corresponding topographic-factor value; εi = local residual term.
2.3.4. XGBoost-SHAP
Extreme Gradient Boosting (XGBoost) is an efficient ensemble machine-learning algorithm. Regression-based approaches struggle to resolve complex non-linear patterns and multi-factor interactions. We therefore couple XGBoost with SHAP interpretation as a complementary tool: XGBoost identifies piecewise threshold behaviors, and SHAP addresses the machine-learning black-box issue by generating factor-contribution metrics comparable to regression outputs. With strong non-linear-fitting and anti-noise performance, this framework captures threshold and interaction effects that linear-family models cannot reproduce [44,45,46,47]. The model prediction formula is [48,49]:
where T = total number of decision trees; ft = function corresponding to a single regression tree; F = function set of all decision trees; Xi = input feature set of topographic factors. To address the “black-box” limitation of machine-learning outputs and improve result interpretability, SHAP (SHapley Additive exPlanations) interpretability theory was introduced. SHAP quantifies the contribution and response mechanisms of individual factors based on game theory. Its core formula is [32]:
where φj = SHAP contribution value of the j-th topographic factor; p = total count of features; S = random feature subset; f(S) = model-predicted output corresponding to feature subset S.
3. Results
3.1. Spatial Patterns of Topography and Rainfall
3.1.1. Spatial Distribution of Topographic Factors
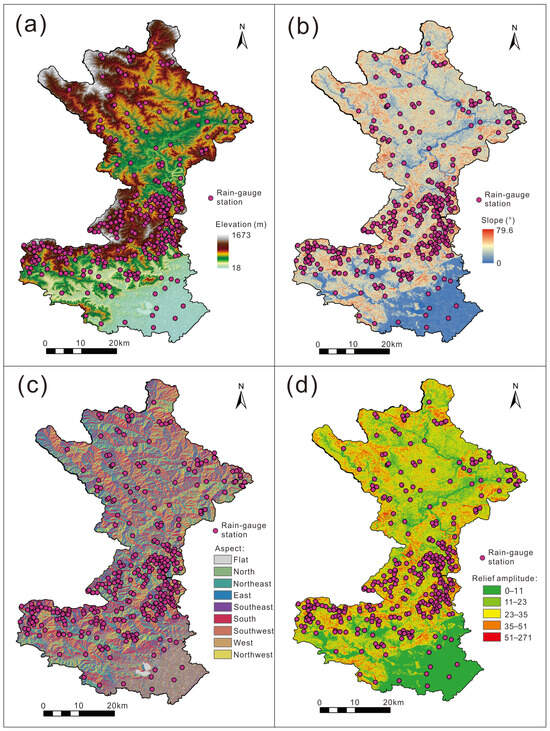
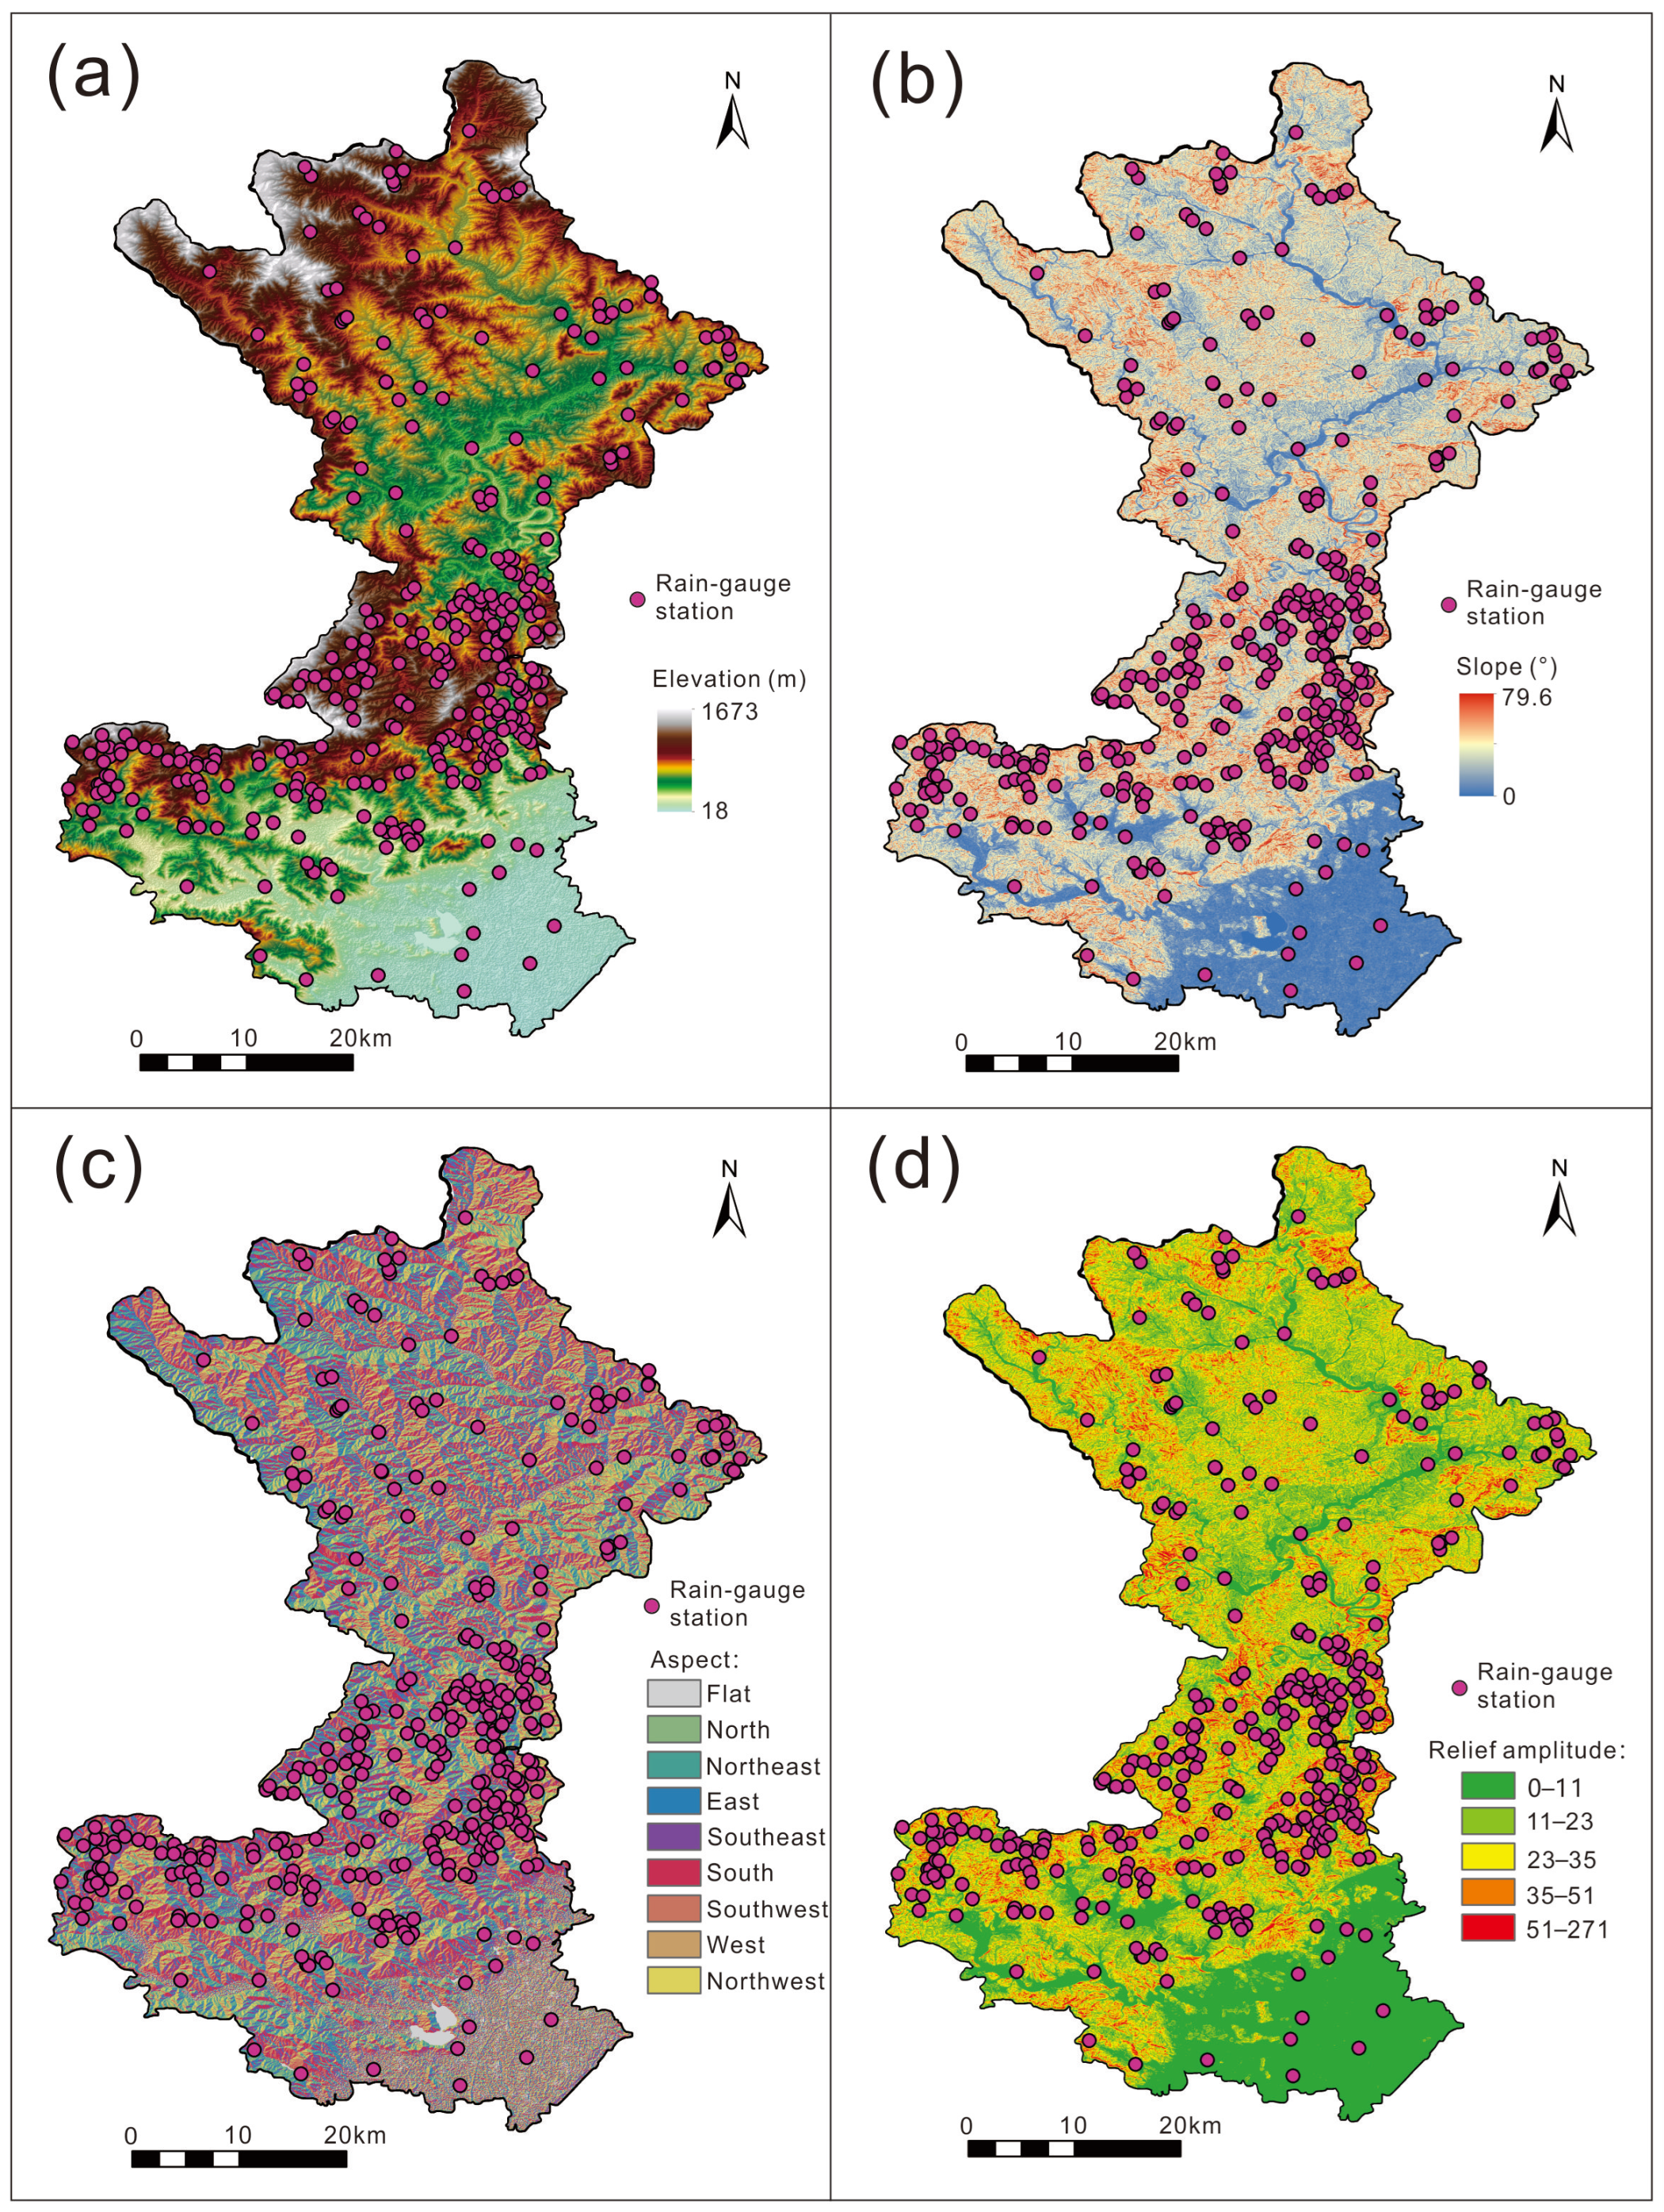
The study area belongs to the layered-stepped geomorphology on the southern foot of the Yanshan Mountains. Elevation presents a spatial pattern of “south-low → middle-high → sub-low → north-high”. The central and northern mountainous parts feature fragmented terrain with strong undulation, while the southern piedmont and central-northern valley-basin areas have gentle terrain with relatively uniform landforms. Slope-aspect orientations are spatially well-distributed with interleaved slope directions across the whole domain, providing fundamental geomorphic conditions for spatial differentiation of orographic rainfall (Figure 1).
Figure 1.
Spatial distribution of topographic factors in Huairou District. (a) Elevation; (b) Slope gradient; (c) Aspect; (d) Terrain ruggedness.
3.1.2. Spatial Patterns for Multi-Type Rainfall
Kriging interpolation outputs reveal obvious spatial discrepancies in spatial-distribution patterns for different rainfall types in Huairou District. To highlight such spatial heterogeneity and combined with local topographic conditions, the study area was divided into northern and southern sub-regions bounded by the main watershed divide.
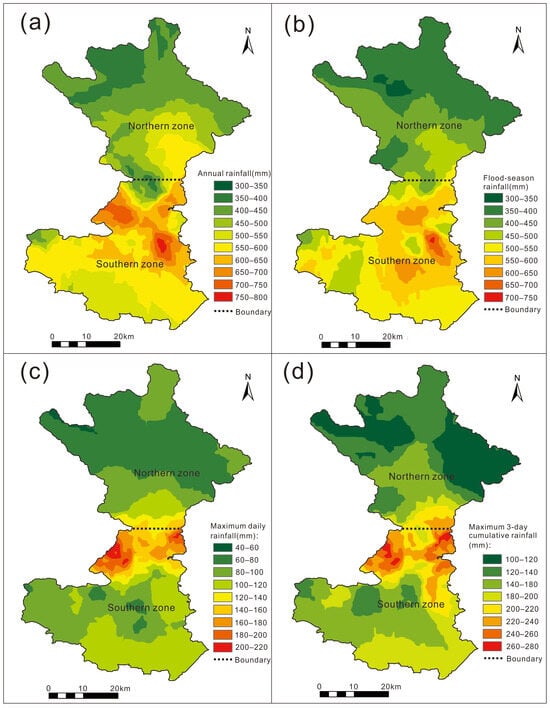
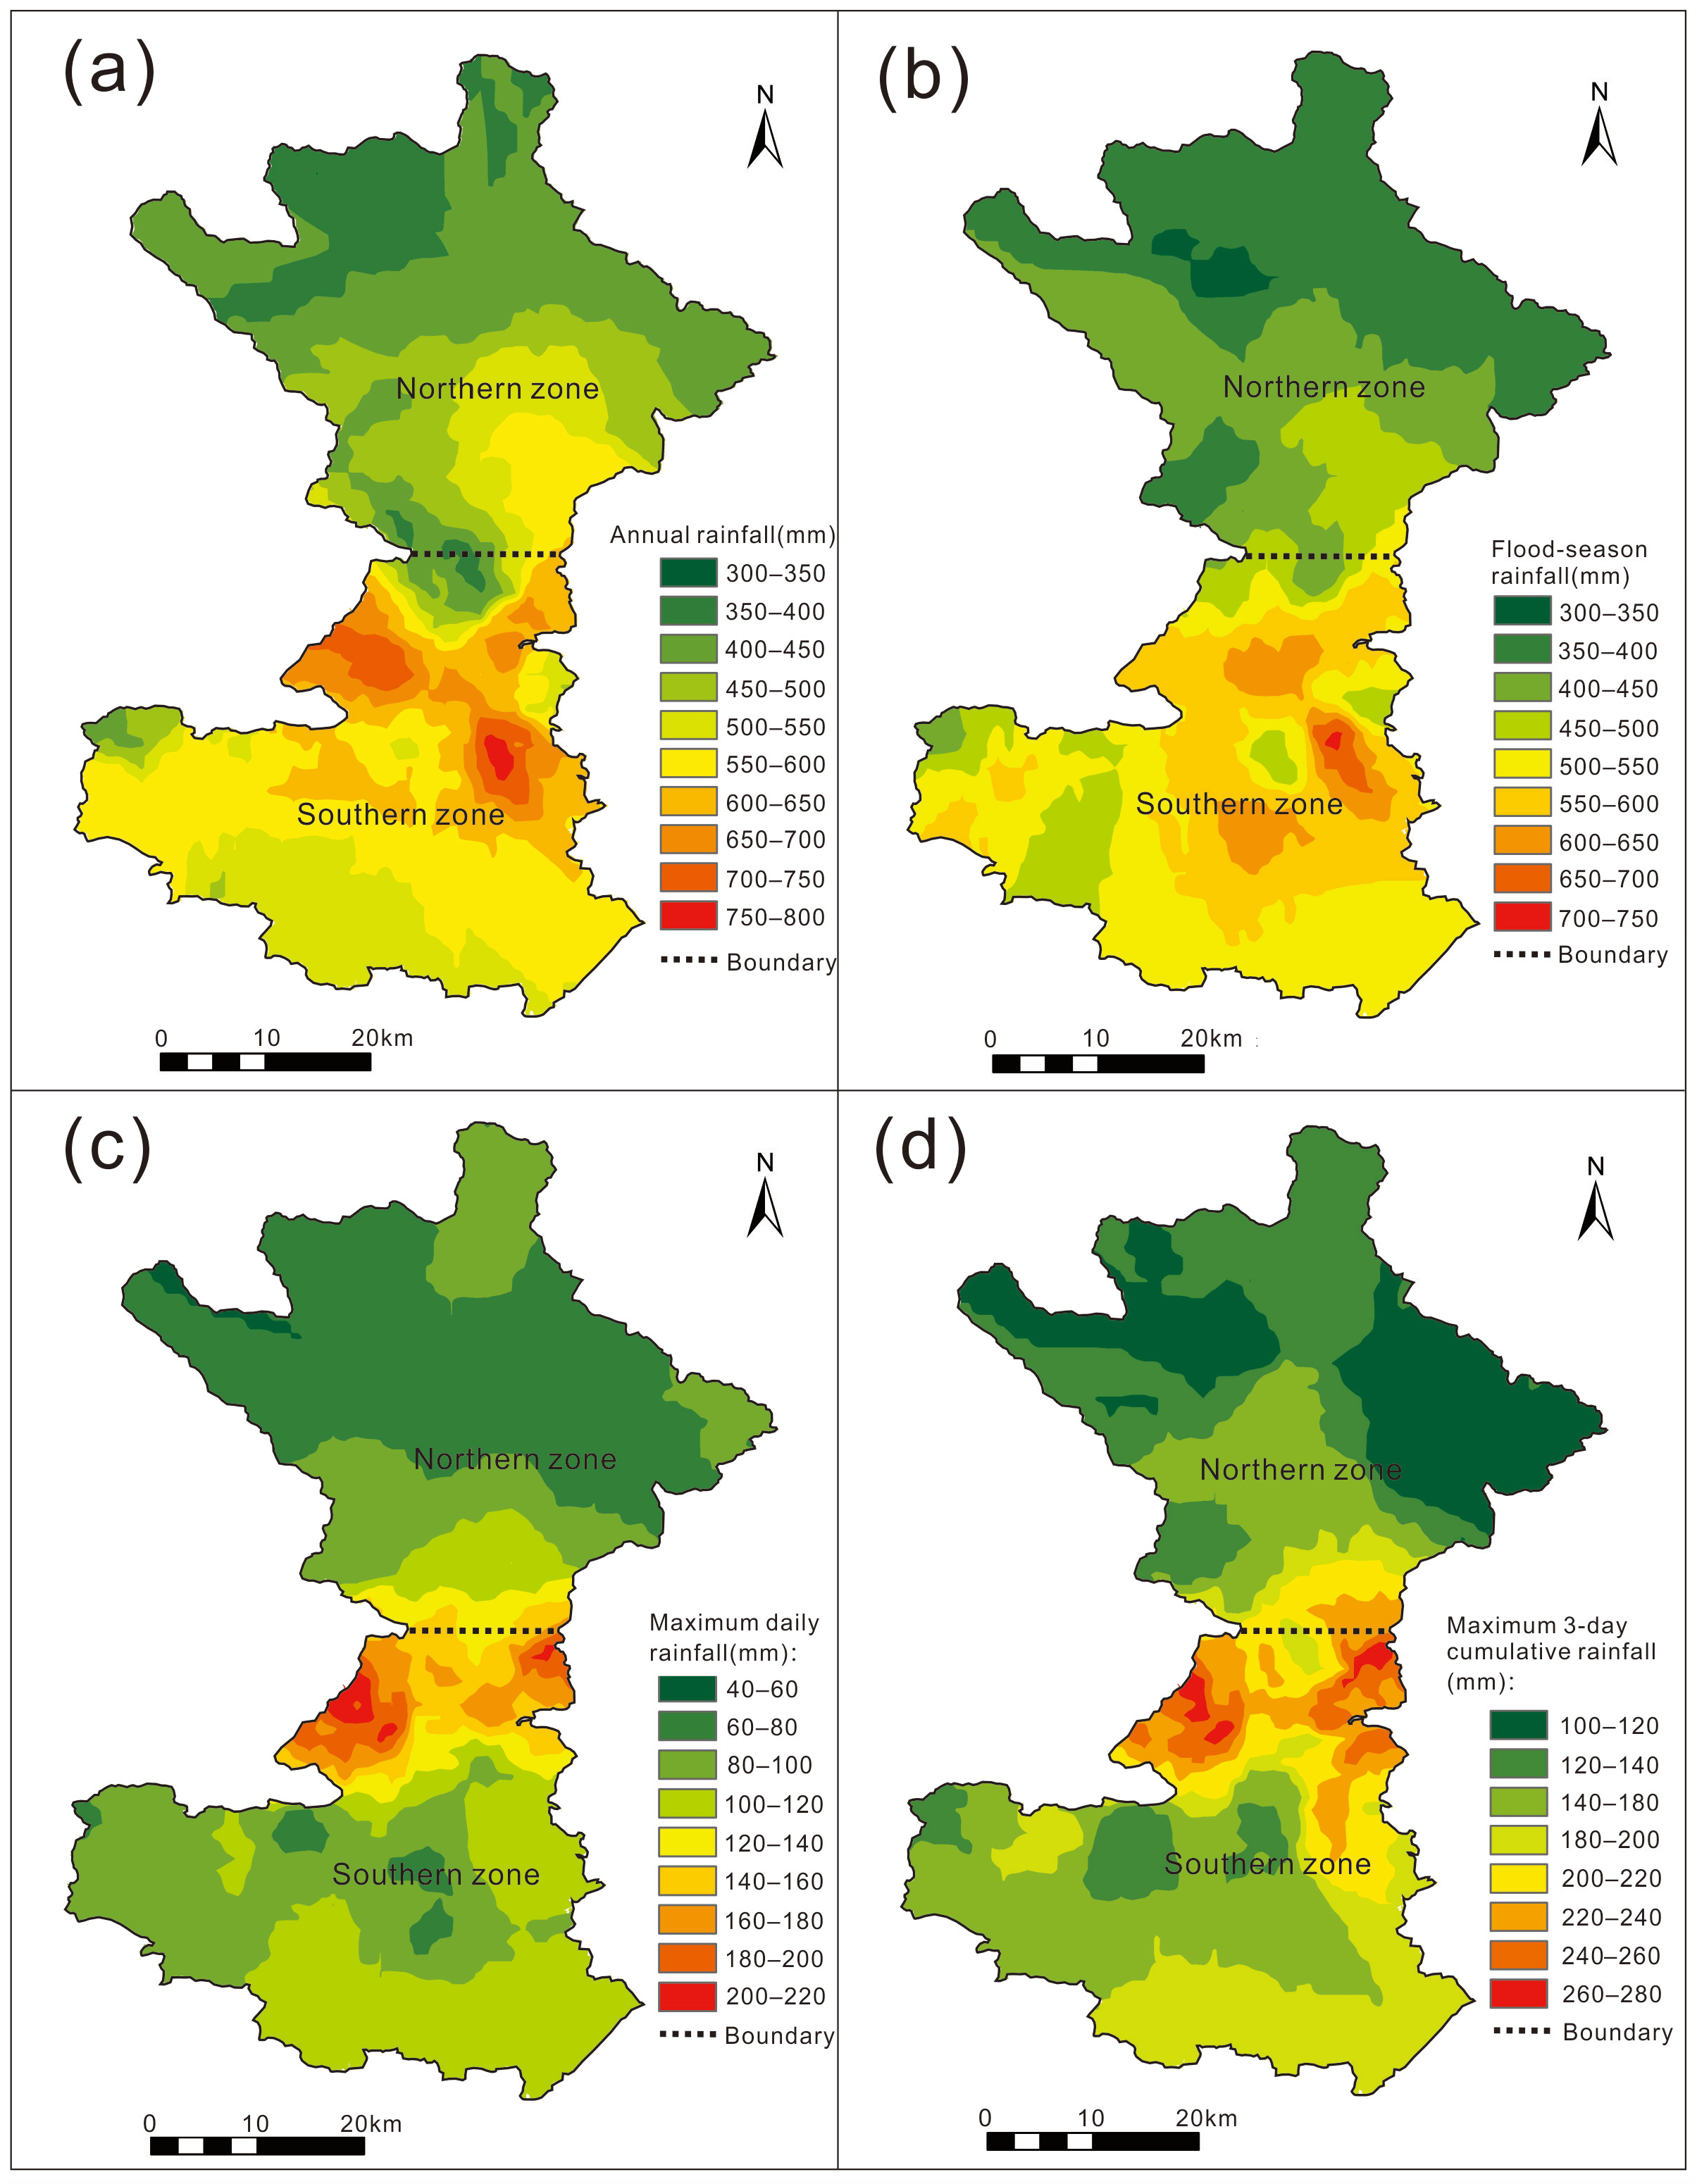
Spatial patterns of annual rainfall and flood-season rainfall are largely consistent. Both exhibit completely opposite layouts between the south and the north: rainfall increases towards the north within the southern zone, whereas rainfall decreases towards the north within the northern zone.
Extreme-rainfall indicators, including maximum-daily rainfall and maximum-3-day cumulative rainfall, show prominent spatial clustering. High-value extreme-rainfall zones are highly concentrated in high-elevation geomorphic units on the northern side of the southern sub-region. By contrast, extreme-rainfall intensities are generally low over gentle southern piedmont areas and across most of the northern zone. Compared with conventional rainfall, extreme rainfall displays stronger spatial heterogeneity and is more dependent upon local micro-topographic patterns (Figure 2).
Figure 2.
Spatial distribution patterns of rainfall with different durations in Huairou District. (a) Annual rainfall; (b) Flood-season rainfall; (c) Maximum-daily rainfall; (d) Maximum-3-day rainfall.
3.2. Global-Scale Responses from Quadratic-Polynomial OLS Regression
Five indicators, namely elevation, slope gradient, sine of aspect, cosine of aspect, and terrain ruggedness, were adopted to characterize topographic conditions. Multicollinearity diagnostics via the variance inflation factor (VIF) identified strong multicollinearity between slope gradient and terrain ruggedness (VIF > 10). Therefore, terrain ruggedness was eliminated from regression modelling, and slope gradient was retained to represent slope-steepness effects, so as to remove multicollinearity interference and guarantee reliable regression results [30,31].
Bounded by the watershed divide, the study area was split into southern and northern sub-regions containing 444 and 483 grid-sampling points, respectively. Descriptive statistics demonstrate distinct natural-condition differences between the two sub-regions (Table 1). In terms of rainfall, mean values of annual rainfall, flood-season rainfall, maximum-daily rainfall, and maximum-3-day rainfall in the southern zone are markedly higher than those in the northern zone. The southern zone receives more overall rainfall and experiences stronger extreme-storm intensity. In terms of topography, the northern zone possesses higher mean elevation and steeper mean slope; the southern zone shows stronger discrete variation in elevation, with interleaved gullies and steep slopes. Mean values of sine-aspect and cosine-aspect indicate that slopes in both sub-regions deviate slightly toward the west, and north-south slope orientations are relatively balanced. In summary, the watershed divide triggers systematic differentiation of hydrometeorological and topographic backgrounds between north and south. Rainfall spatial differences are the most prominent, accompanied by secondary topographic disparities. Background conditions for geological-hazard influencing factors differ evidently between the two zones, which justifies separate OLS regression for the northern and southern sub-regions.
Table 1.
Descriptive statistics of variables.
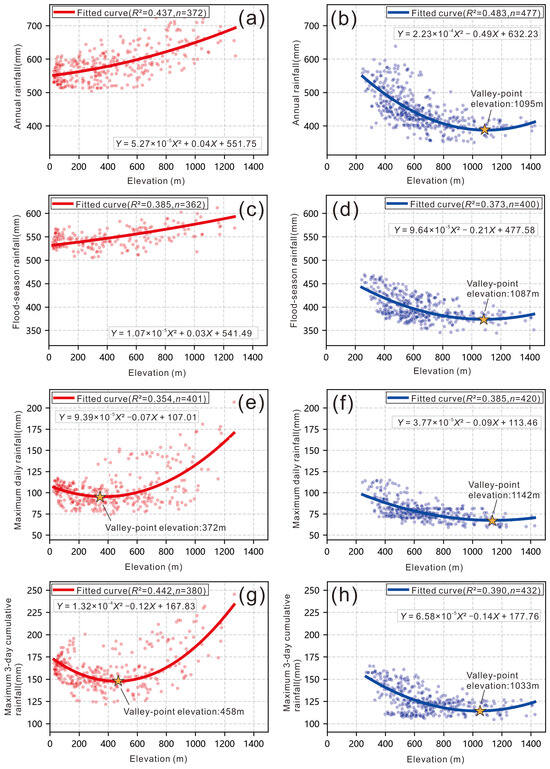
Quadratic-polynomial OLS regression results reveal divergent elevation-rainfall correlation patterns across sub-regions. In the southern zone, annual and flood-season rainfall increase continuously with rising elevation (Figure 3a,c). Maximum-daily and maximum-3-day rainfall follow U-shaped curves, with rainfall inflection points concentrated at 372–458 m mid-low elevations; extreme rainfall rises distinctly once elevation exceeds the inflection-point altitude (Figure 3e,g).
Figure 3.
Quadratic polynomial OLS fitting characteristics of rainfall and elevation in northern and southern zones. (a,b) Annual rainfall; (c,d) Flood-season rainfall; (e,f) Maximum-daily rainfall; (g,h) Maximum-3-day rainfall. Red curves and red dots = southern zone; blue curves and blue dots = northern zone.
All four rainfall variables in the northern zone exhibit U-shaped curves. Rainfall valley-point elevations cluster within the 1033–1142 m mid-high-elevation interval. Rainfall decreases as elevation rises below the valley-point elevation and rebounds moderately above this threshold. Valley-point elevations for annual rainfall, flood-season rainfall and maximum-3-day rainfall are close to one another, indicating highly consistent terrain-response behaviors (Figure 3b,f,h). Maximum-daily rainfall corresponds to the highest valley-point elevation and presents unique elevation-response characteristics (Figure 3d).
Coefficient of determination R2 values for all fitted models range from 0.354 to 0.483. Among the considered topographic predictors, elevation plays a central role in driving north-south rainfall differentiation across Huairou. Slope gradient exerts stable positive modulating effects on rainfall across the whole northern zone, while linear slope influences remain generally weak in the southern zone (Table 2 and Table 3). Nevertheless, global-model fitting performance for extreme-rainfall variables is relatively poor, and global contributions of topographic factors are low. This further confirms that terrain controls on extreme rainfall do not follow spatially homogeneous global rules. Hence, spatially refined regression and machine-learning models are required for deeper mechanistic interpretation.
Table 2.
Fitting results of global OLS regression parameters (Southern Zone).
Table 3.
Fitting results of global OLS regression parameters (Northern Zone).
3.3. Multiscale Non-Linear Coupling Mechanisms Between Rainfall and Topographic Factors Based on MGWR and XGBoost-SHAP
3.3.1. Model Performance and Reliability Analysis
MGWR and XGBoost both reproduced rainfall variations across northern and southern Huairou but exhibited distinct fitting characteristics (Table 4). As a spatially-linear regression tool, MGWR yielded R2 of 0.757–0.831 for northern-zone rainfall. In the gentler-terrain southern zone, its fitting performance declined for annual and flood-season rainfall (R2 = 0.540 and 0.456), while fitting improved for extreme-rainfall variables. To avoid the potential bias from Kriging-derived grid samples, all models were additionally validated against original rain-gauge station observations using leave-station-out cross-validation. Corresponding station-scale evaluation metrics are summarized in Table 5. Consistent with expectations, station-based validation produces lower goodness-of-fit and larger error values compared with grid-sample results in Table 4. For each validation fold, the held-out station was excluded from Kriging surface generation, ensuring out-of-sample evaluation. This discrepancy reflects the removal of interpolation-induced spatial smoothing and pseudo-replication effects, providing more realistic performance benchmarks for our modelling outputs.
Table 4.
Prediction performance of MGWR and XGBoost models for various rainfall indicators *.
Table 5.
Leave-station-out cross-validation performance of MGWR and XGBoost.
Under leave-station-out validation (Table 5), the performance gap between MGWR and XGBoost is reduced. The decline of model performance from grid fitting to station-scale validation suggests moderate overfitting when models are trained on interpolated grid data. MGWR suits analysis of spatially-varying linear effects; XGBoost better resolves non-linear thresholds and factor interactions; combining both delivers comprehensive mechanistic insights.
3.3.2. Spatial-Scale Characteristics Derived from MGWR
The MGWR model was calibrated under the CGCS2000/3° Gauss-Kruger projected coordinate system using a Gaussian kernel with adaptive nearest-neighbor bandwidth. A minimum-neighbor threshold of 80 was set to avoid unstable coefficient estimates and unreliable t-statistics caused by undersized local neighborhoods. Variable-specific optimal bandwidths were obtained by golden-section search minimizing the corrected Akaike information criterion (AICc). Local t-statistics were calculated to evaluate point-wise coefficient significance, and Global Moran’s I was applied to model residuals to detect post-fitting spatial autocorrelation [50,51]. For Global Moran’s I tests on model residuals, a k-nearest-neighbor spatial-weight matrix (k = 8) with row-standardized weights was adopted. Statistical significance was assessed via a Monte-Carlo permutation test with 199 permutations [52,53]. Model-level fitting performance is reported in Table 4; residual spatial autocorrelation results are summarized in Table 6. Full calibration details (bandwidths, t-statistic summaries, significance percentages) are given in Table A2 (Appendix A).
Table 6.
MGWR model-level fitting diagnostics and residual spatial autocorrelation statistics.
Residual Moran’s I statistics for all MGWR sub-models are presented in Table 6. All residual tests remain statistically significant (p < 0.001), with residual Moran’s I values ranging from 0.78 to 0.93. This indicates that, although MGWR captures spatially-varying terrain-rainfall relationships, considerable spatial structure still exists within model residuals. The remaining autocorrelation most likely originates from unaccounted local meteorological processes, such as convective triggering, storm trajectories, and valley-scale local circulations, which are not represented by the static topographic predictors used in this terrain-driven modelling framework.
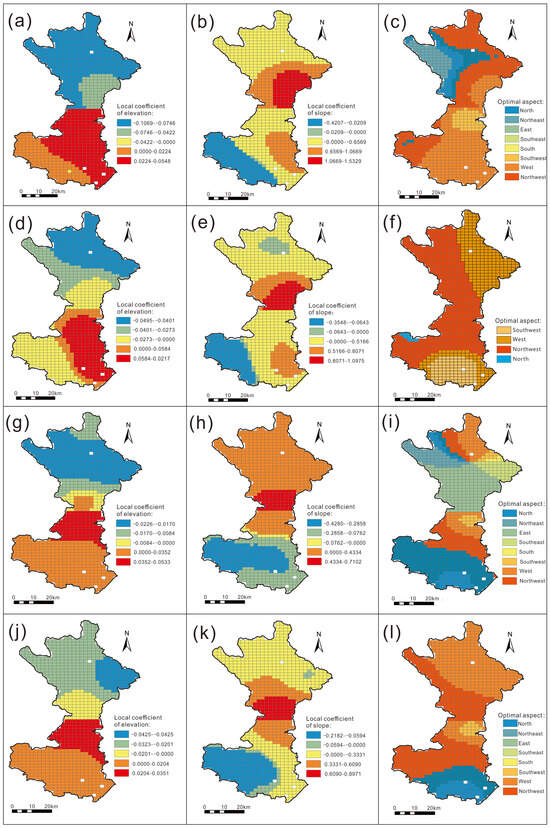
MGWR local-coefficient maps revealed strong spatial non-stationarity for topographic predictors (Figure 4). Elevation coefficients were mostly negative in the north and positive in the south for annual rainfall (Figure 4a), flood-season rainfall (Figure 4d), and maximum-3-day rainfall (Figure 4j). For maximum-daily rainfall, negative elevation effects dominated most northern areas, with positive contributions limited to small central-southern patches (Figure 4g). Slope exerted positive influences over eastern-southern parts and negative effects in the southwest; its positive footprint was broader for maximum-daily rainfall (Figure 4h). Flood-season rainfall (Figure 4e) and maximum-3-day rainfall (Figure 4k) shared similar slope-coefficient spatial patterns. Slope-aspect effects were secondary relative to elevation and slope. West-facing aspects exerted relatively greater influence for flood-season rainfall (Figure 4f) and maximum-3-day rainfall (Figure 4l). Annual-rainfall aspect preferences differed between north and south (Figure 4c), while maximum-daily rainfall showed a clear north-south divide in aspect responses (Figure 4i). Long-duration cumulative rainfall resembled flood-season patterns, whereas short-duration daily extreme rainfall displayed unique terrain responses. It should be noted that these local regression coefficients reflect conditional statistical associations conditioned solely on static terrain predictors.
Figure 4.
Spatial patterns of local MGWR regression coefficients for each topographic factor ((a–c): annual rainfall; (d–f): flood-season rainfall; (g–i): maximum daily rainfall; (j–l): maximum 3-day rainfall).
3.3.3. Non-Linear Responses via XGBoost-SHAP
Feature Importance Ranking
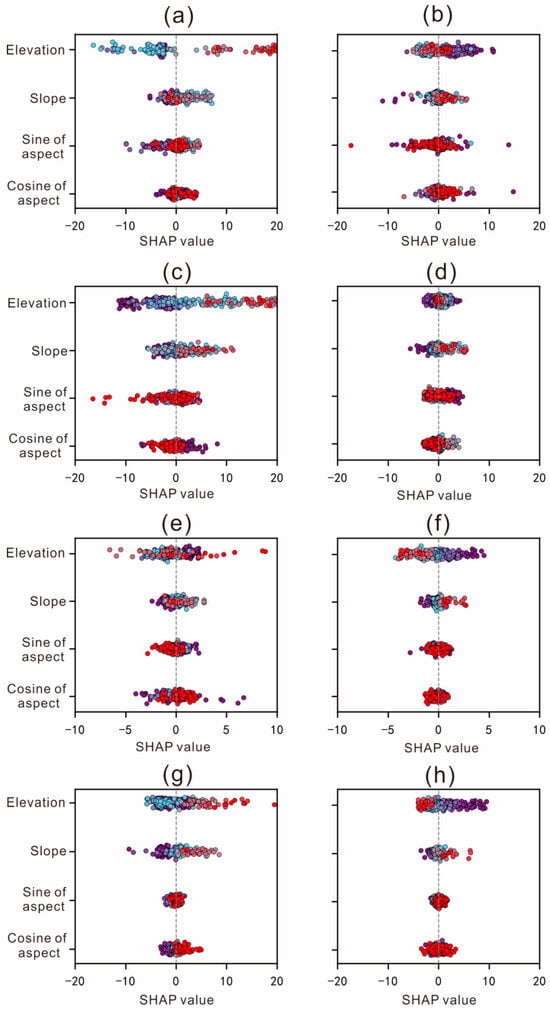
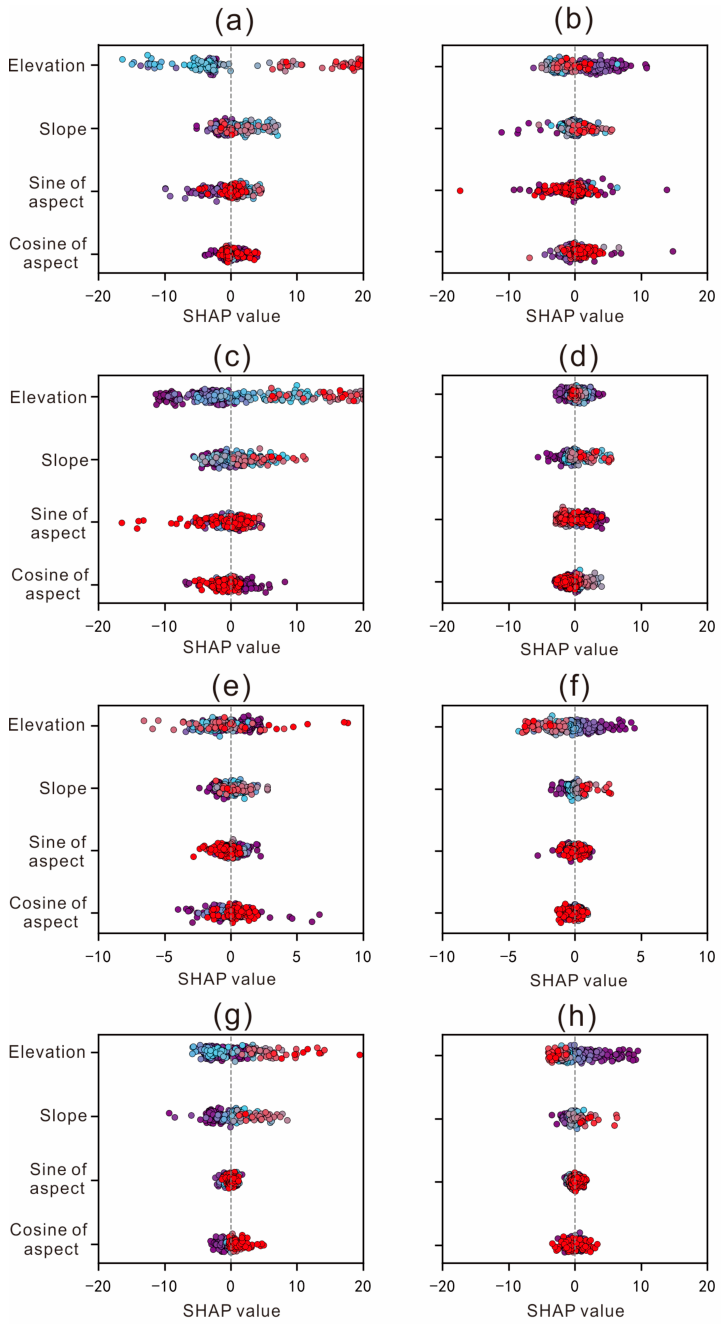
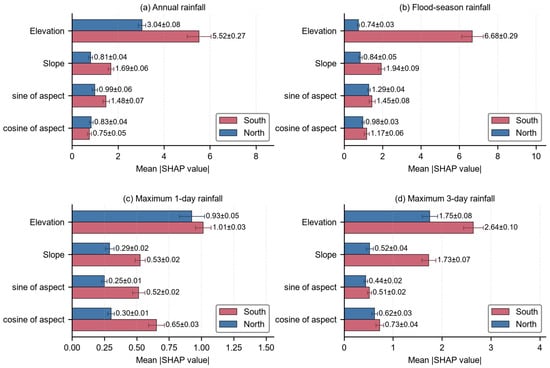
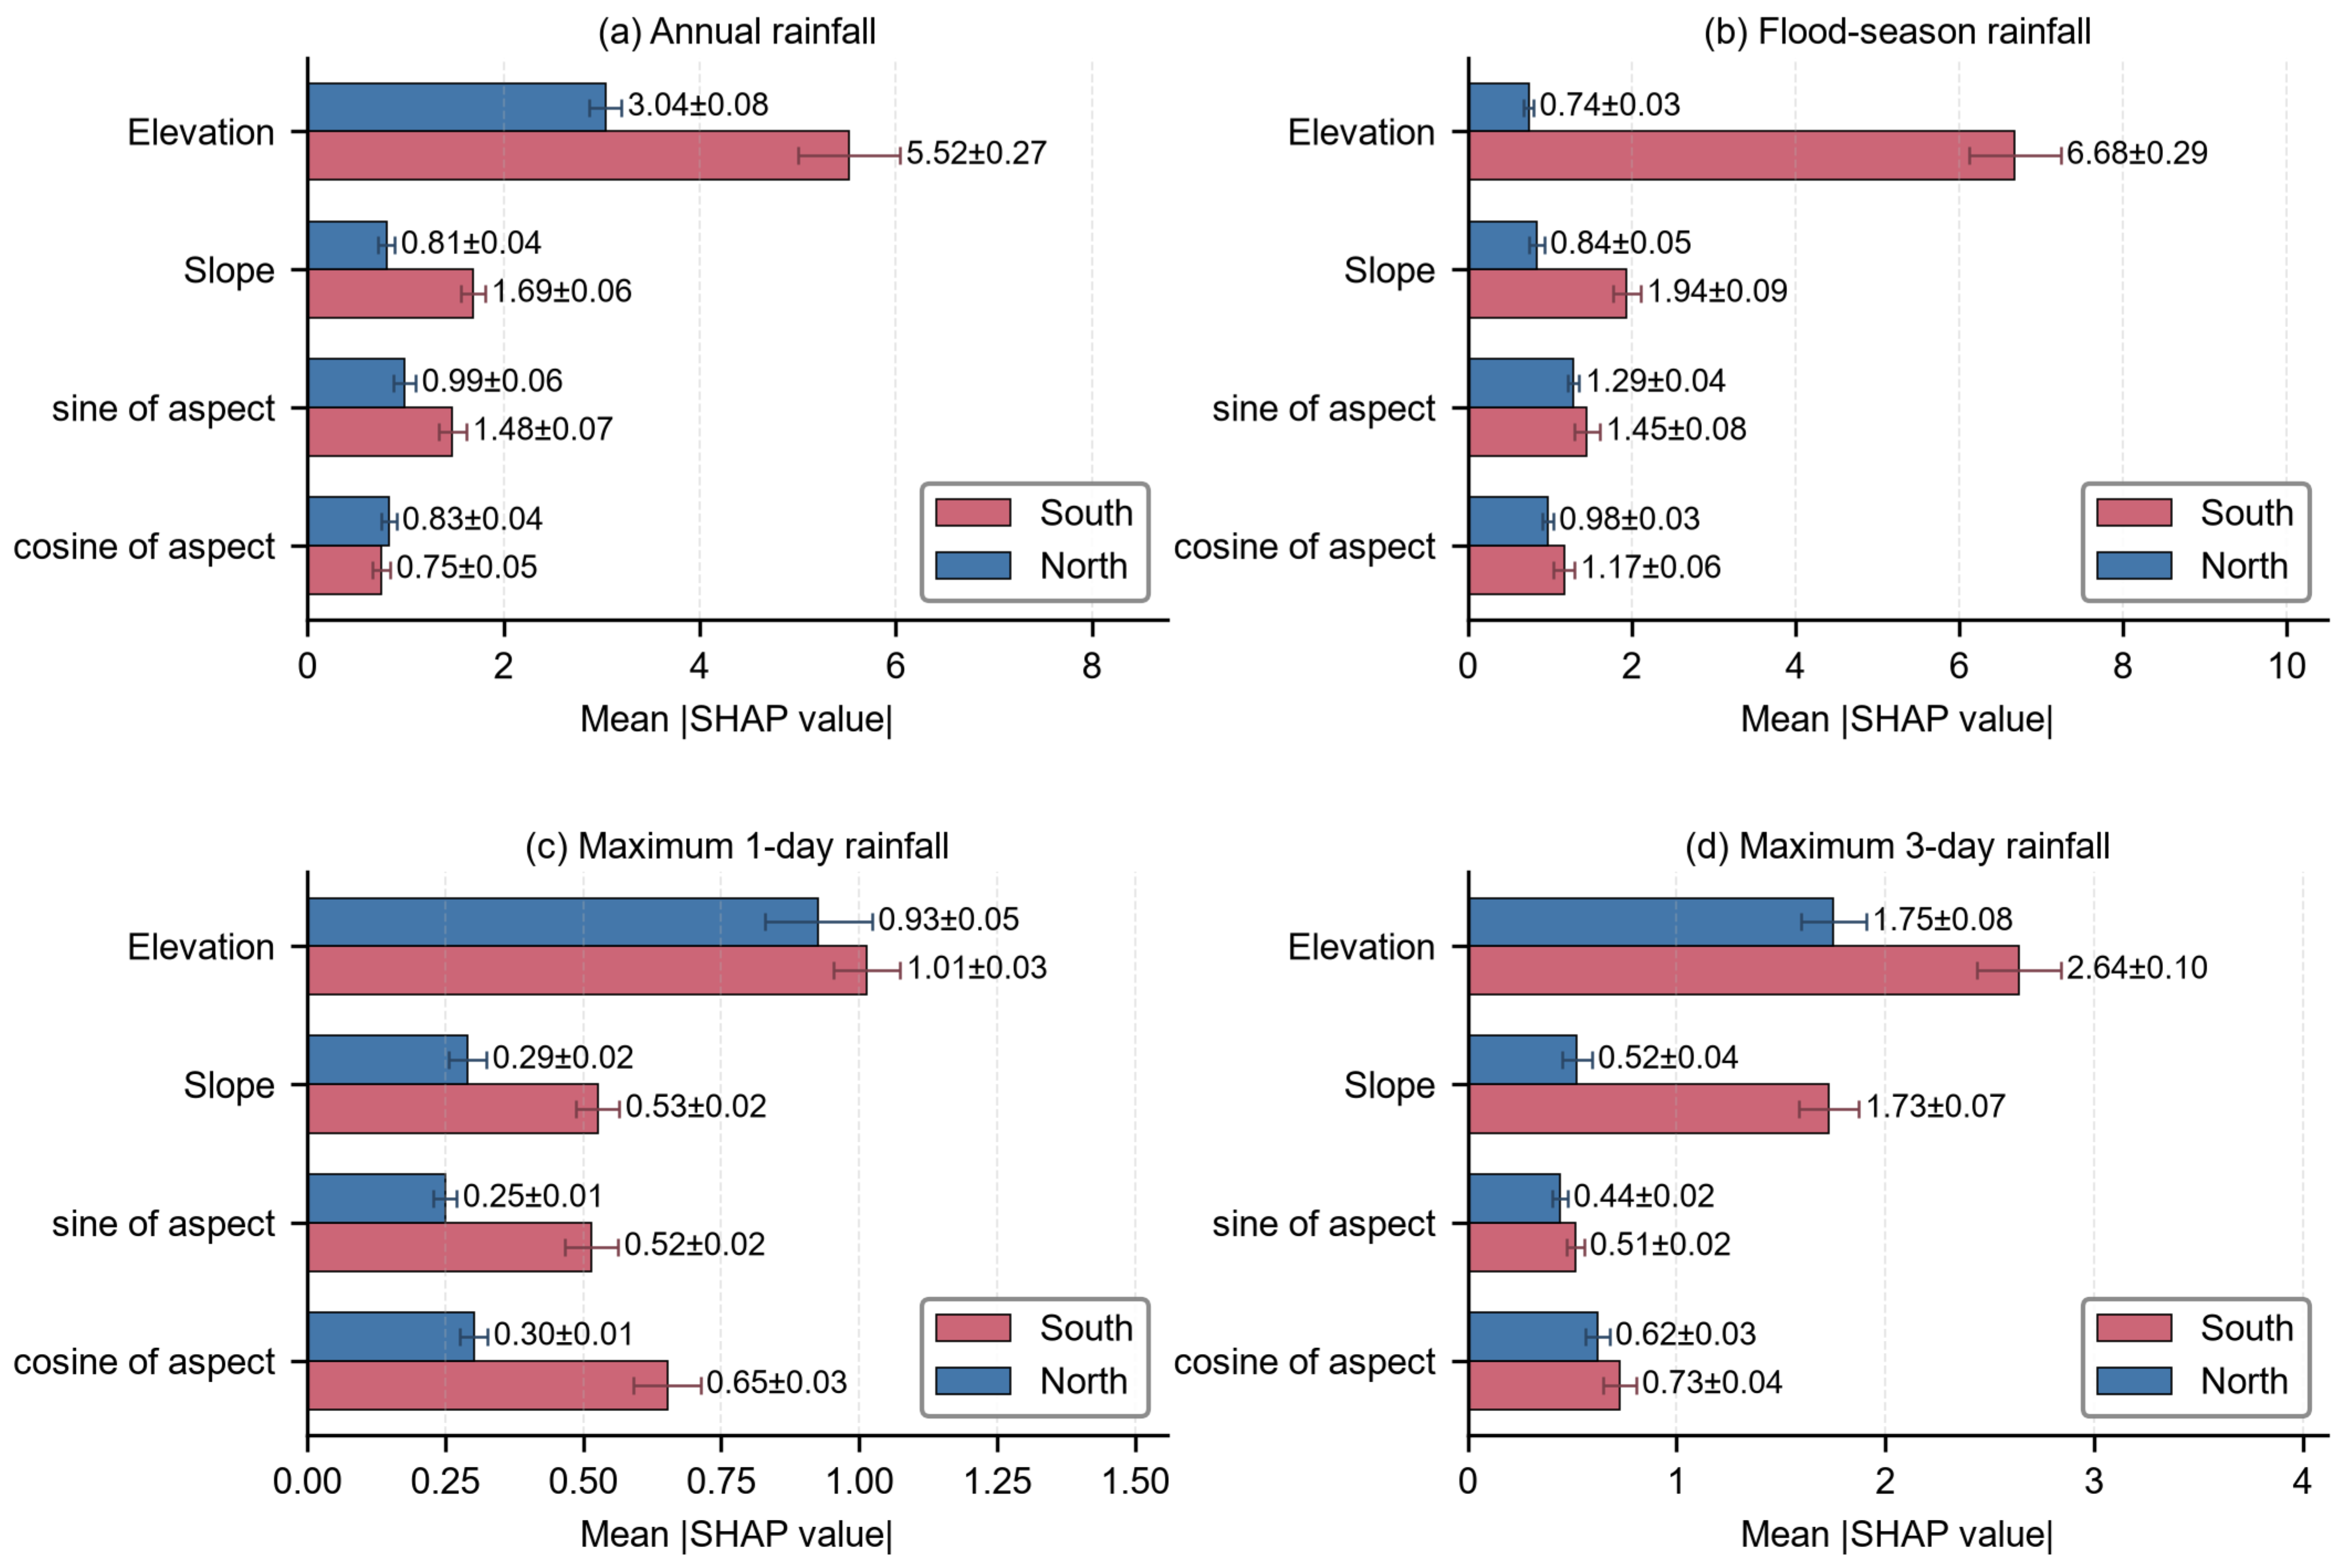
The SHAP beeswarm plot (Figure 5) illustrates sample-level SHAP distributions and positive-negative contribution directions for topographic predictors. Elevation and slope constitute the primary controls on rainfall spatial patterns in both zones, whereas slope-aspect exerts only weak local modulation. To obtain quantitative, uncertainty-aware feature-importance rankings, mean absolute SHAP values were computed over leave-station-out cross-validation folds (Figure 6), with 95% confidence intervals (1.96 × SEM) plotted as error bars. Quantitatively, elevation is the dominant driver for annual and flood-season rainfall, especially within the southern zone, followed by slope; sine and cosine of aspect show comparatively weaker effects. For maximum-daily and maximum-3-day extreme rainfall, elevation and slope still dominate, yet the north-south contrast in factor importance weakens.
Figure 5.
SHAP value analysis of each topographic factor (Subplots (a,c,e,g) represent the southern zone for annual rainfall, flood-season rainfall, maximum daily rainfall, and maximum three-day rainfall, respectively; subplots (b,d,f,h) represent the northern zone for annual rainfall, flood-season rainfall, maximum daily rainfall, and maximum three-day rainfall, respectively). The colour gradient of dots denotes the magnitude of the corresponding topographic predictor value.
Figure 6.
Mean absolute SHAP values of topographic predictors for four rainfall indicators in the northern and southern zones. Error bars represent 95% confidence intervals calculated as 1.96 × SEM based on leave-station-out cross-validation (LOOCV).
For annual rainfall in the southern zone, elevation shows the broadest spread of SHAP values with obvious divergence between positive and negative contributions across individual samples, followed by slope; sine and cosine of aspect exhibit comparatively limited contribution amplitudes (Figure 5a). These sample-scale observations are consistent with the overall importance hierarchy derived from Figure 6a. For northern-zone annual rainfall, elevation yields large SHAP-value fluctuations, and slope contributions also display stronger sample-to-sample dispersion than in the south. Sine and cosine of aspect produce prominent contributions only at a subset of sampling sites, despite their low overall importance according to Figure 6.
Terrain-modulation effects are more pronounced for flood-season rainfall. In the southern zone, elevation presents wide-ranging positive sample-level SHAP responses, consistent with its top-ranked importance in Figure 6b. Slope forms the secondary positive- modulating gradient, whereas the two aspect-related factors have narrower contribution intervals (Figure 5c). In the northern zone, elevation dominates sample-level SHAP variation; slope-driven divergence ranks second, and sine of aspect shows larger local modulation amplitudes than cosine of aspect, even though both aspect variables remain less important globally (Figure 5d).
Distinct sample-level terrain-response patterns emerge for short-duration maximum-daily extreme rainfall. In the southern zone, elevation SHAP values span a wide range from negative to positive with notable extreme individual-sample contributions, and slope presents moderate-amplitude contribution gradients, while cosine of aspect covers a broader influence range than sine of aspect (Figure 5e). In the northern zone, elevation contributions are generally negative across samples, and orographic rainfall-enhancement signals for windward terrain become apparent. Positive slope contributions concentrate over certain samples, and sine of aspect outperforms cosine of aspect in local modulation intensity (Figure 5f).
Multi-day cumulative extreme rainfall shows relatively stable sample-level patterns. For southern-zone maximum-3-day rainfall, elevation SHAP values are predominantly positive with wide distribution, matching its leading importance shown in Figure 6d. Slope acts as the secondary driver at the sample level, and cosine-of-aspect contributions exhibit greater dispersion than sine-of-aspect (Figure 5g). In the northern zone, elevation SHAP outputs are heavily concentrated; slope shows obvious divergence of positive contributions, and sine of aspect delivers stronger local modulation for persistent extreme rainfall relative to cosine of aspect, with both retaining low global importance (Figure 5h).
Interactive-Influence Analysis of Topographic Factors
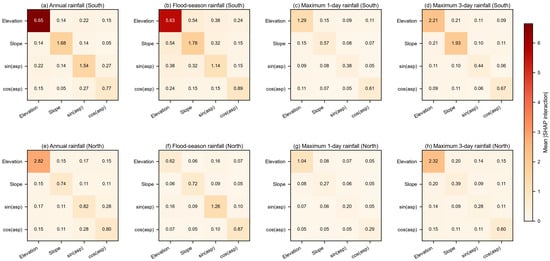
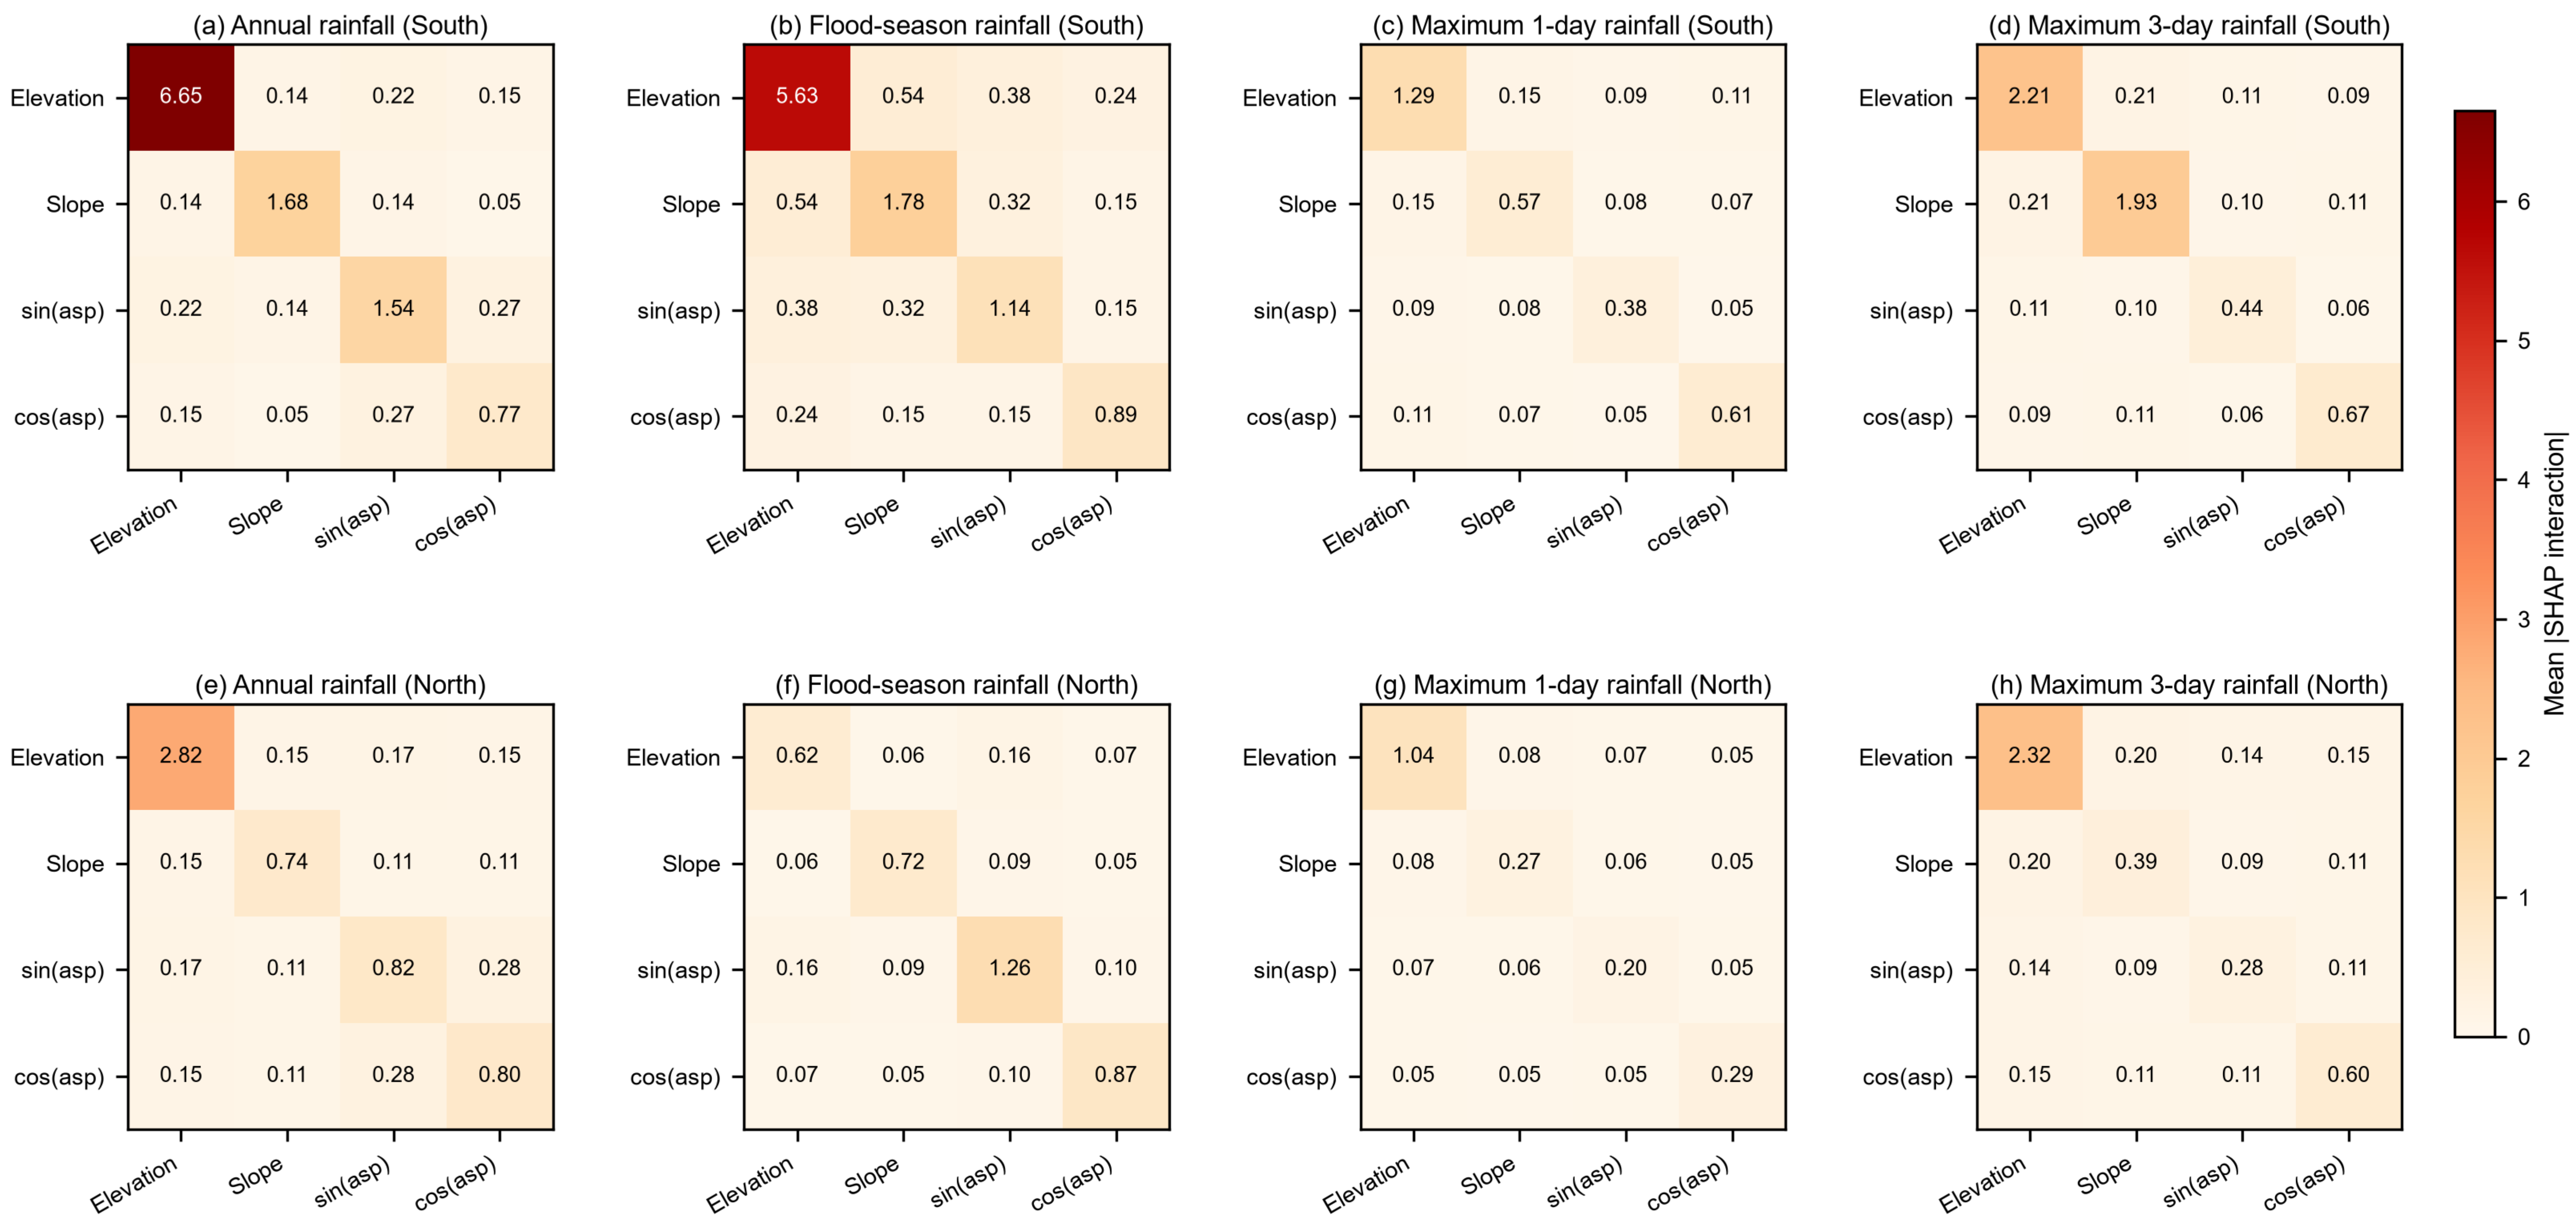
Pairwise statistical interactions and main effects among topographic predictors are quantified by mean absolute SHAP interaction values (Figure 7). Diagonal matrix elements represent the main effect of each individual predictor, whereas off-diagonal entries reflect pairwise statistical interaction strength between two terrain variables. Elevation exhibits the strongest main effect for annual and flood-season rainfall in the southern zone, while its main-effect magnitude decreases obviously in the northern zone. By comparison, off-diagonal values remain generally low across all rainfall indices, which indicates that terrain-rainfall associations are predominantly governed by individual main effects rather than strong pairwise interactive coupling.
Figure 7.
Heatmaps of mean absolute SHAP interaction values for terrain predictors across four rainfall metrics in southern and northern zones. Subplots (a–d) correspond to annual rainfall, flood-season rainfall, maximum 1-day rainfall and maximum 3-day rainfall in the southern zone; subplots (e–h) show the corresponding results for the northern zone.
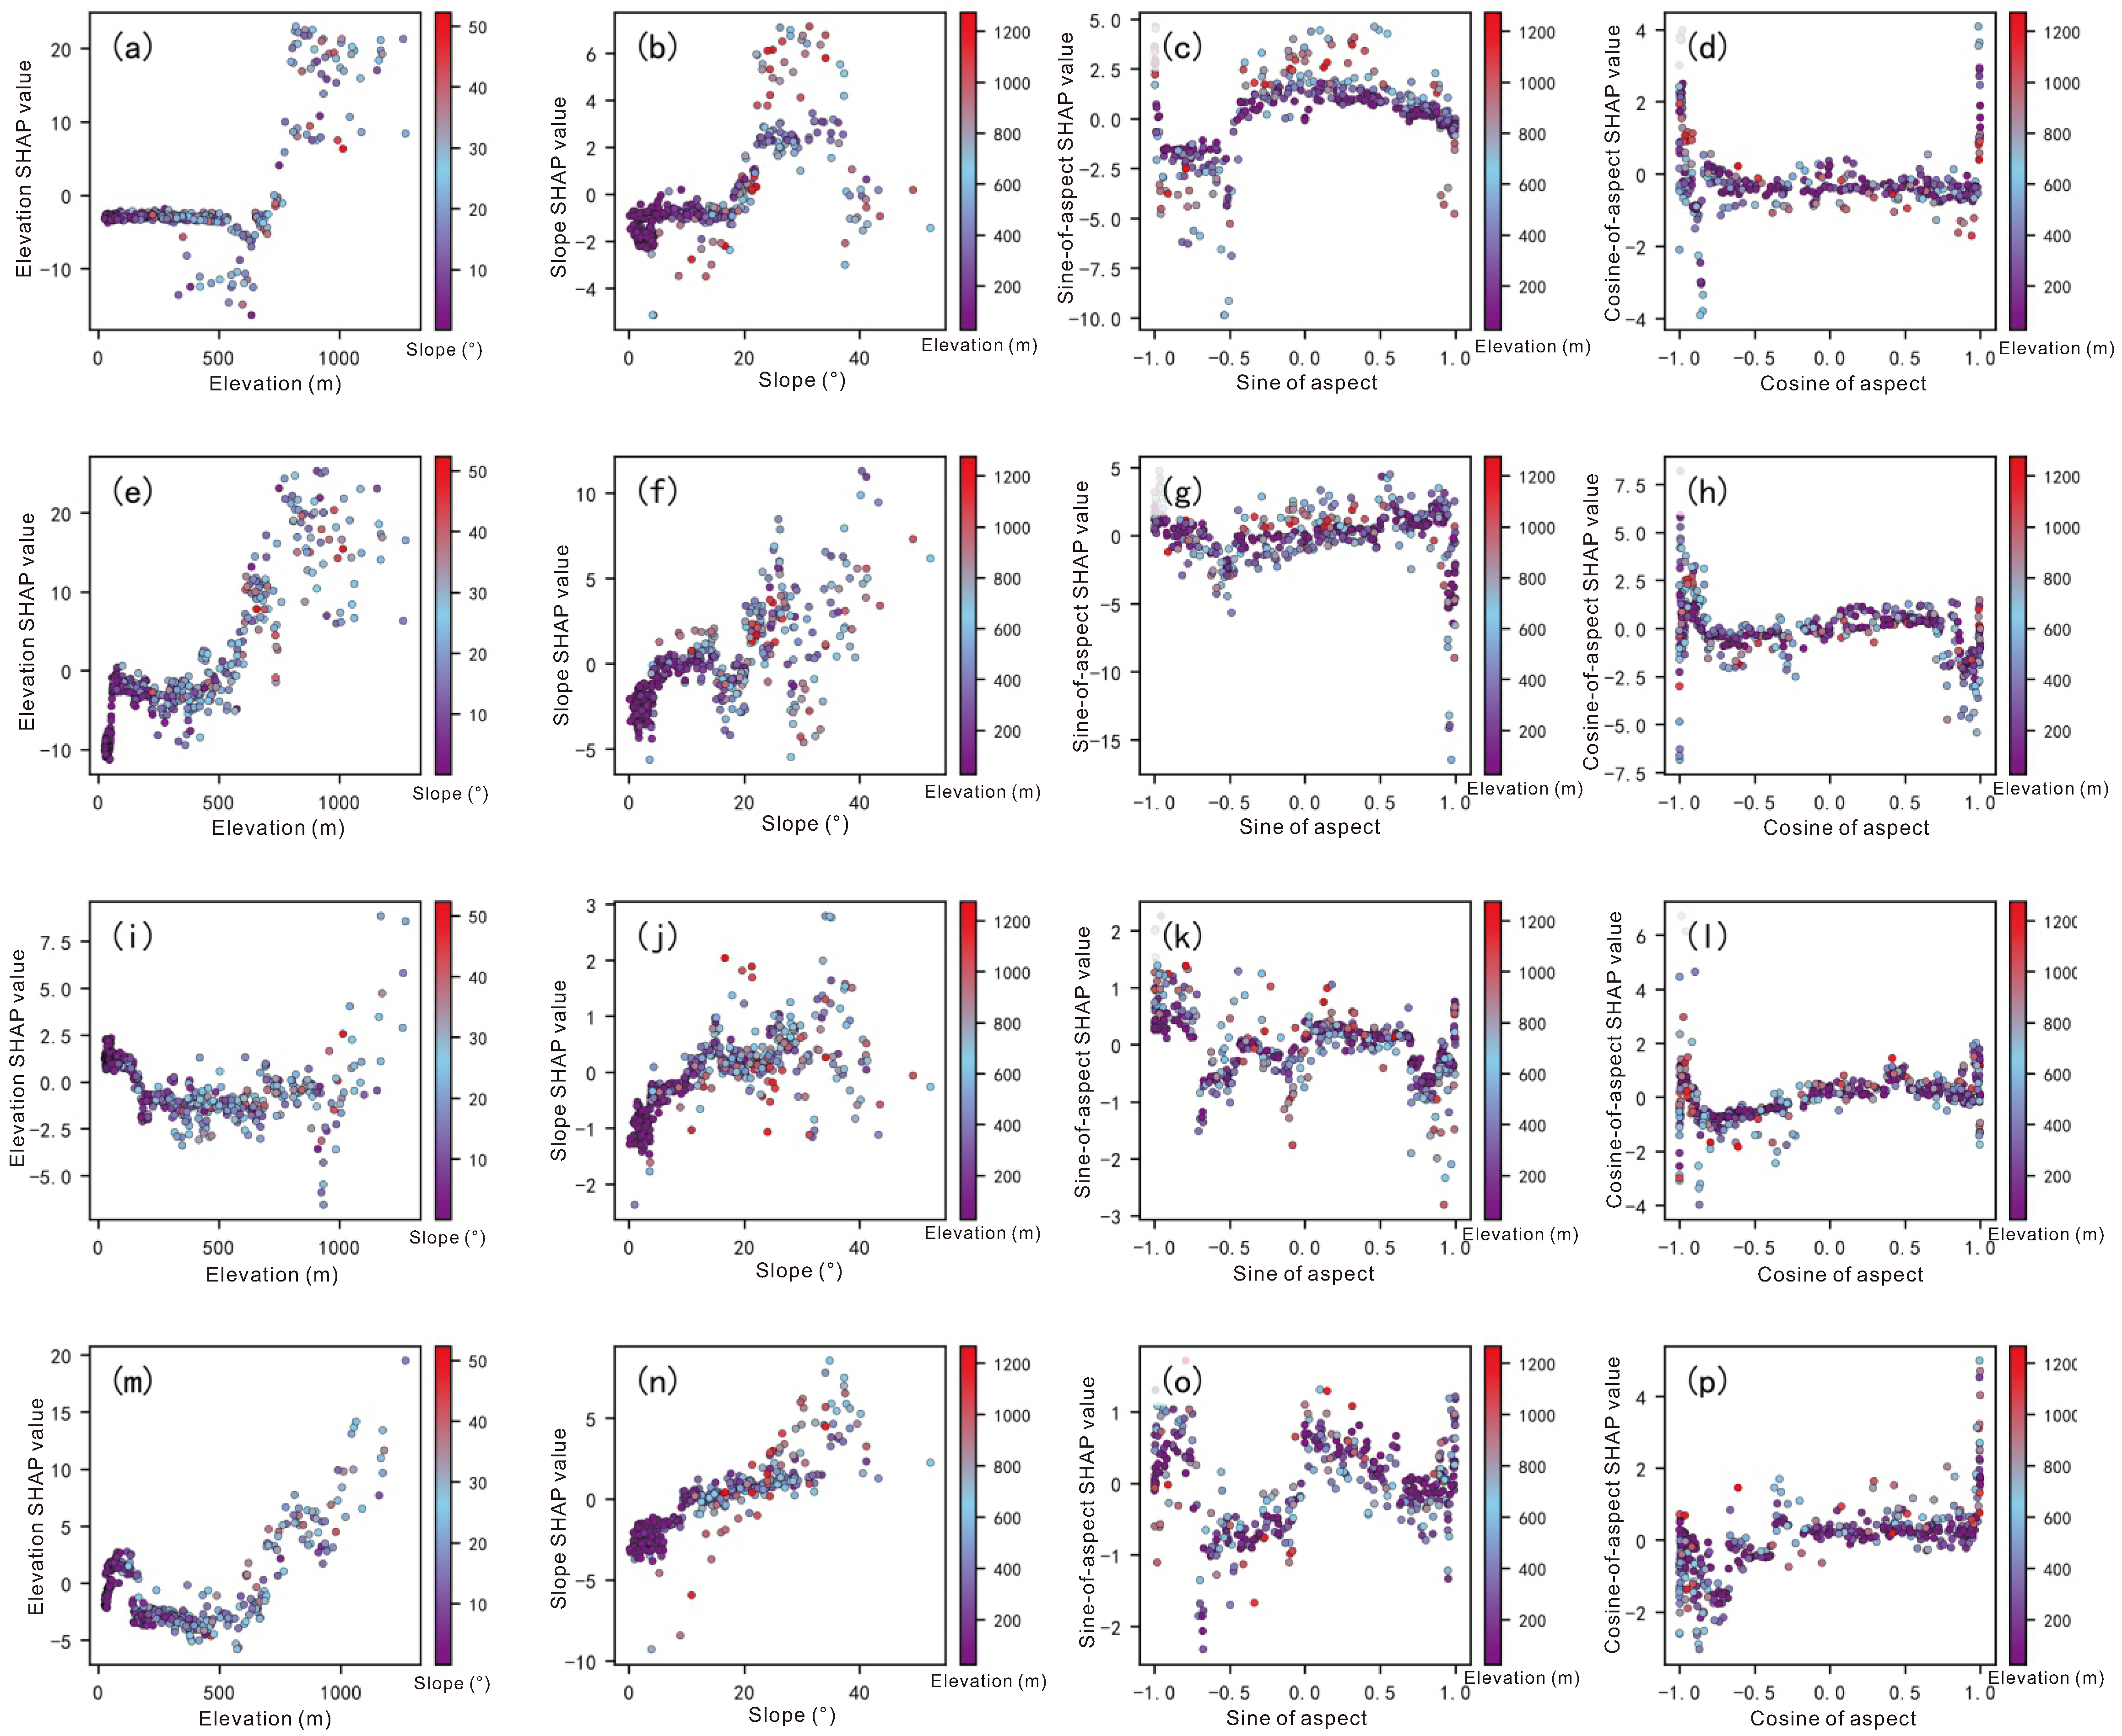
SHAP-dependence plots with eigenvalue overlay are further employed to visualize non-linear response patterns and local co-variation between predictors. It should be noted that such plots only provide suggestive clues of potential statistical co-variation and cannot confirm physical interaction mechanisms. Terrain-rainfall statistical associations show evident spatial non-stationarity between the northern and southern zones of Huairou. Cumulative rainfall metrics tend to correspond to higher values under combined high-elevation and steep-slope conditions in the southern zone, whereas maximum-daily and maximum-3-day extreme rainfall tend to concentrate within low-to-mid-elevation areas in the northern zone.
Southern sub-region
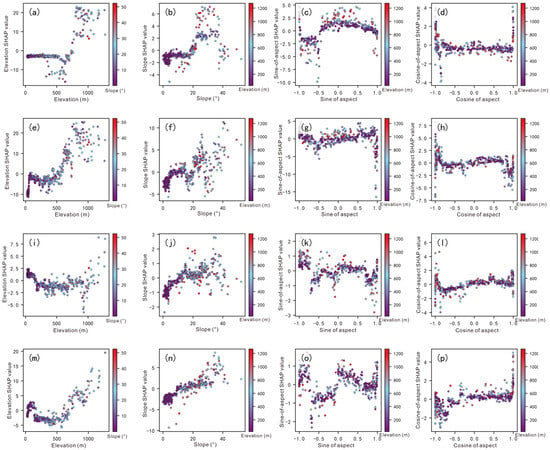
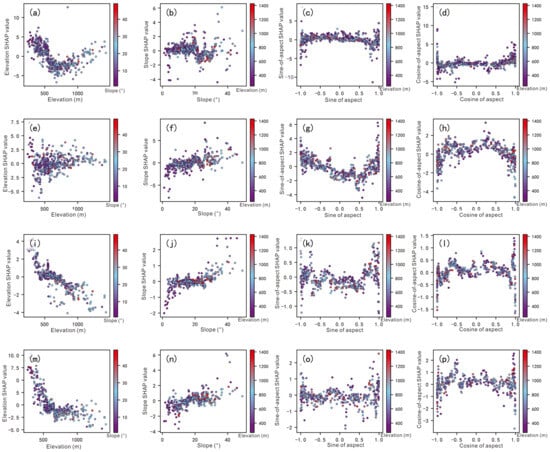
For southern-zone annual rainfall, elevation SHAP values show clear piecewise characteristics. Elevation below 700 m is dominated by negative contributions; the contribution polarity reverses within the 700–800 m interval; stable positive contributions appear above 800 m, and high-level positive contributions are maintained between 900 m and 1200 m. This indicates that high-elevation mountains in the south can increase annual rainfall (Figure 8a). Slope also presents obvious empirical transition-response features: slope below 20° is dominated by negative contributions; contributions gradually turn positive above 20°, and positive rainfall-enhancement contributions reach the highest level within the 25–40° slope interval (Figure 8b). SHAP-value fluctuation ranges of sine and cosine of aspect are limited, and their overall contribution intensity is far lower than elevation and slope (Figure 8c,d).
Figure 8.
Interactive effects of topographic factors on rainfall in the southern zone ((a–d): annual rainfall; (e–h): flood-season rainfall; (i–l): maximum daily rainfall; (m–p): maximum 3-day rainfall).
Elevation gradients for flood-season rainfall in the southern zone are more remarkable than those for annual rainfall. Low-elevation zones are dominated by negative elevation contributions; polarity reversal occurs at 500–700 m; positive contributions rise rapidly above 700–800 m, and high-elevation locations show the strongest rainfall-enhancement effect. This indicates that the spatial distribution of annual rainfall in the southern zone is mainly governed by cumulative flood-season rainfall (Figure 8e). Slope-response rules are distinct: negative contributions dominate gentle slopes; contribution polarity shifts at 15–20°, and positive contributions and scatter-point dispersion increase synchronously above 25°, reflecting the terrain-amplification effect of high-elevation steep slopes on persistent flood-season rainfall (Figure 8f).
The non-linear relationship between elevation and maximum-daily rainfall in the southern zone is relatively weak. Scattered positive-contribution points exist at low elevations; negative contributions prevail from 200 m to 700 m; SHAP values rise slowly above 800 m, yet positive-contribution samples are sparse and discrete at high elevations (Figure 8i,j). Therefore, elevation exerts stronger modulating effects on cumulative rainfall, while short-duration maximum-daily extreme rainfall is more affected by local weather conditions such as convective activities and storm-movement trajectories, and terrain modulation is weakened.
Terrain- modulating effects recover for maximum-3-day cumulative extreme rainfall in the southern zone. Negative contributions dominate from 100 m to 600 m; contributions begin to rise at 600–700 m and turn stably positive above 800 m; rainfall-enhancement effects increase greatly above 1000 m (Figure 8 m). Slope presents stable positive trends, and SHAP values keep increasing within the 20–35° interval (Figure 8n). By comparison, terrain amplification for long-duration persistent heavy rainfall in southern mountains is significantly stronger than for short-duration single-day extreme rainfall.
Northern sub-region
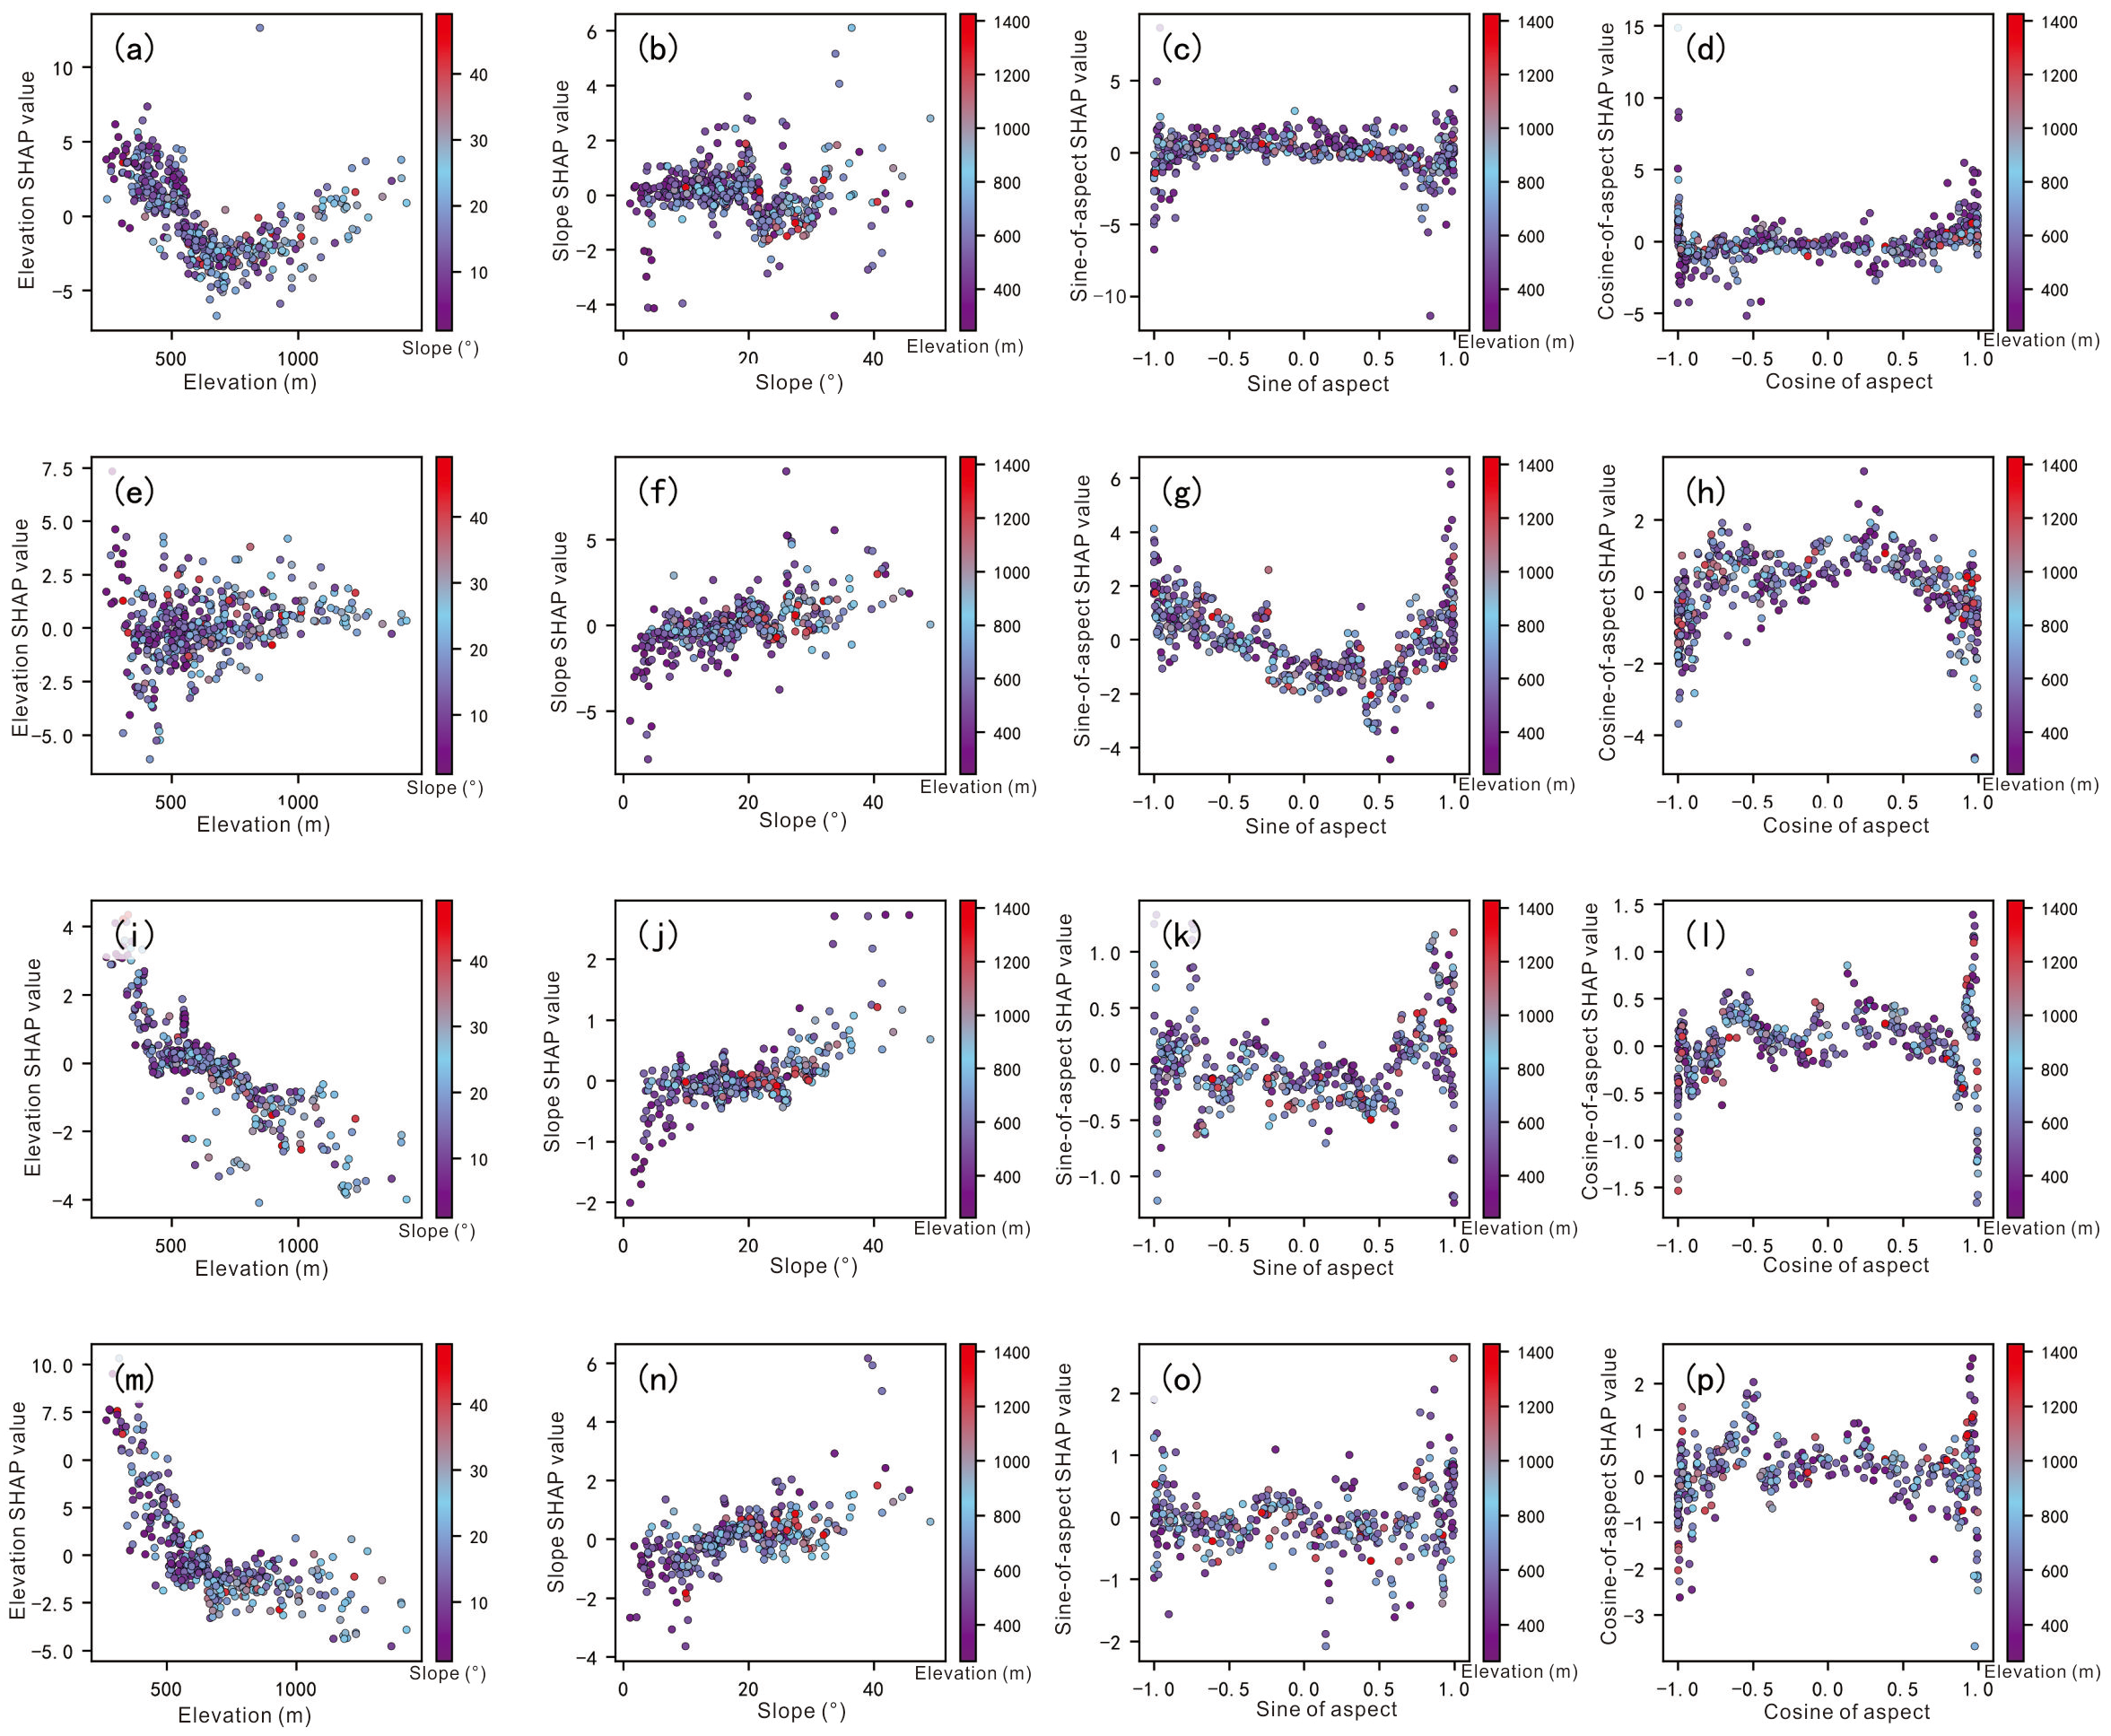
For northern-zone annual rainfall, elevation SHAP values show a typical U-shaped pattern with high values at both ends and low values in the middle. Positive contributions dominate low-elevation locations; contributions turn negative within 500–1000 m; positive contributions recover above 1000 m (Figure 9a). Slope presents obvious graded characteristics: SHAP values are negative at low-slope ranges; positive contributions increase gradually above 20°, and steep slopes produce rainfall-amplification effects (Figure 9b). SHAP-value fluctuation amplitudes of sine and cosine of aspect are very small; they can only slightly adjust local rainfall and cannot govern overall rainfall spatial patterns (Figure 9c,d).
Figure 9.
Interactive effects of topographic factors on rainfall in northern zone ((a–d): annual rainfall; (e–h): flood-season rainfall; (i–l): maximum daily rainfall; (m–p): maximum 3-day rainfall).
Elevation SHAP values for northern-zone flood-season rainfall fluctuate slightly around zero. Elevation modulation intensity is far weaker than in the south, and no obvious rainfall-enhancement effect occurs at high elevations (Figure 9e). Slope below 10° is dominated by negative contributions; contributions are close to zero between 10° and 20°; positive effects emerge gradually above 25° (Figure 9f). Sine and cosine of aspect exert weak influences and only generate minor local rainfall modulation (Figure 9g,h).
The non-linear relationship between elevation and maximum-daily rainfall in the northern zone is the most distinct. Low-elevation sites show obvious positive contributions; values drop rapidly at 400–600 m and gradually turn negative above 600–800 m. High-elevation sites generally correspond to lower predicted maximum-daily rainfall values (Figure 9i). This indicates that maximum-daily heavy-rainfall centers in the northern zone are more likely to occur in low-to-mid-elevation valleys rather than mountain crests. Slope-SHAP values increase with rising slope gradient, yet the fluctuation range is smaller than for annual and flood-season rainfall (Figure 9j). Contribution amplitudes of sine and cosine of aspect remain limited and cannot produce large-scale regulatory effects (Figure 9k,l).
Maximum-3-day rainfall in the northern zone decreases significantly with rising elevation. Positive contributions dominate low-elevation zones; polarity shifts from positive to negative near 500–700 m, and negative contributions prevail in mid-high-elevation zones. This relationship is more stable than for maximum-daily rainfall, which suggests that persistent heavy-rainfall processes are mainly concentrated in low-to-mid-elevation zones. Positive contributions of slope gradually appear above 20° (Figure 9n). Aspect-related factors still show narrow SHAP-value ranges and only local fine-tuning effects (Figure 9o,p).
3.4. Delineation of High-Rainfall-Prone Terrain Units and Hazard Susceptible Sites
High-rainfall-prone terrain units in this study were strictly delineated based on three simultaneous overlay criteria. A pixel is classified as a high-rainfall-prone terrain unit only when all the following Boolean conditions are satisfied: (1) sampling points ranked within the top 25% of both annual maximum-daily rainfall and maximum 3-day cumulative rainfall; (2) the local MGWR regression coefficient of elevation > 0 and the local MGWR regression coefficient of slope > 0; (3) the XGBoost-SHAP value of elevation > 0 and the XGBoost-SHAP value of slope > 0 for the corresponding pixel.
To verify the robustness and rationality of the 25% extreme rainfall percentile threshold, sensitivity analysis with 20%, 25%, and 30% cutoff scenarios was performed, together with quantitative validation of hazard density and spatial enrichment (Table 7). When the rainfall percentile cutoff increased from 20% to 30%, the spatial scope of high-rainfall-prone units expanded moderately, while the core spatial pattern remained stable. Under the adopted 25% baseline scenario, the high-rainfall-prone units cover 206 km2, accounting for 9.7% of the total study area. The internal hazard density reaches 1.11 geological hazard sites per km2, which is higher than the external density of 0.42 sites per km2, with a stable enrichment ratio of 2.64. This spatial enrichment descriptively shows that the delineated units correspond to terrain zones with higher geological-hazard point density.
Table 7.
Spatial statistical validation and sensitivity results of high-rainfall-prone units under different percentile cutoffs.
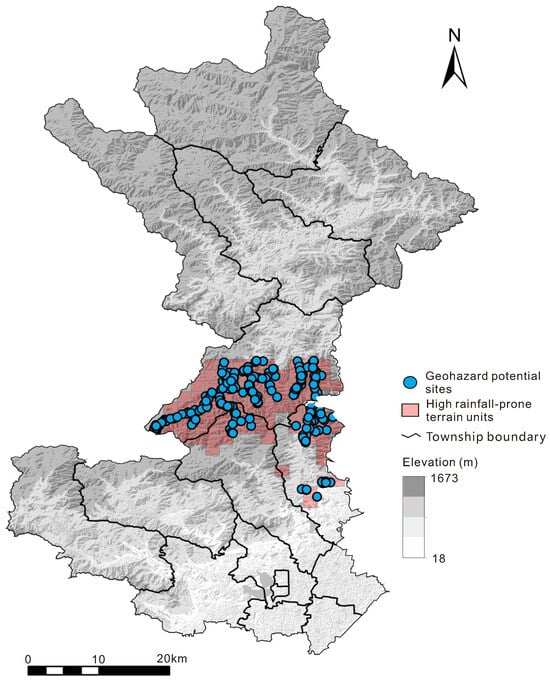
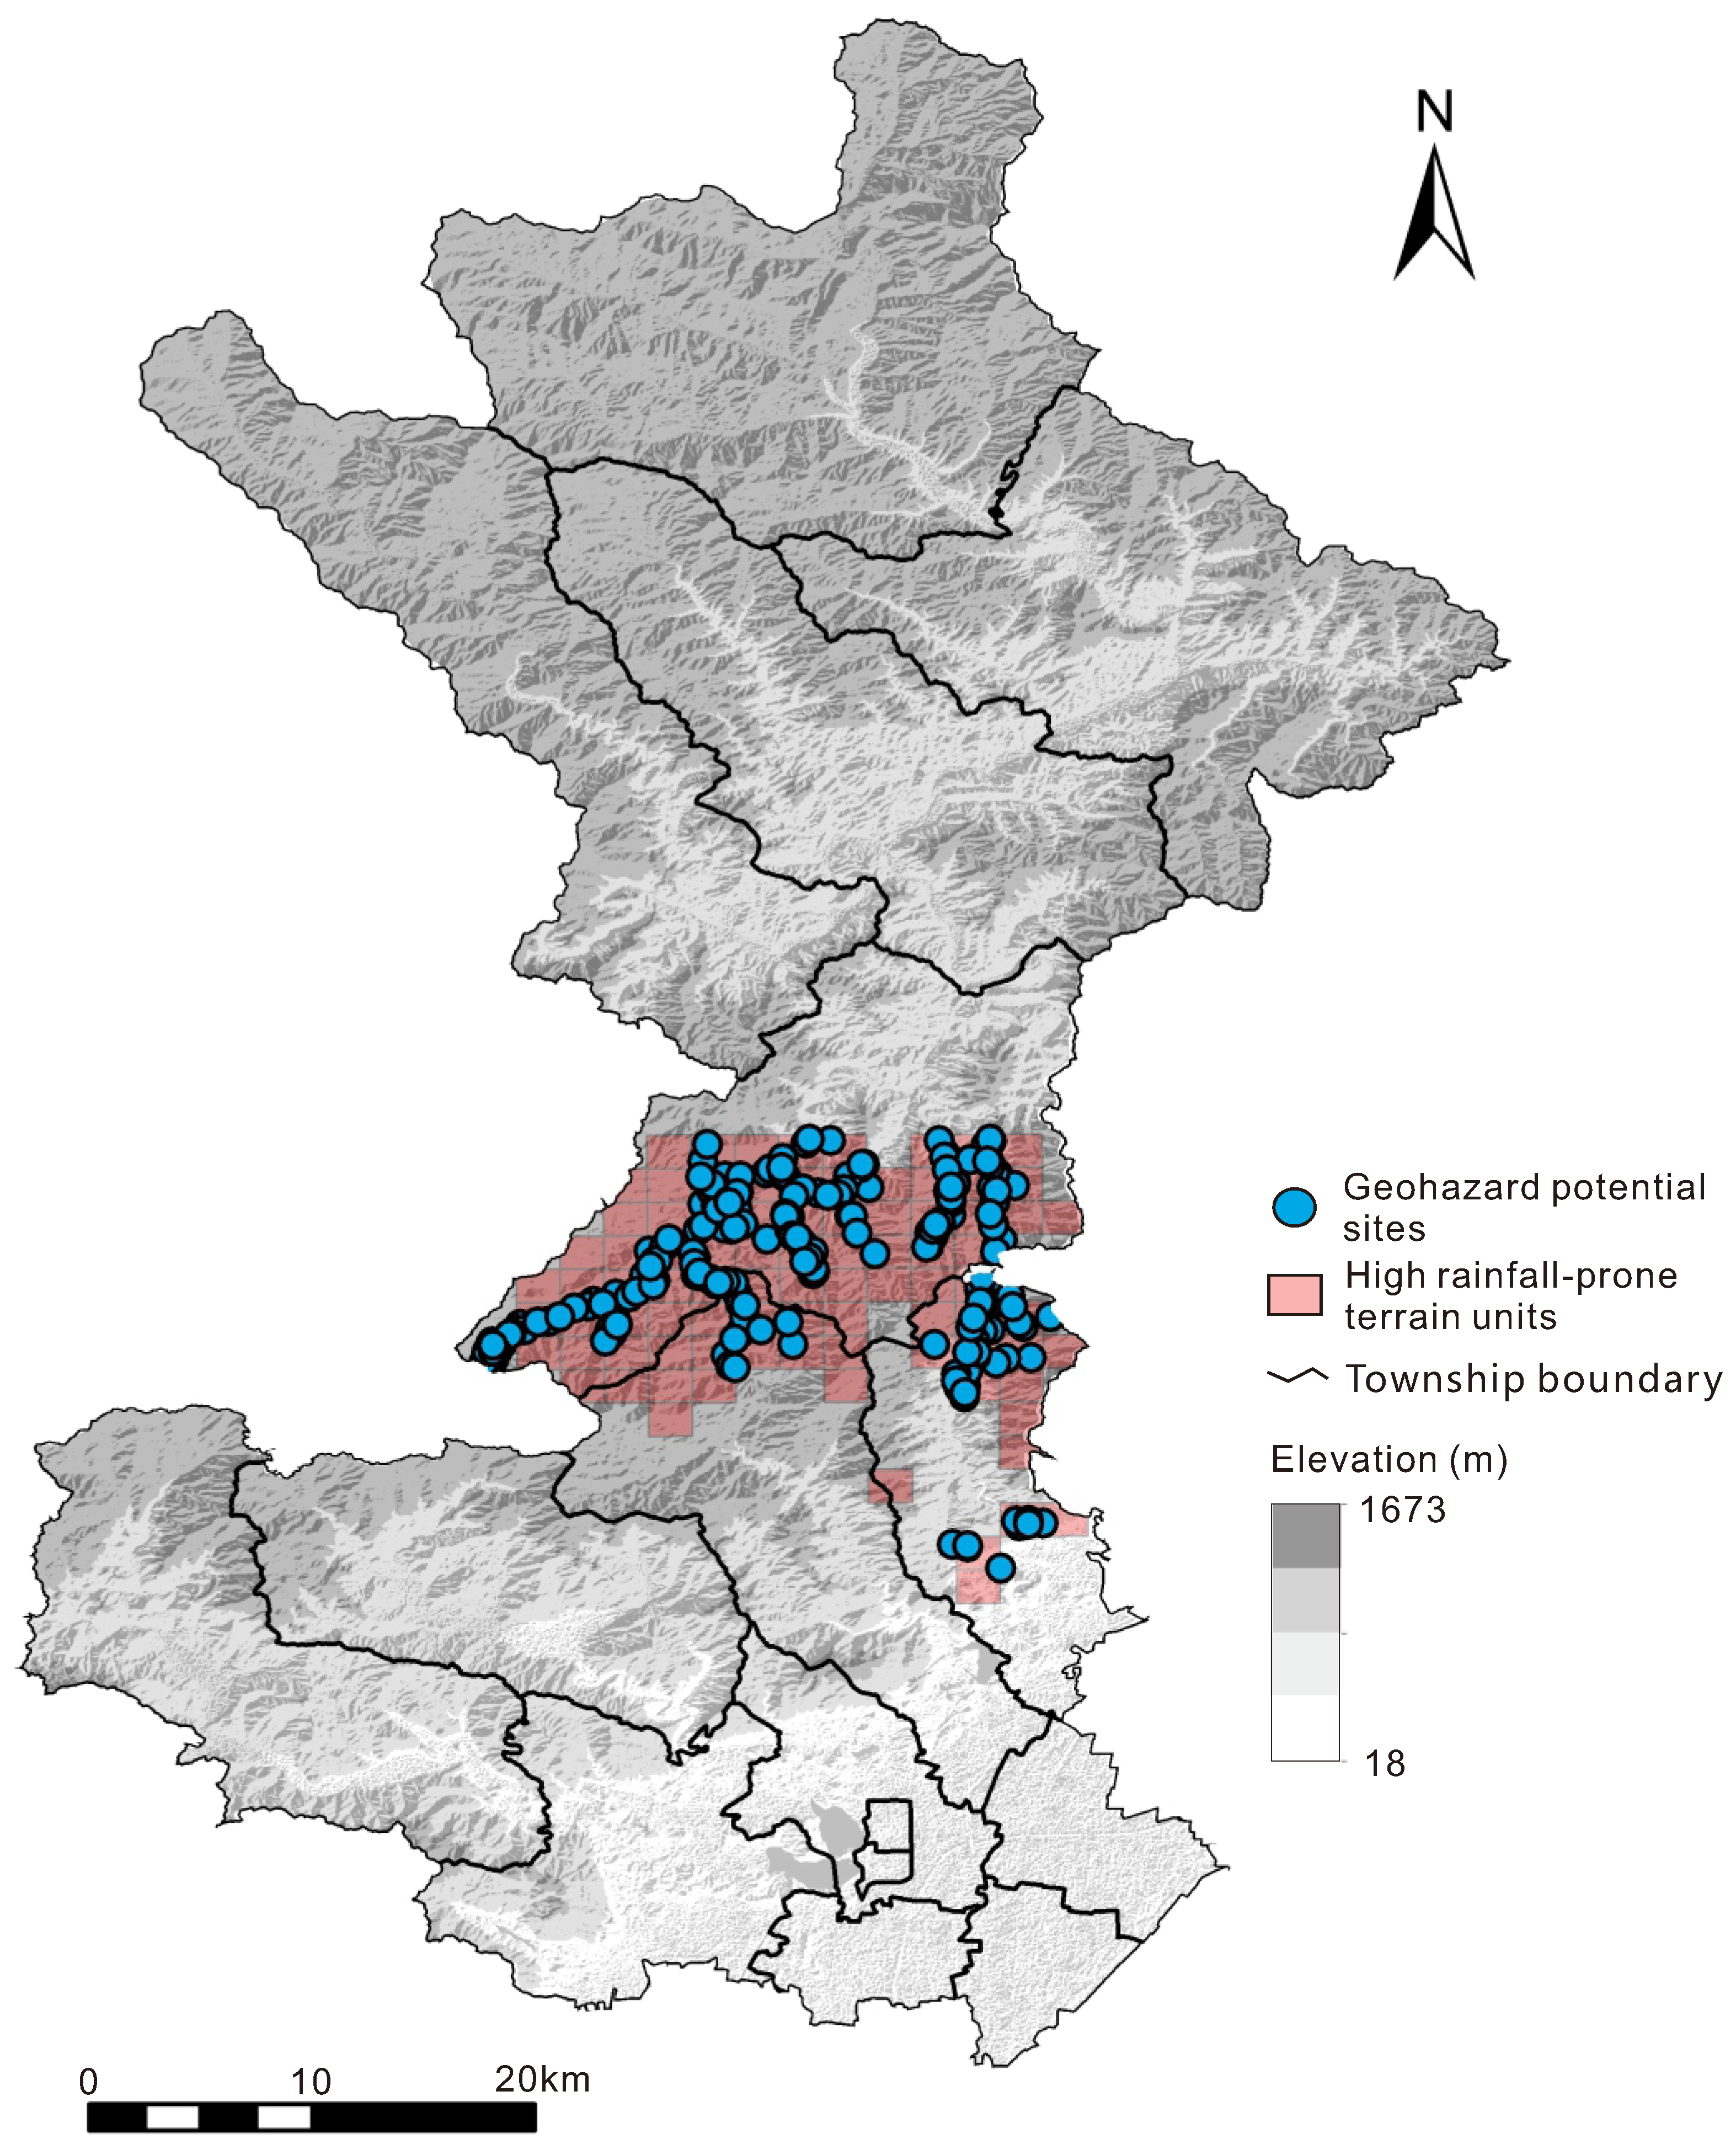
These high-rainfall-prone units are mainly distributed over mid-high-elevation mountains and steep-slope gully landforms in central Huairou (Figure 10). Such geomorphic units are statistically associated with macro-orographic-favorable landform settings and micro-topographic local-amplification-prone terrain; these landforms coincide spatially with frequent local extreme rainfall and constitute key geomorphic carriers for rainfall concentration.
Figure 10.
Spatial distribution of high rainfall-prone units and geological hazard hidden points in Huairou District.
According to the 2026 inventory of geological-hazard hidden sites in Beijing (2026) [29], a total of 1029 geological-hazard hidden sites are distributed across the study area, among which 229 geological-hazard hidden sites are located within high-rainfall-prone terrain units, including 151 collapse sites, six landslide sites, and 72 debris-flow sites. Among them, 50 sites threaten residential settlements, 127 threaten transportation routes, 24 threaten scenic spots, and 28 threaten other objects such as farmland and woodland. These 229 hidden sites located inside high-rainfall-prone units are prone to local extreme heavy rainfall during flood seasons and constitute priority prevention-and-control targets for geological hazards.
4. Discussion
Based on multi-model outputs of OLS, MGWR and XGBoost-SHAP, the discussion systematically interprets terrain-rainfall response rules in the Huairou mountainous area from four perspectives: model adaptability, north-south mechanistic divergence, factor-interaction effects, and practical application. The respective advantages and limitations of each model are also clarified. There is significant complementarity among the three models in analyzing terrain-rainfall modulating mechanisms. The OLS model can stably reveal global linear correlation trends between topography and rainfall and quantitatively judge the overall promoting or suppressing effects of topographic factors. It is suitable for the preliminary evaluation of macroscopic patterns, yet its constant-coefficient assumption cannot capture local association differences and completely ignores spatial non-stationarity and non-linear empirical transition characteristics; therefore, it serves only as a baseline reference model. MGWR relaxes the global-stationarity assumption by using differentiated spatial bandwidths, which enables it to depict conditional spatially-varying statistical patterns of elevation and slope modulating effects, and to clearly identify geographical discrepancies in terrain-rainfall responses between the northern and southern mountains. Nevertheless, MGWR remains essentially a local-linear fitting approach and cannot detect non-linear threshold responses or complex interaction effects among variables. The XGBoost-SHAP framework overcomes the limitations of linear and spatial-regression models. It can capture piecewise-response characteristics and observed transition intervals in terrain-rainfall coupling relationships, and can quantify interactive-modulating effects of elevation and slope. It therefore provides additional mechanistic insights into mountain rainfall processes from a non-linear perspective and effectively compensates for the shortcomings of traditional statistical models.
Clear north-south divergence exists in terrain-rainfall response mechanisms, most prominently in elevation-modulating patterns. In the southern low-mountain zones, rainfall generally increases with rising elevation from our statistical outputs. Statistical terrain-rainfall association magnitudes are weak at low elevations, and become markedly stronger above the 700–800 m elevation threshold, above which rainfall continues to increase. In the northern mountainous zones, elevation shows a typical U-shaped non-linear rainfall response: low-elevation river valleys and high-elevation mountains make prominent rainfall-promoting contributions, while rainfall-response intensity weakens at mid-elevations. This divergence is considered to originate from spatial differences in mountain-range orientation, valley geometry, and local circulations between the two sub-regions. Meanwhile, slope shows clear empirical transition-response behavior near 20°. Statistically, gentler slopes tend to correspond to lower rainfall values, while steeper slopes tend to be associated with higher rainfall within our dataset. Compared with annual and flood-season rainfall, extreme-daily and multi-day persistent extreme rainfall show higher sensitivity to slope changes [20,23,54]. Consequently, steep-slope and high-elevation areas are prone to extreme heavy rainfall and represent high-risk zones for storm-triggered geological hazards in Huairou District. The sine-cosine transformed slope-aspect indicators exert overall weak influences on rainfall and produce local fine-tuning rather than controlling regional rainfall spatial differentiation. It should be emphasized that these observed transition intervals, 700–800 m for elevation and 20° for slope, are statistical patterns derived from approximately 2020–2025 observational records. Owing to the relatively short time series, they should not be interpreted as stable climatological extreme-rainfall thresholds for the region.
Pairwise SHAP interaction metrics (Figure 7) indicate that main individual effects of elevation and slope dominate terrain-rainfall relationships, whereas pairwise statistical interactions between topographic predictors are comparatively weak. Moderate secondary statistical covariation can be observed between elevation and slope: under identical elevation conditions, rainfall enhancement tends to be stronger over steep slopes than over gentle slopes; under identical-slope conditions, orographic rainfall-gain effects tend to be more prominent at higher elevations. This secondary covariation further contributes to rainfall spatial heterogeneity across the study area, yet it remains subordinate to the individual main effects of elevation and slope and cannot override the dominant patterns driven by these two factors. From a disaster-prevention perspective, the identified high-rainfall-prone grid units are mainly distributed in the southern high-elevation steep-slope zones and show high spatial correspondence with high-incidence geological-hazard areas. These results can provide fine-scale baseline data to support risk zoning, hidden-site monitoring, and the prevention and mitigation of storm-triggered geological hazards in Huairou District [55].
This study still has several notable limitations. Only static topographic factors, including elevation, slope, and aspect, were included in the modelling; dynamic factors such as atmospheric circulation, water-vapor conditions, and land-use types were not considered. Furthermore, the analysis relies entirely on statistical models to extract correlation relationships, without quantitative physical-mechanism validation through meteorological numerical simulations. The study area was divided simply into northern and southern sub-regions based on watershed divides, while more refined sub-watershed multi-scale segmentation was not performed. The hazard-related analysis only delineates high-rainfall-prone units and does not include a complete quantitative risk assessment that integrates stratum lithology and human engineering activities. In addition, the empirical transition-response features identified from SHAP dependence plots have not been validated by formal change-point statistical tests. Segmented regression or breakpoint-detection methods should be adopted in future studies to better constrain these terrain-rainfall transition intervals. Future work will integrate multi-source meteorological datasets, numerical-simulation outputs, multi-scale zoning schemes and multi-factor hazard-modelling approaches to advance research in this field.
5. Conclusions
- (1)
- The three modelling approaches possess respective functions and complementary strengths for interpreting terrain-rainfall coupling mechanisms and can effectively avoid analytical limitations caused by adopting a single model. The OLS model can stably characterize global linear correlation patterns between topography and rainfall and is suitable for judging macroscopic trends, yet it cannot identify spatial non-stationarity and non-linear-response characteristics. MGWR can depict conditional spatial-differentiation patterns of topographic-factor modulating effects and effectively distinguish divergent terrain-rainfall responses between northern and southern Huairou mountains. Nevertheless, MGWR is restricted to local-linear fitting; substantial residual spatial autocorrelation remains after model fitting, implying coefficient estimates may be confounded by unincluded local meteorological processes. The XGBoost-SHAP model can empirically transform features and statistical associations between topography and rainfall and serves as an effective tool for analyzing non-linear modulating patterns of mountain rainfall.
- (2)
- Elevation and slope are the dominant topographic factors governing rainfall spatial distribution in Huairou District. Sine-cosine transformed slope-aspect indicators only exert weak local modulation effects and do not dominate regional rainfall-differentiation processes. Terrain presents obvious empirical transition-response features for rainfall. Elevation of 700–800 m and slope of 20° constitute key transition intervals. The modulating magnitude and direction of terrain factors change distinctly on both sides of these observed transition intervals.
- (3)
- Terrain-rainfall response modes show significant spatial heterogeneity between northern and southern Huairou. Rainfall generally increases with rising elevation in southern low-mountain zones, and high-elevation locations correspond to relatively higher rainfall values within our statistical outputs. Northern mountainous zones show a typical U-shaped non-linear statistical elevation-rainfall response: low-elevation valleys and high elevations correspond to relatively higher rainfall values, while rainfall-response intensity weakens in mid-elevation zones.
- (4)
- Extreme daily and multi-day cumulative extreme rainfall show greater observed responsiveness to slope variations than annual and flood-season rainfall. Steep-slope high-elevation terrain is prone to extreme heavy rainfall and constitutes high-risk zones for storm-triggered geological hazards.
Author Contributions
Conceptualization, X.L. and M.-L.L.; methodology, X.L.; software, X.L., S.G. and X.S.; validation, X.L., M.-L.L. and F.X.; formal analysis, X.L.; investigation, X.L. and S.X.; resources, M.-L.L.; data curation, X.L.; writing—original draft preparation, X.L.; writing—review and editing, M.Y., M.-L.L., F.X., S.G. and X.S.; visualization, X.L.; supervision, M.-L.L.; project administration, M.-L.L.; funding acquisition, M.-L.L. All authors have read and agreed to the published version of the manuscript.
Funding
This research was funded by the Scientific Research Project of Beijing Institute of Geology and Mineral Resources Exploration (Grant No. 2026-DKY-ZT002) and the Self-funded Scientific Research Project of Beijing Institute of Geological Hazard Prevention (Grant No. ZFS2026004).
Data Availability Statement
The raw rain-gauge observations and derived terrain attribute samples supporting the findings of this study are archived in the Zenodo repository (DOI: 10.5281/zenodo.22825239, https://doi.org/10.5281/zenodo.22825239). The high-resolution DEM and remote sensing imagery are commercially licensed from 21st Century Aerospace Technology Co., Ltd. and cannot be publicly shared.
Acknowledgments
During the preparation of this manuscript, the authors used Doubao-4.0 (version: 4.0-202608) for the purposes of grammatical refinement and readability improvement only for the abstract. The authors have reviewed and edited all AI-processed output and take full responsibility for the content of this publication. No artificial-intelligence tools were applied for research design, data computation, result interpretation, or drawing conclusions in this work.
Conflicts of Interest
The authors declare no conflict of interest. The funders had no role in the design of the study; in the collection, analyses, or interpretation of data; in the writing of the manuscript; or in the decision to publish the results.
Abbreviations
The following abbreviations are used in this manuscript:
| OLS | Ordinary Least Squares |
| MGWR | Multiscale Geographically Weighted Regression |
| XGBoost | Extreme Gradient Boosting |
| VIF | Variance Inflation Factor |
| RMSE | Root-Mean-Square Error |
| MAE | Mean Absolute Error |
Appendix A
Table A1.
Kriging interpolation parameters and leave-one-out cross-validation results for four rainfall variables.
Table A2.
Detailed MGWR calibration diagnostics.
References
- Beijing Municipal People’s Government. 147 Hours in Rainstorm: Documentary on Beijing’s Flood Prevention and Disaster Relief in Response to the 2025 Extreme Heavy Rainfall. Available online: https://www.beijing.gov.cn/ywdt/yaowen/202507/t20250730_4161853.html (accessed on 15 September 2026).
- National Institute of Natural Hazards. Remote Sensing Analysis Report on Flood Disasters in Northern Mountainous Areas of Beijing 2025; National Institute of Natural Hazards: Beijing, China, 2025.
- Cai, X.M.; Chen, B.; Li, Z.H.; Li, J.R.; Wen, F.; Liu, H.H.; Song, C.; Yu, C.; Li, S.J.; Peng, J.B. Multi source remote sensing identification and spatial distribution analysis of flood and geohazards induced by the July 2025 extreme heavy rainfall in Beijing. Geomat. Inf. Sci. Wuhan Univ. 2025. (In Chinese) [Google Scholar] [CrossRef]
- Nan, Y.; Zhai, S.H.; Li, Y.; Cao, Y.; Luo, S.J.; Wang, Y.T.; Guo, X.F. Characteristics of geohazards triggered by the “23·7” catastrophic rainstorm in Beijing and analysis of early warning effectiveness. Chin. J. Geol. Hazard Control 2024, 35, 66–73. (In Chinese) [Google Scholar] [CrossRef]
- Minder, J.R.; Roe, G.H. Orographic Precipitation. In Encyclopedia of Snow, Ice and Glaciers; Singh, V.P., Singh, P., Haritashya, U.K., Eds.; Springer: Dordrecht, The Netherlands, 2011; pp. 794–799. [Google Scholar]
- Liang, S.H.; Zhang, L.; Qian, H.S.; Li, M.X.; Zou, X.S. Impacts of aspect and elevation on flood-season precipitation in the Beijiang River Basin, Guangdong Province. J. Appl. Meteorol. Sci. 2015, 26, 338–345. (In Chinese) [Google Scholar] [CrossRef]
- Shu, S.J.; Wang, Y.; Xiong, A.Y. Estimation and Analysis for Geographic and Orographic Influences on Precipitation Distribution in China. Chin. J. Geophys. 2007, 50, 1703–1712. [Google Scholar] [CrossRef] [Scilit]
- Gao, X.; Sun, J.; Yin, J.; Li, J.; Liang, X. Thermodynamic Effects of Terrain on the Southerly Monsoon Surge and Extreme Rainfall Over North China. J. Geophys. Res. Atmos. 2025, 130, e2025JD043742. [Google Scholar] [CrossRef] [Scilit]
- Ding, Y.H. The Major Advances and Development Process of the Theory of Heavy Rainfalls in China. Torrential Rain Disasters 2019, 38, 395–406. [Google Scholar]
- Lee, J.; Lee, O.; Choi, J.; Seo, J.; Won, J.; Jang, S.; Kim, S. Estimation of Real-Time Rainfall Fields Reflecting the Mountain Effect of Rainfall Explained by the WRF Rainfall Fields. Water 2023, 15, 1794. [Google Scholar] [CrossRef] [Scilit]
- Li, X.L.; Chen, T.; Zhao, W.; Chen, Y.; Fu, J.L.; Xu, X.H.; Shi, Y.; Shen, Y. Observational analysis of fine-scale topographic effects of the Taihang Mountains on the “23·7” extreme rainstorm in North China. Chin. J. Atmos. Sci. 2025, 49, 629–644. (In Chinese) [Google Scholar] [CrossRef]
- Li, J.; Yang, L.; Liu, W.; Jiang, C. Spatiotemporal Distribution Characteristics of Mesoscale Convective Systems Producing Short-Duration Heavy Rainfall over the Tianshan Mountain Area. Adv. Meteorol. 2019, 9090659. [Google Scholar] [CrossRef] [Scilit]
- Xu, Y.; Min, J.Z.; Zhuang, X.R.; Wang, X.; Zhu, L.J. Numerical study on convective triggering conditions and predictability of boundary-layer-uplift warm-sector heavy rainfall under complex terrain. Chin. J. Atmos. Sci. 2024, 48, 1095–1112. [Google Scholar]
- Kirshbaum, D.J.; Adler, B.; Kalthoff, N.; Barthlott, C.; Serafin, S. Moist Orographic Convection: Physical Mechanisms and Links to Surface-Exchange Processes. Atmosphere 2018, 9, 80. [Google Scholar] [CrossRef] [Scilit]
- Smith, R.B. The Influence of Mountains on the Atmosphere. In Advances in Geophysics; Saltzman, B., Ed.; Elsevier: Amsterdam, The Netherlands, 1979; Volume 21, pp. 87–230. [Google Scholar]
- Fischer, J.; Groenemeijer, P.; Holzer, A.; Feldmann, M.; Schröer, K.; Battaglioli, F.; Schielicke, L.; Púčik, T.; Antonescu, B.; Gatzen, C.; et al. Invited perspectives: Thunderstorm intensification from mountains to plains. Nat. Hazards Earth Syst. Sci. 2025, 25, 2629–2656. [Google Scholar] [CrossRef] [Scilit]
- Chavez, S.P.; Flores Rojas, J.L.; Takahashi, K.; Silva, F.Y. Simulating Stratiform Precipitation With Embedded Convection in High-Elevation Valleys Using LES: The Role of Topographic Detail. J. Geophys. Res. Atmos. 2025, 130, e2025JD043696. [Google Scholar] [CrossRef] [Scilit]
- Javari, M. Assessment of Temperature and Elevation Controls on Spatial Variability of Rainfall in Iran. Atmosphere 2017, 8, 45. [Google Scholar] [CrossRef] [Scilit]
- Zhou, X.; Zeng, Y.; Liu, Q.; You, Q.; Gu, H.; Hu, H. Mechanism of the effect of terrain-climate coupling on extreme precipitation events. Ann. GIS 2026, 32, 305–329. [Google Scholar] [CrossRef] [Scilit]
- Long, Y.; Huang, C.; Jiang, C.; Huang, Z.; Wang, X.; Yan, S. Spatiotemporal Variability of Extreme Precipitation and Influence of Climate Factors and Topography in the Dongting Lake Basin, Southern China. Int. J. Climatol. 2025, 45, e70066. [Google Scholar] [CrossRef] [Scilit]
- Yue, X.; Li, J.; Zhao, Y. The Unevenness of Warm-Season Precipitation Over the Steep Terrain in North China and Its Related Environmental Conditions. Int. J. Climatol. 2025, 45, e70128. [Google Scholar] [CrossRef] [Scilit]
- Hua, S.; Xu, X.; Chen, B. Influence of Multiscale Orography on the Initiation and Maintenance of a Precipitating Convective System in North China: A Case Study. J. Geophys. Res. Atmos. 2020, 125, e2019JD031731. [Google Scholar] [CrossRef] [Scilit]
- Liu, H. Drivers of orographic extreme rainfall over North China mountain plain transition zones identified by XGBoost and SHAP analysis. Int. J. Climatol. 2025, 45, e70156. [Google Scholar] [CrossRef] [Scilit]
- Wang, J.J. A Numerical Study of the Impact of Topography on the July 2021 Extreme Rainfall Event in Zhengzhou, China. J. Geophys. Res. Atmos. 2024, 129, e2024JD041332. [Google Scholar] [CrossRef] [Scilit]
- Wang, H.Z.; Xu, B.; Zhang, J.; Guo, X.; Zhang, L.Q. Rainfall Thresholds of Debris Flows Based on Varying Rainfall Intensity Types in the Mountain Areas of Beijing. Geomat. Nat. Hazards Risk 2022, 13, 2166–2181. [Google Scholar] [CrossRef] [Scilit]
- Xia, R.; Zhang, D.L. An Observational Analysis of Three Extreme Rainfall Episodes of 19–20 July 2016 along the Taihang Mountains in North China. Mon. Weather Rev. 2019, 147, 4199–4220. [Google Scholar] [CrossRef] [Scilit]
- Chen, S.; Fu, J.L.; Chen, T.; Chen, Y.; Liu, B.Y. Convective evolution differences and environmental conditions of the “25·7” warm-sector extreme heavy rainfall in North China. Meteorol. Mon. 2026, 52, 657–672. (In Chinese) [Google Scholar]
- Beijing Municipal Commission of Planning and Natural Resources. 2026 Beijing Administrative-Division Base Map. Available online: https://ghzrzyw.beijing.gov.cn/zhengwuxinxi/tzgg/sj/202609/t20260911_4859523.html (accessed on 20 September 2026).
- Beijing Municipal Commission of Planning and Natural Resources. 2026 Statistical Table of Sudden Geohazard Hidden Sites in Huairou District. Available online: https://ghzrzyw.beijing.gov.cn/zhengwuxinxi/zxzt/dzzhfzzt/yhdqk/202505/t20250523_4666643.html (accessed on 26 May 2026).
- O’brien, R.M. A Caution Regarding Rules of Thumb for Variance Inflation Factors. Qual. Quant. 2007, 41, 673–690. [Google Scholar] [CrossRef] [Scilit]
- Wilks, D.S. Statistical Methods in the Atmospheric Sciences, 3rd ed.; Academic Press: Amsterdam, The Netherlands, 2011. [Google Scholar]
- Fang, Z.; Li, Y. Spatiotemporal prediction of mountain area extreme rainfall using XGBoost and multiple topographic covariates. J. Hydrol. Process. 2023, 37, e14631. [Google Scholar] [CrossRef] [Scilit]
- Cressie, N. Spatial prediction and ordinary kriging. Math. Geol. 1988, 20, 405–421. [Google Scholar] [CrossRef] [Scilit]
- Hijmans, R.J.; Cameron, S.E.; Parra, J.L.; Jones, P.G.; Jarvis, A. Very high resolution interpolated climate surfaces for global land areas. Int. J. Climatol. 2005, 25, 1965–1978. [Google Scholar] [CrossRef] [Scilit]
- Wang, L.H.; Li, Y.C.; Gan, Y.S. Reconstructing high-resolution gridded precipitation data in the southwest China highland canyon area using an improved (MGWR) downscaling method. Sci. Total Environ. 2024, 896, 174866. [Google Scholar] [CrossRef] [Scilit] [PubMed]
- Zhu, H.; Zhang, Z.; Xu, X.; Zhang, Y. A Precipitation Simulation Method Considering Spatial Decay of Geographical Phenomena and Integrating Terrain Light Propagation. Trans. GIS 2026, 30, e70187. [Google Scholar] [CrossRef] [Scilit]
- Tu, L.; Duan, L. Spatial downscaling analysis of GPM IMERG precipitation dataset based on multiscale geographically weighted regression model: A case study of the Inner Mongolia Reach of the Yellow River basin. Front. Environ. Sci. 2024, 12, 1389587. [Google Scholar] [CrossRef] [Scilit]
- Ogunrinde, A.D. Spatial regression analysis of precipitation distribution and topographic controls over Nigeria. Spat. Stat. 2022, 48, 100621. [Google Scholar] [CrossRef] [Scilit]
- Naoum, S.; Tsanis, I.K. Orographic Precipitation Modeling with Multiple Linear Regression. J. Hydrol. Eng. 2004, 9, 79–102. [Google Scholar] [CrossRef] [Scilit]
- Wang, Y.; Chen, Y.; Li, Z. Construction of High-Resolution Precipitation Dataset and Its Implication to Drought over the Tianshan Mountains, China. Front. Earth Sci. 2023, 11, 1128990. [Google Scholar] [CrossRef] [Scilit]
- Kumari, M.; Singh, C.K.; Bakimchandra, O.; Basistha, A. Geographically weighted regression based quantification of rainfall–topography relationship and rainfall gradient in Central Himalayas. Int. J. Climatol. 2017, 37, 1299–1309. [Google Scholar] [CrossRef] [Scilit]
- Fotheringham, A.S.; Yang, W.; Kang, W. Multiscale geographically weighted regression (MGWR). Ann. Assoc. Am. Geogr. 2017, 107, 1247–1265. [Google Scholar] [CrossRef] [Scilit]
- Zhang, T.; Wang, S. Spatial-scale heterogeneity of topographic factors controlling mountain-area precipitation based on MGWR. J. Hydrol. Process. 2022, 36, e14327. [Google Scholar] [CrossRef] [Scilit]
- Khan, D.; Akram, W.; Ullah, S. Enhancing landslide susceptibility predictions with XGBoost and SHAP: A data-driven explainable AI method. Geocarto Int. 2025, 40, 1584–1603. [Google Scholar] [CrossRef] [Scilit]
- Zhang, H. Rainfall-induced shallow landslide susceptibility and terrain factor interpretation based on XGBoost-SHAP. J. Eng. Geol. 2024, 32, 896–906. (In Chinese) [Google Scholar]
- Liu, S.; Wang, J.; Ao, T. Research on Multi-Source Precipitation Fusion Based on Classification and Regression Machine Learning Methods—A Case Study of the Min River Basin in the Eastern Source of the Qinghai–Tibet Plateau. Remote Sens. 2025, 17, 3982. [Google Scholar] [CrossRef] [Scilit]
- Qiu, N.; Zhang, J.; Liu, Y.; Chen, X. Runoff Simulation and Analysis in the Upper Yellow River Basin Using a Budyko–XGBoost Coupled Model. Water 2026, 18, 1944. [Google Scholar] [CrossRef] [Scilit]
- Chen, T.; Guestrin, C. XGBoost: A scalable tree boosting system. In Proceedings of the 22nd ACM SIGKDD International Conference on Knowledge Discovery and Data Mining, San Francisco, CA, USA, 13–17 August 2016; pp. 785–794. [Google Scholar]
- Ma, X.; Wang, J. Spatial Downscaling of Precipitation Data in Arid Regions Based on the XGBoost-MGWR Model. Land 2024, 13, 448. [Google Scholar] [CrossRef] [Scilit]
- Moran, P.A.P. The Interpretation of Statistical Maps. J. R. Stat. Soc. Ser. B (Methodol.) 1948, 10, 243–251. [Google Scholar] [CrossRef] [Scilit]
- Cliff, A.D.; Ord, J.K. Spatial Autocorrelation; Pion Limited: London, UK, 1973. [Google Scholar]
- Anselin, L. Spatial Econometrics: Methods and Models; Kluwer Academic: Dordrecht, The Netherlands, 1988. [Google Scholar] [CrossRef] [Scilit]
- LeSage, J.P.; Pace, R.K. Introduction to Spatial Econometrics; CRC Press: Boca Raton, FL, USA, 2009. [Google Scholar]
- Siler, N.; Koszuta, M.; Rahimi, S.; Norris, J.; Hall, A.; Ullrich, P. Examining the Robustness of Weakened Orographic Influence on Precipitation in Downscaled Climate Projections Over the Western US. Geophys. Res. Lett. 2026, 53, e2025GL119251. [Google Scholar] [CrossRef] [Scilit]
- Gui, M.-W.; Chu, H.-A.; Chung, M.-C.; Chih, L.-S. Integrating Rainfall Distribution Patterns and Slope Stability Analysis in Determining Rainfall Thresholds for Landslide Occurrences: A Case Study. Water 2025, 17, 1240. [Google Scholar] [CrossRef] [Scilit]

Disclaimer/Publisher’s Note: The statements, opinions and data contained in all publications are solely those of the individual author(s) and contributor(s) and not of MDPI and/or the editor(s). MDPI and/or the editor(s) disclaim responsibility for any injury to people or property resulting from any ideas, methods, instructions or products referred to in the content. |
© 2026 by the authors. Licensee MDPI, Basel, Switzerland. This article is an open access article distributed under the terms and conditions of the Creative Commons Attribution (CC BY) license.