


Abstract
Near-surface trace gases exhibit significant spatial heterogeneity, whereas existing observational techniques are unable to simultaneously resolve their horizontal distributions at multiple altitudes with high spatial resolution. To address this limitation, this study developed a lightweight unmanned aerial vehicle (UAV)-borne two-dimensional differential optical absorption spectroscopy (2D-DOAS) system that integrates multi-altitude hovering with multi-azimuth spectral scanning for high-resolution characterization of near-surface NO2, SO2, HCHO, and O4-related optical parameters. Spectral retrievals were performed using the QDOAS software, and the developed system was first validated through synchronous observations with a commercial ground-based multi-axis differential optical absorption spectroscopy (MAX-DOAS) instrument. The NO2 differential slant column density (DSCD) retrievals from the two systems showed strong agreement, with correlation coefficients greater than 0.90 at all six elevation angles, demonstrating the reliability of the developed system. Following validation, a 20-day field campaign was conducted in Huaibei using multi-altitude hovering observations at 30–110 m above ground level combined with synchronous measurements in 24 azimuth directions at 15° intervals. The observations revealed pronounced horizontal and vertical variability in trace-gas distributions, with enhanced DSCDs associated with local industrial emissions, prevailing winds, and atmospheric transport. These results demonstrate that the proposed UAV-borne 2D-DOAS system provides a reliable and flexible tool for high-resolution monitoring of near-surface trace gases, identification of spatial patterns associated with potential emission sources, and investigation of atmospheric transport processes.
1. Introduction
With the continuous implementation of air pollution control strategies in China, overall air quality has improved in recent years; however, complex and regional-scale air pollution problems remain significant [1,2]. Accurate characterization of pollutant spatial distributions is essential for understanding pollution formation mechanisms, elucidating transport processes, and implementing targeted mitigation strategies. However, existing observation techniques still face limitations in spatial coverage and three-dimensional characterization capability. Ground-based monitoring networks [3] provide high measurement accuracy but are constrained by limited spatial representativeness. Satellite remote sensing techniques [4,5,6,7] enable regional-scale observations but remain challenged by spatial resolution, cloud contamination, and limited sensitivity to near-surface pollution, making it difficult to resolve fine-scale local pollution structures. Therefore, developing novel observation approaches with high spatial resolution, operational flexibility, and three-dimensional sensing capability is critical for revealing near-surface pollution distributions and transport processes.
Differential optical absorption spectroscopy (DOAS) exploits the characteristic absorption features of trace gas molecules in the ultraviolet–visible spectral range to achieve non-contact, highly sensitive measurements and simultaneous retrieval of multiple pollutants through multi-component absorption cross-section fitting [8,9,10]. The spatial characterization capability of DOAS systems depends not only on spectroscopic performance but also on the mobility of observation platforms and sampling strategies. Existing ground-based [11] and mobile DOAS observations [12,13] are limited by fixed observation locations or restricted measurement trajectories, respectively, making it difficult to simultaneously achieve high-resolution detection of local pollution and regional-scale spatial characterization. Unmanned aerial vehicle (UAV) platforms, characterized by low-altitude flight, vertical take-off and landing, flexible deployment, and hovering capability, provide new opportunities to overcome the limitations of conventional DOAS observation platforms and improve near-surface pollution characterization [14]. In recent years, UAV-based spectroscopic remote sensing techniques have been applied to pollution source identification, plume tracking, and vertical profiling of atmospheric pollutants, demonstrating considerable potential for atmospheric monitoring. Peng et al. [15] employed a UAV-borne hyperspectral system to accurately localize emission sources; Souza et al. [16] integrated UAV-based methane measurements with ground-level wind field information to identify potential gas leakage regions; Chen et al. [17] characterized the vertical distribution of ozone within the urban boundary layer based on UAV observations; and Zou et al. [18] further improved spatial attribution accuracy for NO2 emission sources. These studies demonstrate that UAV platforms can enhance the spatial flexibility and characterization capability of atmospheric pollution observations. However, existing UAV-based spectroscopic observations have mainly focused on retrieving individual pollutant concentrations or making measurements along single flight paths [19]. The detailed characterization of two-dimensional pollutant distributions and transport processes under multi-component pollution conditions remains insufficient. Therefore, developing a two-dimensional DOAS (2D-DOAS) observation system that integrates the spatial scanning capability of UAV platforms with the multi-component retrieval capability of DOAS is essential for improving the characterization of near-surface complex air pollution.
Here, a lightweight and modular rotary-wing UAV-borne two-dimensional differential optical absorption spectroscopy (2D-DOAS) observation system was developed by integrating the mobility of UAV platforms with the high sensitivity of DOAS for fine-scale observation of near-surface trace gases. Based on this system, a multi-altitude and multi-azimuth observation strategy was established to characterize the spatial distributions of trace gases and investigate complex pollution and atmospheric transport processes. The overall methodology included system integration, flight-attitude stability assessment, spectral calibration, DOAS retrieval, system validation, and field application. The reliability of the measurement approach was further evaluated through flight stability assessment, quality-controlled spectral retrievals, and comparison with a commercial ground-based MAX-DOAS instrument. This framework enables multi-altitude and multi-azimuth observations of near-surface trace gases under field conditions.
2. UAV-Borne Two-Dimensional DOAS Observation System
2.1. Measurement Principle of UAV-Borne DOAS
UAV-borne differential optical absorption spectroscopy (DOAS) uses scattered sunlight as a passive light source and identifies trace gases by analyzing their characteristic absorption features along atmospheric optical paths, enabling quantitative retrieval of atmospheric trace gas concentrations. The absorption process of atmospheric gases can be described by the Lambert–Beer law:
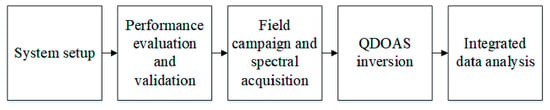
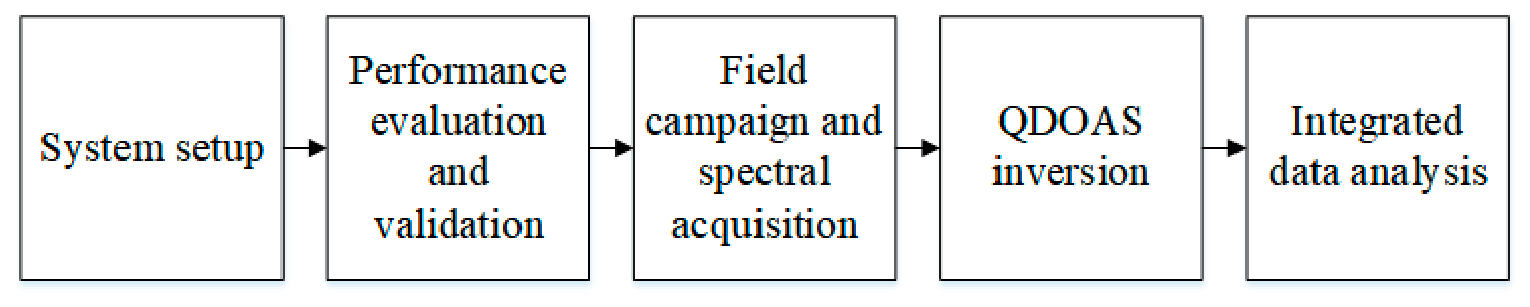
where I0(λ) represents the incident light intensity before atmospheric absorption and scattering, I(λ) represents the received light intensity after atmospheric absorption and scattering, λ denotes the wavelength, j denotes the index of the absorbing gas species, σj(λ) represents the absorption cross-section of the j-th gas species, cj represents its average concentration along the optical path, L represents the optical path length, and εR(λ) and εM(λ) denote the Rayleigh and Mie scattering coefficients, respectively. The term A(λ) represents a wavelength-dependent correction factor accounting for atmospheric turbulence effects. Under complex atmospheric conditions, the optical path length is generally unknown; therefore, the concentration distribution and optical path length are combined and expressed as the slant column density (SCD) of trace gases [20], which can be defined as , where s represents the distance along the optical path. In practical applications, optical interference caused by Rayleigh and Mie scattering exhibits slowly varying spectral structures, which can be removed using high-pass filtering methods to retain the narrow-band absorption features associated with trace gases. The processed spectra are then analyzed using nonlinear least-squares fitting to retrieve the SCDs of trace gases. The overall technical workflow of the UAV-borne two-dimensional DOAS observation experiment is illustrated in Figure 1.
Figure 1.
Workflow of the UAV-borne two-dimensional DOAS observation experiment.
2.2. Construction of the UAV-Borne 2D-DOAS Measurement System
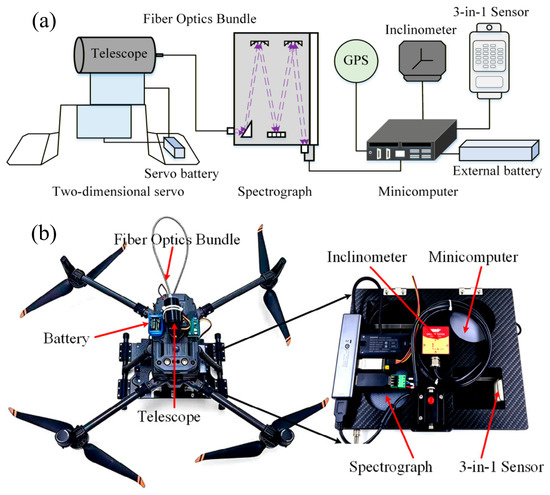
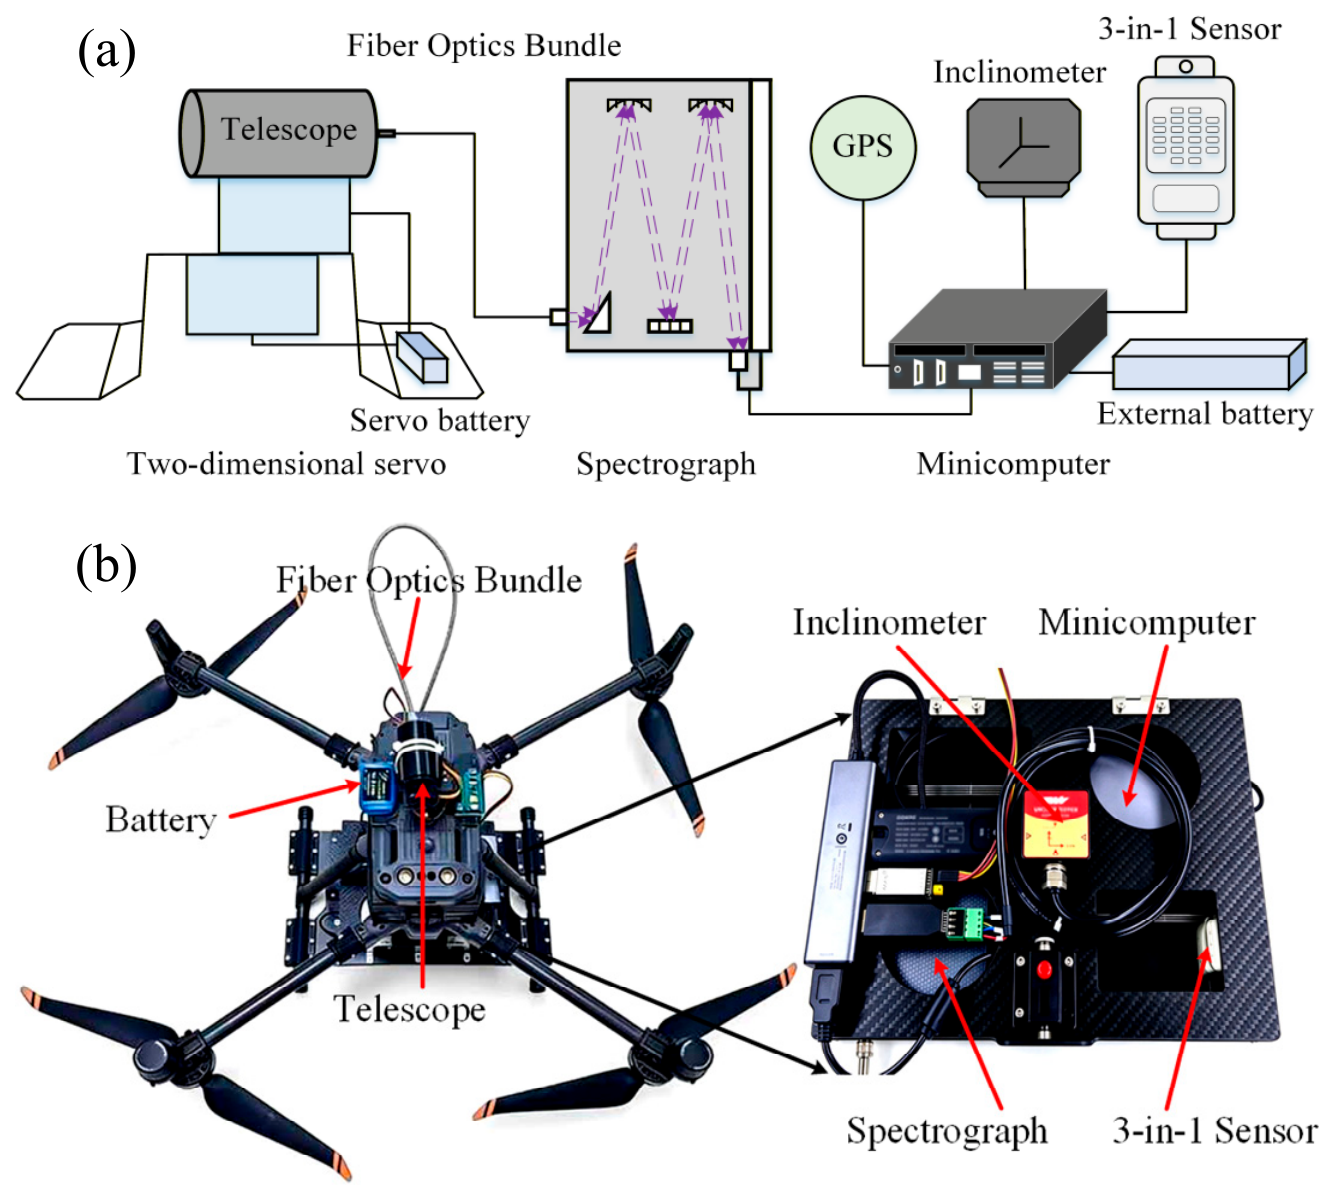
The overall configuration of the UAV-borne 2D-DOAS measurement system is illustrated in Figure 2. Figure 2a shows the schematic diagram of the hardware configuration, while Figure 2b shows the integrated system mounted on the UAV platform. The system consists of five major components, a mini-computer, an optical module, a power supply module, a spectral acquisition module, and an attitude and positioning sensing module, which collectively perform spectral data acquisition, transmission, and processing.
Figure 2.
UAV-borne 2D-DOAS measurement system: (a) schematic diagram; (b) photograph of the integrated system. The purple dashed arrows indicate the optical paths inside the spectrograph.
The mini-computer serves as the core controller of the system and is responsible for real-time spectral acquisition, data storage, and coordinated control of the individual hardware modules. It supports high-speed bidirectional data transmission through a Type-C interface and the power delivery (PD) protocol, ensuring stable system operation. The optical module consists of an Avantes Nexos-series mini spectrometer (Avantes B.V., Apeldoorn, The Netherlands) and a 600 μm-core-diameter, 1 m-long single-core quartz fiber, which together enable spectral signal collection, transmission, and preliminary processing. The spectrometer operates within the wavelength range of 280–438 nm, with a spectral resolution of 0.34 nm and a total weight of 277.5 g, satisfying the lightweight requirements of UAV-based applications. The power supply module uses a separate power distribution design, with customized power configurations for different components to improve supply stability and minimize interference-related measurement errors or hardware failures. The spectral acquisition module comprises an STM32 microcontroller (STMicroelectronics, Geneva, Switzerland), telescope, and two-dimensional servo platform, which serves as the key unit for multi-angle spectral scanning. The attitude and positioning sensing module integrates an HWT905-series nine-axis inertial sensor (WitMotion Shenzhen Co., Ltd., Shenzhen, China) and DJI Pilot 2 software to monitor UAV flight status and environmental parameters in real time, providing essential information for data screening and subsequent analysis of pollutant transport processes.
For the UAV platform, the DJI Matrice 350 RTK (M350 RTK; SZ DJI Technology Co., Ltd., Shenzhen, China) multi-rotor UAV was selected as the carrier for the 2D-DOAS system. The UAV provides a maximum payload capacity of 2.7 kg, resistance to wind speeds up to Beaufort scale 7 (15 m/s), and a maximum flight endurance of 55 min, meeting the operational requirements of multi-altitude observations using the UAV-borne 2D-DOAS system.
During system integration and installation design, the spatial arrangement of sensing components plays a key role in measurement reliability. Hedworth et al. [21] reported that rotor-induced downwash and airframe disturbances may introduce measurement uncertainties, so sensing components should be positioned close to the UAV central axis in relatively undisturbed airflow regions. Based on these considerations, the two-dimensional servo platform, battery, microcontroller board, and telescope were mounted on the upper side of the UAV, whereas other components were installed underneath the platform. This configuration maintained center-of-gravity balance while minimizing optical path obstruction caused by the UAV structure, thereby improving spectral observation integrity and stability.
The equipment enclosure, an important structural component of the UAV platform, was custom-designed with SolidWorks 2022 to ensure structural integrity and operational stability during flight. The enclosure was constructed using six lightweight and high-strength carbon fiber panels connected through interlocking structures. The bottom and side panels were fixed with L-shaped brackets, while the upper panel was designed to be detachable for convenient maintenance and component replacement. Openings for optical fiber routing were designed on the front panel, and ventilation holes were incorporated on the top and side panels to improve heat dissipation and reduce structural weight. The enclosure mounting structure was closely integrated with the UAV landing gear to provide a rigid mechanical connection. The overall design satisfied mechanical strength requirements while optimizing payload distribution, resulting in a lightweight system suitable for stable and reliable two-dimensional spectral observations under field conditions.
Before each experiment, the desired angles of the two servo motors were preset with the Visual Basic (VB)-based host-computer software. During measurements, the microcontroller controlled the two-dimensional servo platform to rotate according to the predefined angles, thereby adjusting the azimuth and elevation angles of the telescope. After propagating through the atmosphere, scattered sunlight was collected by the telescope and transmitted to the spectrometer through the optical fiber. Following grating dispersion and charge-coupled device (CCD) photoelectric conversion, the spectral data were received and stored by the mini-computer, enabling spectral acquisition from different viewing directions.
2.3. System Stability Evaluation
In UAV-based atmospheric observations, attitude variations can significantly affect system stability. Real-time monitoring and control of yaw, pitch, and roll angles are therefore critical for high-precision gas measurements. Variations in yaw angle may cause deviations from the planned flight trajectory, while fluctuations in pitch and roll angles can influence flight stability and potentially affect measurement reliability. Therefore, maintaining stable UAV attitudes is essential for ensuring measurement accuracy and reliable operation of the airborne observation system.
In this study, an attitude and positioning sensing module consisting of an inclination sensor and DJI Pilot 2 software was used to monitor UAV attitude variations in real time. During the experiments, the sensor sampling frequency was set to 10 Hz, and ten measurements were collected per second for analysis. Variations in UAV attitude directly affect the stability of the observation path and consequently influence spectral acquisition accuracy. During hovering measurements, the mean deviations in yaw, pitch, and roll angles were 0.002°, 0.077°, and 0.098°, respectively, with Root Mean Square Errors (RMSEs) below 0.5°, indicating stable UAV attitude variations. However, slight fluctuations in UAV attitude were occasionally observed, which may have been caused by airflow disturbances or mechanical vibrations of the payload. To improve data quality, attitude data collected during unstable periods were filtered and excluded, and only stable periods were retained for subsequent processing. This data screening procedure effectively reduced the influence of attitude fluctuations on measurements and improved the reliability of the final dataset.
2.4. Validation of the UAV-Borne 2D-DOAS System
To evaluate the accuracy and reliability of spectral measurements and retrieval results obtained by the UAV-borne 2D-DOAS system under field conditions, a commercial ground-based multi-axis differential optical absorption spectroscopy (MAX-DOAS) instrument was used as a reference for synchronized comparative observations [22]. The experiment was conducted on the fifth floor of the Physics Building at Huaibei Normal University (33°58′ N, 116°48′ E). The site was strongly influenced by anthropogenic emissions and was considered representative for comparing near-surface pollutant observations. The commercial MAX-DOAS instrument was installed on the rooftop, with the telescope pointing toward the urban area. Solar scattered spectra were automatically collected at ten elevation angles (1°, 2°, 3°, 4°, 5°, 6°, 8°, 15°, 30°, and 90°). The UAV-borne 2D-DOAS system performed synchronized measurements at the same azimuth angle using seven selected elevation angles (2°, 3°, 4°, 5°, 6°, 8°, and 90°). To ensure comparable measurement conditions, both systems automatically adjusted spectral integration times according to real-time illumination conditions, maintaining comparable temporal resolutions.
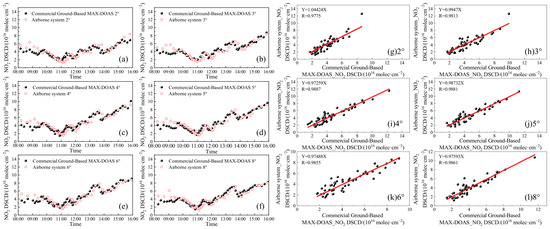
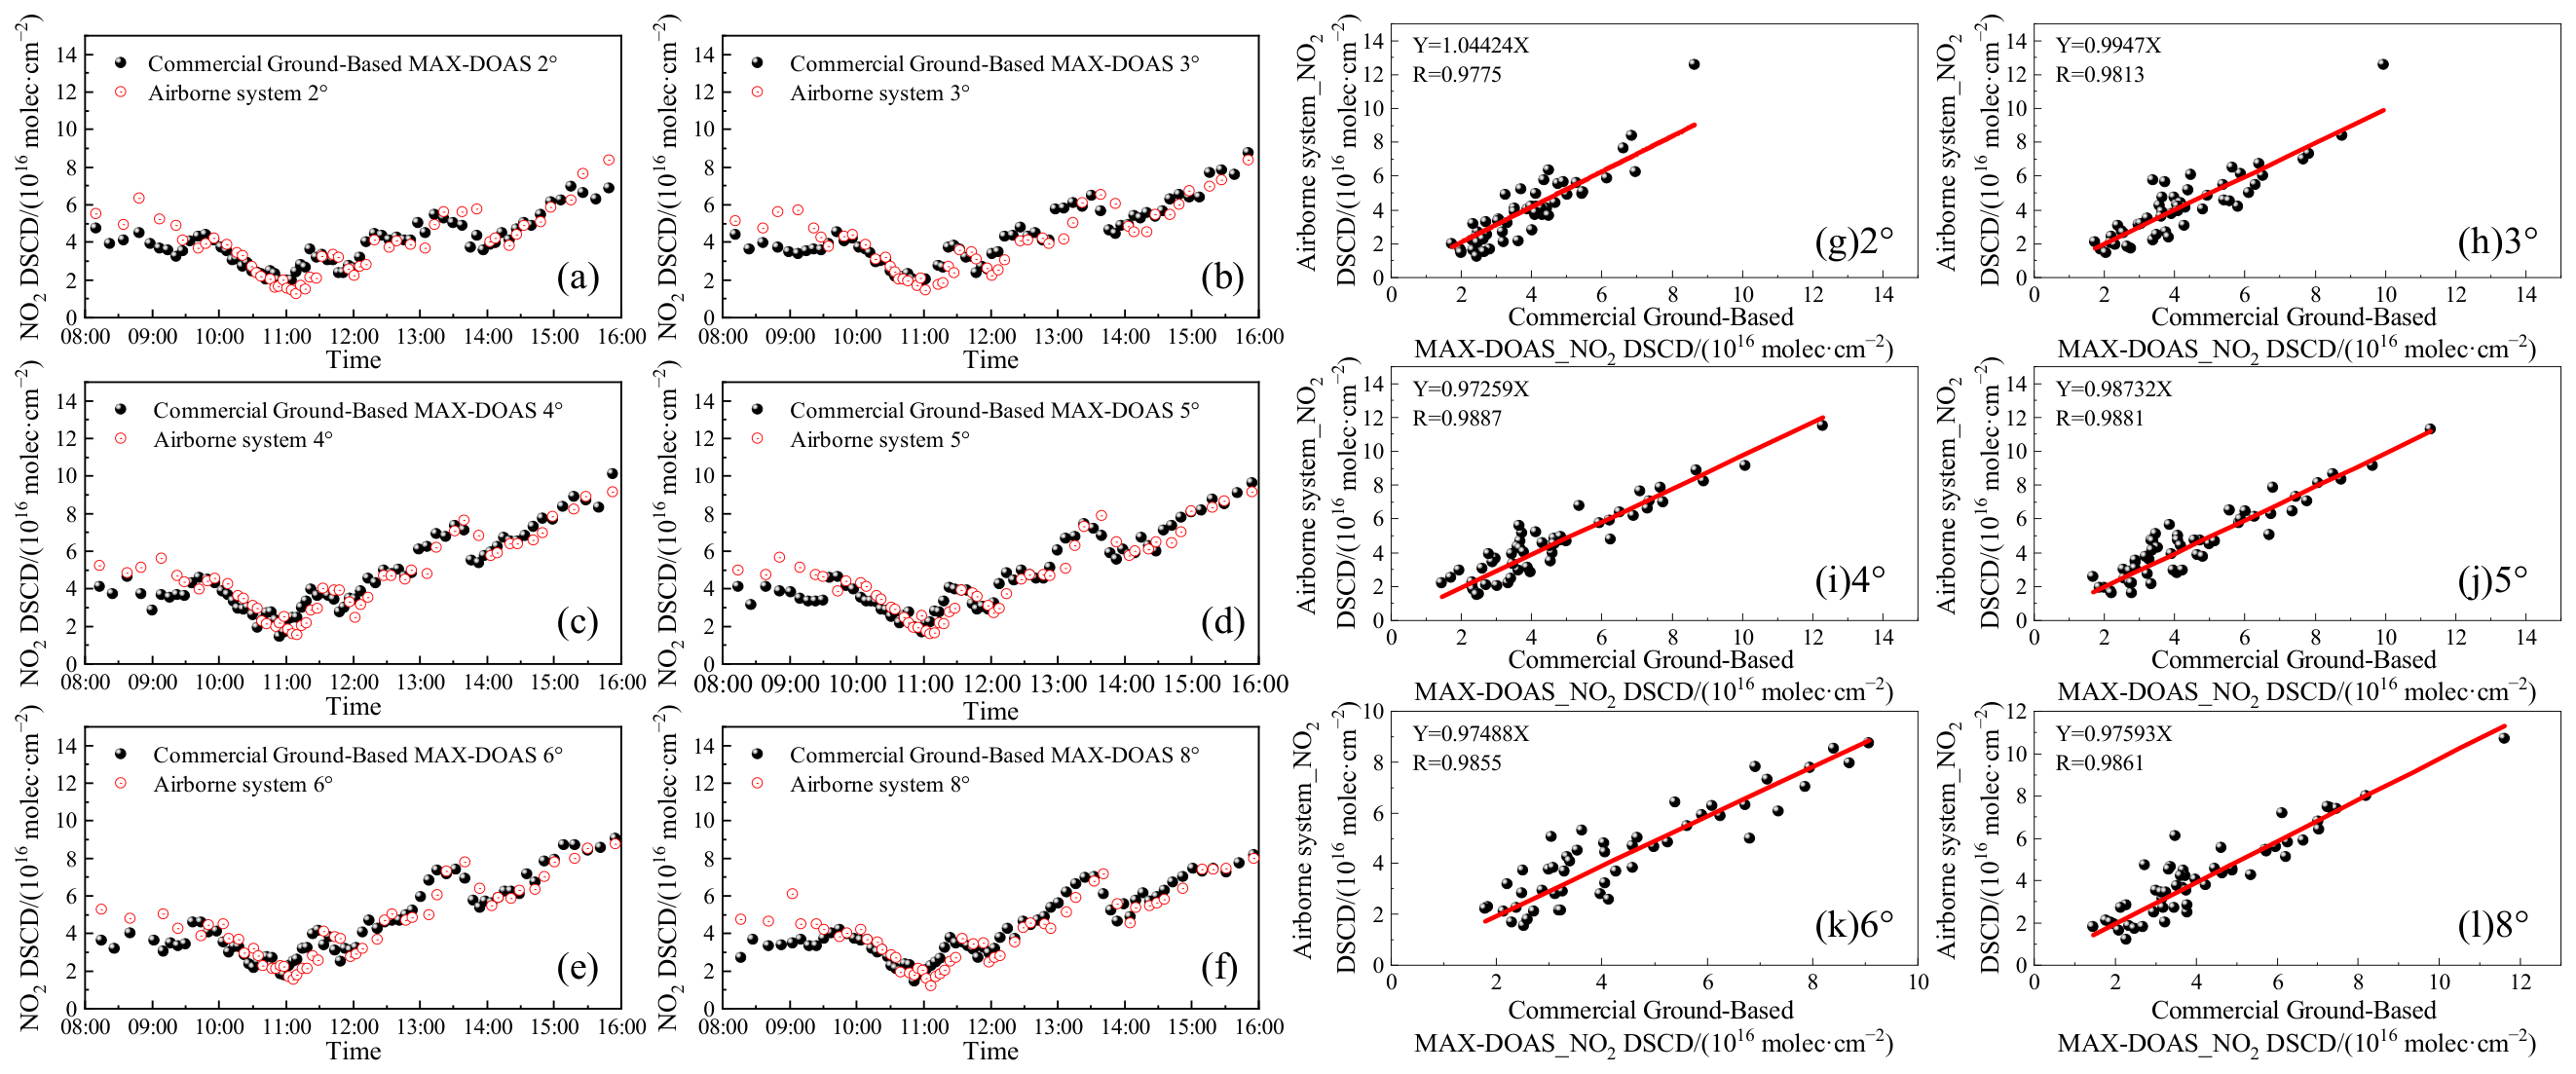
During data processing, spectra collected at a 90° elevation angle within the same measurement sequence were used as reference spectra for both systems. The retrieved NO2 differential slant column densities (DSCDs) at different elevation angles were compared, and correlation analyses were performed. Figure 3 presents time series comparisons and regression analyses of NO2 DSCDs obtained by the two systems during the observation period. The time series results show that NO2 DSCDs retrieved at different elevation angles exhibited similar temporal variations and pronounced bimodal patterns. Chen et al. [23] reported that the average diurnal variation in NO2 volume fractions generally exhibits a single-peak pattern in spring and summer, whereas a bimodal pattern is commonly observed during autumn and winter. This seasonal difference is mainly associated with variations in emission characteristics, boundary layer evolution, and photochemical activity. The regression analysis showed correlation coefficients of 0.9775, 0.9813, 0.9887, 0.9881, 0.9855, and 0.9861 for the corresponding elevation angles, indicating strong linear relationships between the retrieval results from the two systems. These results demonstrate that the UAV-borne 2D-DOAS system provides stable spectral acquisition and reliable retrieval performance, supporting accurate observations of near-surface trace gases and providing a robust data foundation for subsequent multi-altitude and multi-azimuth spatial distribution measurements.
Figure 3.
Comparison of NO2 DSCDs retrieved by the UAV-borne 2D-DOAS and ground-based MAX-DOAS systems: (a–f) time series and (g–l) regression analyses at elevation angles of 2°, 3°, 4°, 5°, 6°, and 8°. In (g–l), black dots represent the paired measurements from the two instruments, and red lines represent the zero-intercept linear regression fits.
3. Experimental Section
3.1. Experimental Setup
The UAV-based vertical observation experiments were conducted at the playground of the Xiangshan Campus, Huaibei Normal University, Huaibei City, Anhui Province (33°58′ N, 116°48′ E). The surrounding area is characterized by pronounced near-surface pollutant emissions and dispersion. Industrial clusters are located to the west, north, and east of the site, while densely populated residential areas and major urban roads are distributed to the south. The atmospheric environment is therefore strongly influenced by anthropogenic emissions from residential activities and transportation sources [24].
Meteorological and environmental observations showed that the air quality index (AQI) reached its highest value of the observation period on 14 January 2026, when the temperature was also the highest among all measurement days. Wind field data were obtained from a meteorological station located on the fifth floor of the Physics Building at Huaibei Normal University. The station continuously recorded meteorological parameters with a 3-min temporal resolution, and instantaneous wind direction and speed between 11:00 and 14:00 were selected for analysis. The results indicated that wind speeds from the northwest direction were generally higher during the observation period, whereas relatively lower wind speeds were observed from the north and southeast directions. The maximum wind speed reached 8 m/s. To minimize systematic uncertainties caused by solar elevation angle variations, all field experiments were conducted between 12:00 and 14:00, when solar elevation remained relatively stable. This strategy reduced the influence of solar radiation fluctuations on spectral acquisition and retrieval accuracy.
A combined layered-hovering and horizontal-scanning strategy was adopted for field observations. The UAV equipped with the 2D-DOAS system performed measurements at five altitude levels of 30, 50, 70, 90, and 110 m above ground level (AGL). At each altitude, a zenith spectrum was first collected as the reference spectrum. Subsequently, horizontal observations were performed with a fixed elevation angle of 0°, starting from the north direction (0°). The azimuth angle was then rotated clockwise in 15° increments. Each complete scanning cycle consisted of one zenith spectrum and 24 azimuthal spectra (25 spectra in total), requiring approximately 5 min. Spectral measurements obtained under stable hovering conditions, with altitude deviations controlled within ±1 m, were considered valid.
3.2. Data Processing
The QDOAS software (Version 3.4, based on a least-squares fitting algorithm) [25] was used to retrieve the differential slant column densities (DSCDs) of NO2, SO2, HCHO, and O4 (http://uv-vis.aeronomie.be/software/QDOAS/ (accessed on 5 January 2026)). Before spectral analysis, the corresponding .clb calibration file was generated using mercury lamp spectra to establish an accurate wavelength calibration between detector pixels and wavelengths. This procedure enabled QDOAS to correctly interpret the spectral axis, match absorption cross-sections, and improve retrieval accuracy. During the fitting process, the zenith spectrum collected within each scanning cycle was used as the reference spectrum. The fitting windows and absorption cross-sections were selected as follows: NO2 and O4 were analyzed in the 338–370 nm wavelength range, SO2 in the 312–326 nm range, and HCHO in the 322–358 nm range. The retrieval procedure included temperature-dependent absorption cross-sections of target gases, ozone (O3) absorption cross-sections at two temperatures, and Ring spectra calculated by QDOAS. O3 was included as an interfering absorber during spectral fitting [26,27], with two absorption cross-sections at different temperatures used to account for its temperature dependence. In contrast, O4 was retrieved as an auxiliary optical parameter because its absorption is related to the atmospheric photon path and aerosol-related optical effects [22,28]. A fifth-order polynomial was applied for broadband spectral structure correction, and an intensity offset term was included to correct baseline shifts.
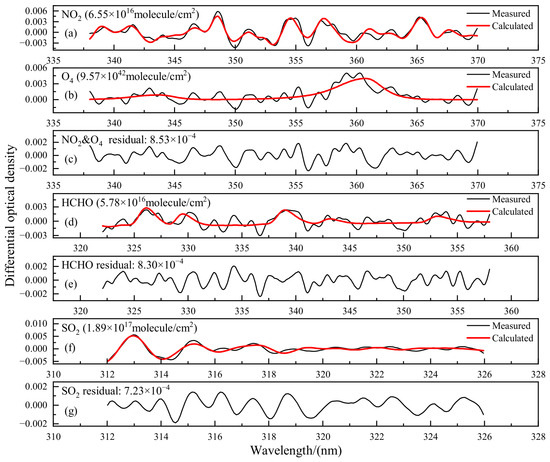
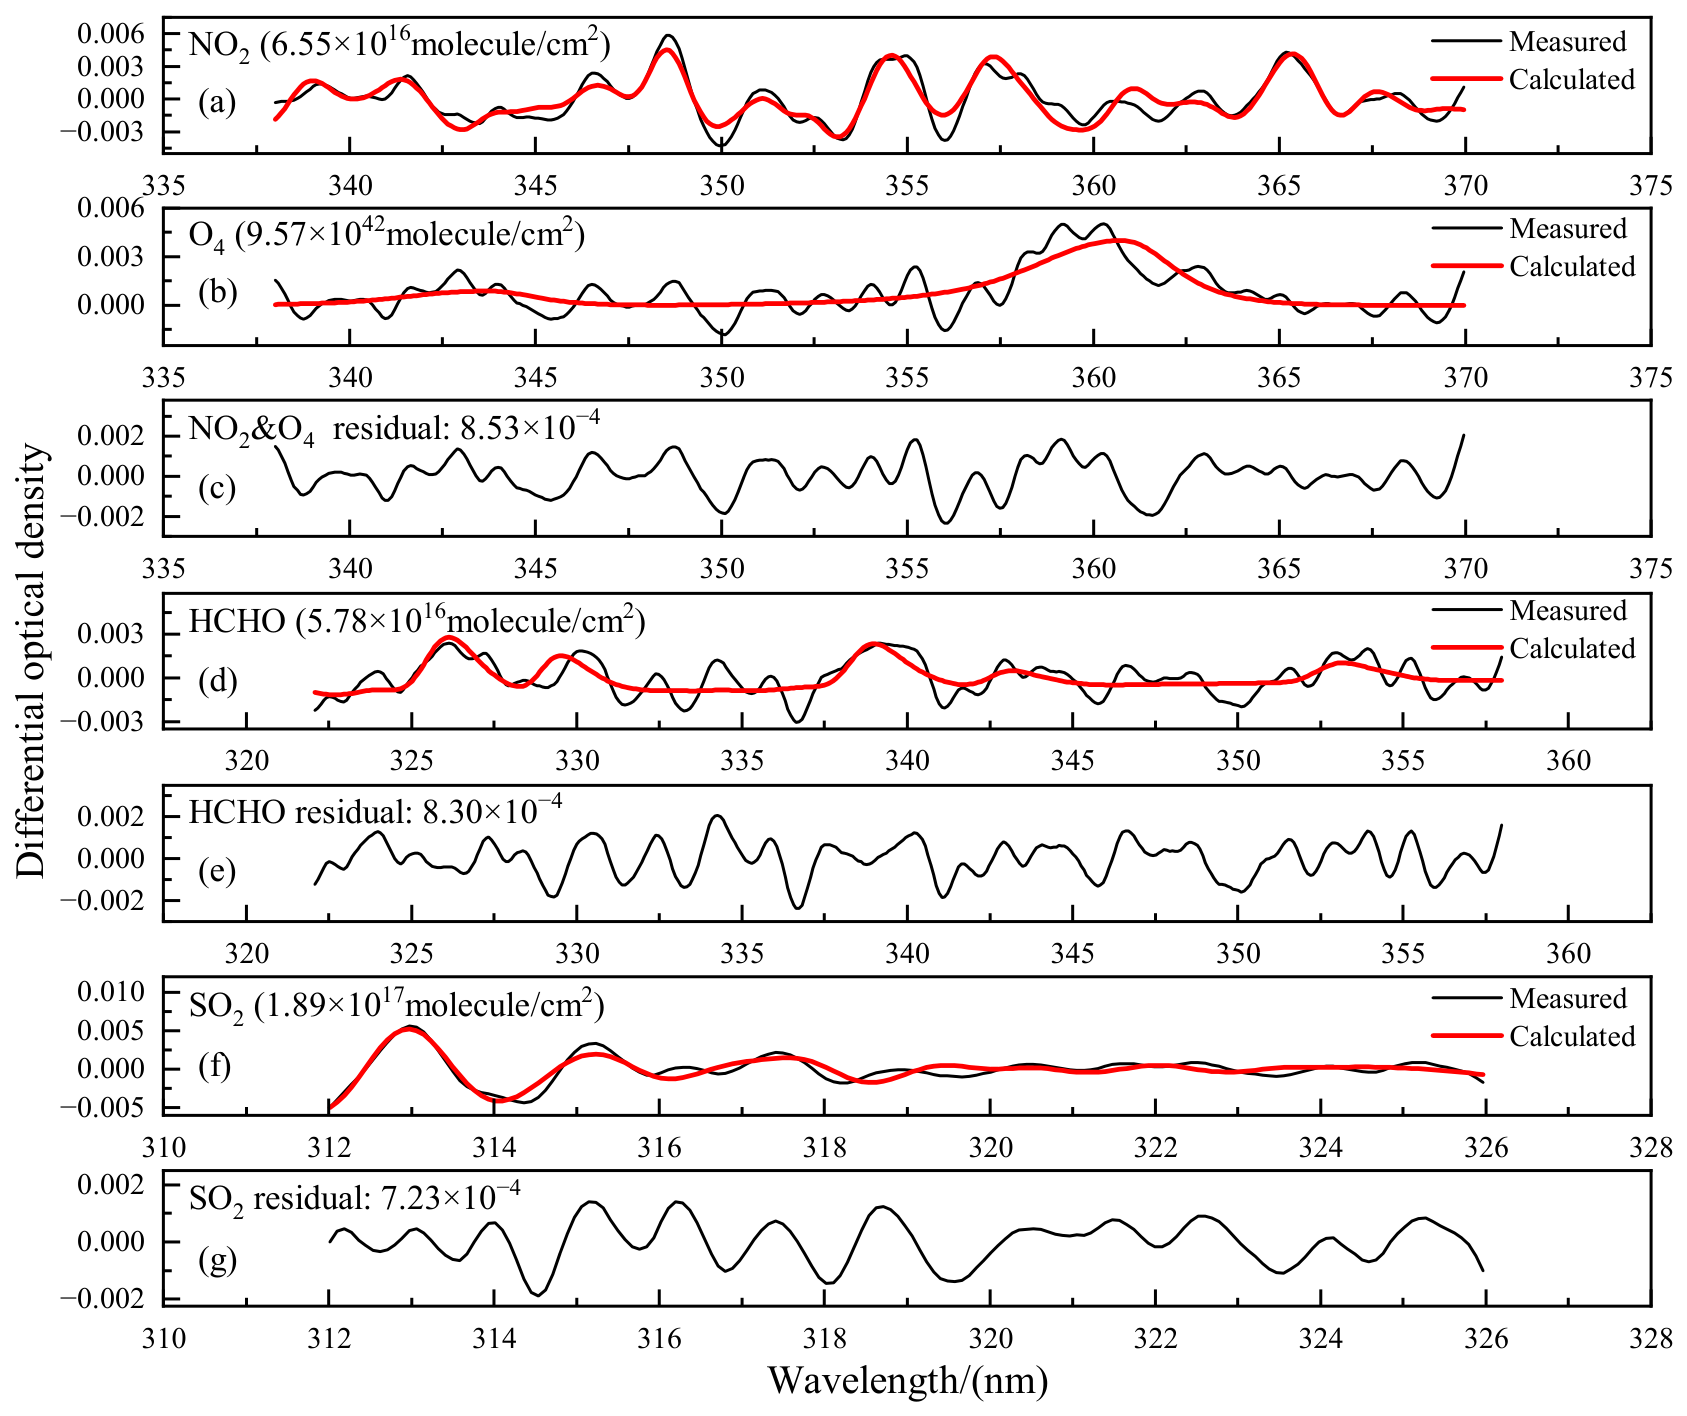
Figure 4 presents an example of spectral fitting results obtained at 12:44 on 14 January 2026, when the UAV was operated at an altitude of 110 m and an azimuth angle of 150° (30° south of east). The root mean square (RMS) residual between the measured and calculated differential optical densities was used to assess the spectral fitting quality [25,29]. To minimize the influence of atmospheric scattering effects and residual trace gas absorption in the Fraunhofer reference spectrum, retrievals with RMS values greater than 0.01 or negative DSCD values were excluded from further analysis [30,31]. For the representative case shown in Figure 4, the RMS residuals were 8.53 × 10⁻⁴ for both the NO2 and O4 fittings, 8.30 × 10⁻⁴ for HCHO, and 7.23 × 10⁻⁴ for SO2, all substantially below the predefined threshold. The O4 and HCHO fittings show relatively more apparent residual structures, which may be associated with atmospheric scattering effects and the relatively weak HCHO absorption features, respectively [32,33].
Figure 4.
Example of DOAS spectral fitting and retrieval results from the UAV-borne 2D-DOAS system at 12:44 on 14 January 2026: (a) NO2 fitting; (b) O4 fitting; (c) NO2 and O4 DSCD residuals; (d) HCHO fitting; (e) HCHO DSCD residual; (f) SO2 fitting; and (g) SO2 DSCD residual.
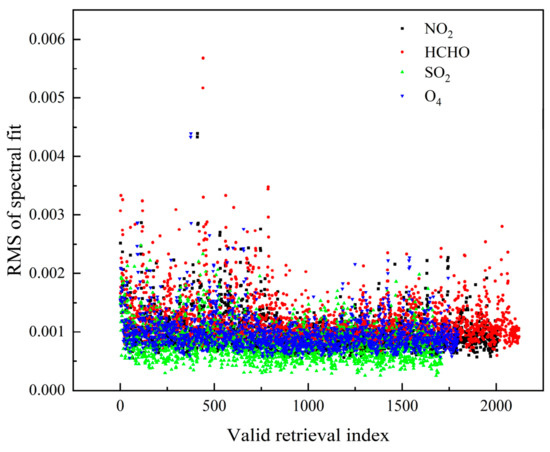
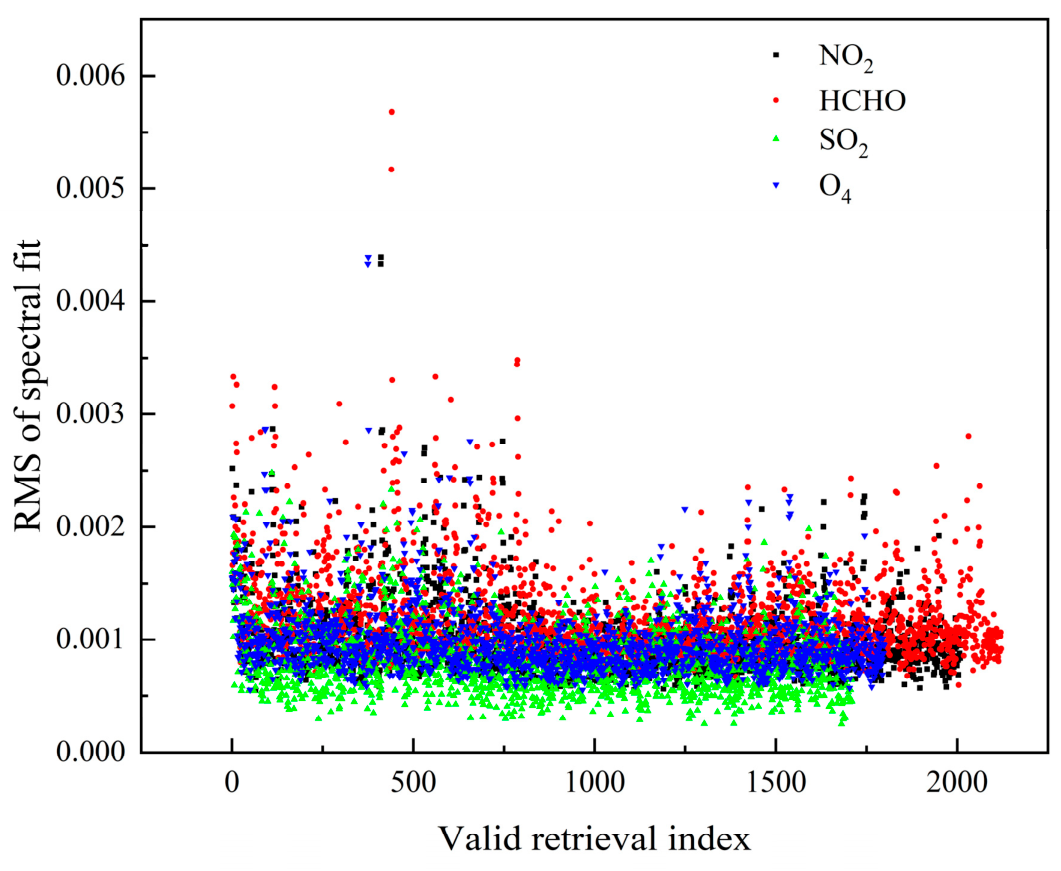
To further evaluate the overall fitting quality after quality control, the RMS residuals of the retained QDOAS retrievals were examined throughout the field campaign. As shown in Figure 5, the RMS residuals were predominantly below 0.003 for NO2, SO2, HCHO, and O4, with all retained retrievals remaining below the 0.01 threshold. These results indicate generally consistent spectral fitting quality among the retained retrievals. The quality-control procedure excluded 14.58%, 9.82%, 27.30%, and 23.51% of the original retrievals for NO2, SO2, HCHO, and O4, respectively.
Figure 5.
Distribution of RMS residuals for the retained QDOAS retrievals during the field campaign.
4. Data Analysis
4.1. Spatial Distribution Analysis of Trace Gases
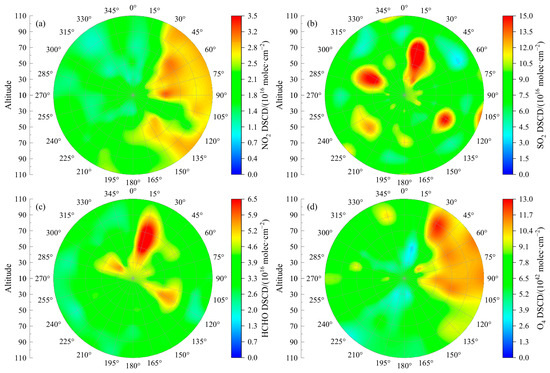
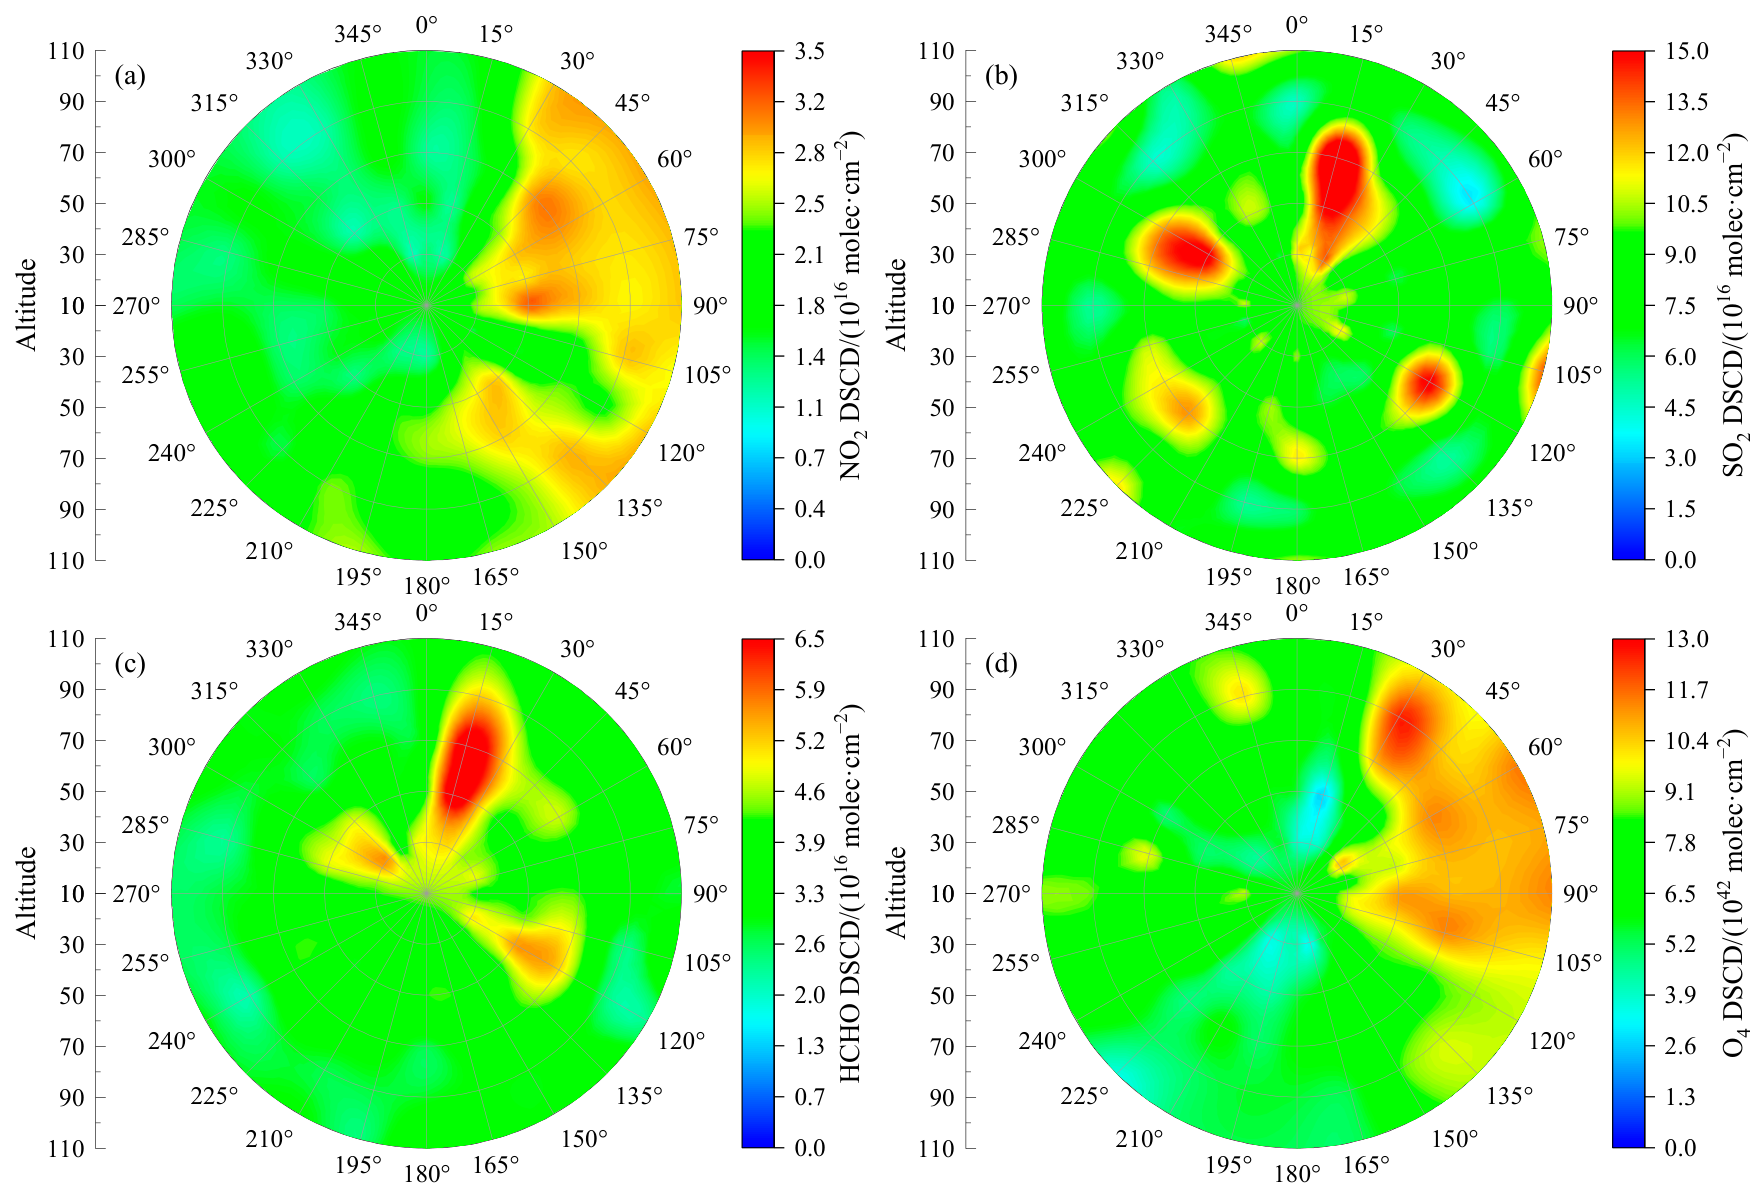
For all valid measurements collected during the 20-day observation period, the DSCD values of trace gases at each combination of observation altitude and azimuth angle were averaged over the entire observation period. The polar-coordinate spatial distributions of NO2, SO2, HCHO, and O4 DSCDs are presented in Figure 6. In these polar plots, the radial direction represents observation altitude, the angular direction represents azimuth angle, and the color scale indicates DSCD magnitude. This averaging approach minimized the impacts of short-term meteorological fluctuations, random measurement noise, and episodic emission events, thereby representing the long-term average spatial distribution of pollutants during the observation period.
Figure 6.
Polar-coordinate distributions of trace gas DSCDs derived from UAV-borne 2D-DOAS measurements: (a) NO2; (b) SO2; (c) HCHO; and (d) O4.
The spatial patterns shown in Figure 6 indicate that the enhanced regions of NO2 (Figure 6a) and O4 (Figure 6d) exhibited similar distributions and were mainly concentrated in the eastern sector (30–150°). Elevated values persisted above 30 m, which was likely associated with the industrial areas distributed in Duji District east of the observation site. Comparison of SO2 (Figure 6b) and HCHO (Figure 6c) distributions revealed that elevated concentrations of both species occurred simultaneously at specific azimuth angles (15°, 120°, and 300°), suggesting common industrial emission sources. At the 15° azimuth, enhanced SO2 and HCHO values were observed mainly between 50 and 90 m. At 120° and 300°, elevated SO2 values appeared around 50–70 m and approximately 70 m, respectively, which were higher than the corresponding HCHO enhancements at the same directions. This difference may be attributed to the relatively short atmospheric lifetime of HCHO and its susceptibility to photochemical degradation [30]. The distributions of all four species showed relatively low DSCD values in the northwest sector (315–0°). This pattern may be explained by the prevailing northwestern winds during the observation period and the presence of Xiangshan Mountain in this direction, which may inhibit the transport of external air masses and pollutants from industrial areas. In contrast, numerous industrial sources are located in northeastern Duji District. The combined effects of local emissions and wind transport likely contributed to the elevated pollutant levels in the eastern, especially northeastern, sector.
4.2. Daily Variation Analysis of Trace Gases
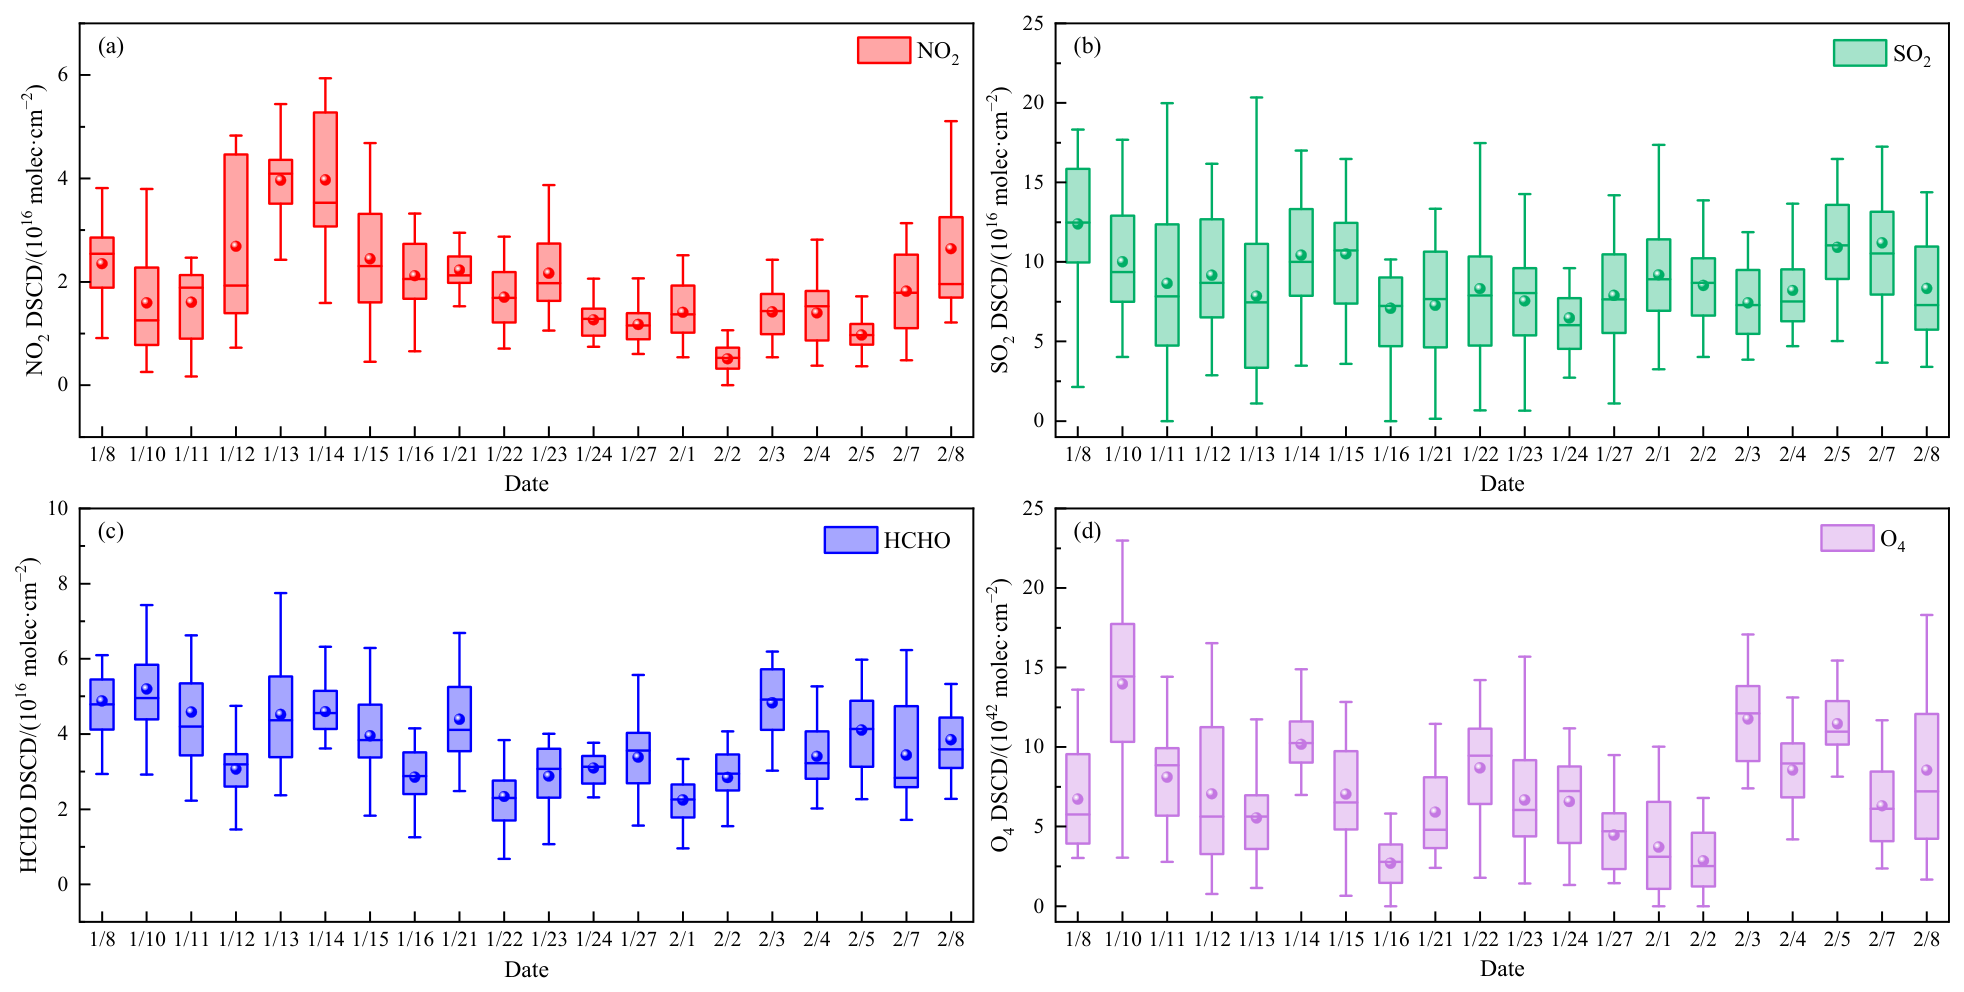
To further investigate the temporal variations in pollutant levels, daily box plots of DSCDs for the four trace gases during the observation period were constructed, as shown in Figure 7.
Figure 7.
Daily variations in DSCDs for four trace gases during the observation period: (a) NO2; (b) SO2; (c) HCHO; and (d) O4. The circles represent daily mean values, the horizontal lines within boxes indicate median values, the upper and lower edges of boxes denote the 75th and 25th percentiles, respectively, and the upper and lower whiskers represent the maximum and minimum values.
The results show that the maximum NO2 DSCD reached approximately 6 × 10¹⁶ molec∙cm−2 on 14 January, while the maximum O4 DSCD was approximately 2.3 × 1043 molec∙cm−2 on 10 January, with both values representing the highest levels observed during the measurement period. The DSCD values of SO2 and HCHO remained relatively stable throughout the observation period. The interquartile ranges of HCHO were generally distributed within (3–5) × 1016 molec∙cm−2. In contrast, SO2 exhibited relatively elevated DSCD values on most days, with maximum values approaching 2 × 10¹⁷ molec∙cm−2. Compared with the horizontal observation results reported by Ye et al. [8] on 21 May 2024, higher DSCD values of NO2, SO2, and HCHO were observed in this study. This difference may be attributed to enhanced anthropogenic emissions during the winter heating period and suppressed pollutant dispersion caused by atmospheric boundary layer inversion conditions.
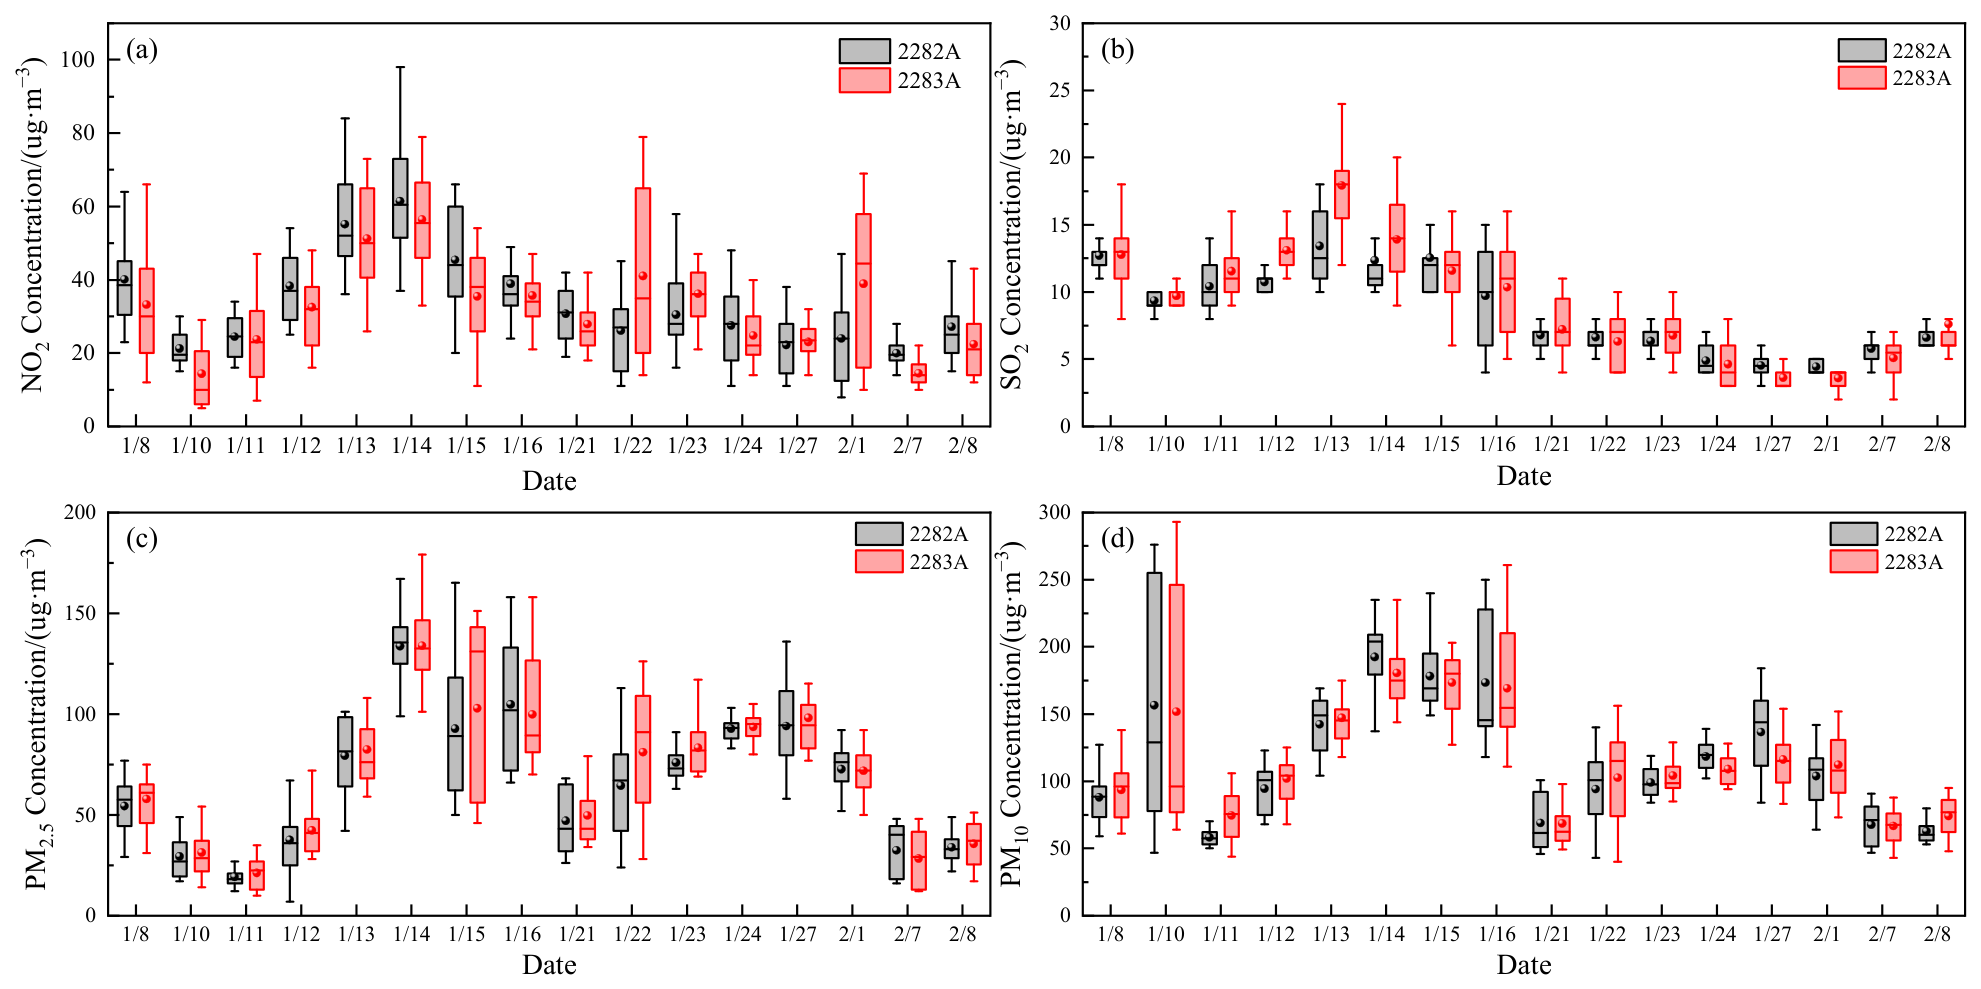
The variations in surface pollutant concentrations at Huaibei monitoring stations during the observation period are shown in Figure 8. The data were obtained from the National Urban Air Quality Real-time Publishing Platform of the China National Environmental Monitoring Centre, including station 2282A (Huaibei Monitoring Station) and station 2283A (Huaibei Lieshan District Government Monitoring Station). A comparison of Figure 7a with Figure 8a and of Figure 7b with Figure 8b indicates that the daily maximum values of NO2 and SO2 occurred on 14 January and 13 January, respectively. The DSCD values retrieved by the UAV-borne system exhibited daily variation patterns similar to those observed at the Huaibei monitoring stations. However, the two datasets represent different physical quantities: the monitoring stations provide near-surface pollutant concentrations, whereas the DOAS system retrieves differential slant column densities along effective atmospheric light paths. Therefore, the comparison with the surface monitoring data is used primarily to examine the temporal variability of the measured trace gases. As a stable atmospheric trace gas, O4 is primarily affected by the effective light path length and aerosol optical depth (AOD) [28]. Figure 8c,d show that PM10 reached its maximum concentration on 10 January, while both PM2.5 and PM10 remained relatively high from 13 January to 16 January. High particulate matter concentrations can enhance atmospheric light scattering and consequently modify the effective photon path length. During the campaign, 10 January exhibited the lowest temperature in Huaibei, and the stable atmospheric conditions associated with low temperatures may have suppressed particulate dispersion [22]. Therefore, the highest O4 DSCD value observed on 10 January may be associated with the combined effects of low-temperature conditions and enhanced aerosol loading, which increased the effective light path length [22,28].
Figure 8.
Variations in surface pollutant concentrations measured at Huaibei monitoring stations during the observation period: (a) NO2; (b) SO2; (c) PM2.5; and (d) PM10. The circles represent daily mean values, the horizontal lines within boxes indicate median values, the upper and lower edges of boxes denote the 75th and 25th percentiles, respectively, and the upper and lower whiskers represent the maximum and minimum values.
4.3. Two-Dimensional Spatiotemporal Variations in Trace Gases
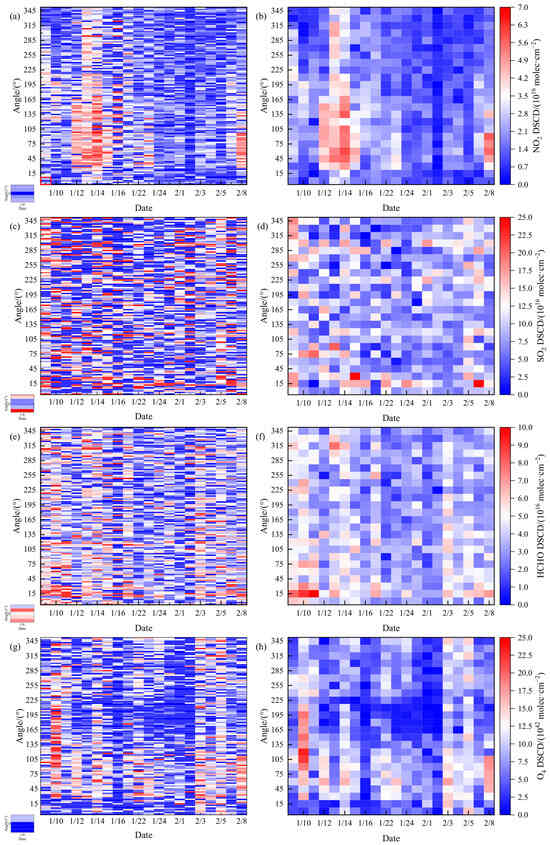
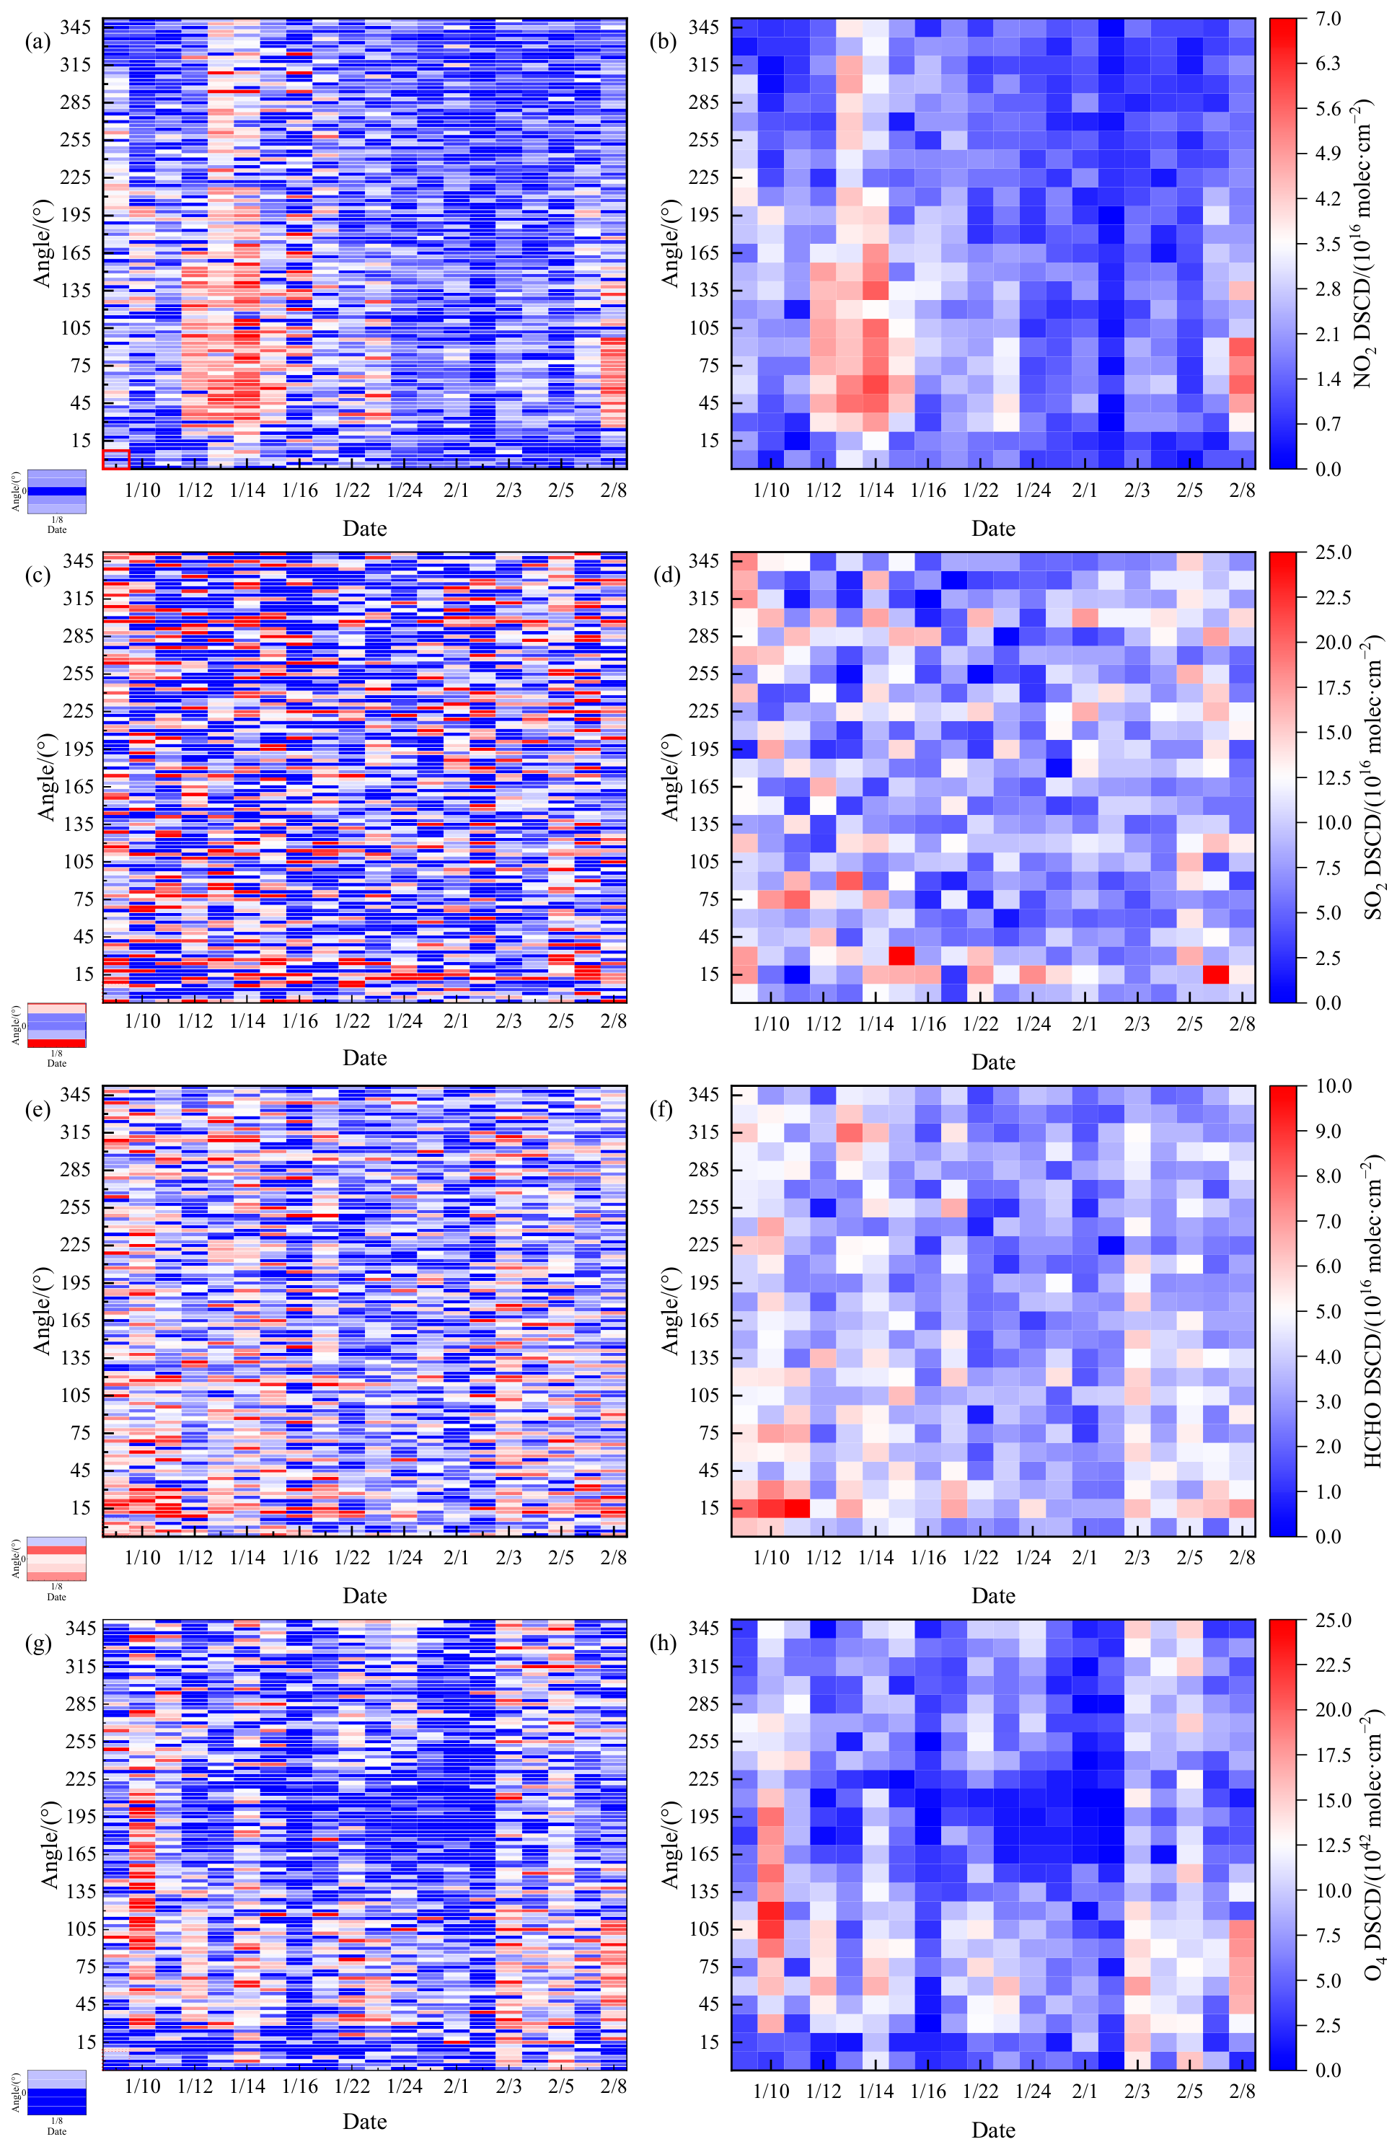
Figure 9 presents the two-dimensional spatiotemporal distributions of trace gas DSCDs as a function of azimuth angle and observation date. The horizontal axis represents the observation date, and the vertical axis represents the azimuth angle. Panels a,c,e,g show the variations in NO2, SO2, HCHO, and O4 DSCDs, respectively, at five observation heights. The enlarged inset in the lower-left corner shows the observations at an azimuth angle of 0° on 8 January 2026. The five horizontal lines from bottom to top correspond to the observation heights of 30, 50, 70, 90, and 110 m, respectively. Panels b,d,f,h show the height-averaged DSCD distributions derived from the corresponding left panels, providing clearer visualization of temporal and angular variations.
Figure 9.
Two-dimensional azimuth–date spatiotemporal distributions of trace gas DSCDs. (a) NO2; (b) height-averaged NO2; (c) SO2; (d) height-averaged SO2; (e) HCHO; (f) height-averaged HCHO; (g) O4; (h) height-averaged O4. The red boxes in (a,c,e,g) indicate observations at 0° azimuth on 8 January 2026.
As shown in Figure 9a,b, relatively high NO2 DSCD values were observed during mid-January (12–15 January), with enhanced regions mainly distributed in the eastern sector (30–150°). The maximum DSCD reached approximately 7 × 10¹⁶ molec∙cm−2. From late January to early February, NO2 levels decreased overall, accompanied by lower azimuth-averaged DSCD values. Compared with other observation periods, NO2 DSCDs on 14 January and O4 DSCDs on 10 January exhibited more concentrated enhanced distributions across multiple azimuth angles as shown in Figure 9a,b,g,h. Taking 180° as the boundary, enhanced values were more frequently observed in the eastern sector (0–180°), suggesting that pollutant levels were generally higher east of the observation site. As shown in Figure 9c–f, SO2 and HCHO DSCD distributions showed similar spatial patterns, with enhanced values appearing at an azimuth angle of 15°. This pattern suggests that industrial activities in Duji District, north of the observation site, may have contributed to the elevated pollutant levels in this direction. Compared with NO2 and O4, the enhanced regions of HCHO and SO2 were distributed more sporadically across azimuth angles, suggesting the coexistence of industrial point sources and scattered local emission sources around the observation site.
4.4. Angular Dependence and Vertical Heterogeneity of Trace Gas DSCDs
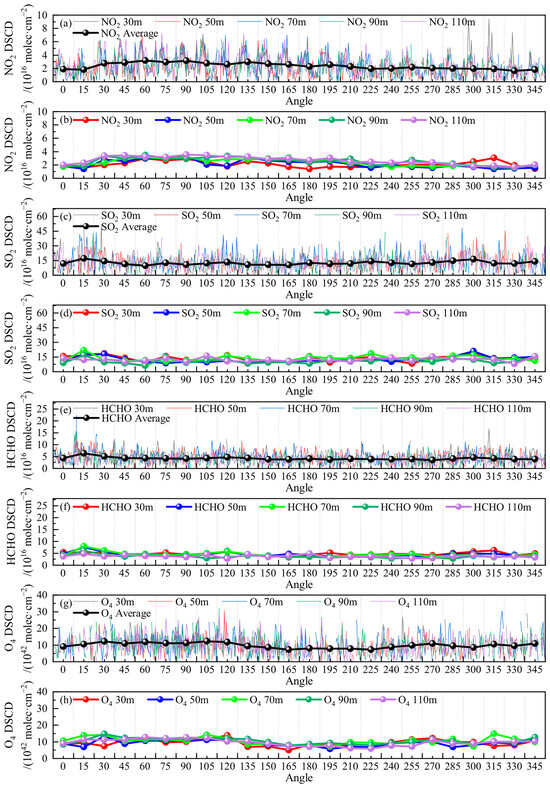
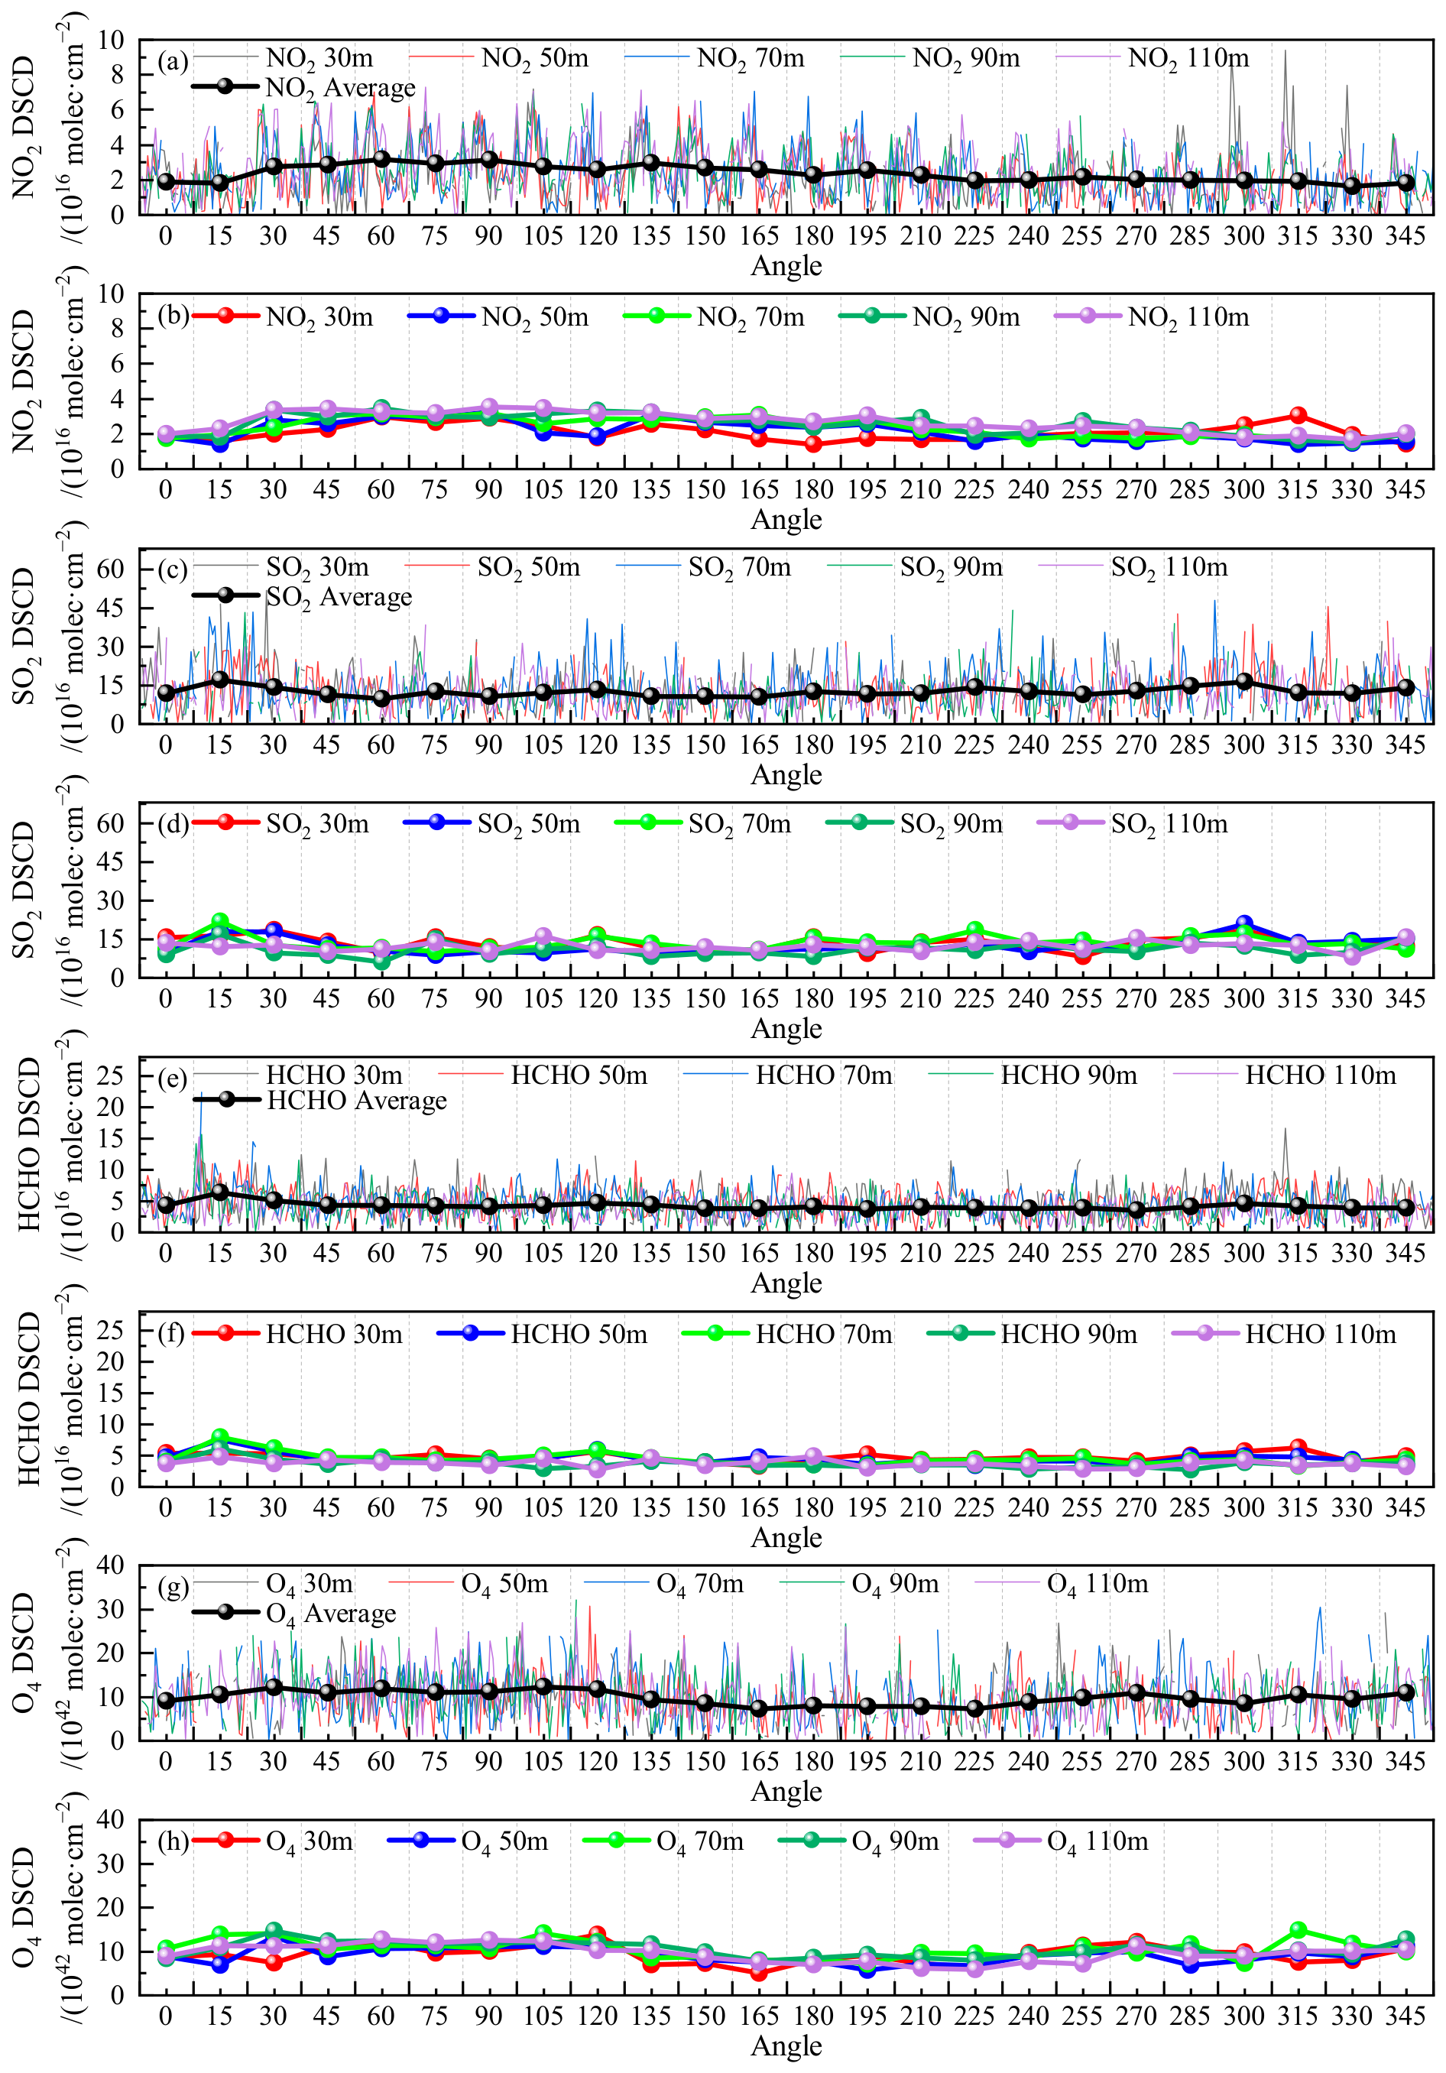
To further investigate how observation geometry influences trace gas distributions, the angular variations in DSCDs at different observation azimuth angles were analyzed, as shown in Figure 10. The horizontal axis represents the observation azimuth angle, while the vertical axis represents the DSCD values of NO2, SO2, HCHO, and O4. Panels a,c,e,g show the original DSCD observations at five heights under different azimuth angles, where black circles represent the height-averaged DSCD values. Panels b,d,f,h present the mean DSCD values at each altitude.
Figure 10.
Azimuthal distributions of trace gas DSCDs. (a) NO2; (b) mean NO2 DSCDs at each altitude; (c) SO2; (d) mean SO2 DSCDs at each altitude; (e) HCHO; (f) mean HCHO DSCDs at each altitude; (g) O4; (h) mean O4 DSCDs at each altitude.
Significant fluctuations in DSCD values were observed among the trace gases and altitude levels shown in Figure 10a,c,e,g. As shown in Figure 10a, the averaged NO2 DSCD increased and then decreased. Between 0° and 90°, NO2 DSCD gradually increased and reached a local maximum between 60° and 90°. From 90° to 180°, NO2 DSCD decreased and showed a pronounced minimum around 120°. After 180°, the DSCD values remained relatively stable, at approximately 2 × 10¹⁶ molec∙cm−2 with reduced variability. Figure 10c shows that the averaged SO2 DSCD exhibited considerable variations across most azimuth angles, with elevated values observed at 15° and 300°. These directional enhancements suggest contributions from industrial emission sources. As shown in Figure 10e, the averaged HCHO DSCD remained relatively stable overall, although an enhanced DSCD value was observed at 15°, which may be associated with industrial activities in Duji District in this direction. As shown in Figure 10g, the averaged O4 DSCD showed limited variability, with only minor fluctuations observed at several azimuth angles. As shown in Figure 10b,d,f,h, enhanced DSCD regions for the same trace gas occurred at different altitude levels depending on the observation azimuth angle. As shown in Figure 10b, NO2 DSCD values at 110 m were slightly higher than those at other altitudes for most azimuth angles. UAV-based observations have also demonstrated clear vertical variations in NO2 within the lower atmosphere [34]. As shown in Figure 10d, SO2 DSCD values at 70 m were generally higher than those at other altitude levels, which may be attributed to pollutant accumulation associated with elevated emission sources. Figure 10f indicates that HCHO DSCD values were relatively higher at 30, 50, and 70 m, which may be related to the short atmospheric lifetime of HCHO. As shown in Figure 10h, O4 DSCD values were relatively uniform among different altitude levels, reflecting its stable atmospheric optical characteristics.
Overall, trace gas levels were generally higher in the eastern sector than in the western sector. In addition, NO2 DSCD values at 120° were relatively low, with significant decreases observed at 30 and 50 m, whereas the 110 m layer showed no obvious variation. In contrast, O4 DSCD values increased at 120°, particularly at the 30 m altitude level. This discrepancy may be associated with building obstruction along this direction, which could perturb the effective optical path and thus influence the retrieved DSCD values.
4.5. Backward Trajectory Analysis and Air Mass Transport Characteristics
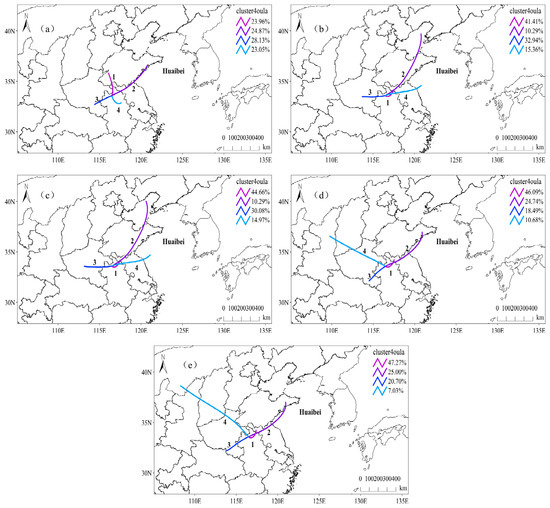
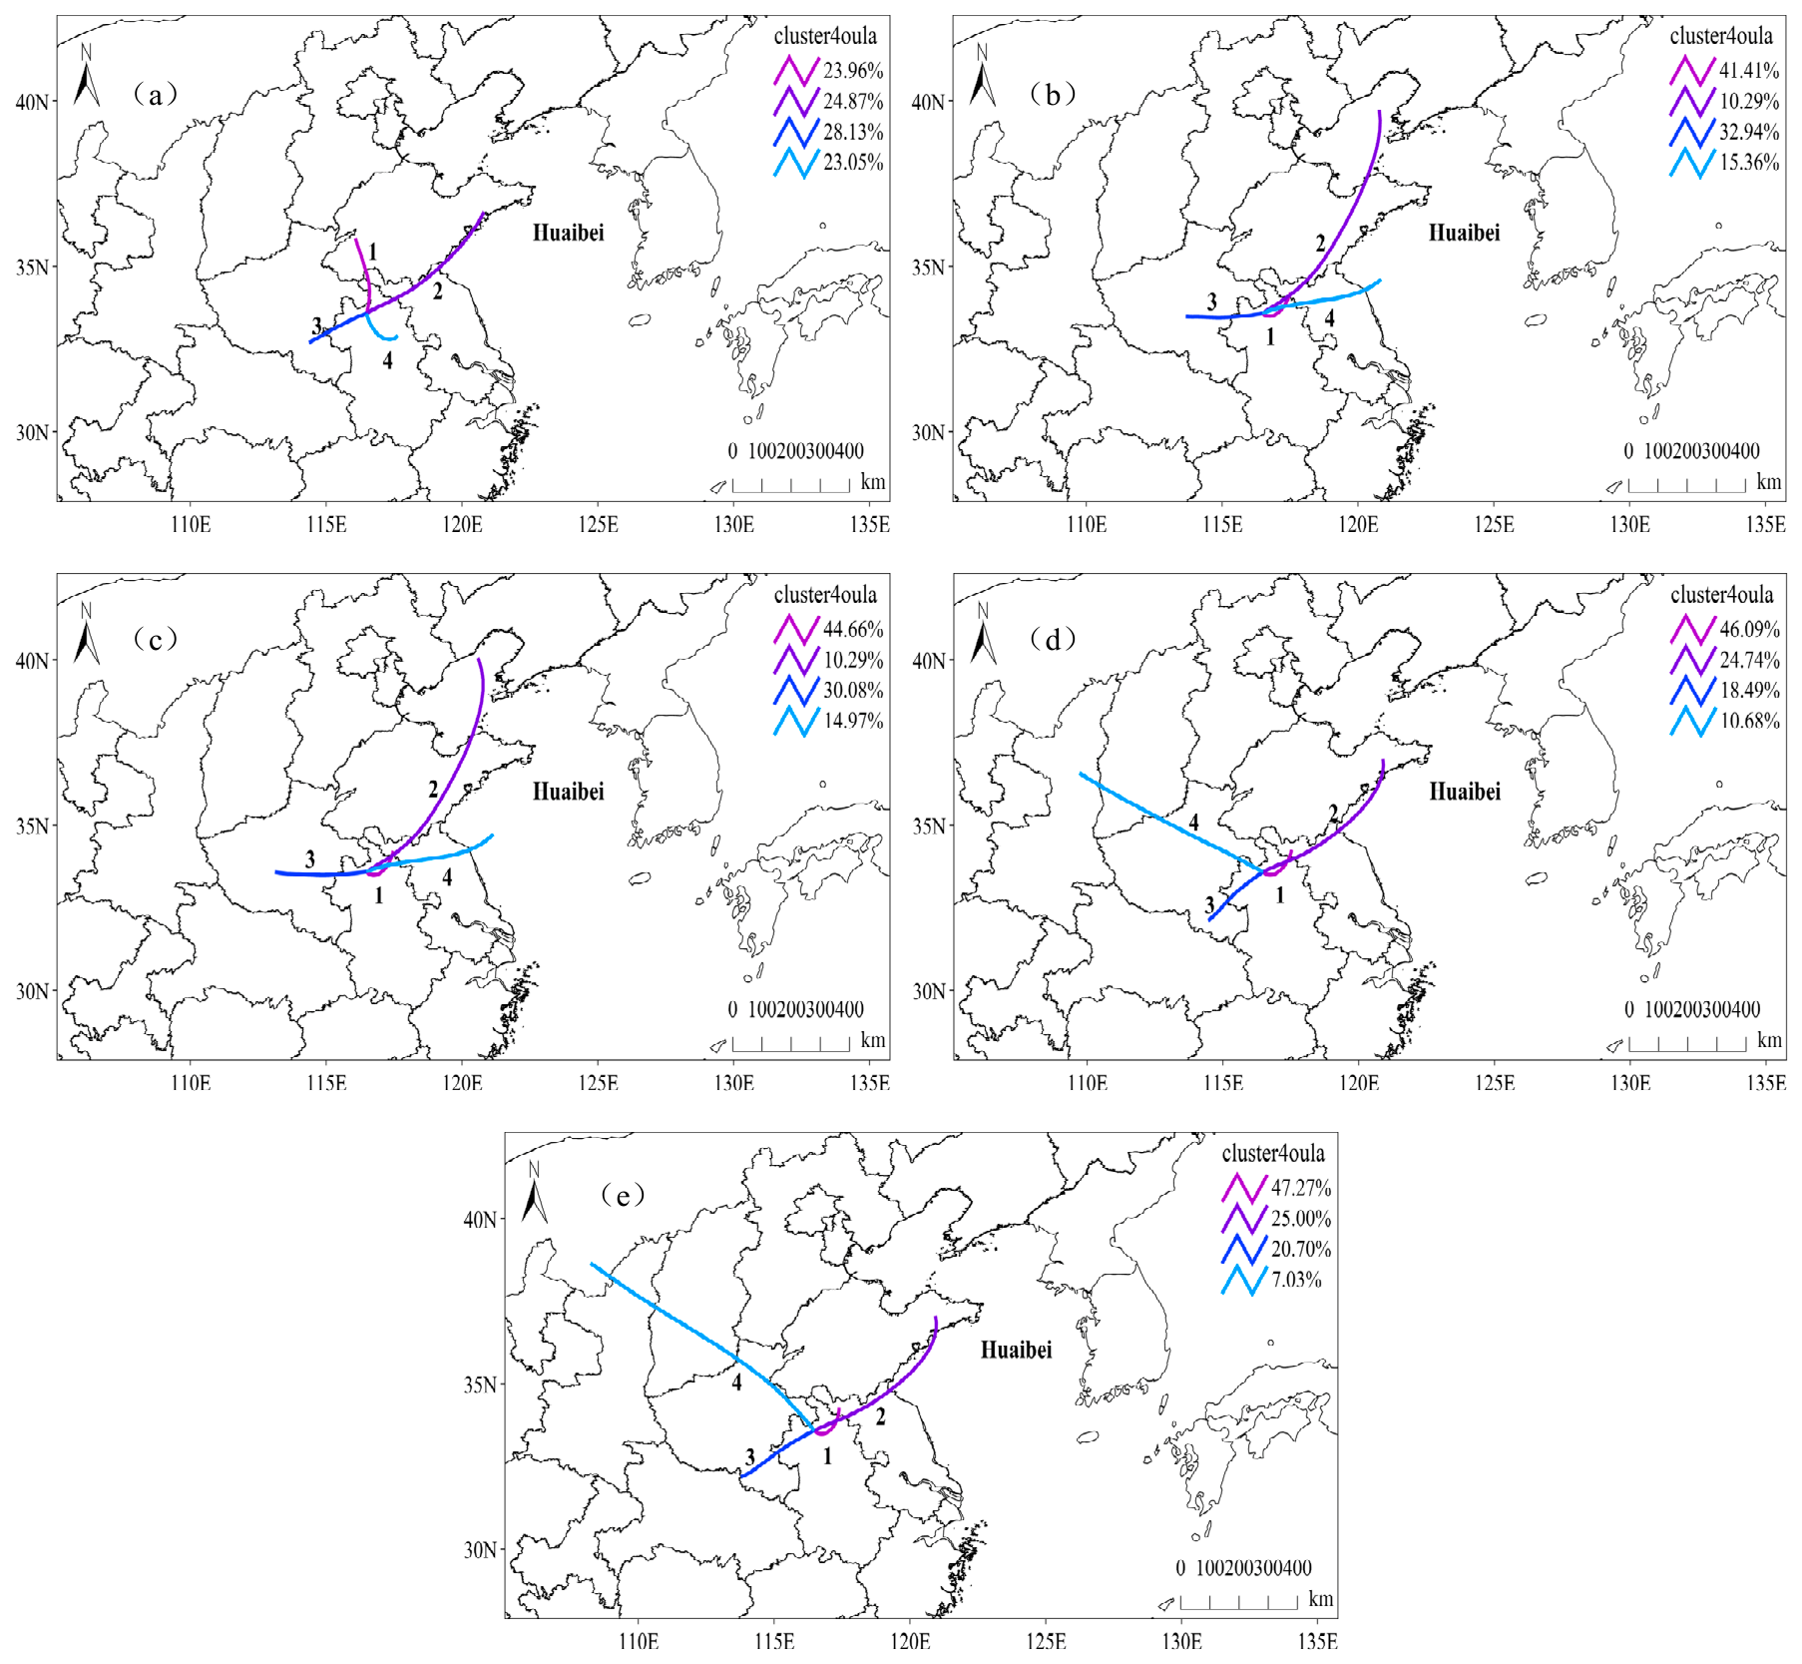
To investigate the relationship between trace gas variations and atmospheric transport conditions, Figure 11 presents 24-h backward trajectory simulations and cluster analyses of air mass pathways at five altitude levels (30, 50, 70, 90, and 110 m) during 8 January–8 February 2026. The backward trajectories were calculated using the Hybrid Single-Particle Lagrangian Integrated Trajectory (HYSPLIT) model developed by the National Oceanic and Atmospheric Administration (NOAA) Air Resources Laboratory (ARL) [35]. The Global Data Assimilation System 1-degree archive (GDAS1) meteorological data provided by NOAA ARL were used as the meteorological input for the simulations [36]. The calculated trajectories were processed and clustered using the TrajStat module of MeteoInfo [37,38].
Figure 11.
Cluster analysis of 24-h backward air-mass trajectories at different altitudes: (a) 30 m, (b) 50 m, (c) 70 m, (d) 90 m, and (e) 110 m.
Backward trajectories were initialized at the observation site at the five measurement altitudes and integrated backward for 24 h. Based on the similarity of air mass transport pathways, the five altitude levels were classified into three groups: 30 m represented the first group, 50 and 70 m were grouped together, and 90 and 110 m formed the third group. Trajectory clustering was performed using the Euclidean-distance method, and the number of clusters was determined based on the variation in total spatial variance (TSV) with the number of clusters [38]. Four trajectory clusters were identified at each altitude level. As shown in Figure 11, all altitude levels were influenced by Cluster 3 originating from the western region, and its contribution increased initially and then decreased with altitude, reaching a maximum at 50 m (32.94%). Except for the 30 m layer, Cluster 1 dominated at the other four altitude levels, with its contribution increasing gradually with altitude. Cluster 1 exhibited a relatively limited spatial extent, with air masses mainly confined to the region surrounding the observation site. This pathway may facilitate the local accumulation of pollutants due to relatively short transport distances. The differences in air mass transport pathways and their contributions among altitude levels further support the altitude- and azimuth-dependent variations observed in trace gas distributions.
5. Conclusions
This study developed a lightweight and modular UAV-borne two-dimensional differential optical absorption spectroscopy (2D-DOAS) observation system for high-resolution spatial characterization of near-surface trace gases. By integrating the mobility of a UAV platform with the multi-species retrieval capability of DOAS, the proposed system overcomes the limitations of conventional observations in spatial coverage and three-dimensional characterization. A layered scanning strategy combining multi-altitude hovering and multi-azimuth observations was established, enabling simultaneous measurements of NO2, SO2, HCHO, and the auxiliary optical parameter O4.
System evaluation and comparison with a commercial ground-based MAX-DOAS instrument demonstrated that the proposed system possesses reliable spectral stability, measurement accuracy, and field adaptability. During a 20-day field campaign at the Xiangshan Campus of Huaibei Normal University, the system successfully captured the two-dimensional spatial distributions of near-surface trace gases at multiple altitudes and azimuths, revealing pronounced horizontal and vertical variability under different environmental conditions. These observations demonstrate that UAV-borne 2D-DOAS provides an effective tool for resolving spatial gradients of atmospheric pollutants and offers valuable observational evidence for investigating pollutant transport and local pollution formation mechanisms.
Overall, the proposed UAV-borne 2D-DOAS system extends the spatial coverage and multi-dimensional spatial observation capability of conventional atmospheric monitoring, enabling a transition from single-point and single-path observations to multi-component, multi-altitude, and multi-azimuth measurements. It therefore provides a flexible and efficient approach for regional air pollution monitoring, emission source identification, and investigations of near-surface atmospheric processes.
Although the proposed system has demonstrated its capability for multi-altitude and multi-azimuth observations, further improvements in platform endurance, payload stability, and observation efficiency are still needed. With advances in UAV power systems and flight-control technologies, future work will focus on improving the endurance and autonomous flight capability of the platform. Multi-UAV cooperative observation could also be explored to achieve synchronized measurements over larger areas and construct high-resolution three-dimensional near-surface trace-gas distributions, thereby providing more efficient technical support for atmospheric environmental monitoring and the investigation of regional pollution transport processes.
Author Contributions
Conceptualization, F.Z., F.M. and S.L.; methodology, F.Z., J.Z. and H.H.; software, F.Z. and F.M.; validation, J.Z., H.H. and J.L.; formal analysis, F.Z. and F.M.; investigation, F.Z., J.Z., H.H. and J.L.; resources, F.M. and S.L.; data curation, F.Z.; writing—original draft preparation, F.Z. and F.M.; writing—review and editing, F.M., J.Z., H.H., J.L. and S.L.; visualization, F.Z.; supervision, F.M. and S.L.; project administration, F.M. and S.L.; funding acquisition, F.M. and S.L. All authors have read and agreed to the published version of the manuscript.
Funding
This research was funded by the National Natural Science Foundation of China (No. 41875040 and 41705012), the Innovation Team Project of Anhui Educational Committee, China (No. 2023AH010043), the Natural Science Foundation of Anhui Province, China (No. 2208085QF215), and the Natural Science Research Project of Anhui Educational Committee, China (No. 2023AH050338).
Institutional Review Board Statement
Not applicable.
Informed Consent Statement
Not applicable.
Data Availability Statement
The data presented in this study are available from the corresponding author upon reasonable request.
Conflicts of Interest
The authors declare no conflicts of interest.
References
- Feng, Y.; Ning, M.; Lei, Y.; Sun, Y.; Liu, W.; Wang, J. Defending blue sky in China: Effectiveness of the “Air Pollution Prevention and Control Action Plan” on air quality improvements from 2013 to 2017. J. Environ. Manag. 2019, 252, 109603. [Google Scholar] [CrossRef] [Scilit]
- Liu, W.; Xing, C. Needs and challenges of optical atmospheric monitoring on the background of carbon neutrality in China. Front. Environ. Sci. Eng. 2024, 18, 73. [Google Scholar] [CrossRef] [Scilit]
- Kong, L.; Tang, X.; Zhu, J.; Wang, Z.; Li, J.; Wu, H.; Wu, Q.; Chen, H.; Zhu, L.; Wang, W.; et al. A 6-year-long (2013–2018) high-resolution air quality reanalysis dataset in China based on the assimilation of surface observations from CNEMC. Earth Syst. Sci. Data 2021, 13, 529–570. [Google Scholar] [CrossRef] [Scilit]
- Acker, S.; Holloway, T.; Harkey, M. Satellite detection of NO2 distributions using TROPOMI and TEMPO and comparison with ground-based concentration measurements. Atmos. Chem. Phys. 2025, 25, 8271–8288. [Google Scholar] [CrossRef] [Scilit]
- Li, Y.; Xing, C.; Peng, H.; Song, Y.; Zhang, C.; Xue, J.; Niu, X.; Liu, C. Long-term observations of NO2 using GEMS in China: Validations and regional transport. Sci. Total Environ. 2023, 904, 166762. [Google Scholar] [CrossRef] [Scilit]
- Oetjen, H.; Baidar, S.; Krotkov, N.A.; Lamsal, L.N.; Lechner, M.; Volkamer, R. Airborne MAX-DOAS measurements over California: Testing the NASA OMI tropospheric NO2 product. J. Geophys. Res. Atmos. 2013, 118, 7400–7413. [Google Scholar] [CrossRef] [Scilit]
- Peng, H.; Xing, C.; Li, Y.; Zhang, C.; Lin, J.; Xue, J.; Wang, X.; Song, Y.; Niu, X.; Liu, C. Studies on regional ozone formation sensitivities and transport with higher spatiotemporal resolutions in a stereoscopic dimension: GEMS and vertical observations. Atmos. Res. 2024, 302, 107314. [Google Scholar] [CrossRef] [Scilit]
- Ye, F.; Li, S.; Mou, F.; Wang, S.; Wang, Z.; Tang, Y.; Luo, J. Research and application of a rotary-wing UAV-borne differential optical absorption two-dimensional detection system. Acta Phys. Sin. 2024, 73, 84–93. [Google Scholar] [CrossRef] [Scilit]
- Zhang, Q.; Mou, F.; Shan, W.; Luo, J.; Wang, X.; Li, S. Vertical profiles of aerosol and NO2 based on mobile multi-axis differential absorption spectroscopy. Atmos. Pollut. Res. 2023, 14, 101732. [Google Scholar] [CrossRef] [Scilit]
- Zhou, C.; Li, S.; Mou, F.; Luo, J.; Wang, X.; Ye, F. The investigation of retrieval method for aerosol and water vapor profiles based on MAX-DOAS technology. Atmos. Pollut. Res. 2024, 15, 102183. [Google Scholar] [CrossRef] [Scilit]
- Yu, Q.; Yin, Y.; Zhang, X. Characteristics of atmospheric NO2 pollution in Nanjing based on ground-based MAX-DOAS and TROPOMI satellite remote sensing. China Environ. Sci. 2023, 43, 2722–2733. [Google Scholar]
- Lange, K.; Richter, A.; Schönhardt, A.; Meier, A.C.; Bösch, T.; Seyler, A.; Krause, K.; Behrens, L.K.; Wittrock, F.; Merlaud, A.; et al. Validation of Sentinel-5P TROPOMI tropospheric NO2 products by comparison with NO2 measurements from airborne imaging DOAS, ground-based stationary DOAS, and mobile car DOAS measurements during the S5P-VAL-DE-Ruhr campaign. Atmos. Meas. Tech. 2023, 16, 1357–1389. [Google Scholar] [CrossRef] [Scilit]
- Yang, D.; Zeng, Y.; Xi, L.; Zhou, H.; Qiu, X.; Luo, Y.; Si, F.; Liu, W. Analysis of NOx emission flux from pollution sources based on simultaneous airborne and vehicle-mounted differential optical absorption spectroscopy measurements. Acta Opt. Sin. 2020, 40, 23–33. [Google Scholar] [CrossRef] [Scilit]
- Li, Y.; Zhang, C.; Su, W.; Jiang, S.; Nie, D.; Wang, Y.; Wang, Y.; He, H.; Chen, Q.; Martin, S.T.; et al. Copter-type UAV-based sensing in atmospheric chemistry: Recent advances, applications, and future perspectives. Environ. Sci. Technol. 2025, 59, 13532–13550. [Google Scholar] [CrossRef] [Scilit]
- Peng, H.; Xing, C.; Tang, T.; Tan, W.; Li, Y.; Zhang, Z. UAV hyperspectral stereoscopic remote sensing technique supports NO2 localization with a meter-level spatial resolution. IEEE Trans. Geosci. Remote Sens. 2026, 64, 1001209. [Google Scholar] [CrossRef] [Scilit]
- Souza, W.S.R.; Hart, A.J.; Fonseca, B.J.B.; Tahernezhadi, M.; Christensen, L.E. A framework to survey a region for gas leaks using an unmanned aerial vehicle. IEEE Access 2024, 12, 1386–1407. [Google Scholar] [CrossRef] [Scilit]
- Chen, Q.; Wang, D.; Li, X.; Li, B.; Song, R.; He, H.; Peng, Z. Vertical characteristics of winter ozone distribution within the boundary layer in Shanghai based on hexacopter unmanned aerial vehicle platform. Sustainability 2019, 11, 7026. [Google Scholar] [CrossRef] [Scilit]
- Zou, T.; Xing, C.; Tan, W.; Wu, Z.; Liu, C. Meter-scale UAV hyperspectral remote sensing for pollution source attribution: Dynamic reference spectrum optimization and surface albedo correction. Environ. Sci. Technol. 2026, 60, 2590–2601. [Google Scholar] [CrossRef] [Scilit]
- Xing, C.; Peng, H.; Zou, T.; Song, Y.; Liu, C. UAV-based hyperspectral imaging bridges the spatial gap in pollution source identification. Anal. Chem. 2026, 98, 5381–5393. [Google Scholar] [CrossRef] [Scilit]
- Platt, U.; Stutz, J. Differential Optical Absorption Spectroscopy: Principles and Applications; Springer: Berlin/Heidelberg, Germany, 2008. [Google Scholar]
- Hedworth, H.; Page, J.; Sohl, J.; Saad, T. Investigating errors observed during UAV-based vertical measurements using computational fluid dynamics. Drones 2022, 6, 253. [Google Scholar] [CrossRef] [Scilit]
- Mou, F.; Luo, J.; Zhang, Q.; Zhou, C.; Wang, S.; Ye, F.; Li, S.; Sun, Y. Ground-based MAX-DOAS observation of trace gases from 2019 to 2021 in Huaibei, China. Atmosphere 2023, 14, 739. [Google Scholar] [CrossRef] [Scilit]
- Chen, J.; Xing, C.; Lin, J.; Liu, C. Spectral remote sensing reveals differences in vertical profiles of NO2 during major events and holidays in Beijing. Acta Opt. Sin. 2024, 44, 68–79. [Google Scholar]
- Dai, S.; Zhou, C.X.; Pang, X.B.; Li, J.J.; Chen, L.; Wu, Z.T.; Yuan, K.B.; Han, Z.L.; Wang, Q.; Wang, S.Q.; et al. Vertical profiles of near-surface ozone in the Hangzhou Bay chemical industrial park based on unmanned aerial vehicle observations. China Environ. Sci. 2022, 42, 2514–2522. [Google Scholar]
- Danckaert, T.; Fayt, C.; Van Roozendael, M.; De Smedt, I.; Letocart, V.; Merlaud, A.; Pinardi, G. QDOAS Software User Manual, version 3.2; Royal Belgian Institute for Space Aeronomy (BIRA-IASB): Brussels, Belgium, 2017. [Google Scholar]
- Bogumil, K.; Orphal, J.; Homann, T.; Voigt, S.; Spietz, P.; Fleischmann, O.C.; Vogel, A.; Hartmann, M.; Kromminga, H.; Bovensmann, H.; et al. Measurements of molecular absorption spectra with the SCIAMACHY pre-flight model: Instrument characterization and reference data for atmospheric remote-sensing in the 230–2380 nm region. J. Photochem. Photobiol. A Chem. 2003, 157, 167–184. [Google Scholar] [CrossRef] [Scilit]
- Serdyuchenko, A.; Gorshelev, V.; Weber, M.; Chehade, W.; Burrows, J.P. High spectral resolution ozone absorption cross-sections—Part 2: Temperature dependence. Atmos. Meas. Tech. 2014, 7, 625–636. [Google Scholar] [CrossRef] [Scilit]
- Wagner, T.; Dix, B.; von Friedeburg, C.; Frieß, U.; Sanghavi, S.; Sinreich, R.; Platt, U. MAX-DOAS O4 measurements: A new technique to derive information on atmospheric aerosols—Principles and information content. J. Geophys. Res. Atmos. 2004, 109, D22205. [Google Scholar] [CrossRef] [Scilit]
- Javed, Z.; Tanvir, A.; Bilal, M.; Su, W.; Xia, C.; Rehman, A.; Zhang, Y.; Sandhu, O.; Xing, C.; Ji, X.; et al. Recommendations for HCHO and SO2 retrieval settings from MAX-DOAS observations under different meteorological conditions. Remote Sens. 2021, 13, 2244. [Google Scholar] [CrossRef] [Scilit]
- Javed, Z.; Liu, C.; Khokhar, M.F.; Tan, W.; Liu, H.; Xing, C.; Ji, X.; Tanvir, A.; Hong, Q.; Sandhu, O.; et al. Ground-based MAX-DOAS observations of CHOCHO and HCHO in Beijing and Baoding, China. Remote Sens. 2019, 11, 1524. [Google Scholar] [CrossRef] [Scilit]
- Zhang, Q.; Xing, C.; Feng, M.; Ding, Y.; Sun, Z.; Li, Y.; Peng, H.; Tan, W.; Zhang, Z.; Du, T.; et al. Mobile MAX-DOAS measurements and source analysis of NO2, HCHO, and HONO during the Chengdu 2023 FISU World University Games. J. Environ. Sci. 2026, 160, 517–527. [Google Scholar] [CrossRef] [Scilit]
- Xing, C.; Liu, C.; Wang, S.; Hu, Q.; Liu, H.; Tan, W.; Zhang, W.; Li, B.; Liu, J. A new method to determine the aerosol optical properties from multiple-wavelength O4 absorptions by MAX-DOAS observation. Atmos. Meas. Tech. 2019, 12, 3289–3302. [Google Scholar] [CrossRef] [Scilit]
- Pinardi, G.; Van Roozendael, M.; Abuhassan, N.; Adams, C.; Cede, A.; Clémer, K.; Fayt, C.; Frieß, U.; Gil, M.; Hendrick, F.; et al. MAX-DOAS formaldehyde slant column measurements during CINDI: Intercomparison and analysis improvement. Atmos. Meas. Tech. 2013, 6, 167–185, Correction in Atmos. Meas. Tech. 2013, 6, 219. [Google Scholar] [CrossRef] [Scilit]
- Chen, L.; Pang, X.; Li, J.; Xing, B.; An, T.; Yuan, K.; Dai, S.; Wu, Z.; Wang, S.; Wang, Q.; et al. Vertical profiles of O3, NO2 and PM in a major fine chemical industry park in the Yangtze River Delta of China detected by a sensor package on an unmanned aerial vehicle. Sci. Total Environ. 2022, 845, 157113. [Google Scholar] [CrossRef] [Scilit]
- Stein, A.F.; Draxler, R.R.; Rolph, G.D.; Stunder, B.J.B.; Cohen, M.D.; Ngan, F. NOAA’s HYSPLIT atmospheric transport and dispersion modeling system. Bull. Am. Meteorol. Soc. 2015, 96, 2059–2077. [Google Scholar] [CrossRef] [Scilit]
- Rolph, G.; Stein, A.; Stunder, B. Real-time Environmental Applications and Display sYstem: READY. Environ. Model. Softw. 2017, 95, 210–228. [Google Scholar] [CrossRef] [Scilit]
- Wang, Y.Q. MeteoInfo: GIS software for meteorological data visualization and analysis. Meteorol. Appl. 2014, 21, 360–368. [Google Scholar] [CrossRef] [Scilit]
- Wang, Y.Q.; Zhang, X.Y.; Draxler, R.R. TrajStat: GIS-based software that uses various trajectory statistical analysis methods to identify potential sources from long-term air pollution measurement data. Environ. Model. Softw. 2009, 24, 938–939. [Google Scholar] [CrossRef] [Scilit]
Disclaimer/Publisher’s Note: The statements, opinions and data contained in all publications are solely those of the individual author(s) and contributor(s) and not of MDPI and/or the editor(s). MDPI and/or the editor(s) disclaim responsibility for any injury to people or property resulting from any ideas, methods, instructions or products referred to in the content. |
© 2026 by the authors. Licensee MDPI, Basel, Switzerland. This article is an open access article distributed under the terms and conditions of the Creative Commons Attribution (CC BY) license.