


Abstract
Satellite aerosol optical depth (AOD) provides information for surface PM2.5 retrieval, but its relationship with ground-level concentrations depends on meteorological and environmental conditions. This study evaluated a multi-source PM2.5 retrieval framework for the Beijing–Tianjin–Hebei (BTH) region during 2019–2021. Four input combinations were compared: AOD alone, AOD with meteorological variables, AOD with additional satellite variables, and all eight predictors. The satellite variables included land surface temperature, NDVI, and tropospheric NO2. Random forest, support vector regression, XGBoost, and linear stacking were evaluated using the same samples and an 80:10:10 training–validation–test split. The stacking model was trained using out-of-fold predictions. Across the four models, R2 increased from 0.51–0.54 with AOD alone to 0.83–0.84 with all predictors. Stacking achieved the best performance with all predictors, with R2 = 0.84, RMSE = 12.4 μg/m3, and MAE = 9.7 μg/m3. Annual retrievals showed higher concentrations in southern and southwestern Hebei and lower concentrations in northern BTH, while the 2021 maps showed higher concentrations in winter than in summer. Missing AOD reduced the spatial completeness of PM2.5 retrievals, and future work should assess gap filling to improve coverage and its effects on retrieval accuracy.
1. Introduction
Reliable regional PM2.5 retrievals are needed for air-quality assessment, exposure studies, and pollution management. Ground monitoring provides direct measurements at individual locations, but stations cannot fully describe pollution differences between cities, rural areas, and mountainous areas. Satellite observations can complement these measurements and support regional mapping [1,2,3]. This need is important in the Beijing–Tianjin–Hebei (BTH) region, where urban development, industrial activity, agricultural land, and complex terrain create varied conditions for pollutant emissions and dispersion [4,5].
Aerosol optical depth (AOD) is widely used for surface PM2.5 retrieval because it measures aerosol extinction through the atmospheric column. However, AOD and PM2.5 describe different properties: AOD measures column optical loading, whereas ground stations measure particle mass near the surface [1,2,6]. Their relationship changes with aerosol height, relative humidity, boundary-layer structure, and aerosol composition [6,7]. These factors support the inclusion of meteorological and environmental variables in AOD-based retrieval models.
Machine learning can combine these variables and represent nonlinear relationships. Previous studies have used tree-based and ensemble models to combine satellite, meteorological, and land-surface information for PM2.5 retrieval across China [8,9,10,11,12,13,14]. Related applications to pollutant concentrations and emissions in densely populated regions also support the use of environmental observations and complementary modelling approaches [15,16]. These studies provide a basis for testing multi-source inputs and model combinations under regional conditions.
For regional PM2.5 retrieval, it is important to determine how much information is gained by adding predictors to AOD and whether stacking improves performance beyond individual models. Meteorological variables describe conditions affecting aerosol growth and dispersion [6,17]. Land surface temperature (LST), NDVI, and tropospheric NO2 provide additional information on surface conditions and pollution-related spatial differences [8,18]. Comparing input combinations using the same observations and data partitions helps identify their added value.
Input availability also affects the usefulness of retrieved maps. Clouds, retrieval failure, and quality screening can leave pixels without valid AOD, while other required inputs may also be missing [19]. Prediction accuracy and spatial completeness therefore need to be considered together. The varied urban, plain, mountain, and coastal environments of BTH provide a useful setting for examining these aspects of regional retrieval.
This study evaluates daily PM2.5 retrieval in BTH during 2019–2021 using four input combinations and four machine-learning models. The objectives are to assess the added value of meteorological and satellite variables relative to AOD alone; compare RF, SVR, XGBoost, and linear stacking under the same evaluation conditions; describe annual and seasonal PM2.5 patterns; and examine how missing AOD affects retrieval coverage. This comparison helps clarify the roles of input information, model choice, and data availability in regional PM2.5 mapping.
2. Materials and Methods
2.1. Study Area and Period

The Beijing–Tianjin–Hebei (BTH) region is located in northern China and comprises Beijing Municipality, Tianjin Municipality, and Hebei Province (Figure 1). It is one of China’s major urban–industrial agglomerations and includes densely populated urban centers, industrial and energy-production areas, major transportation corridors, agricultural plains, coastal zones, and mountainous landscapes. The southern and eastern parts of the region are dominated by the North China Plain, while the Taihang Mountains border the west and the Yanshan Mountains extend across the north. The eastern part of the region is adjacent to the Bohai Sea. These contrasting land-use and topographic conditions produce considerable spatial heterogeneity in emissions, surface characteristics, and atmospheric dispersion.
Figure 1.
Location of the Beijing–Tianjin–Hebei region in China.
The region has a temperate continental monsoon climate characterized by hot, relatively humid summers and cold, dry winters. Summer precipitation and stronger atmospheric mixing generally favor pollutant dispersion and removal, whereas winter heating emissions, shallow boundary layers, and stagnant meteorological conditions can promote near-surface pollutant accumulation. The mountains surrounding the western and northern parts of BTH can further influence local circulation and regional pollutant transport. Together with intensive industrial activity, energy consumption, traffic emissions, and seasonal residential heating, these conditions make BTH a challenging and representative region for evaluating satellite-based PM2.5 retrieval models.
The study period extended from January 2019 to December 2021, providing three complete annual cycles and a consistent temporal window for the satellite, meteorological, and ground-monitoring datasets. All input data were restricted to this common period prior to preprocessing and spatial matching. During preprocessing, records with missing values or failing the specified quality-control criteria were excluded to ensure the reliability and consistency of the final dataset. The basic unit used for supervised learning was a valid station-day record, defined as a daily ground-level PM2.5 observation at a monitoring station matched with the corresponding aerosol optical depth (AOD), meteorological variables, and other satellite-derived predictors. This data structure enabled the models to learn the relationships between multi-source environmental variables and observed ground-level PM2.5 concentrations and supported the subsequent generation of annual regional PM2.5 retrievals.
2.2. Data Sources
2.2.1. Ground PM2.5 Observations
Daily ground-level PM2.5 observations for monitoring stations in the Beijing–Tianjin–Hebei (BTH) region during 2019–2021 were obtained from the China National Environmental Monitoring Centre (CNEMC) [20]. Station identifiers and geographic coordinates were obtained from the official CNEMC monitoring-station list for spatial matching with the satellite and meteorological datasets. The monitoring network covered approximately 113°27′–119°50′ E and 36°05′–42°40′ N. For each station-day, PM2.5 was represented by the 24 h mean concentration, recorded as PM2.5 (μg/m3) in the final modelling dataset. These observations served as the reference response variable for model training and evaluation, while satellite-derived and meteorological predictors were used to estimate the spatial distribution of PM2.5 across the BTH region.
2.2.2. Satellite Remote Sensing Data
Aerosol Optical Depth (AOD) data were obtained from the MODIS MCD19A2 aerosol product using the Multi-Angle Implementation of Atmospheric Correction (MAIAC) algorithm [19]. This product provides AOD at 550 nm (AOD550) with a nominal spatial resolution of 1 km. It was selected because of its long-term, stable, and widely validated aerosol observations, which are suitable for regional PM2.5 retrieval. The MCD19A2 product was used to provide daily AOD information over the study area.
Land Surface Temperature (LST) data were obtained from the Terra MODIS MOD11A2 product, which provides 8-day composite LST at a nominal spatial resolution of 1 km [21]. Daytime LST was used and converted to degrees Celsius for integration with the other modelling variables. The corresponding 8-day composite interval was retained when matching LST values with station-day observations. LST helps represent land–atmosphere thermal conditions that influence boundary layer development and pollutant dispersion.
Normalized Difference Vegetation Index (NDVI) data were obtained from the MODIS vegetation index products MOD13A2, which provide 16-day composite NDVI data at a nominal spatial resolution of 1 km. These products were selected to characterize vegetation conditions across the study area. The NDVI represents vegetation and land-surface characteristics, which are associated with surface reflectance, land use, and spatial differences in emission and deposition environments. The NDVI data were spatially matched with ground-level PM2.5 observations and other satellite-derived and meteorological variables and incorporated as an environmental predictor in the machine learning models.
Nitrogen dioxide (NO2) data were obtained from the Sentinel-5P satellite equipped with the TROPOMI (TROPOSpheric Monitoring Instrument). The OFFL Level-3 NO2 product was used, with tropospheric NO2 column number density as the target variable, expressed in mol/m2. The product has a nominal spatial resolution of 1.11 km. Only observations with a quality assurance (QA) value > 0.75 were retained to ensure reliable retrievals. NO2 was included as an emission-related satellite proxy because it is closely associated with combustion sources, traffic activity, and industrial emissions that also contribute to PM2.5 formation. The NO2 data were spatially matched with ground-level PM2.5 observations and other predictor variables for machine learning-based retrieval of PM2.5 concentrations.
2.2.3. Meteorological Variables
Meteorological data were obtained from the ERA5 reanalysis product provided by the European Centre for Medium-Range Weather Forecasts (ECMWF) on a regular 0.25° × 0.25° grid [22]. Hourly reanalysis fields were aggregated to daily values. The selected meteorological predictors included near-surface air temperature, relative humidity, wind speed, and planetary boundary layer height (PBLH). These variables were selected to characterize atmospheric thermodynamic conditions, horizontal dispersion, and vertical mixing, which influence the distribution of PM2.5. The ERA5 fields were interpolated or extracted to the monitoring-station locations for model development and to the common spatial grid for regional PM2.5 mapping. The data sources, spatial and temporal resolutions, and roles of all variables used in this study are summarized in Table 1.
Table 1.
Multi-source variables used in the BTH retrieval framework.
2.3. Data Preprocessing
All datasets were quality-controlled and harmonized before model development. Daily ground-level PM2.5 observations were organized by station and date, and invalid records were removed. For satellite variables, MCD19A2 AOD, MOD11A2 daytime LST, and MOD13A2 NDVI were screened using the corresponding product quality information. LST and NDVI were scaled according to product specifications, with LST further converted to °C. Sentinel-5P TROPOMI Level-3 tropospheric NO2 data obtained through Google Earth Engine were filtered according to the product quality criteria.
Hourly ERA5 temperature, relative humidity, wind speed, and planetary boundary layer height were aggregated to daily values. All satellite and meteorological variables were then spatially matched to the monitoring stations and temporally aligned with the corresponding station-day observations. For composite products, LST and NDVI were assigned according to the composite period covering each observation date. Records with missing values in the variables required for modelling were excluded.
The final dataset consisted of daily PM2.5 as the target variable and AOD, LST, NDVI, tropospheric NO2, temperature, relative humidity, wind speed, and planetary boundary layer height as predictors.
2.4. Model Development, Hyperparameter Optimization, and Validation
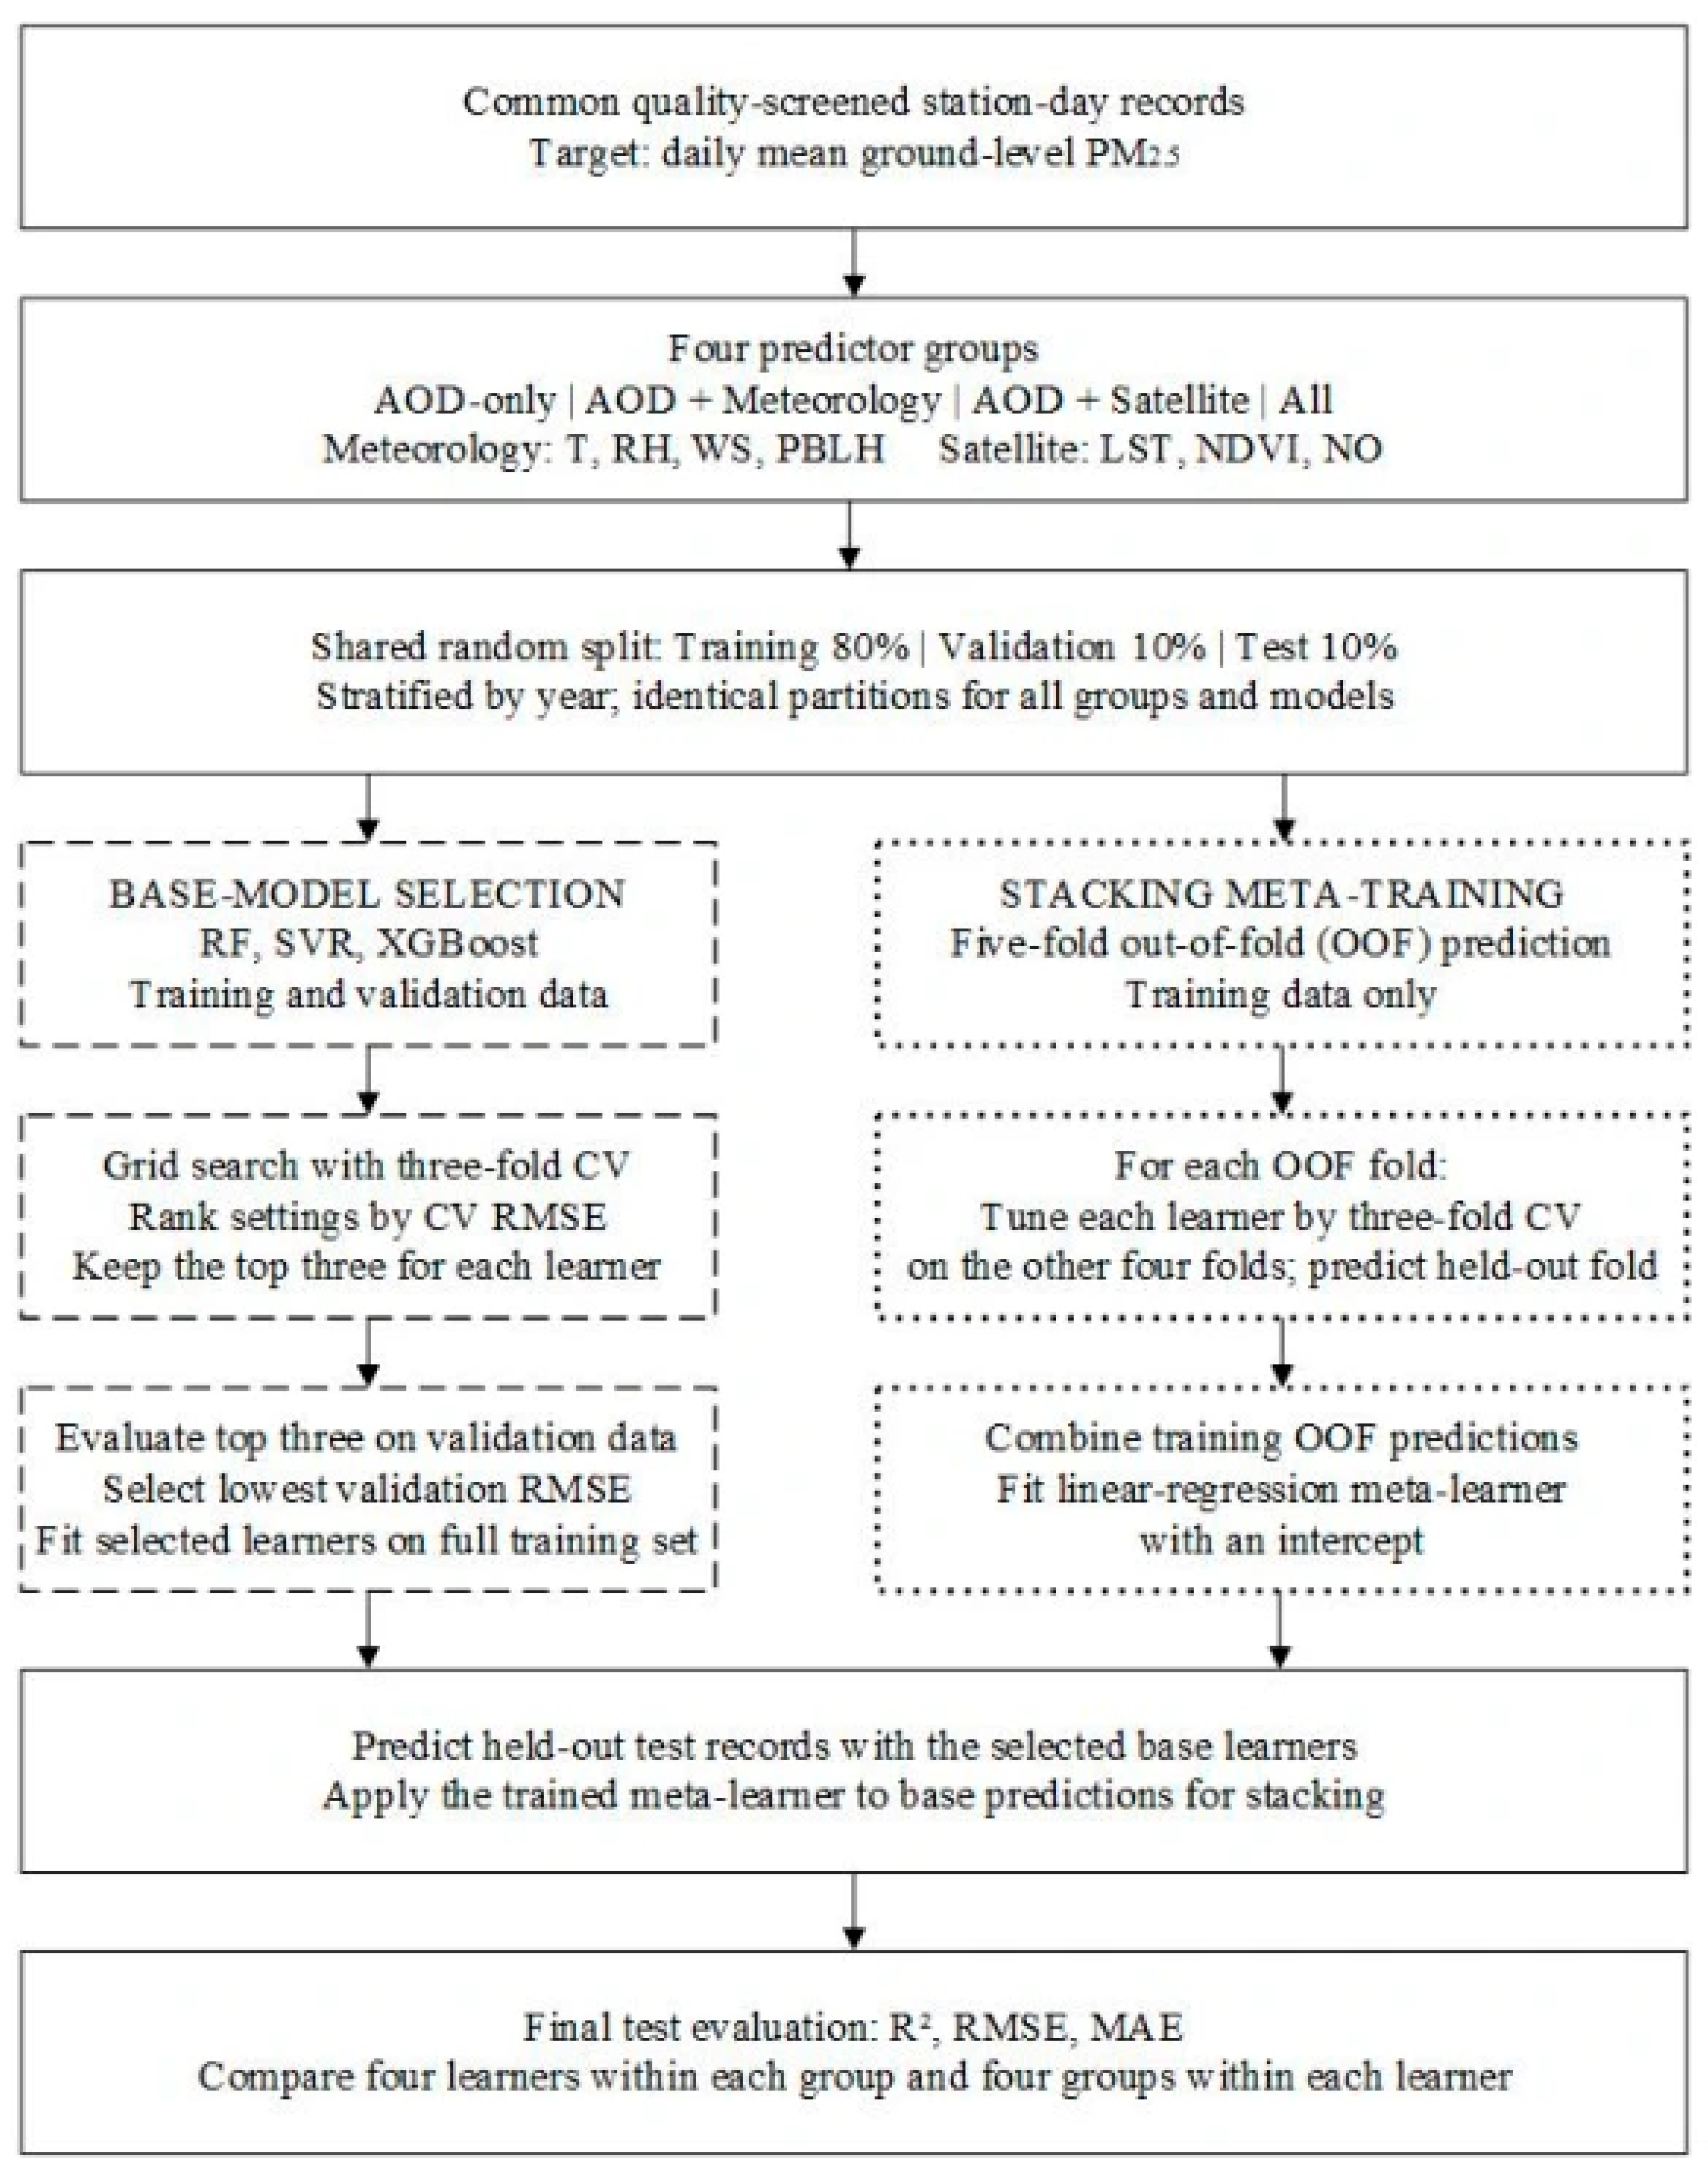
Daily mean ground-level PM2.5 concentration was used as the target variable. Four predictor groups were compared (Figure 2): AOD-only, AOD with meteorological variables, AOD with other satellite variables, and all predictors combined. Meteorological variables included temperature, relative humidity, wind speed, and planetary boundary-layer height. Other satellite variables included LST, NDVI, and NO2. All groups used the same samples after quality screening and the same data splits. Coordinates and dates were used to match and identify records but were not used as model inputs.
RF, SVR, and XGBoost were implemented as base learners, representing bagging-based, kernel-based, and boosting-based approaches, respectively [23,24,25]. Each learner was fitted separately for each predictor configuration using the same hyperparameter search space. SVR employed a radial basis function kernel, and its predictors were standardized using means and standard deviations estimated exclusively from the corresponding training subset. RF and XGBoost used unstandardized predictors. Samples were randomly divided into training, validation, and test sets at an 80:10:10 ratio, with similar year proportions maintained across the three sets. A fixed random seed was used to ensure reproducibility.
Hyperparameters were selected by grid search with three-fold cross-validation within the training set. For each model, the three parameter settings with the lowest cross-validation RMSE were tested on the validation set. The setting with the lowest validation RMSE was selected. The test set was used only for final evaluation. Each model used the same search range across the four predictor groups. RF used 200 trees, maximum depths of unlimited or 12, minimum leaf sizes of 1, 3, or 6, and a feature fraction of 0.8. SVR used C values of 10, 100, or 500, ϵ values of 0.1 or 1, and γ settings of “scale” or 0.03. XGBoost used 300 boosting rounds, maximum depths of 2, 4, or 6, learning rates of 0.03 or 0.1, row and column sampling fractions of 0.8, and L2 regularization of 5.
The stacking model combined predictions from RF, SVR, and XGBoost [26]. The training set was divided into five folds. In each fold, the base models were tuned by three-fold cross-validation using the other four folds and then used to predict the held-out fold. These out-of-fold predictions were used to train a linear-regression meta-learner with an intercept. The selected base models were then trained on the full training set. Their predictions for the validation and test sets were combined by the meta-learner. The validation and test observations were not used to train the meta-learner.
Model performance was evaluated using the coefficient of determination (R2), root mean square error (RMSE), and mean absolute error (MAE):
Here, yi and are the observed and predicted PM2.5 concentrations, is the mean observed concentration in the evaluated set, and n is the sample size.
The models were built in Python 3.12 using pandas 2.2.3, NumPy 2.3.5, scikit-learn 1.8.0, and XGBoost 3.4.1 [25,27]. Records from the same station could appear in different sets. The test results therefore show performance for randomly held-out station-day records, rather than for new stations or future years.
Figure 2.
Machine learning workflow for ground-level PM2.5 retrieval across four predictor groups.
2.5. Cloud-Affected AOD Availability Case
AOD availability can limit the spatial completeness of PM2.5 retrieval because cloud cover, retrieval failure, and quality screening may leave pixels without valid AOD [19].
To examine this limitation, a local case study was conducted for Shijiazhuang and its surrounding areas on 13 April 2021. The date was selected because cloud cover occurred over part of the study area while valid satellite observations remained available elsewhere, allowing cloud-affected and relatively clear areas to be compared within the same scene. The PM2.5 surface was generated using the same preprocessing and retrieval procedures applied in the regional analysis. Pixels without valid AOD were retained as missing values rather than being spatially or temporally interpolated.
MODIS true-color imagery acquired between 10:00 and 14:00 local time, covering the approximate daytime overpass periods of Terra and Aqua, was used to provide visual information on cloud distribution. The true-color image and retrieved PM2.5 surface were displayed over the same geographic extent and compared qualitatively. Particular attention was given to whether cloud-covered areas in the MODIS imagery corresponded to missing or spatially discontinuous PM2.5 retrievals.
3. Results
3.1. Model Performance Across Predictor Groups
Model performance improved as meteorological and additional satellite variables were added to AOD (Table 2). The AOD-only models achieved test R2 values of 0.506–0.543, with RMSE ranging from 21.196 to 22.022 μg/m3. Adding meteorological variables increased R2 to 0.715–0.742 and reduced RMSE to 15.928–16.734 μg/m3. Adding other satellite variables produced higher R2 values of 0.793–0.807 and lower RMSE values of 13.755–14.259 μg/m3.
Table 2.
Performance of RF, SVR, XGBoost, and stacking under four predictor groups in the BTH region.
Combining all predictors gave the best performance for each model. Stacking achieved the highest R2 (0.842) and the lowest RMSE (12.444 μg/m3) and MAE (9.731 μg/m3) in this group. However, stacking did not lead in every predictor group: XGBoost performed best with AOD-only and AOD plus meteorology, while SVR had the highest R2 and lowest RMSE with AOD plus satellite variables.
Training, validation, and test performance are reported in Table 3. With all predictors, R2 decreased from 0.947 to 0.834 for RF and from 0.916 to 0.836 for XGBoost. Stacking showed a smaller decrease, from 0.900 to 0.842, while SVR changed from 0.851 to 0.837. Validation and test performance were similar under the full-input configuration.
Table 3.
Training, validation, and test performance of four models across four input combinations.
3.2. Spatial Distribution of Retrieved PM2.5
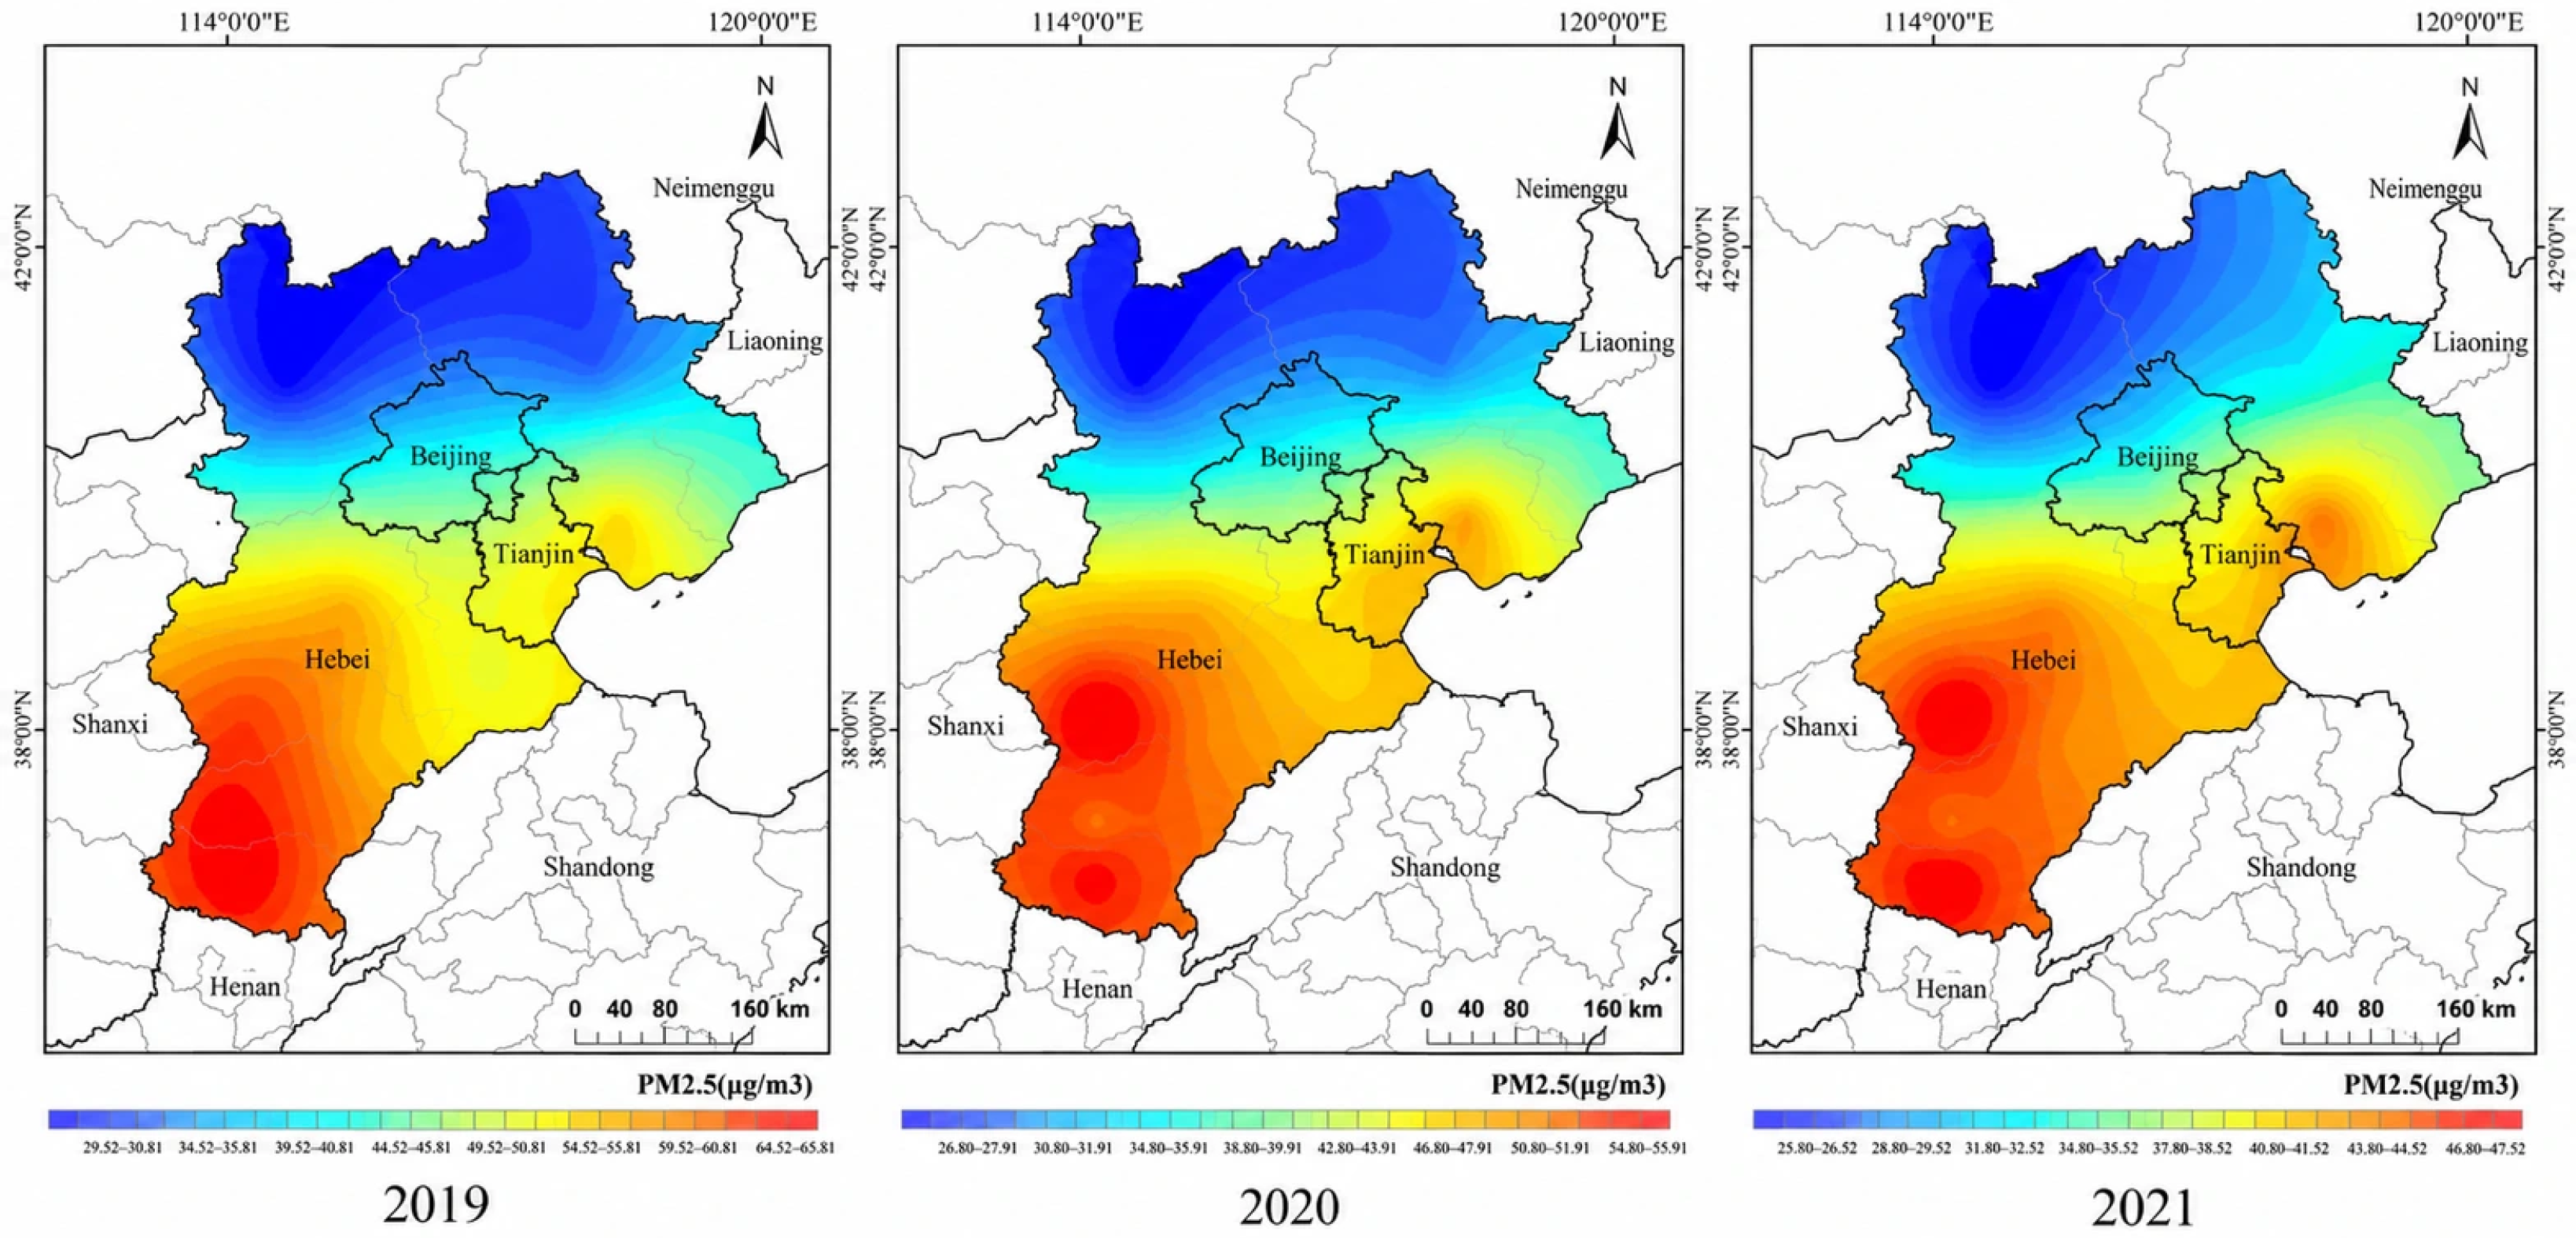
Figure 3 presents the annual mean PM2.5 concentrations retrieved by the stacking model across the BTH region during 2019–2021. The results revealed a pronounced and persistent north–south spatial gradient, with higher concentrations mainly occurring in southern and southwestern Hebei and lower concentrations in the northern mountainous areas, particularly around Zhangjiakou and Chengde. Beijing and Tianjin generally exhibited intermediate concentrations, with gradual spatial transitions toward surrounding high- and low-concentration areas. Although the overall spatial pattern remained consistent across the three years, variations were observed in the magnitude and extent of high-concentration areas. Overall, the stacking model captured the major regional PM2.5 gradients and provided spatially continuous estimates across the BTH region.
Figure 3.
Annual mean PM2.5 concentrations retrieved by the stacking model in the BTH region from 2019 to 2021.
3.3. Temporal and Seasonal Variation in PM2.5
3.3.1. Interannual Variation from 2019 to 2021
The annual PM2.5 maps showed a persistent north–south spatial gradient across the BTH region during 2019–2021, with higher concentrations mainly occurring in southern Hebei and lower concentrations in northern BTH. Although the overall spatial pattern remained stable, the intensity and spatial extent of high-concentration areas varied among the three years. These results indicate that the retrieval framework captured both persistent regional patterns and interannual variability in PM2.5 concentrations.
3.3.2. Seasonal Variation in the Beijing–Tianjin–Hebei Region
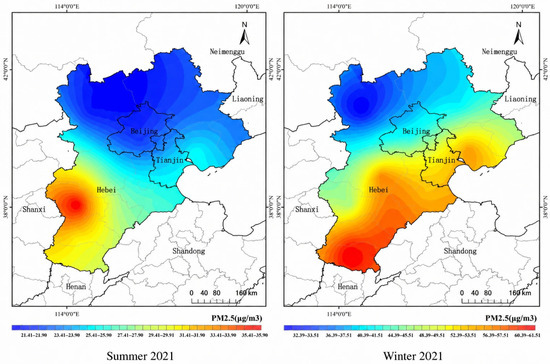
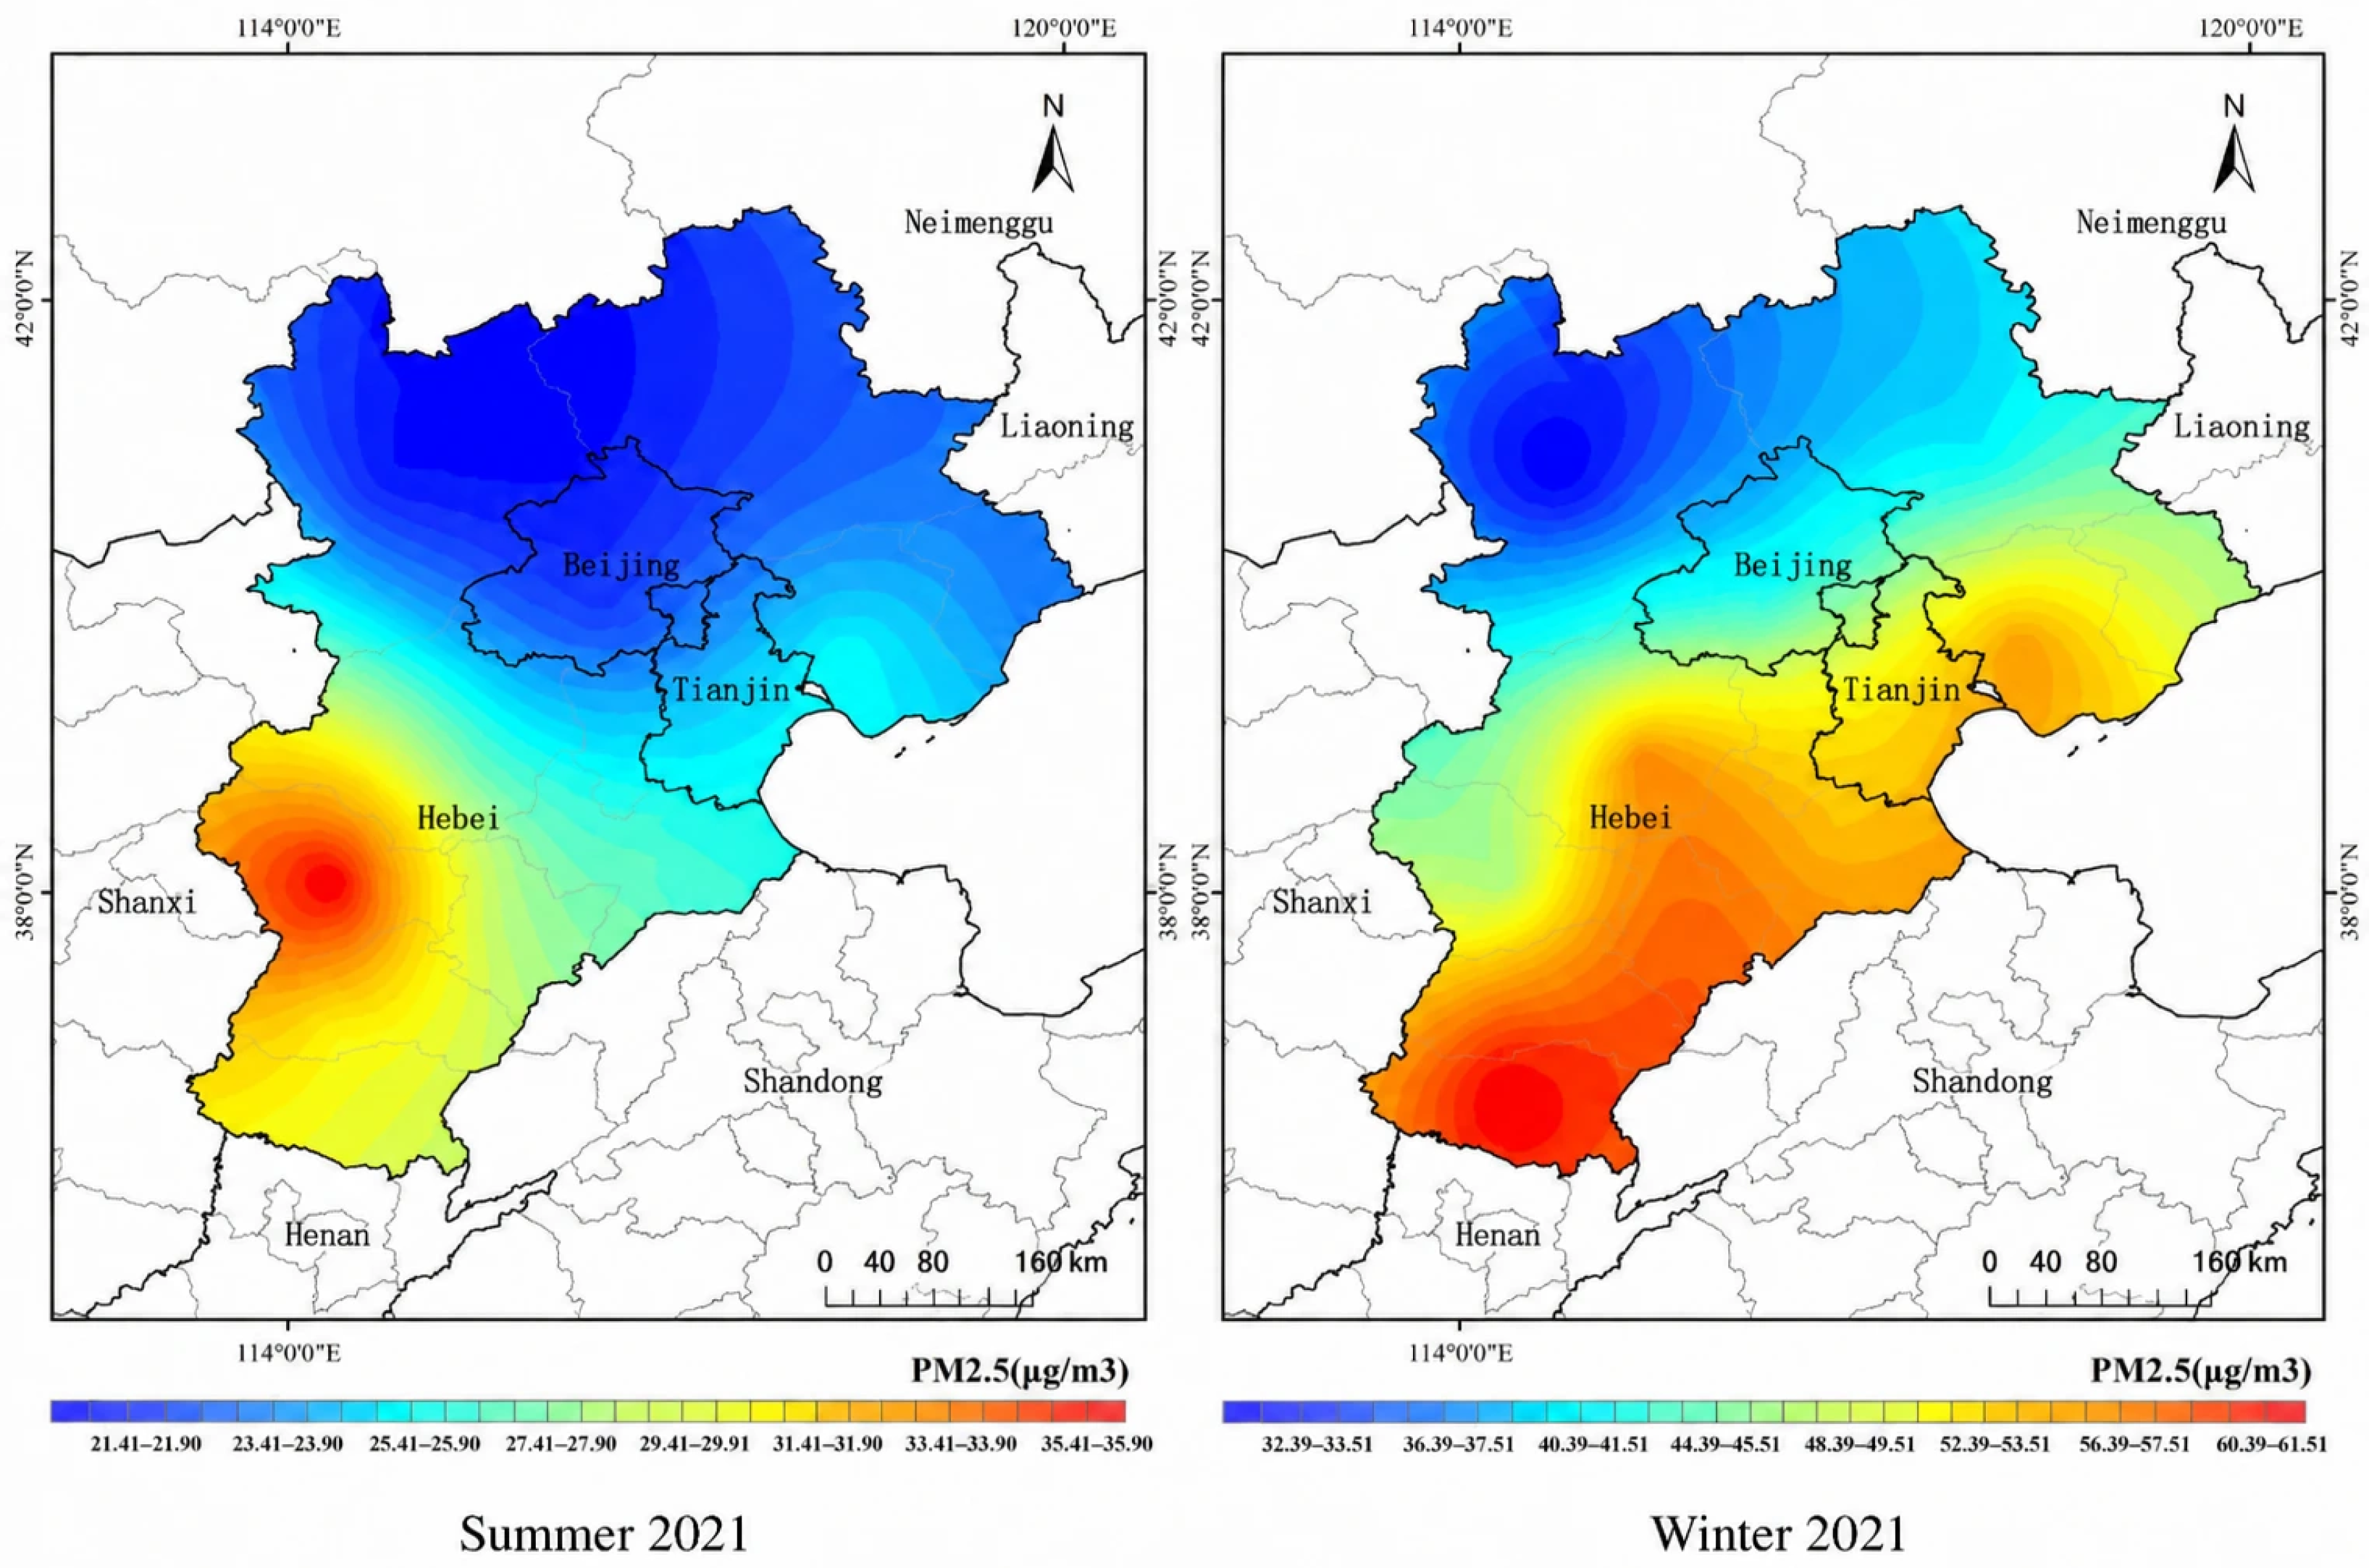
Figure 4 compares the spatial distribution of retrieved PM2.5 concentrations between summer and winter 2021. PM2.5 concentrations were generally lower and more spatially limited in summer, whereas higher and more extensive concentrations occurred in winter, particularly across southern and southwestern Hebei. The north–south gradient persisted in both seasons, but seasonal differences were more pronounced in southern Hebei. Overall, the results demonstrate that the retrieval framework captured both persistent spatial gradients and seasonal variation in PM2.5 concentrations.
Figure 4.
Seasonal distribution of PM2.5 concentrations retrieved by the stacking model in the BTH region in 2021.
3.4. AOD Availability and Retrieval Gaps
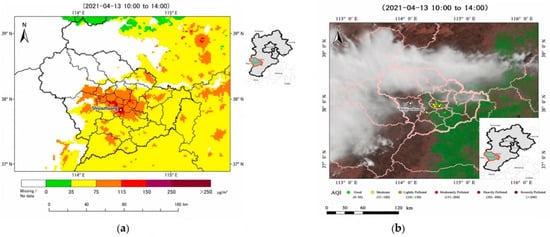
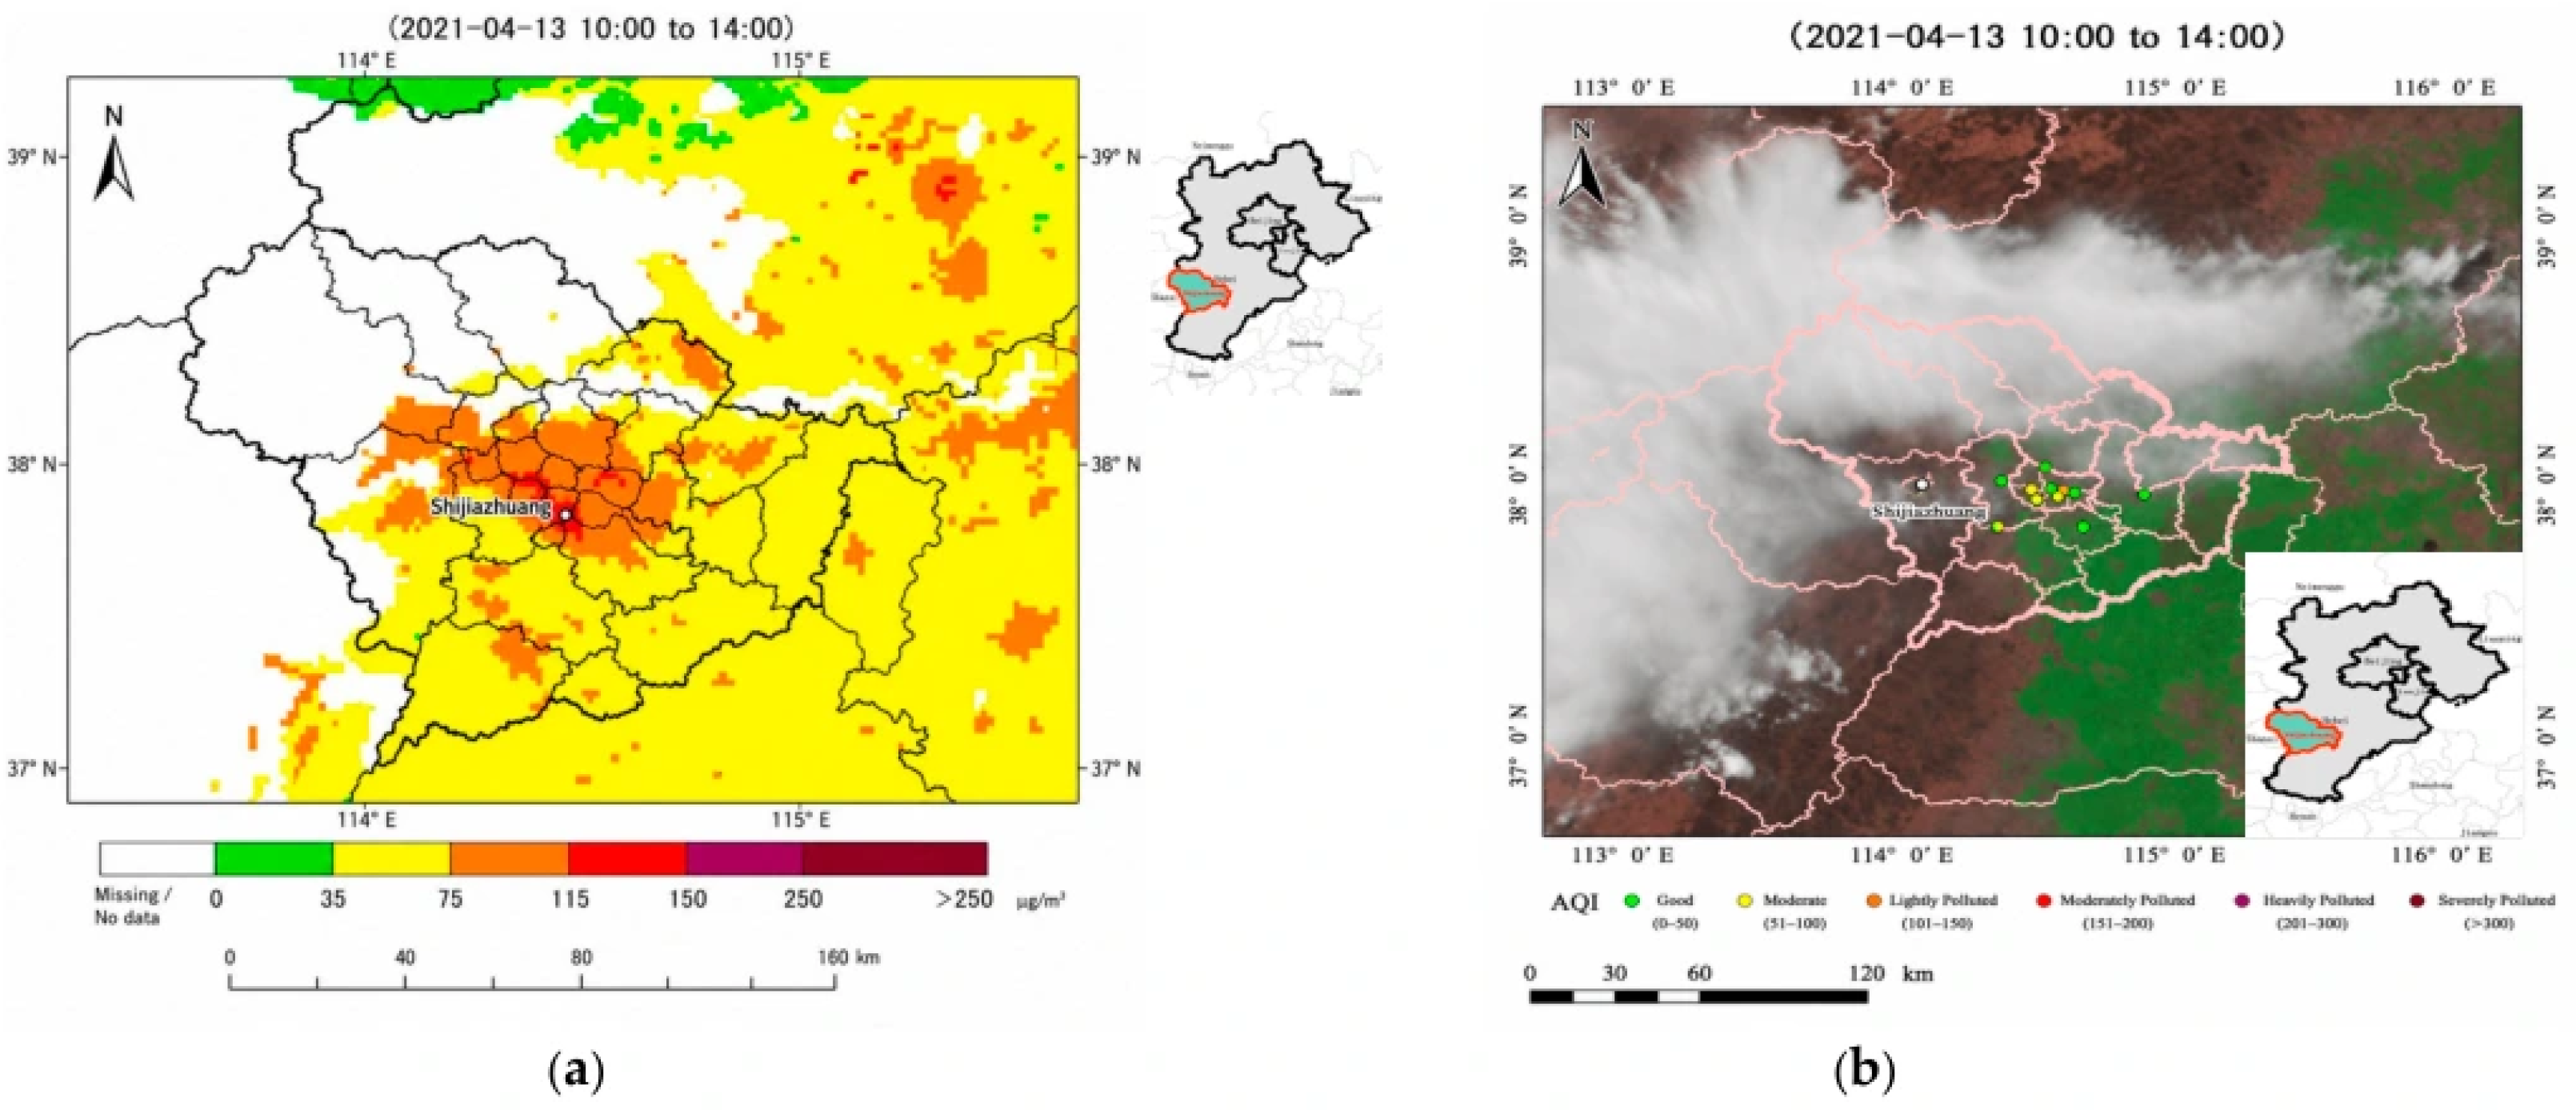
Figure 5 shows gaps in the PM2.5 retrieval for Shijiazhuang and its surrounding areas on 13 April 2021. Large blank areas in the western and northwestern parts of the map broadly coincided with visible cloud cover in the MODIS true-color image. Retrievals were more complete in the eastern and southeastern areas, where less cloud cover was visible. This pattern is consistent with cloud-related limits on AOD availability, although missing inputs and quality screening may also explain some gaps. Blank pixels represent unavailable retrievals rather than low PM2.5 concentrations or prediction errors.
Figure 5.
Fine-scale PM2.5 Retrieval Under Cloud-affected and Missing-AOD Conditions in Shijiazhuang, BTH region: (a) Retrieved PM2.5 Concentration Distribution in Shijiazhuang on 13 April 2021; (b) MODIS True Color Satellite Image of Shijiazhuang and Surrounding Areas on 13 April 2021.
No gap filling was applied, so the map retained gaps where required inputs were unavailable. Gap filling could increase spatial coverage, but errors in the filled inputs could affect PM2.5 predictions and smooth local concentration differences. These effects were not quantified in this study. Future work should compare filled and unfilled retrievals using independent observations, with accuracy assessed separately for pixels with observed and filled inputs.
4. Discussion
4.1. Added Value of Multi-Source Inputs
The four input combinations show that AOD alone provided limited information for daily surface PM2.5 retrieval, with R2 ranging from 0.51 to 0.54. Adding meteorological variables increased R2 to 0.71–0.74, while adding LST, NDVI, and NO2 increased it to 0.79–0.81. All eight predictors produced the highest performance for every model, with R2 ranging from 0.83 to 0.84. These results show that the additional variables supplied useful information beyond AOD.
The improvement after adding meteorological variables is consistent with the effects of humidity and boundary-layer structure on the AOD–PM2.5 relationship [6,7,17]. Relative humidity affects aerosol water uptake and optical extinction, while boundary-layer height describes the vertical space available for pollutant mixing [6,7,17]. Temperature and wind speed provide information on atmospheric conditions and dispersion.
The satellite-variable combination also improved retrieval performance. LST and NDVI describe surface thermal and vegetation conditions, while tropospheric NO2 provides additional information associated with combustion-related pollution. Their combined use with meteorological variables produced the strongest results, supporting the integration of different environmental data sources.
4.2. Performance of the Stacking Ensemble
With all predictors, stacking achieved R2 = 0.84, RMSE = 12.4 μg/m3, and MAE = 9.7 μg/m3. Based on the unrounded results, its RMSE and MAE were approximately 1.9% and 1.4% lower than those of XGBoost, respectively. Stacking therefore provided a small improvement under the full-input configuration.
However, stacking was not the best model for every input combination. XGBoost had the highest R2 and lowest RMSE with AOD alone and with AOD plus meteorology, while SVR performed best on these metrics with the satellite-variable combination. The benefit of stacking therefore depended on the available inputs. These results support using stacking to combine complementary model predictions, while retaining individual models as useful alternatives. Previous hybrid-model research also supports combining different learners for PM2.5 retrieval [13,14,26].
The larger training–test gaps for RF and XGBoost suggest greater fitting to the training data and possible overfitting. Stacking showed a smaller gap, although its training performance was also better than its test performance. SVR showed the smallest gap under the full-input configuration. These comparisons show that strong training performance does not guarantee better held-out performance.
4.3. Spatial and Seasonal PM2.5 Patterns
The annual retrievals showed higher PM2.5 concentrations in southern and southwestern Hebei and lower concentrations in northern BTH. The persistence of this pattern indicates stable regional differences during 2019–2021. Urban and industrial activity, regional transport, terrain, and atmospheric dispersion provide possible explanations for the spatial contrast [4,5,28].
The 2021 maps showed higher concentrations in winter than in summer. Winter heating and weaker atmospheric mixing can favor pollutant accumulation, while summer conditions can support dispersion and wet removal [17,29]. Similar winter–summer differences have been reported in previous PM2.5 retrieval studies [14].
Data availability should also be considered when interpreting annual and seasonal maps. Differences in the number and timing of valid daily retrievals may affect the mapped averages. Valid-day counts can help describe the observational support for each mapped area.
4.4. AOD Availability and Gap Filling
The Shijiazhuang case showed that missing required inputs reduced the spatial completeness of PM2.5 retrievals. Cloud cover in the true-color image provided qualitative evidence for one possible cause of missing AOD. Retrieval failure, quality screening, and missing auxiliary inputs may also produce blank pixels. These gaps indicate unavailable retrievals rather than prediction errors. No gap filling was applied.
Future work should assess whether gap filling improves coverage while maintaining retrieval accuracy and local concentration differences [18,30,31]. Additional meteorological, aerosol-profile, and emission data could also support retrieval improvement.
5. Conclusions
This study compared four input combinations and four machine-learning models for PM2.5 retrieval in the BTH region during 2019–2021. Multi-source inputs improved performance over AOD alone, with R2 increasing from 0.51–0.54 to 0.83–0.84. With all predictors, stacking achieved the best results, with R2 = 0.84, RMSE = 12.4 μg/m3, and MAE = 9.7 μg/m3. Its improvement over individual models was small and depended on the input combination.
The retrieved maps showed higher concentrations in southern and southwestern Hebei, lower concentrations in northern BTH, and higher winter than summer concentrations in 2021. Missing required inputs reduced map completeness. Future research should assess gap filling using independent observations and report accuracy separately for filled and originally valid pixels. The framework provides a basis for regional PM2.5 retrieval and air-quality assessment.
Author Contributions
Conceptualization, L.C. and S.N.A.R.; methodology, L.C. and S.N.A.R.; validation, L.C., S.N.A.R. and H.Z.M.S.; formal analysis, L.C. and S.N.A.R.; investigation, L.C., W.W., Q.L. and J.L.; resources, S.N.A.R., H.Z.M.S. and W.W.; data curation, L.C., W.W., Q.L. and J.L.; writing—original draft preparation, L.C.; writing—review and editing, L.C., S.N.A.R., and H.Z.M.S.; visualization, L.C.; supervision, S.N.A.R. and H.Z.M.S.; project administration, S.N.A.R. and H.Z.M.S. All authors have read and agreed to the published version of the manuscript.
Funding
This research received no external funding.
Institutional Review Board Statement
Not applicable.
Informed Consent Statement
Not applicable.
Data Availability Statement
MODIS AOD, LST, and NDVI products are publicly available through NASA Earthdata Search (https://search.earthdata.nasa.gov/). Sentinel-5P/TROPOMI tropospheric NO2 data are available through the Google Earth Engine collection COPERNICUS/S5P/OFFL/L3_NO2 (https://developers.google.com/earth-engine/datasets/catalog/COPERNICUS_S5P_OFFL_L3_NO2, accessed on 15 April 2026). ERA5 meteorological data are available from the Copernicus Climate Data Store (https://cds.climate.copernicus.eu/datasets/reanalysis-era5-single-levels, accessed on 15 April 2026). Ground-level PM2.5 observations used in this study were originally published by the China National Environmental Monitoring Centre (CNEMC; https://www.cnemc.cn/sssj/, accessed on 15 April 2026).
Conflicts of Interest
The authors declare no conflicts of interest.
Abbreviations
The following abbreviations are used in this manuscript:
| PM2.5 | Fine particulate matter |
| CNEMC | China National Environmental Monitoring Centre |
| MODIS | Moderate Resolution Imaging Spectroradiometer |
| MAIAC | Multi-Angle Implementation of Atmospheric Correction |
| TROPOMI | TROPOspheric Monitoring Instrument |
| ERA5 | ECMWF fifth-generation reanalysis |
| ECMWF | European Centre for Medium-Range Weather Forecasts |
| RF | Random Forest |
| SVR | Support Vector Regression |
| XGBoost | Extreme Gradient Boosting |
| AOD | Aerosol Optical Depth |
| LST | Land surface temperature |
| NDVI | Normalized difference vegetation index |
| NO2 | Nitrogen dioxide |
| Temp | Temperature |
| RH | Relative Humidity |
| WS | Wind speed |
| PBLH | Planetary Boundary Layer Height |
| BTH | Beijing–Tianjin–Hebei region |
| R2 | Coefficient of determination |
| RMSE | Root mean square error |
| MAE | Mean absolute error |
References
- Martin, R.V. Satellite remote sensing of surface air quality. Atmos. Environ. 2008, 42, 7823–7843. [Google Scholar] [CrossRef] [Scilit]
- Hoff, R.M.; Christopher, S.A. Remote sensing of particulate pollution from space: Have we reached the promised land? J. Air Waste Manag. Assoc. 2009, 59, 645–675. [Google Scholar] [CrossRef] [Scilit]
- van Donkelaar, A.; Martin, R.V.; Brauer, M.; Kahn, R.; Levy, R.; Verduzco, C.; Villeneuve, P.J. Global estimates of ambient fine particulate matter concentrations from satellite-based aerosol optical depth: Development and application. Environ. Health Perspect. 2010, 118, 847–855. [Google Scholar] [CrossRef] [Scilit] [PubMed]
- Yang, X.; Xiao, D.; Bai, H.; Tang, J.; Wang, W. Spatiotemporal distributions of PM2.5 concentrations in the Beijing–Tianjin–Hebei region from 2013 to 2020. Front. Environ. Sci. 2022, 10, 842237. [Google Scholar] [CrossRef] [Scilit]
- Chen, D.; Jin, X.; Fu, X.; Xia, L.; Guo, X.; Lang, J.; Zhou, Y.; Wei, W. Impact of inter-annual variation in meteorology from 2010 to 2019 on the inter-city transport of PM2.5 in the Beijing–Tianjin–Hebei region. Sustainability 2022, 14, 6210. [Google Scholar] [CrossRef] [Scilit]
- He, Q.; Wang, M.; Yim, S.H.L. The spatiotemporal relationship between PM2.5 and aerosol optical depth in China: Influencing factors and implications for satellite PM2.5 estimations using MAIAC aerosol optical depth. Atmos. Chem. Phys. 2021, 21, 18375–18391. [Google Scholar] [CrossRef] [Scilit]
- Wang, Z.; Chen, L.; Tao, J.; Zhang, Y.; Su, L. Satellite-based estimation of regional particulate matter (PM) in Beijing using vertical-and-RH correcting method. Remote Sens. Environ. 2010, 114, 50–63. [Google Scholar]
- Chen, G.; Li, S.; Knibbs, L.D.; Hamm, N.A.S.; Cao, W.; Li, T.; Guo, J.; Ren, H.; Abramson, M.J.; Guo, Y. A machine learning method to estimate PM2.5 concentrations across China with remote sensing, meteorological and land use information. Sci. Total Environ. 2018, 636, 52–60. [Google Scholar] [CrossRef] [Scilit] [PubMed]
- Wei, J.; Li, Z.; Cribb, M.; Huang, W.; Xue, W.; Sun, L.; Guo, J.; Peng, Y.; Li, J.; Lyapustin, A.; et al. Improved 1 km resolution PM2.5 estimates across China using enhanced space-time extremely randomized trees. Atmos. Chem. Phys. 2020, 20, 3273–3289. [Google Scholar] [CrossRef] [Scilit]
- Wei, J.; Li, Z.; Lyapustin, A.; Sun, L.; Peng, Y.; Xue, W.; Su, T.; Cribb, M. Reconstructing 1-km-resolution high-quality PM2.5 data records from 2000 to 2018 in China: Spatiotemporal variations and policy implications. Remote Sens. Environ. 2021, 252, 112136. [Google Scholar] [CrossRef] [Scilit]
- Di, Q.; Amini, H.; Shi, L.; Kloog, I.; Silvern, R.; Kelly, J.; Sabath, M.B.; Choirat, C.; Koutrakis, P.; Lyapustin, A.; et al. An ensemble-based model of PM2.5 concentration across the contiguous United States with high spatiotemporal resolution. Environ. Int. 2019, 130, 104909. [Google Scholar] [CrossRef] [Scilit] [PubMed]
- Xiao, Q.; Chang, H.H.; Geng, G.; Liu, Y. An ensemble machine-learning model to predict historical PM2.5 concentrations in China from satellite data. Environ. Sci. Technol. 2018, 52, 13260–13269. [Google Scholar] [CrossRef] [Scilit] [PubMed]
- Chen, J.; Yin, J.; Zang, L.; Zhang, T.; Zhao, M. Stacking machine learning model for estimating hourly PM2.5 in China based on Himawari-8 aerosol optical depth data. Sci. Total Environ. 2019, 697, 134021. [Google Scholar] [CrossRef] [Scilit] [PubMed]
- Song, Z.; Chen, B.; Huang, Y.; Dong, L.; Yang, T. Estimation of PM2.5 concentration in China using linear hybrid machine learning model. Atmos. Meas. Tech. 2021, 14, 5333–5347. [Google Scholar] [CrossRef] [Scilit]
- Otto, P.; Fusta Moro, A.; Rodeschini, J.; Shaboviq, Q.; Ignaccolo, R.; Golini, N.; Cameletti, M.; Maranzano, P.; Finazzi, F.; Fassò, A. Spatiotemporal modelling of PM2.5 concentrations in Lombardy (Italy): A comparative study. Environ. Ecol. Stat. 2024, 31, 245–272. [Google Scholar] [CrossRef] [Scilit]
- Marongiu, A.; Collalto, A.G.; Distefano, G.G.; Angelino, E. Application of Machine Learning to Estimate Ammonia Atmospheric Emissions and Concentrations. Air 2024, 2, 38–60. [Google Scholar] [CrossRef] [Scilit]
- Chen, Z.; Chen, D.; Zhao, C.; Kwan, M.-P.; Cai, J.; Zhuang, Y.; Zhao, B.; Wang, X.; Chen, B.; Yang, J.; et al. Influence of meteorological conditions on PM2.5 concentrations across China: A review of methodology and mechanism. Environ. Int. 2020, 139, 105558. [Google Scholar] [CrossRef] [Scilit] [PubMed]
- Kawano, A.; Kelp, M.; Qiu, M.; Singh, K.; Chaturvedi, E.; Dahiya, S.; Azevedo, I.; Burke, M. Improved daily PM2.5 estimates in India reveal inequalities in recent enhancement of air quality. Sci. Adv. 2025, 11, eadq1071. [Google Scholar] [CrossRef] [Scilit] [PubMed]
- Lyapustin, A.; Wang, Y.; Korkin, S.; Huang, D. MODIS Collection 6 MAIAC algorithm. Atmos. Meas. Tech. 2018, 11, 5741–5765. [Google Scholar] [CrossRef] [Scilit]
- Wang, Z.; Qian, Y.; Li, Z.; Wu, K.; Guo, C.; Zhang, L.; Li, X.; Guo, J. Analysis of Regional Heavy PM2.5 Pollution Events in Beijing–Tianjin–Hebei and the Surrounding Area in China during 2015–2018. Glob. NEST J. 2021, 23, 475–482. [Google Scholar] [CrossRef] [Scilit]
- Shi, T.; Zhang, Y.; Yuan, X.; Li, F.; Yan, S. Spatial Patterns and Determinants of PM2.5 Concentrations: A Land Use Regression Analysis in Shenyang Metropolitan Area, China. Sustainability 2024, 16, 5119. [Google Scholar] [CrossRef] [Scilit]
- Soci, C.; Hersbach, H.; Simmons, A.; Poli, P.; Bell, B.; Berrisford, P.; Horányi, A.; Muñoz-Sabater, J.; Nicolas, J.; Radu, R.; et al. The ERA5 global reanalysis from 1940 to 2022. Q. J. R. Meteorol. Soc. 2024, 150, 4014–4048. [Google Scholar] [CrossRef] [Scilit]
- Breiman, L. Random forests. Mach. Learn. 2001, 45, 5–32. [Google Scholar] [CrossRef] [Scilit]
- Drucker, H.; Burges, C.J.C.; Kaufman, L.; Smola, A.J.; Vapnik, V. Support vector regression machines. In Advances in Neural Information Processing Systems 9; Mozer, M.C., Jordan, M.I., Petsche, T., Eds.; MIT Press: Cambridge, MA, USA, 1997; pp. 155–161. [Google Scholar]
- Chen, T.; Guestrin, C. XGBoost: A scalable tree boosting system. In Proceedings of the 22nd ACM SIGKDD International Conference on Knowledge Discovery and Data Mining, San Francisco, CA, USA, 13–17 August 2016; pp. 785–794. [Google Scholar] [CrossRef] [Scilit]
- Fu, Q.; Guo, H.; Gu, X.; Li, J.; Zhang, W.; Mi, X.; Zhao, Q.; Chen, D. High-Resolution PM2.5 Concentrations Estimation Based on Stacked Ensemble Learning Model Using Multi-Source Satellite TOA Data. Remote Sens. 2023, 15, 5489. [Google Scholar] [CrossRef] [Scilit]
- VanderPlas, J. Python Data Science Handbook, 2nd ed.; O’Reilly Media: Sebastopol, CA, USA, 2022. [Google Scholar]
- Huang, K.; Xiao, Q.; Meng, X.; Geng, G.; Wang, Y.; Lyapustin, A.; Gu, D.; Liu, Y. Predicting monthly high-resolution PM2.5 concentrations with random forest model in the North China Plain. Environ. Pollut. 2018, 242, 675–683. [Google Scholar] [CrossRef] [Scilit] [PubMed]
- Guo, J.; Deng, M.; Fan, J.; Li, Z.; Chen, Q.; Zhai, P.; Dai, Z.; Li, X. Precipitation and air pollution at mountain and plain stations in northern China: Insights gained from observations and modeling. J. Geophys. Res. Atmos. 2014, 119, 4793–4807. [Google Scholar] [CrossRef] [Scilit]
- Xiao, Q.; Geng, G.; Liu, S.; Liu, J.; Meng, X.; Zhang, Q. Spatiotemporal continuous estimates of daily 1 km PM2.5 from 2000 to present under the Tracking Air Pollution in China (TAP) framework. Atmos. Chem. Phys. 2022, 22, 13229–13242. [Google Scholar] [CrossRef] [Scilit]
- Fan, Y.; Sun, L.; Liu, X. High-accuracy full-coverage PM2.5 retrieval from 2014 to 2023 over China based on satellite remote sensing and hierarchical deep learning model. Int. J. Digit. Earth 2024, 17, 2392850. [Google Scholar] [CrossRef] [Scilit]

Disclaimer/Publisher’s Note: The statements, opinions and data contained in all publications are solely those of the individual author(s) and contributor(s) and not of MDPI and/or the editor(s). MDPI and/or the editor(s) disclaim responsibility for any injury to people or property resulting from any ideas, methods, instructions or products referred to in the content. |
© 2026 by the authors. Licensee MDPI, Basel, Switzerland. This article is an open access article distributed under the terms and conditions of the Creative Commons Attribution (CC BY) license.