


Abstract
Background: In 2022, the World Health Organization announced colorectal cancer as the third most common cancer worldwide and the second leading cause of cancer-related deaths. CRC progression is driven by cumulative genetic and epigenetic alterations which can transformation from benign adenomas into invasive adenocarcinomas. Considering the mortality rate and the challenge of early detection, computational analyses utilizing public datasets provide a powerful approach to suggest novel biomarkers and the underlying molecular basis of the disease. Methods: We applied an integrative gene expression analysis approach to four CRC NCBI GEO gene expression datasets that include human tumor and normal samples. The module detects the common up/downregulated differentially expressed genes (DEGs) across the four datasets. Next, functional enrichment analysis using Gene Ontology (GO) and KEGG pathways was performed to identify key biological processes and potential biomarkers. Then, core candidate biomarkers were evaluated using The Cancer Genome Atlas (TCGA-COAD/READ) datasets, with diagnostic and prognostic utility evaluated via Receiver Operating Characteristic (ROC) curves and a Kaplan–Meier survival analysis. Results: A robust set of 14 downregulated genes and eight upregulated genes common across all four datasets and successfully validated through TCGA datasets. Notably, the batch of the 14 downregulated genes were functionally linked to the regulation of epithelial ion and electrolyte transport. Conclusions: This study provides a robust multi-dataset computational analysis pointing out that reduced epithelial electrolyte transport is a characteristic molecular change in tumor samples. The identified 22 genes are supported by the existing experimental literature and are proposed as potential diagnostic and prognostic biomarkers for future colorectal cancer diagnostics.
1. Introduction
Colorectal cancer, often called colon cancer or rectal cancer, affects the epithelial cells of the large intestines [1]. In 2022, CRC was ranked as the third most common cancer worldwide by the World Health Organization (WHO), with more than 1.9 million diagnosed cases, making it the second leading cause of cancer-related deaths worldwide, with approximately 900,000 deaths per year [1]. CRC is typically driven by cumulative genetic and epigenetic alterations, which can transform benign adenomas into invasive adenocarcinomas [2]. This multistep process can be influenced by chronic inflammation and environmental exposures [3].
Thoroughly monitoring CRC at the molecular level is important to understand its complexity and to develop precise treatments along with targeted therapies [4]. Recent studies have identified key signaling pathways that drive the progression of CRC, including Wnt/β-catenin, MAPK, and PI3K pathways, which regulate fundamental cellular processes, such as growth, differentiation, and apoptosis [5]. Furthermore, the molecular level analysis exposes specific interactions between cancer cells, stromal cells, and the extracellular matrix (ECM) that may not be detectable through histological examination alone [6]. Molecular data (proteomics, transcriptomics, and functional studies) revealed tissue- and stage-specific ECM signatures and signaling nodes that control metastatic spread and patient outcomes [7]. In addition to these molecular alterations, changes in normal epithelial functions, including ion transport and electrolyte balance, may also play a role in CRC development. Moreover, the colonic epithelium depends on regulated sodium and chloride transport to maintain healthy tissue function [8].
The prognosis of CRC strongly depends on the stage of the diagnosis. Early-stage patients showed 5-year survival rates ranging broadly between 71% and 90% depending on the stage, whereas survival after metastasis drops to be around 14% [3]. Such statistics highlight the importance of early detection, which is considered challenging due to a lack of noticeable symptoms in early stages [9]. Furthermore, CRC risk is significantly influenced by lifestyle and environmental factors including smoking and diets high in red and processed meats [10,11]. These findings underscore the critical importance of public health initiatives aimed at promoting healthy diets and regular physical activity to reduce the potential of CRC development [10].
Treatment strategies depend heavily on the tumor location and stage, where surgery and local ablative are considered as the core treatments for localized CRC and selected metastatic cases [12]. These local treatments are usually combined with systemic therapies such as chemotherapy, targeted therapy, or immunotherapy [13]. Targeted therapies directed against Vascular Endothelial Growth Factor or Epidermal Growth factor Receptor pathways have shown outcome improvements in biomarker-defined subgroups. Moreover, multiple recent studies targeted the validation of predictive biomarkers, such as tumor mutation burden, PD-L1 expression, tumor-infiltrating lymphocytes, and circulating tumor DNA, to support treatment decision-making for targeted or immune therapies [2,14].
Recent studies pointed out the important roles of ion transport in main CRC biological processes [15,16]. Ion transport can be well studied using gene expression studies targeting ion channels and ion carriers. However, the primary challenge in oncology studies is translating massive genomic datasets into clinically usable knowledge. Although significant progress has been made in understanding CRC biology, translating molecular discoveries into clinical discoveries remains a challenge [17]. Integrative multi-omics and computational approaches now offer powerful frameworks to bridge this gap by combining transcriptomic, genomic, epigenomic, and proteomic data [18]. Such approaches not only enhance the understanding of CRC but also accelerate the discovery of clinically relevant biomarkers for prognosis and therapeutic targeting [19].
Presently, computational approaches alongside clinical attention are required to enhance the discovery of CRC molecular basis using advanced bioinformatics techniques [17]. Public datasets, particularly NCBI Gene Expression Omnibus (GEO), serve as the foundation for developing and deploying these computational methods. For instance, NCBI GEO currently contains approximately 2954 human CRC gene expression profiling series (GSE) records. Leveraging such resources through intensive bioinformatics analysis can provide deeper insights into disease mechanisms, support biomarker discovery, and contribute to improved diagnostic and therapeutic strategies.
In this work, we present an intensive analysis of four highly informative NCBI GEO gene expression datasets to highlight key CRC characteristics and propose potential biomarkers for future studies. To further strengthen the reliability of our findings, the identified gene expression patterns were validated using independent large-scale transcriptomic datasets from The Cancer Genome Atlas (TCGA) including colon adenocarcinoma (TCGA-COAD) and rectal adenocarcinoma (TCGA-READ).
2. Methods
2.1. Datasets
In this study, four public NCBI GEO datasets were selected based on the inclusion of human CRC samples, sufficient sample size to ensure statistical reliability, and availability of control or comparative tissues. We acquired the pre-normalized versions available for each of the selected datasets. Later, sub-datasets including upregulated or downregulated DEGs from selected datasets were fed to advanced gene set analysis module aiming to understand the biological processes and pathways in addition to possible roles in CRC.
The first gene expression dataset (GSE87211) contains 203 cancer samples and 160 matched mucosa controls that investigated loci as potential markers of rectal cancer prognosis after surgery [20]. The second dataset (GSE20916) includes 101 tumor samples and 44 normal colon samples. The tumor group included adenomas, carcinomas and adenocarcinomas. Additionally, samples were grouped according to their original tissue diagnoses, regardless of the dissection method. This dataset aims to model oncogenic signaling in colon tumors by using multidirectional analyses [21]. The third dataset (GSE21510) aimed to determine the clinical significance of Osteoprotegerin expression in CRC containing 148 samples of cancer and normal tissues [22]. The fourth dataset (GSE9348) used 70 tumor patients and biopsies from 12 healthy controls [23]. The validation datasets were acquired from TCGA COAD and READ datasets to complete the intensive validation process using datasets from other public sources.
2.2. Differential Expression Analysis Module
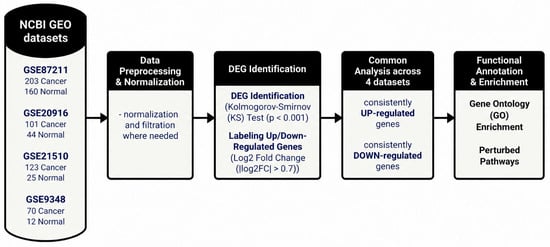
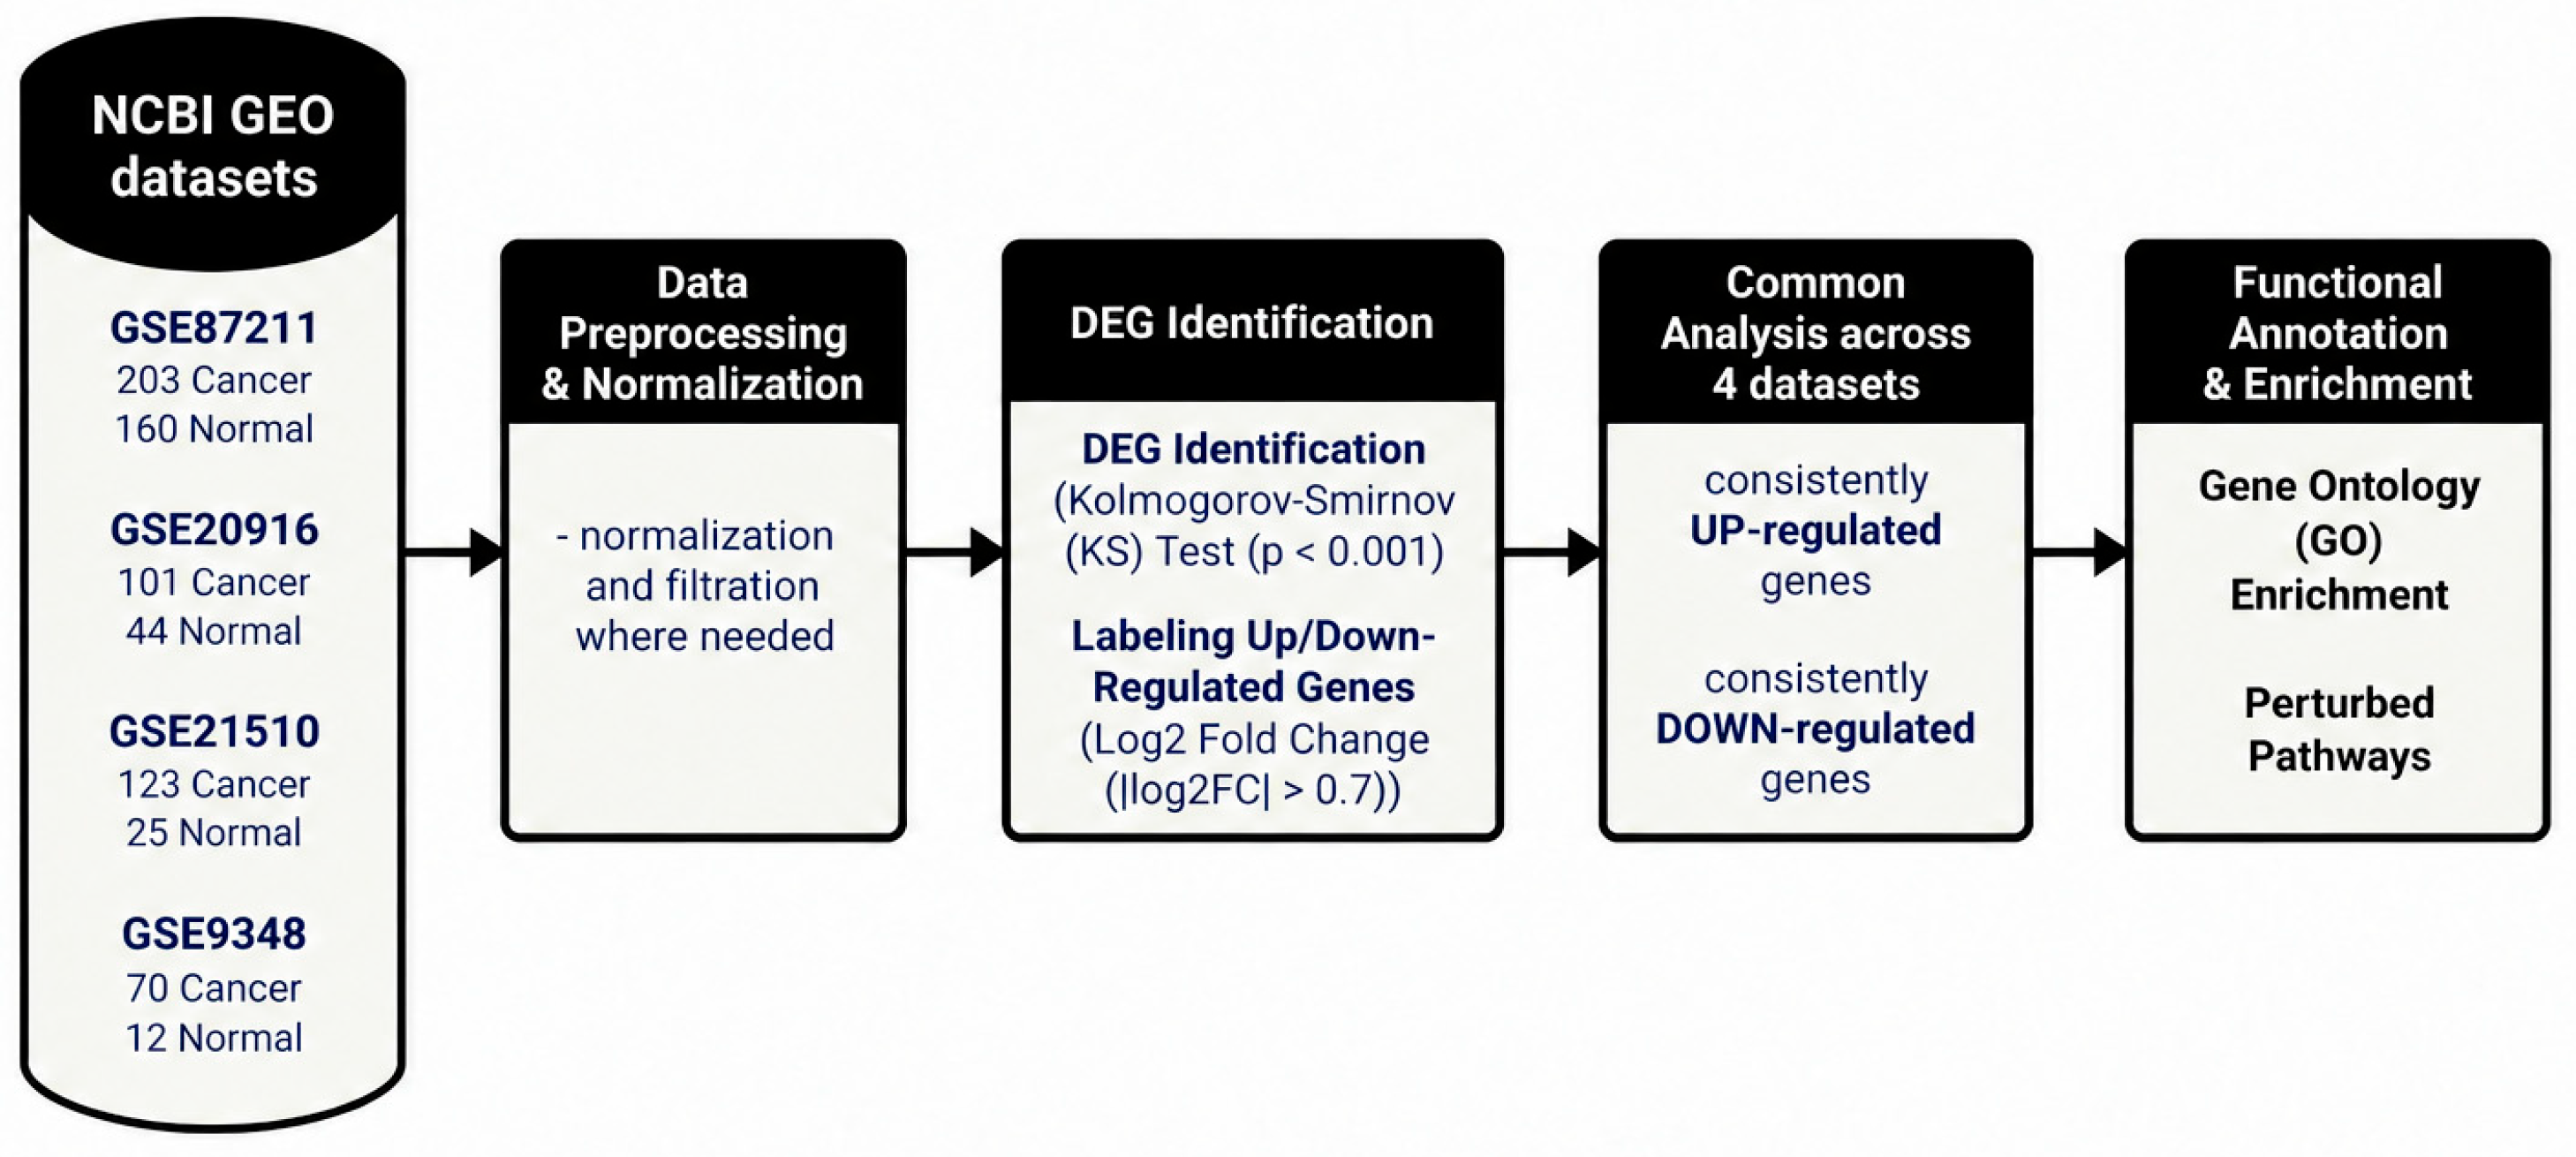
We initiated this work by identifying differentially expressed genes (DEGs) that were common in the four NCBI GEO datasets and that are validated using TCGA COAD and READ datasets. DEGs were identified using the Kolmogorov–Smirnov (KS) test, followed by the analysis of their biological significance through enriched Gene Ontology (GO) biological processes and perturbed pathways. A summary workflow, including dataset selection, preprocessing, differential expression analysis, and functional enrichment, is presented in Figure 1. The applied framework presented in this study has been previously applied in cancer and diabetes studies [24,25,26,27]. The KS test module was prepared in a Python 3.13 environment through the scipy.stats package [28]. To ensure the selection of highly significant genes for more reliable results, we applied a strict p-value threshold of 0.001, followed by a False Discovery Rate (FDR) correction at a threshold of 0.05 to reduce the likelihood of false positives. Next, an Area Under the Curve (AUC) analysis was performed using Receiver Operating Characteristic (ROC) curves to evaluate the required analysis sensitivity. Then, log fold change (LogFC) was calculated to categorize DEGs as either upregulated or downregulated using strict threshold of |0.7|, where LogFC ≥ 0.7 labels upregulation in tumor samples compared to control samples while LogFC ≤ 0.7 labels downregulation. The |0.7| cutoff corresponds to 1.625-fold change in gene expression which is a widely accepted threshold that balances statistical sensitivity with biological relevance and helps avoid excluding biologically important genes [29,30]. This distinction at this stage is vital as upregulated and downregulated DEGs often participate in different biological processes and pathways, and such classification enhances the identification of mechanisms related to the identification of novel biomarkers. Next, a GO enrichment analysis was applied using gseapy library, which is widely used for analyzing RNA-seq, ChIP-seq, and Microarray data [31]. On the other hand, Bioservices packages were employed to find perturbed pathways using the Kyoto Encyclopedia of Genes and Genomes (KEGG) database [32]. Moreover, we calculated the percentage of perturbed genes for each reported pathway along with the fold enrichment score which measures the pathway involvement. Later, we employed Bioconductor packages, including GOSim (1.38.0) [33], clusterProfiler (4.20.2) [34,35,36,37], and ggplot2 (4.0.3) [38], to visualize enriched GO biological processes, and we generated a Protein–Protein Interaction network using the STRING12.5 database to validate our findings [39], while enriched pathways were detected using ShinyGo0.82 [40] and NIH DAVID [41].
Figure 1.
Workflow diagram for DEGs identification.
3. Results
The following section presents our findings of the applied gene expression module to the four CRC selected datasets. We initially labeled genes into upregulated or downregulated using the outcomes of the KS test followed by LogFC analysis. The following sub-sections present the overall distribution of DEGs, the functional enrichment of biological processes, and the perturbed pathways associated with CRC progression.
3.1. Differential Gene Expression Analysis
To identify genes that consistently alter the progression of CRC, intensive differential expression analysis was performed on the selected datasets considering tumor and normal classes. The identified DEGs in each dataset were initially labeled where we report 2150 common DEGS in all datasets. The full list of common DEGs is provided in Supplementary Table S1. This high degree of commonality indicates that these genes may contribute to the development of CRC, which suggests their potential biological relevance and reliability for further analysis. The complete list of genes, including expression levels and fold changes for the comparison groups, is provided in Supplementary Table S2.
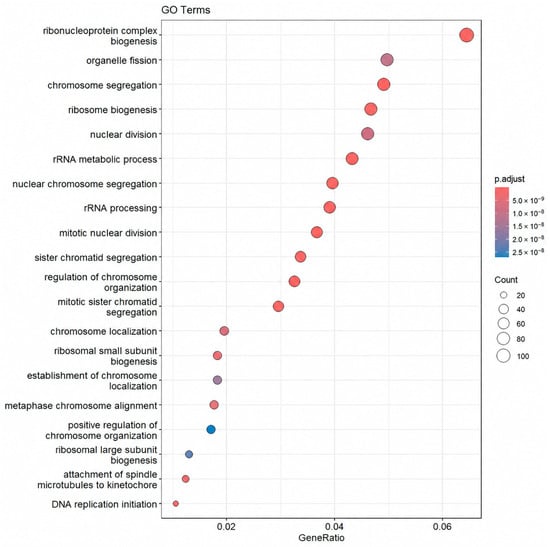
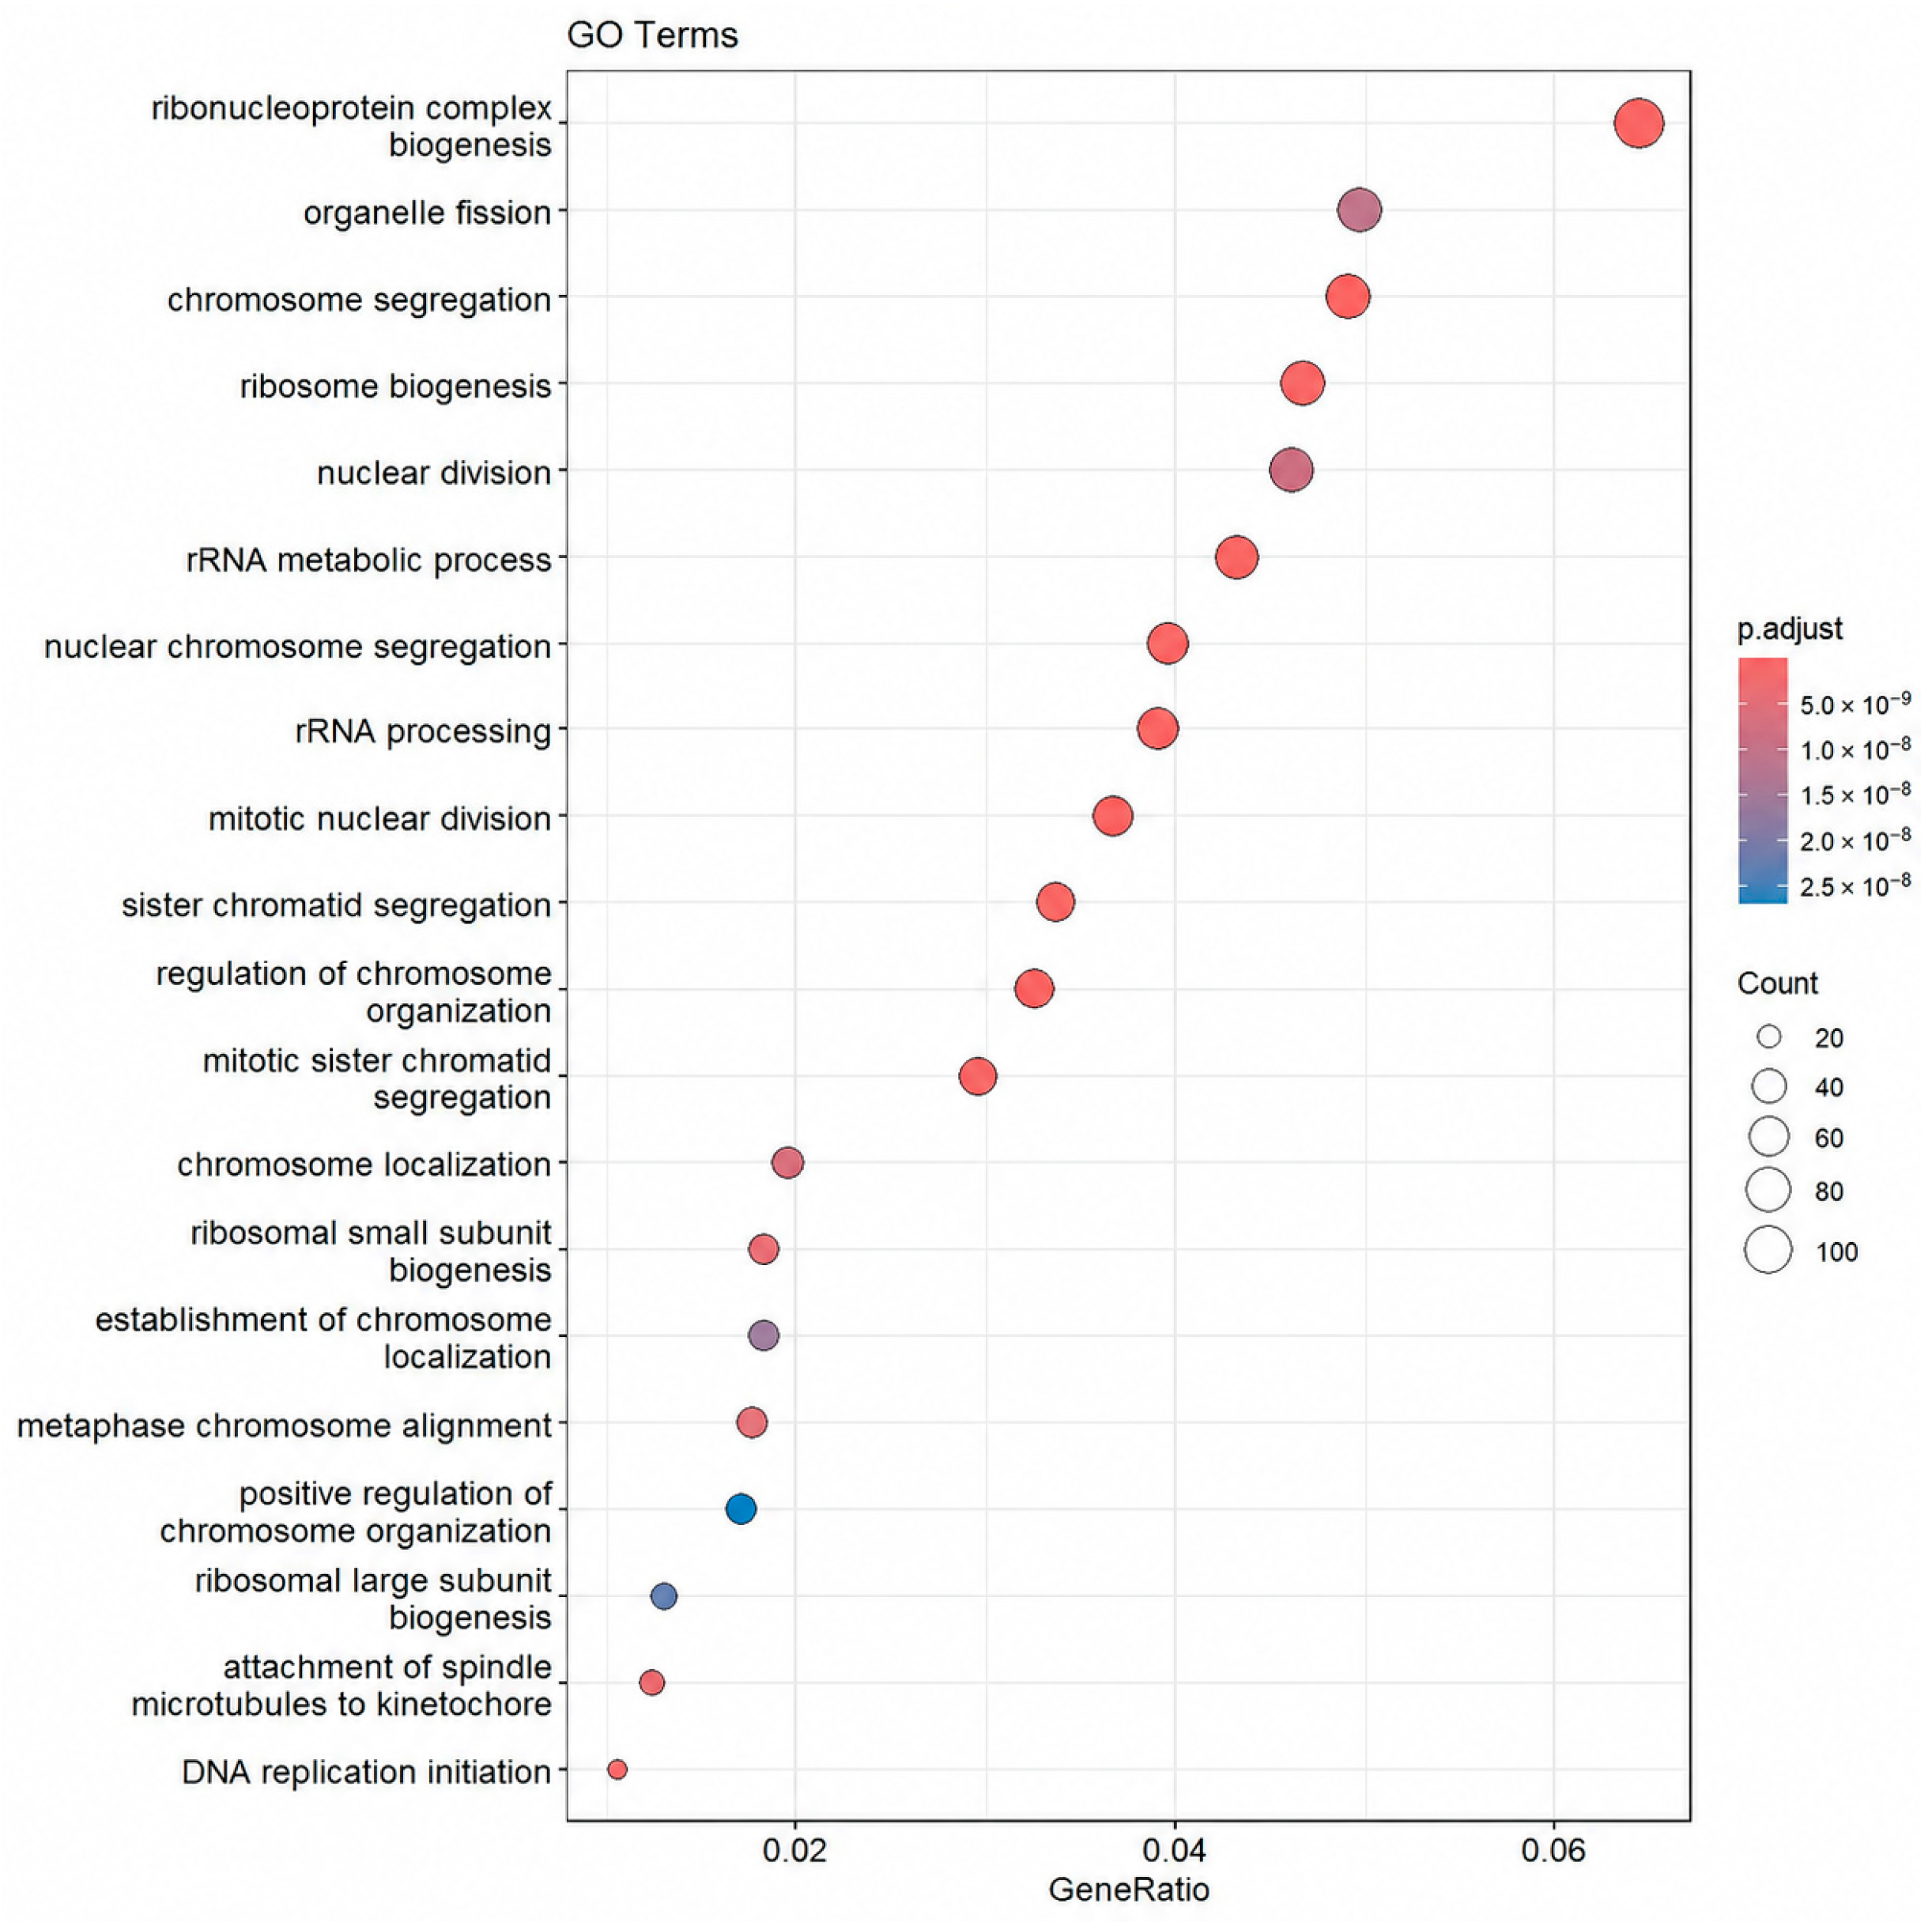
Subsequently, GO and pathway enrichment analyses were performed to reveal the functional importance of the defined DEGs. Our results revealed strong enrichment behavior, especially in ribonucleoprotein complex biogenesis, organelle fission, chromosome segregation, ribosome biogenesis, and nuclear division, as presented by the dot plot in Figure 2 where the x-axis (GeneRatio) represents the ratio of DEGs involved in a specific process to the total number of genes associated with that GO term. The dot size represents the number of associated genes in the process, while the color gradient reflects the adjusted p-value, where the red color indicates higher statistical significance. Moreover, many of the enriched GO terms were associated with ribosomal and chromosomal activities, such as rRNA metabolic processes, rRNA processing, and sister chromatid segregation.
Figure 2.
GO enrichment analysis of common DEGs in CRC.
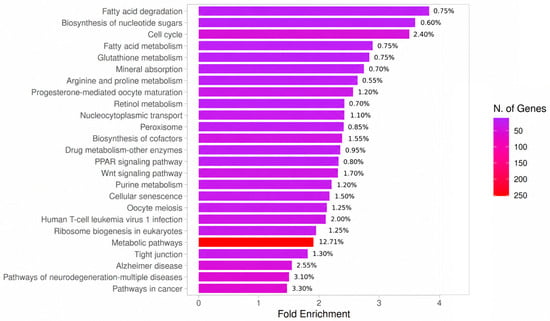
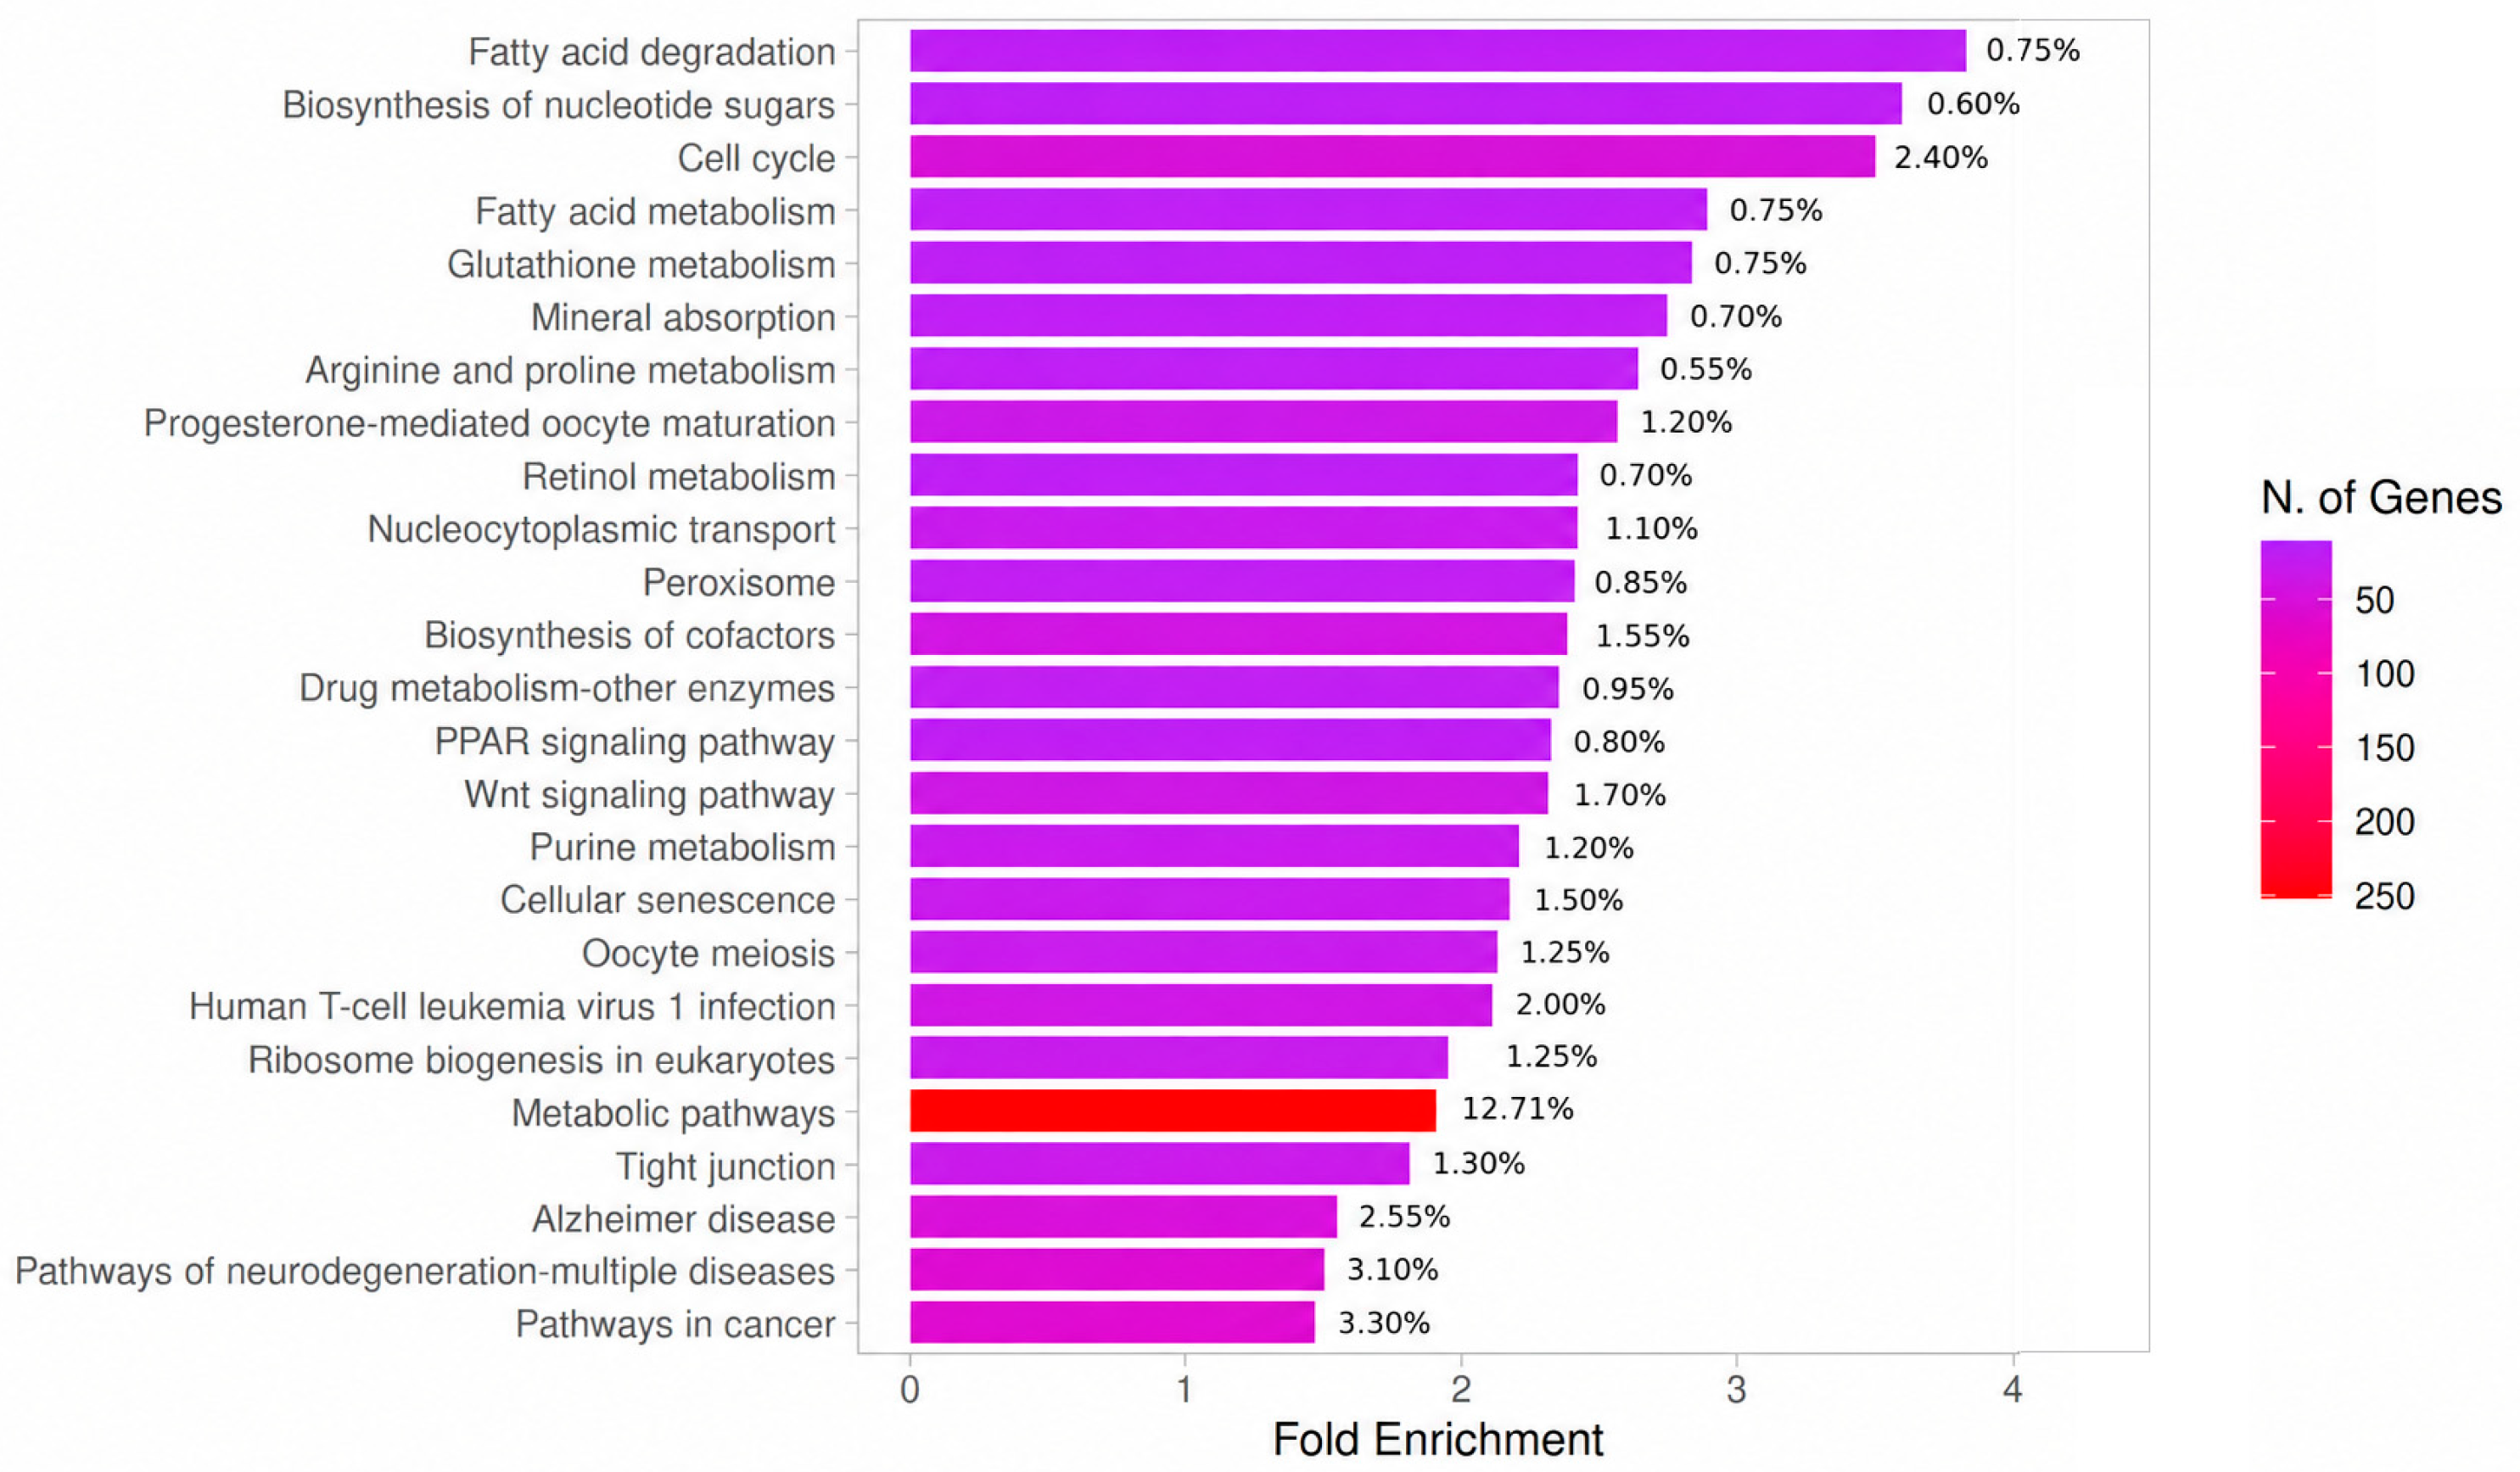
Pathway enrichment analysis of common DEGs revealed many significantly perturbed biological pathways as presented in Figure 3. The most enriched pathways ranked based on the percentage of perturbed genes are metabolic pathways (12.71%), the cell cycle (2.4%), human T-cell leukemia virus 1 infection (2%), the Wnt signaling pathway (1.70%), biosynthesis of cofactors (1.55%), cellular senescence (1.5%), and the p53 signaling pathway (0.8%). Additional pathways, such as fatty acid metabolism, glutathione metabolism, and arginine and proline metabolism, were also identified among the enriched terms, indicating widespread metabolic and signaling variations in CRC.
Figure 3.
KEGG pathways enrichment analysis of common DEGs.
The fold enrichment measures the extent to which a pathway is overrepresented in the gene list compared to the background. As shown in Figure 3 pathways are ranked by fold enrichment (x-axis); the color gradient represents the number of associated genes (N. of Genes) for each term, with red indicating the largest gene clusters and purple indicating smaller sets. Pathways such as fatty acid degradation, biosynthesis of nucleotide sugars, and the cell cycle presented the highest fold enrichment values, indicating that these pathways were overrepresented among the common DEGs. In contrast, metabolic pathways had the largest number of DEGs, which was expected due to their broad coverage of many metabolic functions.
3.2. Functional Regulation Pattern Analysis
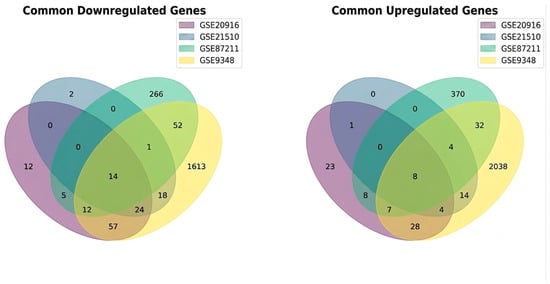
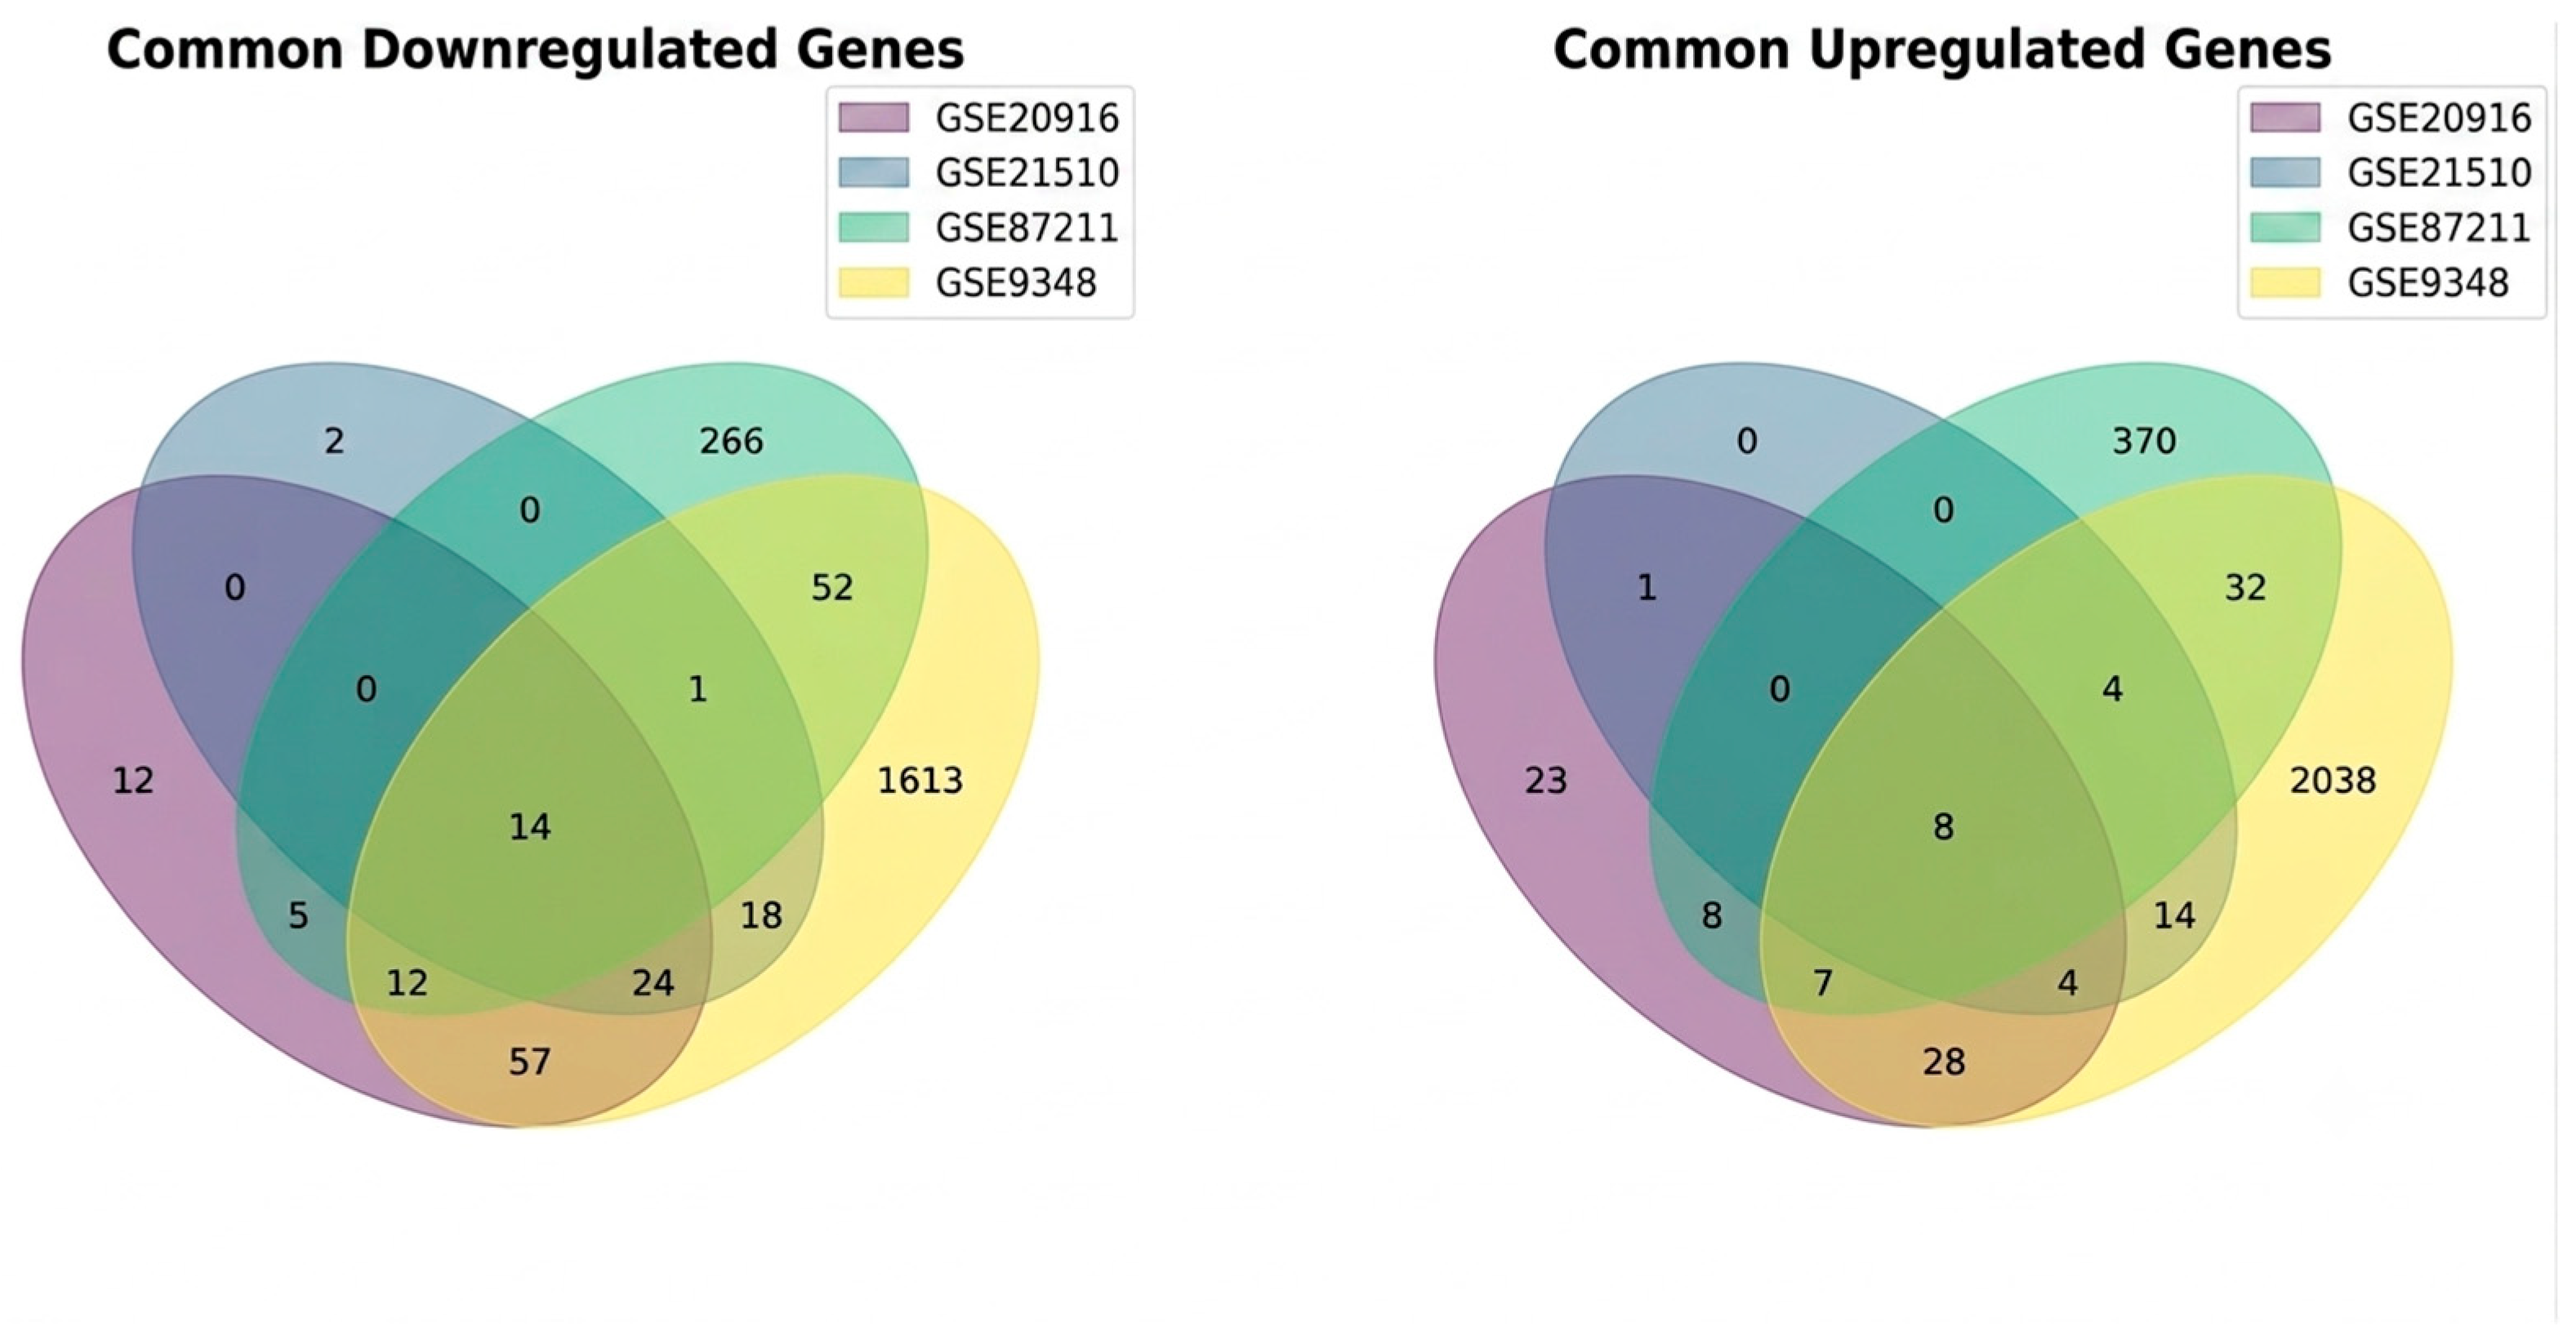
At this stage, we labeled the upregulated and downregulated DEGs in each dataset. Next, we extended the analysis further to focus on genes that were common across all datasets and showed the same direction of regulation (either consistently upregulated or downregulated). This approach ensures robustness as it only includes genes that show uniform expression trends in all datasets. A Venn diagram was constructed to display the overlap of significantly downregulated (left) and upregulated (right) genes identified from the comparison of primary tumor and normal colon samples. The numbers within each section indicate the count of DEGs unique to a single dataset or shared among multiple datasets, revealing 14 downregulated and eight upregulated DEGs common across all four datasets as presented in Figure 4. These common genes represent the candidates and form the basis for the subsequent analyses, where upregulated and downregulated patterns are investigated separately. The full gene list of these common upregulated and downregulated genes is provided in Supplementary Table S3.
Figure 4.
Venn diagrams illustrate the intersection of DEGs across four independent CRC datasets.
3.2.1. Downregulated DEGs
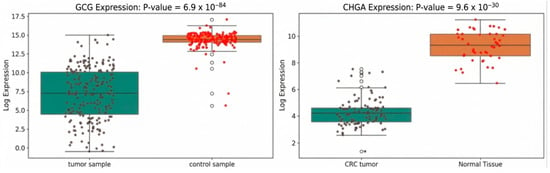
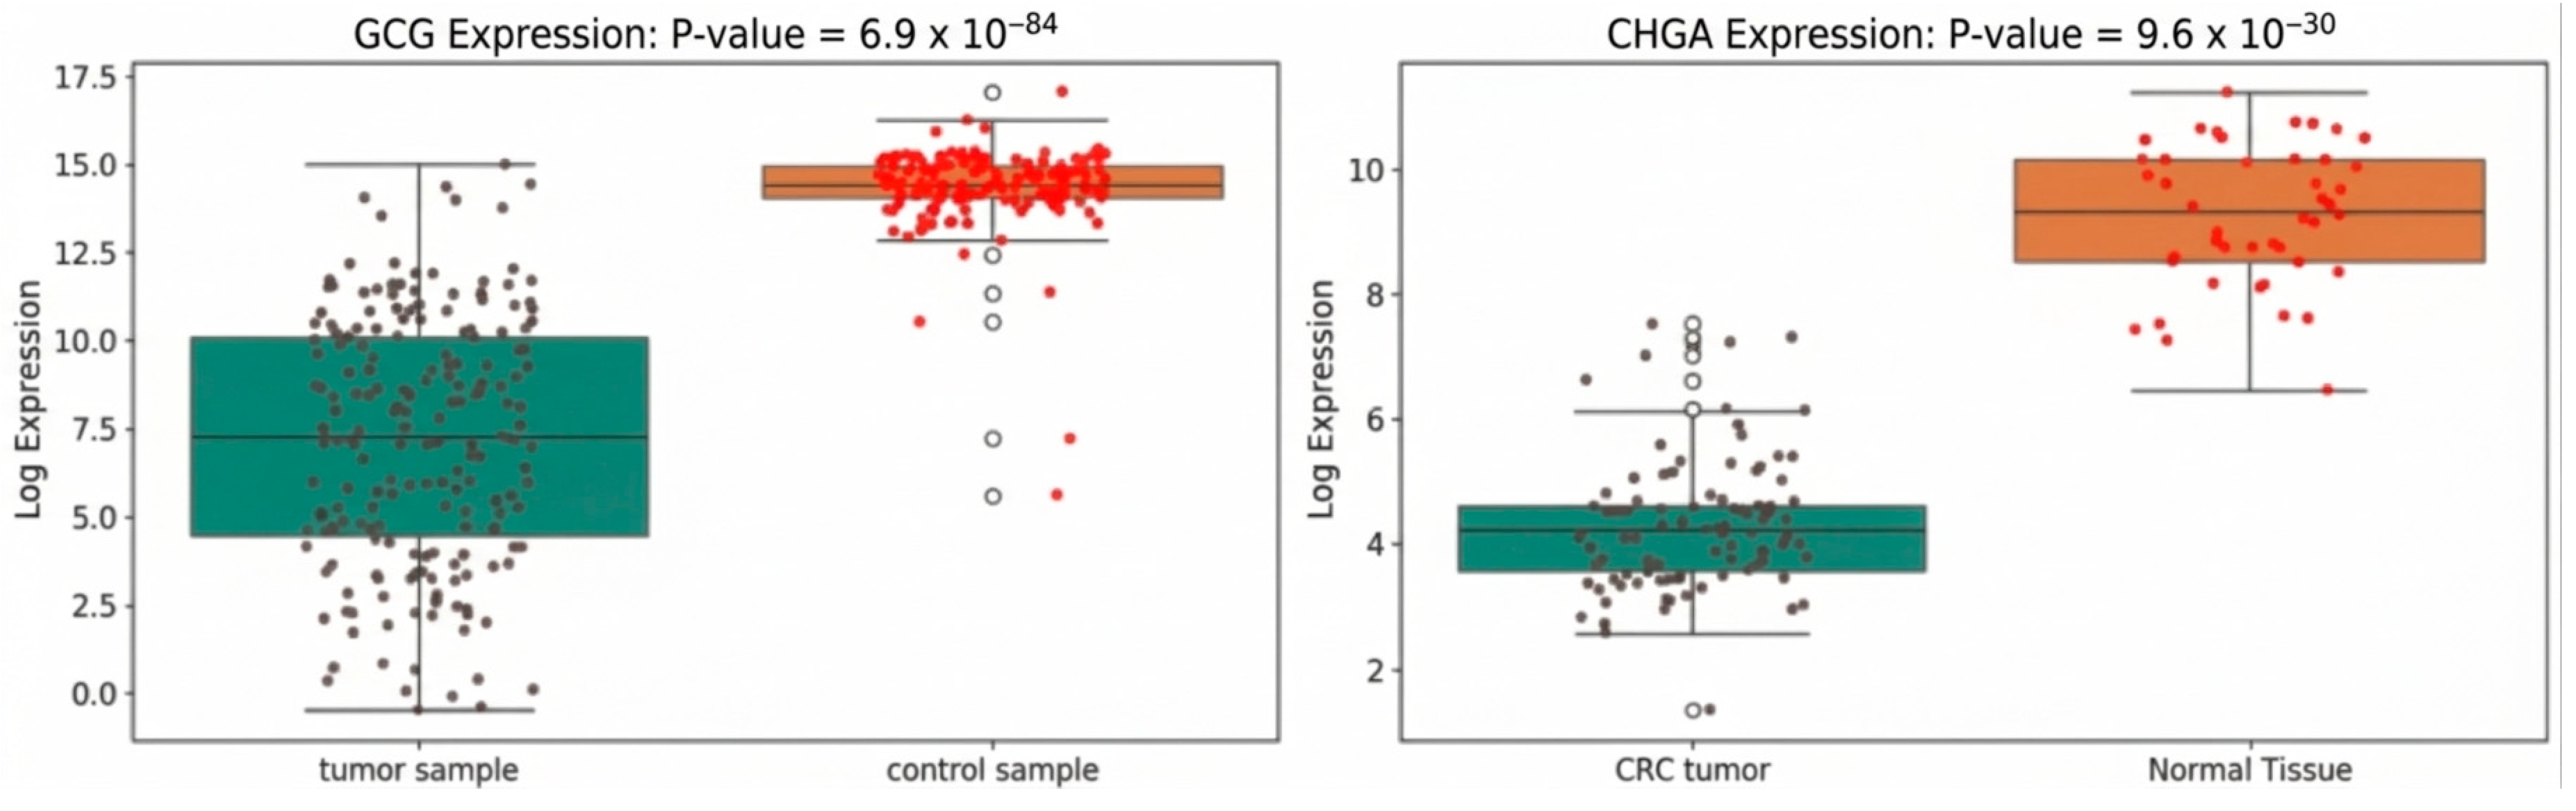
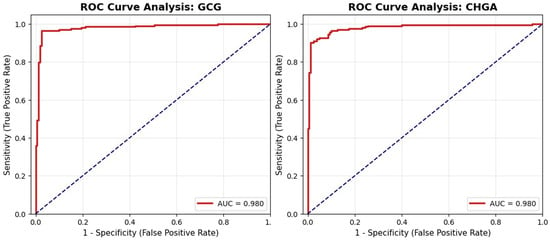
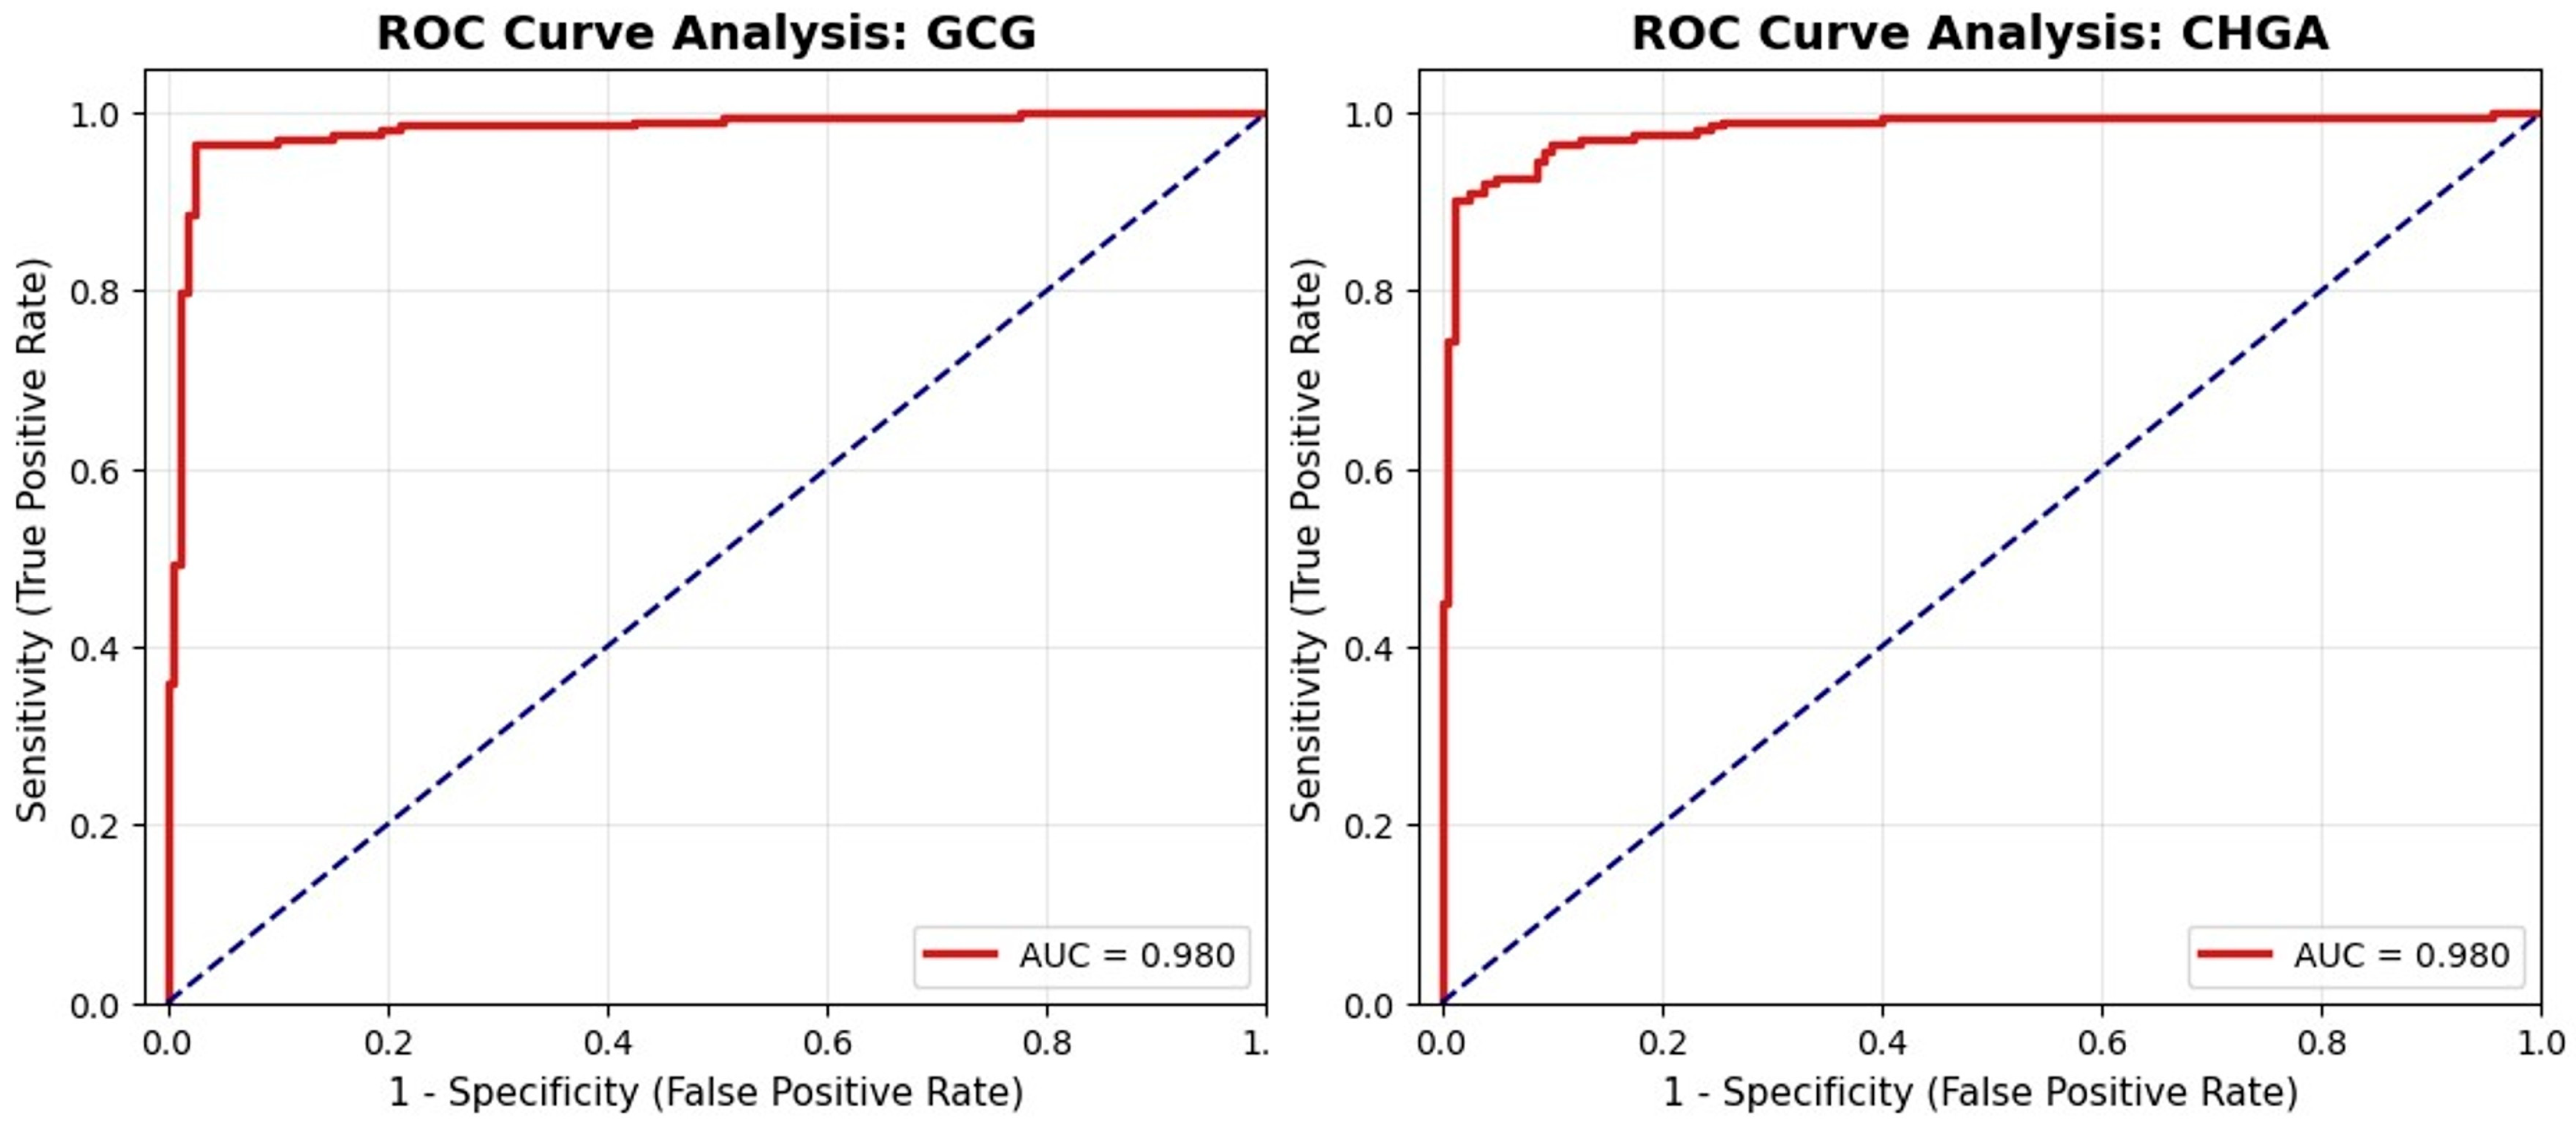
Out of all the DEGs, we noticed that only 14 genes were found to be downregulated across all datasets: ADH1B, ANO5, CHGA, CLCA4, CLDN8, CNTN3, GCG, INSL5, MAMDC2, MS4A12, NAP1L2, SCNN1B, SI, and SLC30A10. Moreover, we found that those 14 genes were also downregulated in the TCGA COAD and READ datasets as presented in Section 3.2.3. The consistent trends of these genes among the datasets strengthen their potential role in tumor-related biological processes. The boxplots in Figure 5 show the expression behavior of the top downregulated genes within the tumor samples in selected datasets. Furthermore, ROC curves were generated to support these findings as shown in Figure 6. Both genes showed high diagnostic accuracy, each achieving an AUC of 0.98; these plots reinforce the statical significance of our findings.
Figure 5.
Top downregulated genes. (Left): GCG expression in GSE87211. (Right): CHGA expression in GSE20916. The y-axis represents the log2-transformed expression values while the x-axis represents the studied classes. Black and red dots represent individual samples from the tumor and control groups, respectively, while white dots indicate outliers identified by the boxplots.
Figure 6.
Top downregulated genes in tumor class. (Left): ROC curve analysis of GCG. (Right): ROC curve analysis of CHGA. The red solid lines represent the ROC curves, while the blue dashed diagonal lines represent the performance of a random classifier, serving as a reference for comparison.
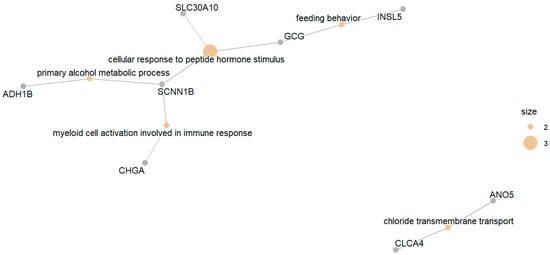
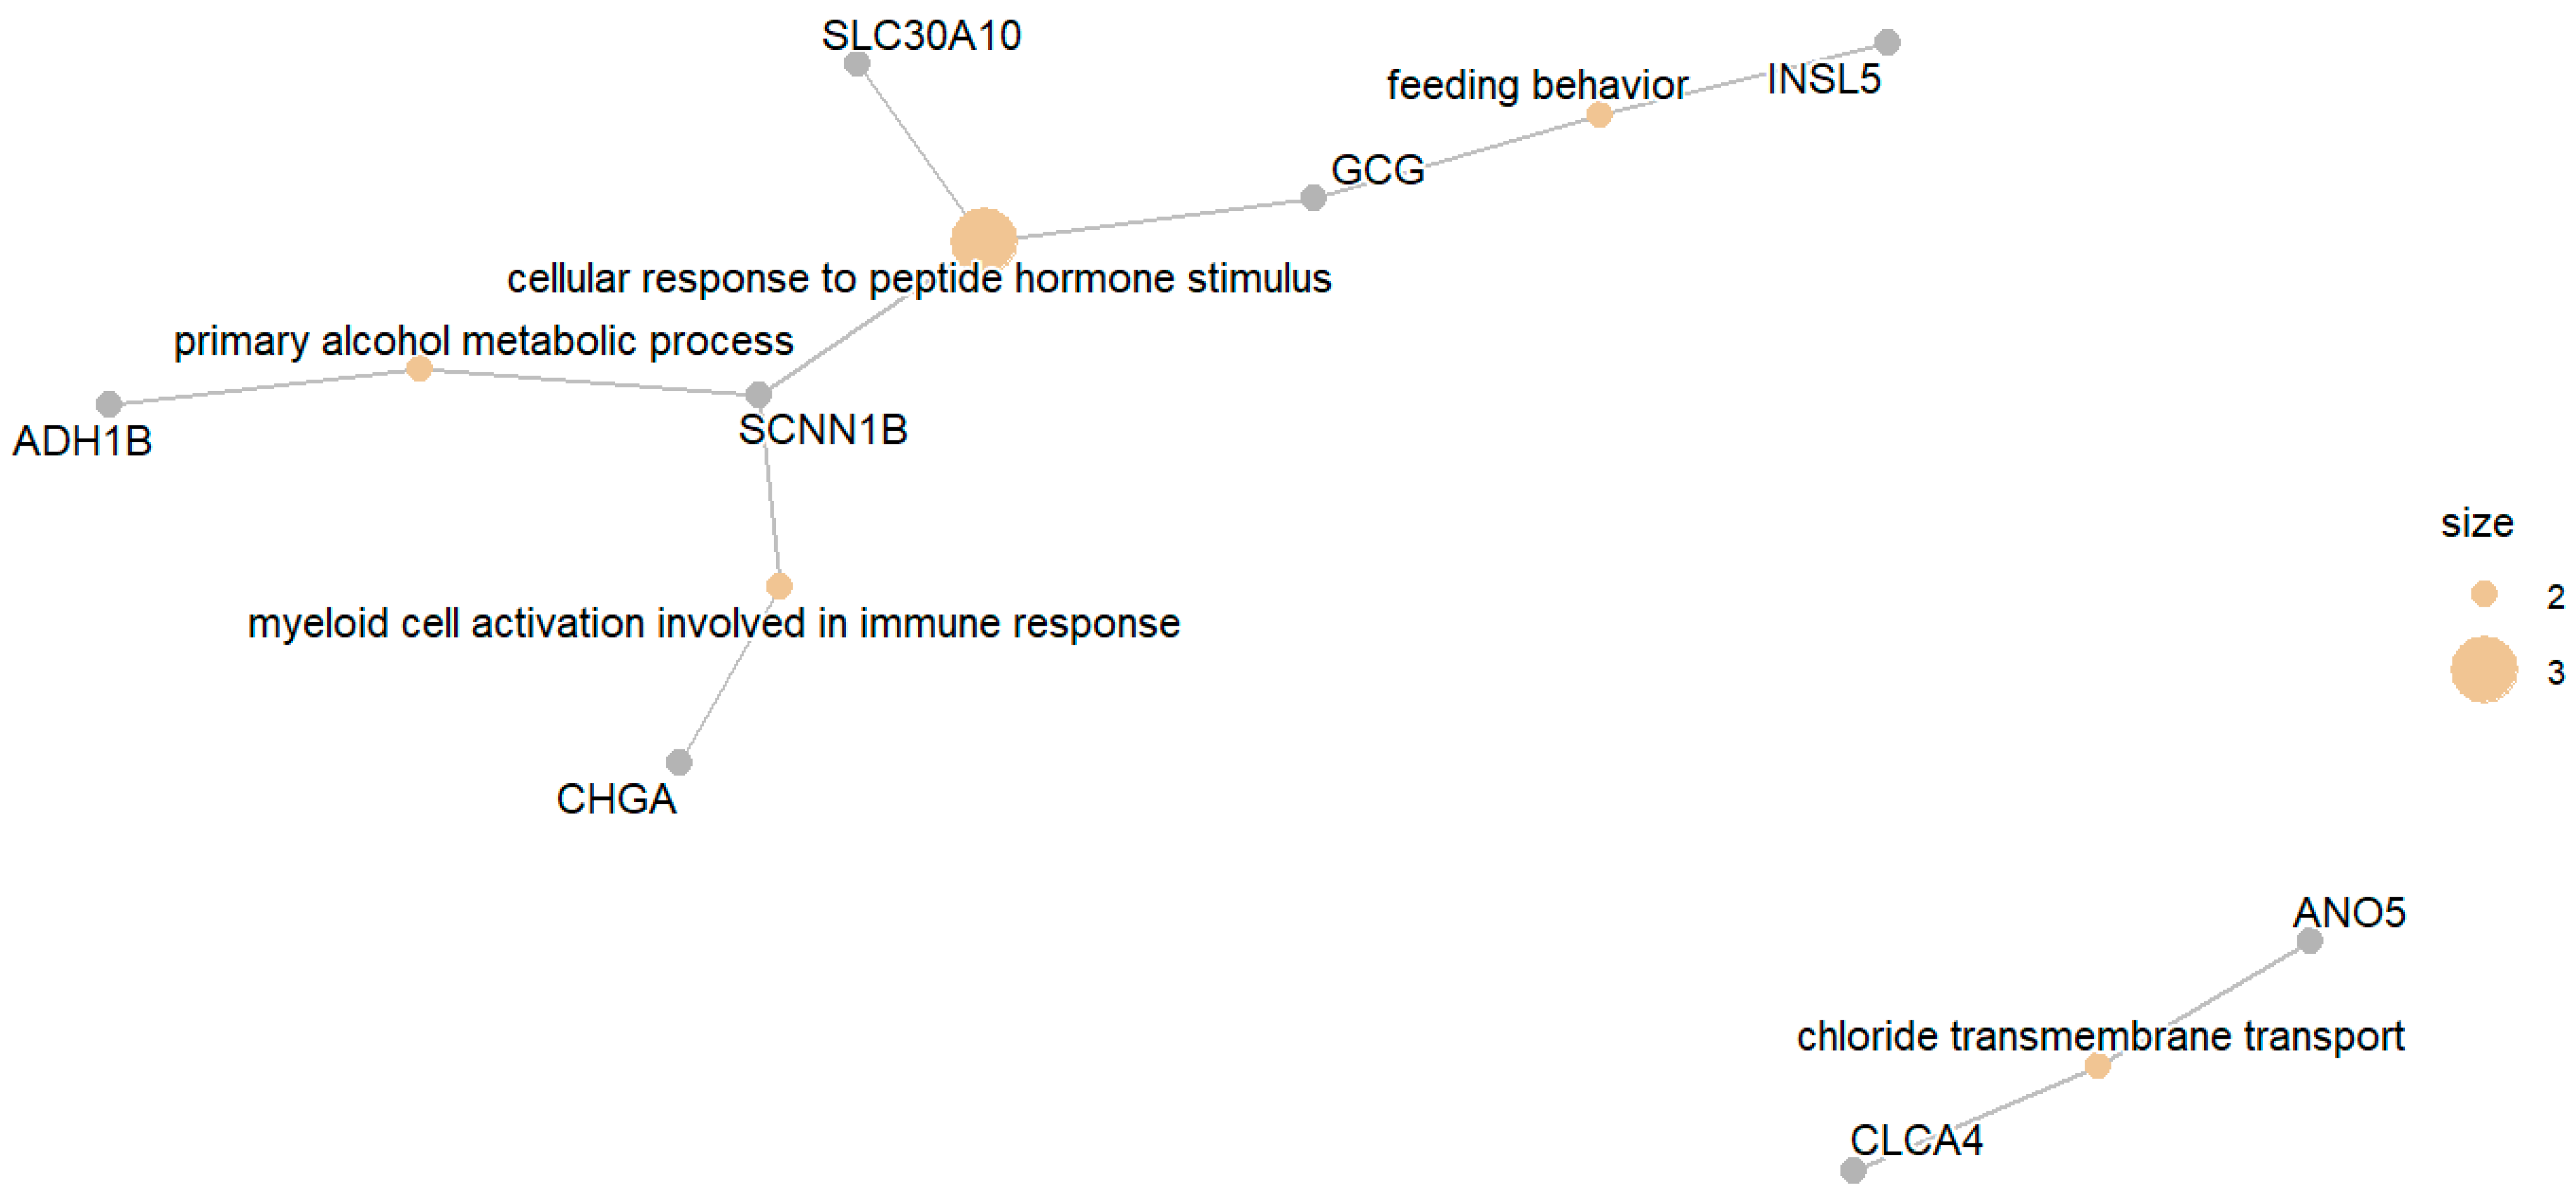
Several key perturbed biological processes were revealed after applying GO enrichment analysis, as illustrated in the network plot in Figure 7. These findings were further validated by a Protein–Protein Interaction (PPI) network which confirms the strong functional connectivity among the common downregulated genes. The analysis highlights that the cellular response to peptide hormone stimulus is the most affected process by the downregulated genes. Additional enriched processes included the primary alcohol metabolic process, myeloid cell activation involved in immune response, and chloride transmembrane transport. These results indicate that the downregulated genes are associated with hormonal signaling, metabolic regulation, and immune-related processes, in addition to epithelial ion transport.
Figure 7.
GO enrichment network of downregulated genes.
Notably, a distinct functional cluster was identified within the downregulated gene set including CLDN8, SCNN1B, CLCA4, SLC30A10, and ANO5; this subgroup of genes were found to be functionally associated with epithelial ion transport and electrolyte regulation. They are involved in sodium handling, chloride transport, and regulation of epithelial ion permeability. The reduced expression of these genes indicates that a fundamental characteristic of CRC is the breakdown of the colon’s ability to regulate electrolytes. Supplementary Figure S1 presents the detailed enriched GO terms highlighting processes affected by ion transport.
The analysis of the downregulated gene pathways revealed that the genes CLDN8, GCG, ADH1B, SCNN1B, and ANO5 are involved in multiple vital pathways such as glycolysis, gluconeogenesis, alcoholic liver disease, and fatty acid degradation. Moreover, they are involved in endocrine regulation and signaling pathways, such as glucagon signaling, hormone signaling, aldosterone-regulated sodium reabsorption, and others related to epithelial barrier function, such as tight junction and cornified envelope formation. Finally, genes such as CLDN8 are linked to drug metabolism and infection, whereas GCG plays a role in gastrointestinal cancers.
3.2.2. Upregulated DEGs
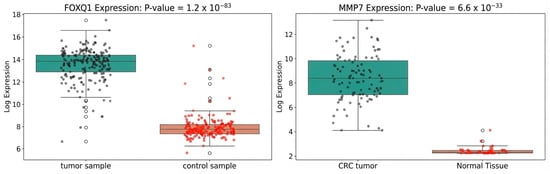
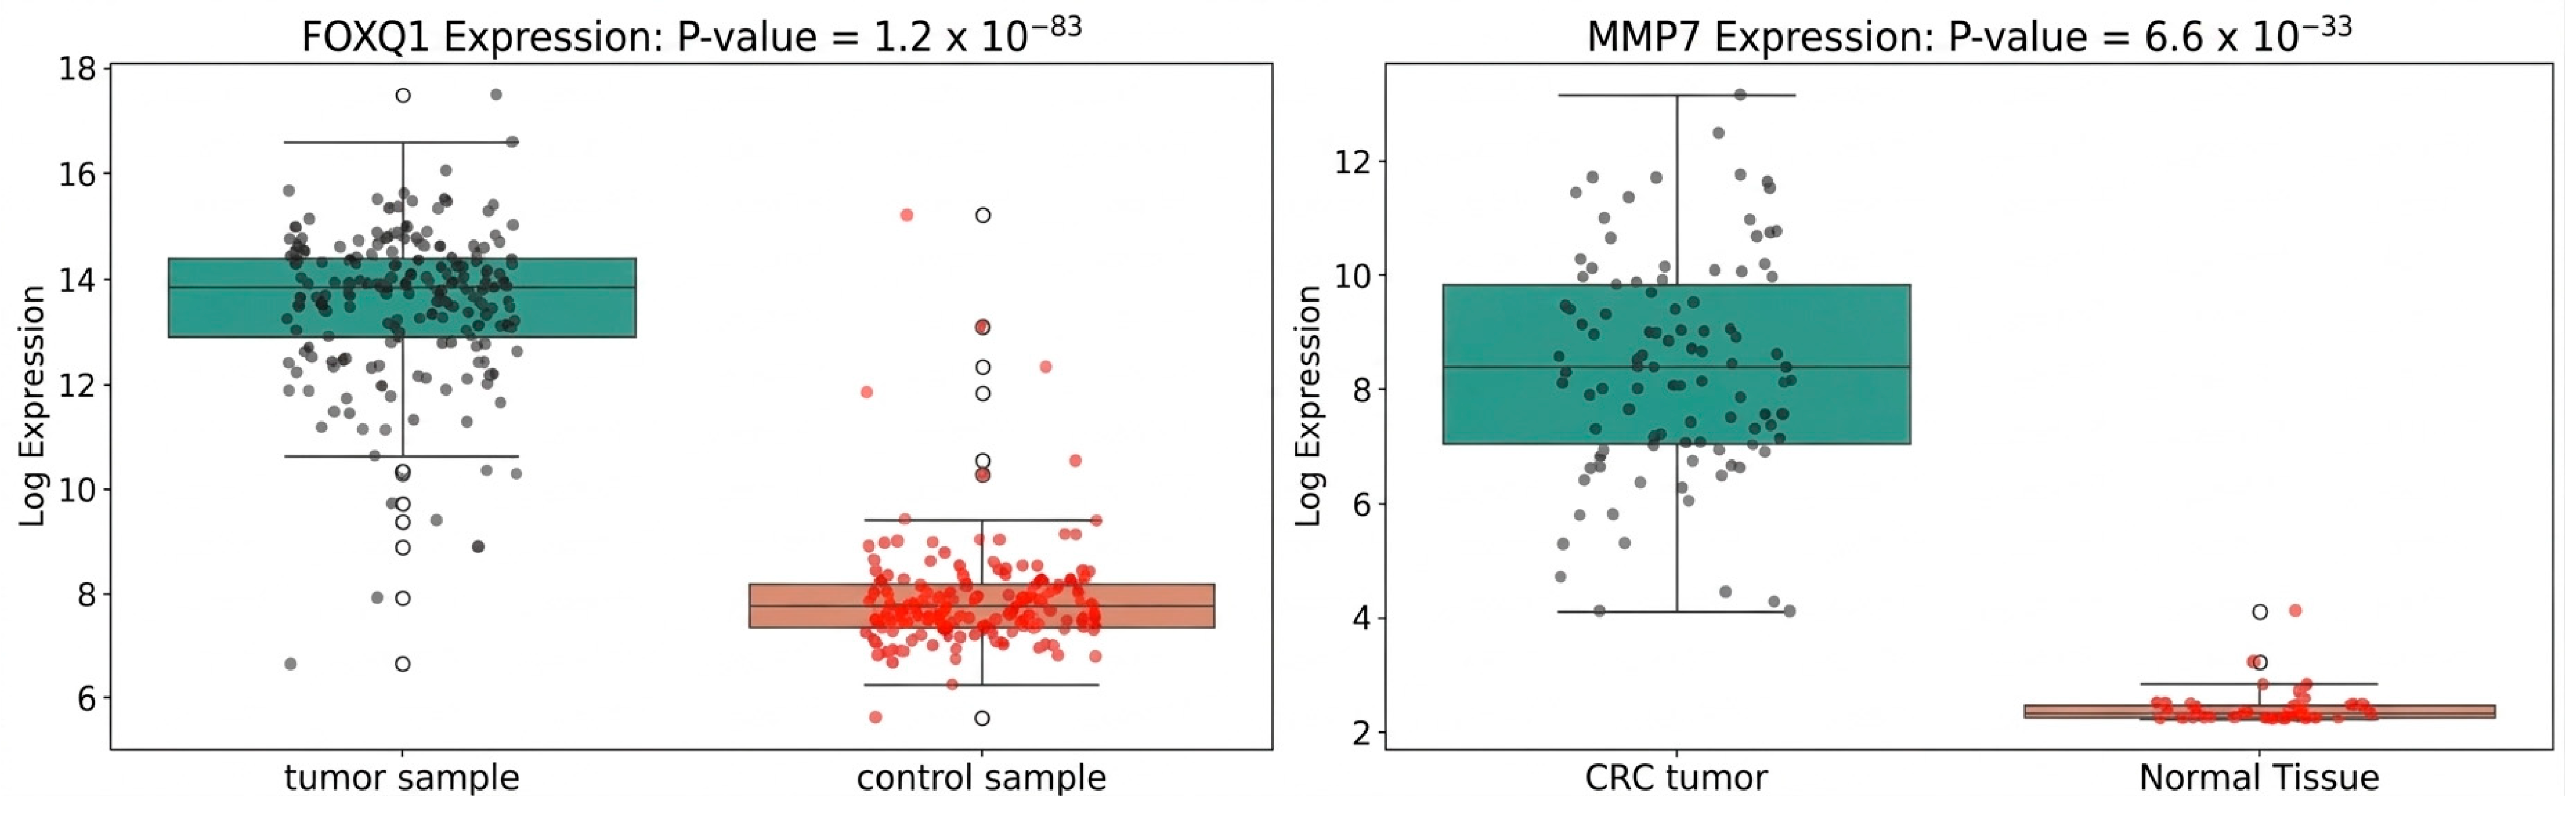
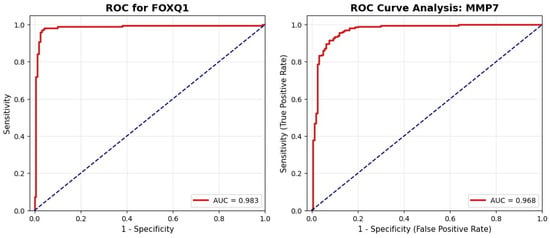
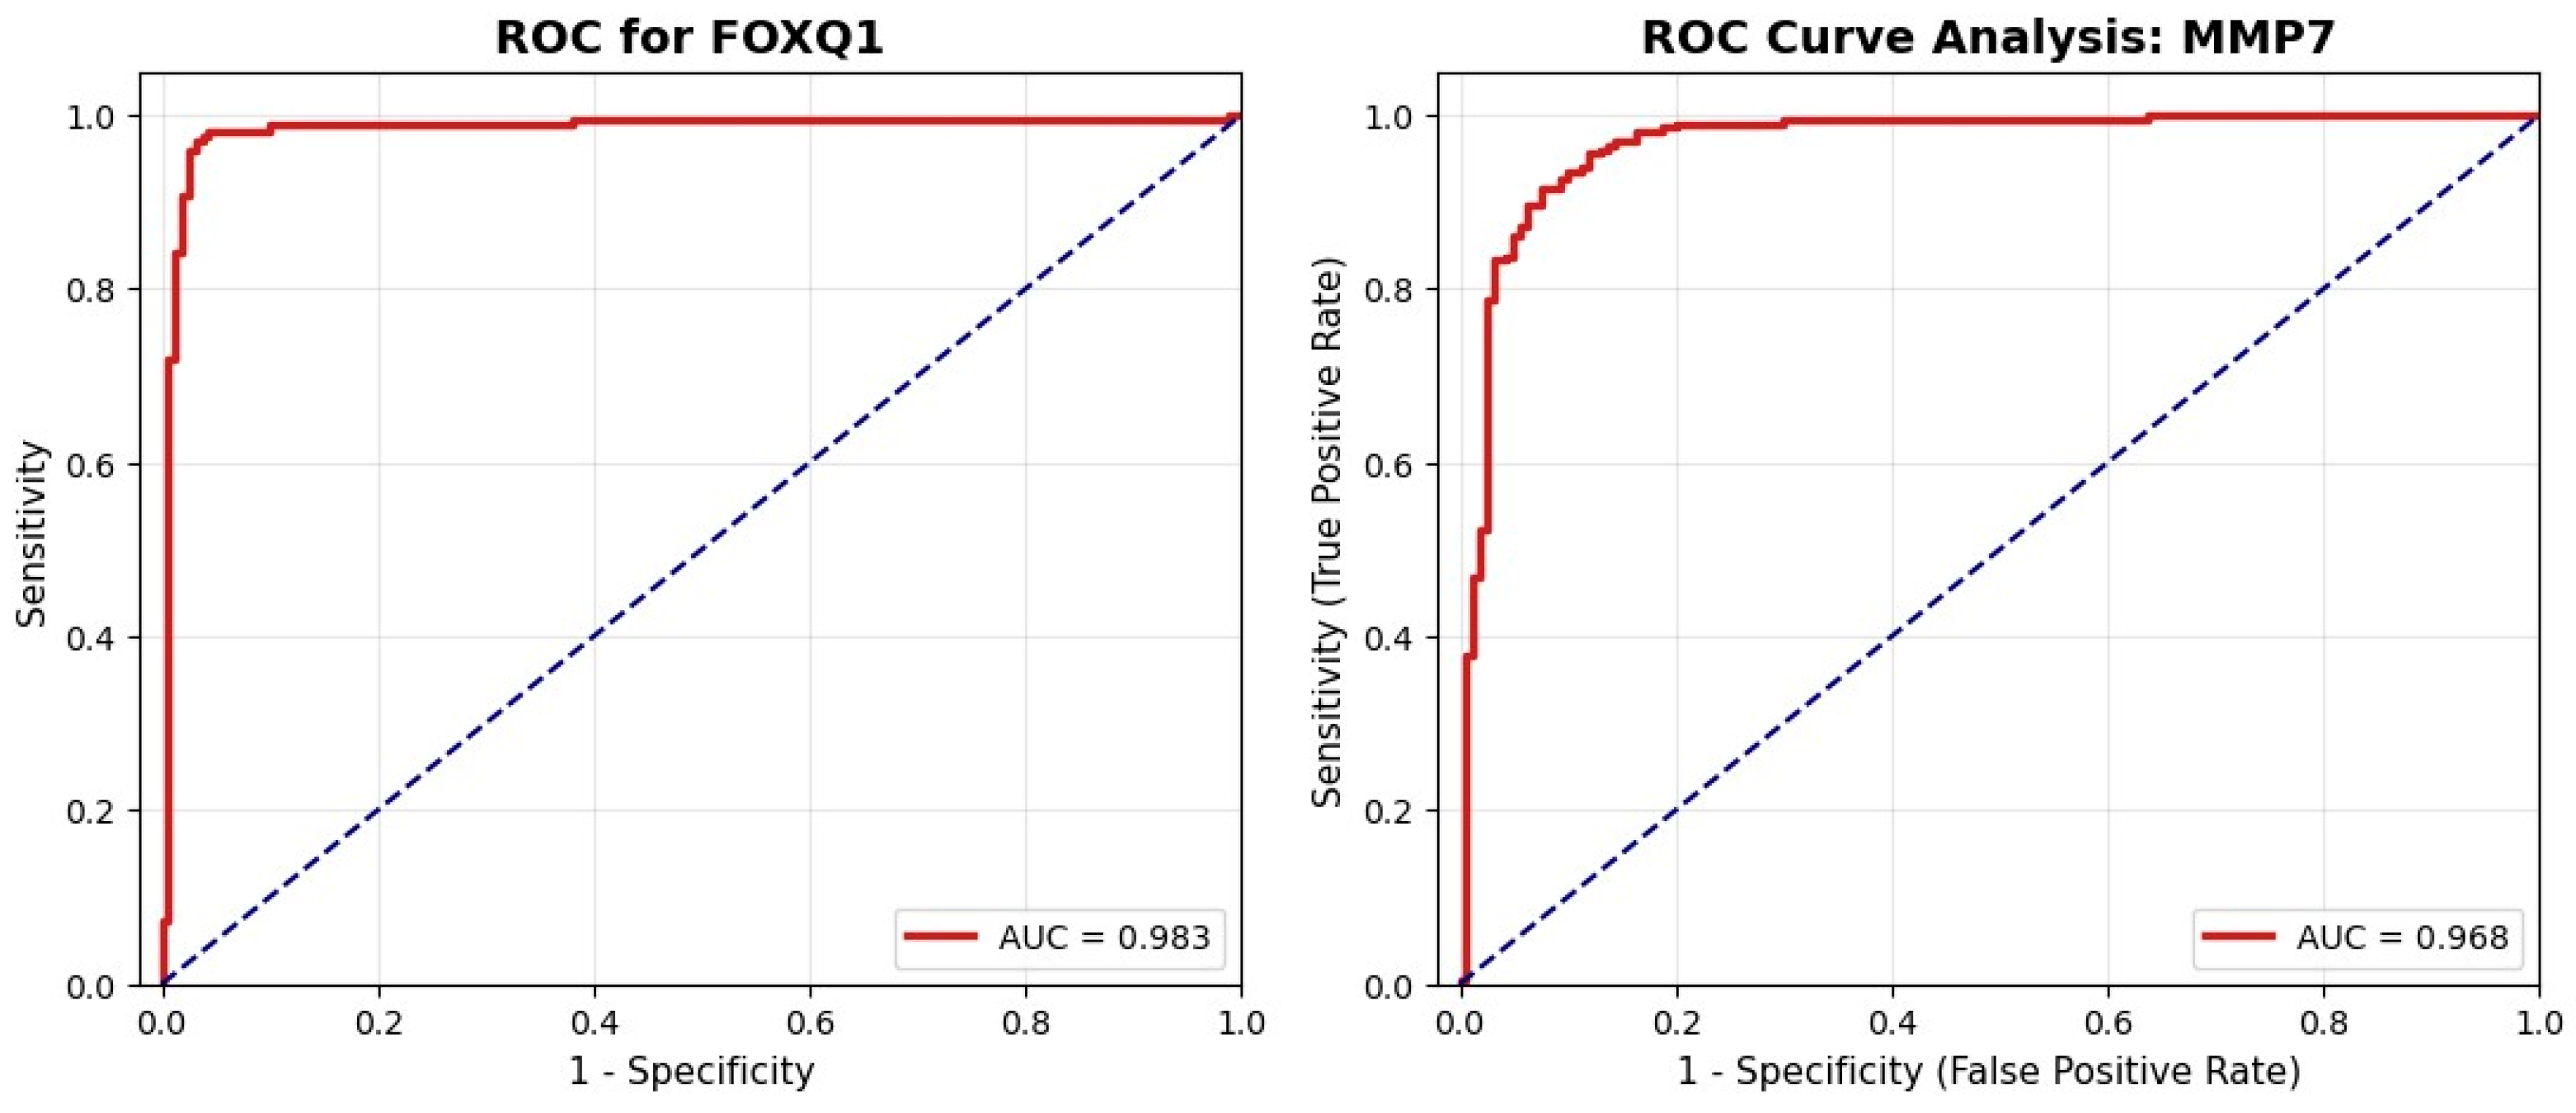
Our analysis reported eight common upregulated DEGs across all datasets: ACSL6, COL11A1, CXCL11, EPHX4, FOXQ1, KRT23, MMP3, and MMP7. Moreover, our TCGA validation analysis reported that the eight genes were also upregulated in the TCGA COAD and READ datasets as presented in Section 3.2.3. These genes showed consistently increased expression in tumor samples compared to that in normal samples, indicating an important potential role in CRC development. To further illustrate these patterns, the boxplots in Figure 8 visualize the elevated expression of the top genes in the tumor class. Additionally, the ROC curves presented in Figure 9 reinforce the statical significance of our findings since the AUC = 0.983 in FOXQ1 and 0.968 in MMP7.
Figure 8.
Top upregulated genes. (Left): FOXQ1 expression in GSE87211. (Right): MMP7 expression in GSE20916. The y-axis represents the log2-transformed expression values, and the x-axis presents the studied classes. Black and red dots represent individual samples from the tumor and control groups, respectively, while white dots indicate outliers identified by the boxplots.
Figure 9.
Top upregulated genes in tumor class. (Left): ROC curve analysis of FOXQ1. (Right): ROC curve analysis of MMP7. The red solid lines represent the ROC curves, while the blue dashed diagonal lines represent the performance of a random classifier, serving as a reference for comparison.
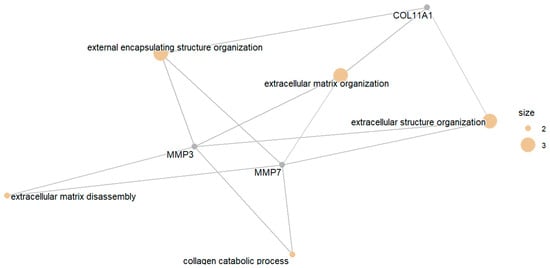
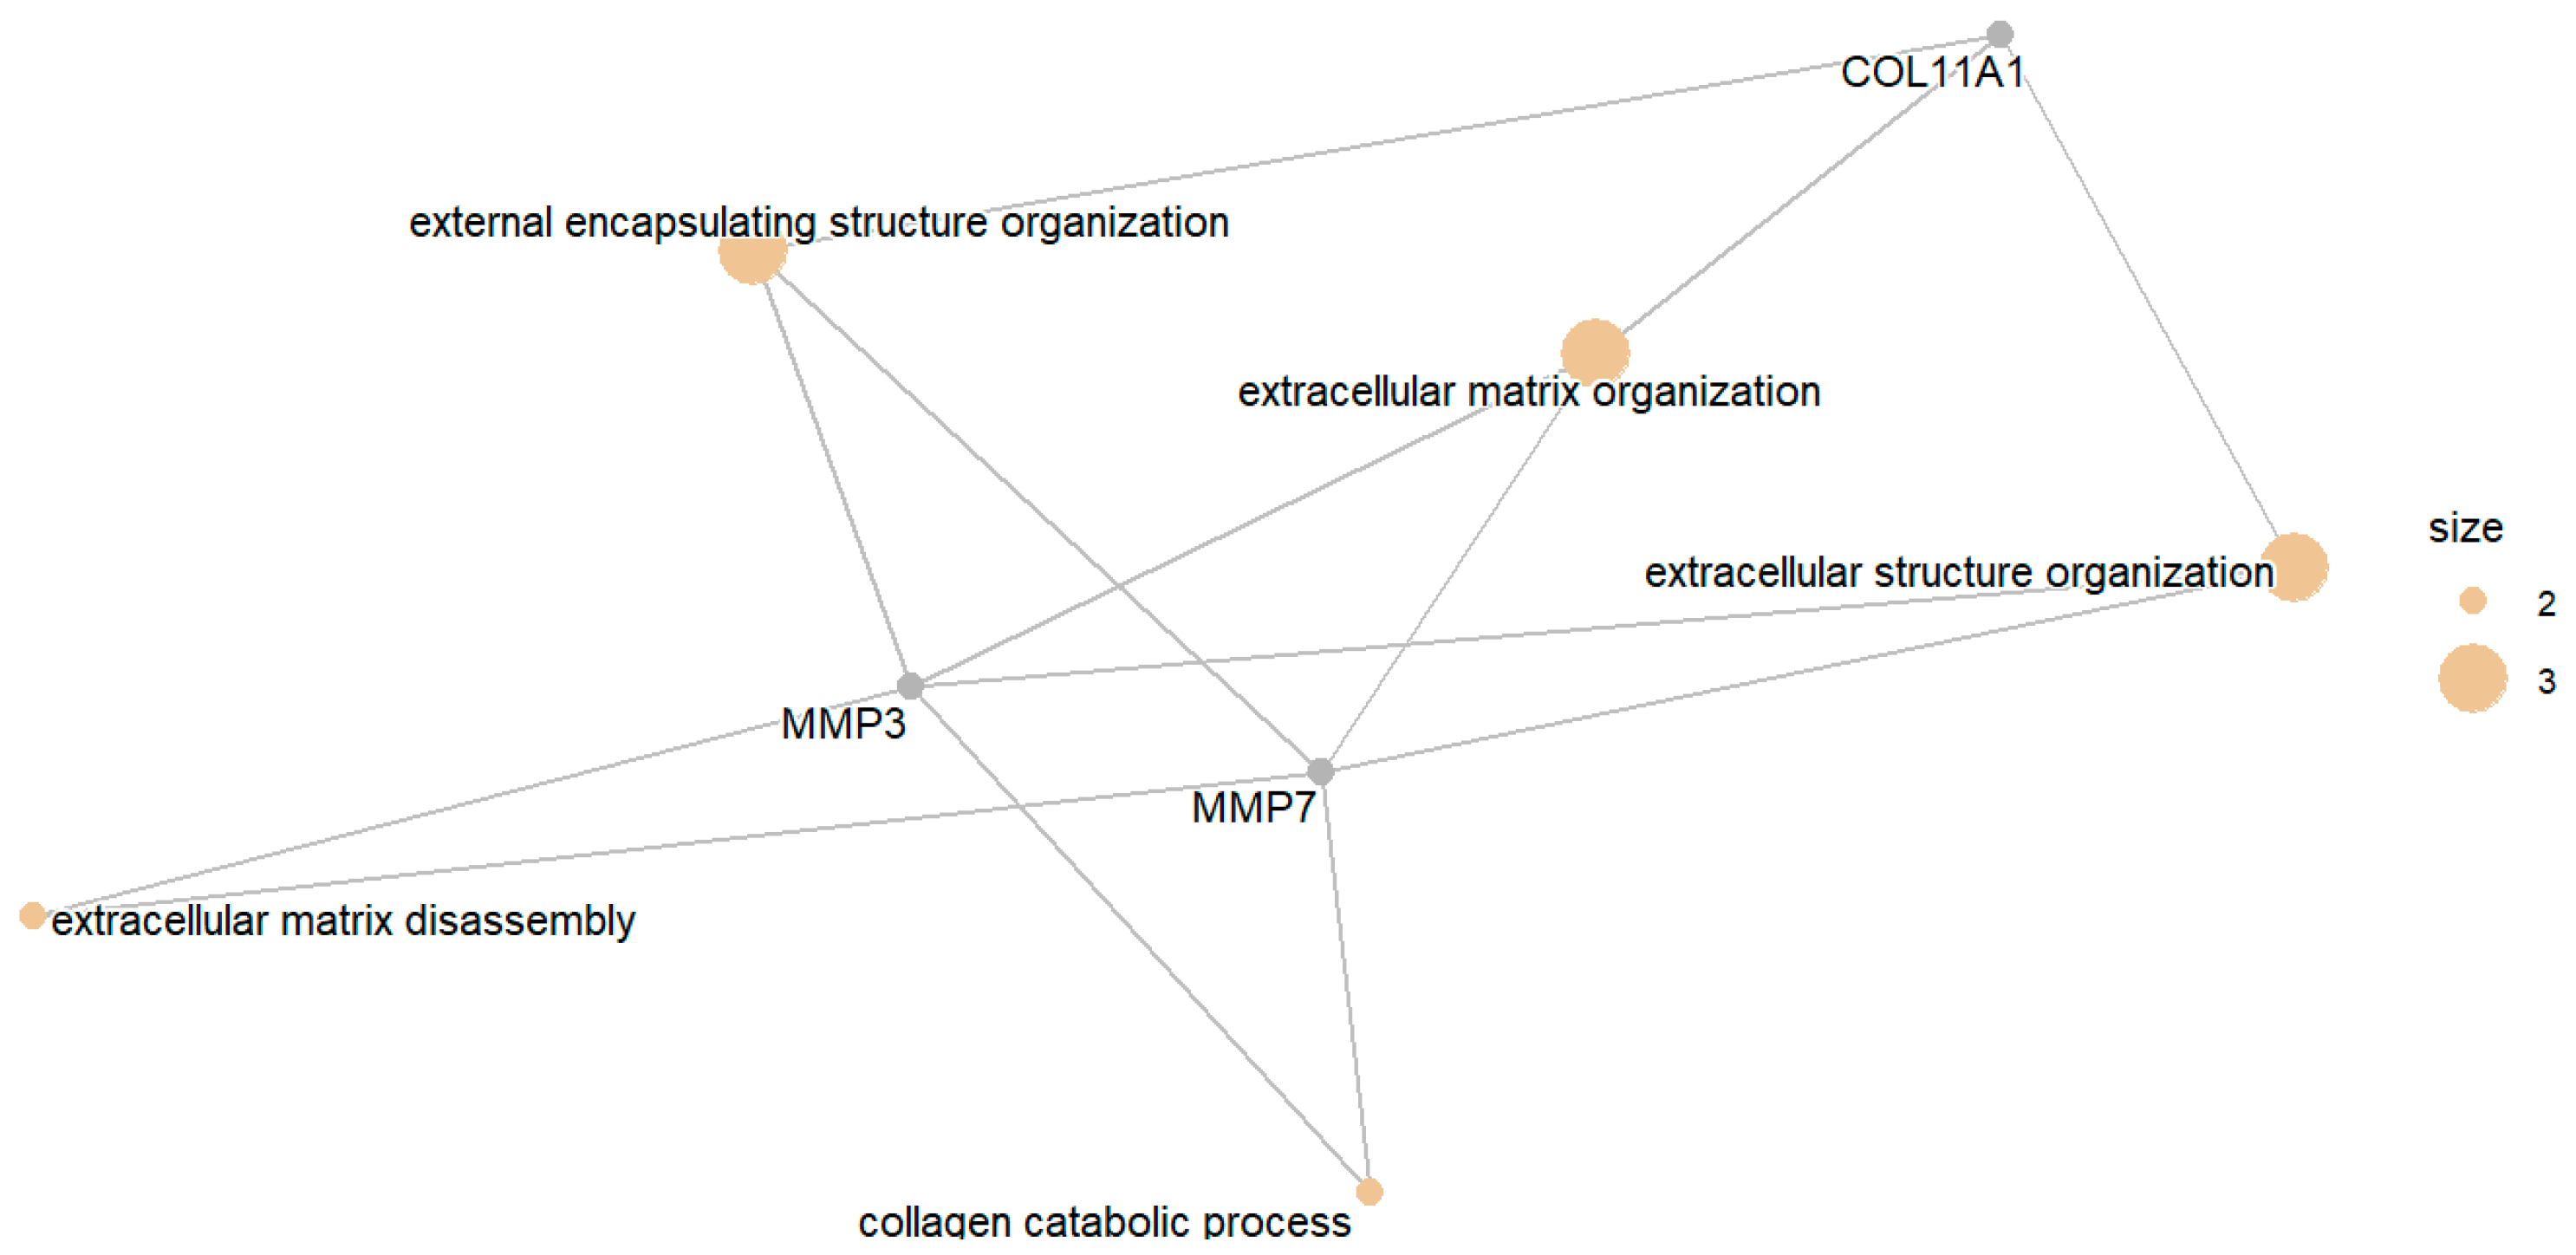
The GO enrichment analysis of the upregulated DEGs revealed that the most significantly enriched biological processes were primarily linked to the extracellular matrix structure and organization as presented in Figure 10. These findings were further validated by a PPI network as provided in Supplementary Figure S3. The most significant terms included external encapsulating structure organization, extracellular matrix organization, and extracellular structure organization. Notably, there are key genes creating this network, COL11A1, MMP3, and MMP7, suggesting that these genes have increased extracellular matrix activity in tumor tissues. Moreover, these results indicate that upregulated genes are strongly associated with extracellular matrix (ECM) remodeling, which is crucial for CRC progression or metastasis.
Figure 10.
Top enriched biological processes based on upregulation pattern.
The upregulated DEGs are involved in a broad spectrum of perturbed pathways. For instance, genes MMP3 and CXCL11 were found to participate in pathways related to inflammation (e.g., rheumatoid arthritis, IL-17 signaling pathway, cytokine–cytokine receptor interaction, and chemokine signaling pathway) and cancer pathways (e.g., transcriptional misregulation in cancer, bladder cancer, prostate cancer, and pathways in cancer). Other genes, such as MMP7 and KRT23, are associated with the Wnt signaling pathway, estrogen signaling, and infection responses. Additionally, genes like EPHX4 were linked to chemical carcinogenesis, while COL11A1 was connected to both cytoskeleton in muscle cells and protein digestion and absorption. Finally, ACSL6 was exclusively mapped to the metabolic pathways in these datasets. The extensive involvement of these genes highlights their potential roles in processes that are central to CRC development.
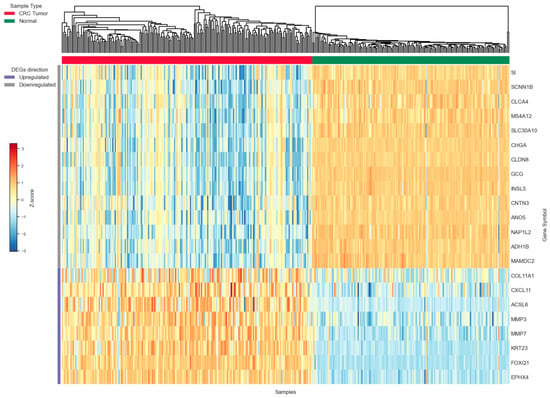
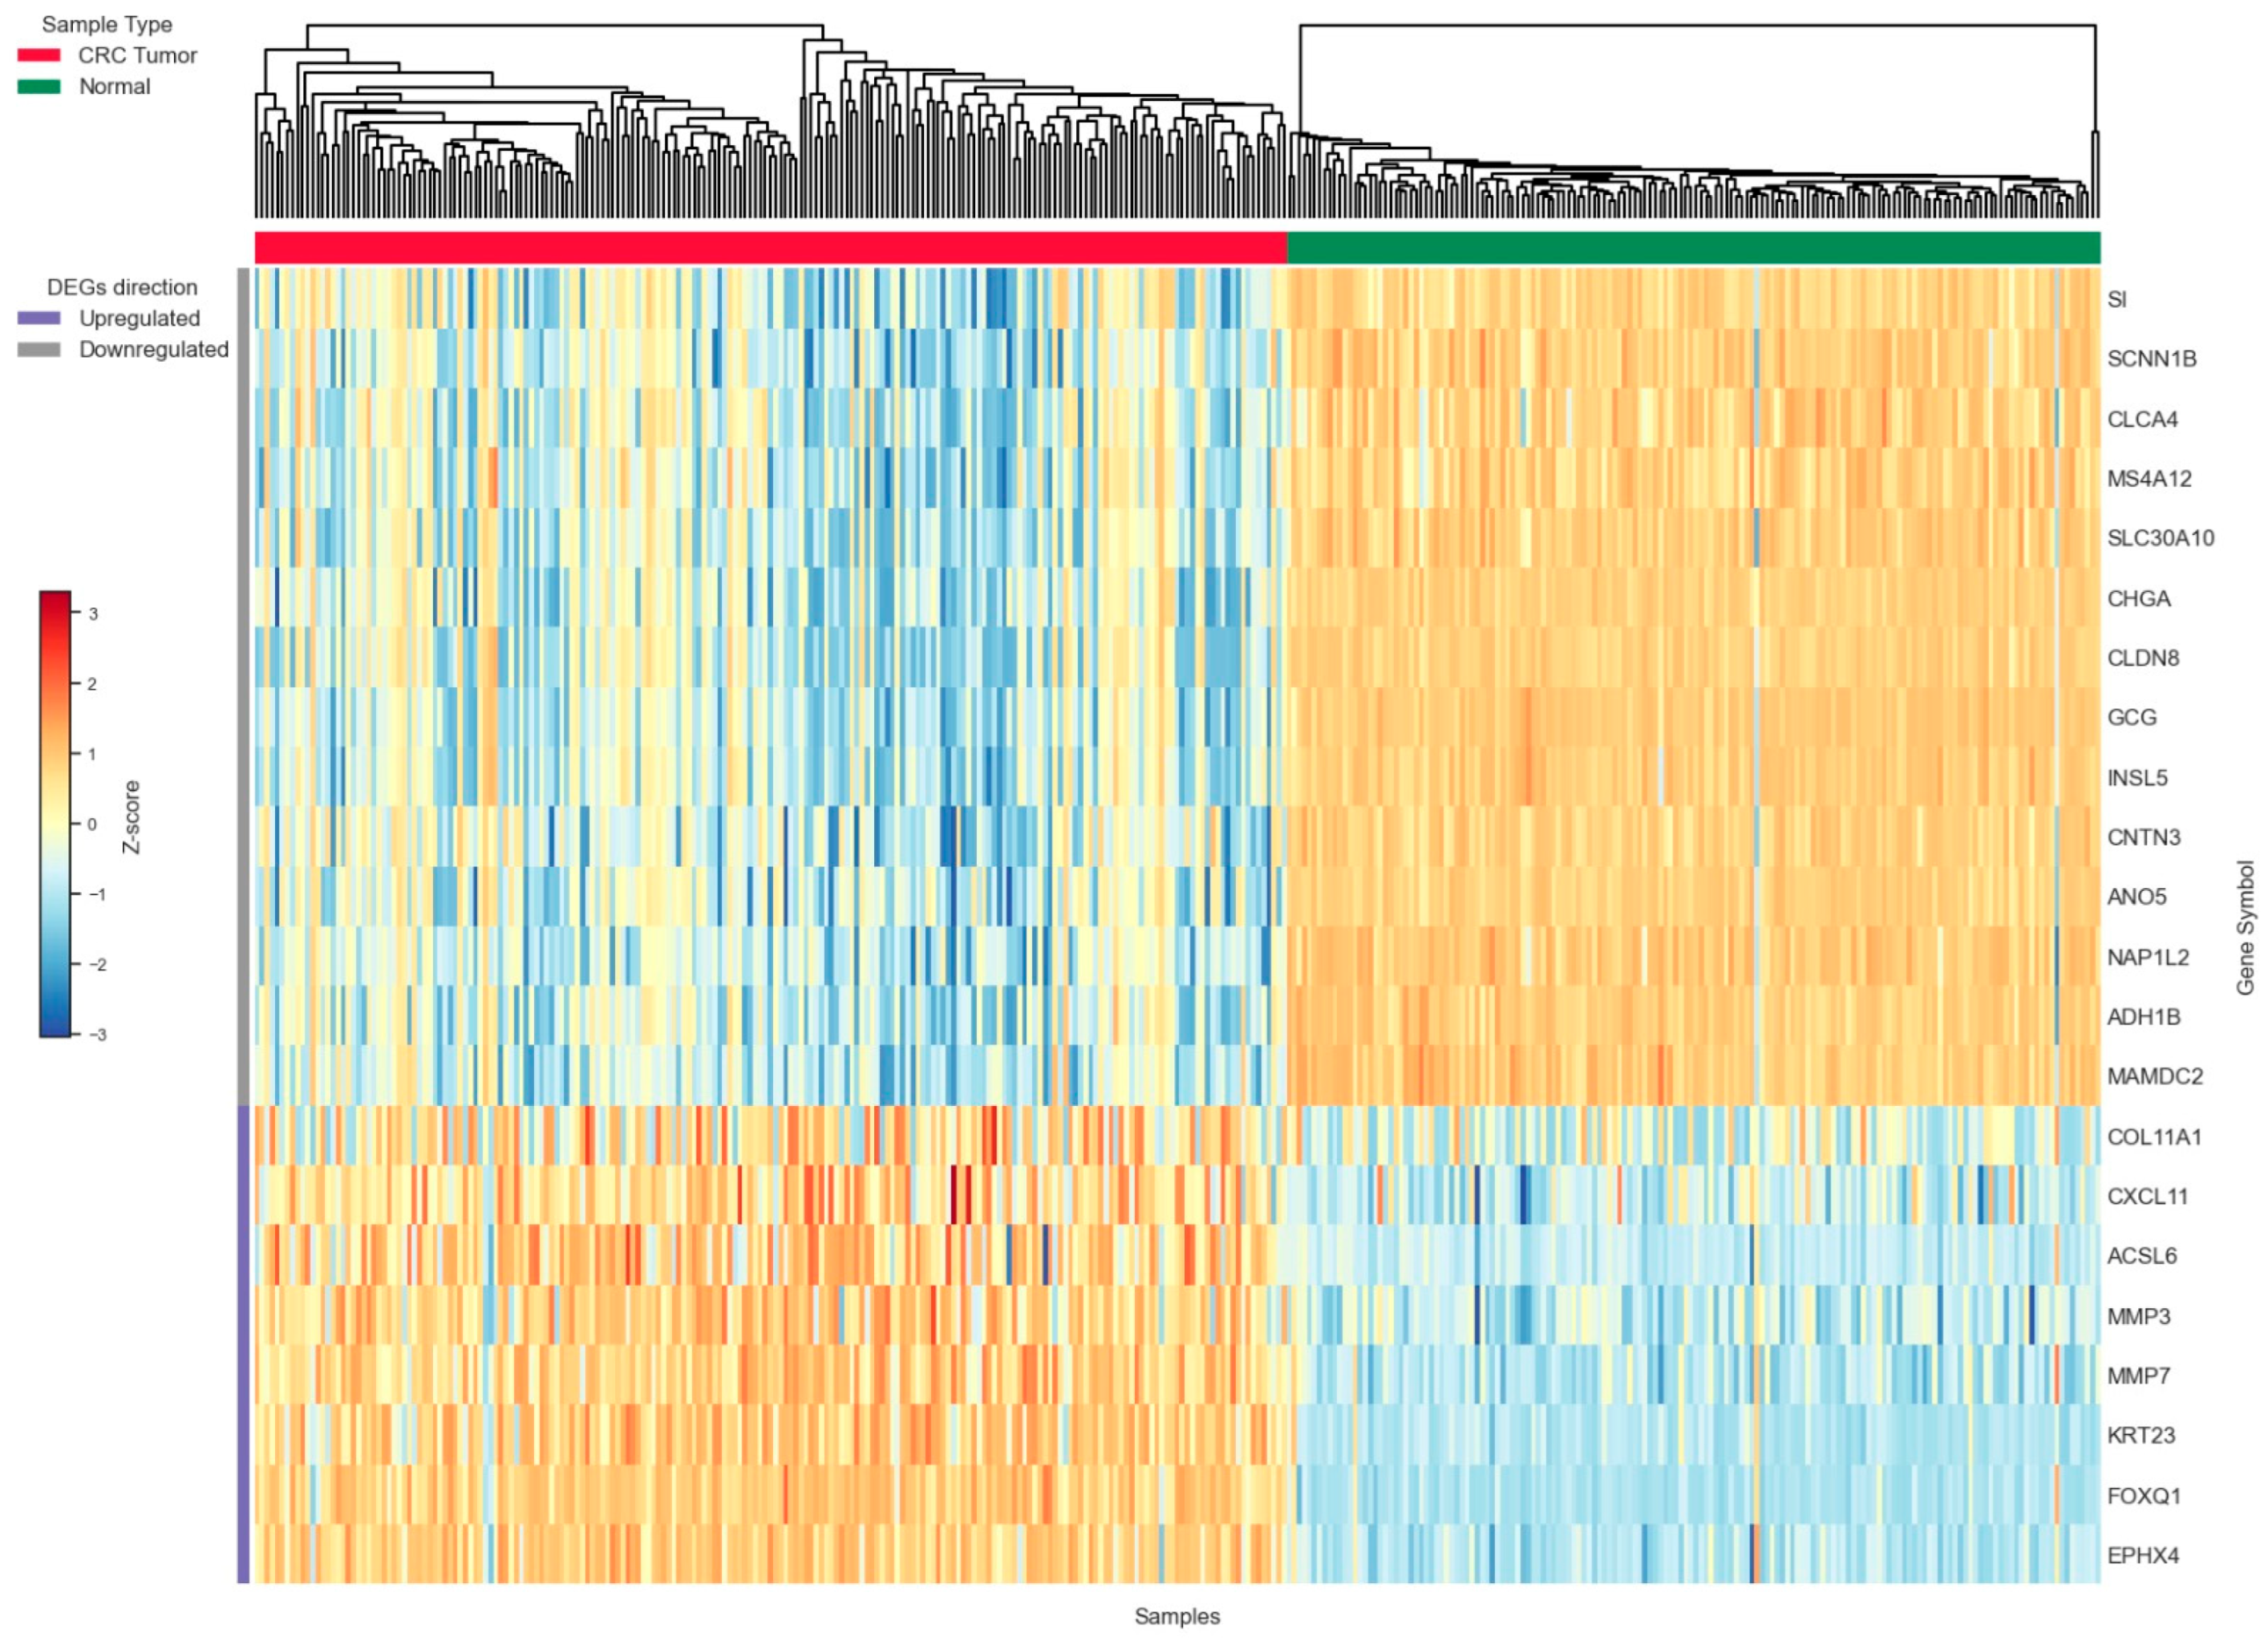
In summary, to visualize the consistent expression patterns among the 22 identified DEGs, we generated a heatmap using the GSE87211 dataset shown in Figure 11. The heatmap clearly distinguishes between CRC tumor and normal samples based on the direction of gene expression. Specifically, the top 14 downregulated genes showed lower expression in tumor samples (mostly blue and white colors) compared to normal samples (mostly orange color). The eight upregulated genes in the lower part of the heatmap showed higher expression in tumor samples compared to the normal samples. This distinct expression profile confirms that the identified DEGs are highly robust, with each gene maintaining its predicted direction across the entire sample set.
Figure 11.
Heatmap of core differentially expressed genes in CRC. Read color denotes CRC samples and green color denotes normal samples.
3.2.3. TCGA Gene Expression and Survival Analysis
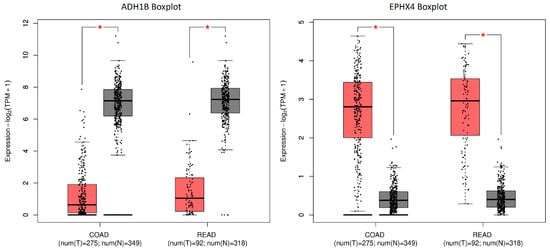
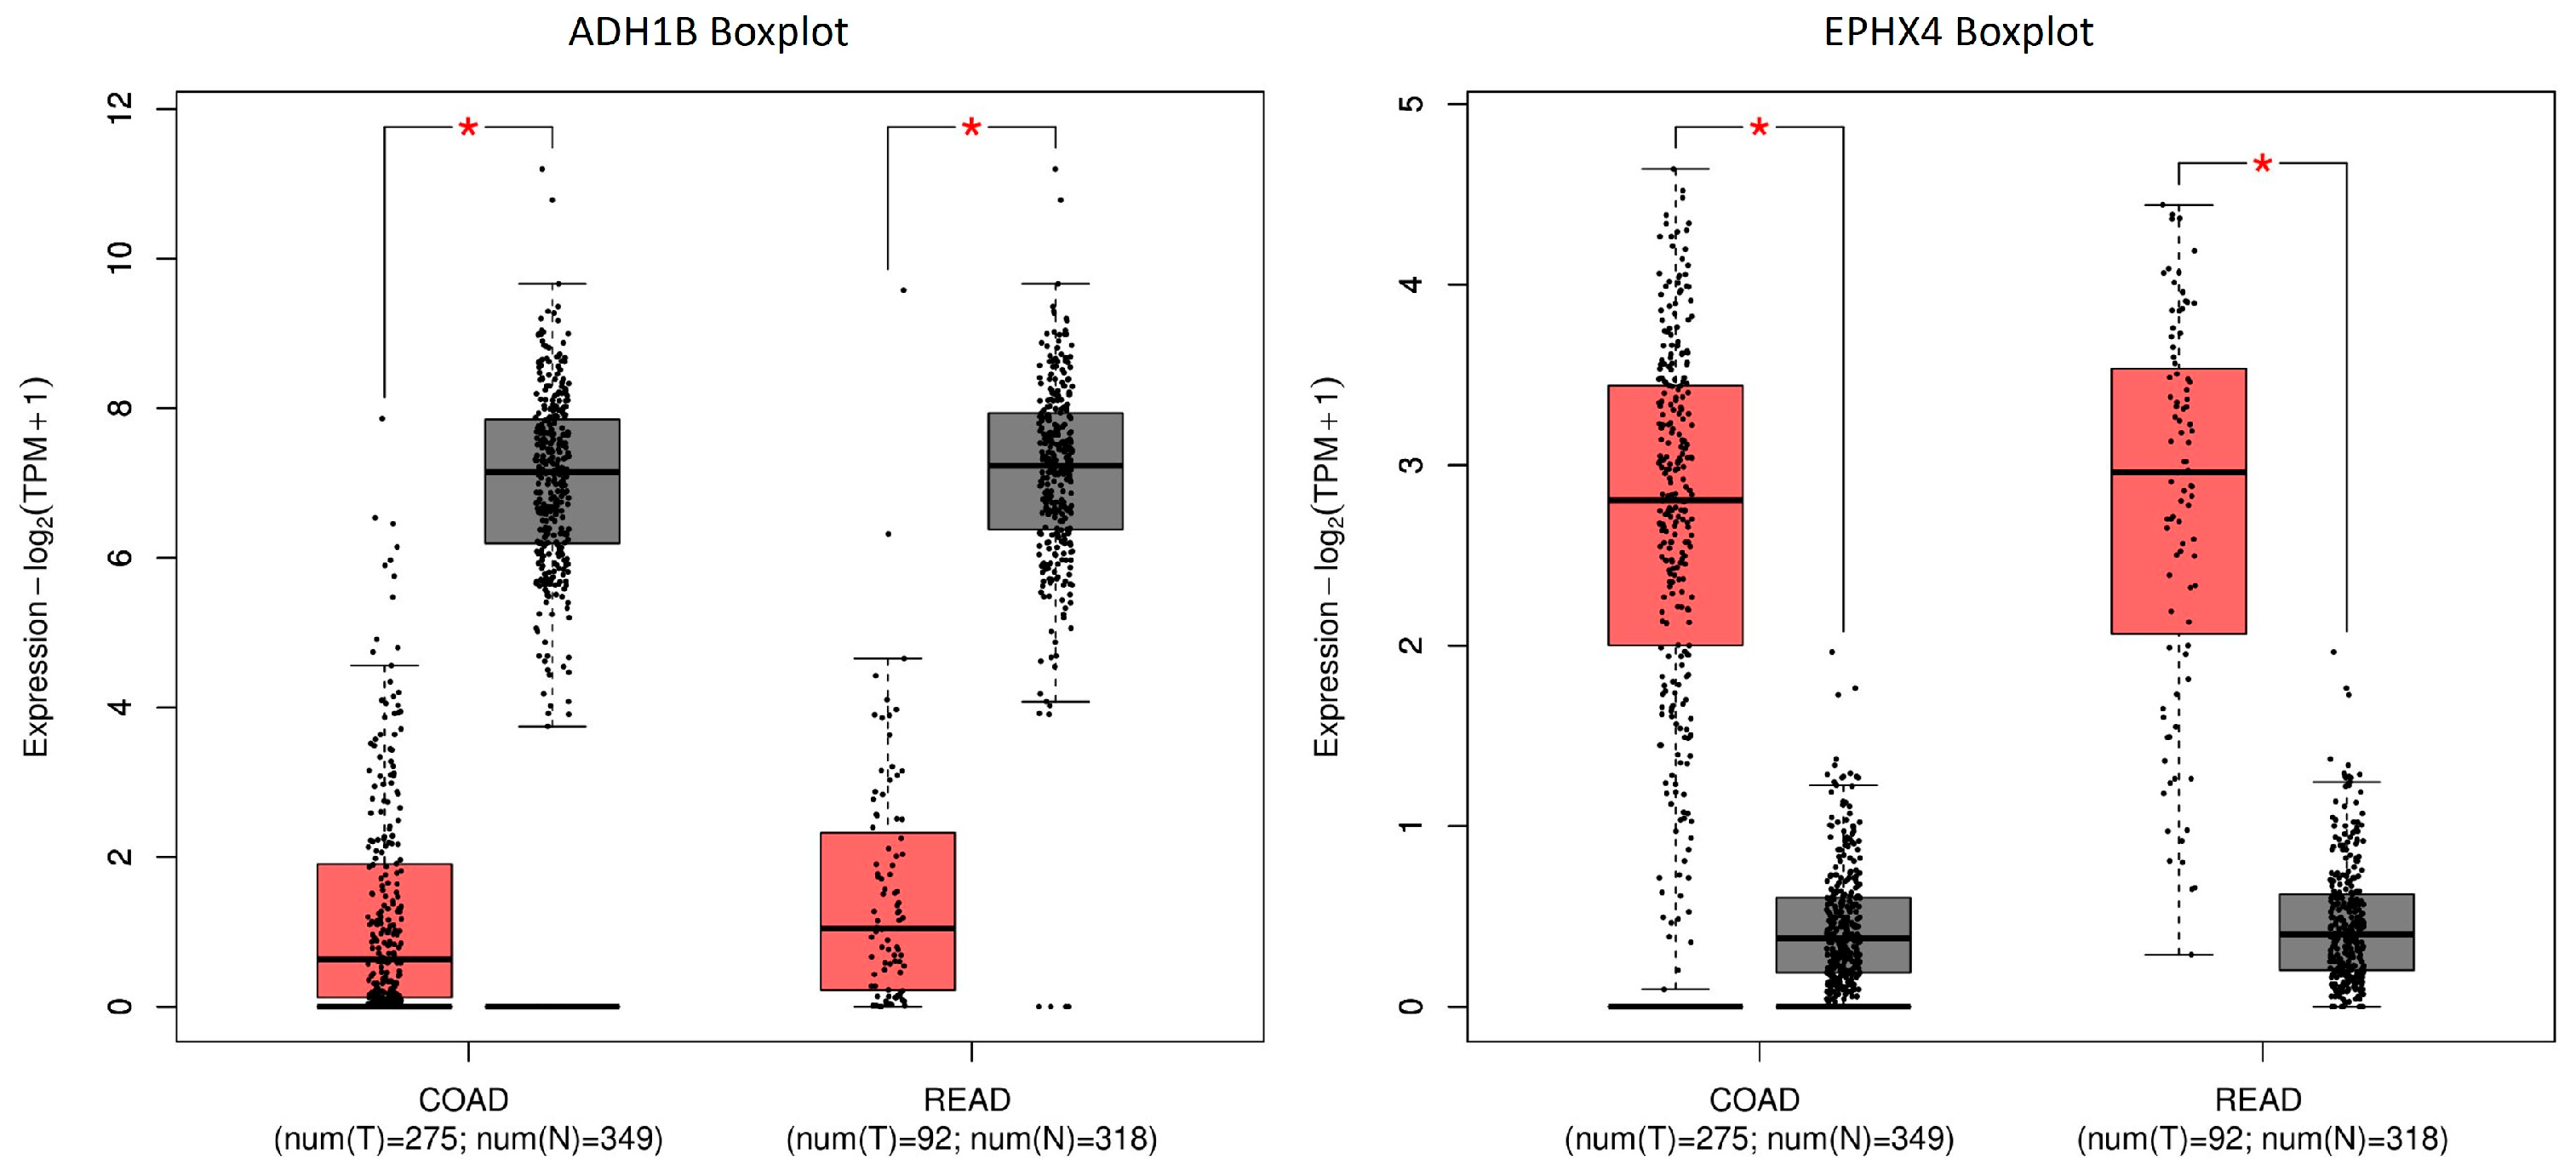
To further validate the expression pattern of the common DEGs, TCGA-COAD and TCGA-READ datasets were intensively analyzed. Our analysis confirmed that the 22 common DEGs had the same expression behavior in TCGA datasets where upregulated genes were upregulated in TCGA datasets and downregulated genes were downregulated in TCGA datasets. Figure 12 presents ADH1B gene (left) as a sample of one downregulated gene and EPHX4 (right) as an upregulated gene sample; the red boxes represent tumor samples, while gray boxes represent matching normal tissue. Black dots represent individual samples, red asterisks (*) indicate statistically significant differences between tumor and normal tissues, and sample sizes for each dataset are shown below the x-axis labels.
Figure 12.
Validation of gene expression patterns using TCGA and GTEx datasets via GEPIA2.
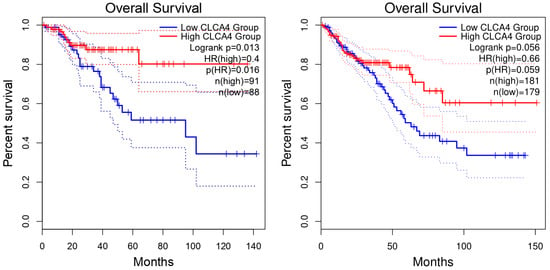
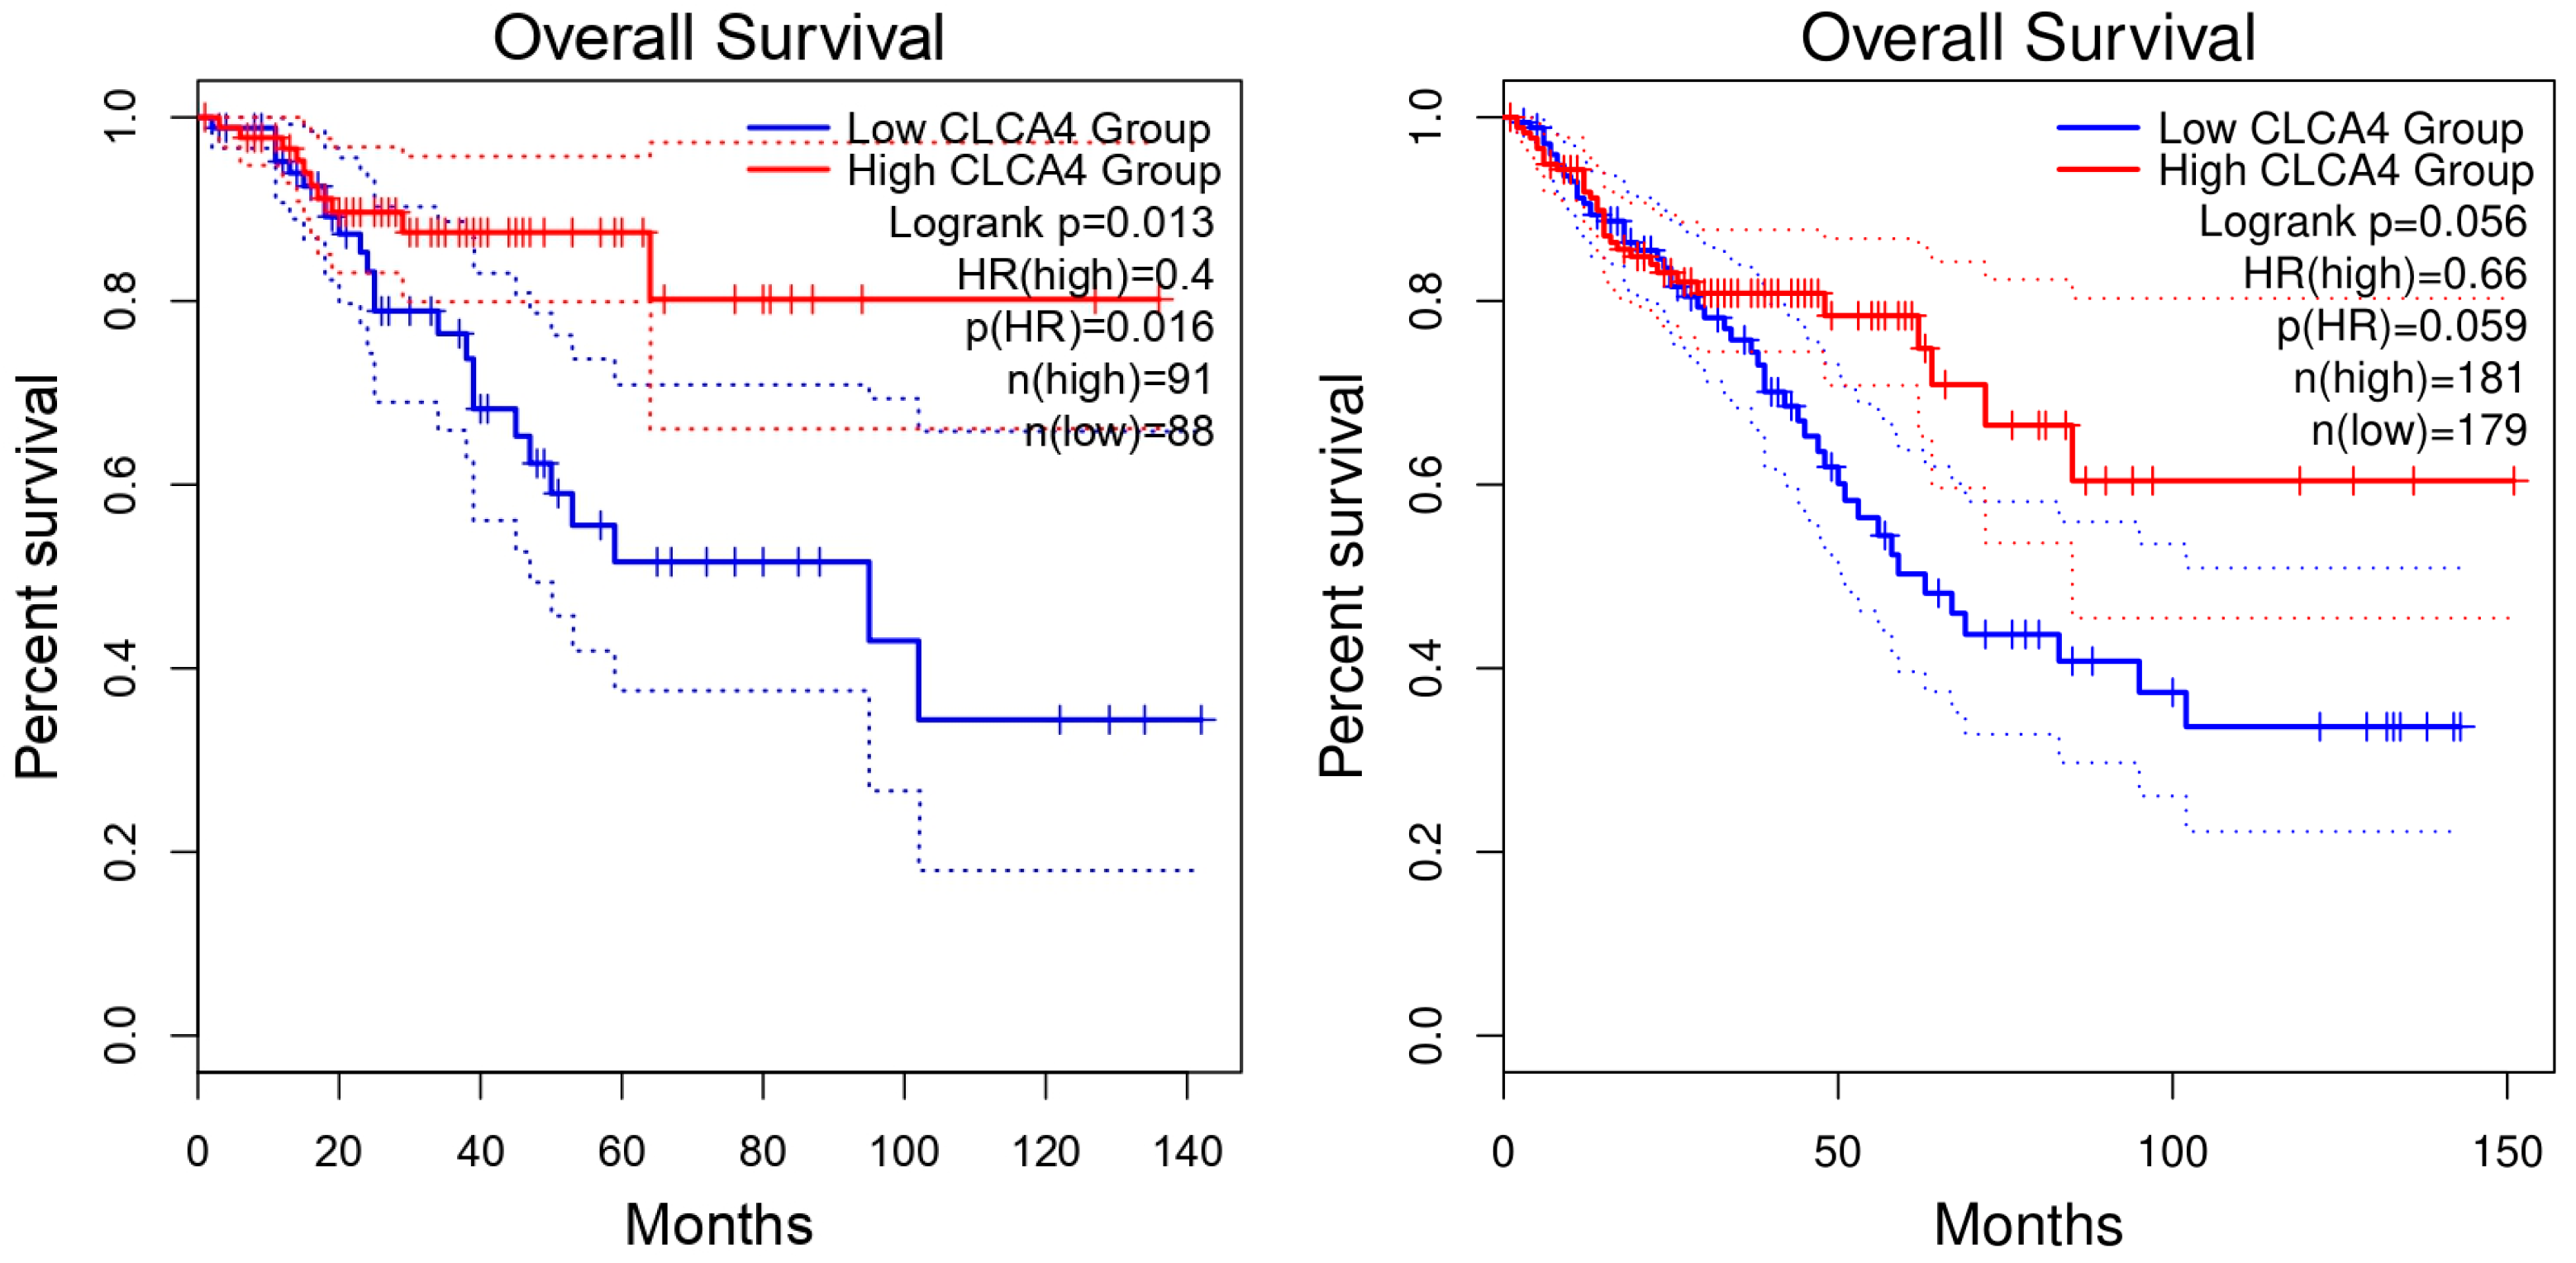
Next, we examined the relationship between the expression of the 22 candidate genes and overall survival using GEPIA2. Lower expressions of GCG, CLCA4, and MS4A12 were associated with poorer survival when p < 0.05 (p = 0.0063, 0.013, and 0.048, respectively). The remaining 19 genes did not meet this threshold even if the figures presented clear distinction. For instance, Figure 13 presents representative genes from both categories considering the defined p-value threshold. A lower expression of CLCA4 was significantly associated with a poorer overall survival (Log-rank p = 0.013), while a higher expression of COL11A1 showed a trend toward reduced survival probability (Log-rank p = 0.078) but the difference was statistically marginal. In summary, these findings suggest possible survival associations for selected genes and the remaining plots are provided in the Supplementary Materials.
Figure 13.
Kaplan–Meier survival analysis of candidate DEGs in CRC.
4. Discussion
In this study, we analyzed four datasets composed of normal and tumor tissues to identify potential biomarker genes that are linked to CRC progression. Our analysis revealed 2150 common DEGs among all datasets. Next, we labeled the commonly upregulated and downregulated genes by considering all datasets to strengthen the foundation of our findings, resulting in eight upregulated genes and 14 downregulated genes common across all datasets. The 22 common up/downregulated DEGs were initially validated by external datasets from TCGA. In this section, we discuss our findings, along with intensive literature validations that support the outcomes.
4.1. Common Differentially Expressed Genes
In this work, we applied an intensive GO enrichment analysis considering common DEGs. The higher fold enrichment values indicate stronger pathway involvement [40] as shown in Figure 3, where the reported enriched processes included multiple ribosomal and chromosomal activities such as ribonucleoprotein complex biogenesis, rRNA processing, chromosome segregation, and sister chromatid segregation. Along the same side, recent studies pointed that abnormal rRNA processing and chemical modification of rRNA creates ribosomes that drive translation toward oncogenic programs that can produce proteomes favorable to tumor growth [42]. Recent studies support these findings, where elevated levels of nucleosides including m6A and m1A levels were affecting RNA methylation process in CRC patients, suggesting the involvement of epitranscriptomic and post-transcriptional regulatory mechanisms in colorectal tumor progression [43]. Moreover, mitochondrial rRNA modifications can affect mitochondrial function, energy production, and generation of reactive oxygen species, which contribute to the resilience and growth of cancer cells [44]. Additionally, proper separation of sister chromatids during cell division is crucial for chromosome stability, where errors might lead to abnormal chromosomes and structural rearrangements that promote tumor growth and variations within the tumor [45,46]. Overall, all these factors are linked to cancer progression by contributing to increased cell proliferation, altered protein synthesis, and genomic instability [42,47].
Our analysis revealed multiple CRC progression-related pathways, including fatty acid degradation, metabolism, and biosynthesis. Cancer cells in CRC have been found to enhance both the synthesis and uptake of fatty acids to increase their cell division and survival. Moreover, CRC cells suppress the degradation of fatty acids that promotes the proliferation of tumor cells [48]. Another pathway is nucleotide-sugar production, which is coupled with lipid synthesis, sustaining proliferative and antioxidant needs in CRC cells [49,50]. The glutathione metabolism (GSH) pathway plays a crucial role in CRC progression, primarily by protecting cells from oxidative stress that contributes to tumor progression, and elevated levels of GSH help cancer cells to resist treatment [51,52].
4.2. Implications of Downregulated Genes
In this section, we discuss the findings considering the downregulated genes and the corresponding enriched processes or perturbed pathways. As an initial validation step, we confirmed that the common downregulated genes had the same expression behavior in TCGA COAD and READ datasets. Recent studies have shown that the majority of colorectal carcinomas show a significant decrease in the mRNA levels of ADH1B in early stages of the disease, and the expression levels decrease even more with CRC progression [53,54]. The reduced expression of CHGA in the early stages of colon cancer suggests that it can be used as a biomarker for early diagnosis, although it showed increased expression in primary versus metastatic cell lines [54,55,56]. The CNTN3 gene’s role in CRC and intestines in general is complex and requires further research, but it was found to be downregulated and marked as a potential biomarker in CRC progression [57]. GCG is one of the top DEGS in our study and was found to be significantly downregulated in colon and rectum adenocarcinomas compared with healthy control samples [58]. INSL5 expression was lower in CRC tissues than in normal tissues, while higher INSL5 expression was associated with better prognosis in CRC patients [59]. In a methylation PCR analysis study in CRC, the MAMDC2 gene was found to be downregulated and showed methylation presence across a large subset of CRC samples [60]. Regarding MS4A12, a recent study labeled it as a potential biomarker that increased the survival rate of patients with primary CRC [61]. Additionally, it was found to show significant differential expression in a downregulated manner considering CRC tissues and normal colorectal tissues [62]. NAP1L2 was found to be significantly downregulated and needs further analysis to identify its role in CRC [63]. Sucrase-isomaltase (SI) expression is downregulated in human colon adenocarcinoma Caco-2 cells and inversely correlated with growth factor activity [64].
4.2.1. Functional Significance of Ion Transport Dysregulation
Among the downregulated genes in our analysis, the group CLDN8, SCNN1B, CLCA4, SLC30A10, and ANO5 stand out as they are among the ion transport controllers that work together to keep the colon lining healthy and functional. For instance, the sodium channel subunit SCNN1B and CLDN8 play a role in epithelial sodium transport and electrolyte balance. In vitro studies using CRC cell lines showed that SCNN1B suppresses cell proliferation, induces cell cycle arrest, and inhibit cell migration [65]. Moreover, SCNN1B may serve as an effective molecular marker for predicting CRC progression and prognosis [66]. Additionally, CLDN8 was reported to have direct impact in sodium absorption by closing the paracellular barrier to prevent sodium leakage, disrupting the tissue’s normal fluid balance and creating an environment that helps tumors grow [67]. Notably, CLDN8 has a fluctuating expression behavior, where it is reported to be upregulated in CRC tissues and promotes cancer by increasing proliferation, migration, and invasion, and by activating the MAPK/ERK signaling pathway [68,69], while it is also reported as downregulated depending on the specific tumor subtype and RNA level background [70]. CLCA4 is reported to be downregulated in CRC and acts as a tumor suppressor gene involved in chloride transmembrane transport that helps colon cells maintain their proper rigid structure. Its decreased expression is associated with more aggressive tumors and poorer patient survival [8]. Furthermore, ANO5 belongs to the Anoctamin family of calcium-activated chloride channels, which are prominently expressed in normal gastrointestinal epithelial tissues to help regulate cellular homeostasis [71]. Beyond its primary role in ion transport, the downregulation of ANO5 weakens the expression of wild-type TP53 transcription, which is crucial for cellular damage repair and tumor suppression [72]. Lastly, SLC30A10 functions as a metal ion transporter and contributes to cellular ion homeostasis, where its low expression promotes cell proliferation and migration in CRC cells, making it a therapeutic target [73].
The decreased expression in these ion transport genes suggests that the colon’s protective lining is fundamentally changing. Supporting this observation, recent spatial transcriptomic analyses demonstrated that the development from inflammatory bowel disease (IBD) to CRC is associated with the loss and reprogramming of epithelial cell populations involved in mineral absorption and epithelial homeostasis. This shift causes the tissue to lose its balance and move toward a more cancerous state [74].
4.2.2. Functional Enrichment Validation for Downregulated Genes
Navigating through the GO enrichment processes that was illustrated in Figure 7, the hormonal processes mainly driven by GCG, which is considered an endocrine-related gene, were consistently enriched in genes that were downregulated in tumor tissue [75]. Several peptide hormone pathways, including somatostatin, CRHR2, and GLP1, are involved in the downregulation or suppression of CRC progression, primarily by inhibiting cell proliferation, inducing apoptosis, or modulating cellular processes vital for tumor growth [76]. Additionally, the primary alcohol metabolic pathway can suppress CRC progression via two key mechanisms. It detoxifies the carcinogen acetaldehyde via aldehyde dehydrogenase (ALDH) and is also essential for synthesizing retinoic acid, a strong tumor-suppressing molecule that regulates cell differentiation and inhibits cancer cell growth [77,78,79].
Furthermore, the transmembrane chloride channel Cystic Fibrosis Transmembrane Conductance Regulator (CFTR), which regulates chloride transport, is frequently downregulated in CRC, and its loss of function is associated with aggressive tumor development [80,81]. Myeloid cell activation in the tumor microenvironment often leads to the expansion and activation of myeloid-derived suppressor cells that promote CRC progression and immune evasion due to the contradictory roles of CHGA [82,83].
Considering perturbed pathways, CLDN8 loss is linked to the disruption of the epithelial barrier pathway in the colon. Moreover, Campylobacter concisus infection reduces ENaC-dependent Na+ transport and lowers claudin-8 expression, leading to defects in epithelial barrier function and sodium absorption [84]. Furthermore, CLDN8 has been reported to be downregulated in intestinal inflammation and its essential role in maintaining tight junction structure has been confirmed, further compromising the epithelial barrier [85]. Moreover, glucagon (GCG) is significantly downregulated in colon and rectal adenocarcinomas and is related to the patient’s clinical outcomes. Furthermore, GCG is enriched in the cell cycle and signaling pathways, including neuropeptide ligand–receptor interactions and WNT-related pathways, suggesting that the disruption of glucagon-related signaling contributes to gastrointestinal tumor biology [86].
Collectively, several of the downregulated genes are linked to epithelial ion transport and electrolyte regulation. In particular, CLDN8, SCNN1B, CLCA4, SLC30A10, and ANO5 are associated with sodium handling, chloride conductance, or epithelial ion permeability. This is consistent with the enrichment of chloride transmembrane transport observed in the GO analysis, supporting the reduced gene expression related to ion transport in CRC tumors. Pathway analysis further reinforces this observation, as CLDN8 loss has been associated with disruption of tight junction integrity and ENaC-dependent sodium transport.
4.3. Implications of Upregulated Genes
Upregulated genes often enhance cellular proliferation and other processes that promote cancer progression. As an initial validation step, we confirmed that the common upregulated genes had the same expression behavior in TCGA COAD and READ datasets. This section highlights the significance of these genes and their roles in elevated CRC expression.
ACSL6 is an interesting gene that is found to be decreased in expression in most types of cancers but not in CRC [87], where it is upregulated and has been reported to reduce the survival rate by enhancing CRC development [88]. The overexpression of COL11A1 makes it a prognostic biomarker that may help in targeted therapies. Similarly, it is frequently associated with low survival rates [89,90]. Moreover, this gene has an impact on the oncogenomic and metabolic pathways that strongly affect CRC progression and requires further attention [89]. Another important gene is CXCL11, which is upregulated in both colon adenocarcinoma, rectal adenocarcinoma, and other colon inflammatory diseases. Moreover, it has been confirmed to be involved with other chemokines in immune signaling, angiogenesis, and intestinal repair mechanisms that may contribute to tumor development [91,92]. Epoxide hydrolase EPHX4 is upregulated in CRC compared to normal samples, which apparently enhances the malignancy of CRC [93]. FOXQ1 is highly overexpressed in CRC and promotes tumor progression. This is achieved through its ability to regulate multiple oncogenic pathways involved in cell cycle control, angiogenesis, and apoptosis resistance, making it a key player in CRC development [94,95]. MMP3 was identified as a key gene in addition to MMP7 that plays an important role in the overexpression in early stages of CRC by promoting the development of adenomas from normal colon epithelial cells into invasive cancer [96,97,98]. Recent studies have suggested that CRC migration and development can be inhibited if KRT23 is silenced, as it is highly expressed in CRC and promotes cancer stem cells properties [99,100]. In contrast, suppressing KRT23 expression significantly reduced tumor cell growth in vitro and in vivo [100].
Functional Enrichment Validations for Upregulated Genes
The main enriched processes illustrated in Figure 10 are suggested to fuel CRC progression. Extracellular encapsulating structure organization, extracellular matrix (ECM) organization, extracellular structure organization, extracellular matrix disassembly, and collagen catabolic processes are all connected together in promoting CRC.
ECM organization and collagen catabolic processes have diagnostic, prognostic, and therapeutic consequences, such as supporting metastatic colonization and treatment failure in CRC [101]. Additionally, crosslinked ECM increases interstitial fluid pressure and can exclude immune cells or impair drug delivery, thereby contributing to chemoresistance [101,102]. The upregulation of collagen and collagenase-encoding genes (e.g., COL1A1/2) is associated with poorer overall survival and may lead patients to aggressive disease biology [103]. MMP3 and MMP7 belong to a large group of proteases capable of breaking down all essential components of the extracellular matrix [97]. In conclusion, ECM organization (architecture, stiffness) and ECM disassembly (MMP-driven collagen catabolism) work together to convert the tumor environment to be more favorable for CRC invasion and metastasis; these changes also produce useful biomarkers and potential treatment targets [6,102,103,104].
Regarding perturbed pathways, MMP3 expression increases alongside IL-17 pathway activation and extracellular matrix remodeling in colorectal tumors, supporting its role in cytokine, chemokine, and IL-17–mediated inflammatory signaling [91]. Single-cell transcriptomic comparisons further support this, revealing that upregulated chemokine signaling and the NF-κB/IL-17 pathways are highly active in monocyte-macrophages within the CRC microenvironment, driving chronic inflammatory responses that facilitate cell growth [105]. Similarly, CXCL11 is overexpressed in CRC that develops in patients with ulcerative colitis and promotes cytokine–cytokine receptor interactions, clustering with key chemokine signaling mediators in CRC gene networks [91,106]. Additionally, MMP7 has been functionally linked to Wnt/β-catenin signaling pathway, where it contributes to early tumor progression and promotes invasion and metastasis through extracellular matrix degradation [96]. The estrogen signaling pathway has been shown to reduce MMP7 activation, suggesting that endocrine regulation may limit CRC metastasis [107].
4.4. Limitations of the Survival Analysis
We noticed during the TCGA validation phase that the 22 candidate genes showed consistent expression differences between tumor and normal tissues. However, only three genes showed statistically significant survival differences in the GEPIA2 analyses. This suggests that although the proposed genes are clearly associated with CRC progression, not all of them have direct linkage with patient survival. Furthermore, extra studies, including analyses that account for clinical factors such as age and tumor stage, are needed to assess their relationship with survival.
5. Conclusions
This study performed an intensive analysis of four publicly available NCBI GEO datasets to identify key molecular characteristics and potential biomarkers in CRC progression. Our analysis identified 2150 common DEGs considering tumor and normal samples, highlighting a robust set of genes potentially driving CRC development. Our analysis identified a set of persistently upregulated/downregulated DEGs and validated them using TCGA datasets COAD and READ. General functional analysis of these DEGs revealed a set of significantly perturbed biological processes related to ribonucleoprotein complex biogenesis, chromosome segregation, organelle fission, and ribosome biogenesis in addition to unusual behavior in the Wnt signaling pathway. The 14 consistently downregulated genes in all datasets were linked mainly to epithelial ion transport, including chloride transmembrane transport in addition to peptide hormone response and alcohol metabolism, suggesting the loss of normal epithelial ion transport processes in CRC. On the other hand, the eight consistently upregulated genes in all datasets were primarily involved in extracellular matrix organization and degradation, indicating enhanced ECM remodeling, that may contribute to tumor invasion and metastasis Finally, the 22 identified up/downregulated genes were mostly validated using literature wet-lab studies suggesting a robust set of potential biomarkers for CRC to guide new diagnostics schemes.
Supplementary Materials
The following supporting information can be downloaded at https://www.mdpi.com/article/10.3390/genes17111396/s1. Figure S1: Gene Ontology enrichment analysis; Figures S2 and S3: Protein-protein interaction networks of downregulated and upregulated genes, respectively; Figures S4 and S5: Kaplan–Meier overall survival curves for upregulated and downregulated genes, respectively; Figures S6–S9, S10–S13, S14–S17 and S18–S21: Receiver operating characteristic (ROC) curves and expression boxplots for upregulated and downregulated genes in GSE9348, GSE20916, GSE21510, and GSE87211, respectively; Table S1: Supplementary gene list; Table S2: Dataset-specific differential expression results; Table S3: Common downregulated and upregulated differentially expressed genes across the four datasets; Table S4: Differential expression results for common upregulated and downregulated genes in TCGA COAD and READ datasets.
Author Contributions
Conceptualization, T.A. and A.B.; methodology, T.A. and A.B.; scripting, T.A.; validation, T.A.; writing—original draft preparation, T.A.; writing the manuscript, T.A.; visualization, T.A. and A.B.; supervision, A.B. All authors have read and agreed to the published version of the manuscript.
Funding
This research received no external funding.
Institutional Review Board Statement
Not applicable.
Informed Consent Statement
Not applicable.
Data Availability Statement
The original contributions presented in this study are included in the article/Supplementary Materials. Further inquiries can be directed to the corresponding author.
Conflicts of Interest
The authors declare no conflicts of interest.
Abbreviations
The following abbreviations are used in this manuscript:
| CRC | Colorectal Cancer |
| NCBI | National Center for Biotechnology Information |
| TCGA | The Cancer Genome Atlas |
| GEO | Gene Expression Omnibus |
| KEGG | Kyoto Encyclopedia of Genes and Genomes |
| GO | Gene Ontology |
| DEG | Differentially Expressed Genes |
| KS | Kolmogorov–Smirnov |
| WHO | World Health Organization |
References
- World Health Organization. Colorectal Cancer; World Health Organization: Geneva, Switzerland. Available online: https://www.who.int/news-room/fact-sheets/detail/colorectal-cancer (accessed on 11 September 2025).
- Jung, G.; Hernández-Illán, E.; Moreira, L.; Balaguer, F.; Goel, A. Epigenetics of colorectal cancer: Biomarker and therapeutic potential. Nat. Rev. Gastroenterol. Hepatol. 2020, 17, 111–130. [Google Scholar] [CrossRef] [Scilit] [PubMed]
- Lichtenstern, C.R.; Ngu, R.K.; Shalapour, S.; Karin, M. Immunotherapy, Inflammation and Colorectal Cancer. Cells 2020, 9, 618. [Google Scholar] [CrossRef] [Scilit]
- De Rosa, M.; Rega, D.; Costabile, V.; Duraturo, F.; Niglio, A.; Izzo, P.; Pace, U.; Delrio, P. The biological complexity of colorectal cancer: Insights into biomarkers for early detection and personalized care. Ther. Adv. Gastroenterol. 2016, 9, 861. [Google Scholar] [CrossRef] [Scilit]
- Fleming-de-Moraes, C.D.; Rocha, M.R.; Tessmann, J.W.; de Araujo, W.M.; Morgado-Diaz, J.A. Crosstalk between PI3K/Akt and Wnt/β-catenin pathways promote colorectal cancer progression regardless of mutational status. Cancer Biol. Ther. 2022, 23, 1–13. [Google Scholar] [CrossRef] [Scilit]
- Liang, Y.; Lv, Z.; Huang, G.; Qin, J.; Li, H.; Nong, F.; Wen, B. Prognostic significance of abnormal matrix collagen remodeling in colorectal cancer based on histologic and bioinformatics analysis. Oncol. Rep. 2020, 44, 1671–1685. [Google Scholar] [CrossRef] [Scilit]
- Yuzhalin, A.E.; Gordon-Weeks, A.N.; Tognoli, M.L.; Jones, K.; Markelc, B.; Konietzny, R.; Fischer, R.; Muth, A.; O’neill, E.; Thompson, P.R.; et al. Colorectal cancer liver metastatic growth depends on PAD4-driven citrullination of the extracellular matrix. Nat. Commun. 2018, 9, 4783. [Google Scholar] [CrossRef] [Scilit]
- Teske, K.; Erickson, N.A.; Huck, A.; Dzamukova, M.; Fulde, M.; Heinbokel, T.; Horst, D.; Klymiuk, N.; Pastille, E.; Mekes-Adamczyk, A.; et al. The impact of disease and species differences on the intestinal CLCA4 gene expression. J. Mol. Med. 2025, 103, 687–697. [Google Scholar] [CrossRef] [Scilit]
- Wu, D.; Song, Q.-Y.; Dai, B.-S.; Li, J.; Wang, X.-X.; Liu, J.-Y.; Xie, T.-Y. Colorectal cancer early screening: Dilemmas and solutions. World J. Gastroenterol. 2025, 31, 98760. [Google Scholar] [CrossRef] [Scilit]
- Huxley, R.R.; Ansary-Moghaddam, A.; Clifton, P.; Czernichow, S.; Parr, C.L.; Woodward, M. The impact of dietary and lifestyle risk factors on risk of colorectal cancer: A quantitative overview of the epidemiological evidence. Int. J. Cancer 2009, 125, 171–180. [Google Scholar] [CrossRef] [Scilit]
- Lauby-Secretan, B.; Scoccianti, C.; Loomis, D.; Grosse, Y.; Bianchini, F.; Straif, K. Body Fatness and Cancer—Viewpoint of the IARC Working Group. N. Engl. J. Med. 2016, 375, 794–798. [Google Scholar] [CrossRef] [Scilit] [PubMed]
- Puccini, A.; Seeber, A.; Berger, M.D. Biomarkers in Metastatic Colorectal Cancer: Status Quo and Future Perspective. Cancers 2022, 14, 4828. [Google Scholar] [CrossRef] [Scilit]
- Johdi, N.A.; Sukor, N.F. Colorectal Cancer Immunotherapy: Options and Strategies. Front. Immunol. 2020, 11, 525648. [Google Scholar] [CrossRef] [Scilit]
- Carlsen, L.; Huntington, K.E.; El-Deiry, W.S. Immunotherapy for Colorectal Cancer: Mechanisms and Predictive Biomarkers. Cancers 2022, 14, 1028. [Google Scholar] [CrossRef] [Scilit]
- Terzi, A.; Maqoud, F.; Guido, D.; Mallardi, D.; Aloisio, M.; Ura, B.; Gualandi, N.; Russo, F.; Giannelli, G. Ion Channel–Extracellular Matrix Interplay in Colorectal Cancer: A Network-Based Approach to Tumor Microenvironment Remodeling. Int. J. Mol. Sci. 2025, 26, 5147. [Google Scholar] [CrossRef] [Scilit]
- Zhang, M.; Li, T.; Zhu, J.; Tuo, B.; Liu, X. Physiological and pathophysiological role of ion channels and transporters in the colorectum and colorectal cancer. J. Cell. Mol. Med. 2020, 24, 9486. [Google Scholar] [CrossRef] [Scilit]
- Chen, L.; Lu, D.; Sun, K.; Xu, Y.; Hu, P.; Li, X.; Xu, F. Identification of biomarkers associated with diagnosis and prognosis of colorectal cancer patients based on integrated bioinformatics analysis. Gene 2019, 692, 119–125. [Google Scholar] [CrossRef] [Scilit]
- Subramanian, I.; Verma, S.; Kumar, S.; Jere, A.; Anamika, K. Multi-omics Data Integration, Interpretation, and Its Application. Bioinform. Biol. Insights 2020, 14, 1–24. [Google Scholar] [CrossRef] [Scilit]
- Sveen, A.; Kopetz, S.; Lothe, R.A. Biomarker-guided therapy for colorectal cancer: Strength in complexity. Nat. Rev. Clin. Oncol. 2020, 17, 11–32. [Google Scholar] [CrossRef] [Scilit]
- Hu, Y.; Gaedcke, J.; Emons, G.; Beissbarth, T.; Grade, M.; Jo, P.; Yeager, M.; Chanock, S.J.; Wolff, H.; Camps, J.; et al. Colorectal cancer susceptibility loci as predictive markers of rectal cancer prognosis after surgery. Genes Chromosom. Cancer 2018, 57, 140–149. [Google Scholar] [CrossRef] [Scilit]
- Skrzypczak, M.; Goryca, K.; Rubel, T.; Paziewska, A.; Mikula, M.; Jarosz, D.; Pachlewski, J.; Oledzki, J.; Ostrowsk, J. Modeling oncogenic signaling in colon tumors by multidirectional analyses of microarray data directed for maximization of analytical reliability. PLoS ONE 2010, 5, e13091. [Google Scholar] [CrossRef] [Scilit]
- Tsukamoto, S.; Ishikawa, T.; Iida, S.; Ishiguro, M.; Mogushi, K.; Mizushima, H.; Uetake, H.; Tanaka, H.; Sugihara, K. Clinical significance of osteoprotegerin expression in human colorectal cancer. Clin. Cancer Res. 2011, 17, 2444–2450. [Google Scholar] [CrossRef] [Scilit]
- Hong, Y.; Downey, T.; Eu, K.W.; Koh, P.K.; Cheah, P.Y. A ‘metastasis-prone’ signature for early-stage mismatch-repair proficient sporadic colorectal cancer patients and its implications for possible therapeutics. Clin. Exp. Metastasis 2010, 27, 83–90. [Google Scholar] [CrossRef] [Scilit]
- Barghash, A.; Helms, V.; Kessler, S.M. Overexpression of IGF2 mRNA-Binding Protein 2 (IMP2/p62) as a Feature of Basal-like Breast Cancer Correlates with Short Survival. Scand. J. Immunol. 2015, 82, 142–143. [Google Scholar] [CrossRef] [Scilit]
- Barghash, A.; Golob-Schwarzl, N.; Helms, V.; Haybaeck, J.; Kessler, S.M. Elevated expression of the IGF2 mRNA binding protein 2 (IGF2BP2/IMP2) is linked to short survival and metastasis in esophageal adenocarcinoma. Oncotarget 2016, 7, 49743. [Google Scholar] [CrossRef] [Scilit]
- Barghash, A.; Shanak, S. Advanced Gene-Expression Analysis of Skeletal Muscles Focusing on Normal, Glucose-Intolerant, and Diabetic Individuals with Type 2 Diabetes. Biomedicines 2025, 13, 2181. [Google Scholar] [CrossRef] [Scilit]
- Barghash, A.; Abdelhadi, T. Unveiling the molecular landscape: Advanced gene expression analysis identifies novel biomarkers for thyroid cancer. Perinat. J. 2025, 33, 1011–1021. [Google Scholar] [CrossRef] [Scilit]
- Virtanen, P.; Gommers, R.; Oliphant, T.E.; Haberland, M.; Reddy, T.; Cournapeau, D.; Burovski, E.; Peterson, P.; Weckesser, W.; Bright, J.; et al. SciPy 1.0: Fundamental algorithms for scientific computing in Python. Nat. Methods 2020, 17, 261–272. [Google Scholar] [CrossRef] [Scilit] [PubMed]
- Wiebe, D.S.; Omelyanchuk, N.A.; Mukhin, A.M.; Grosse, I.; Lashin, S.A.; Zemlyanskaya, E.V.; Mironova, V.V. Fold-Change-Specific Enrichment Analysis (FSEA): Quantification of Transcriptional Response Magnitude for Functional Gene Groups. Genes 2020, 11, 434. [Google Scholar] [CrossRef] [Scilit]
- Romero, R.; Bastida, D.M.A. Identification and Functional Characterization of Upregulated Hub Genes in Adenocarcinoma across Multiple Organ Sites. Asian Pac. J. Cancer Biol. 2025, 10, 27–35. [Google Scholar] [CrossRef] [Scilit]
- Fang, Z.; Liu, X.; Peltz, G. GSEApy: A comprehensive package for performing gene set enrichment analysis in Python. Bioinformatics 2023, 39, btac757. [Google Scholar] [CrossRef] [Scilit] [PubMed]
- Cokelaer, T.; Pultz, D.; Harder, L.M.; Serra-Musach, J.; Saez-Rodriguez, J. BioServices: A common Python package to access biological Web Services programmatically. Bioinformatics 2013, 29, 3241–3242. [Google Scholar] [CrossRef] [Scilit]
- Fröhlich, H.; Speer, N.; Poustka, A.; Beißbarth, T. GOSim—An R-package for computation of information theoretic GO similarities between terms and gene products. BMC Bioinform. 2007, 8, 166. [Google Scholar] [CrossRef] [Scilit]
- Yu, G. Thirteen years of clusterProfiler. Innovation 2024, 5, 100722. [Google Scholar] [CrossRef] [Scilit]
- Xu, S.; Hu, E.; Cai, Y.; Xie, Z.; Luo, X.; Zhan, L.; Tang, W.; Wang, Q.; Liu, B.; Wang, R.; et al. Using clusterProfiler to characterize multiomics data. Nat. Protoc. 2024, 19, 3292–3320. [Google Scholar] [CrossRef] [Scilit] [PubMed]
- Wu, T.; Hu, E.; Xu, S.; Chen, M.; Guo, P.; Dai, Z.; Feng, T.; Zhou, L.; Tang, W.; Zhan, L.; et al. ClusterProfiler 4.0: A universal enrichment tool for interpreting omics data. Innovation 2021, 2, 100141. [Google Scholar] [CrossRef] [Scilit] [PubMed]
- Yu, G.; Wang, L.-G.; Han, Y.; He, Q.-Y. ClusterProfiler: An R Package for Comparing Biological Themes Among Gene Clusters. OMICS 2012, 16, 284–287. [Google Scholar] [CrossRef] [Scilit] [PubMed]
- Wickham, H. ggplot2; Springer: Cham, Switzerland, 2016. [Google Scholar] [CrossRef] [Scilit]
- Szklarczyk, D.; Kirsch, R.; Koutrouli, M.; Nastou, K.; Mehryary, F.; Hachilif, R.; Gable, A.L.; Fang, T.; Doncheva, N.T.; Pyysalo, S.; et al. The STRING database in 2023: Protein-protein association networks and functional enrichment analyses for any sequenced genome of interest. Nucleic Acids Res. 2023, 51, D638–D646. [Google Scholar] [CrossRef] [Scilit] [PubMed]
- Ge, S.X.; Jung, D.; Jung, D.; Yao, R. ShinyGO: A graphical gene-set enrichment tool for animals and plants. Bioinformatics 2020, 36, 2628–2629. [Google Scholar] [CrossRef] [Scilit] [PubMed]
- Sherman, B.T.; Hao, M.; Qiu, J.; Jiao, X.; Baseler, M.W.; Lane, H.C.; Imamichi, T.; Chang, W. DAVID: A web server for functional enrichment analysis and functional annotation of gene lists (2021 update). Nucleic Acids Res. 2022, 50, W216–W221. [Google Scholar] [CrossRef] [Scilit] [PubMed]
- López, J.; Blanco, S. Exploring the role of ribosomal RNA modifications in cancer. Curr. Opin. Genet. Dev. 2024, 86, 102204. [Google Scholar] [CrossRef] [Scilit]
- Zheng, W.; Wang, M.; Chai, X.; Pan, F.; Xu, M.; Wang, Y.; Lan, L.; Hu, F.; Zhang, Z.; Chen, Z. Targeted metabolomics analysis of nucleosides and the identification of biomarkers for colorectal adenomas and colorectal cancer. Front. Mol. Biosci. 2023, 10, 1163089. [Google Scholar] [CrossRef] [Scilit]
- Cui, L.; Zheng, J.; Lin, Y.; Lin, P.; Lu, Y.; Zheng, Y.; Guo, B.; Zhao, X. Decoding the ribosome’s hidden language: RRNA modifications as key players in cancer dynamics and targeted therapies. Clin. Transl. Med. 2024, 14, e1705. [Google Scholar] [CrossRef] [Scilit]
- Gaviraghi, M.; Vivori, C.; Tonon, G. How Cancer Exploits Ribosomal RNA Biogenesis: A Journey beyond the Boundaries of rRNA Transcription. Cells 2019, 8, 1098. [Google Scholar] [CrossRef] [Scilit]
- Elhamamsy, A.R.; Metge, B.J.; Alsheikh, H.A.; Shevde, L.A.; Samant, R.S. Ribosome Biogenesis: A Central Player in Cancer Metastasis and Therapeutic Resistance. Cancer Res. 2022, 82, 2344–2353. [Google Scholar] [CrossRef] [Scilit]
- Muñoz-Velasco, I.; Herrera-Escamilla, A.K.; Vázquez-Salazar, A. Nucleolar origins: Challenging perspectives on evolution and function. Open Biol. 2025, 15, 240330. [Google Scholar] [CrossRef] [Scilit]
- Zhuang, Z.; Chen, Y.; Yao, Y.; Zhu, X. Metabolic Reprogramming in Colorectal Cancer: The Impact of Fatty Acid Metabolism. Hum. Mutat. 2025, 2025, 9567214. [Google Scholar] [CrossRef] [Scilit]
- Krauß, D.; Fari, O.; Sibilia, M. Lipid Metabolism Interplay in CRC—An Update. Metabolites 2022, 12, 213. [Google Scholar] [CrossRef] [Scilit]
- Hon, K.W.; Zainal Abidin, S.A.; Othman, I.; Naidu, R. The Crosstalk Between Signaling Pathways and Cancer Metabolism in Colorectal Cancer. Front. Pharmacol. 2021, 12, 768861. [Google Scholar] [CrossRef] [Scilit]
- Zhang, X.; He, Y.; Shen, J.; Zhou, B.; Qin, H.; Zhang, S.; Huang, Z. Study on the Mechanism of FOXA2 Activation on Glutathione Metabolic Reprogramming Mediated by ETV4 Transcription to Facilitate Colorectal Cancer Malignant Progression. Biochem. Genet. 2025, 63, 4179–4199. [Google Scholar] [CrossRef] [Scilit]
- Bansal, A.; Simon, M.C. Glutathione metabolism in cancer progression and treatment resistance. J. Cell Biol. 2018, 217, 2291–2298. [Google Scholar] [CrossRef] [Scilit]
- Kropotova, E.S.; Zinovieva, O.L.; Zyryanova, A.F.; Dybovaya, V.I.; Prasolov, V.S.; Beresten, S.F.; Oparina, N.Y.; Mashkova, T.D. Altered expression of multiple genes involved in retinoic acid biosynthesis in human colorectal cancer. Pathol. Oncol. Res. 2014, 20, 707–717. [Google Scholar] [CrossRef] [Scilit]
- Demmler, R.; Anchang, C.G.; Yong, Y.; Ramming, A.; Rauber, S.; Schellerer, V.S.; Schmid, B.; Hartmann, A.; Merkel, S.; Imkeller, K.; et al. Fibroblast dynamics in colorectal cancer: Stability, plasticity, and novel markers. Oncogene 2026, 45, 2299–2312. [Google Scholar] [CrossRef] [Scilit]
- Zhang, X.; Zhang, H.; Shen, B.; Sun, X.F. Chromogranin-A Expression as a Novel Biomarker for Early Diagnosis of Colon Cancer Patients. Int. J. Mol. Sci. 2019, 20, 2919. [Google Scholar] [CrossRef] [Scilit]
- Safarpour, H.; Ranjbaran, J.; Erfanian, N.; Nomiri, S.; Derakhshani, A.; Gerarduzzi, C.; Feriz, A.M.; HosseiniGol, E.; Saghafi, S.; Silvestris, N. Holistic exploration of CHGA and hsa-miR-137 in colorectal cancer via multi-omic data Integration. Heliyon 2024, 10, e27046. [Google Scholar] [CrossRef] [Scilit]
- Zhou, J.; Xie, Z.; Cui, P.; Su, Q.; Zhang, Y.; Luo, L.; Li, Z.; Ye, L.; Liang, H.; Huang, J. SLC1A1, SLC16A9, and CNTN3 Are Potential Biomarkers for the Occurrence of Colorectal Cancer. BioMed Res. Int. 2020, 2020, 1204605. [Google Scholar] [CrossRef] [Scilit]
- Behrouzifar, S. Comparative Study of Under-Expressed Prognostic Biomarkers and Pivotal Signaling Pathways in Colon Cancer and Ulcerative Colitis Using Integrated Bioinformatics Approach. Available online: http://gepia.cancer-pku.cn/ (accessed on 1 May 2026).
- Yang, X.; Wei, W.; Tan, S.; Guo, L.; Qiao, S.; Yao, B.; Wang, Z. Identification and verification of HCAR3 and INSL5 as new potential therapeutic targets of colorectal cancer. World J. Surg. Oncol. 2021, 19, 248. [Google Scholar] [CrossRef] [Scilit]
- Mitchell, S.M.; Ross, J.P.; Drew, H.R.; Ho, T.; Brown, G.S.; Saunders, N.F.; Duesing, K.R.; Buckley, M.J.; Dunne, R.; Beetson, I.; et al. A panel of genes methylated with high frequency in colorectal cancer. BMC Cancer 2014, 14, 54. [Google Scholar] [CrossRef] [Scilit]
- Han, J.; Zhang, X.; Liu, Y.; Jing, L.; Liu, Y.B.; Feng, L. CLCA4 and MS4A12 as the significant gene biomarkers of primary colorectal cancer. Biosci. Rep. 2020, 40, BSR20200963. [Google Scholar] [CrossRef] [Scilit]
- Xu, H.; Ma, Y.; Zhang, J.; Gu, J.; Jing, X.; Lu, S.; Fu, S.; Huo, J. Identification and Verification of Core Genes in Colorectal Cancer. BioMed Res. Int. 2020, 2020, 8082697. [Google Scholar] [CrossRef] [Scilit]
- Li, X.; Li, J.; Li, J.; Liu, N.; Zhuang, L. Development and validation of epigenetic modification-related signals for the diagnosis and prognosis of colorectal cancer. BMC Genom. 2024, 25, 51. [Google Scholar] [CrossRef] [Scilit]
- Beaulieu, J.F.; Quaroni, A. Clonal analysis of sucrase-isomaltase expression in the human colon adenocarcinoma Caco-2 cells. Biochem. J. 1991, 280, 599. [Google Scholar] [CrossRef] [Scilit]
- Qian, Y.; Zhou, L.; Luk, S.T.Y.; Xu, J.; Li, W.; Gou, H.; Chen, H.; Kang, W.; Yu, J.; Wong, C.C. The sodium channel subunit SCNN1B suppresses colorectal cancer via suppression of active c-Raf and MAPK signaling cascade. Oncogene 2023, 42, 601–612. [Google Scholar] [CrossRef] [Scilit]
- Liu, Y.; Duan, Y.; Bai, T.; Kong, D. Hypermethylation of the sodium channel beta subunit gene promoter is associated with colorectal cancer. Hereditas 2024, 161, 39. [Google Scholar] [CrossRef] [Scilit]
- Amasheh, S.; Milatz, S.; Krug, S.M.; Bergs, M.; Amasheh, M.; Schulzke, J.-D.; Fromm, M. Na+ absorption defends from paracellular back-leakage by claudin-8 upregulation. Biochem. Biophys. Res. Commun. 2009, 378, 45–50. [Google Scholar] [CrossRef] [Scilit]
- Cheng, B.; Rong, A.; Zhou, Q.; Li, W. CLDN8 promotes colorectal cancer cell proliferation, migration, and invasion by activating MAPK/ERK signaling. Cancer Manag. Res. 2019, 11, 3741. [Google Scholar] [CrossRef] [Scilit]
- Tao, D.; Guan, B.; Li, H.; Zhou, C. Expression patterns of claudins in cancer. Heliyon 2023, 9, e21338. [Google Scholar] [CrossRef] [Scilit]
- Cox, K.E.; Liu, S.; Hoffman, R.M.; Batra, S.K.; Dhawan, P.; Bouvet, M. The Expression of the Claudin Family of Proteins in Colorectal Cancer. Biomolecules 2024, 14, 272. [Google Scholar] [CrossRef] [Scilit]
- Pan, R.; Lu, Q.; Ren, C.; Li, H.; Zeng, F.; Tian, X.; Chen, H. Anoctamin 5 promotes osteosarcoma development by increasing degradation of Nel-like proteins 1 and 2. Aging 2021, 13, 17316–17327. [Google Scholar] [CrossRef] [Scilit]
- Lu, S.; Jia, C.Y.; Yang, J.S. Future therapeutic implications of new molecular mechanism of colorectal cancer. World J. Gastroenterol. 2023, 29, 2359. [Google Scholar] [CrossRef] [Scilit]
- Hou, L.; Liu, P.; Zhu, T. Long noncoding RNA SLC30A10 promotes colorectal tumor proliferation and migration via miR-21c/APC axis. Eur. Rev. Med. Pharmacol. Sci. 2020, 24, 6682–6691. [Google Scholar] [CrossRef]
- Hosseini, S.T.; AminianToosi, K.; Nemati, F.; BishehKolaei, R.; Deng, Y. Deciphering immune and cellular reprogramming during the progression from inflammatory bowel disease to colorectal cancer using multi-omics single-cell and spatial transcriptomics. J. Transl. Med. 2026, 24, 591. [Google Scholar] [CrossRef] [Scilit]
- da Silva, E.M.; Cipelli, M.; do Amaral, M.A.; Pacheco-Silva, A.; Câmara, N.O.S.; Andrade-Oliveira, V. Downregulation of Enteroendocrine Genes Predicts Survival in Colon Cancer: A Bioinformatics-Based Analysis. Int. J. Mol. Sci. 2025, 26, 11127. [Google Scholar] [CrossRef] [Scilit]
- Kasprzak, A.; Adamek, A. The Neuropeptide System and Colorectal Cancer Liver Metastases: Mechanisms and Management. Int. J. Mol. Sci. 2020, 21, 3494. [Google Scholar] [CrossRef] [Scilit]
- Duester, G. Retinoic Acid Synthesis and Signaling during Early Organogenesis. Cell 2008, 134, 921–931. [Google Scholar] [CrossRef] [Scilit]
- Singh, S.; Brocker, C.; Koppaka, V.; Chen, Y.; Jackson, B.C.; Matsumoto, A.; Thompson, D.C.; Vasiliou, V. Aldehyde dehydrogenases in cellular responses to oxidative/electrophilicstress. Free Radic. Biol. Med. 2013, 56, 89–101. [Google Scholar] [CrossRef] [Scilit]
- Villéger, R.; Chulkina, M.; Mifflin, R.C.; Markov, N.S.; Trieu, J.; Sinha, M.; Johnson, P.; Saada, J.I.; Adegboyega, P.A.; Luxon, B.A.; et al. Loss of alcohol dehydrogenase 1B in cancer-associated fibroblasts: Contribution to the increase of tumor-promoting IL-6 in colon cancer. Br. J. Cancer 2023, 128, 537–548. [Google Scholar] [CrossRef] [Scilit]
- Yang, B.; Cao, L.; Liu, B.; McCaig, C.D.; Pu, J. The Transition from Proliferation to Differentiation in Colorectal Cancer Is Regulated by the Calcium Activated Chloride Channel A1. PLoS ONE 2013, 8, e60861. [Google Scholar] [CrossRef] [Scilit]
- Scott, P.; Anderson, K.; Singhania, M.; Cormier, R. Cystic Fibrosis, CFTR, and Colorectal Cancer. Int. J. Mol. Sci. 2020, 21, 2891. [Google Scholar] [CrossRef] [Scilit]
- Nie, S.C.; Jing, Y.H.; Lu, L.; Ren, S.S.; Ji, G.; Xu, H.C. Mechanisms of myeloid-derived suppressor cell-mediated immunosuppression in colorectal cancer and related therapies. World J. Gastrointest. Oncol. 2024, 16, 1690–1704. [Google Scholar] [CrossRef] [Scilit]
- Sieminska, I.; Baran, J. Myeloid-Derived Suppressor Cells in Colorectal Cancer. Front. Immunol. 2020, 11, 552695. [Google Scholar] [CrossRef] [Scilit] [PubMed]
- Nattramilarasu, P.K.; Bücker, R.; de Sá, F.D.L.; Fromm, A.; Nagel, O.; Lee, I.-F.M.; Butkevych, E.; Mousavi, S.; Genger, C.; Kløve, S.; et al. Campylobacter concisus Impairs Sodium Absorption in Colonic Epithelium via ENaC Dysfunction and Claudin-8 Disruption. Int. J. Mol. Sci. 2020, 21, 373. [Google Scholar] [CrossRef] [Scilit]
- Garcia-Hernandez, V.; Quiros, M.; Nusrat, A. Intestinal epithelial claudins: Expression and regulation in homeostasis and inflammation. Ann. N. Y. Acad. Sci. 2017, 1397, 66–79. [Google Scholar] [CrossRef] [Scilit]
- Du, W.; Miao, Y.; Zhang, G.; Luo, G.; Yang, P.; Chen, F.; Zhang, B.; Yang, C.; Li, G.; Chang, J. The Regulatory Role of Neuropeptide Gene Glucagon in Colorectal Cancer: A Comprehensive Bioinformatic Analysis. Dis. Markers 2022, 2022, 4262600. [Google Scholar] [CrossRef] [Scilit]
- Chen, W.C.; Wang, C.Y.; Hung, Y.H.; Weng, T.Y.; Yen, M.C.; Lai, M.D. Systematic Analysis of Gene Expression Alterations and Clinical Outcomes for Long-Chain Acyl-Coenzyme A Synthetase Family in Cancer. PLoS ONE 2016, 11, e0155660. [Google Scholar] [CrossRef] [Scilit]
- Huang, Z.; Yang, Q.; Huang, Z. Identification of Critical Genes and Five Prognostic Biomarkers Associated with Colorectal Cancer. Med. Sci. Monit. 2018, 24, 4625. [Google Scholar] [CrossRef] [Scilit]
- Patra, R.; Das, N.C.; Mukherjee, S. Exploring the Differential Expression and Prognostic Significance of the COL11A1 Gene in Human Colorectal Carcinoma: An Integrated Bioinformatics Approach. Front. Genet. 2021, 12, 608313. [Google Scholar] [CrossRef] [Scilit]
- Wu, Y.-H.; Chang, T.-H.; Huang, Y.-F.; Huang, H.-D.; Chou, C.-Y. COL11A1 promotes tumor progression and predicts poor clinical outcome in ovarian cancer. Oncogene 2014, 33, 3432–3440. [Google Scholar] [CrossRef] [Scilit]
- Lu, C.; Zhang, X.; Luo, Y.; Huang, J.; Yu, M. Identification of CXCL10 and CXCL11 as the candidate genes involving the development of colitis-associated colorectal cancer. Front. Genet. 2022, 13, 945414. [Google Scholar] [CrossRef] [Scilit]
- Cao, Y.; Jiao, N.; Sun, T.; Ma, Y.; Zhang, X.; Chen, H.; Hong, J.; Zhang, Y. CXCL11 Correlates with Antitumor Immunity and an Improved Prognosis in Colon Cancer. Front. Cell Dev. Biol. 2021, 9, 646252. [Google Scholar] [CrossRef] [Scilit]
- Cao, L.; Ba, Y.; Chen, F.; Li, D.; Zhang, S.; Zhang, H. The prognostic significance of epoxide hydrolases in colorectal cancer. Biochem. Biophys. Rep. 2025, 41, 101912. [Google Scholar] [CrossRef] [Scilit]
- Kaneda, H.; Arao, T.; Tanaka, K.; Tamura, D.; Aomatsu, K.; Kudo, K.; Sakai, K.; De Velasco, M.A.; Matsumoto, K.; Fujita, Y.; et al. FOXQ1 is overexpressed in colorectal cancer and enhances tumorigenicity and tumor growth. Cancer Res. 2010, 70, 2053–2063. [Google Scholar] [CrossRef] [Scilit]
- Ye, Z.H.; Luo, W.; Li, L.; Shuai, W.; Zhou, L.; Duan, Y.; Chen, X.; Zhang, J.; Huang, W.; Liu, R. Genome-Wide In Vivo RNAi Screening Identifies HOXD4 as a Tumor Metastasis Suppressor in Colorectal Cancer. Adv. Sci. 2026, 13, e20829. [Google Scholar] [CrossRef] [Scilit]
- Lièvre, A.; Milet, J.; Carayol, J.; Le Corre, D.; Milan, C.; Pariente, A.; Nalet, B.; Lafon, J.; Faivre, J.; Bonithon-Kopp, C.; et al. Genetic polymorphisms of MMP1, MMP3 and MMP7 gene promoter and risk of colorectal adenoma. BMC Cancer 2006, 6, 270. [Google Scholar] [CrossRef] [Scilit]
- Zinzindohoué, F.; Lecomte, T.; Ferraz, J.-M.; Houllier, A.-M.; Cugnenc, P.-H.; Berger, A.; Blons, H.; Laurent-Puig, P. Prognostic Significance of MMP-1 and MMP-3 Functional Promoter Polymorphisms in Colorectal Cancer. Clin. Cancer Res. 2005, 11, 594–599. [Google Scholar] [CrossRef] [Scilit]
- Večurkovská, I.; Stupák, M.; Kaťuchová, J.; Roškovičová, V.; Pavluš, M.; Mareková, M.; Mašlanková, J. Multi-Platform Detection of MMP-7 in Colorectal Carcinoma. Cancers 2026, 18, 214. [Google Scholar] [CrossRef] [Scilit]
- Liu, J.; Li, Y.; Liao, B.; Xu, Q.; Zhou, Y.; Zhang, H. ZNF384 mediates KRT23 to promote CRC process through the TGF-β/Smad signaling pathway. Cytotechnology 2025, 77, 111. [Google Scholar] [CrossRef] [Scilit]
- Zhang, N.; Zhang, R.; Zou, K.; Yu, W.; Guo, W.; Gao, Y.; Li, J.; Li, M.; Tai, Y.; Huang, W.; et al. Keratin 23 promotes telomerase reverse transcriptase expression and human colorectal cancer growth. Cell Death Dis. 2017, 8, e2961. [Google Scholar] [CrossRef] [Scilit]
- Venning, F.A.; Wullkopf, L.; Erler, J.T. Targeting ECM disrupts cancer progression. Front. Oncol. 2015, 5, 165088. [Google Scholar] [CrossRef] [Scilit]
- Barkan, D.; Green, J.E.; Chambers, A.F. Extracellular Matrix: A Gatekeeper in the Transition from Dormancy to Metastatic Growth. Eur. J. Cancer 2010, 46, 1181. [Google Scholar] [CrossRef] [Scilit]
- Marques-Magalhães, Â.; Cruz, T.; Costa, Â.M.; Estêvão, D.; Rios, E.; Canão, P.A.; Velho, S.; Carneiro, F.; Oliveira, M.J.; Cardoso, A.P. Decellularized Colorectal Cancer Matrices as Bioactive Scaffolds for Studying Tumor-Stroma Interactions. Cancers 2022, 14, 359. [Google Scholar] [CrossRef] [Scilit]
- Kehlet, S.N.; Sanz-Pamplona, R.; Brix, S.; Leeming, D.J.; Karsdal, M.A.; Moreno, V. Excessive collagen turnover products are released during colorectal cancer progression and elevated in serum from metastatic colorectal cancer patients. Sci. Rep. 2016, 6, 30599. [Google Scholar] [CrossRef] [Scilit]
- Lv, H.; Mu, Y.; Zhang, C.; Zhao, M.; Jiang, P.; Xiao, S.; Sun, H.; Wu, N.; Sun, D.; Jin, Y. Comparative analysis of single-cell transcriptome reveals heterogeneity and commonality in the immune microenvironment of colorectal cancer and inflammatory bowel disease. Front. Immunol. 2024, 15, 1356075. [Google Scholar] [CrossRef] [Scilit]
- Shahnazari, M.; Afshar, S.; Emami, M.H.; Amini, R.; Jalali, A. Novel biomarkers for neoplastic progression from ulcerative colitis to colorectal cancer: A systems biology approach. Sci. Rep. 2023, 13, 3413. [Google Scholar] [CrossRef] [Scilit]
- Fang, Y.J.; Pan, Z.Z.; Li, L.R.; Lu, Z.H.; Zhang, L.Y.; Wan, D.S. MMP7 expression regulated by endocrine therapy in ERβ-positive colon cancer cells. J. Exp. Clin. Cancer Res. 2009, 28, 132. [Google Scholar] [CrossRef] [Scilit]
Disclaimer/Publisher’s Note: The statements, opinions and data contained in all publications are solely those of the individual author(s) and contributor(s) and not of MDPI and/or the editor(s). MDPI and/or the editor(s) disclaim responsibility for any injury to people or property resulting from any ideas, methods, instructions or products referred to in the content. |
© 2026 by the authors. Licensee MDPI, Basel, Switzerland. This article is an open access article distributed under the terms and conditions of the Creative Commons Attribution (CC BY) license.