


Abstract
Chalkiness is a complex quantitative trait regulated by both genetic and environmental factors. Reducing chalkiness has long been a research focus in rice genetics and breeding. A total of 108 markers on/closely linked to starch biosynthesizing genes, grain shape and chalkiness QTLs were used to detect interactions affecting chalkiness. A total of 30 and 39 marker pairs with significant bigenic epistasis were identified for percentage of grain with chalkiness (PGWC) and degree of endosperm chalkiness (DEC), respectively, of which 16 were commonly found in both traits. Using markers associated with chalkiness and marker pairs with significant epistatic effects as candidate predictors increased the coefficient of determination (R2) of the best multiple regression models for predicting both traits. GBSSI, SSIIa and the interaction between GBSSI and GBSSII were consistently identified in optimal models, indicating their critical roles in regulating rice chalkiness. R2 for DEC and PGWC ranged from 36.5% to 42.7% and from 52.9% to 73.8% in two environments, respectively. PGWC decreased significantly from 38.9% to 15.10% after three cycles using marker-assisted recurrent selection (MARS). This study suggests that epistasis contributes substantially to the regulation of chalkiness, and demonstrates that MARS can effectively improve chalkiness without imposing obvious negative impacts on eating quality.
1. Introduction
Chalkiness, the white opaque areas in the rice grain, is an undesirable trait in almost all of the rice industries, which not only reduces head rice recovery because of starch granules loosely packed with large space in the chalky areas, but also lowers the value of milled rice because of poor appearance quality [1,2]. Chalkiness exhibited a highly significant negative correlation with head rice yield (HRY). A 1% decrease in chalkiness was accompanied by approximately a 1% increase in HRY in indica rice [1]. Therefore, chalkiness is often used as an indicator to evaluate rice grain quality and commercial value [3]. The arrangement and fine structure of starch granules was mainly regulated by chalkiness, affecting the physicochemical properties [4,5]. Chalkiness was negatively correlated with the amylose content, peak and breakdown viscosity but positively correlated with the branching degree, the enthalpy of gelatinization, setback viscosity and pasting time, which further impair eating and cooking quality [6,7]. Therefore, eliminating chalkiness would produce more head rice in the same land area, which would benefit farmers, millers, traders and consumers, thereby contributing to food security and potential income.
Chalkiness is a complex trait affected by environmental factors, cultivation and agronomic practices, as well as physiological and metabolic processes during grain filling [8,9,10]. Numerous quantitative trait loci (QTLs) or genes related to chalkiness have been identified, which were distributed across all 12 chromosomes [11,12,13,14,15]. Up to now, more than one hundred genes were identified by map-based cloning, reverse genetics or mutation studies. Generally speaking, these genes can be divided into seven categories, that is, starch synthesis-related genes, grain shape-related genes, storage protein-related genes, transcriptional regulators, organelle development-related genes, high temperature- and reactive oxygen species-related genes, and genes encoding key enzymes in some specific metabolic pathways affecting chalkiness formation [16].
Studies using association mapping have revealed that some starch biosynthesizing genes were associated with chalkiness. For example, SSIIa, ISA2, PUL and SSIIIa were associated with chalkiness in a population with 233 Australian rice breeding lines [17]. We also reported that SSIIa, GBSSI, BEIIb, PUL, SSI and SSIVb were strongly associated with degree of endosperm chalkiness (DEC) or the percentage of grains with chalkiness (PGWC) using an indica population of 375 diverse advanced lines from irrigated rice breeding programs in different countries [18]. For example, three SNPs of SSIIa explained 5.52–18.96% of the phenotypic variance in the percentage of grains with chalkiness (PGWC) and the degree of endosperm chalkiness (DEC) across the six environments, and two SNPs on Wx explained 5.45–8.90% of the phenotypic variance of the above traits across four or more environments. In addition, the PGWC and DEC of the subset with low amylose content (AC) were 50% lower than those of others with intermediate or high AC [10]. Wx encodes GBSSI, the primary enzyme amylose synthesis, which has three major alleles, Wxa, Wxb and Wxin. Near-isogenic lines containing the Wxb allele had lower AC, PGWC and DEC than those with other alleles [19,20]. Decreased expression of OsSSIIa and OsSSIIIa resulted in a higher DEC [21]. Slender grains can significantly reduce chalkiness, since substances are transported by the dorsal vascular bundles of the glumes to the core and belly during grain filling; therefore, higher width grains are prone to insufficient grain filling because a longer nutrient transportation route results in a chalky area. Lots of evidence has been found indicating that some genes-related grain shape or size are involved chalkiness formation [22,23,24]. The gs3 mutant created by CRISPR/Cas9 produced long, slender grains, with lower chalkiness than that of the wild type; however, gs3gl3.1 double mutation had significant positive effects on the regulation of grain length and width, resulting in wider and longer grains with higher PGWC and DEC, while the combination of slender-grain hybrid rice caused by gs3 and gw8 mutations promoted endosperm development and improved appearance quality [23]. gl9, as a novel allele, with a 7-kb insertion in the second exon of GS9, increased grain yield and appearance quality simultaneously [24].
It is well-known that epistasis (the interaction between genes) plays an important role in the genetic determination of many quantitative traits in rice, such as grain weight, panicle size, chalkiness and so on [18,25,26,27]. Our previous study reported that allelic combinations between SSIIa and RMw513 revealed more variations in DEC [18]. OsSPL14 regulates grain size, and its downregulated plants showed a chalky endosperm, since the OsSPL14 and OsNF-YB9/YC8-12 subunits cooperate to enhance grain appearance quality by promoting Wx and PDIL1-1 expression in rice [28]. The above studies suggest that it is possible to improve grain yield and quality synergistically. Our previous study identified 29 marker–trait associations (MTA) for chalkiness, including 13 SNPs on starch synthesis genes (GBSSI, SSI, SSIIa, SSIV, BEIIb and PUL), 8, 3, 3 and 2 MTAs located on gene/QTLs for chalkiness, grain yield, grain shape and others, respectively [18]. More recently, studies investigating the effects and identification of different allele combinations of SSIIa and Wx have revealed significant variation in rice eating and cooking quality [29,30] and chalkiness [31]. Therefore, further investigation on the epistatic effects on chalkiness formation among those genes/QTLs might be essential to the design of efficient and effective gene pyramiding strategies for eliminating chalkiness in rice breeding.
The objectives of the present study were to investigate the effects of epistasis between markers for a set of known genes/QTLs for chalkiness; to study whether it is feasible to predict chalkiness using model equation generated by multiple regression analysis using significant markers and marker-pairs; and to test potential of model equation on low chalky rice breeding using marker assisted recurrent selection (MARS).
2. Materials and Methods
2.1. Plant Materials
The original MARS population for low chalkiness was developed using 16 parental lines, including 6461, HHZ 5-SAL 9-Y 3-Y 1, Weed tolerance rice, Yangdao 6, SAGC-6, FFZ1, IR 02A127, IR04A421, IR06A119, IR-BB57, PR 33282-B-8-1-1-1-1-1, OM6600, B11598C-TB-2-1-B-7, CT 16658-5-2-2SR-2-3-6MP, PAU-201 and ADRON 125. To avoid huge loads on manual crossing for population (next cycle) generation, all 16 lines as recurrent parents were backcrossed with IR36ms three times individually, and then BC3F1 (BC stands for backcross) plants with MSms were selected for selfing. 200 BC3F2 seeds of each backcross were collected and mixed completely. About 3000 seedlings were transplanted with a spacing distance of 0.2 × 0.2 m on 2019 at Lingshui, Hainan (LS). This area was isolated surround using 3 m high polyethylene film before heading. Seeds on male sterile plants were harvested individually and then mixed equally for next random pollination on 2019 at Hangzhou, Zhejiang (HZ). After three seasons of random pollination, 20 seeds on each male sterile plant with 80–95 cm in height were collected and mixed as original population (cycle 0, slefing 0, C0S0) All field experiments were conducted at experimental farm of Zhejiang A & F University, HZ and LS. Seedlings at 21 and 28 days after sowing were transplanted by 0.2 × 0.2 m space at HZ and LS, respectively. The nitrogen fertilizer dose was set at 225 kg/ha, which was applied at a ratio of 5:3:2 as basal, tillering, and panicle fertilizer, respectively. Phosphorus (80 kg/ha as P2O5) and potassium (50 kg/ha as KCl) were applied with nitrogen before transplanting as basal fertilizer. Other field management was performed according to local farming practices.
2.2. Phenotyping, Genotyping and Statistical Analysis
To avoid chalky grains breaking during milling, PGWC was determined manually using more than 100 dehulled grains with three replications. Dehulled grains and quartz sand were added to 10 mL centrifuge tubes and shaken until the aleurone layer was completely removed. DEC of polished grains were measured using a Cervitec Grain Inspector 1625 (Foss, Hilleroed, Denmark). Sequences, physical position, related gene or QTLs of markers used in study were shown on Tables S2–S5. PCR amplification was conducted in a 10 μL reaction mixture containing 50 ng template DNA, 0.5 μM of each primer, 200 μM of each dNTP, 1.5 μM MgCl2, 0.1% Triton X-100 and 1 U Taq polymerase and 1.0 μL of 10× PCR buffer under the following program: 5 min at 94 °C, followed by 30 cycles of 15 s at 94 °C, 15 s at 55 °C, and 30 s at 72 °C with a final extension of 5 min at 72 °C. PCR products were separated on 6% nondenaturing polyacrylamide gels and observed by the SYBR® Safe staining method. In the present study, rare marker alleles, occurring at a frequency of less than 5% among all the lines for any one marker were excluded from digenic epistatic analysis. Finally, 108 markers remained. To detect the presence of epistasis, a fixed effect model analysis was conducted for all the marker pairs. The model includes marker 1, marker 2 and the interaction between marker 1 and marker 2 as fixed effects. An interaction at the p < 0.01 level was regarded as significant and presented with “×” between marker pairs. Pairwise interaction analysis among 108 markers was conducted using R programming language. Stepwise multiple regression analysis was performed using SPSS 19.0 (SPSS Inc. Chicago, IL, USA) to develop prediction models for PGWC and DEC. The analysis utilized 29 molecular markers (marked with “*” on Tables S2–S5) that showed significant associations with chalkiness, as well as the marker pairs with significant interactions detected in Table 1. All SNPs of the alleles presented were marked with an underline to distinguish them from traits or genes.
Table 1.
Significant epistasis for DEC and PGWC detected using pairwise analysis.
2.3. Recurrent Selection Program
The procedure of recurrent selection applied in this study is illustrated in Figure S1. There were two RS programs conducted for low chalkiness germplasm enhancement, that is, phenotypic selection (PS) and MARS with prediction models, respectively. Each cycle has two growing seasons. In the first season, the C0S0 population was grown with around 10,000 plants, and then about 300 plants were selected based on breeder’s experience in plant architecture and yield traits. All selected plants were genotyped using markers in the prediction models, and PGWC was measured as well. For phenotypic selection, all plants were ranked from lowest to highest based on PGWC, and then 60 of 300 (20%) plants with relatively lower on PGWC were selected. About 200 seeds randomly sampled from each selected plant were mixed for random pollination to generate next cycle on next season. For prediction models selection, 60 of 300 (20%) plants with relatively lower predicted value of PGWC were selected using molecular models, and 200 seeds of each plant were mixed and planted for random pollination on next season. The same steps were conducted on following cycles. Random pollination season (C0S0, C1S0, C2S0 and C3S0) was grown at LS. Generation (C0S1, C1S1, C2S1 and C3S1) for PS and MARS was planted at HZ. Finaly, four cycles were carried out during 2020–2023. All selected plants were generation advanced using single seed descent. Advanced lines from C0, C1, C2 and C3 were grown in 2025 at Hangzhou; days to maturity (DTM), amylose content (AC) and PGWC were measured, respectively.
3. Results
3.1. Number of Marker-Pairs Involved in Bigenic Epistasis
A total of 30 and 39 marker pairs with significant bigenic epistasis were identified for PGWC and DEC respectively, 16 were commonly found in both traits (Table 1). Among them, only 13 and 11 interactions for PGWC and DEC were detected between markers with significant main effects at least in one environment [18]. In addition, 5 and 12 interactions for PGWC and DEC were found between markers without main effects. For 30 significant interactions of PGWC, 10 were between markers on/tightly linked to genes/QTLs for chalkiness and starch synthesis genes; seven were between markers related to chalkiness and grain yield; four were between markers both related to chalkiness; three were between markers for chalkiness and grain shapes; three were between markers related to starch synthesis genes and grain shapes; two were between grain shape and grain yield; one was between both markers on starch synthesis genes. For 39 significant interactions of DEC, 15 were between markers related to chalkiness and grain yield; nine were between markers on/for starch synthesis genes and chalkiness; five were between both markers related to chalkiness; five were between makers for chalkiness and grain shapes; five were between markers related to starch synthesis genes and grain shapes; four were between markers for grain shapes and grain yield; two were between both markers related to grain shapes; and one was between both markers on starch synthesis genes. A single pair of interaction explained only 1.78–5.91% of the phenotypic variation, which was relatively small.
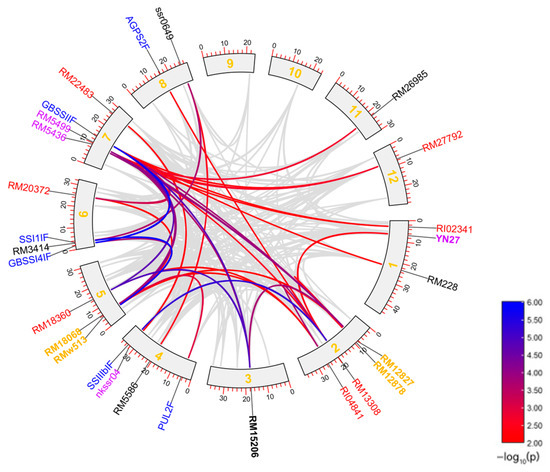
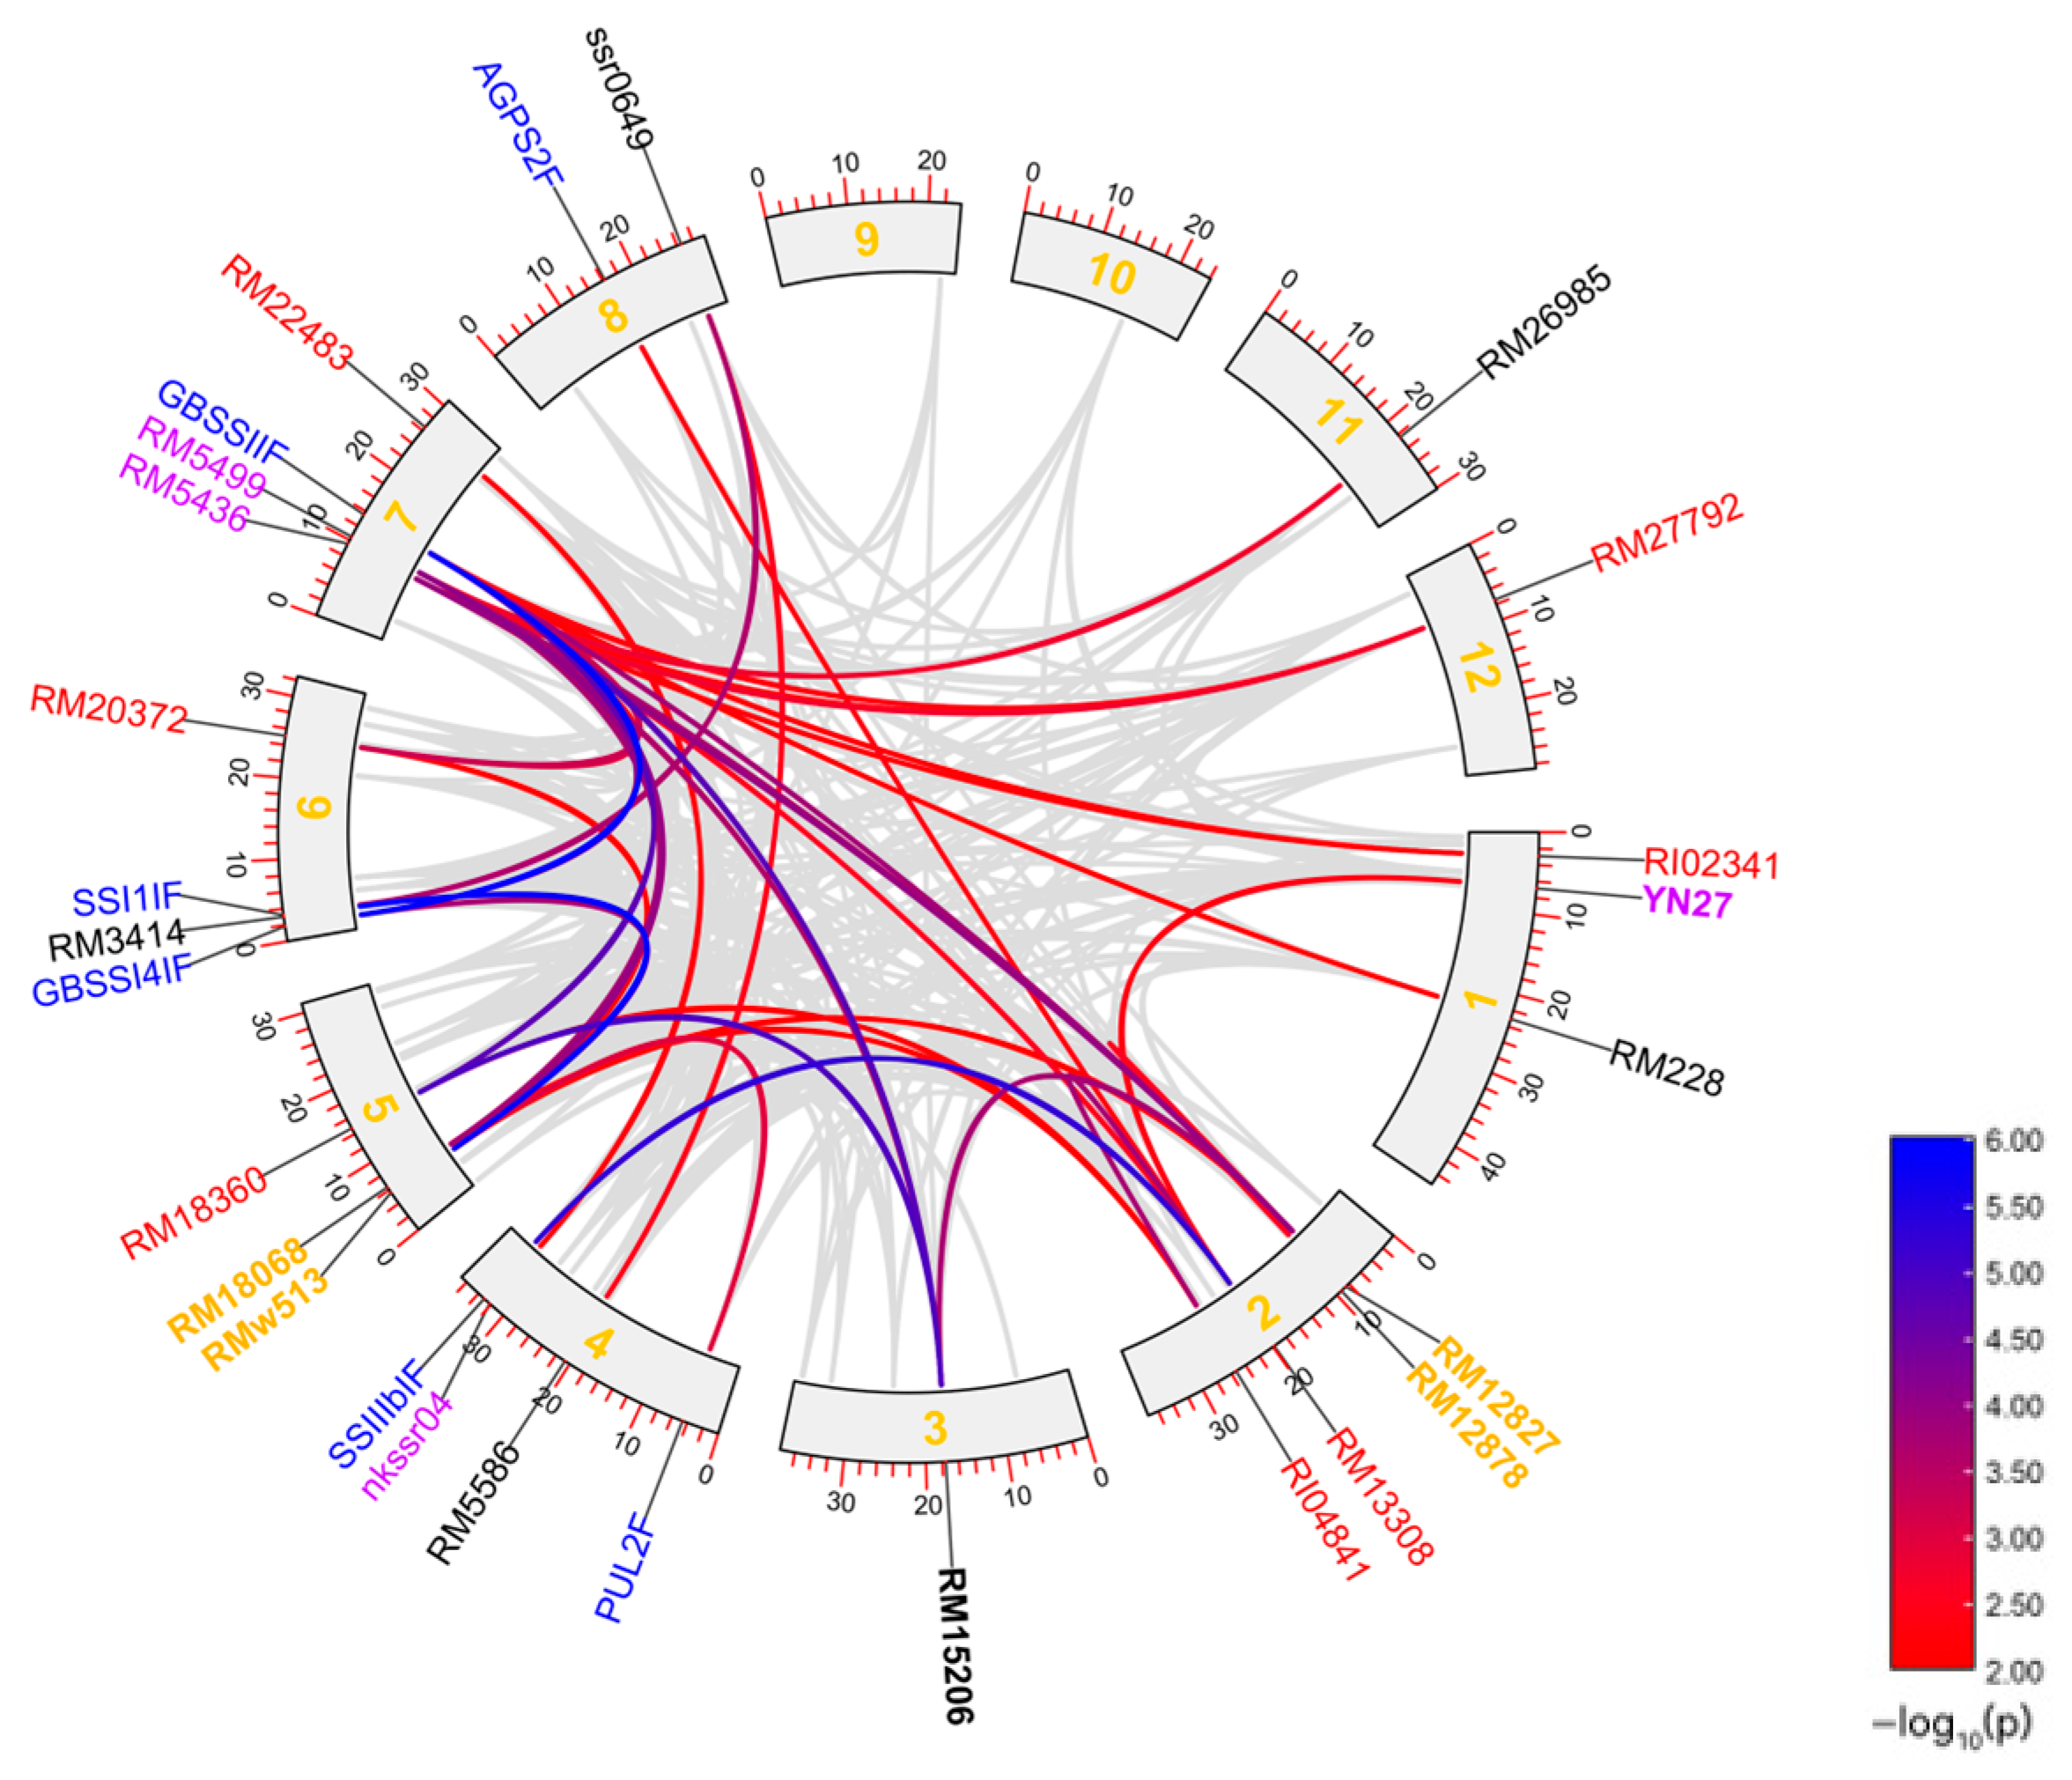
A total of 28 markers with significant interactions for DEC were detected, distributed on 10 chromosomes, except Chr 9 and Chr 10 (Figure 1). RM5499, a marker on Chr 7 closely linked to the grain yield trait, interacted significantly with 10 markers. GBSSIIF was involved in digenic epistasis with other nine markers. RMw513, a marker on Chr 5 related to chalkiness, grain width and grain weight, was involved in seven significant interactions. RM12827, a marker on Chr 2 related to chalkiness, grain width and grain weight, showed significant interactions with six markers. The above 4 markers contributed to 27 of the 39 major digenic epistasis interactions of DEC.
Figure 1.
Significant interactions detected among markers for DEC. The markers in blue are located on starch synthesis genes; the markers in red, purple and black are tightly linked to QTLs for chalkiness, grain yield and grain shape, respectively; the markers in bold are located on genes of grain shape or grain yield; the markers in yellow are tightly linked to QTLs associated with both grain shape and chalkiness. The numbers represent the length of chromosomes (Mb).
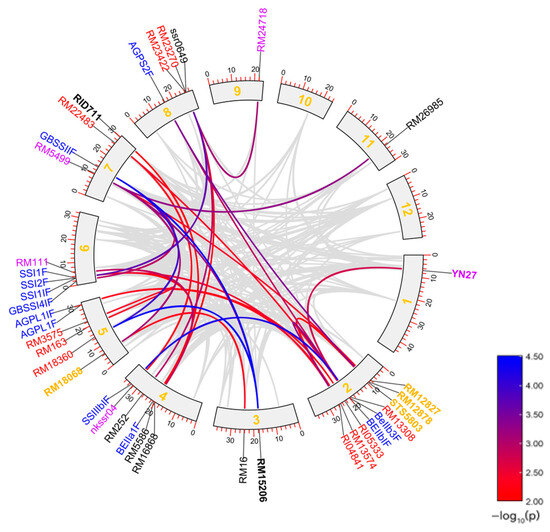
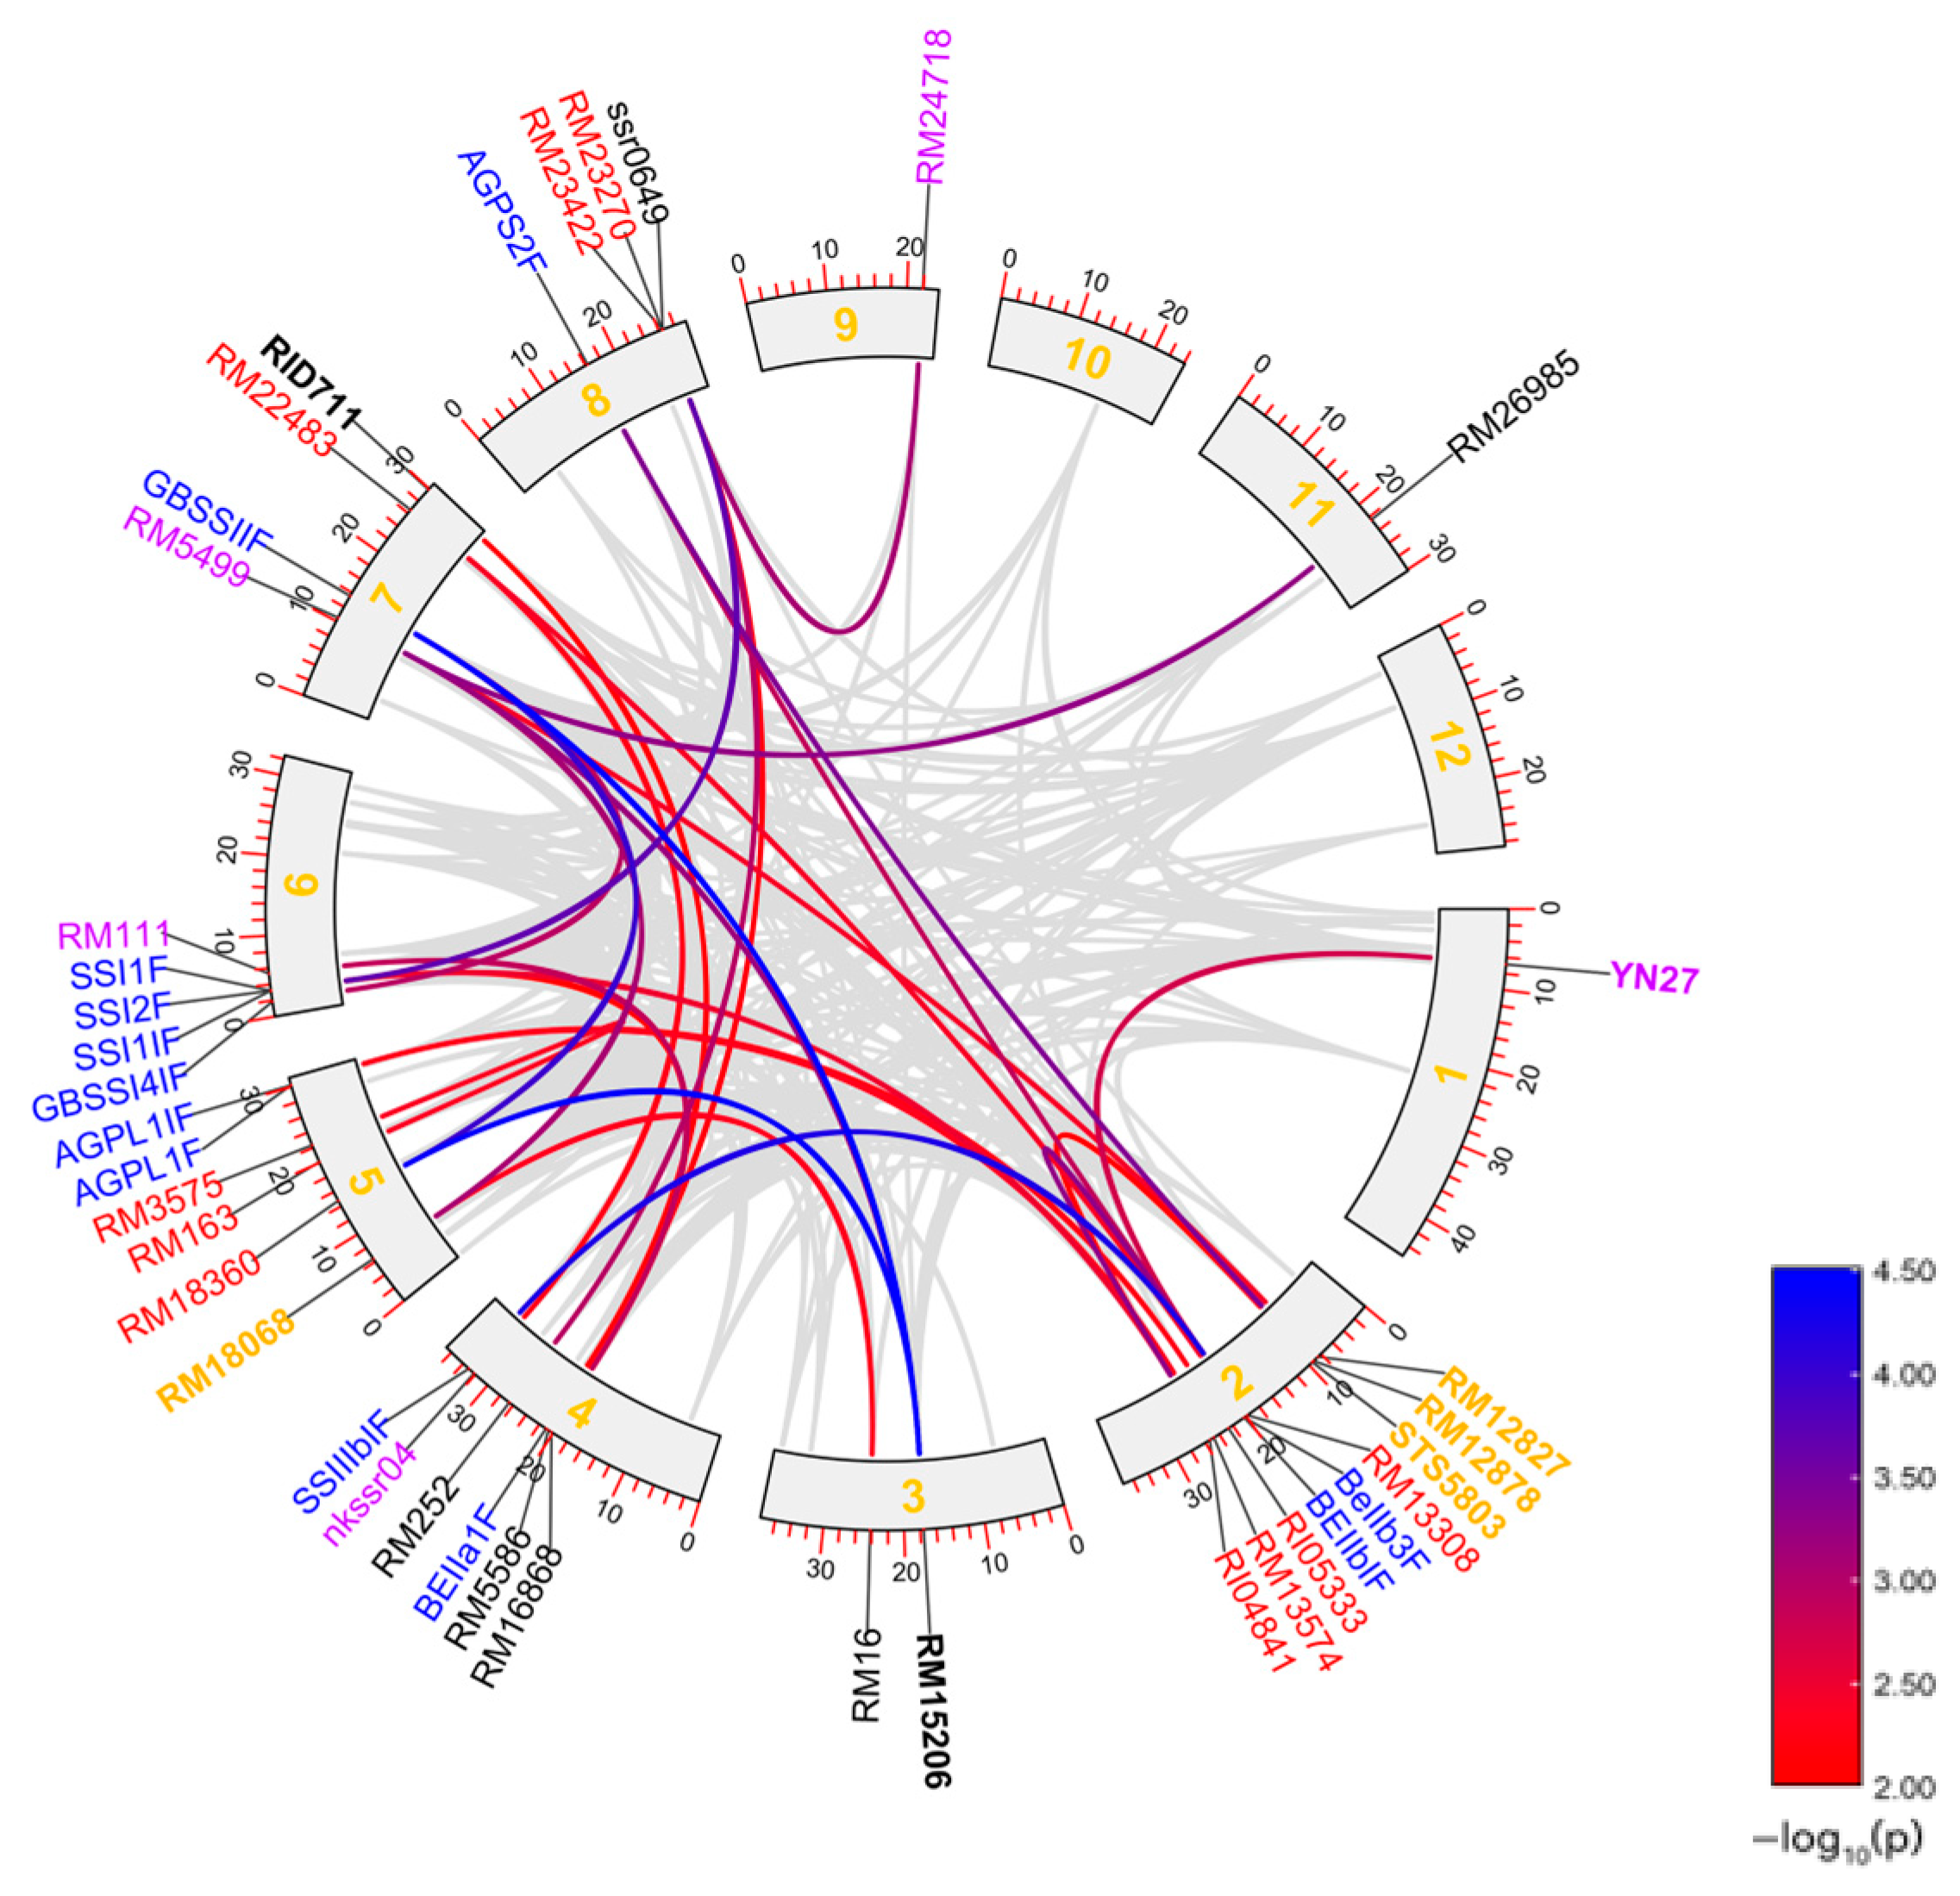
Unlike DEC, where most interactions were mainly concentrated on few markers, 40 markers were involved in 30 significant interactions for PGWC, distributed on 10 chromosomes except Chr 10 and Chr 12 (Figure 2). Four markers (RI04841, RM13308, RM16868 and RM5499) and four markers (SSIF, GBSSIIF, RM15206, RM22483) were involved in major epistatic interactions with other four and three markers, respectively. The remaining markers were involved only in 1 or 2 major interactions.
Figure 2.
Significant interactions detected among markers for PGWC. The markers in blue are located on starch synthesis genes; the markers in red, purple and black are tightly linked to the QTLs for chalkiness, grain yield and grain shape, respectively; the markers in bold are located on genes of grain shape or grain yield; the markers in yellow font are tightly linked to QTLs associated with both grain shape and chalkiness. The numbers represent the length of chromosomes (Mb).
3.2. Digenic Epistatic Effects
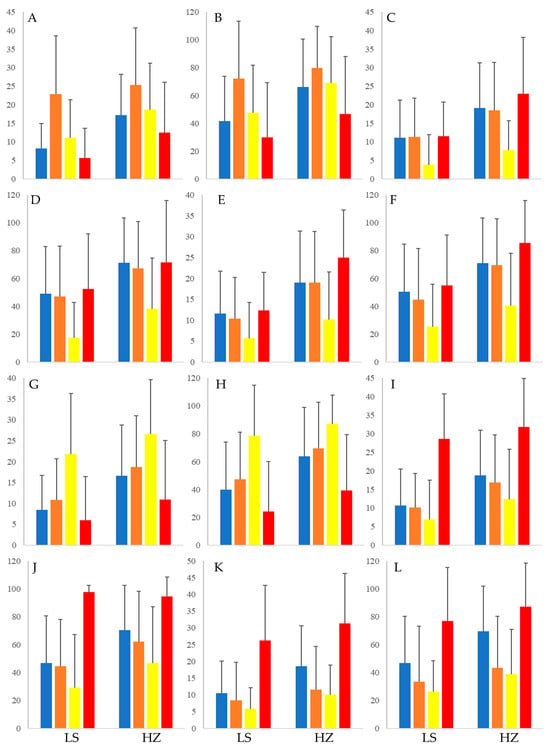
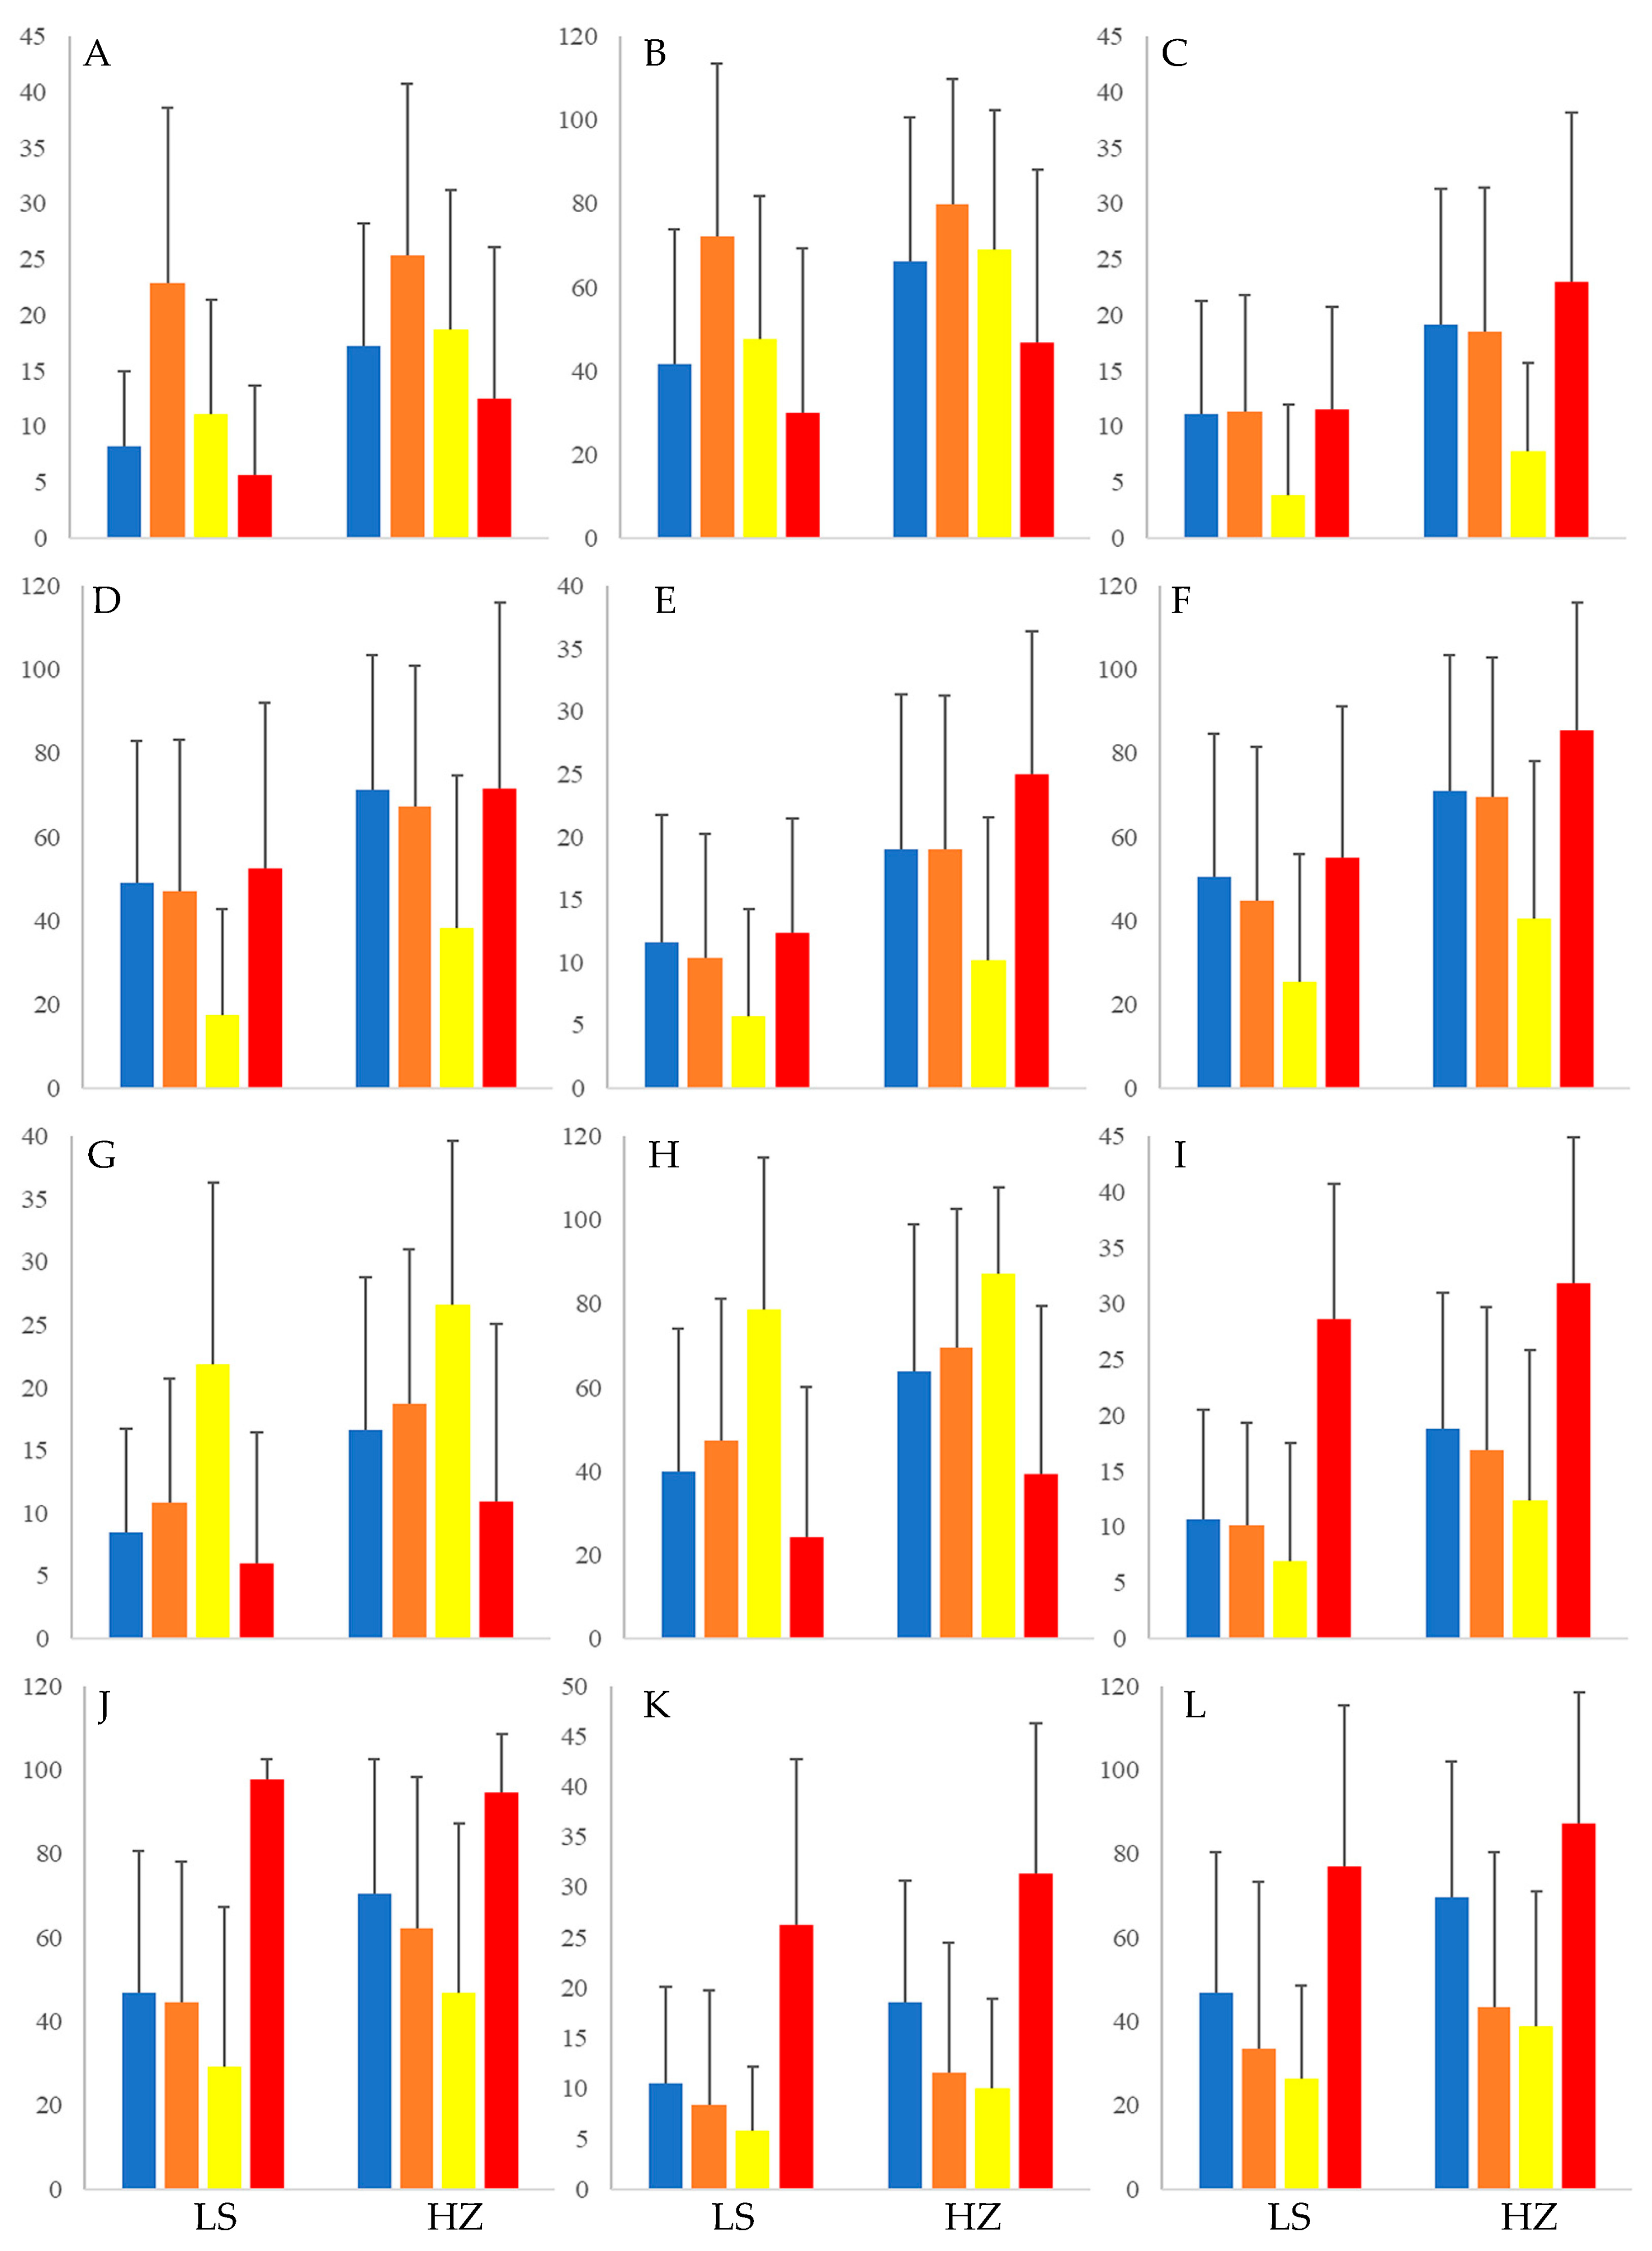
The effects of all significant interactions for PGWC and DEC are presented in Table S1. Generally speaking, the effects of each interaction were quite small, ranging from 1.78% to 5.91% for DEC and from 1.96% to 4.39% for PGWC, respectively. As a typical case of significant interactions between two starch synthesis genes, GBSSI4IF × GBSSIIF was detected for both DEC and PGWC and explained up to 5.91% of the phenotypic variance (Table 1). Both markers had two major genotypes. The DEC of four subsets based on allele combinations of these two markers were quite different, ranging from 5.63% to 22.91% and from 12.51% to 25.37% at LS and HZ, respectively (Table S1, Figure 3A). The subset of genotypes with GBSSI4IF Allele2 + GBSSIIF Allele2 had the lowest DEC in both environments, while GBSSI4IF Allele1 + GBSSIIF Allele2 had the highest DEC. The same trend as DEC was observed for PGWC (Table 2, Figure 3B).
Figure 3.
Effects of four allelic combinations between two makers. (A,C,E,G,I,K) represent interaction effects of six marker pairs on DEC (Y-axis %), namely GBSSI4IF × GBSSIIF, RI04841 × RM15937, RI04841 × RM13308, GBSSIIF × RM15206, GBSSIIF × RM18360, RM12827 × RM5499, respectively; (B,D,F,H,J,L) represent interaction effects of the same set of marker pairs on PGWC (Y-axis %). Error bars indicate the variance in PGWC or DEC of each subset according to allele combinations. LS and HZ represent Lingshui, Hainan and Hangzhou, Zhejiang, respectively (X-axis).
Table 2.
Multiple regression models using significant markers and marker pairs, and the associated adjusted R2 for three quality traits measured in six environments.
RI04841 is a marker associated with chalkiness, while RM15937 is associated with grain yield. The significant interaction between them explained 2.67% and 2.79% of the variance in DEC and PGWC, respectively (Table 1). On average, the DEC of the set based on RI04841 Allele2 +RM15937 Allele1 was 3.88%, while that of the other 3 sets was 3 times higher at LS. In another environment, the DEC of this set was 7.82% only; however that of the other three sets was higher than 18.46% on average. The PGWC of this set was 17.41% and 38.23% at LS and HZ respectively, while that of the others was higher than 47% and 67% on average at LS and HZ, respectively (Table S1, Figure 3C,D).
RM04841 and RM13308 were both linked to QTL or genes involved in chalkiness formation. Epistatic effects between them accounted for 3.66% and 3.29% of the phenotypic variance in DEC and PGWC, respectively (Table 1). The DEC of the set with RI04841 Allele2 and RM13308 Allele1 was 5.75% and 10.15% at LS and HZ, respectively, while that of the other sets was almost double. The effects on PGWC were quite similar to those on DEC. The PGWC of the set with RI04841 Allele2 and RM13308 Allele1 was 25.29% and 40.57% at LS and HZ, respectively, while that of the other combinations ranged from 44.75% to 54.99% and from 69.55% to 85.64% at LS and HZ, respectively (Table S1, Figure 3E,F).
The interaction between GBSSIIF and RM15206 explained 4.71% and 4.49% of the variation in DEC and PGWC. The former and latter markers were close to or on genes related to starch synthesis and grain shape, respectively (Table 1). The DEC of the set with GBSSIIF Allele2 and RM15206 Allele2 was 5.95% and 10.96% at LS and HZ, respectively. On the other hand, that of the set with GBSSIIF Allele2 and RM15206 Allele1 was the highest among the four subsets, 21.91% and 26.65% at LS and HZ, respectively. The PGWC of the set with GBSSIIF Allele2 and RM15206 Allele2 24.18% and 39.51% at LS and HZ, respectively. The set with GBSSIIF Allele2 and RM15206 Allele1 showed the highest PGWC in both environments, 78.60% and 87.23%, respectively (Table S1, Figure 3G,H).
A typical case of significant interaction between markers on/related starch synthesis genes and chalkiness formation was GBSSIIF and RM18360, which explained about 4.42% and 3.76% of variation in DEC and PGWC, respectively (Table 1). Among four subsets, the DEC of the set with GBSSIIF Allele2 and RM118360 Allele1 was lowest in both environments, 7.01% and 12.42%, respectively, while the set with GBSSIIF Allele2 and RM118360 Allele2 was the highest. A similar trend was observed in PGWC (Table S1, Figure 3I,J).
RM12827 and RM5499, markers related to grain shape and yield, respectively, explained about 3.89% and 2.51% of the variation in DEC and PGWC (Table 1). The set of RM12827 Allele2 and RM5499 Allele1 showed the lowest DEC and PGWC in both environments, while the set with RM12827 Allele2 and RM5499 Allele2 showed the highest (Table S1, Figure 3K,L).
3.3. Molecular Marker Prediction Models of PGWC and DEC
To avoid too many independent variables, only markers strongly associated with a trait detected by Zhao et al. and marker pair with significant interaction found in the present study were used in model prediction [18]. When pairwise interactions were not considered, the adjusted R2 of the best prediction models for DEC varied from 0.212 to 0.262 across two environments (Table 2). Genes SSIIa and GBSSI were common in the models. When digenic epistasis was considered, the adjusted R2 of the best prediction models for DEC varied from 0.365 to 0.427 (Table 2); that is, by taking digenic epistasis into account, R2 increased in both testing environments. Only markers on SSIIa were involved in the prediction models. The adjusted R2 of the best models for PGWC ranged from 0.258 to 0.340 when digenic epistasis was not considered, whereas it ranged from 0.529 to 0.738 when digenic epistasis was considered (Table 2). Markers on SSIIa, marker pairs of GBSSI and GBSSII were in the final models of both environments (Table 2). Markers on SSIIa were present in all eight models, although different markers were chosen in different environments or traits. GBSSI was included in seven models for chalkiness prediction, except for DEC at LS.
3.4. Effects of Marker-Assisted Recurrent Selection on Chalkiness
The C0S0 individuals derived from three rounds of random pollination using 16 parents were used as the testing population for recurrent selection to develop low-chalkiness germplasm. The average PGWC of 200 selected plants was 38.08% (Table 3). The PGWC of 30% individuals with the lowest PGWC ranged from 14.0% to 29.0%, 23.08% on average, which was significantly lower than that of the 30% individuals selected based on the predication model, ranging from 15.0% to 41.0%, 26.58% on average. The PGWC of the lowest 30% of selected plants based on C1S0 PS and MARS was 14.97% and 17.85%, respectively. In C2S0, the PGWC of MARS was 14.97% on average, which was still significantly higher than that of PS. Interestingly, there was no significant difference observed in C3S0; the PGWC of PS and MARS ranged from 6.0% to 17.0% and from 7.0% to 20.0%, with averages of 11.88% and 12.97%, respectively. A similar trend was observed for the PGWC of advanced lines. In the first two cycles, the PGWC of PS was significantly lower than that of MARS; however, the PGWC of PS and MASR was quite similar in C3, with averages of 12.64% and 12.84%, respectively.
Table 3.
Genetic gain in PGWC using phenotypic and marker-assisted recurrent selection.
4. Discussion
Consumers generally prefer rice with uniform shape and translucent endosperm, although preferences for eating quality characteristics vary across countries and regions [1,32]. Chalkiness refers to white, opaque areas, since starch granules in the chalky, opaque areas are loosely packed. Starch, including amylose and amylopectin, accounts for approximately 70–80% of dry matter in rice grains. Amylose is synthesized by AGPase (including four subunits, AGPL1, AGPS1, AGPS1 and AGPS2) and GBSSI while amylopectin is synthesized by the coordinated actions of AGPase, starch synthase, starch branching enzyme and starch debranching enzyme [33]. Therefore, it is not strange that some starch synthase genes are involved in chalkiness formation, since insufficient starch biosynthesis affects not only rice yield but grain quality. In the present study, 29 of 69 digenic interactions (epistasis) for DEC and PGWC were related to starch synthase genes such as GBSSI, GBSSII, AGPL1, AGPS2, BEII, SSI, SSIIIb and so on (Table 1). Among them, most were identified between starch synthase genes and markers linked to QTLs for chalkiness or grain size. GBSSII was not associated with chalkiness in this population [18]. It is interesting that GBSSII exhibited a high frequency of significant epistatic interactions with other markers, with nine and three interactions for DEC and PGWC, respectively. The interaction between GBSSI and GBSSII explained 5.91% and 2.92% of the variation in DEC and PGWC, respectively. In addition, markers for GS3 and GW5 were also found to be involved in epistasis with GBSSII in chalkiness formation. It is well known that GBSSII is responsible for the amylose biosynthesis in the chloroplast of leaves via fixing carbon by photosynthesis [34]. Foliar starch, known as transitory starch, affects not only plant growth but also grain quality, since it can be converted into sucrose and then transported into endosperm at night during the grain filling stage [35]. Overexpression of GBSSII, in the oslesv and osesv1 mutants, significantly increased the starch content in both leaves and endosperms and improved the grain weight and appearance qualities, although these phenotypic characteristics of the OE lines did not completely revert to wild-type levels [36]. In addition, the mutations of GBSSI created using CRISPR/Cas9 reduced, but did not abolish, GBSS activity in seeds due to partial compensation caused by the upregulation of GBSSII [37]. The above results suggested that GBSSII plays an important role in chalkiness by regulating the source–sink relationship. It is worth mentioning that pleiotropy of genes or markers showing epistasis in chalkiness formation was common. QTL mapping has revealed that epistasis plays an important role in the genetic control of chalkiness [15]. In the present study, of the major significant epistatic interactions for DEC and PGWC, 56 of 69 involved at least one marker related to a known QTL/gene for chalkiness. A total of 27 of the 69 significant interactions involved at least one marker related to grain shape or size. A total of 23 marker pairs were related to known QTLs of grain yield. These results implied that how to balance grain yield and appearance quality is a critical issue in modern rice breeding. Five significant interactions for DEC and PGWC involved at least one marker not in the regions with known QTLs, which indicated that epistasis between markers without main effects has long been seen as an important genetic basis for complex traits [15,26,27]. Although the interactions between genes with large main effects are more important in gene pyramiding, which is seen as one of the major MAS methods [38], the contributions of epistasis between the target genes and genes without main effects (background genes) should also not be neglected to achieve the expected results.
Recurrent selection has been wildly used in plant breeding for quantitative traits and has shown high efficiency [39,40,41]. Chalkiness is a complex trait not only affected by lots of QTLs or genes but also by environmental factors, cultivation and agronomic practices and physiological and metabolic processes during grain filling. The national standard for Grade 1 rice in China requires DEC to be less than 2% (GB/T 1354-2018 [42]); therefore, cultivars with Grade 1 rice are very difficult to develop, especially in hybrid rice, because of a narrowing genetic base. In the present study, each cycle has only two seasons, one for random pollination and another for single plant selection, which implies that genetic gain could be rapidly increased (Table 3). In the PS program, the PGWC of selected plants based on agronomic traits was decreased significantly, from 38.09% in C0S0 to 19.73% in C2S0; that is, PGWC was almost reduced by half in two years (Table 3). The improvement in PGWC might be attributed to accurate measurement and selection of this trait, a large scale of genetic recombination and the elimination of undesirable alleles for the next recurrent selection cycle [43,44,45]. Compared to PS, the genetic gain in PGWC of the MAS program was slower. The PGWC of MAS-selected plants was 29.76% in average, whereas that of PS was only 24.63%. However, the gap between PS and MAS was narrowed to 3.08% and 1.03% in C2S0 and C3S0, respectively. The difference in PGWC between the two methods was significant in C0S0, C1S0 and C2S0 as well. However, in C3S0, no significant difference was observed. In other words, phenotypic selection was more efficient at early stages of recurrent selection for low-chalkiness germplasm enhancement than MARS. After a few cycles, the genetic gain was similar. This may be mainly attributed to the higher selection accuracy of PS, since it was based directly on PGWC values. This value of each plant not only reflects the effects of the whole genome, but also includes the interaction between genes and the environment. However, there were only few markers considered at first; that is, the predicted value could not completely represent the actual value. In addition, chalkiness was highly susceptible to environmental factors, especially at the single-plant level [1,8,9,10].
This study found that both PS and MARS exhibited high efficiency in improving chalkiness. However, when other agronomic or quality traits of advanced lines were investigated, both methods showed limitations. For example, the days to maturity of advanced lines of C0S0 in PS were 133.65 d on average, which increased to 134.65 d in C3S0. However, that of MARS ranged from 131.72 d to 131.75 d; that is, the DTM under MAS was quite stable (Table 3). This indicates that there are more and more late-maturing plants selected cycle by cycle since delayed heading dates provide a greater chance to escape high-temperature stress during grain filling, thereby ultimately leading to lower chalkiness. The results above suggest that MAS has some advantages in low-chalkiness line development, since the influences of environmental conditions and cultural practices, especially during grain filling, could be overcome to a certain degree [8,9,10]. However, in the MAS program, using the prediction model, lines with intermediate AC and high AC disappeared after three cycles. It is not strange that GBSSI is involved in all molecular models for prediction (Table 2). The average AC of the G allele of the first intron/exon junction site of GBSSI was 24.32%, while that of the T allele was 16.75% [18]. On the other hand, the two alleles (C and A) of the sixth exon of GBSSI had a very similar AC (23.25 and 22.94%, respectively). The genotype G/C at these two loci had a higher AC than that of the G/A genotype. Therefore, the two loci of GBSSI were major contributors to AC, with the genotypes of G/A, G/C and T/A having, respectively, high, intermediate and low AC [46]. Some studies have reported that AC was associated with the formation of grain chalkiness [18,19,20,31,47]. We previously found that the low AC lines was lower in DEC than the lines with intermediate or high AC in the present population and a population of 239 indica varieties released in China [10,48]. Our findings in the present study provide a genetic explanation of the often-observed positive correlation between AC and chalkiness. AC, DEC and PGWC of the lines with the T allele of GBSSI1IF was significantly lower than those with the G allele. The above results suggest that GBSSI had pleiotropic effects (additive and epistasis) on AC and chalkiness, which caused low AC to exhibit the lowest chalkiness, while the genotype with intermediate AC had the highest chalkiness; therefore, almost no HAC or IAC plants remained after few cycles of MAS, since these two alleles were excluded during random recombination for the next cycle. Therefore, this might be the main reason why the frequency of the lines with a low AC increased from 48.33% in C0S0 to 71.67% in C3S0, while that of IAC and HAC decreased in the PS program (Table 3). Except for low chalkiness, preferences for eating quality characteristics vary across countries and regions. Grain shape, especially grain length and width significantly affected chalkiness [22,23,24]; therefore, MAS for these known genes, combined with visual selection for grain shape, could be a more efficient method for breeding low-chalkiness lines with acceptable eating quality (AC) and grain shape in rice.
5. Conclusions
This study explored the epistatic interactions between molecular markers associated with the percentage of grain white chalkiness (PGWC) and the degree of endosperm chalkiness (DEC) and evaluated the applicability of marker-assisted recurrent selection (MARS) for breeding rice with low chalkiness. GBSSI and SSIIa were consistently identified in optimal models, indicating their critical roles in regulating rice chalkiness. The incorporation of digenic epistatic effects significantly improved the adjusted coefficient of determination (R2) of the best predictive models across both experimental environments. Our results confirmed that MARS is an efficient strategy for reducing chalkiness and enhancing eating quality. Nevertheless, phenotypic selection may remain more effective for breeding rice varieties with intermediate or high amylose content.
Supplementary Materials
The following supporting information can be downloaded at: https://www.mdpi.com/article/10.3390/agronomy16080792/s1, Table S1: Average of DEC and PGWC of subsets based alleles combination of marker pairs of significant interactions in two environments. Table S2: Markers on starch synthesis genes. Table S3: Mapped QTLs or cloned genes for grain shape and yield components, marker information and references; Table S4: Mapped QTLs or cloned genes for chalkiness or related components, marker information and references; Table S5: Random selected markers for big gaps on chromosomes. Figure S1: Flowchart of recurrent selection.
Author Contributions
The experiments were conceived and designed by X.Z.; field experiments, W.G., L.F. and J.Q.; grain quality analysis, J.Q. and F.L.; data analysis, W.G., L.F. and X.W.; genotyping, W.G., L.F. and C.R.; writing—original draft preparation, W.G. and L.F.; writing—review and editing, X.Z.; supervision, X.Z.; project administration, X.Z. All authors have read and agreed to the published version of the manuscript.
Funding
This research was funded by Zhejiang Sannong Jiufang Science and Technology Collaboration Program (Funding No. 2023SNJF042, Zhejiang Provincial Department of Agriculture and Rural Affairs) and the Scientific Research Development Fund of Zhejiang A&F University (Funding No. 2022LFR126, Zhejiang A&F University).
Data Availability Statement
The data used and/or analyzed in this study are available from the corresponding author on reasonable request.
Conflicts of Interest
The authors declare no conflicts of interest.
Abbreviations
The following abbreviations are used in this manuscript:
| PGWC | Percentage of grain with chalkiness |
| DEC | Degree of endosperm chalkiness |
| AC | Amylose content |
| IAC | Intermediate amylose content |
| HAC | High amylose content |
| PS | Phenotypic selection |
| MARS | Marker assisted recurrent selection |
| HRY | Head rice yield |
| QTLs | Quantitative trait loci |
| PCR | Polymerase chain reaction |
| DTM | Days to maturity |
References
- Zhao, X.; Fitzgerald, M. Climate change: Implications for the yield of edible rice. PLoS ONE 2013, 8, e66218. [Google Scholar] [CrossRef] [Scilit]
- Ishimaru, T.; Horigane, A.K.; Ida, M.; Iwasawa, N.; Sanoh, Y.A.; Nakazono, M.; Nishizawa, N.K.; Masumura, T.; Kondo, M.; Yoshida, M. Formation of grain chalkiness and changes in water distribution in developing rice caryopses grown under high-temperature stress. J. Cereal Sci. 2009, 50, 166–174. [Google Scholar] [CrossRef] [Scilit]
- Zhao, D.; Zhang, C.; Li, Q.; Liu, Q. Genetic control of grain appearance quality in rice. Biotechnol. Adv. 2022, 60, 108014. [Google Scholar] [CrossRef] [Scilit] [PubMed]
- Wang, C.; Guo, W.; Hu, P.; Wei, X.; Tang, S.; Jiao, G. Differences of physicochemical properties between chalky and translucent parts of rice grains. Rice Sci. 2022, 29, 577–588. [Google Scholar] [CrossRef] [Scilit]
- Zhong, Y.; Qu, J.; Li, Z.; Tian, Y.; Zhu, F.; Blennow, A.; Liu, X. Rice starch multi-level structure and functional relationships. Carbohydr. Polym. 2022, 275, 118777. [Google Scholar] [CrossRef] [Scilit]
- Wu, B.; Yun, P.; Zhou, H.; Xia, D.; Gu, Y.; Li, P.; Yao, J.; Zhou, Z.; Chen, J.; Liu, R.; et al. Natural variation in WHITE-CORE RATE 1 regulates redox homeostasis in rice endosperm to affect grain quality. Plant Cell 2022, 34, 1912–1932. [Google Scholar] [CrossRef] [Scilit]
- Long, C.; Du, Y.; Zeng, M.; Deng, X.; Zhang, Z.; Liu, D.; Zeng, Y. Relationship betwwen chalkiness and the structural and physicochemical properties of rice starch at different nighttime temperatures during the early grain-filling stage. Foods 2024, 13, 1516. [Google Scholar] [CrossRef] [Scilit]
- Cooper, N.T.W.; Siebenmorgen, T.J.; Counce, P.A. Effects of nighttime temperature during kernel development on rice physicochemical properties. Cereal Chem. 2008, 85, 276–282. [Google Scholar] [CrossRef] [Scilit]
- Zhang, X.; Li, Y.; Dong, J.; Sun, Y.; Fu, H. Split application of potassium reduces rice chalkiness by regulationg starch accumulation prosecss under high temperatures. Agronomy 2025, 15, 116. [Google Scholar] [CrossRef] [Scilit]
- Zhou, L.; Liang, S.; Ponce, K.; Marundon, S.; Ye, G.; Zhao, X. Factors affecting head rice yield and chalkiness in indica rice. Field Crops Res. 2015, 172, 1–10. [Google Scholar] [CrossRef] [Scilit]
- He, P.; Li, S.G.; Qian, Q.; Ma, Y.Q.; Li, J.Z.; Wang, W.M.; Chen, Y.; Zhu, L.H. Genetic analysis of rice grain quality. Theor. Appl. Genet. 1999, 98, 502–508. [Google Scholar] [CrossRef] [Scilit]
- Tan, Y.F.; Xing, Y.Z.; Li, J.X.; Yu, S.B.; Xu, C.G.; Zhang, Q. Genetic bases of appearance quality of rice grains in Shanyou 63, an elite rice hybrid. Theor. Appl. Genet. 2000, 101, 823–829. [Google Scholar] [CrossRef] [Scilit]
- Wan, X.Y.; Wan, J.M.; Weng, J.F.; Jiang, L.; Bi, J.C.; Wang, C.M.; Zhai, H.Q. Stability of QTLs for rice grain dimension and endosperm chalkiness characteristics across eight environments. Theor. Appl. Genet. 2005, 110, 1334–1346. [Google Scholar] [CrossRef] [Scilit] [PubMed]
- Guo, T.; Liu, X.; Wan, X.; Weng, J.; Liu, S.; Liu, X.; Chen, M.; Li, J.; Su, N.; Wu, F.; et al. Identification of a stable quantitative trait locus for percentage grains with white chalkiness in rice (Oryza sativa L.). J. Integr. Plant Biol. 2011, 53, 598–607. [Google Scholar] [CrossRef] [Scilit]
- Zhao, X.; Daygon, V.D.; McNally, K.L.; Hamilton, R.S.; Xie, F.; Reinke, R.F.; FItzgerald, M.A. Identification of stable QTLs causing chalk in rice grains in nine environments. Theor. Appl. Genet. 2016, 129, 141–153. [Google Scholar] [CrossRef] [Scilit]
- Chen, L.; Li, X.; Zheng, M.; Hu, R.; Dong, J.; Zhou, L.; Liu, W.; Liu, D.; Yang, W. Genes controlling frain chalkiness in rice. Crop J. 2024, 12, 979–991. [Google Scholar] [CrossRef] [Scilit]
- Kharabian-Masouleh, A.; Waters, D.L.; Reinke, R.F.; Ward, R.; Henry, R.J. SNP in starch biosynthesis genes associated with nutritional and functional properties of rice. Sci. Rep. 2012, 2, 557. [Google Scholar] [CrossRef] [Scilit]
- Zhao, X.; Zhou, L.; Ponce, K.; Ye, G. The usefulness of known genes/QTLs for grain quality traits in an indica population of diverse breeding lines tested using association analysis. Rice 2015, 8, 29. [Google Scholar] [CrossRef] [Scilit]
- Li, J.L.; Zhang, C.; Luo, X.; Zhang, T.; Zhang, X.Y.; Liu, P.; Yang, W.; Lei, Y.K.; Tang, S.W.; Kang, L.Z.; et al. Fine mapping of the grain chalkiness quantitative trait locus qCGP6 reveals the involvement of Wx in grain chalkiness formation. J. Exp. Bot. 2023, 74, 3544–3559. [Google Scholar] [CrossRef] [Scilit]
- Yang, Y.; Zhou, L.; Feng, L.; Jiang, J.; Huang, L.; Liu, Q.; Zhang, Y.; Zhang, C.; Liu, Q. Deciphering the role of Waxy gene mutations in enhancing rice grain quality. Foods 2024, 13, 1624. [Google Scholar] [CrossRef] [Scilit]
- Zhang, G.Y.; Cheng, Z.J.; Zhang, X.; Guo, X.P.; Su, N.; Jiang, L.; Mao, L.; Wan, J.M. Double repression of soluble starch synthase genes SSIIa and SSIIIa in rice (Oryza sativa L.) uncovers interactive effects on the physicochemical properties of starch. Genome 2011, 54, 448–459. [Google Scholar] [CrossRef] [Scilit] [PubMed]
- Huang, J.; Chen, W.; Gao, L.; Qing, D.; Pan, Y.; Zhou, W.; Wu, H.; Li, J.; Ma, C.; Chu, C.; et al. Rapid improvement of grain appearance in three-line hybrid rice via CRISPR/Cas9 editing of grain size genes. Theor. Appl. Genet. 2024, 137, 173. [Google Scholar] [CrossRef] [Scilit] [PubMed]
- Chen, Y.Y.; Zhu, A.; Xue, P.; Wen, X.X.; Cao, Y.R.; Wang, B.F.; Zhang, Y.; Shah, L.; Cheng, S.H.; Cao, L.Y.; et al. Effects of GS3 and GL3.1 for grain size editing by CRISPR/Cas9 in rice. Rice Sci. 2020, 27, 405–413. [Google Scholar] [CrossRef] [Scilit]
- Lin, S.; Liu, Z.; Zhang, K.; Yang, W.; Zhan, P.; Tan, Q.; Gou, Y.; Ma, S.; Luan, X.; Huang, C.; et al. GL9 from Oryza glumaepatula controls grain size and chalkiness in rice. Crop J. 2023, 11, 198–207. [Google Scholar] [CrossRef] [Scilit]
- Jin, F.; Ji, S.; Xie, X.; Kang, J.; Ju, H.; Ahn, S. Detection of epistatic interaction of two QTLs, gw8.1 and gw9.1, underlying grain weight using nearly isogenic lines in rice. Breed. Sci. 2011, 61, 69–75. [Google Scholar] [CrossRef] [Scilit]
- Mei, H.W.; Xu, J.L.; Li, Z.K.; Yu, X.Q.; Guo, L.B.; Wang, Y.P.; Ying, C.S.; Luo, L.J. QTLs influencing panicle size detected in two reciprocal introgressive line (IL) populations in rice (Oryza sativa L.). Theor. Appl. Genet. 2006, 112, 648–656. [Google Scholar] [CrossRef] [Scilit]
- Li, Z.; Pinson, S.R.M.; Park, W.D.; Paterson, A.H.; Stansel, J.W. Epistasis for three grain yield components in rice (Oryza sativa L.). Genetics 1997, 145, 453–465. [Google Scholar] [CrossRef] [Scilit]
- Li, Y.; Guo, X.; Song, J.; Xu, K.; Qin, T.; Zhang, X.; Song, Z.; He, Y.; Zhang, B.; Zhang, H.; et al. OsSPL14 and OsNF-YB9/YC8-12 subunits cooperate to enhance grain appearance quality through promoting Waxy and PDIL1-1 expression in rice. Plant Commu. 2025, 6, 101348. [Google Scholar] [CrossRef] [Scilit]
- Zhang, S.; Fu, A.; Guo, M.; Li, J.; Tan, Z.; Guo, T.; Zhou, H.; Yang, G. Effect and identification of different allele combinations of SSIIa and Wx on rice eating and cooking quality. Euphytica 2024, 220, 63. [Google Scholar] [CrossRef] [Scilit]
- Peng, Y.; Li, Y.; Zhang, L.; Yu, J.; Pan, J.; Deng, B.; Bao, J. Effect of allelic variations in Wx and SSIIa on rice cooking and eating quality. Int. J. Mol. Sci. 2026, 27, 2588. [Google Scholar] [CrossRef] [Scilit]
- Hao, Y.; Xu, J.; Wu, M.; Zhu, Y.; Song, J.; Han, Y.; Li, C.; Huang, F. The Wx/SSIIa and GS3/GW7 alleles, both iIndividually and in combination, can significantly distinguish rice germplasm quality. Int. J. Mol. Sci. 2025, 26, 6726. [Google Scholar] [CrossRef] [Scilit] [PubMed]
- Calingacion, M.; Laborte, A.; Nelson, A.; Resurreccion, A.; Concepcion, J.C.; Daygon, V.D.; Mumm, R.; Reinke, R.; Dipti, S.; Bassinello, P.Z.; et al. Diversity of global rice markets and the science required for consumer-targeted rice breeding. PLoS ONE 2014, 9, e85106. [Google Scholar] [CrossRef] [Scilit] [PubMed]
- Ohdan, T.; Francisco, P.B.; Sawada, T.; Hirose, T.; Terao, T.; Satoh, H.; Nakamura, Y. Expression profiling of genes involved in starch synthesis in sink and source organs of rice. J. Exp. Bot. 2005, 56, 3229–3244. [Google Scholar] [CrossRef] [Scilit] [PubMed]
- Vrinten, P.L.; Nakamura, T. Wheat granule-boundstarch synthase I and II are encoded by separate genesthat are expressed in different tissues. Plant Physiol. 2000, 122, 255–264. [Google Scholar] [CrossRef] [Scilit]
- Scofield, G.N.; Ruuska, S.A.; Aoki, N.; Lewis, D.C.; Tabe, L.M.; Jenkins, C.L.D. Starch storage in the stems of wheat plants: Localization and temporal changes. Ann. Bot. 2009, 103, 859–868. [Google Scholar] [CrossRef] [Scilit]
- Dong, N.; Jiao, G.; Cao, J.; Li, S.; Zhao, S.; Duan, Y.; Ma, L.; Li, X.; Lu, F.; Wang, H.; et al. OsLESV and OsESV1 promote transitory and storage starch biosynthesis to determine rice grain quality and yield. Plant Commu. 2024, 5, 100893. [Google Scholar] [CrossRef] [Scilit]
- Pérez, L.; Soto, E.; Farré, G.; Juanos, J.; Villorbina, G.; Bassie, L.; Medina, V.; Serrato, A.J.; Sahrawy, M.; Rojas, J.A.; et al. CRISPR/Cas9 mutations in the rice Waxy/GBSSI gene induce allele specific and zygosity-dependent feedback effects on endosperm starch biosynthesis. Plant Cell Rep. 2019, 38, 417–433. [Google Scholar] [CrossRef] [Scilit]
- Ye, G.; Smith, K.F. Marker-assisted gene pyramiding for cultivar development. Plant Breed. Rev. 2010, 33, 219–256. [Google Scholar]
- Júnior, O.P.M.; Breseghello, F.; Duarte, J.B.; Morais, O.P.; Rangel, P.H.N.; Coelho, A.S.G. Effectiveness of recurrent selection in irrigated rice breeding. Crop Sci. 2017, 57, 3043–3058. [Google Scholar] [CrossRef] [Scilit]
- Rangel, P.H.N.; Brondani, C.; Morais, O.P.; Schiochett, M.; Borba, T.C.O.; Rangel, P.N. Establishment of the irrigated rice cultivar SCSBRS Tio Taka by recurrent selection. Crop Breed. Appl. Biotechnol. 2007, 7, 103–110. [Google Scholar] [CrossRef] [Scilit]
- Júnior, O.P.M.; Breseghello, F.; Duarte, J.B.; Coelho, A.S.G.; Borba, T.C.O.; Aguiar, J.T.; Neves, P.C.F.; Morais, O.P. Assessing predicaiton models for different traits in a rice populaiton dericed from a recurrent slection program. Crop Sci. 2018, 58, 2348–2359. [Google Scholar]
- GB/T 1354-2018; Milled Rice, State Administration for Market Regulation. Standardization Administration of the People’s Republic of China: Beijing, China, 2018.
- Müller, D.; Schopp, P.; Melchinger, A.E. Persistency of prediction accuracy and genetic gain in synthetic populations under recurrent genomic selection. G3 2017, 7, 801–811. [Google Scholar] [CrossRef] [Scilit]
- Spindel, J.; Begum, H.; Akdemir, D.; Virk, P.; Collard, B.; Redoña, E.; Atlin, G.; Jannink, J.; McCouch, S.R. Genomic selection and association mapping in rice (Oryza sativa): Effect of trait genetic architecture, training population, composition, marker number and statistical model on accuracy of rice genomic selection in elite, tropical rice breeding lines. PLoS Genet. 2015, 11, e1004982. [Google Scholar]
- Breseghello, F.; Coelho, A.S.G. Traditional and modern plant breeding methods with examples in rice (Oryza sativa L.). J. Agric. Food Chem. 2013, 61, 8277–8286. [Google Scholar] [CrossRef] [Scilit]
- Chen, M.-H.; Bergman, C.J.; Pinson, S.R.M.; Fjellstrom, R.G. Waxy gene haplotypes: Associations with pasting properties in an international rice germplasm collection. J. Cereal Sci. 2008, 48, 781–788. [Google Scholar] [CrossRef] [Scilit]
- Cai, H.; Xie, W.; Lian, X. Comparative analysis of differentially expressed genes in rice under nitrogen and phosphorus starvation stress conditions. Plant Mol. Biol. Rep. 2013, 31, 160–173. [Google Scholar] [CrossRef] [Scilit]
- Zhou, L.; Sheng, W.; Wu, J.; Deng, Q.; Zhao, X. Analysis on grain quality traits of the national authorized indica hybrid rice varieties during 2003~2013. Hybrid Rice 2015, 30, 76–80. [Google Scholar]

Disclaimer/Publisher’s Note: The statements, opinions and data contained in all publications are solely those of the individual author(s) and contributor(s) and not of MDPI and/or the editor(s). MDPI and/or the editor(s) disclaim responsibility for any injury to people or property resulting from any ideas, methods, instructions or products referred to in the content. |
© 2026 by the authors. Licensee MDPI, Basel, Switzerland. This article is an open access article distributed under the terms and conditions of the Creative Commons Attribution (CC BY) license.