


Abstract
Long-term continuous cropping in cotton fields of Southern Xinjiang has limited crop productivity. To investigate how subsoiling depth regulates ecosystem-level water partitioning and thereby enhances water productivity mechanisms, a two-year field experiment was conducted in a mulched drip irrigation cotton field in Southern Xinjiang. Using a non-subsoiled field in the current season (CT) as the control, three subsoiling depths were established: subsoiling at 30 cm (ST1), 40 cm (ST2), and 50 cm (ST3). Changes in evapotranspiration partitioning and water use efficiency were analyzed. The results showed that subsoiling enhanced the utilization of deep soil water. Compared with CT, the ST2 and ST3 treatments significantly reduced soil water storage in the 0–60 cm layer during the flower opening to boll-setting stages, while soil water consumption increased by 26.4 mm and 28.8 mm, respectively. We demonstrate that subsoiling depth exerts a predominant control on the partitioning of evapotranspiration. Increasing subsoiling depth systematically shifted water loss from non-productive soil evaporation to productive plant transpiration, with the ST2 and ST3 treatments decreasing seasonal soil evaporation by 24.1% and 25.1%, respectively, and increasing plant transpiration by 21.9% and 22.8%, and lowering the Es/ET (where Es is soil evaporation and ET is evapotranspiration) ratio by 22.1% and 27.1%. However, this maximal physiological water-saving did not yield the optimal agronomic return. We established a non-linear relationship in which the ST2 treatment uniquely achieved the maximum seed cotton yield, WUE (water use efficiency), and IWUE (irrigation water use efficiency) (increasing by up to 34.4%, 17.2%, and 23.4%, respectively). This optimal depth better balances water resource allocation and reproductive growth. We conclude that under sandy loam soil conditions in typical mulched drip-irrigated cotton areas of Southern Xinjiang, implementing an optimal subsoiling depth (40 cm) can engineer a more resilient soil–plant–water continuum, providing a feasible pathway toward enhancing water and crop production sustainability.
1. Introduction
Global agriculture faces the paramount challenge of producing more food and fiber for a growing population under the escalating constraints of water scarcity and climate change [1,2,3,4]. This challenge is particularly acute in arid and semi-arid regions, where crop production is heavily dependent on irrigation, placing immense pressure on limited freshwater resources [5]. In Northwest China, a vast arid region, oasis agriculture sustains cotton (Gossypium hirsutum L.) as a critical economic crop [6,7,8]. Here, the mulching drip irrigation system has been widely adopted as a water-saving technology, effectively conserving soil moisture and suppressing weeds [9,10,11]. However, long-term conventional tillage under this system often leads to the formation of a hardpan or plow layer, which impedes root penetration, limits deep soil water access, and can exacerbate soil degradation [12,13,14].
In this context, subsoiling has emerged as a promising management practice to break the hardpan, improve soil structure, and enhance water infiltration [15,16,17,18]. By alleviating soil compaction, subsoiling can potentially foster deeper root systems, allowing crops to access water from deeper soil profiles and better withstand periods of peak water demand [19,20]. The fundamental premise is that this altered root zone hydrology can optimize the partitioning of evapotranspiration (ET), the primary pathway of water loss in agroecosystems [21,22,23,24]. ET consists of two distinct components: unproductive soil evaporation (Es) and productive plant transpiration (Tp) [25], which is directly linked to carbon assimilation and biomass production [26,27]. In water-limited environments, the ultimate goal of water management is to minimize Es while maximizing Tp, thereby enhancing overall water use efficiency (WUE) [28,29,30].
While the general benefits of subsoiling on soil properties and crop yield are recognized [16,19], a critical and understudied aspect is the precise role of subsoiling depth. The depth of soil disruption is likely a key determinant of the ensuing hydrological and physiological responses. Deeper subsoiling may facilitate greater root exploration and water extraction from deeper layers [31,32], but it may also represent an unnecessary energy input or even lead to excessive vegetative growth at the expense of reproductive yield [33,34]. Crucially, the mechanistic link between subsoiling depth, the dynamic partitioning of ET into Es and Tp throughout the growing season, and the resulting impact on yield and WUE in a mulching drip irrigation system remains quantitatively unclear. Most previous studies have treated ET as a monolithic flux, potentially failing to dissect its components to reveal the true physiological mechanism behind WUE improvements.
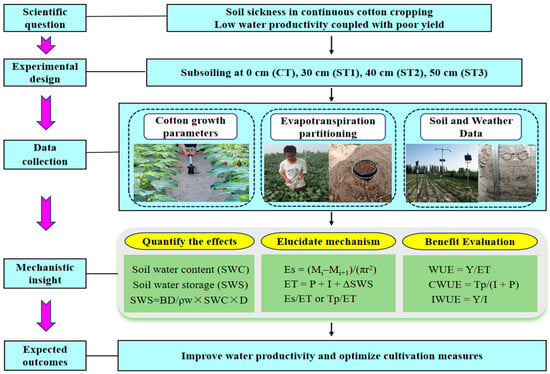
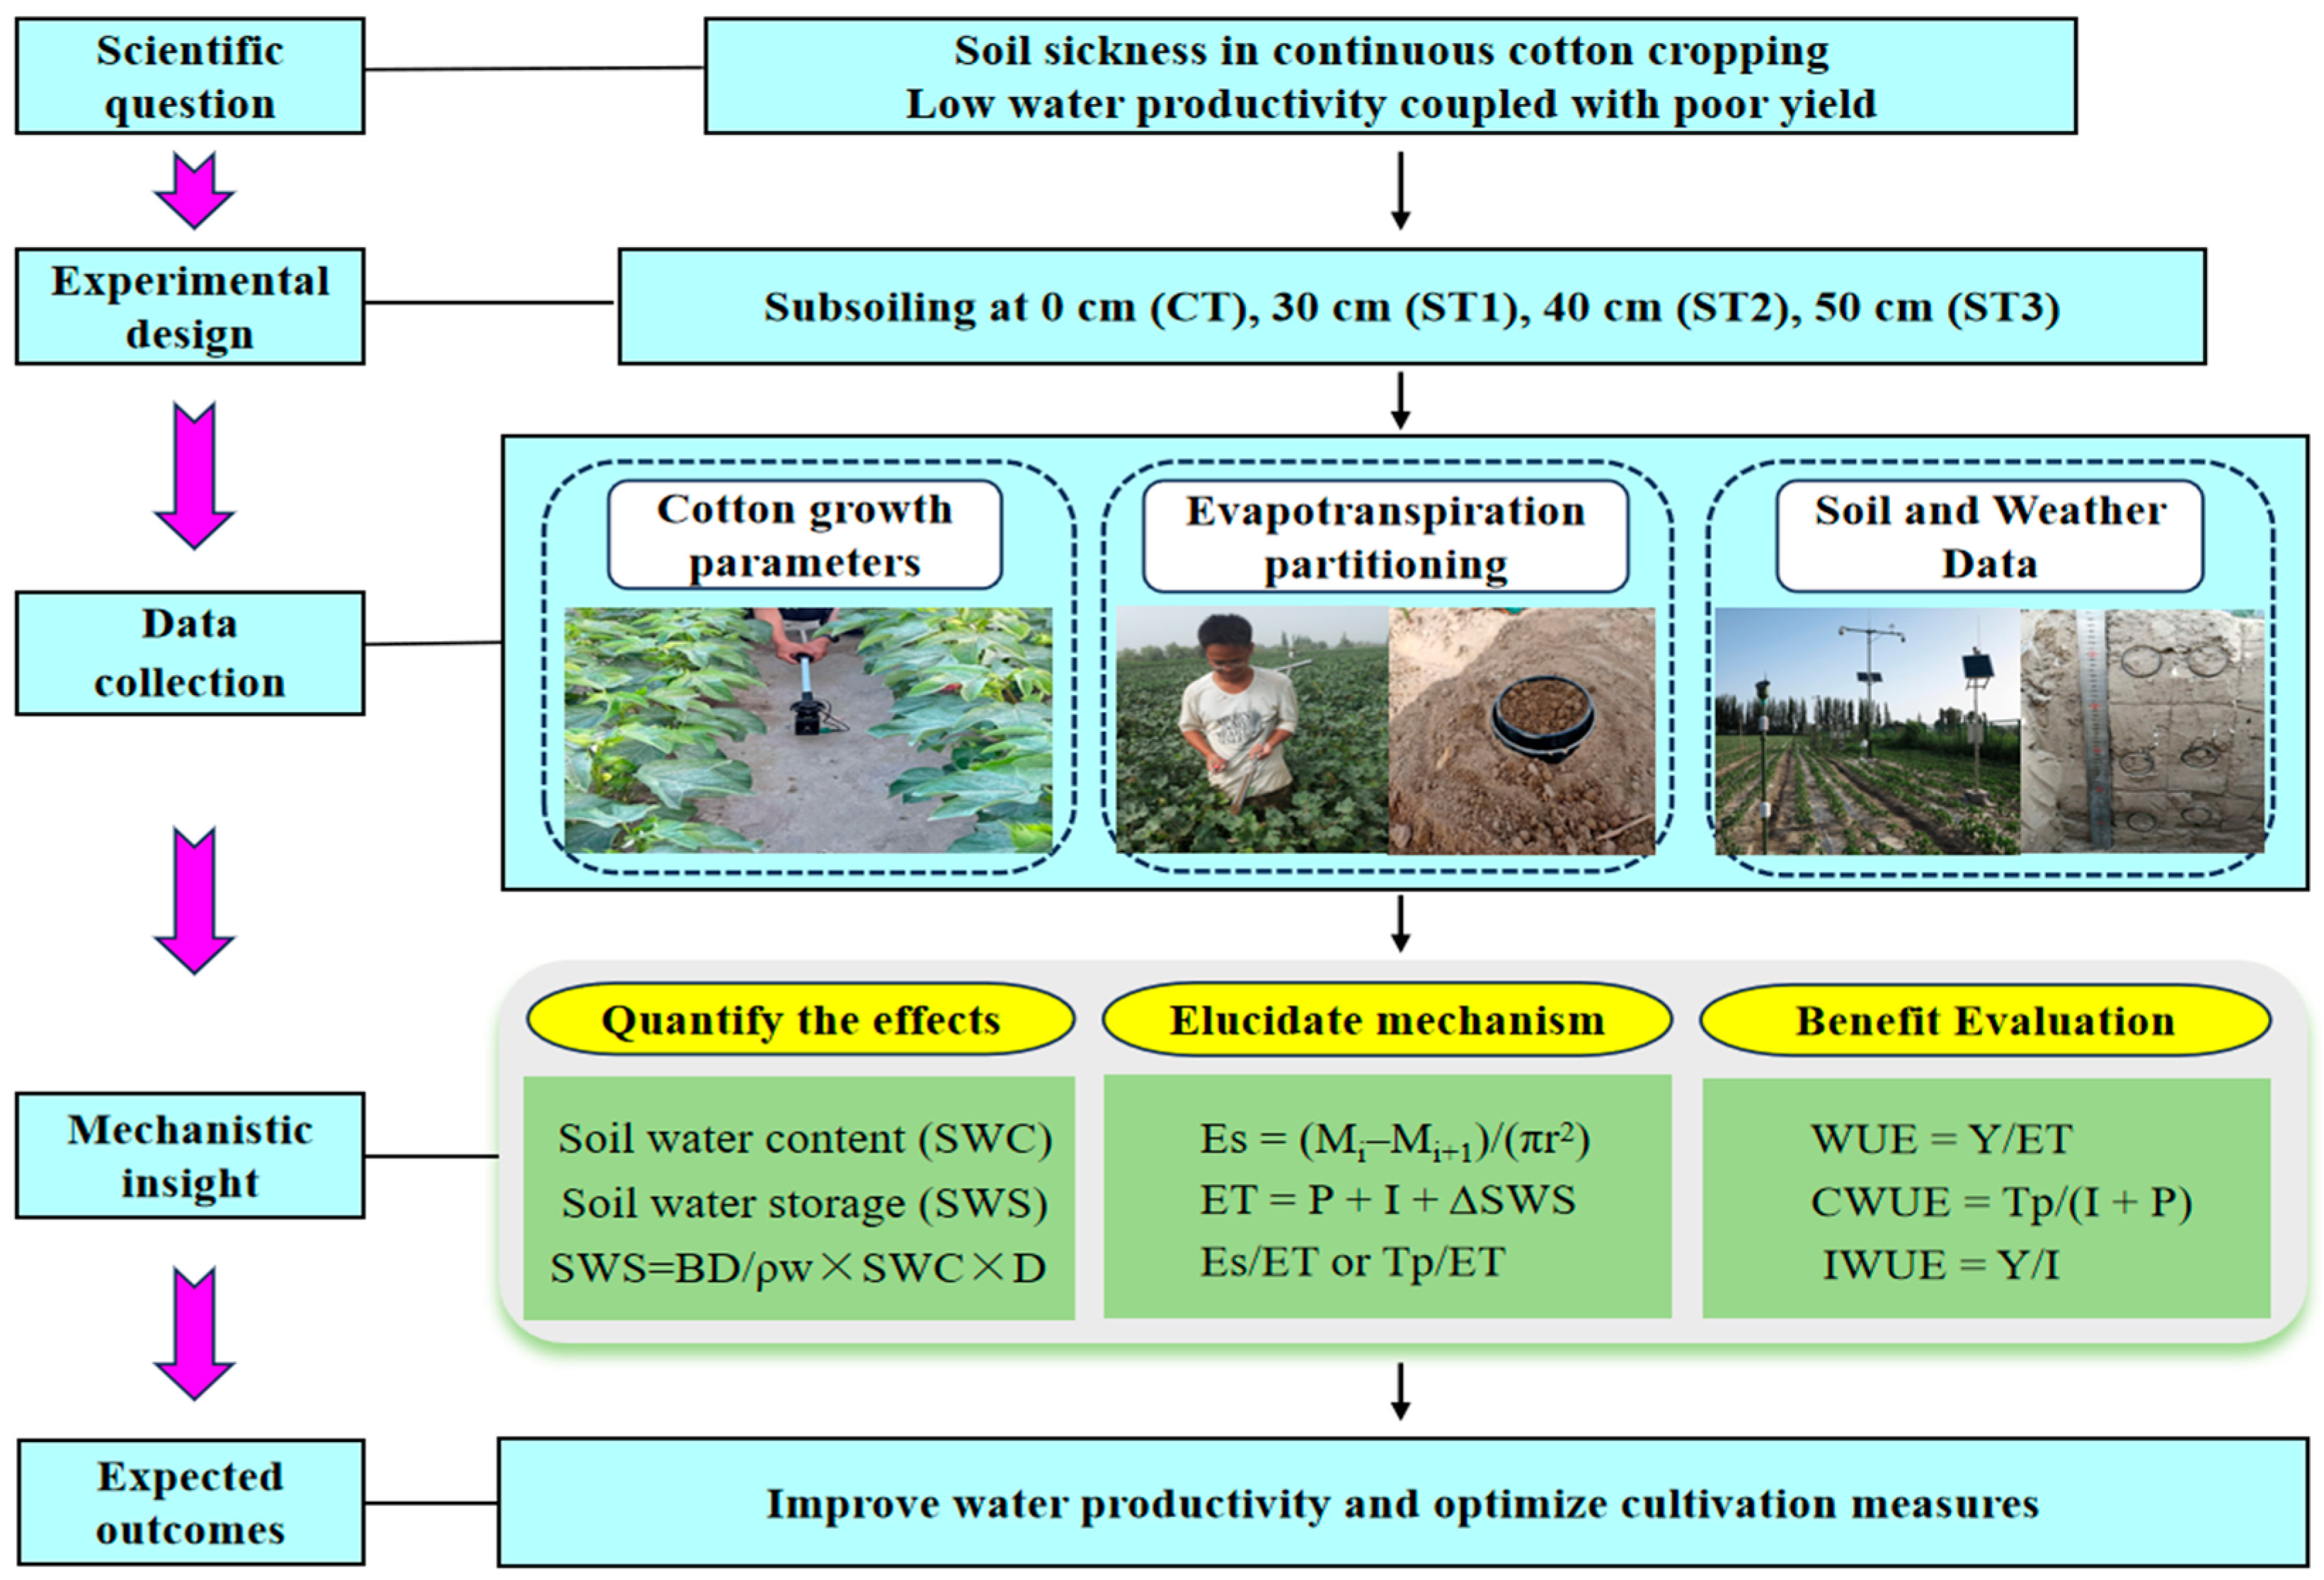
Based on the aforementioned considerations, we hypothesized that increasing sub-soiling depth would shift seasonal evapotranspiration partitioning from non-productive soil evaporation (Es) towards productive plant transpiration (Tp). And, this shift would enhance overall WUE, but the relationship between subsoiling depth and agronomic performance (yield, WUE) would be optimized at a specific depth, reflecting a balance between improved water access and the metabolic cost of root system development. To test these hypotheses, a two-year field experiment was conducted with the following specific objectives: (1) to quantify the effects of different subsoiling depths (30, 40, and 50 cm) on soil water storage dynamics and root zone water consumption; (2) to determine how subsoiling depth alters the seasonal partitioning of evapotranspiration into soil evaporation (Es) and plant transpiration (Tp); and (3) to evaluate the integrated effects of subsoiling depth on cotton growth, seed cotton yield, and various metrics of water use efficiency (WUE, IWUE, CWUE (effective water utilization coefficient)). This study provides a mechanistic, process-based understanding of how subsoiling depth regulates the soil–plant–water continuum (Figure 1), offering scientific evidence for optimizing tillage practices to achieve sustainable intensification of cotton production in water-scarce regions.
Figure 1.
Flowchart of the study on regulating evapotranspiration and water use efficiency by subsoiling.
2. Materials and Methods
2.1. Experimental Site Description
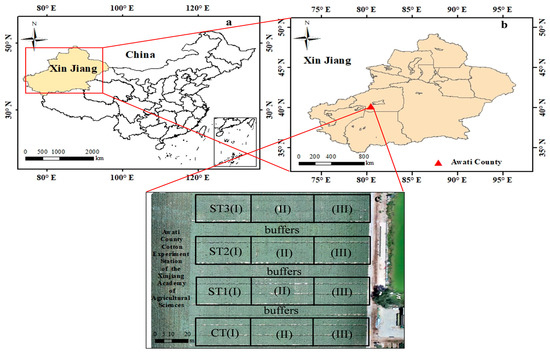
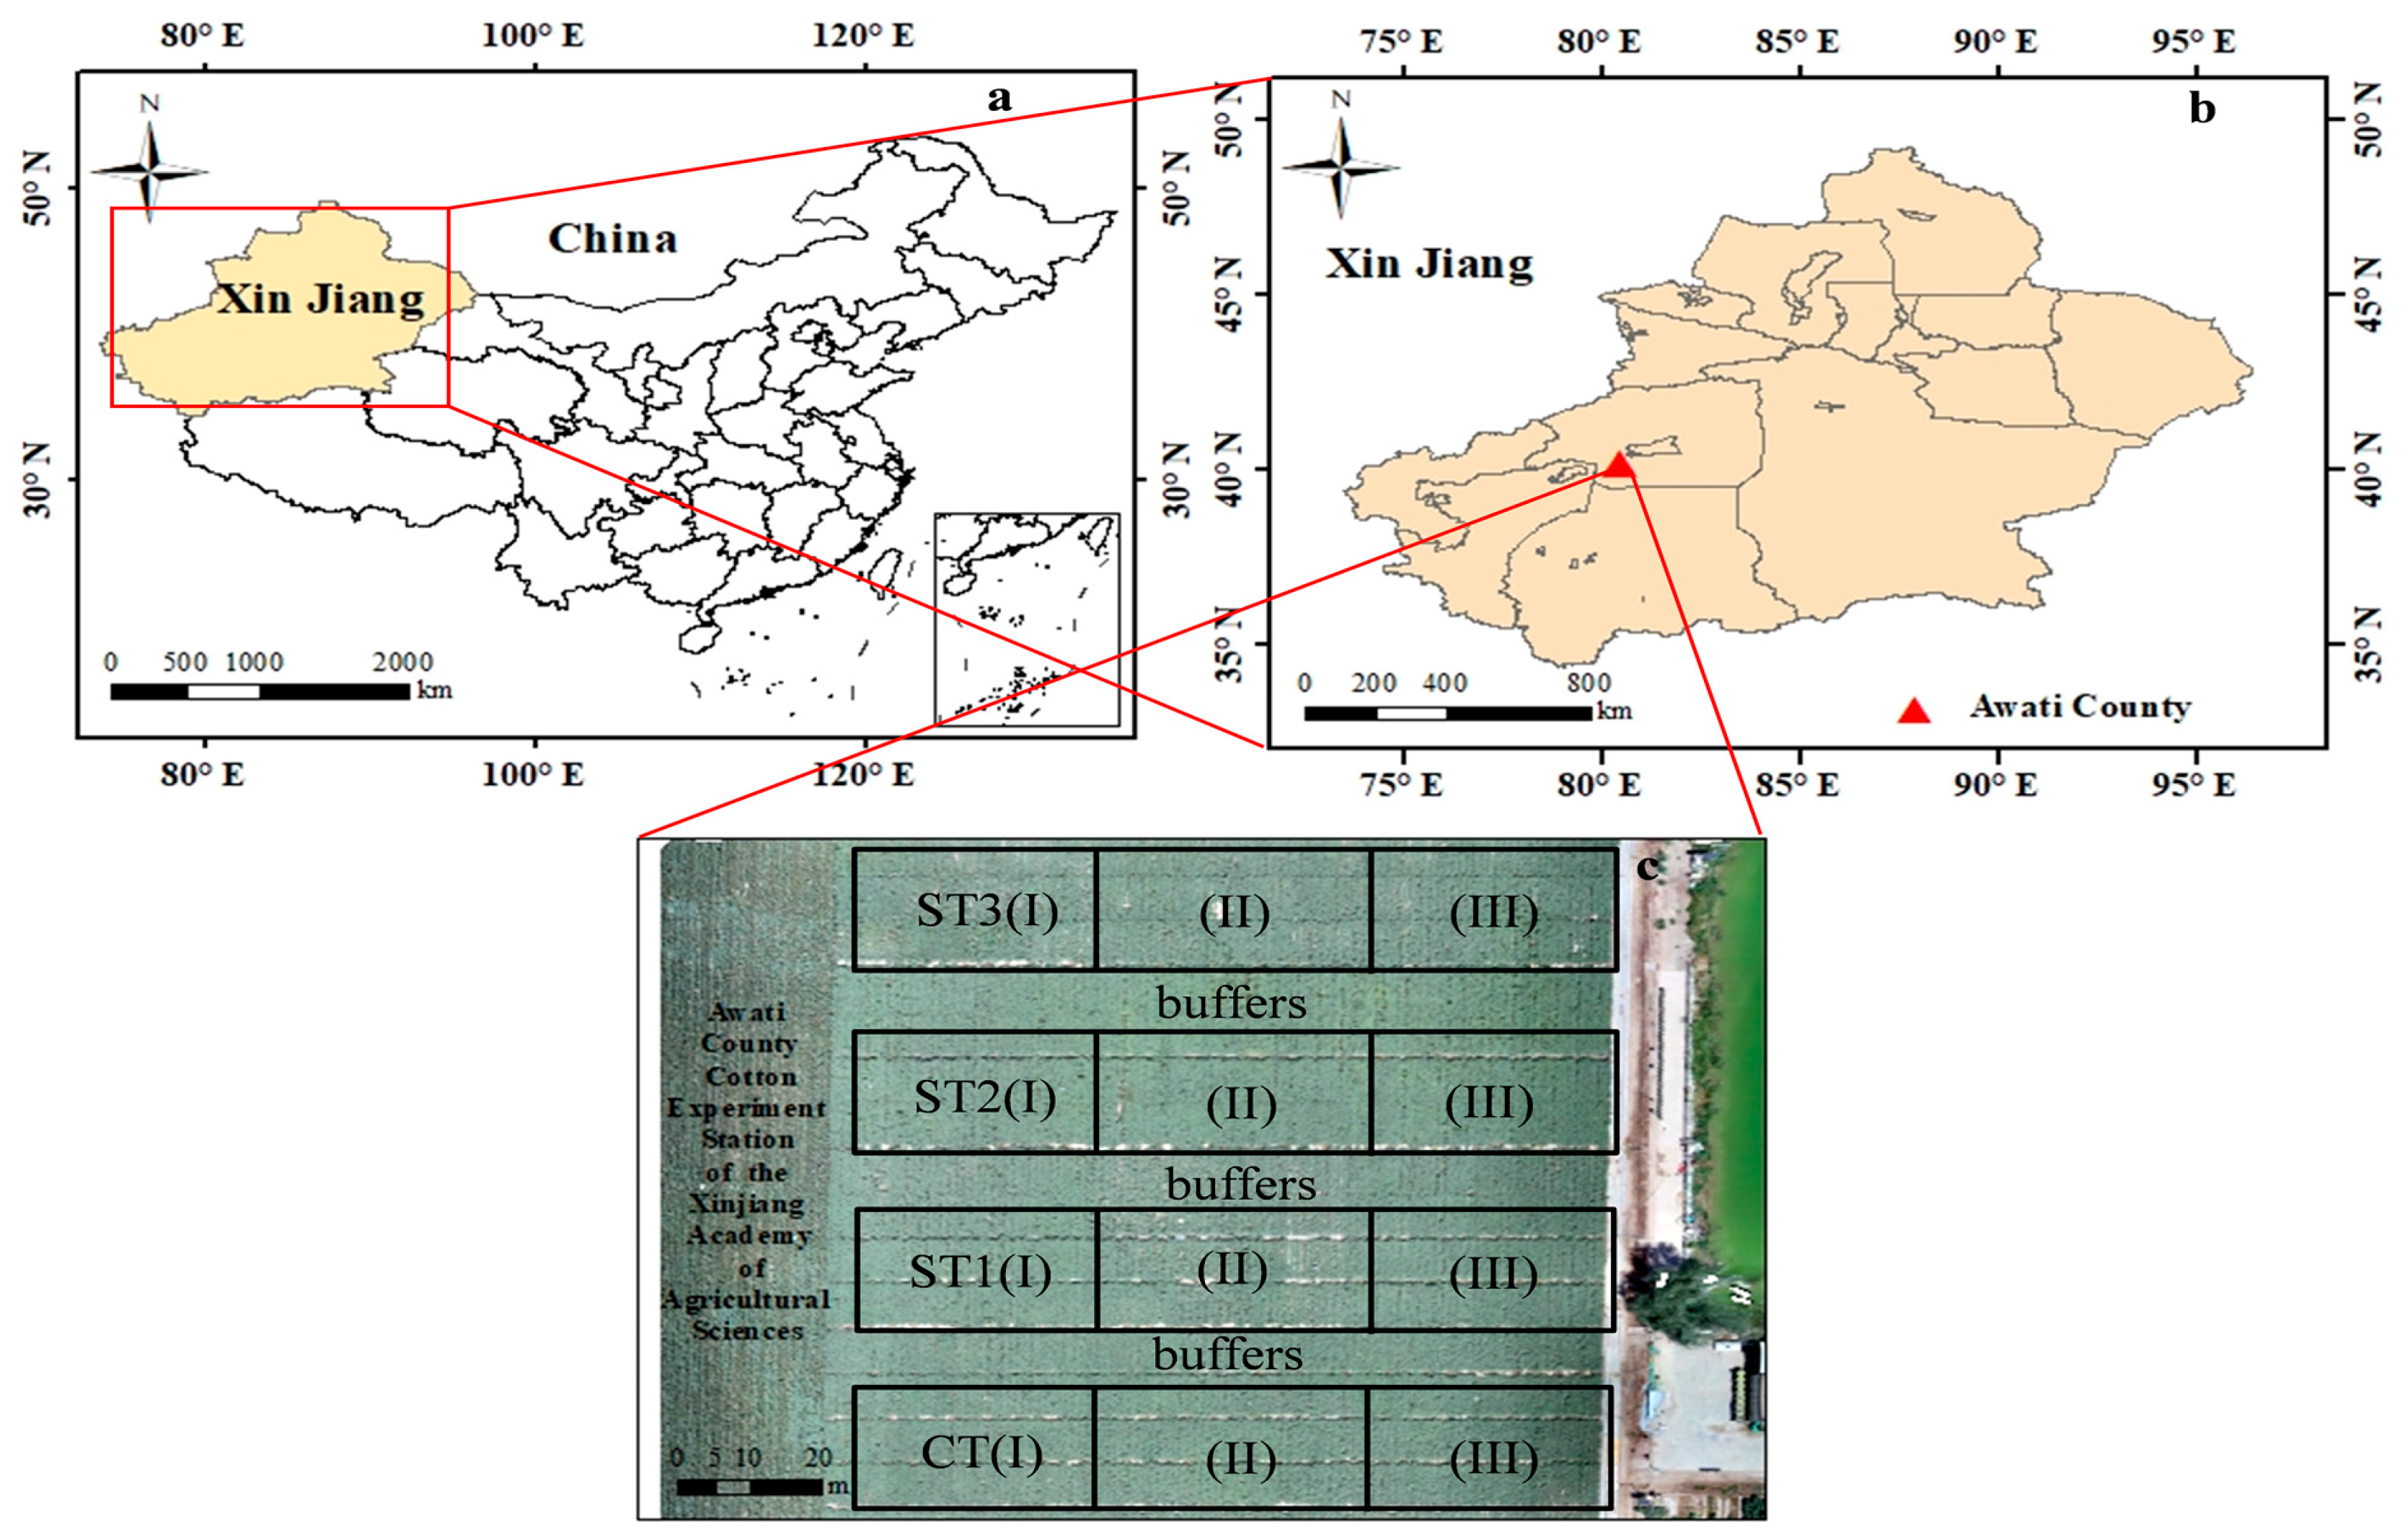
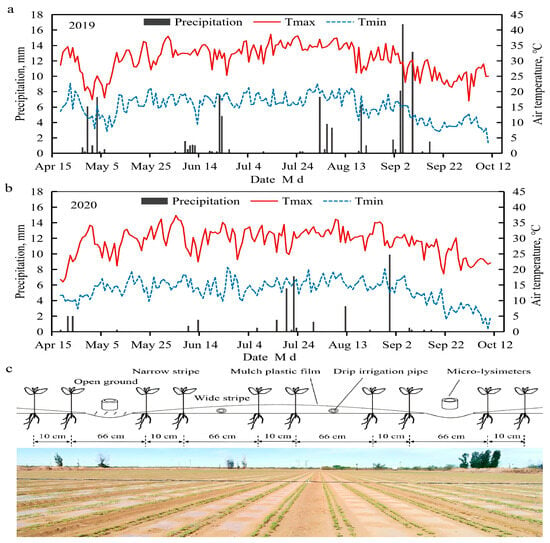
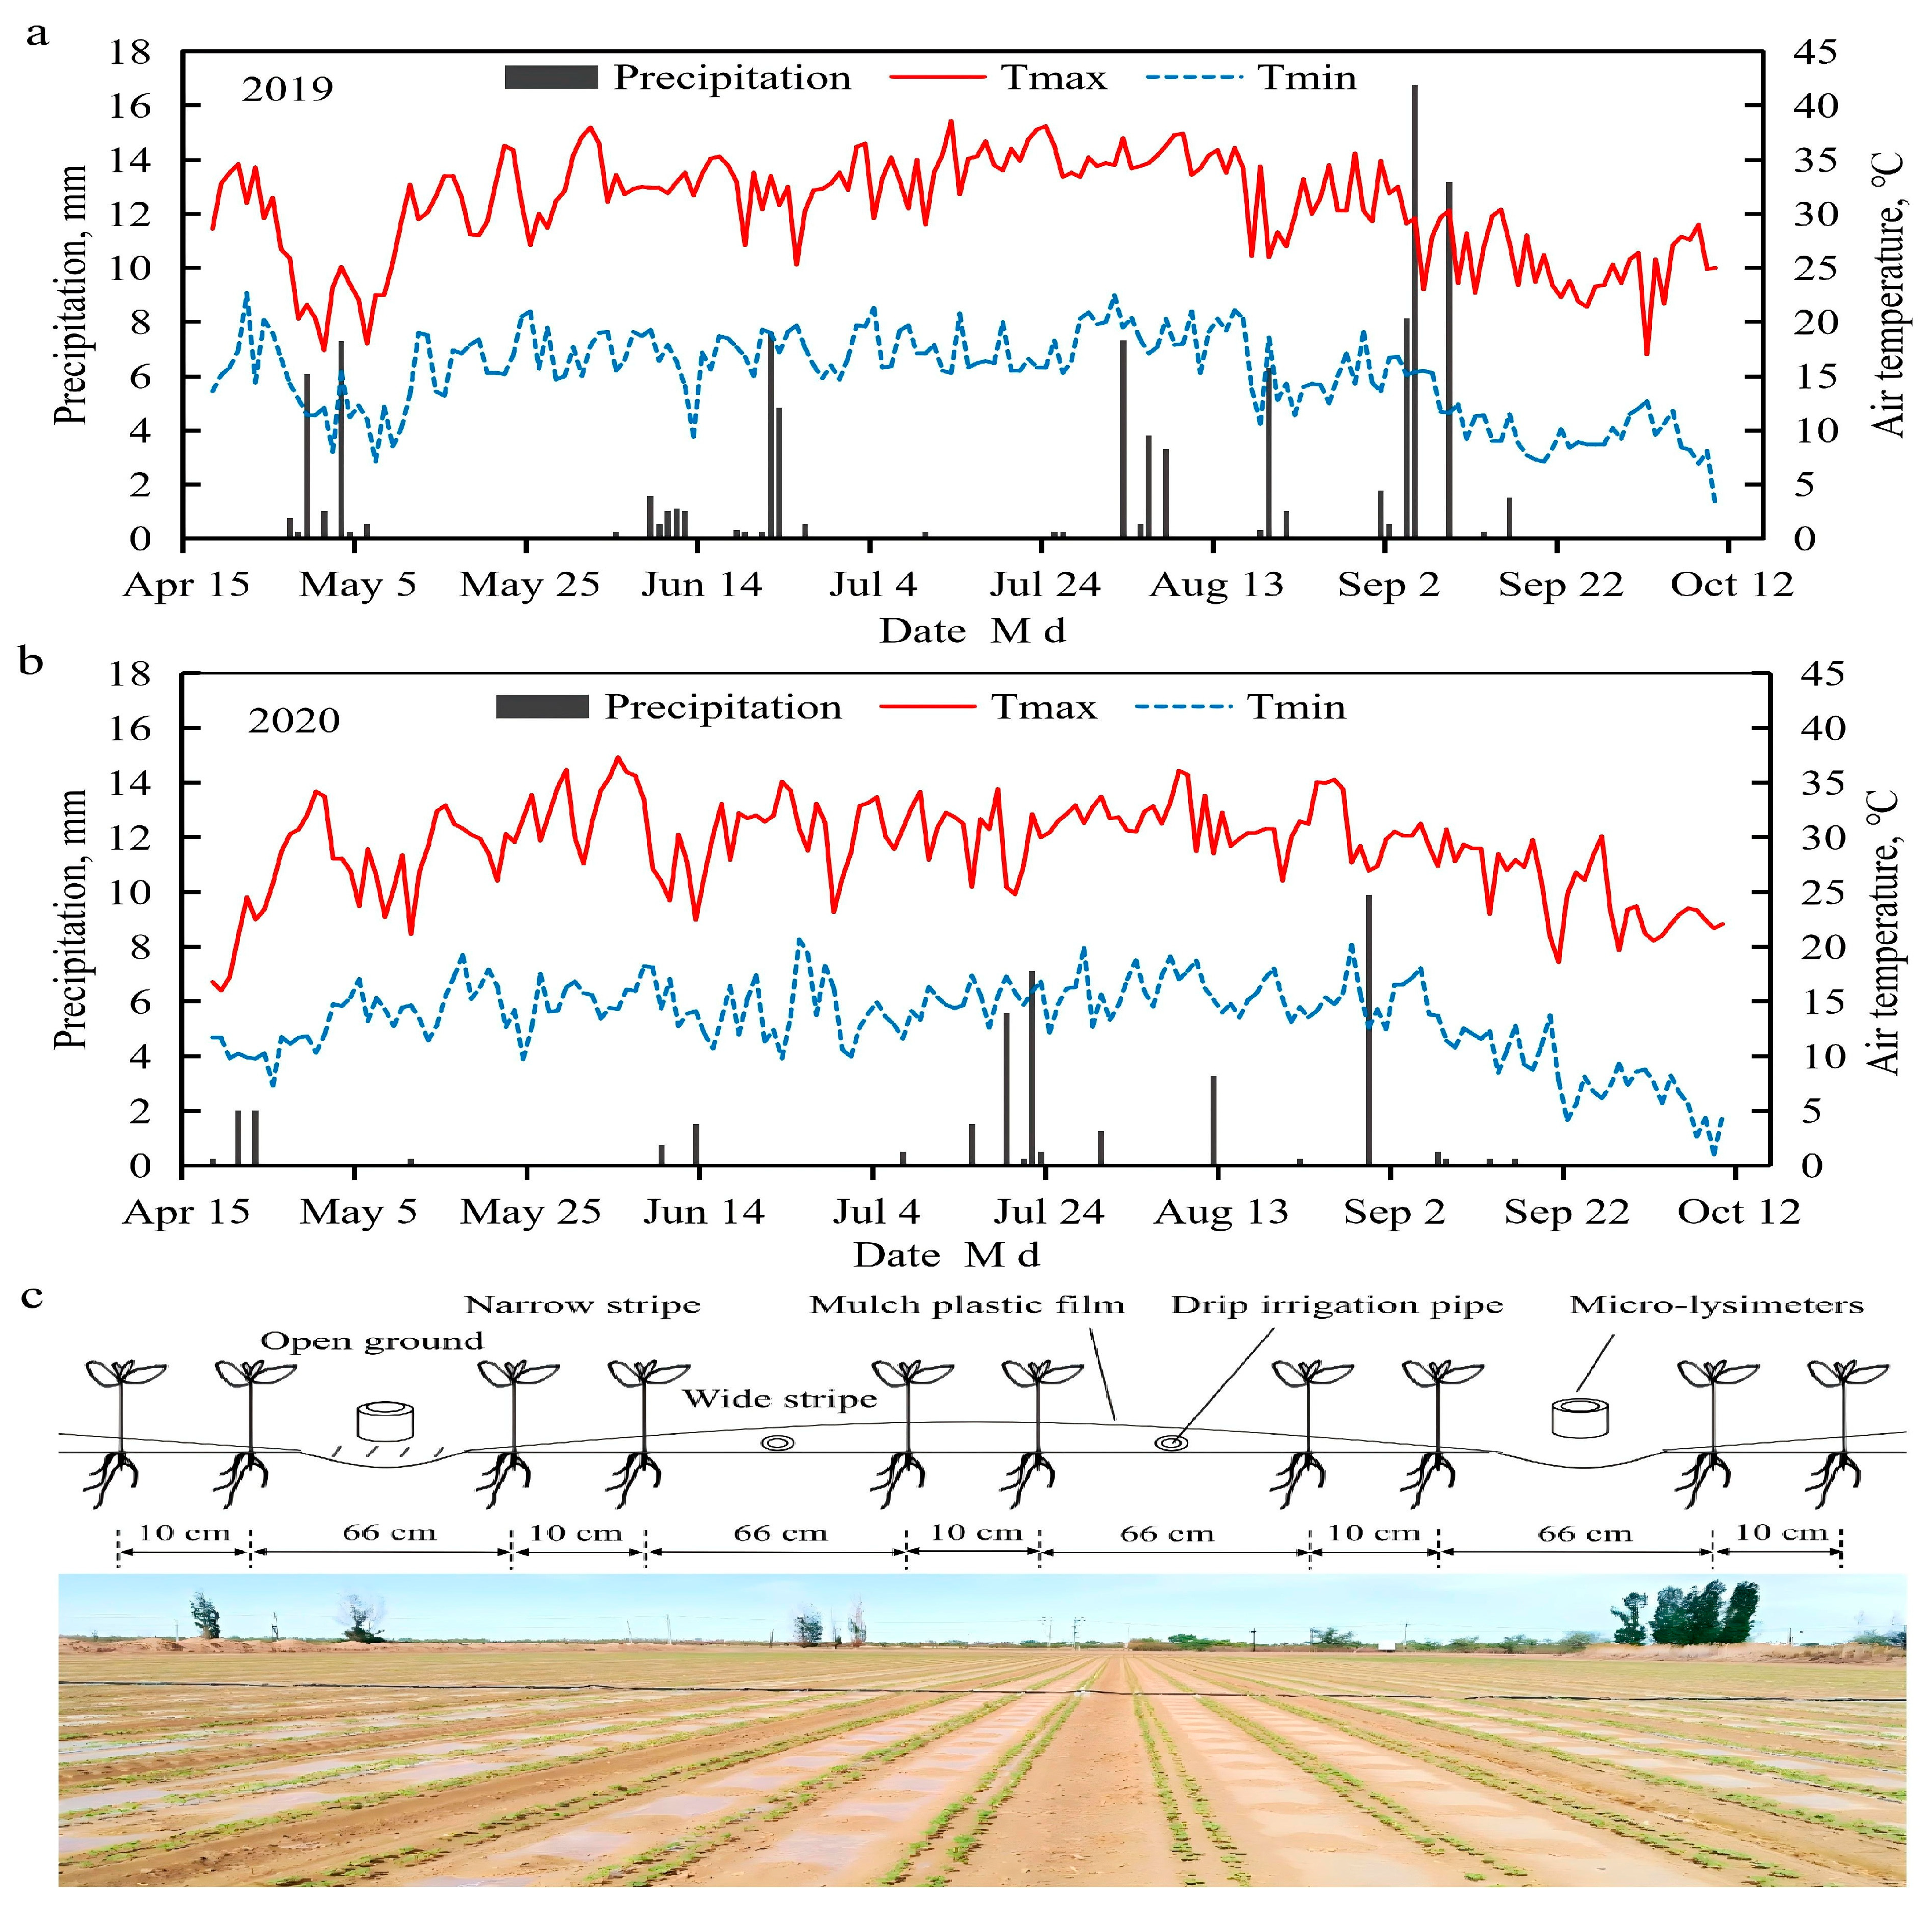
The field experiments were conducted during the cotton growing seasons of 2019 and 2020 at the experimental station of the Xinjiang Academy of Agricultural Sciences, Awati County, Aksu (40°27′ N, 80°21′ E, 1025 m a.s.l.). The experimental area is located in the Dolangkuotaimisi Village, Awati County, in the northwestern part of the Taklimakan Desert, with the specific location illustrated in Figure 2a,b. Characterized by a continental warm-temperate arid climate, the area experiences severe aridity, with scarce and temporally uneven annual precipitation, and high potential evaporation. The long-term mean annual precipitation is 46.7 mm, while the mean annual evaporation is 1890.7 mm. The mean annual air temperature is 10.4 °C, with an accumulated temperature above 10 °C of 3987.7 °C, 2679 annual sunshine hours, and a frost-free period of 211 days. During the 2019 and 2020 cotton growing seasons, the total precipitation was 100.9 mm and 40.9 mm, respectively (Figure 3a,b). The region represents a typical irrigated agricultural zone, where crop production is entirely dependent on surface water irrigation sourced from Tianshan Mountain snowmelt. The experimental field had a 20-year history of continuous cotton cultivation under conventional tillage as the primary practice. Based on the World Reference Base for Soil Resources (WRB), the soil at the long-term irrigated experimental site is classified as a sandy loam with characteristics of an irragric horizon. The soil in the 0–40 cm layer is sandy loam with a 61:36:3 ratio of sand, silt, and clay, and the soil in the 40–60 cm layer is clay loam with a 29:34:37 ratio of sand, silt, and clay. with a mean dry bulk density of 1.48 g cm−3, a mean pH of 7.33, a mean field capacity of 27.4%, and a permanent wilting point of 0.12 cm3 cm−3 in the 0–60 cm soil layer. The groundwater table was deeper than 5 m, precluding its contribution to the cotton water supply.
Figure 2.
Schematic diagram of the study area location (a,b), and of the experimental plots layout (c).
Figure 3.
Daily precipitation and mean air temperature during the 2019 and 2020 cotton growing seasons at the experimental site (a,b), (data source: automatic weather station, Campbell Scientific, Inc., Logan, UT, USA), and schematic diagram of the planting pattern, drip irrigation layout, and plastic film mulching system (c).
2.2. Experimental Design
In the 2019–2020 cotton growing seasons, the following three depths of subsoiling treatments were applied: subsoiling at 30 cm (ST1), 40 cm (ST2), and 50 cm (ST3). A control treatment (CT) was established, which involved no subsoiling in the current season, followed by conventional plowing to a depth of 15 cm, which was performed prior to sowing in the following year. The specific operations were as follows: After the cotton harvest in the current season, all cotton stalks were crushed and returned to the field. Subsoiling was then performed at depths of 30 cm, 40 cm, and 50 cm using a subsoiling implement equipped with a hydraulic control and depth positioning system. The implement was towed by a John Deere 6J-2204 tractor (Deere & Company, Inc., Moline, IL, USA) and featured six sets of double-row staggered curved shanks with a curved blade height of 65 cm and an operating width of 3.3 m. A high-precision ultrasonic depth positioning sensor provided real-time monitoring of the tillage layer depth, enabling precise depth control within a 60 cm range. A plot of equivalent area to any subsoiling treatment was reserved as the control and left in that state over winter. In the spring of the following year, prior to sowing, basal fertilizers were applied to the planting area at rates of 225 kg ha−1 urea (46% N), 150 kg ha−1 potassium sulfate (50% K2O), and 375 kg ha−1 calcium superphosphate (46% P2O5). Subsequently, a hydraulic bidirectional reversible plow (Model 1LFT-440) (Chifeng Shuntong Agricultural Machinery Manufacturing Co., Ltd., Chifeng, China) was used to till the entire experimental area to a depth of 15 cm, and single-seed hill dropping was conducted using a 2MBJ-2/12 precision film-mulching seeder (Xinjiang Boshrun Intelligent Agricultural Machinery Co., Ltd., Wusu, China). After sowing, the experimental area was demarcated based on the locations marked during subsoiling. The experimental field length was 300 m, and the CT, ST1, ST2, and ST3 treatments were arranged sequentially from east to west, the width of each treatment was 9.12 m (equivalent to four planting swaths), and three replicates were set from south to north for each treatment, resulting in a total of 12 plots, each with an area of 63.84 m2 (7 m × 9.12 m). A buffer row of one planting swath width was maintained between all plots. The layout of the experimental plots is illustrated in Figure 2c. In this study, annual subsoiling was conducted on 30 October 2019 and 2 November 2020, with the operation performed at the same plot locations each year.
Cotton rows were oriented north–south in an alternating pattern of wide and narrow rows: wide rows of 66 cm, narrow rows of 10 cm, and bare soil rows of 66 cm. The plant spacing was 10 cm, achieving a planting density of 2.6 × 10⁵ plants ha−2. A 2.05 m wide transparent plastic film was used for mulching. One drip irrigation tape was laid under the film in each wide row, with a spacing of 76 cm between adjacent tapes. The emitters were spaced 20 cm apart with a designed flow rate of 2.1 L h−1. The planting pattern, drip irrigation layout, and film mulching are illustrated in Figure 3c. Irrigation was controlled and measured individually for each plot. The total seasonal irrigation amount was 360 mm, applied over 10 irrigation events. During each irrigation, urea (46% N) at 52.5 kg ha−1 and diammonium phosphate (18% N, 46% P2O5) at 75.0 kg ha−1 were applied equally with the water. Cotton was sown on 14 April 2019 and 13 April 2020, and harvested on 25 September 2019 and September 28 2020, respectively. The specific divisions of cotton growth stages, precipitation, and irrigation amounts are detailed in Table 1. The cotton cultivar used was “Xinluzhong 88”, a mid-maturing variety. All other field management practices aligned with those of the surrounding local farms.
Table 1.
Division of cotton growth stages, irrigation dates, and amounts of irrigation and precipitation during the 2019 and 2020 cotton growing seasons.
2.3. Meteorological Factors
Meteorological data during the 2019–2020 cotton growing seasons, including precipitation (P), air temperature (Ta), solar radiation (Rn), relative humidity (RH), and wind speed at 2 m height (u2), were collected using an automatic weather station (Campbell Scientific, Inc., Logan, UT, USA) installed 50 m from the experimental plots. The 083E sensors (Met One Instruments, Inc., Grants Pass, OR, USA) for Ta (±0.2 °C to ±0.5 °C; 3 m) and RH (±1.5% to ±3%; 3 m), the 034B sensors (Met One Instruments, Inc., Grants Pass, OR, USA) for wind speed (±0.3 m s−1; 3 m) and direction (±3° to ±5°; 3 m), the TE525 sensor (Texas Electronics, Inc., Dallas, TX, USA) for P (±1%; 1.5 m), and the LI190SB sensor (LI-COR Biosciences, Lincoln, NE, USA) for PAR (±5%; 4 m) were used. All sensors were connected to a CR3000 datalogger (Campbell Scientific, Inc., Logan, UT, USA) supported by LoggerNet 4.3 software (Campbell Scientific, Inc., Logan, UT, USA), recording data at 30 min intervals.
2.4. Soil Water Content and Soil Water Storage
During the 2019–2020 growing seasons, soil samples were collected at 7-day intervals after seedling emergence to determine the soil water content (SWC). Soil cores were taken randomly directly beneath the emitters using a 40 mm diameter steel core sampler to a depth of 100 cm. Samples were collected at 10 cm intervals from 0 to 60 cm and at 20 cm intervals from 60 to 100 cm soil cores. Three samples were taken per plot one day before irrigation, with additional sampling following precipitation events. SWC (gravimetric water content, g g−1) and soil bulk density (BD, g cm−3) were measured using the oven-drying method. The gravimetric water content was multiplied by the bulk density to obtain the volumetric water content.
The soil water storage (SWS, mm) for a given soil layer at different cotton growth stages was calculated as follows [35,36]:
where BD is bulk density (g cm−3); ρw is water density (the value is 1 g cm−3); SWC is the soil water content (g g−1); and D is the thickness of the soil layer (mm).
SWS = BD/ρw × SWC × D
2.5. Soil Evaporation
Soil evaporation (Es) was measured using micro-lysimeters (MLs) made from polyvinyl chloride (PVC) tubes [37]. Each MLs consisted of an unsealed outer sleeve and an inner sleeve. The inner sleeve had an inner diameter of 11 cm, a wall thickness of 5 mm, and a height of 15 cm. The outer sleeve had a slightly larger diameter and the same height. The inner sleeve was vertically pressed into the soil, filled with undisturbed soil, covered with a polyethylene mesh at the bottom, and then placed inside the fixed outer sleeve. After the subsoiled field was divided into experimental plots, three MLs were installed in each plot, all placed in the bare soil row between the two plastic films within the plot (Figure 3c). The MLs were replaced with undisturbed soil samples every six days, and after each irrigation or rainfall event. The soil mass was measured daily at 12:00 noon using an electronic balance with a precision of 0.01 g. The daily Es was calculated as follows [38]:
where Es is the daily soil evaporation (mm d−1), Mi is the mass (g) of the MLs at 12:00 on day i, Mi+1 is the mass (g) at 12:00 on day i + 1, and r is the radius (mm) of the inner sleeve.
Es = (Mi − Mi+1)/(πr2)
2.6. Seasonal Evapotranspiration Calculation
Seasonal actual cotton evapotranspiration (ET) was calculated using the water balance equation [36,39]:
where P is the effective precipitation during the growing season (mm), I is the irrigation amount (mm), ΔSWS is the change in water storage in the 0–100 cm soil profile between the start and end of the season (mm), CR is the capillary rise from the groundwater (mm), R is the surface runoff (mm), and D is deep percolation (mm). Surface runoff (R) was considered negligible due to the flat terrain, low precipitation intensity, and high soil infiltration and water holding capacity. Given that the groundwater depth was >5 m, and observations confirmed that soil moisture in the 100 cm layer remained unchanged after irrigation/rainfall with no infiltration beyond 1 m, both capillary rise (CR) and deep percolation (D) were assumed to be zero (CR = 0, D = 0). Therefore, the equation was simplified as follows [36]:
ET = P + I + ΔSWS + CR − R − D
ET = P + I + ΔSWS
2.7. Aboveground Biomass, Seed Cotton Yield, and Harvest Index (HI)
At harvest, five representative cotton plants were sampled from each plot. Plant height was measured using a meter with 1 cm precision. The aboveground parts were harvested, separated into leaves, stems, and bolls, and oven-dried at 80 °C to a constant weight to determine the aboveground biomass. Simultaneously, a representative sample area of 2.92 m × 2.28 m was randomly selected in each plot to count the number of effective plants and bolls. Seed cotton was manually harvested from a 6.67 m2 area per plot, sun-dried, and weighed. Yield measurements from the three replicates per treatment were averaged to determine the single boll mass and seed cotton yield. The harvest index (HI) was defined as the ratio of seed cotton yield to the aboveground biological yield [40].
2.8. Water Use Efficiency
Water use efficiency (WUE, kg ha−1 mm−1) was calculated as follows [30,36]:
WUE = Y/ET
Evapotranspiration (ET) comprises evaporation (Es) and transpiration (Tp). Es is considered ineffective water loss, while Tp, being directly related to crop growth, represents effective water use. The effective water utilization coefficient (CWUE) was calculated as follows [30]:
CWUE = Tp/(I + P)
Irrigation water use efficiency (IWUE, kg ha−1 mm−1) was calculated as follows [36]:
where Y is the seed cotton yield (kg ha−1); Tp (mm) and ET (mm) are the total transpiration and evapotranspiration over the entire growing season, respectively.
IWUE = Y/I
2.9. Statistical Analysis
First, we summarized the experimental data by calculating descriptive statistics, including means and standard deviations, to characterize the central tendency and variability. To statistically compare the mean values across multiple treatment groups, an analysis of variance (ANOVA) was conducted on the complete dataset (including year and treatment factors) using IBM SPSS Statistics (v19.0), examining the effects of treatment, year, and their interaction. When the ANOVA indicated significant differences (p > 0.05), the Least Significant Difference (LSD) test was applied for multiple comparisons to assess the significance of differences among the deep tillage depth treatment groups (p ≤ 0.05). Visualization of the results was performed using Origin (v8.5), Surfer (v8.0), and Microsoft Excel 2010.
3. Results
3.1. Soil Water Utilization Under Different Subsoiling Depths
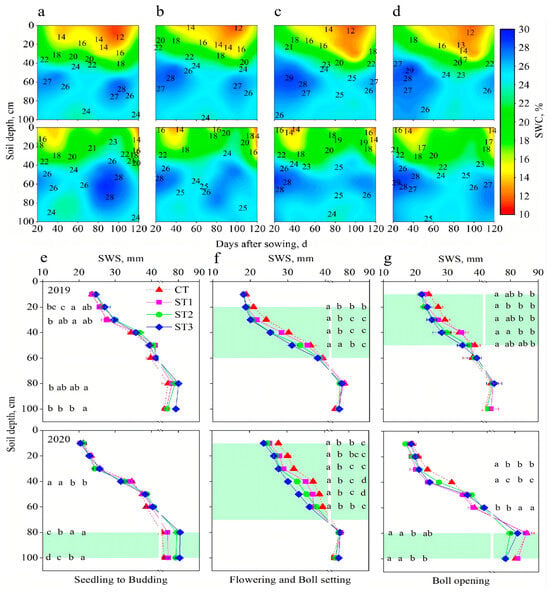
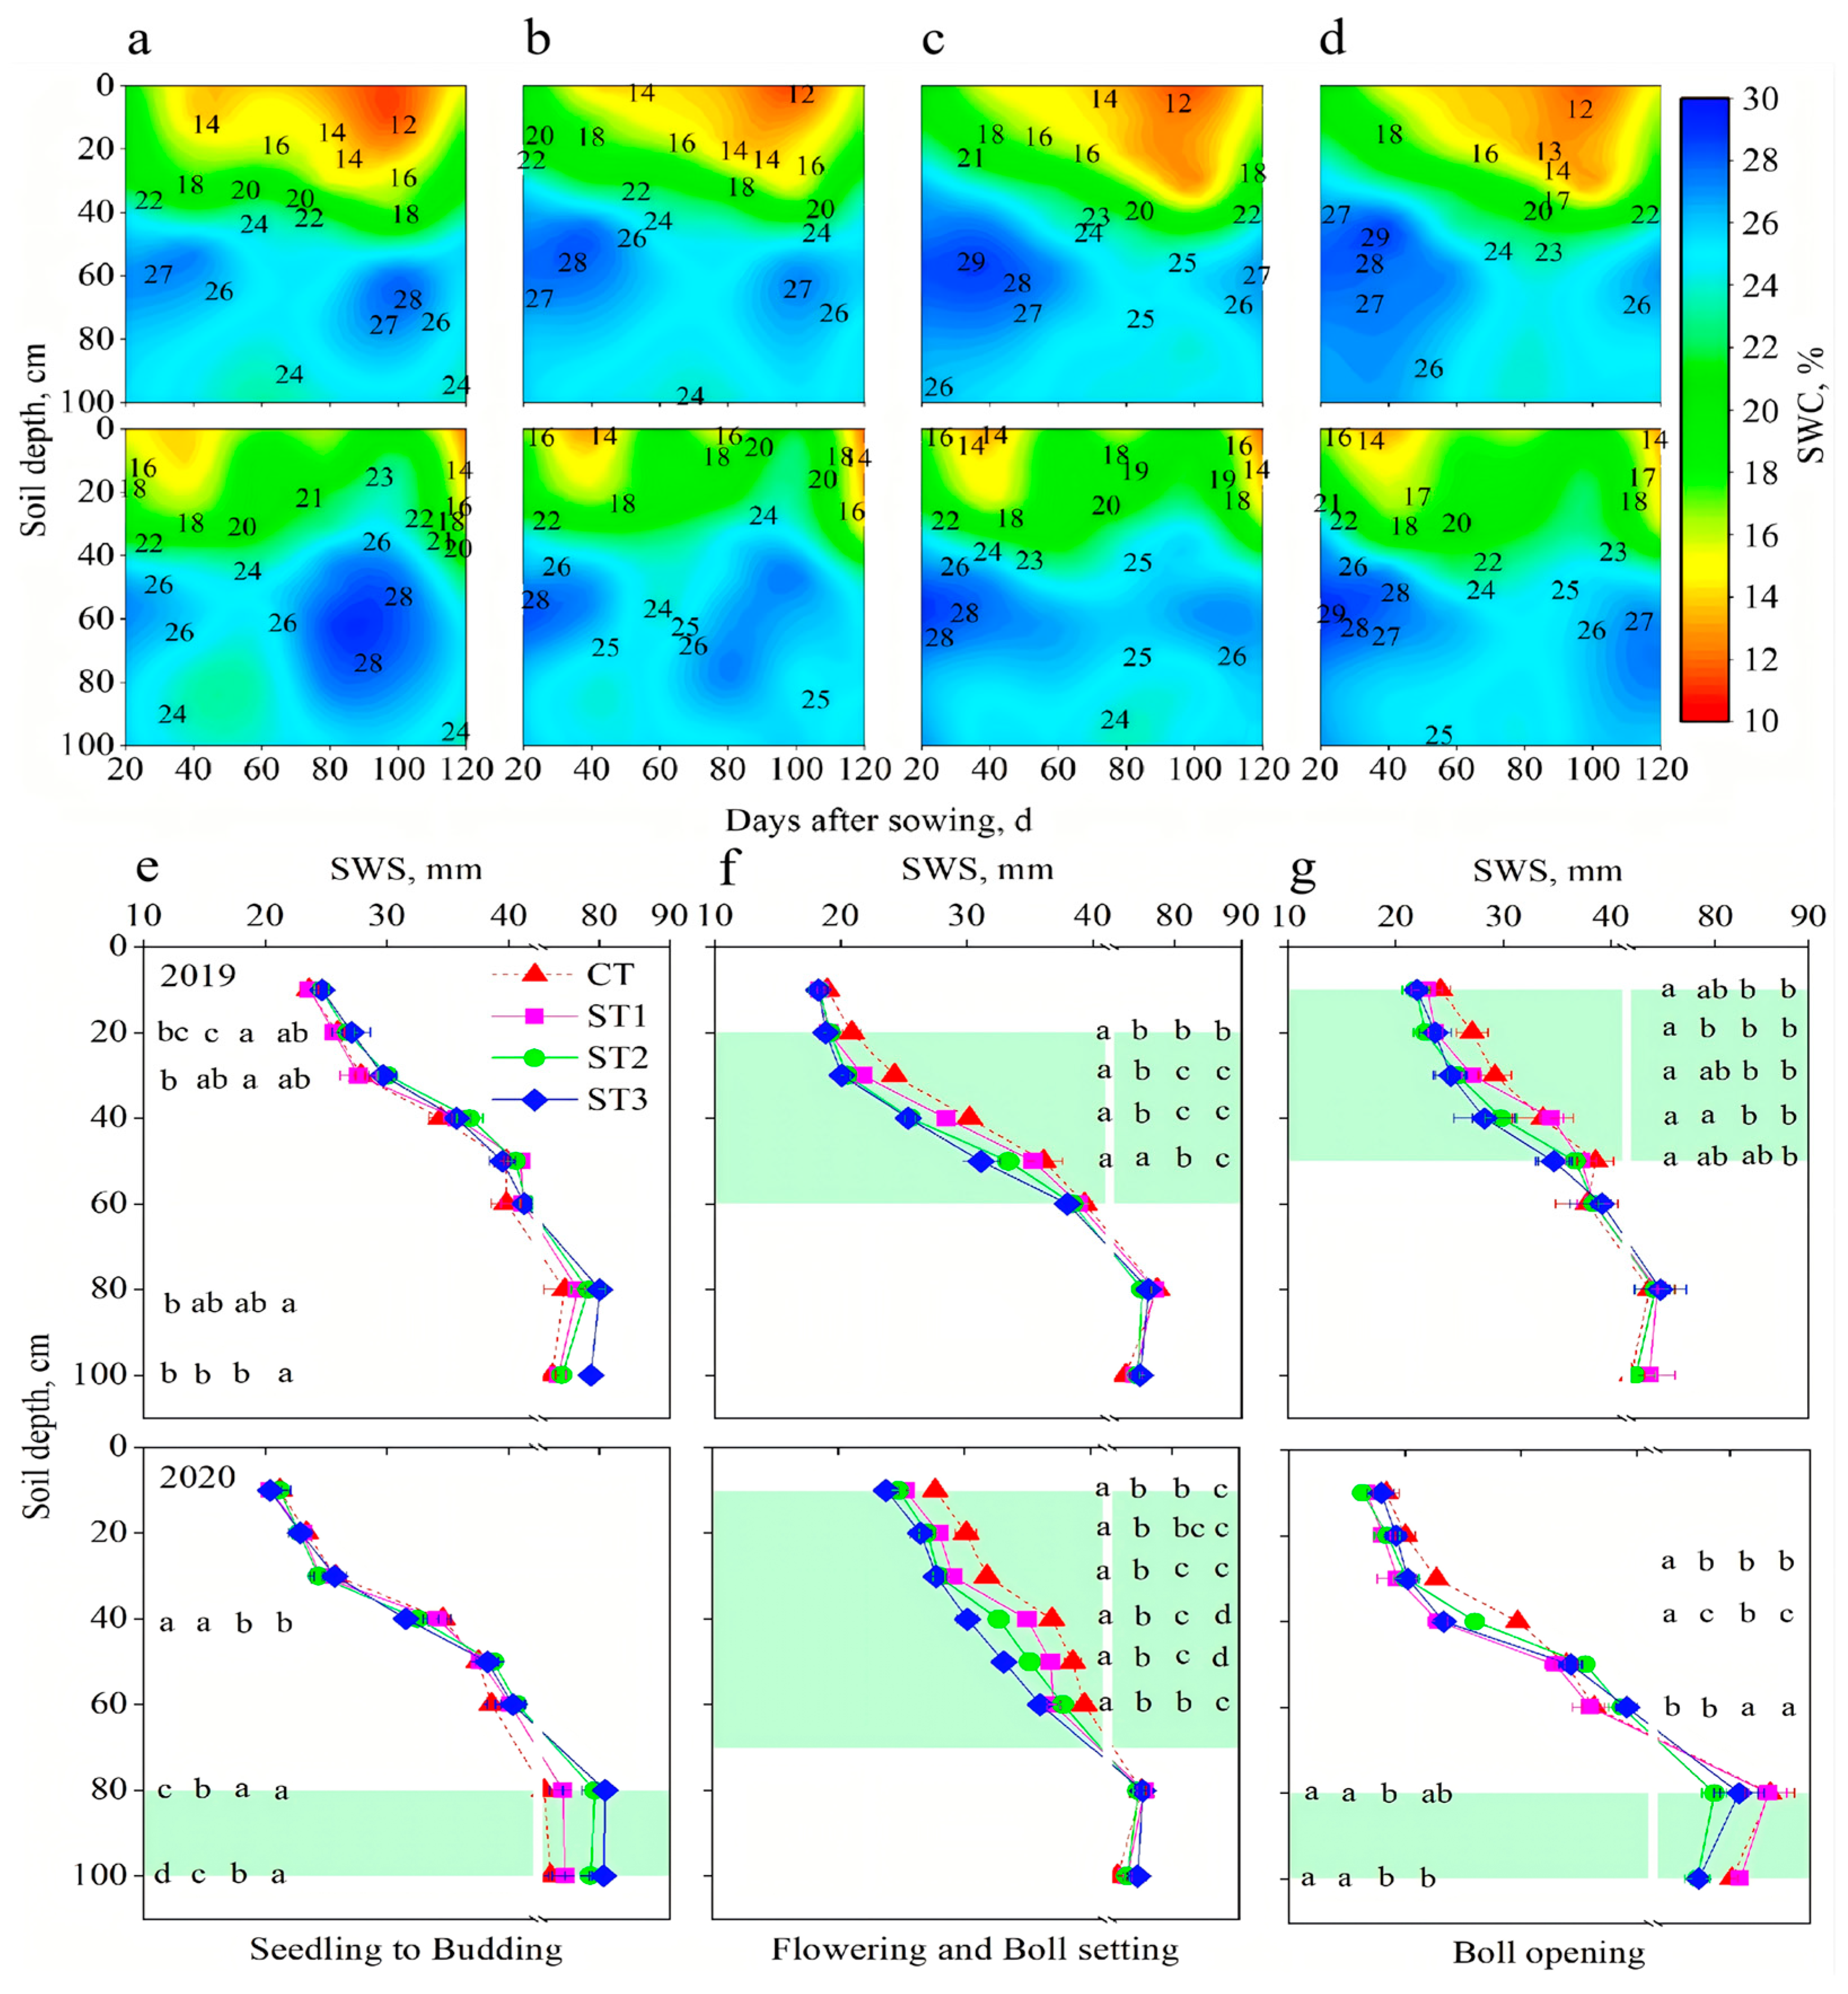
Subsoiling significantly influenced the SWC distribution across soil profiles at different growth stages (Figure 4a–d). During the first 0–30 days after sowing (seedling stage), the SWC across soil profiles followed the order ST3 > ST2 > ST1 > CT (Figure 4a–d). At 60 days after sowing (squaring stage), the SWC in the 0–50 cm layer was lower in subsoiled treatments (two-year averages of 19.7%, 19.3%, and 18.6% for ST1, ST2, and ST3, respectively) compared to CT (20.7%), while the SWC in the 50–100 cm layer remained higher than in CT. From 90 to 120 days after sowing (flowering and boll-setting stages), the SWC across all soil layers followed the order CT > ST1 > ST2 > ST3 (Figure 4a–d). The lower SWC under subsoiling during key growth stages was primarily attributed to the disruption of the plow pan, which reduced bulk density and increased soil porosity, facilitating root penetration and enhancing the uptake of deep soil water. Compared to 2020, the SWC in the upper 40 cm layer decreased more sharply in 2019 for all treatments, mainly due to a longer duration of temperatures exceeding 35 °C in 2019.
Figure 4.
Dynamics of soil water content (SWC; (a–d)) and soil water storage (SWS; (e–g)) in the 0–100 cm soil profile under different subsoiling depths during the 2019 and 2020 cotton growing seasons. Note: (a) 2019 and 2020 CT treatment, (b) 2019 and 2020 ST1 treatment, (c) 2019 and 2020 ST2 treatment, and (d) 2019 and 2020 ST3 treatment. CT: no subsoiling; ST1: 30 cm subsoiling; ST2: 40 cm subsoiling; ST3: 50 cm subsoiling. The isoline in each figure shows the water content; error bars represent standard deviations (n = 3). In panels (e–g), the light green shaded background denotes the interval of significant differences among treatments, different lowercase letters (marked from left to right corresponding to CT, ST1, ST2, and ST3, respectively) indicate significant differences among treatments within the same year (p < 0.05).
From the seedling to squaring stages, SWS at 80 cm and 100 cm depths was significantly higher (p < 0.05) in ST1, ST2, and ST3 plots than in CT plots, with SWS generally increasing with greater subsoiling depth (Figure 4e). Upon entering the flowering and boll-setting stages, subsoiling significantly reduced SWS in the 0–60 cm layer, with considerable fluctuations. In 2019, the SWS in this layer changed in the order ST3 < ST2 < ST1 < CT (Figure 4f). The average SWS in the 0–60 cm layer for ST1, ST2, and ST3 was 4.8%, 8.6%, and 10.7% lower than CT, respectively (p < 0.05). Fluctuations in SWS were smaller in the 60–100 cm layer. Similar results were obtained in 2020. At harvest over the two seasons, SWS in the 0–50 cm layer was significantly lower in ST1, ST2, and ST3 plots compared to CT (Figure 4g). The SWS in the upper soil layer was higher in 2019 than in 2020, associated with higher precipitation during the boll-opening stage (42.1 mm in 2019 vs. 11.2 mm in 2020).
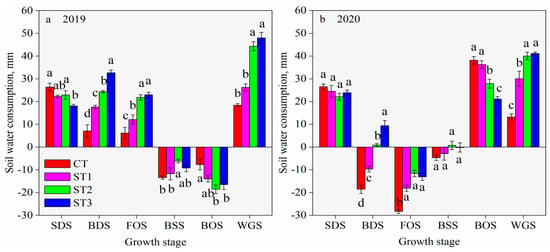
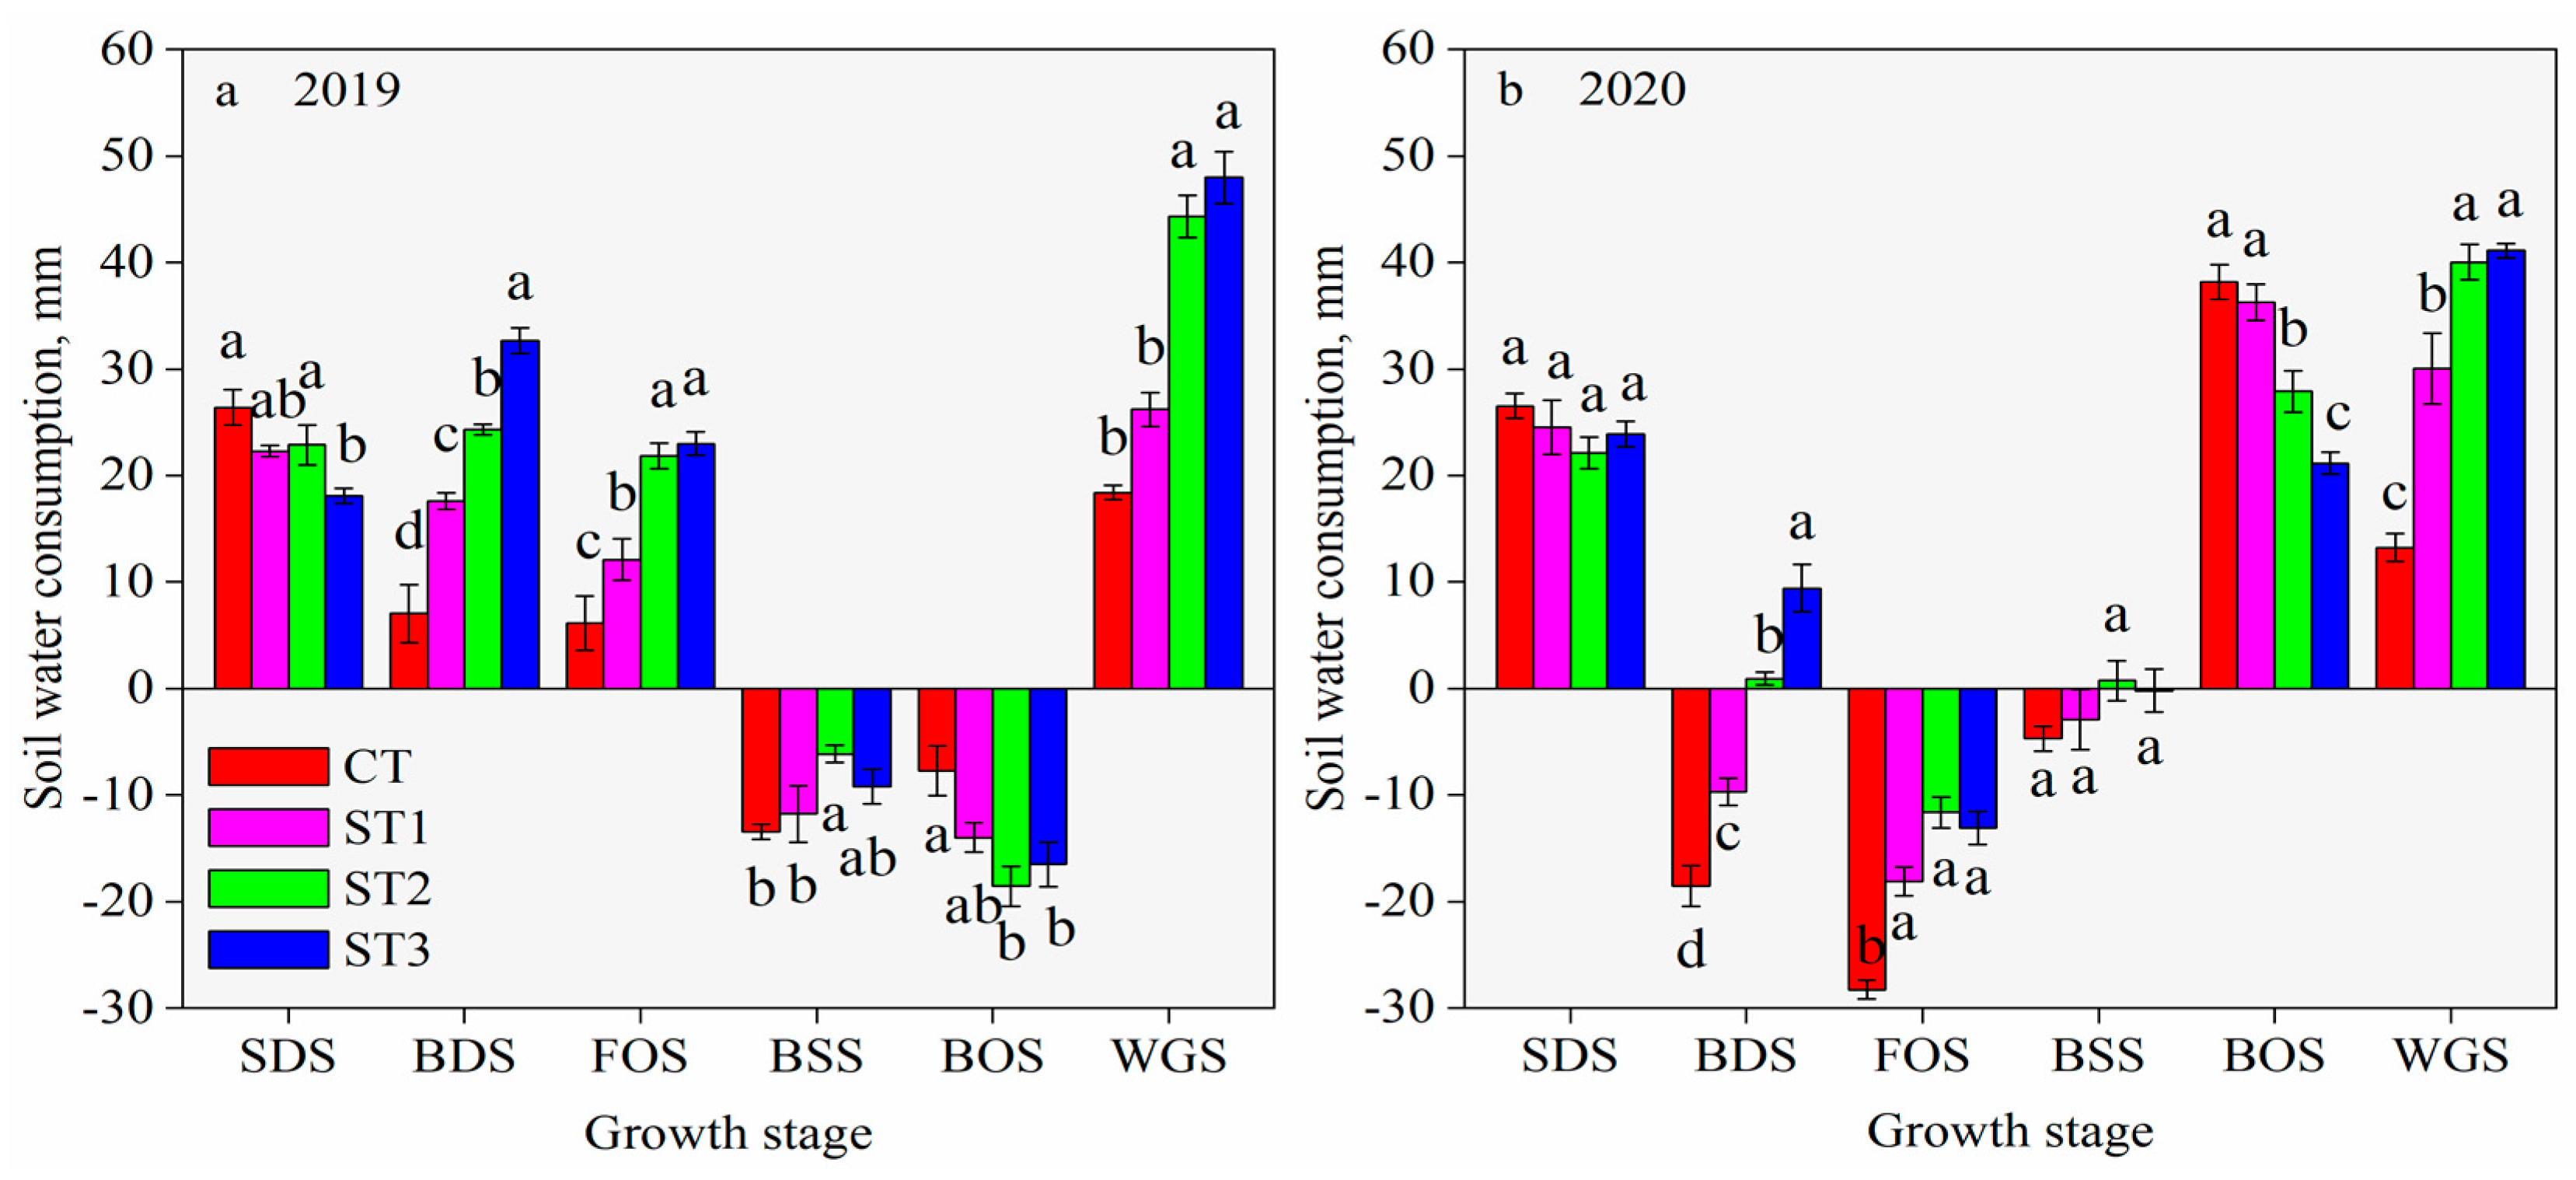
Subsoiling depth also affected soil water consumption in the 0–100 cm layer (Figure 5a,b). Compared to the CT treatment, soil water consumption under subsoiling treatments was lower during the seedling stage, but increased significantly during the squaring and full flowering stages. Over the two growing seasons, the total soil water consumption across subsoiling treatments followed the order ST3 > ST2 > ST1 > CT. The average total soil water consumption in ST2 and ST3 plots was 26.4 mm and 28.8 mm higher than in CT plots, respectively (p < 0.05; Figure 5). Combined with Figure 4, these results indicate that increasing subsoiling depth decreased SWS and increased soil water consumption during the vigorous growth period, suggesting that subsoiling enhances the utilization capacity of deep soil water during key cotton growth stages.
Figure 5.
Soil water consumption in the 0–100 cm soil layer under different subsoiling depths during the 2019 (a) and 2020 (b) cotton growing seasons. Within a stage, values followed by different lowercase letters are significantly different at p < 0.05 according to the LSD test. CT: no subsoiling; ST1: 30 cm subsoiling; ST2: 40 cm subsoiling; ST3: 50 cm subsoiling. SDS: Seedling stage; BDS: squaring stage; FOS: flowering stage; BSS: boll-setting stage; BOS: boll-opening stage; WGS: whole growing season.
3.2. Soil Evaporation (Es) and Crop Transpiration (Tp)
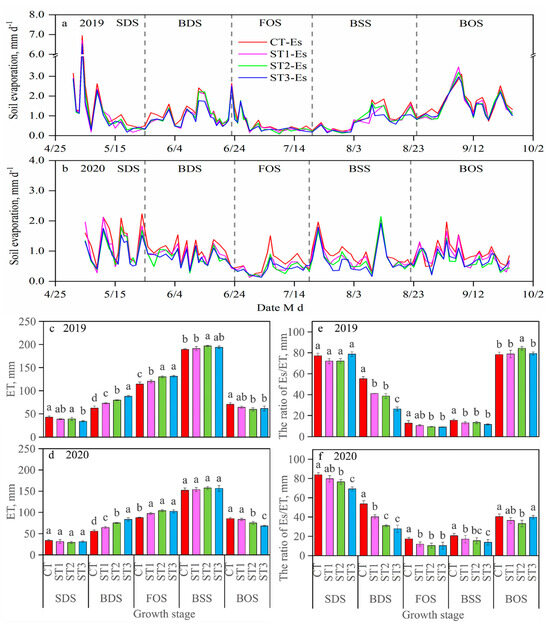
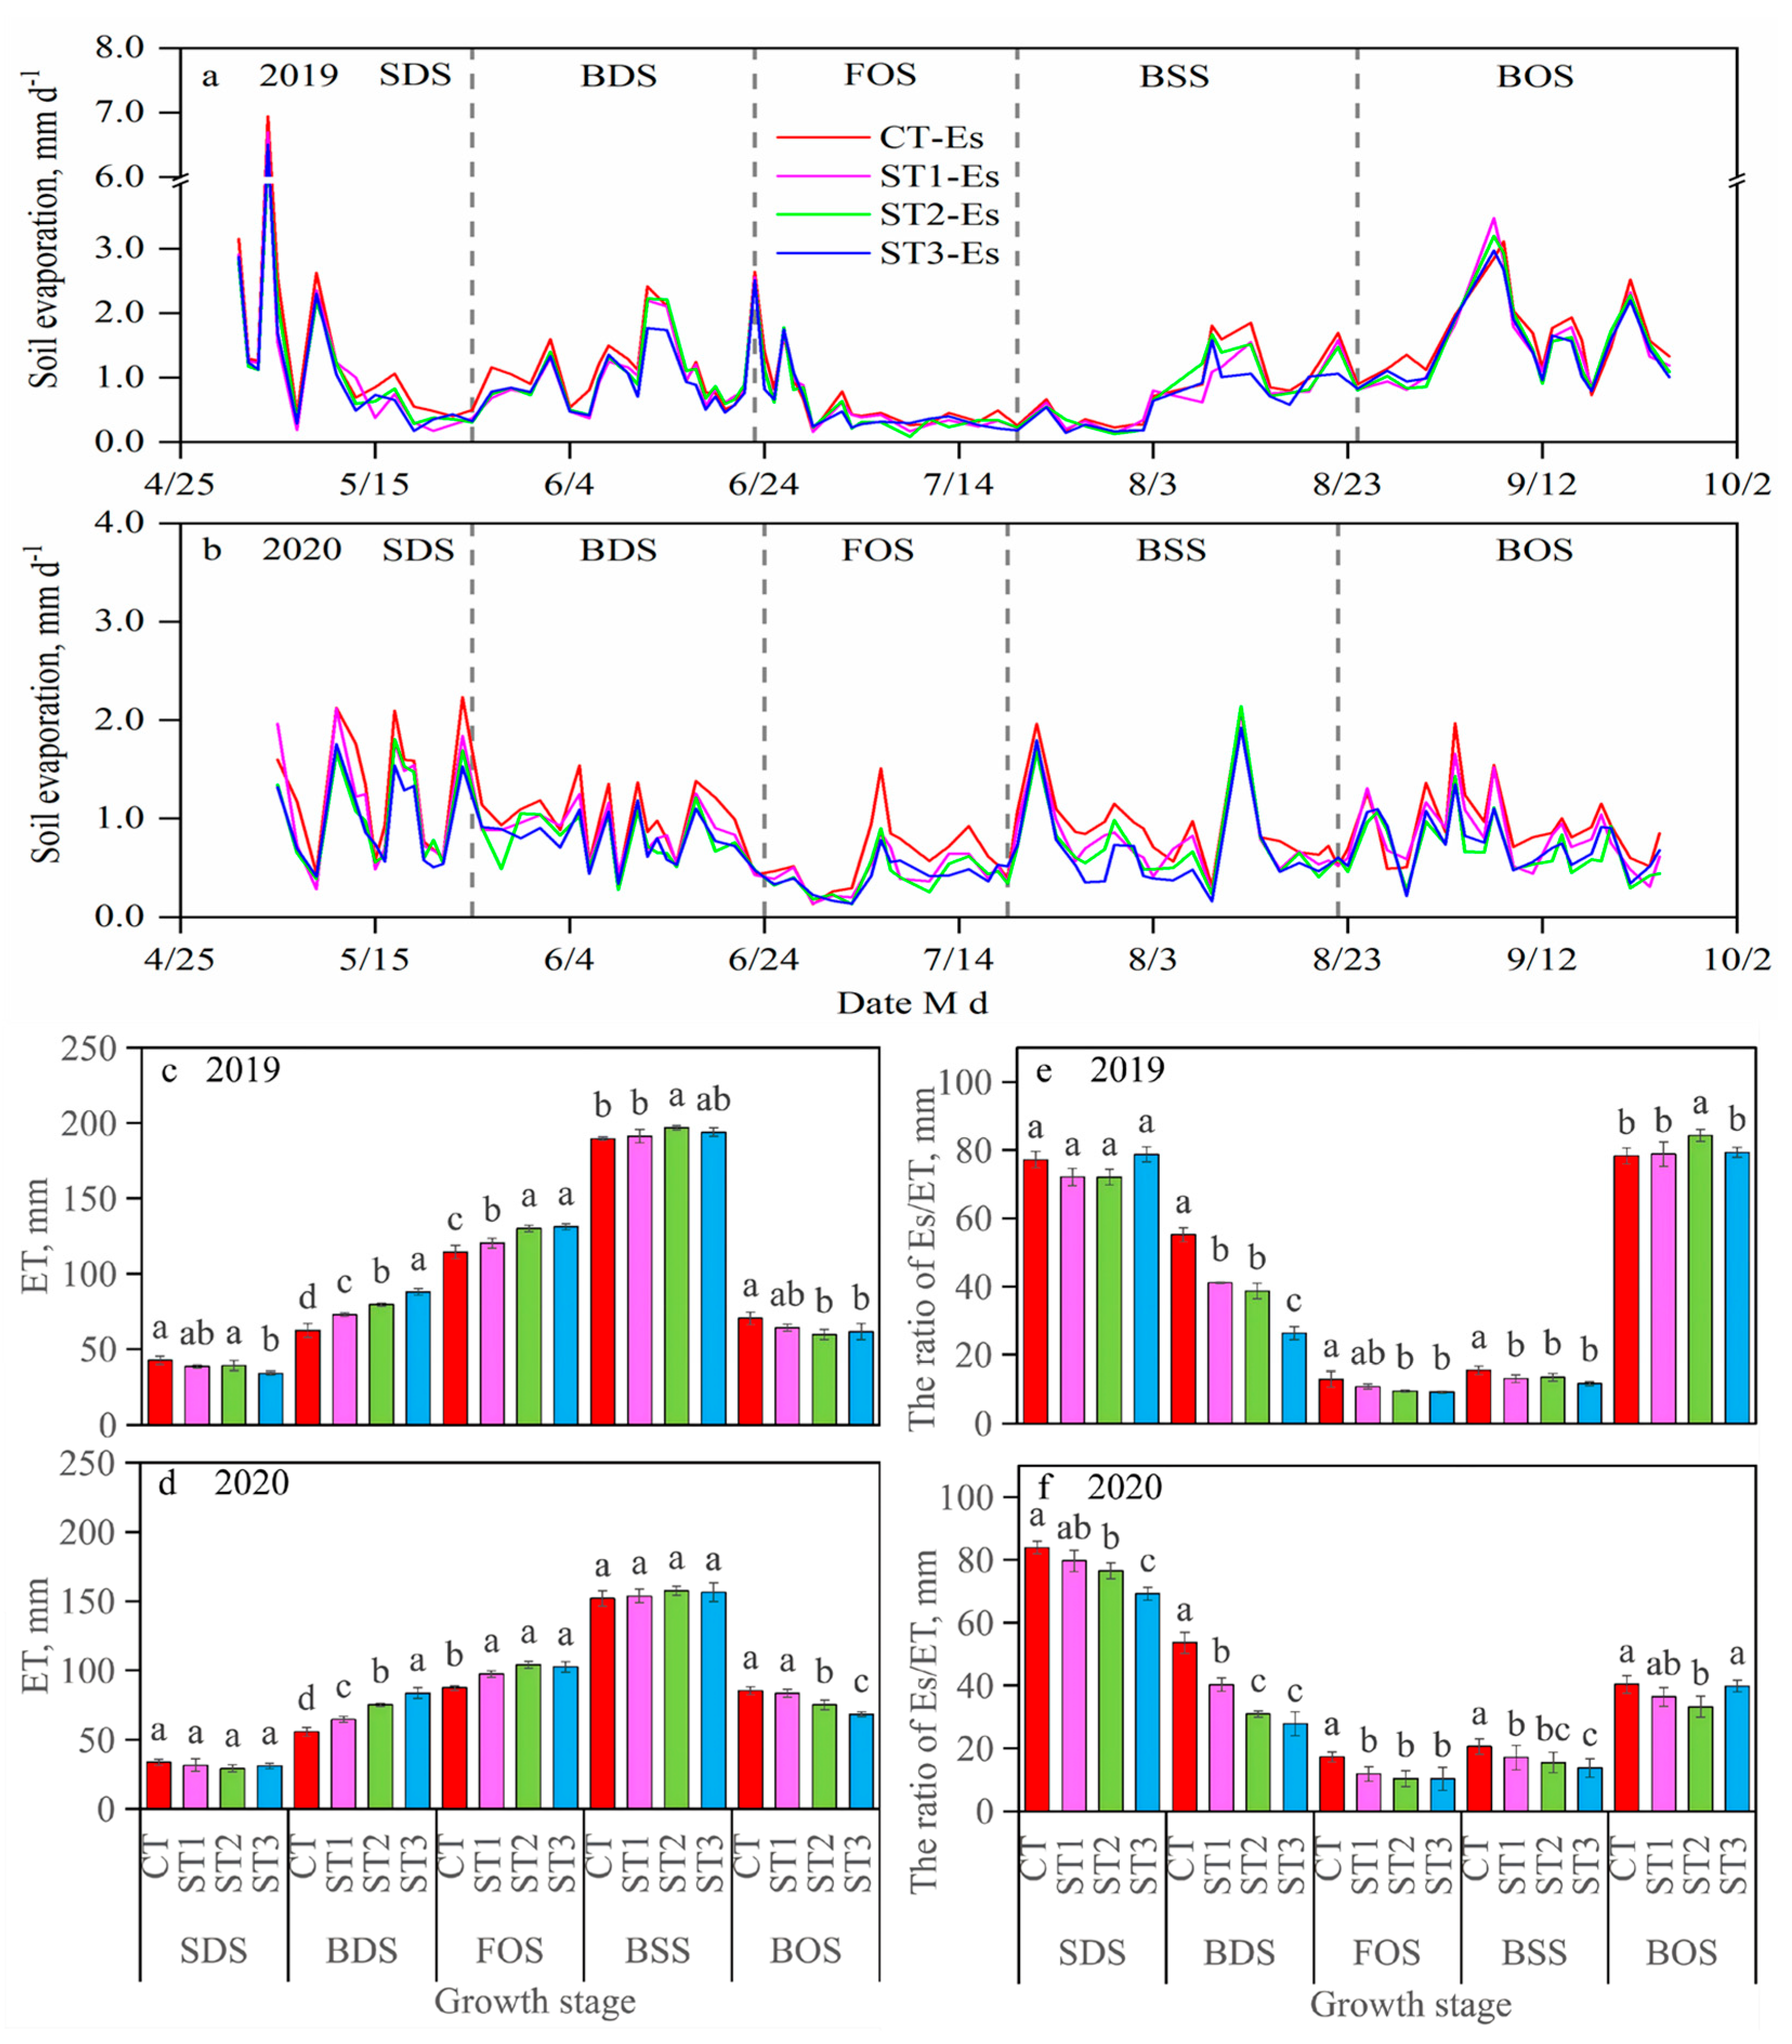
Daily Es varied with growth stage (Figure 6a,b). Across both seasons, daily Es was consistently highest under CT and lowest under ST3 (Figure 6a,b). The mean daily Es for CT, ST1, ST2, and ST3 were 1.20, 1.07, 1.08, and 1.01 mm d−1 in 2019 and 0.96, 0.82, 0.73, and 0.72 mm d−1 in 2020, respectively. Over the two years, the mean daily Es for ST1, ST2, and ST3 was 12.5%, 16.2%, and 19.9% lower than CT (Figure 6a,b). An increase in daily Es was observed after each irrigation or rainfall event, gradually decreasing thereafter, with more pronounced changes in evaporation from bare soil.
Figure 6.
Dynamics of daily soil evaporation (Es) (a,b) and evapotranspiration (ET) (c,d) and the ratio of soil evaporation to evapotranspiration (Es/ET) (e,f) under different subsoiling depths during the 2019 and 2020 cotton growing seasons. Different lowercase letters within the same growth stage indicate significant differences in ET among treatments at p < 0.05. CT: no subsoiling; ST1: 30 cm subsoiling; ST2: 40 cm subsoiling; ST3: 50 cm subsoiling. SDS: seedling stage; BDS: squaring stage; FOS: flowering stage; BSS: boll-setting stage; BOS: boll-opening stage.
Consistently and stably reduced cumulative soil evaporation (Es) across all growth stages over the two years (two-way ANOVA showed no significant year × treatment interaction, p > 0.05; overall cross-year comparison p < 0.05; Table 2). In 2019, ST1, ST2, and ST3 significantly reduced Es during the seedling stages by 15.6%, 14.8%, and 17.7%, respectively, compared to CT, while differences during the full flowering and boll-opening stages were not significant. In 2020, cumulative Es under subsoiling were significantly lower than CT at all stages, with significant differences among all four treatments. Combining the data from both years, subsoiling significantly reduced total Es (p < 0.05; Table 2), with the order for total Es being CT > ST1 > ST2 > ST3. Compared to CT, total Es for ST1, ST2, and ST3 were reduced by an average of 13.0%, 17.5%, and 22.4%, respectively. Regarding transpiration (Tp), both growing seasons showed relatively small differences in Tp among different subsoiling treatments during the early (seedling) and late (boll-opening) stages (Table 2). From the squaring to peak boll-setting stages, subsoiling significantly increased Tp, with the order ST3 > ST2 > ST1 > CT (Table 2). During the full flowering and peak boll-setting stages, Tp for ST1, ST2, and ST3 was 13.4%, 23.7%, and 23.4%, and 4.7%, 8.3%, and 9.4% higher than CT, on average. The total seasonal Tp increased significantly with increasing subsoiling depth, with ST1, ST2, and ST3 showing average increases of 11.0%, 18.0%, and 21.3% over CT (p < 0.05; Table 2). In summary, subsoiling exhibited a consistent effect pattern across different years, significantly suppressed soil evaporation, reduced ineffective water consumption, and increased effective plant transpiration, with ST3 being the most effective, followed by ST2, both superior to ST1.
Table 2.
Seasonal soil evaporation (Es) and crop transpiration (Tp) at different growth stages under various subsoiling depths in 2019 and 2020. Data are presented as mean ± SD; different lowercase letters indicate significant differences among treatments within the same year (based on one-way ANOVA and LSD test using data from that year, p < 0.05). Different uppercase letters indicate overall differences based on the combined data of all observations for each treatment across 2019 and 2020 (based on one-way ANOVA and LSD test using data from both years, p < 0.05). CT: no subsoiling; ST1: 30 cm subsoiling; ST2: 40 cm subsoiling; ST3: 50 cm subsoiling. SDS: seedling stage; BDS: squaring stage; FOS: flowering stage; BSS: boll-setting stage; BOS: boll-opening stage; WGS: whole growing season.
3.3. Variations in Proportions of ET and the Ratio of Tp/ET or Es/ET
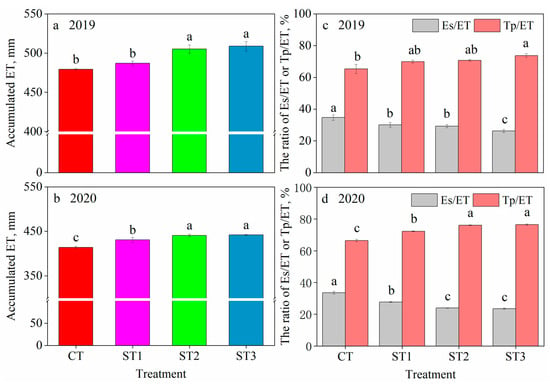
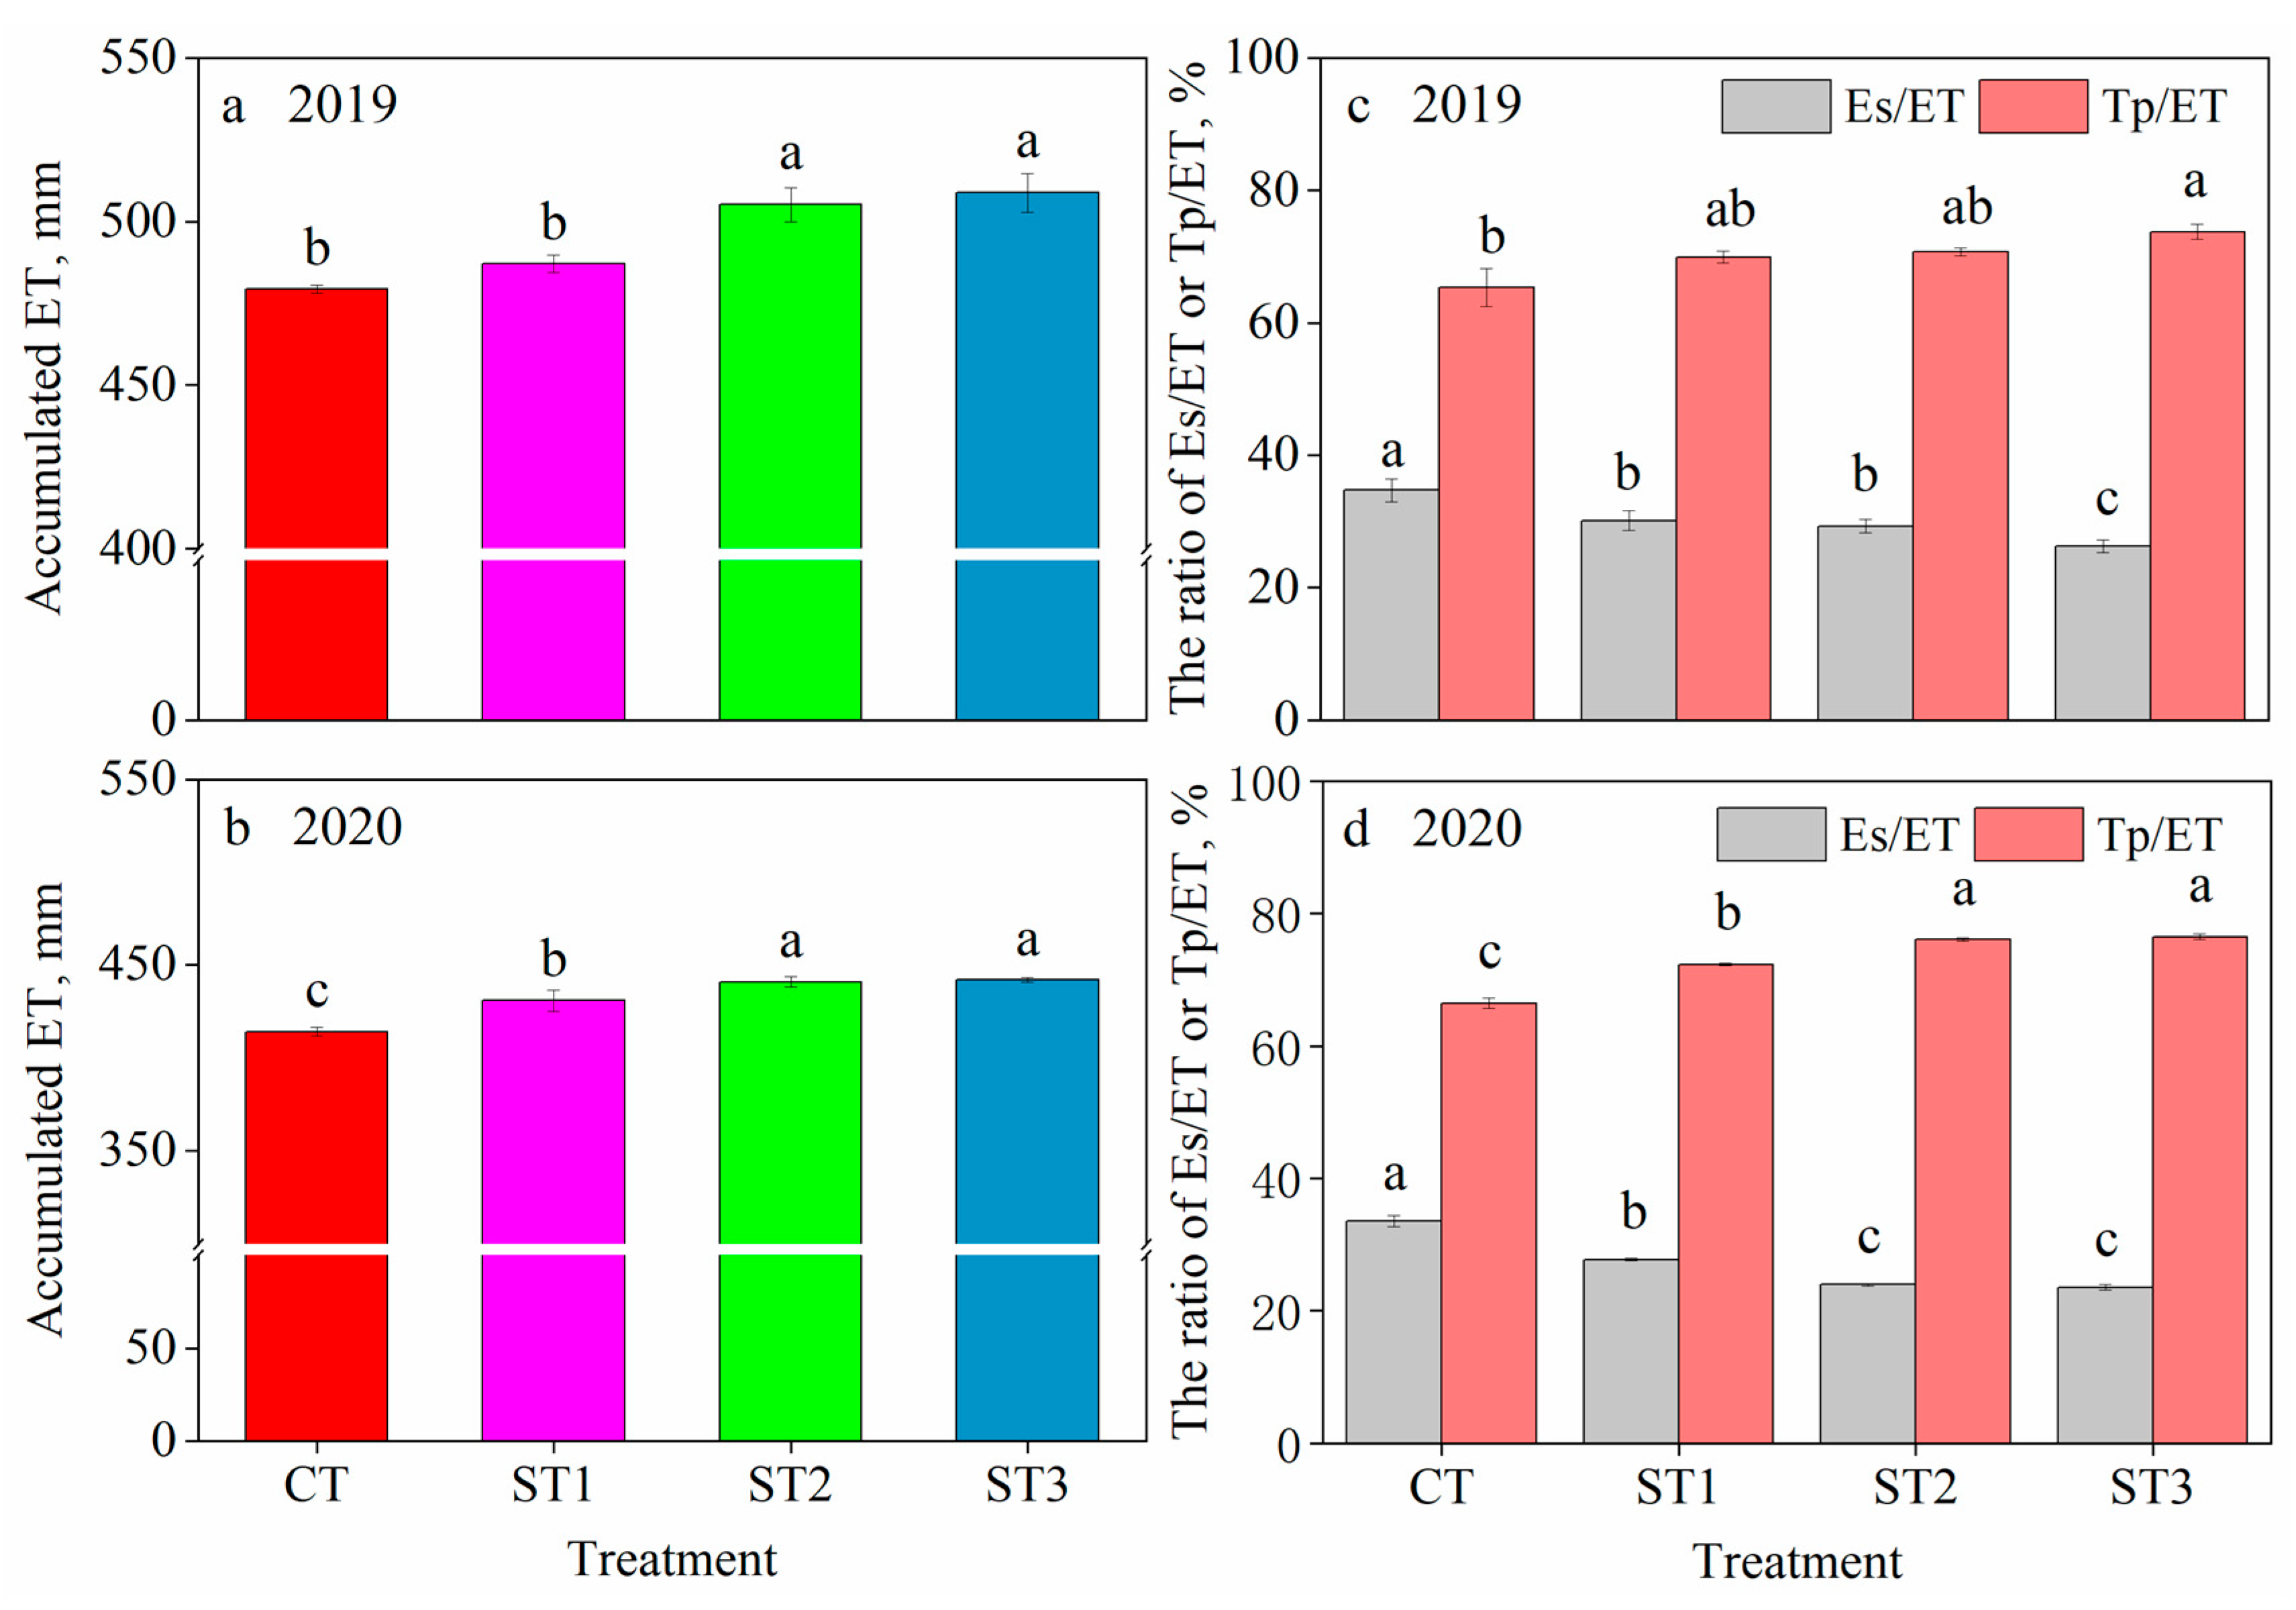
During the seedling stage, differences in ET among the four treatments were small. During the squaring stage, ET differed significantly among subsoiling depths, increasing with deeper subsoiling (p < 0.05; Figure 6c,d). In 2019, ET for ST1, ST2, and ST3 was 17.0%, 27.8%, and 41.2% higher than CT, respectively; corresponding increases in 2020 were 15.8%, 34.9%, and 50.1%. During the full flowering stage, ET for ST2 and ST3 was significantly higher than CT, by 16.4% and 16.0% on average over the two years (p < 0.05; Figure 6c,d). During the late growth stage (BOS), ET decreased with increasing subsoiling depth in both years, a pattern similar to the early season, indicating that subsoiling reduced soil water consumption during the initial and final stages, favoring enhanced water uptake capacity during the mid-season. The two-year results showed that the order of total seasonal ET across subsoiling treatments was ST3 > ST2 > ST1 > CT. The total ET for ST2 and ST3 was significantly higher than for CT and ST1, but the difference between ST2 and ST3 was not significant (Figure 7a,b), with average increases of 6.0% and 6.5% over CT, respectively. In 2020, total seasonal ET ranged from 414.1 mm (CT) to 442.0 mm (ST3), averaging 432.0 mm. The seasonal total ET in 2019 (average 495.1 mm) was 14.6% higher than in 2020, primarily due to 60 mm more precipitation.
Figure 7.
Effects of subsoiling depth on accumulated seasonal evapotranspiration (ET) (a,b) and the ratio of transpiration or evaporation to evapotranspiration (Es/ET, Tp/ET) (c,d) in 2019 and 2020. Different lowercase letters above the bars indicate significant differences among treatments at p < 0.05. CT: no subsoiling; ST1: 30 cm subsoiling; ST2: 40 cm subsoiling; ST3: 50 cm subsoiling.
The variation in the Es/ET ratio during different growth stages in 2019–2020 exhibited distinct seasonality (Figure 6e,f). Es dominated ET during the early stage (accounting for 70–85%). In 2020, the Es/ET ratio for CT, ST1, ST2, and ST3 was 83.9%, 79.7%, 76.5%, and 69.2%, respectively (Figure 6f). The ratio decreased significantly during the squaring stage, as subsoiling depth increased from CT to ST3, the average Es/ET ratio decreased from 54.4% (CT) to 27.1% (ST3). It stabilized at its lowest level (10–20%) from the full flowering to peak boll-setting stages. During this period, the Es/ET ratio was still highest for CT, followed by ST1, ST2, and ST3. The ratio increased during the late growth stage, particularly in 2019 when the boll-opening stage had a higher Es/ET ratio due to substantial rainfall between August 25 and September 10; the ratio was strongly influenced by Es.
Subsoiling significantly reduced the contribution of Es to total seasonal ET over the two seasons. The total seasonal Es/ET ratio followed the order ST3 < ST2 < ST1 < CT, ranging from 23.5% to 34.7% (Figure 7c,d). The average Es/ET for CT was 34.1%, meaning approximately one-third of the water was lost as evaporation. Compared to CT, the total Es/ET ratio for ST1, ST2, and ST3 decreased by an average of 15.3%, 22.1%, and 27.1%, respectively. The total seasonal Tp/ET ratio showed an opposite trend to Es/ET, increasing with subsoiling depth (Figure 7c,d). The Tp/ET for ST3 was significantly higher than CT by an average of 14.0%, but not significantly different from ST2. These results indicate that subsoiling reduced the Es/ET ratio during most growth stages, primarily by altering soil moisture dynamics to reduce ineffective evaporation while simultaneously intensifying crop water consumption.
3.4. Plant Growth, Yield, and Yield Components
Over the 2019–2020 seasons, plant height at maturity under ST2 and ST3 was significantly greater than under CT (Table 3). The maximum leaf area index (LAI) increased with subsoiling depth, with ST3 being significantly higher than the other treatments (p < 0.05; Table 3). Total biomass was significantly lower in CT and ST1 plots compared to ST2 and ST3. The effects of ST2 and ST3 on total biomass were not significantly different; ST2 had the highest average total biomass (23.7 t ha−1), which was 25.9% and 12.7% higher than CT (18.8 t ha−1) and ST1 (21.1 t ha−1), respectively (Table 3). Subsoiling had no significant effect on the harvest index. ST2 and ST3 significantly increased seed cotton yield in both 2019 and 2020 (p > 0.05; Table 3). Compared to CT and ST1, ST2 increased yield by 8.0–15.5% (2019) and 13.7–34.4% (2020), while ST3 increased yield by 5.6–13.0% (2019) and 12.7–33.2% (2020). Within two years, seed cotton yield followed the order ST2 > ST3 > ST1 > CT. The higher yield under ST2 was associated with a higher boll number and greater single boll mass. The boll number for ST2 was 7.6% and 15.6% higher than CT in 2019 and 2020, respectively. Single boll mass under ST2 and ST3 was significantly greater than under CT and ST1 (p < 0.05; Table 3). Due to more favorable climatic conditions in 2019, the average seed cotton yield, total biomass at maturity, and boll number were all higher than in 2020, respectively; the relative effect patterns among treatments remained stable across years. While ST1, ST2, and ST3 all increased total biomass, boll number, and seed cotton yield compared to CT, the highest values for these parameters were achieved at the 40 cm subsoiling depth (ST2) in both growing seasons, further confirming the year-to-year consistency of the treatment effects.
Table 3.
Effects of subsoiling depth on plant growth, yield, and yield components of cotton in 2019 and 2020. Data are presented as mean ± SD, different lowercase letters indicate significant differences among treatments within the same year (based on one-way ANOVA and LSD test using data from that year, p < 0.05). Different uppercase letters indicate overall differences based on the combined data of all observations for each treatment across 2019 and 2020 (based on one-way ANOVA and LSD test using data from both years, p < 0.05). CT: no subsoiling; ST1: 30 cm subsoiling; ST2: 40 cm subsoiling; ST3: 50 cm subsoiling. ET: seasonal crop evapotranspiration.
3.5. Variations in Water Use Efficiency
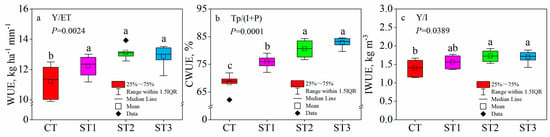
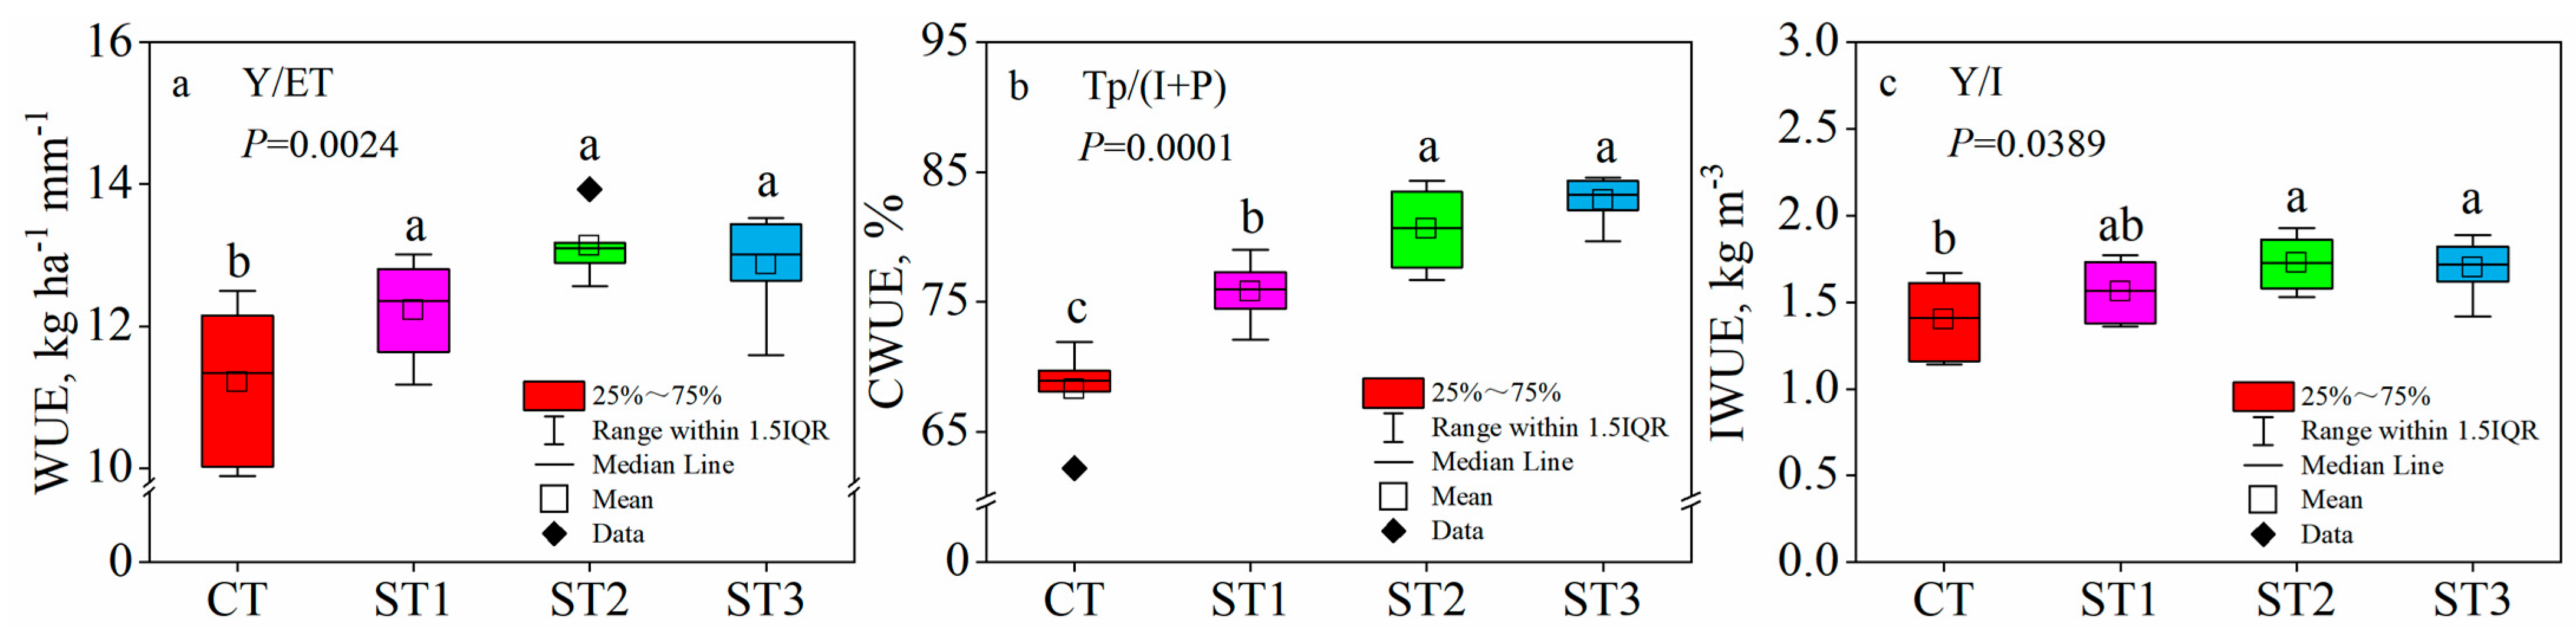
During the two-year experimental period from 2019 to 2020, there were significant differences (p < 0.05) in the effects of different subsoiling treatments on WUE, CWUE, and IWUE. Both WUE and IWUE under CT were significantly lower than under ST2 and ST3, with no significant difference between ST2 and ST3 (Figure 8a,c). The highest WUE and IWUE values were observed for ST2 (13.1 kg ha−1 mm−1 and 1.7 kg m−3). Compared to CT, the average WUE for ST1, ST2, and ST3 increased by 9.1%, 17.2%, and 14.8%, respectively, while the average IWUE increased by 11.7%, 23.4%, and 21.5%, respectively (Figure 8a,c). The boxes for ST2 and ST3 were very compact (IQR: 0.5–1.0), indicating good stability across years and replicates. CWUE gradually increased with subsoiling depth over both years, and both ST2 and ST3 were significantly higher than CT and ST1. Compared to CT, ST1, ST2, and ST3 increased the average CWUE by 11.0%, 18.0%, and 21.4%, respectively (Figure 8b). These results demonstrate that subsoiling significantly improved WUE, CWUE, and IWUE. Under drip irrigation, IWUE is a more realistic indicator of crop water productivity. Based on a comprehensive evaluation from three dimensions—stability, efficiency, and practical water-saving significance—the ST2 (moderate-depth subsoiling) treatment showed the optimal effect in improving water productivity of drip-irrigated cotton.
Figure 8.
Effect of subsoiling depth on cotton water use efficiency (WUE) (a), effective water utilization coefficient (CWUE) (b), and irrigation water use efficiency (IWUE) (c) in 2019 and 2020. Note: The box plots were drawn based on combined data from all replicate observations for each treatment in 2019 and 2020. Different lowercase letters above the boxes indicate significant differences among treatments at p < 0.05 level by one-way ANOVA. CT: no subsoiling; ST1: 30 cm subsoiling; ST2: 40 cm subsoiling; ST3: 50 cm subsoiling.
3.6. Links Among Yield, WUE, ET, and the Total Es/ET Ratio
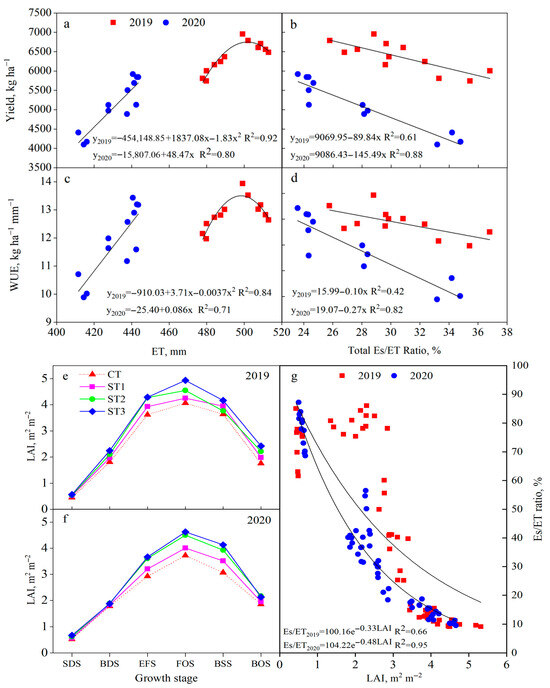
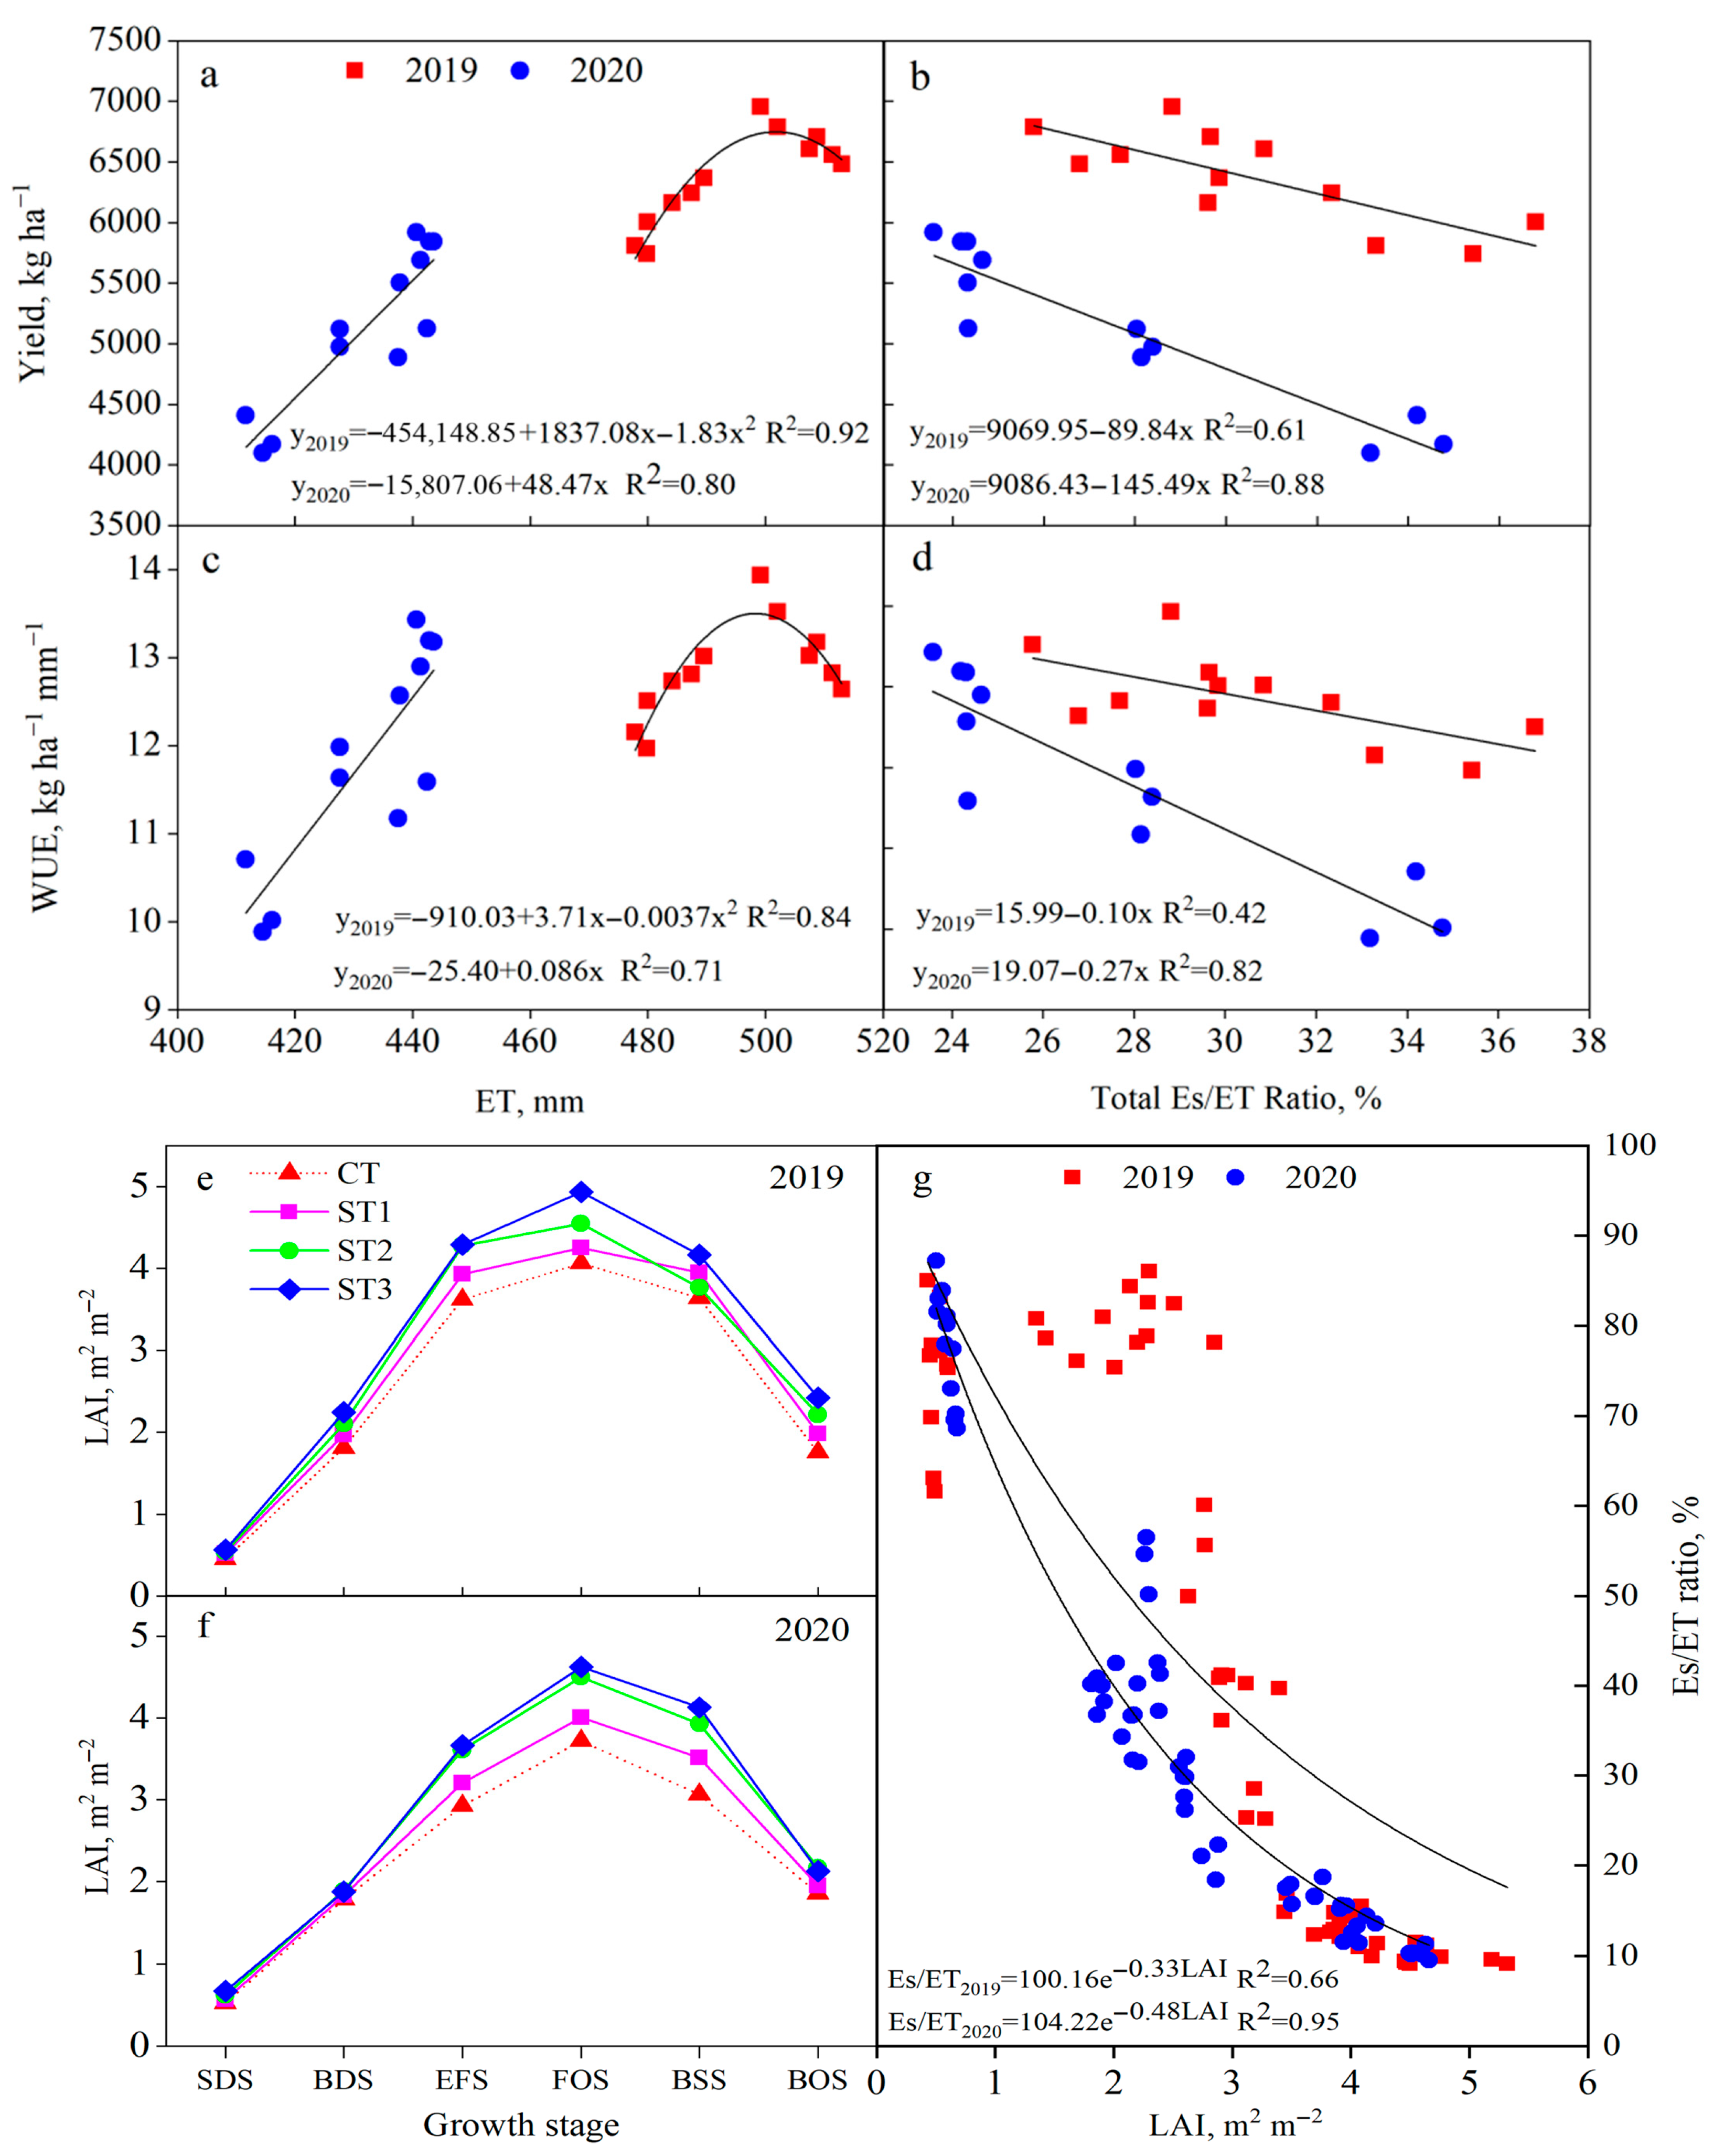
During the 2019–2020 seasons, seed cotton yield and WUE showed similar responses to ET (Figure 9a,c). When ET was below 500 mm, yield and WUE were positively correlated with ET; beyond this point, further increases in ET led to a negative correlation (Figure 9a,c), suggesting that excessively high ET typically reduces yield and WUE. Yield and WUE were negatively correlated with the total Es/ET ratio in both seasons (Figure 9b,d), indicating that a high Es/ET ratio generally reduces yield and WUE. The R2 values were larger and the decline more pronounced in 2020. Therefore, to enhance seed cotton yield and WUE, ET should be maintained within an appropriate range while minimizing the Es/ET ratio or maximizing the Tp/ET ratio. Integrating these findings with earlier results, while ST3 had the highest ET during key growth stages and the total seasonal ET, and the Es/ET ratio decreased with increasing subsoiling depth, both yield and WUE were higher for ST2 than for ST3. In conclusion, the ST2 treatment optimally maintained a low Es/ET ratio while achieving high yield and WUE.
Figure 9.
Relationships between seed cotton yield, water use efficiency (WUE) and seasonal evapotranspiration (ET) or the ratio of soil evaporation to evapotranspiration (Es/ET) (a–d), and dynamics of the leaf area index (LAI) (e,f) and links to the Es/ET ratio (g) across different subsoiling treatments in 2019 and 2020.
The leaf area index (LAI) exhibited a unimodal curve during the growing season, with the maximum value occurring at the full flowering stage (Figure 9e,f). Over the two years, ST3 generally had the highest LAI, followed by ST2, and CT the lowest, except during the peak boll-setting stage in 2019. The relationship between the Es/ET ratio and LAI followed an exponential function (Figure 9g), with the Es/ET ratio decreasing as LAI increased. In 2019, influenced by higher rainfall during the boll-opening stage, evaporation rates increased rapidly, leading to a wider distribution of Es/ET ratios between 0.5 and 2.5. In 2020, the Es/ET ratios were primarily distributed between 2.0 and 4.5. Additionally, LAI increased in the wetter growing season (2019), but the Es/ET ratio was also higher compared to the normal year (2020).
4. Discussion
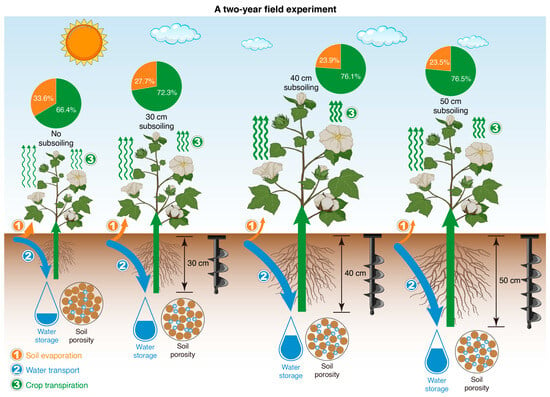
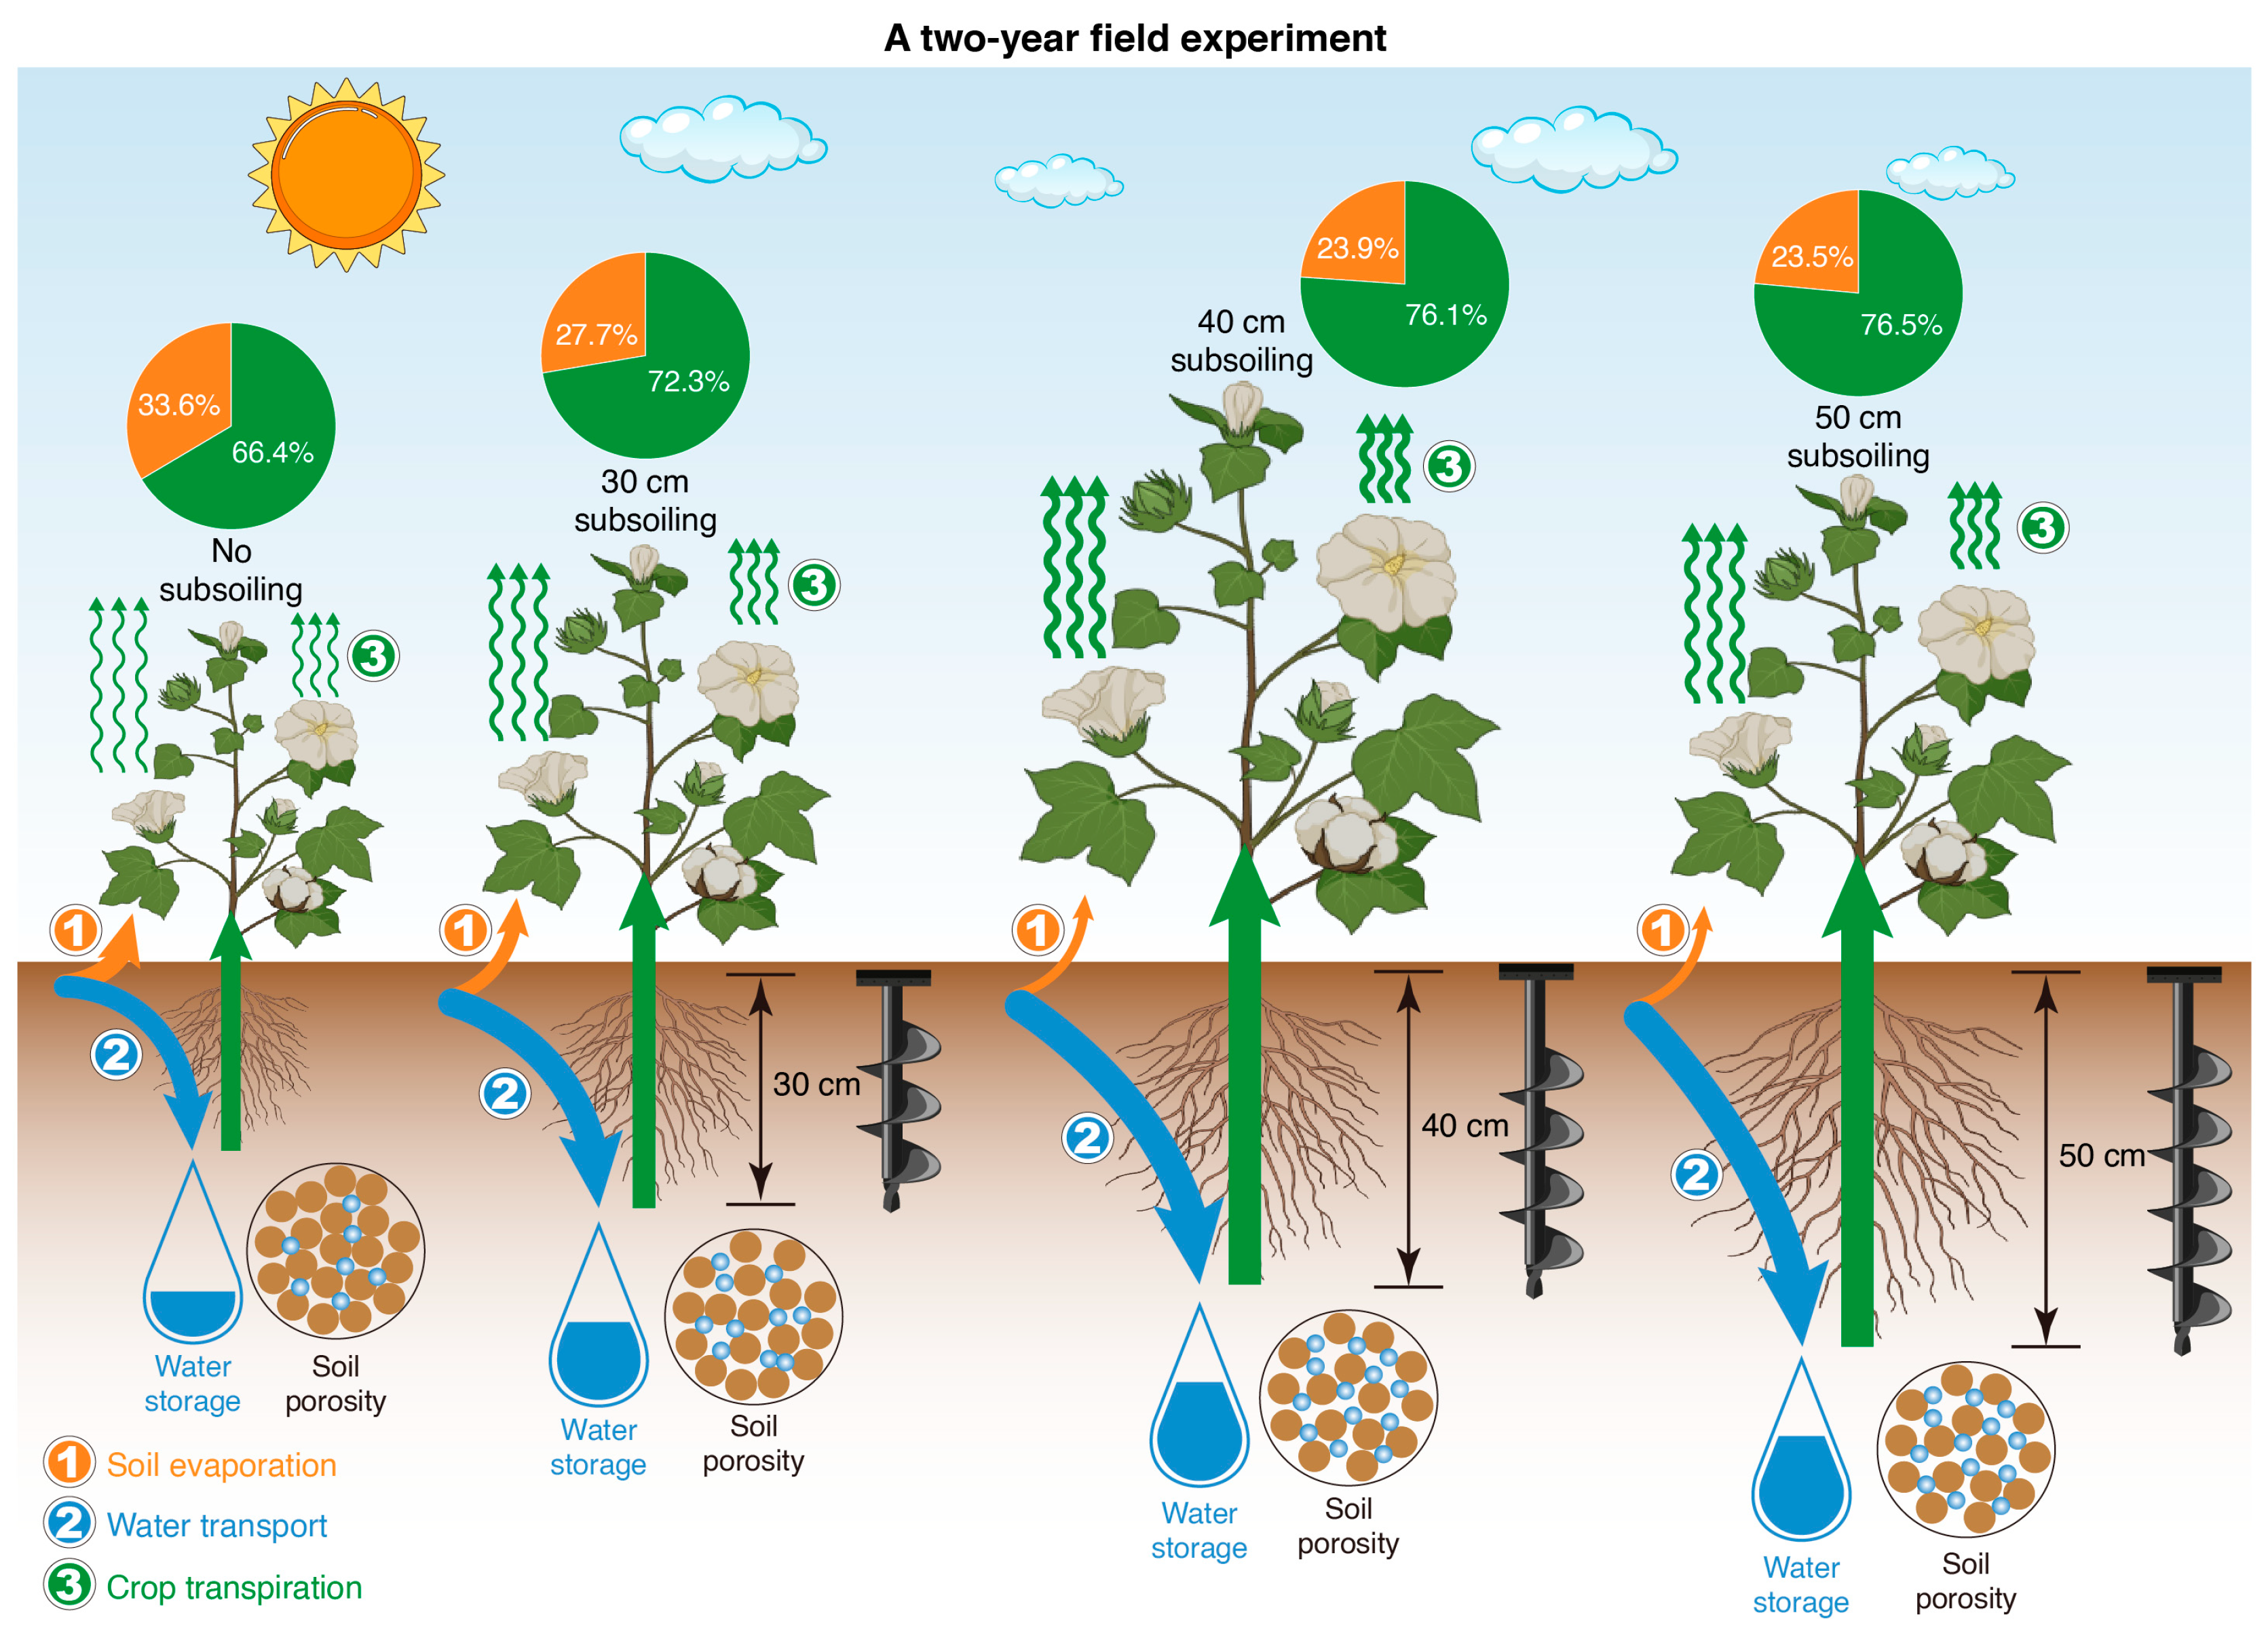
Our study provides a mechanistic understanding of how subsoiling depth alters the soil–plant–water continuum to influence water partitioning and productivity in a mulching drip irrigation cotton system within an arid oasis ecosystem, specifically in Southern Xinjiang (Figure 10). The central finding is that while subsoiling generally enhances deep water utilization and plant transpiration, the relationship between subsoiling depth and agronomic performance is not linear. The 40 cm depth (ST2) emerged as the optimal practice, achieving the highest seed cotton yield and water use efficiency by optimally balancing the enhancement of productive water loss (Tp) against the suppression of non-productive water loss (Es) and associated metabolic costs.
Figure 10.
Schematic diagram depicting how subsoiling influences the evapotranspiration partitioning, water use efficiency, and crop yield of mulching drip irrigation cotton fields.
4.1. Subsoiling Alters Soil Hydro-Physical Properties to Modulate Root Zone Water Dynamics
The primary mechanical effect of subsoiling is the disruption of the plow pan, a common feature in long-term conventionally tilled soils that drastically reduces hydraulic conductivity and root penetration [19,20,41]. This tillage-induced compaction layer, often termed a “hardpan”, is a well-documented constraint to water movement and crop productivity in intensively managed soils [14,42,43]. Our results confirm that this intervention had a profound impact on soil water storage (SWS). The higher early-season SWC under deeper subsoiling (ST2, ST3; Figure 4) aligns with studies showing that subsoiling fractures compacted layers, creating macro-pores and fissures that enhance water infiltration and reduce surface runoff, thereby increasing the plant-available “water bank” in the root zone [32,44,45]. The practice effectively mitigates subsurface compaction, a key component of soil physical degradation [12]. Crucially, the subsequent shift to lower SWS in the 0–60 cm layer during peak demand. Crucially, the subsequent shift to lower SWS in the 0–60 cm layer during peak demand (Figure 4 and Figure 5) signals enhanced root exploration. This is a direct consequence of alleviated physical impedance, allowing roots to access deeper soil moisture—a critical adaptation to drought stress during reproductive stages [46,47,48]. This demonstrates that subsoiling acts not merely as a water conservation practice, but as a water management strategy that reallocates soil water from early-season storage to mid-season consumption.
The increased water consumption during the mid-season under subsoiling, especially ST3, directly translates to a greater capacity to meet atmospheric demand and support physiological processes. This aligns with the observed significant increase in seasonal transpiration (Tp) with subsoiling depth (Table 2). Our findings thus demonstrate that subsoiling functions not merely as a water conservation practice, but as a water management practice that reallocates soil water from early-season storage to mid-season consumption, precisely when the crop’s water demand peaks.
4.2. Strategic Partitioning of Evapotranspiration: The Key to Enhanced Water Use Efficiency
It is established that plastic mulch is highly effective at reducing Es, especially in early growth stages [49,50]. Long-term mulched drip irrigation could improve soil structure and is sustainable in arid northwest China [11]. In this line, disentangling how subsoiling alters water use efficiency in such regions is timely and relevant. A pivotal finding of this study is the dramatic shift in evapotranspiration (ET) partitioning induced by subsoiling. Accurately quantifying the components of ET—soil evaporation (Es) and plant transpiration (Tp)—is fundamental for diagnosing true water savings in agronomic systems [30]. The reduction in the Es/ET ratio and the concomitant increase in the Tp/ET ratio (Figure 6 and Figure 7) underscore a fundamental improvement in the effectiveness of water use. The significant suppression of cumulative soil evaporation (Es) under subsoiling, with ST3 being most effective (Table 2), can be attributed to a combination of factors. Firstly, the improved infiltration and subsequent downward movement of water reduce surface moisture availability for evaporation [19,51,52]. Secondly, the enhanced crop growth and faster canopy closure, evidenced by the higher Leaf Area Index (LAI) in subsoiled plots (Table 3, Figure 9), provide greater shading of the soil surface, further mitigating Es [53,54,55].
The strong exponential relationship between LAI and the Es/ET ratio (Figure 9g) confirms that canopy development is a primary driver in controlling non-productive water loss. By reducing Es, a larger proportion of the finite water resource (irrigation + precipitation) is channeled through the plant as transpiration (Tp), which is directly coupled with photosynthesis and biomass production [56,57,58,59]. This shift from evaporation to transpiration is the core physiological mechanism for improving crop water productivity under drought conditions [25,59]. This mechanistic shift from evaporation to transpiration is the cornerstone of the improved water use efficiency (WUE) and effective water utilization coefficient (CWUE) observed in our study (Figure 8). The higher irrigation water use efficiency (IWUE) under ST2 is particularly significant for drip-irrigated cotton fields in the sandy loam soils of the arid Southern Xinjiang region, indicating more seed cotton yield produced per unit of applied irrigation water, a critical metric for sustainable water resource management.
4.3. The Non-Linear Response of Yield to Subsoiling Depth: An Optimization Between Resource Acquisition and Allocation
While deeper subsoiling (ST3) led to the most pronounced improvements in soil water extraction and transpiration, it was the 40 cm depth (ST2) that consistently delivered the highest seed cotton yield and IWUE (Table 3, Figure 8). This apparent paradox highlights a crucial ecological and agronomic principle: maximum resource acquisition does not necessarily translate to optimal economic yield if it incurs high metabolic costs [60,61,62]. In this line, the ST3 treatment likely stimulated excessive root growth at the expense of reproductive investment. Deeper root systems require significant carbon and nutrient investment, which might have been diverted from boll formation and filling [63,64,65]. Crop responses to improved water availability must be analyzed through the framework of resource allocation trade-offs, where biomass partitioning between roots, shoots, and reproductive organs determines final yield [60]. This is supported by the yield components data, where ST2 achieved the highest boll number and single boll mass, surpassing even ST3 (Table 3).
Furthermore, the path analysis and the relationship between ET and yield (Figure 9) revealed an important threshold. While yield increased with ET up to a point, excessively high ET, as seen in ST3, was associated with a yield decline. This suggests that beyond an optimal level, further increases in water consumption may not contribute to yield and could even be detrimental, potentially due to subtle nutrient leaching or a shift in the carbon allocation strategy away from reproduction. Such non-linear responses are characteristic of many agronomic interventions, where an optimal intensity must be identified [17]. Therefore, the 40 cm subsoiling depth (ST2) appears to strike an optimal balance, sufficiently disrupting the plow pan to enhance deep-water access and Tp, while avoiding the potential over-investment in root biomass associated with the 50 cm depth, thereby maximizing harvest index and yield.
4.4. Implications and Future Perspectives
Our research moves beyond simply recommending a tillage practice; it provides a physiological and hydrological framework for optimizing water management in arid agroecosystems. The demonstrated ability of moderate subsoiling (40 cm) to systematically repartition ET towards more productive transpiration offers a sustainable pathway to intensify cotton production under water scarcity. This aligns with the global imperative to enhance green water use efficiency—the productive use of rainfall and soil moisture—which is critical for agricultural sustainability [30]. This strategy is more resilient than mere irrigation reduction, as it enhances the crop’s inherent capacity to utilize soil water reserves effectively. A limitation of this study is its focus on a single soil type (sandy loam) and a two-year period. Future research should explore the interaction between subsoiling depth and varying irrigation regimes (e.g., deficit irrigation) across different soil textures. Integrating process-based crop models that simulate root growth and water uptake could help extrapolate these findings and optimize management for different environments [59]. Furthermore, integrating molecular techniques to study root architecture and function, coupled with stable isotope analysis (e.g., δ18O) to precisely quantify depth-specific water uptake, could provide deeper insights into the plant-level mechanisms driving the observed responses.
This study employed a fixed irrigation regime across all treatments, which is representative of local farmer practice. While this design successfully revealed how subsoiling depth repartitions a given water input, it also presents a limitation. The improvements in soil porosity and infiltration capacity induced by deeper subsoiling suggest that the optimal irrigation volume might be treatment-dependent. Future research should investigate the interaction between subsoiling depth and irrigation regimes (e.g., deficit irrigation) to identify combinations that maximize water productivity. Furthermore, our measurement of soil evaporation (Es) using micro-lysimeters in the bare inter-film zone requires careful interpretation. This method provides a valuable index for relative comparison between treatments. However, the absolute value of Es is likely an overestimate for the field-scale average, as the plastic film mulch covering the majority of the soil surface suppresses evaporation. The subsoiling operation itself was confined to the planted rows beneath the film; therefore, our Es measurements primarily reflect the treatment’s indirect effect on soil moisture conditions influencing evaporation from the untilled bare soil zone. Future studies could employ micro-lysimeters under the film or use numerical modeling to better partition ET components under such managed conditions.
While this two-year experiment demonstrated the immediate hydro-physiological benefits of subsoiling, the sustainability of these practices warrants consideration over longer timescales. Long-term studies in analogous arid and semi-arid regions of north-west China indicate that periodic subsoiling, particularly when integrated into rotational tillage systems, can drive progressive improvements in subsoil fertility—notably enhancing soil organic carbon sequestration and aggregate stability at depths of 20–40 cm [52,66,67]. These changes foster a more resilient soil matrix conducive to deep rooting. Therefore, the optimal 40 cm depth identified here may represent a key management variable not only for immediate water partitioning but also for initiating positive feedback loops in soil health. Furthermore, by systematically reducing the evaporation fraction (Es/ET), subsoiling could contribute to the long-term mitigation of secondary soil salinization in irrigated oasis fields [68]. Future research should verify these long-term effects in the specific context of Southern Xinjiang’s sandy loam soils and examine optimal subsoiling frequencies within integrated crop and soil management cycles.
5. Conclusions
Under sandy loam soil conditions in the mulched drip-irrigated cotton fields of Southern Xinjiang, increasing subsoiling depth systematically shifted evapotranspiration partitioning from non-productive soil evaporation to productive plant transpiration. High-depth subsoiling (50 cm) most effectively suppressed soil evaporation and enhanced deep-water extraction, thereby maximizing the transpiration fraction. Differently, medium-depth subsoiling (40 cm) uniquely optimized seed cotton yield and irrigation water use efficiency. This optimum reflects a critical trade-off: while deeper subsoiling enhanced root exploration and water access, it likely incurred a higher carbon cost for root proliferation. The 50 cm treatment appeared to divert photosynthetic resources from boll development, whereas the 40 cm depth balanced root investment with reproductive growth. Overall, our findings demonstrate that in the mulched drip-irrigated cotton region of Southern Xinjiang, strategic, medium-depth subsoiling engineers a more resilient soil–plant–water continuum by optimally repartitioning water flow and carbon allocation. This study provides a mechanistic basis for tillage management, emphasizing the pressing need to optimize subsoiling depth, not just its implementation, to secure crop production and enhance water sustainability in arid agroecosystems.
Author Contributions
Investigation, L.W., R.G., G.T. and N.Z.; formal analysis, L.W., Z.L., G.T. and N.Z.; validation, L.W. and R.G.; visualization, L.W. and Z.Z.; data curation, Z.Z.; writing—original draft, L.W. and Z.L.; writing—review and editing, L.W., Q.T., L.T. and J.C.; resources, T.L.; Conceptualization, L.T. and J.C.; methodology, Q.T. and L.T.; supervision, L.T. and J.C.; project administration, J.C.; funding acquisition, T.L. and J.C. All authors have read and agreed to the published version of the manuscript.
Funding
This research was supported by the Xinjiang Uygur Autonomous Region Key Research and Development Program (2024B02004), Xinjiang Uygur Autonomous Region Key Research and Development Program (2024B02002), Xinjiang Key Laboratory of Cotton Genetic Improvement and Intelligent Production Program (xjnkywdzc-2025002-14-05), National Cotton Industry Technology System (CARS-15-12), Project of Renovation Capacity Building for the Young Sci-Tech Talents Sponsored by the Xinjiang Academy of Agricultural Sciences (xjnkq-2019012), National Natural Science Foundation of China (32501548), and China Postdoctoral Science Foundation(2024M760964 and 2025T180733).
Data Availability Statement
The original contributions presented in this study are included in the article. Further inquiries can be directed to the corresponding author.
Conflicts of Interest
The authors declare no conflicts of interest.
Abbreviations
The following abbreviations are used in this manuscript:
| SDS | Seedling stage |
| BDS | Squaring stage |
| FOS | Flower opening stage |
| BSS | Boll-setting stage |
| BOS | Boll-opening stage |
| WGS | Whole growth stage |
| SWC | Soil water content |
| BD | Soil bulk density |
| SWS | Soil water storage |
| MLs | Micro-lysimeters |
| Es | Soil evaporation |
| Tp | Plant transpiration |
| ET | Evapotranspiration |
| HI | Harvest index |
| WUE | Water use efficiency |
| CWUE | Effective water utilization coefficient |
| IWUE | Irrigation water use efficiency |
| LAI | Leaf area index |
References
- Chen, S.; Liu, W.; Yan, Z.; Morel, J.; Parsons, D.; Du, T. Adaptation strategy can ensure seed and food production with improving water and nitrogen use efficiency under climate change. Earth’s Future 2023, 11, e2022EF002879. [Google Scholar]
- Yang, Y.; Tilman, D.; Jin, Z.; Smith, P.; Barrett, C.B.; Zhu, Y.; Burney, J.; D’Odorico, P.; Fantke, P.; Fargione, J.; et al. Climate change exacerbates the environmental impacts of agriculture. Science 2024, 385, eadn3747. [Google Scholar] [CrossRef] [Scilit]
- Vorosmarty, C.J.; Green, P.; Salisbury, J.; Lammers, R.B. Global water resources: Vulnerability from climate change and population growth. Science 2000, 289, 284–288. [Google Scholar] [CrossRef] [Scilit]
- Rosa, L.; Chiarelli, D.D.; Rulli, M.C.; Dell Angelo, J.; D’Odorico, P. Global agricultural economic water scarcity. Sci. Adv. 2020, 6, eaaz6031. [Google Scholar] [CrossRef] [Scilit]
- Tian, X.; Dong, J.; Jin, S.; He, H.; Yin, H.; Chen, X. Climate change impacts on regional agricultural irrigation water use in semi-arid environments. Agric. Water Manag. 2023, 281, 108239. [Google Scholar] [CrossRef] [Scilit]
- Gui, Y.; Huang, C.; Zhou, J.; Zhang, Z.; Wang, J.; Kang, X.; Huang, W.; Lv, X.; Zhang, L. Warming effect of the desert regulates spatio-temporal distribution of cotton Verticillium wilt for the oasis agriculture ecosystem. Ind. Crops Prod. 2024, 219, 119063. [Google Scholar] [CrossRef] [Scilit]
- Li, W.; He, J.; Wang, T.; Jia, F.; Javed, T.; Zhou, B.; Wang, Z. Effects and action pathways of oxygenation strategies for enhancing cotton yield and quality under mulched drip irrigation in arid oasis regions. Field Crops Res. 2026, 335, 110196. [Google Scholar]
- Xiao, C.; Ji, Q.; Zhang, F.; Li, Y.; Fan, J.; Hou, X.; Yan, F.; Liu, X.; Gong, K. Effects of various soil water potential thresholds for drip irrigation on soil salinity, seed cotton yield and water productivity of cotton in northwest China. Agric. Water Manag. 2023, 279, 108172. [Google Scholar] [CrossRef] [Scilit]
- Li, Z.; Zhang, F.; Ma, Y.; Wan, S.; Han, Y.; Chen, G.; Lei, Y.; Xiong, S.; Mao, T.; Feng, L.; et al. Rational optimization of irrigation regimes for drip-irrigated cotton fields without mulch can alleviate the problem of residual film contamination in arid zones. Ind. Crops Prod. 2024, 221, 119430. [Google Scholar]
- Ma, Z.; Liu, J.; Zhang, J.; Yin, F.; Guo, L.; Wen, Y.; Song, L.; Zhu, Y.; Liang, Y.; Wang, Z. Ultra-wide film mulching with moderate irrigation water salinity enhances cotton growth under drip irrigation in Xinjiang, China. Field Crops Res. 2024, 315, 109485. [Google Scholar]
- Wang, Z.; Chen, R.; Li, W.; Zhang, J.; Zhang, J.; Song, L.; Wang, J.; Li, H.; Mou, H.; Li, Z.; et al. Mulched drip irrigation: A promising practice for sustainable agriculture in China’s arid region. npj Sustain. Agric. 2024, 2, 17. [Google Scholar] [CrossRef] [Scilit]
- De Corato, U.; Viola, E.; Keswani, C.; Minkina, T. Impact of the sustainable agricultural practices for governing soil health from the perspective of a rising agri-based circular bioeconomy. Appl. Soil Ecol. 2024, 194, 105199. [Google Scholar] [CrossRef] [Scilit]
- Yang, Y.; Wu, J.; Zhao, S.; Mao, Y.; Zhang, J.; Pan, X.; He, F.; van der Ploeg, M. Impact of long-term sub-soiling tillage on soil porosity and soil physical properties in the soil profile. Land Degrad. Dev. 2021, 32, 2892–2905. [Google Scholar]
- Rathnayake, N.R.R.W.; Leelamanie, D.A.L.; Maeda, M. Shallow-depth hardpan attributes influence soil surface and subsurface hydraulic properties. Catena 2025, 259, 109405. [Google Scholar] [CrossRef] [Scilit]
- Rix, J.P.; Lo, T.H.; Gholson, D.M.; Pringle, H.C.L.; Spencer, G.D.; Singh, G. Effects of low-till parabolic subsoiling frequency and furrow irrigation frequency on maize in the Yazoo-Mississippi Delta. Agric. Water Manag. 2022, 274, 107945. [Google Scholar]
- Yuan, M.; Shangguan, X.; Wang, X.; Wei, S.; Li, B.; Liu, Z.; Zong, R.; Fan, Y.; Li, Q. Subsoiling tillage increases water-use efficiency of winter wheat by improving soil hydraulic properties associated with pore structure in the North China Plain. Crop J. 2025, 13, 1291–1300. [Google Scholar]
- Wang, Y.; Chen, S.; Zhang, D.; Yang, L.; Cui, T.; Jing, H.; Li, Y. Effects of subsoiling depth, period interval and combined tillage practice on soil properties and yield in the Huang-Huai-Hai Plain, China. J. Integr. Agric. 2020, 19, 1596–1608. [Google Scholar]
- Wang, X.; Fu, Z.; Zhang, Q.; Huang, Y. Short-term subsoiling effects with different wing mounting heights before winter wheat on soil properties and wheat growth in Northwest China. Soil Tillage Res. 2021, 213, 105151. [Google Scholar] [CrossRef] [Scilit]
- Vanderhasselt, A.; Steinwidder, L.; D’Hose, T.; Cornelis, W. Opening up the subsoil: Subsoiling and bio-subsoilers to remediate subsoil compaction in three fodder crop rotations on a sandy loam soil. Soil Tillage Res. 2024, 237, 105956. [Google Scholar]
- Guo, R.; Zhang, N.; Wang, L.; Lin, T.; Zheng, Z.; Cui, J.; Tian, L. Subsoiling depth affects the morphological and physiological traits of roots in film-mulched and drip-irrigated cotton. Soil Tillage Res. 2023, 234, 105826. [Google Scholar]
- Gao, H.; Hrachowitz, M.; Wang-Erlandsson, L.; Fenicia, F.; Xi, Q.; Xia, J.; Shao, W.; Sun, G.; Savenije, H.H.G. Root zone in the Earth system. Hydrol. Earth Syst. Sci. 2024, 28, 4477–4499. [Google Scholar] [CrossRef] [Scilit]
- Li, B.; Shi, P.; Li, Z. Partitioning and controlling factors of evapotranspiration: 1. Hydrological modeling constrained with isotope-based water balance decoupling. Agric. Ecosyst. Environ. 2024, 364, 108908. [Google Scholar] [CrossRef] [Scilit]
- Lu, S.; Zhu, G.; Qiu, D.; Li, R.; Jiao, Y.; Meng, G.; Lin, X.; Wang, Q.; Zhang, W.; Chen, L. Optimizing irrigation in arid irrigated farmlands based on soil water movement processes: Knowledge from water isotope data. Geoderma 2025, 460, 117440. [Google Scholar] [CrossRef] [Scilit]
- Guo, X.; Tian, L.; Wang, L.; Zhang, L.; Wang, Y.; Li, Y.; Zhao, W. Evapotranspiration partitioning over the Tibetan plateau: Spatial-seasonal patterns and possible controls. Agric. Water Manag. 2025, 318, 109712. [Google Scholar] [CrossRef] [Scilit]
- An, X. Responses of Water Use Efficiency to climate change in evapotranspiration and transpiration ecosystems. Ecol. Indic. 2022, 141, 109157. [Google Scholar] [CrossRef] [Scilit]
- Singh, H. Exploring adaptive modulation in plant functional traits and its impact on the productivity of Acacia auriculiformis under CO2-enriched environment. Ind. Crops Prod. 2024, 210, 118186. [Google Scholar]
- Durand, M.; Brendel, O.; Buré, C.; Courtois, P.; Lily, J.; Granier, A.; Thiec, D.L. Impacts of a partial rainfall exclusion in the field on growth and transpiration: Consequences for leaf-level and whole-plant water-use efficiency compared to controlled conditions. Agric. For. Meteorol. 2020, 282–283, 107873. [Google Scholar]
- Chintala, S.; Karimindla, A.R.; Kambhammettu, B.P. Scaling relations between leaf and plant water use efficiencies in rainfed Cotton. Agric. Water Manag. 2024, 292, 108680. [Google Scholar] [CrossRef] [Scilit]
- Wang, X.; Yang, J.; Wang, J.; Yang, T.; Chang, C.; Zhao, Y.; Wu, X.; Zhang, G.; Xiao, X. Physiological changes induced by green fodder expansion into grasslands and croplands enhance water-use efficiency in the Northeastern Tibetan Plateau. Agric. Water Manag. 2025, 307, 109218. [Google Scholar]
- Wang, T.; Sun, S.; Yin, Y.; Zhao, J.; Tang, Y.; Wang, Y.; Gao, F.; Luan, X. Status of crop water use efficiency evaluation methods: A review. Agric. For. Meteorol. 2024, 349, 109961. [Google Scholar] [CrossRef] [Scilit]
- Li, P.; Ma, B.; Wei, X.; Guo, S.; Ma, Y. Deeper root distribution and optimized root anatomy help improve dryland wheat yield and water use efficiency under low water conditions. Plant Soil 2024, 501, 437–454. [Google Scholar] [CrossRef] [Scilit]
- Ning, T.; Liu, Z.; Hu, H.; Li, G.; Kuzyakov, Y. Physical, chemical and biological subsoiling for sustainable agriculture. Soil Tillage Res. 2022, 223, 105490. [Google Scholar] [CrossRef] [Scilit]
- Liu, K.; Sozzi, M.; Gasparini, F.; Marinello, F.; Sartori, L. Combining simulations and field experiments: Effects of subsoiling angle and tillage depth on soil structure and energy requirements. Comput. Electron. Agric. 2023, 214, 108323. [Google Scholar] [CrossRef] [Scilit]
- Raper, R.L.; Reeves, D.W.; Shaw, J.N.; van Santen, E.; Mask, P.L. Benefits of site-specific subsoiling for cotton production in Coastal Plain soils. Soil Tillage Res. 2007, 96, 174–181. [Google Scholar] [CrossRef] [Scilit]
- Liu, Y.; Zhao, W.; Zhang, X.; Fang, X. Soil water storage changes within deep profiles under introduced shrubs during the growing season: Evidence from semiarid Loess Plateau, China. Water 2016, 8, 475. [Google Scholar] [CrossRef] [Scilit]
- Yang, W.; Zhou, J.; Wang, S.; Yin, L. Different supplemental irrigation methods result in discrepant water use efficiency and yield by changing steps of water use process in dryland wheat. Eur. J. Agron. 2024, 160, 127318. [Google Scholar] [CrossRef] [Scilit]
- Plauborg, F. Evaporation from bare soil in a temperate humid climate—Measurement using micro-lysimeters and time domain reflectometry. Agric. For. Meteorol. 1995, 76, 1–17. [Google Scholar]
- Hu, F.; Chai, Q.; Tan, Y.; Zhao, C.; Yu, A.; Fan, Z.; Yin, W.; Fan, H.; He, W. No-till with plastic film mulching combined with N fertilizer reduction improves water productivity of spring wheat. Farming Syst. 2023, 1, 100021. [Google Scholar] [CrossRef] [Scilit]
- Gao, Z.; Du, X.; Yu, H.; Liu, C.; Jian, H.; Xu, X.; Li, X.; Bian, D.; Cui, Y. Sub-surface plastic mulching reduced evaporation during the fallow season and increased spring maize yield in the North China Plain. Eur. J. Agron. 2023, 143, 126708. [Google Scholar] [CrossRef] [Scilit]
- Wu, Y.; Tang, C.; Du, M.; Tian, J.; Yang, M.; Zhang, Y.; Zhang, W. Optimizing chemical topping in cotton: Effects of planting density and variety sensitivity to mepiquat chloride. Field Crops Res. 2025, 327, 109914. [Google Scholar]
- Liu, X.; Liu, J.; Huang, C.; Liu, H.; Meng, Y.; Chen, H.; Ma, S.; Liu, Z. The impacts of irrigation methods and regimes on the water and nitrogen utilization efficiency in subsoiling wheat fields. Agric. Water Manag. 2024, 295, 108765. [Google Scholar] [CrossRef] [Scilit]
- Menegat, S. The geography of conventional agriculture’s unsustainability. Nat. Clim. Change 2025, 15, 20–21. [Google Scholar]
- Blanco-Canqui, H.; Hassim, R.; Shapiro, C.; Jasa, P.; Klopp, H. How does no-till affect soil-profile compactibility in the long term? Geoderma 2022, 425, 116016. [Google Scholar] [CrossRef] [Scilit]
- Zhou, P.; Wang, S.; Guo, L.; Shen, Y.; Han, H.; Ning, T. Effects of subsoiling stage on summer maize water use efficiency and yield in North China Plains. Plant Soil Environ. 2019, 65, 556–562. [Google Scholar] [CrossRef] [Scilit]
- Abidela Hussein, M.; Muche, H.; Schmitter, P.; Nakawuka, P.; Tilahun, S.A.; Langan, S.; Barron, J.; Steenhuis, T.S. Deep tillage improves degraded soils in the (sub) humid Ethiopian highlands. Land 2019, 8, 159. [Google Scholar] [CrossRef] [Scilit]
- Moraes, M.T.D.; Olbermann, F.J.R.; Bonetti, J.D.A.; Pilegi, L.R.; Costa, M.V.R.; Pacheco, V.; Rogers, C.D.; Guimarães, R.M.L. The impacts of cover crop mixes on the penetration resistance model of an Oxisol under no-tillage. Soil Tillage Res. 2024, 242, 106138. [Google Scholar] [CrossRef] [Scilit]
- Wu, Z.; Xu, C.; Li, R.; Xu, Y.; Hua, J.; Sun, S.; Han, T.; Song, W.; Wu, C. Full-field straw mulching and fertilizer application improved the soybean seed yield through optimization of the root and canopy structure: A study case in Huang-Huai-Hai region. Eur. J. Agron. 2024, 159, 127280. [Google Scholar] [CrossRef] [Scilit]
- Nosalewicz, A.; Lipiec, J. The effect of compacted soil layers on vertical root distribution and water uptake by wheat. Plant Soil 2014, 375, 229–240. [Google Scholar]
- Gündoğdu, S.; Akça, M.O.; Özkan, İ.; Sarıdaş, M.A.; Küçükel, E.; Rodríguez-Seijo, A.; Er, E.; Turgay, O.C. A review of non-petroleum alternatives of plastic mulches in agriculture: Knowledge gaps and future recommendations. Eur. J. Agron. 2026, 172, 127831. [Google Scholar]
- Ramos, T.B.; Darouich, H.; Pereira, L.S. Mulching effects on soil evaporation, crop evapotranspiration and crop coefficients: A review aimed at improved irrigation management. Irrig. Sci. 2024, 42, 525–539. [Google Scholar] [CrossRef] [Scilit]
- Jiao, F.; Hong, S.; Cui, J.; Zhang, Q.; Li, M.; Shi, R.; Han, H.; Li, Q. Subsoiling combined with irrigation improves carbon emission and crop water productivity of winter wheat in North China Plain. Agric. Water Manag. 2022, 269, 107685. [Google Scholar] [CrossRef] [Scilit]
- Yang, Y.; Liu, H.; Wu, J.; Gao, C.; Zhang, S.; Tang, D.W.S. Long-term combined subsoiling and straw mulching conserves water and improves agricultural soil properties. Land Degrad. Dev. 2024, 35, 1050–1060. [Google Scholar] [CrossRef] [Scilit]
- Ma, W.; Yu, Z.; Chen, J.; Yang, W.; Zhang, Y.; Hu, Y.; Shao, M.; Hu, J.; Zhang, Y.; Zhang, H.; et al. What drives the cooling dynamics of urban vegetation via evapotranspiration and shading under extreme heat? Sustain. Cities Soc. 2025, 130, 106659. [Google Scholar] [CrossRef] [Scilit]
- Kumar, B.M.; Kunhamu, T.K.; Bhardwaj, A.; Santhoshkumar, A.V. Subcanopy light availability, crop yields, and managerial implications: A systematic review of the shaded cropping systems in the tropics. Agrofor. Syst. 2024, 98, 2785–2810. [Google Scholar] [CrossRef] [Scilit]
- Yu, Z.; Chen, J.; Chen, J.; Zhan, W.; Wang, C.; Ma, W.; Yao, X.; Zhou, S.; Zhu, K.; Sun, R. Enhanced observations from an optimized soil-canopy-photosynthesis and energy flux model revealed evapotranspiration-shading cooling dynamics of urban vegetation during extreme heat. Remote Sens. Environ. 2024, 305, 114098. [Google Scholar] [CrossRef] [Scilit]
- Huanhe, W.; Xiaoyu, G.; Xiang, Z.; Wang, Z.; Xubin, Z.; Yinglong, C.; Zhongyang, H.; Guisheng, Z.; Tianyao, M.; Qigen, D. Grain yield, biomass accumulation, and leaf photosynthetic characteristics of rice under combined salinity-drought stress. Rice Sci. 2024, 31, 118–128. [Google Scholar] [CrossRef] [Scilit]
- Wang, X.; Sale, P.; Hunt, J.; Clark, G.; Wood, J.L.; Franks, A.E.; Reddy, P.; Jin, J.; Joseph, S.; Tang, C. Enhancing growth and transpiration efficiency of corn plants with compost addition and potential beneficial microbes under well-watered and water-stressed conditions. Plant Soil 2025, 514, 2475–2493. [Google Scholar]
- Yin, X.; Chen, J.; Ye, Y.; Zhu, H.; Li, J.; Zhang, L.; Zhang, H.; He, S.; Wu, H. Optimizing bent branch numbers improves transpiration and crop water productivity of cut rose (Rosa hybrida) in greenhouse. Agric. Water Manag. 2024, 296, 108795. [Google Scholar] [CrossRef] [Scilit]
- Vadez, V.; Grondin, A.; Chenu, K.; Henry, A.; Laplaze, L.; Millet, E.J.; Carminati, A. Crop traits and production under drought. Nat. Rev. Earth Environ. 2024, 5, 211–225. [Google Scholar] [CrossRef] [Scilit]
- Rossi, M.; Bermudez, L.; Carrari, F. Crop yield: Challenges from a metabolic perspective. Curr. Opin. Plant Biol. 2015, 25, 79–89. [Google Scholar] [CrossRef] [Scilit]
- Malik, A.A.; Martiny, J.B.H.; Brodie, E.L.; Martiny, A.C.; Treseder, K.K.; Allison, S.D. Defining trait-based microbial strategies with consequences for soil carbon cycling under climate change. ISME J. 2020, 14, 1–9. [Google Scholar] [CrossRef] [Scilit] [PubMed]
- Malik, A.A.; Puissant, J.; Goodall, T.; Allison, S.D.; Griffiths, R.I. Soil microbial communities with greater investment in resource acquisition have lower growth yield. Soil Biol. Biochem. 2019, 132, 36–39. [Google Scholar] [CrossRef] [Scilit]
- Reay, M.K.; Sayer, E.J.; Smith, A.; Pastor, V.; Kourmouli, A.; Marshall, M.; Grzesik, R.T.; Evans, I.; Rumeau, M.; Hart, K.; et al. Elevated CO2 alters relative belowground carbon investment for nutrient acquisition in a mature temperate forest. Proc. Natl. Acad. Sci. USA 2025, 122, e1791372174. [Google Scholar] [CrossRef] [Scilit]
- Siddique, K.H.M.; Bolan, N.; Rehman, A.; Farooq, M. Enhancing crop productivity for recarbonizing soil. Soil Tillage Res. 2024, 235, 105863. [Google Scholar] [CrossRef] [Scilit]
- Tariq, A.; Graciano, C.; Sardans, J.; Zeng, F.; Hughes, A.C.; Ahmed, Z.; Ullah, A.; Ali, S.; Gao, Y.; Peñuelas, J. Plant root mechanisms and their effects on carbon and nutrient accumulation in desert ecosystems under changes in land use and climate. New Phytol. 2024, 242, 916–934. [Google Scholar] [CrossRef] [Scilit]
- Guo, X.; Wang, H.; Yu, Q.; Ahmad, N.; Li, J.; Wang, R.; Wang, X. Subsoiling and plowing rotation increase soil C and N storage and crop yield on a semiarid Loess Plateau. Soil Tillage Res. 2022, 221, 105413. [Google Scholar] [CrossRef] [Scilit]
- Shao, J.; Liu, L.; Cui, J.; Yang, H.; Zhang, Y.; Li, R.; Lv, Y.; Ma, Y.; Fang, Q.; Sun, S.; et al. Enhancing the coupling coordination of soil–crop systems by optimising soil properties and crop production via subsoiling. Soil Tillage Res. 2025, 248, 106438. [Google Scholar] [CrossRef] [Scilit]
- Hu, H.; Wen, J.; Peng, Z.; Tian, F.; Ming, G.; Liu, H.; Yan, Z.; Khan, M.Y.A. Spatio-temporal variations of soil moisture and salinity and their effects on cotton growth in a mulched drip irrigation field. Irrig. Drain. 2020, 69, 928–943. [Google Scholar] [CrossRef] [Scilit]

Disclaimer/Publisher’s Note: The statements, opinions and data contained in all publications are solely those of the individual author(s) and contributor(s) and not of MDPI and/or the editor(s). MDPI and/or the editor(s) disclaim responsibility for any injury to people or property resulting from any ideas, methods, instructions or products referred to in the content. |
© 2026 by the authors. Licensee MDPI, Basel, Switzerland. This article is an open access article distributed under the terms and conditions of the Creative Commons Attribution (CC BY) license.