


Abstract
Soursop fruit (Annona muricata L.) exhibits a rapid loss of firmness during postharvest ripening, mainly attributed to pectin depolymerization and cell wall restructuring. Among the enzymes involved, rhamnogalacturonan lyase (RGL), belonging to the PF06045 protein family, contributes to the degradation of rhamnogalacturonan I (RG-I), a key structural component of pectin. However, the regulatory mechanisms and transcriptional dynamics of RGL genes in tropical fruits remain poorly characterized. This study aimed to evaluate RGL in three soursop varieties (GUANAY-1, GUANAY-2, and GUANAY-3) during postharvest ripening through integrative bioinformatic, transcriptional, and enzymatic analyses. Bioinformatic analysis identified five soursop genes containing the PF06045 domain, designated RGL1–RGL5, which were grouped into three phylogenetic clusters. Differential expression analysis revealed that RGL1, RGL2, and RGL3 were differentially expressed, while functional enrichment analysis indicated that these genes are mainly associated with lyase activity and cell wall polysaccharide disassembly. Quantitative polymerase chain reaction (qPCR) revealed variety-dependent transcriptional patterns. RGL2 showed expression peaks on day 5 in GUANAY-1 and GUANAY-3 and on day 7 in GUANAY-2, while RGL3 reached its maximum expression on day 5 in all varieties. Enzymatic activity also varied among varieties, showing concordance with RGL2 and RGL3 expression in GUANAY-1, a delayed maximum in GUANAY-2, and a progressive decline in GUANAY-3. Principal component analysis explained 87.2% of the total variation, with enzymatic activity contributing mainly to PC1 and RGL2 and RGL3 expression to PC2. Overall, these results demonstrate differential regulation of RGL among soursop varieties and confirm its central role in RG-I degradation during postharvest fruit softening.
1. Introduction
Soursop (Annona muricata L.) is cultivated in tropical and subtropical regions, particularly in Brazil, Colombia, Mexico, and Venezuela [1]. Mexico is the world’s leading producer, with an annual yield of 30,039.13 t. According to data from the Agri-Food and Fisheries Information Service [2], the state of Nayarit accounts for more than 80% of national production, registering 24,429.4 t in 2024 and an estimated income of 258,357,550 Mexican pesos [2]. Given the economic importance to the state, the Autonomous University of Nayarit has registered three soursop varieties, designated GUANAY-1, GUANAY-2, and GUANAY-3, which are characterized by their physiological and physicochemical properties during ripening [3]. Soursop fruit is climacteric in nature, exhibiting a high respiration rate and ethylene production, which induce rapid softening and shorten postharvest life [4]. This behavior limits its international commercialization due to the loss of firmness [5].
During growth, cell division occurs, followed by cell expansion through vacuole formation and biomass accumulation [6,7,8,9,10]. Ripening is divided into physiological maturity, when the fruit completes its development and becomes harvestable [8,11], and consumption maturity, the stage at which maximum nutritional and organoleptic attributes are attained [12,13]. During consumption maturity, fruit softening begins [14], which is a process characterized by biochemical and physiological changes associated with the synthesis and activation of cell wall-degrading enzymes. These enzymes act mainly on pectin [15], accelerating loss of firmness and leading to the onset of senescence. The loss of firmness and changes in fruit texture are associated with the action of various cell wall-modifying enzymes, such as polygalacturonase (PG), pectin methylesterase (PME), pectate lyase (PL), glucosidase (Glu), expansin (EXP) and rhamnogalacturonan lyase (RGL), among others [16,17,18,19]. During this final and irreversible stage, nutrient degradation intensifies, phenolic compounds increase, and firmness progressively declines—processes closely linked to the activity of cell wall-modifying enzymes [9,11,20,21]. The plant cell wall provides essential mechanical support for growth and protection against biotic and abiotic stresses [22,23]. It is mainly composed of cellulose, hemicellulose, and pectin [24]. Pectin is the most abundant structural polysaccharide and is primarily composed of galacturonic acid [25,26]. Its major components include homogalacturonan (HG), rhamnogalacturonan I (RG-I), and rhamnogalacturonan II (RG-II) [27,28]. RG-I accounts for 20–35% of total pectin and consists of alternating repeating units of galacturonic acid and rhamnose, forming a linear backbone [→α-D-GalA-(1→2)-α-L-Rha-(1→4)→]n [28]. In addition, RG-I contains side chains of arabinan, galactan, and arabinogalactan attached to the C4 position of rhamnose in the backbone. Due to its structural complexity, RG-I degradation requires the coordinated action of multiple enzymes [29]. RGL catalyzes the cleavage of the RG-I polymer through a β-elimination reaction that breaks the α-(1,4) linkages between rhamnose and galacturonic acid in the backbone [30]. Proteins in this family contain the PF06045 domain, which is responsible for their catalytic function [31]. Although RGL has been extensively studied in fungi and bacteria, information regarding its function in plants remains limited [28]. Functional studies in plants have demonstrated morphological and physiological effects associated with this enzyme. In this regard, Oomen et al. [32] generated transgenic potato plants overexpressing an RGL gene from Aspergillus aculeatus, which resulted in tuber distortion, reduced pollen fertility, decreased RG-I content, and increased homogalacturonan levels. Similarly, overexpression of the tomato gene Solyc11g011300 led to firmer fruits with an extended shelf life [28]. Transcriptomic studies have enabled the characterization of RGL gene expression in tropical fruits. In the ‘Keitt’ mango, expression of the gene comp25112, which encodes RGL, increased five-fold at consumption maturity compared with physiological maturity [33]. In tomato, analysis of the promoter regions of Solyc11g011300 revealed its specific regulation in pollen and ripe fruits [34]. In soursop, de novo assembly and annotation of the transcriptome of the GUANAY-1 variety stored at 15 °C and 28 °C revealed a family of RGL genes that were highly expressed from day 3 onward, suggesting their involvement in fruit softening [15]. Additionally, gene expression studies using qPCR have confirmed the physiological relevance of RGL genes in fruits. In strawberry, FaRGLyase1 exhibited high expression levels in the fruit receptacle, where it was associated with pectin degradation in the middle lamella [35]. In tomato, the gene Solyc11g011300 showed increased expression during the peak of ethylene production, indicating its role in firmness loss during fruit ripening [36]. Based on the above, fruit softening can be attributed to the action of enzymes that degrade structural components of the cell wall. However, despite the physiological relevance of these processes, changes in RGL gene expression and enzymatic activity during soursop fruit ripening have not yet been characterized. This lack of information limits the understanding of the molecular mechanisms underlying firmness loss and, consequently, the development of more efficient postharvest strategies.
In this context, the objective of this study was to evaluate RGL in three soursop varieties (GUANAY-1, GUANAY-2, and GUANAY-3) during postharvest ripening through integrative bioinformatic, transcriptional, and enzymatic analyses.
2. Materials and Methods
2.1. Genes Encoding RGL and Phylogenetic Analysis
Sequences containing the PF06045 protein domain were identified in four plant species selected based on their membership in the Annonaceae family, the availability of genomic resources, or their use as model organisms. For soursop (Annona muricata), sequences were obtained from the transcriptome of the GUANAY-1 variety (BioProject PRJNA804904) [15] and from the Annomics database (http://perseo.uan.mx/bioinformatica/annomicsdatabase, accessed on 20 March 2025). For cherimoya (Annona cherimola), sequences were downloaded from the IHSM Subtropicals database (https://ihsmsubtropicals.uma.es/easy_gdb/index.php, accessed on 20 March 2025). Tomato [37] and A. thaliana [38] sequences were retrieved from the Phytozome database [39]. All sequences were integrated into a single FASTA file and subsequently aligned using the MUSCLE algorithm with default parameters. Phylogenetic analysis was performed using the Neighbor-Joining method with 1000 bootstrap replicates, and evolutionary distances were estimated using the p-distance model [40]. All bioinformatic analyses were conducted in R v4.3.3 using the packages biostrings, ape, msa, ggplot2, ggtree, seqinr, and phangorn.
2.2. Differential Expression Analysis
An RSEM expression matrix was generated using transcriptome data from soursop (Annona muricata) variety GUANAY-1 (BioProject ID PRJNA804904) stored at 28 °C, corresponding to day 0 (physiological maturity), day 3 (consumption maturity), and day 6 (onset of senescence). Differential expression analysis was then performed by comparing day 3 vs. day 0, day 6 vs. day 0, and day 6 vs. day 3 using the DESeq2 method [41]. Significantly differentially expressed genes were identified using a p-value threshold of ≤0.05 and a log2 fold change (LogFC) > 1 or <−1. Based on these results, a heatmap was generated using the pheatmap package in R [42].
2.3. Functional Enrichment Analysis and Gene Co-Expression Network
Based on the annotation of differentially expressed genes, Arabidopsis thaliana Ensembl gene identifiers (829951, 829959, and 828545) were used for functional enrichment analysis employing the biomaRt package in R v4.3.3. Homologous gene identifiers were exported in .txt format and uploaded to the Database for Annotation, Visualization and Integrated Discovery (DAVID) platform (https://davidbioinformatics.nih.gov/, accessed on 20 March 2025) to perform functional annotation analysis [43]. Ensembl gene IDs were retrieved based on functional annotation (100%). Subsequently, the identifiers were associated with Gene Ontology (GO) terms using the A. thaliana database (org.At.tair.db) through the clusterProfiler package. GO terms with p < 0.05 were visualized in R using the enrichplot package. A correlation matrix was generated using LogFC values of enriched differentially expressed genes (DEGs) based on the Pearson correlation coefficient, considering correlations significant at p < 0.05. Gene co-expression networks were then constructed using an undirected approach with the igraph package in R, excluding connections with correlation values below r = 0.8. A Minimum Spanning Tree (MST) network was constructed to visualize gene associations, where nodes represent genes and edges indicate connections based on shared expression patterns.
2.4. Plant Material
Fifteen fruits from each of the three soursop varieties (GUANAY-1, GUANAY-2, and GUANAY-3) were harvested from a 25-year-old orchard located in Venustiano Carranza, Nayarit, Mexico (21°32′2.77″ N, 104°58′39.73″ W). The fruits were stored at 28 °C, and pericarp samples were collected on days 1 (physiological maturity), 3, 5 (consumption maturity), and 7 (onset of senescence) of storage. The samples were immediately frozen at −80 °C. Subsequently, 50 mg of pericarp tissue was pulverized using a mortar and pestle under liquid nitrogen. Finally, the samples were stored at −80 °C until use for RGL expression analysis and enzymatic activity assays.
2.5. Total RNA Extraction and cDNA Synthesis
Total RNA was extracted using the Spectrum™ Plant Total RNA Kit (Sigma-Aldrich®, St. Louis, MO, USA) following the manufacturer’s protocol with minor modifications. Kit columns were replaced with columns from another manufacturer (Biomed Solutions®, Shenzhen, China). These columns were activated using the binding solution provided in the kit, after which the protocol was continued as recommended. Residual genomic DNA was removed using DNase I, RNase-free (Thermo Scientific™, Waltham, MA, USA), following the manufacturer’s instructions. The concentration and purity of the extracted total RNA were assessed using a Multiskan Go Nano spectrophotometer (Thermo Scientific™, Waltham, MA, USA) by measuring the A260/A280 absorbance ratios. The average values of concentration and purity of the total RNA extracted from each sample are presented in Table 1. RNA integrity was evaluated visually by electrophoresis on 1.0% agarose gels stained with 5 μL of SYBR™ Gold Nucleic Acid Gel Stain (Thermo Scientific™, Waltham, MA, USA).
Table 1.
Average concentration of total RNA (ng/µL) and the 260/280 absorbance ratio in soursop mesocarp during postharvest storage. The letter D corresponds to the storage day (Day 1, Day 3, Day 5, and Day 7), the letter G corresponds to the variety (GUANAY-1, GUANAY-2, and GUANAY-3), and the symbol ± indicates the standard deviation.
Electrophoresis was performed at a constant voltage of 90 V for 120 min in 1× TAE buffer (Tris–acetate–EDTA). Gels were visualized using a benchtop UV transilluminator (Krackeler Scientific, Inc., Albany, NY, USA), and images were captured with a PhotoDoc-It System. The presence of well-defined ribosomal RNA bands (28S and 18S) confirmed the integrity and quality of the extracted RNA for downstream qPCR analyses. Subsequently, cDNA synthesis was carried out by reverse transcription using the GoScript™ Reverse Transcription System (Promega, Madison, WI, USA) according to the manufacturer’s instructions. The resulting cDNA libraries were stored at −20 °C until further use.
2.6. Primer Design
Primers were designed based on the differentially expressed genes RGL1, RGL2, and RGL3. However, because RGL1 and RGL2 exhibited similar expression patterns, primers were ultimately designed for RGL2 and RGL3, which showed greater transcriptional relevance. Primers for the amplification of RGL2 and RGL3 genes were designed using Primer-BLAST (http://www.ncbi.nlm.nih.gov/tools/primer-blast/, accessed on 25 March 2025), considering specific parameters, including annealing temperature (50–60 °C), amplicon size (100–150 bp), and primer length (18–24 bp) [44]. Finally, in silico PCR was performed using the “in silico PCR” tool (http://insilico.ehu.es/mini_tools/PCR/, accessed on 25 March 2025). Gene identifiers (IDs), primer sequences, probes, annealing temperatures, and expected amplicon sizes are provided in Table 2.
Table 2.
Sequences and characteristics of the primers and probes used in this study. Fw and Rv refer to forward and reverse, respectively. Tm indicates the temperature of melting.
2.7. Quantitative Real-Time Polymerase Chain Reaction (qPCR)
The expression of the RGL2 gene was analyzed using Maxima SYBR Green/ROX qPCR Master Mix (Thermo Scientific™, Waltham, MA, USA), whereas RGL3 expression was evaluated using TaqMan probes. For RGL2, the reaction mixture consisted of 8 µL of SYBR Green/ROX qPCR Master Mix (2X) (Thermo Scientific™, Waltham, MA, USA), 1.2 µL of each forward and reverse primer (1 µM), 1 µL of cDNA (20 ng total), and 8.6 µL of nuclease-free water. For RGL3, the reaction mixture contained 10 µL of TaqMan Fast Advanced Master Mix (1X), 0.8 µL of forward and reverse primers (0.4 µM), 0.72 µL of the probe (0.18 µM), 1 µL of cDNA (20 ng total), and 5.68 µL of nuclease-free water.
qPCR reactions were performed on a Rotor-Gene Q MDx 5plex HRM instrument (QIAGEN, Hilden, Nordrhein-Westfalen, Germany) using a two-step protocol, consisting of an initial denaturation at 95 °C for 5 min, followed by 40 cycles of denaturation at 95 °C for 30 s and annealing/extension at 58 °C for RGL2 and 59 °C for RGL3 for 45 s. Standard curves were generated using 2-fold serial dilutions of cDNA in triplicate for each condition. Amplification efficiency (E) of each primer was calculated according to the formula E = (10(−1/slope) − 1) × 100. Data of the standard curves are listed in Table 2. For relative gene expression analysis, day 1 samples were used as independent calibrators for each analyzed variety (GUANAY-1, GUANAY-2, and GUANAY-3), and expression levels were calculated using the 2−ΔΔCt method as described by Livak & Schmittgen [45]. UBCc was used as the reference gene for data normalization as previously reported for soursop [46]. The qPCR amplicons were sent to Macrogen Inc. (Seoul, Republic of Korea) for Sanger sequencing.
2.8. Enzyme Extract Preparation
The enzymatic extract from soursop fruits was obtained as described by Ochoa-Jiménez et al. [28]. Briefly, 0.5 g of pericarp tissue was ground in liquid nitrogen and homogenized by vortexing with 1 mL of cold sodium phosphate buffer (0.5 M sodium phosphate buffer, 0.8 M NaCl, pH 8.1). The samples were incubated for 1 h at 4 °C under constant agitation using a thermomixer (Benchmark Scientific, Sayreville, NJ, USA). Subsequently, the homogenates were centrifuged at 2000× g for 10 min, and the resulting supernatant was used as the crude enzymatic extract.
2.9. Total Protein Determination
Total protein content in the enzymatic extract was determined using the Bradford [47], with bovine serum albumin (0.0–0.25 mg mL−1) as the standard. For the assay, 5 µL of the extract was mixed with 145 µL of Bradford reagent and 100 µL of distilled water. Absorbance was measured at 595 nm using a Multiskan Go microplate spectrophotometer (Thermo Scientific™, Waltham, MA, USA). Total protein concentration was calculated based on the standard curve and expressed as mg mL−1.
2.10. Enzymatic Activity
Enzymatic activity was determined following the protocol described by Ochoa-Jiménez et al. [28], using potato rhamnogalacturonan (RG-I) as the substrate. A reaction buffer containing 0.5 g L−1 potato RG-I T-RHAM 09/02 (Megazyme Ltd., Bray, County Wicklow, Ireland), 50 mM Tris–HCl (pH 8.5), and 2 mM CaCl2 was prepared. The reaction mixture was incubated at 37 °C for 20 min, after which 900 µL of 50 mM HCl was added to terminate the reaction. RGL activity was measured at 235 nm using a Multiskan Go spectrophotometer (Thermo Scientific™, Waltham, MA, USA). An extinction coefficient of 5500 M−1 cm−1 was used to calculate the amount of product formed. Enzymatic activity was expressed as U mg−1 protein, where one unit (U) is defined as the amount of enzyme that catalyzes the conversion of 1 µmol of substrate per minute, and mg of protein corresponds to the total protein content in the sample.
2.11. Statistical Analysis and Multivariate Analysis
Enzymatic activity and gene expression data were obtained from three independent biological replicates per sampling point and analyzed in technical triplicate under a completely randomized design. The Shapiro–Wilk test and Bartlett test were used for all variables to examine the normality and the homogeneity of variances, respectively. A one-way analysis of variance (ANOVA) was performed using a significance level of 5%. When significant differences were detected by ANOVA, mean comparisons were conducted using Tukey’s HSD test (p < 0.05). Additionally, Pearson correlation analysis was performed between enzymatic activity and the relative expression levels of the RGL2 and RGL3 genes using the cor. test () function with default parameters (two-sided test, 95% confidence level), and correlation coefficients of r ≥ 0.7. Based on the relative expression data of RGL2 and RGL3, as well as RGL enzymatic activity, a scaled (unit variance-standardized) correlation matrix was generated. Principal component analysis (PCA) was then conducted using this matrix to assess the relative contribution of each variable and to examine patterns across storage days and among varieties. Gene expression data from day 1 are equal to 1 and do not contribute to variance. For this reason, day 1 expression data was excluded from the PCA. All statistical analyses and graphical representations were performed using the R statistical environment (v. 4.3.3) with the packages readxl, dplyr, ggplot2, and agricolae.
3. Results
3.1. RGL-Encoding Genes and Phylogenetic Analysis
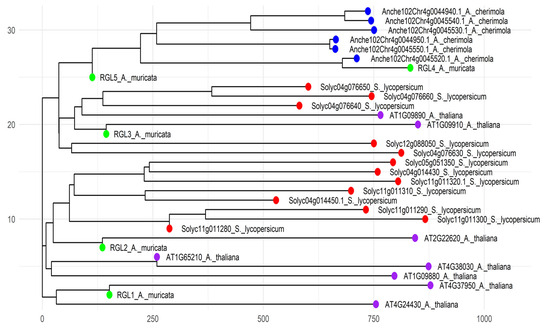
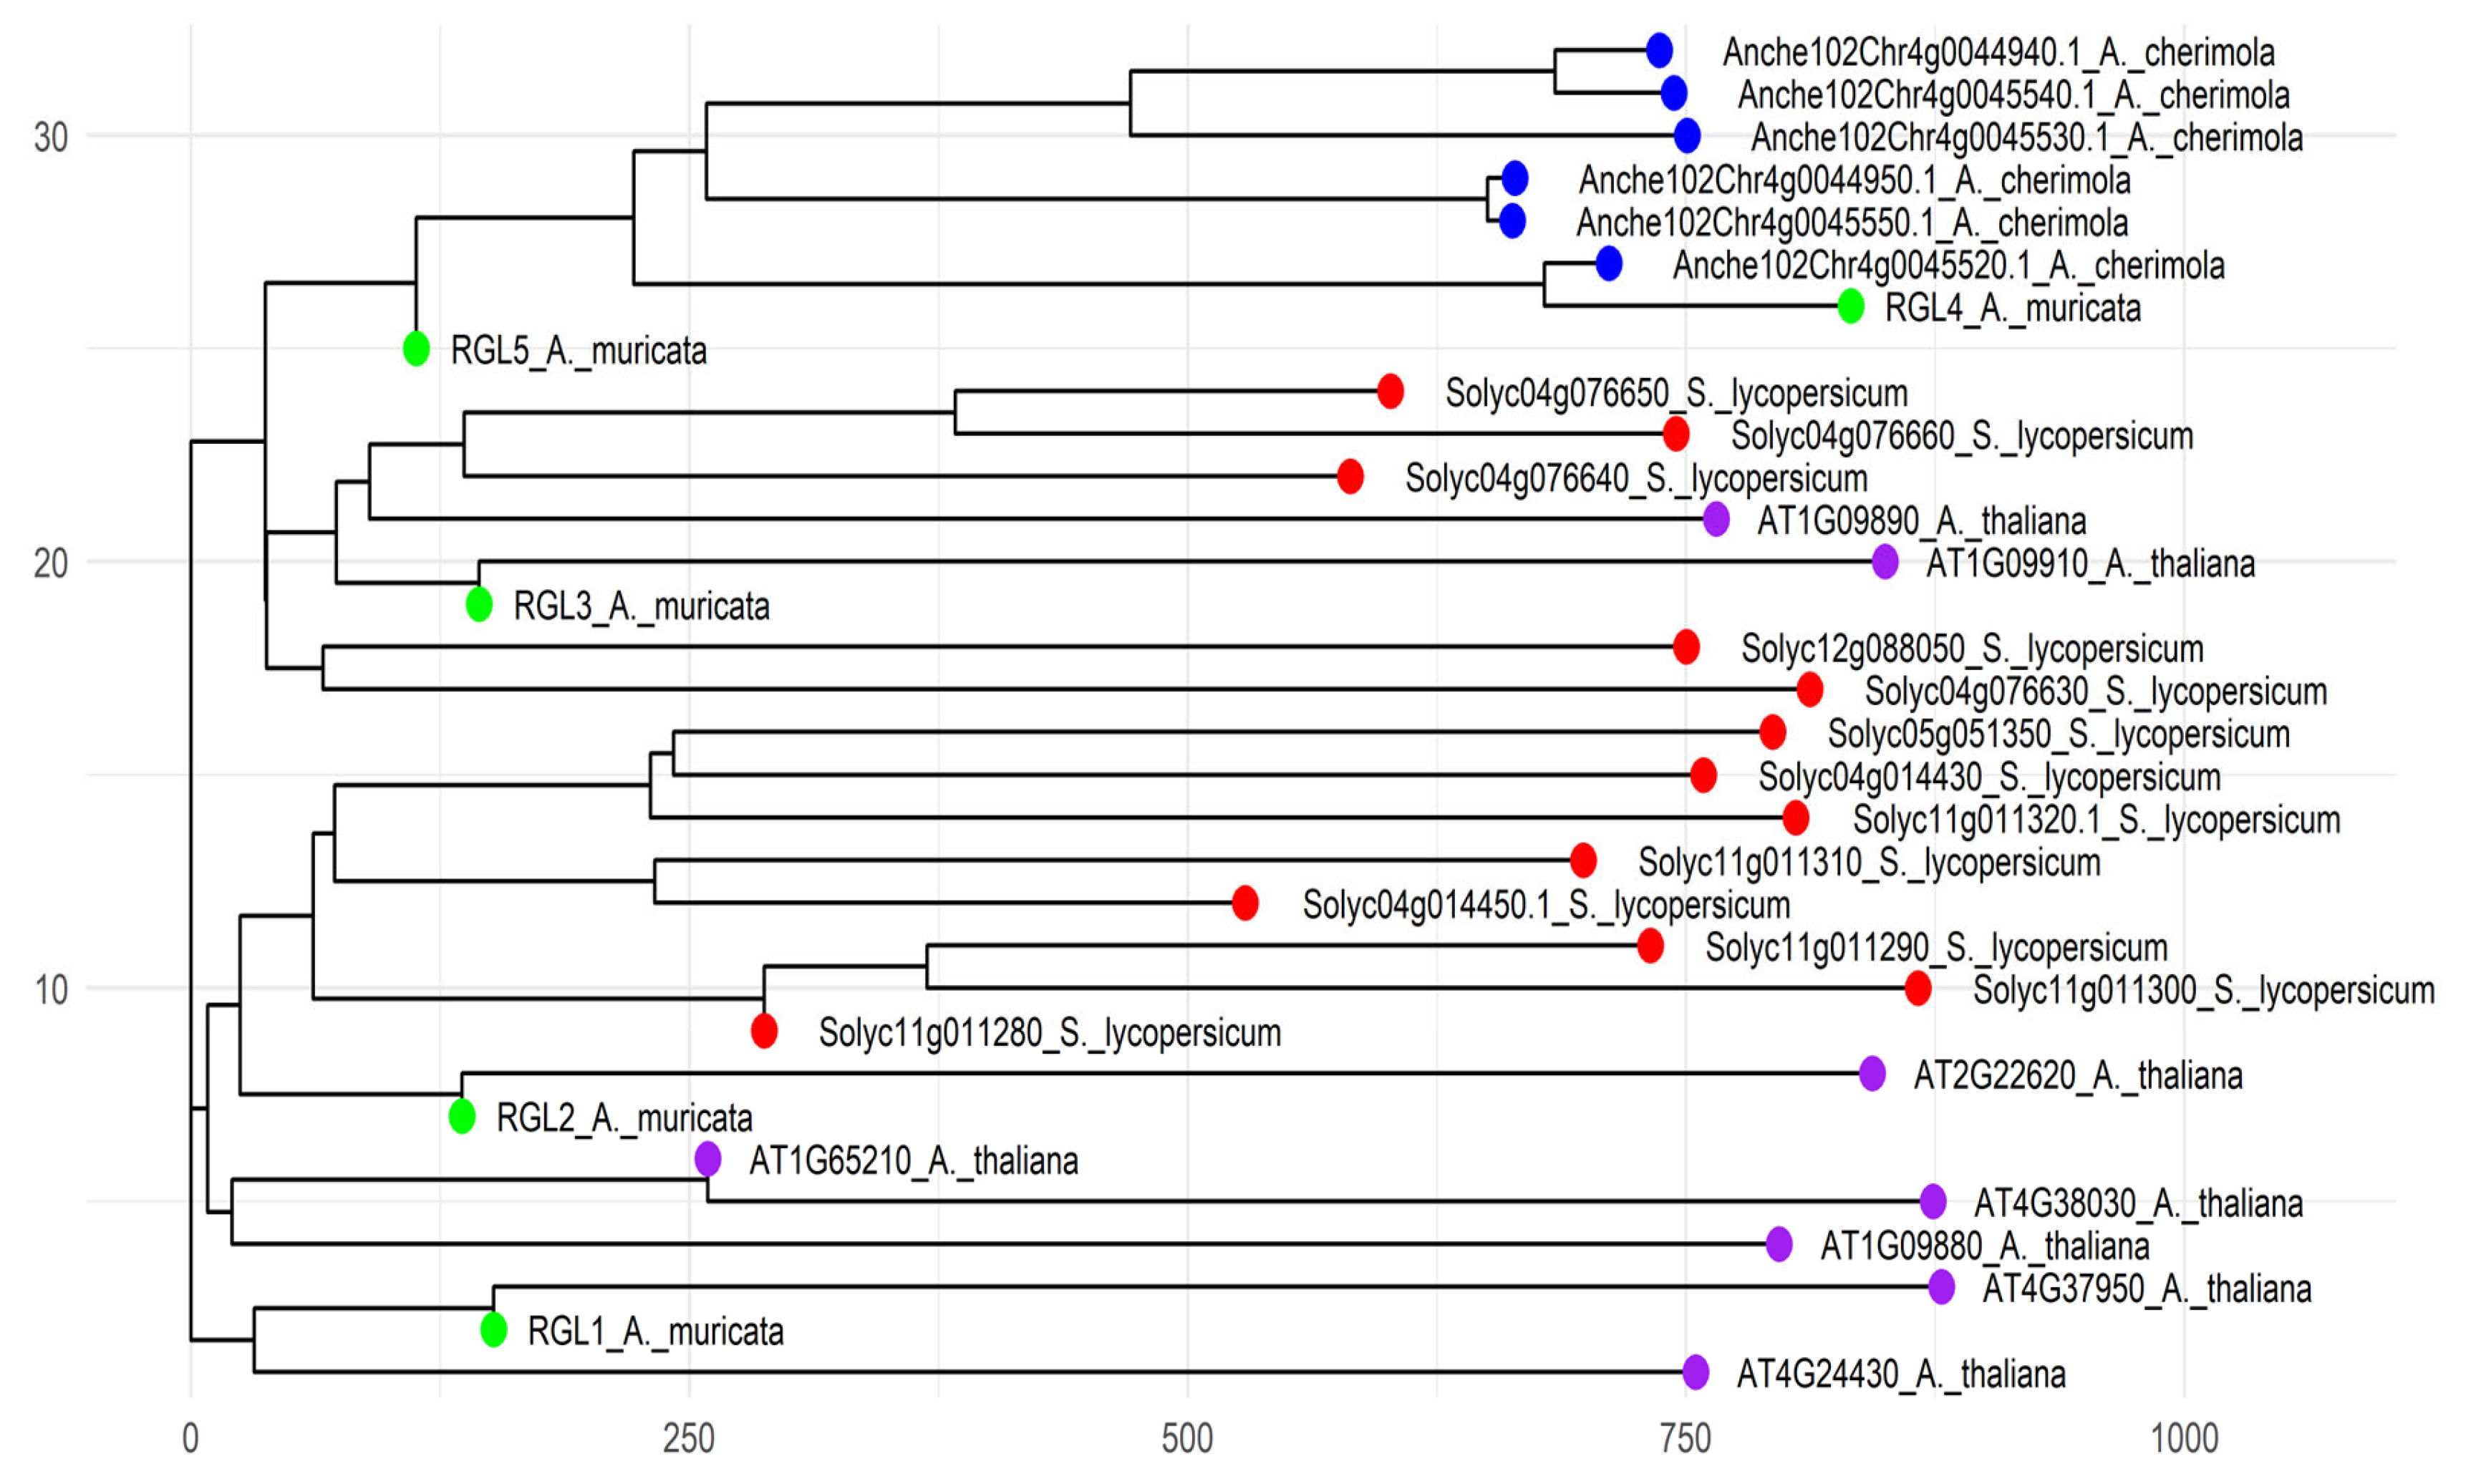
A total of 32 sequences containing the PF06045 domain were identified across the analyzed species. Of these, eight were found in A. thaliana, 13 in tomato, six in cherimoya, and five in soursop, which were designated as RGL1, RGL2, RGL3, RGL4, and RGL5, as shown in Figure 1.
Figure 1.
Phylogenetic tree of RGL-encoding isoenzymes. Green represents soursop, red indicates tomato, blue corresponds to cherimoya, and purple represents Arabidopsis. Values (Nei’s genetic distance) reflect the genetic divergence among species. The root of the tree represents the most ancient common ancestor of all isoenzymes included in the analysis, while nodes indicate points of evolutionary divergence. Branch lengths represent the time elapsed since these divergence events.
The phylogenetic analysis showed that soursop RGLs can be grouped into three distinct clusters (Figure 1). RGL1 and RGL2 were assigned to clusters 1 and 2, respectively, whereas RGL3, RGL4, and RGL5 clustered within cluster 3. This clustering suggests a close evolutionary relationship with low genetic divergence, which may indicate that RGL isoenzymes within each cluster share similar physiological functions. RGL1, RGL2, and RGL3 clearly differentiated from tomato and cherimoya sequences, suggesting a potential functional conservation specific to soursop.
3.2. Differential Expression Analysis
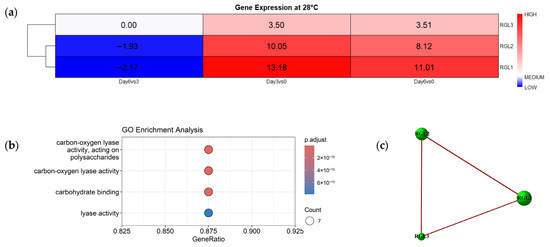
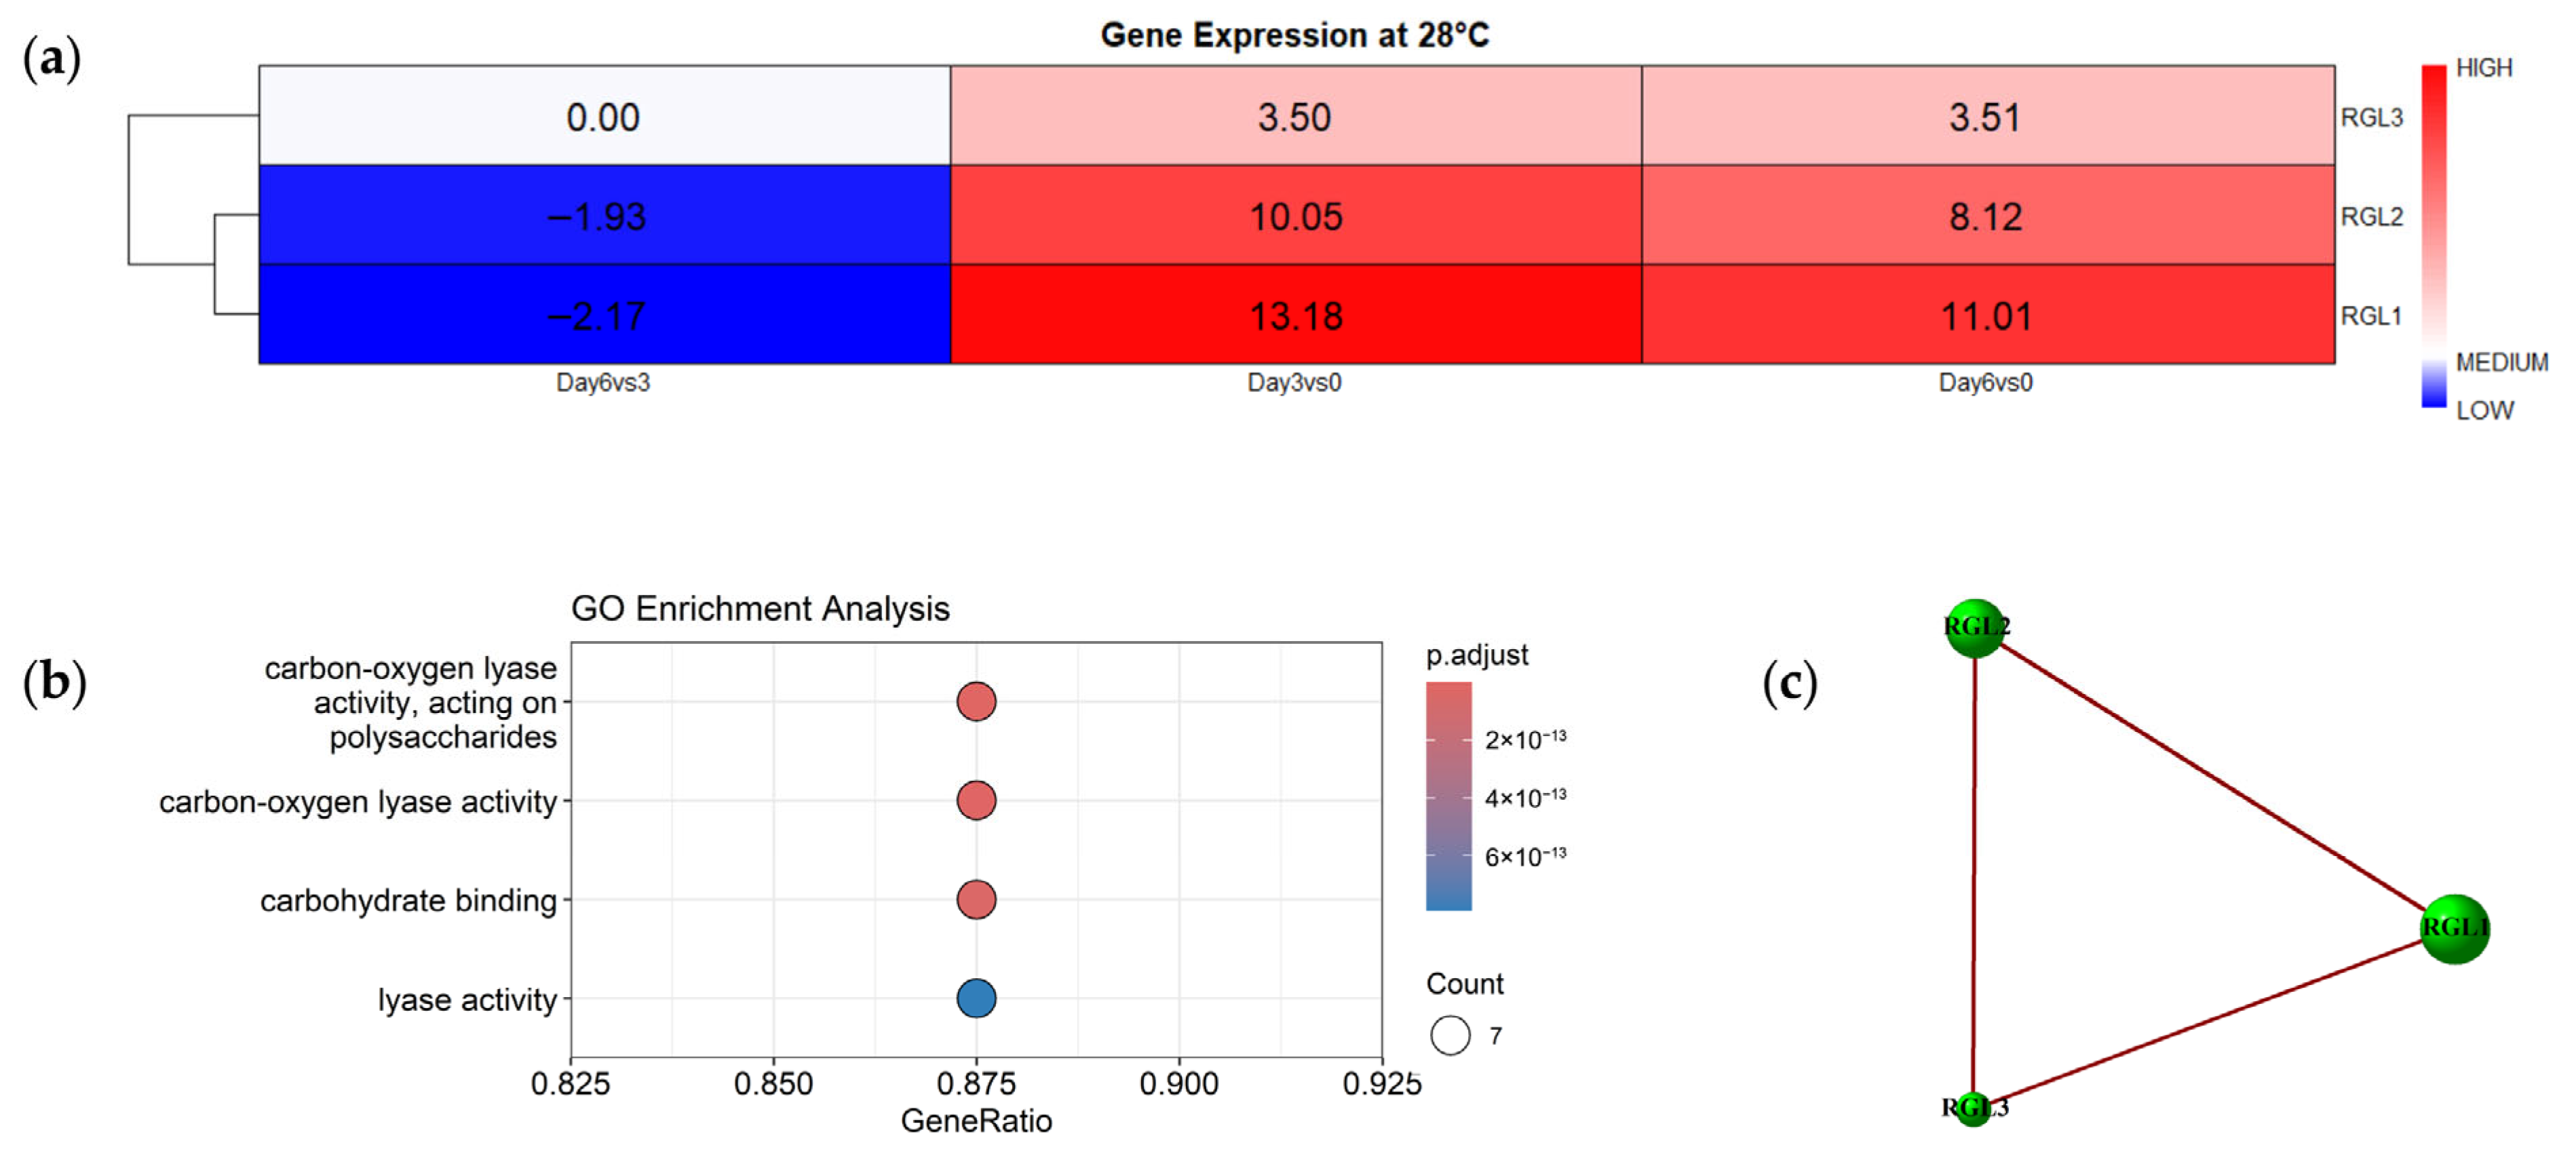
Based on the differentially expressed genes, a heatmap with hierarchical clustering was generated (Figure 2a). The expression of RGL1, RGL2, and RGL3 genes showed significant variations throughout fruit storage. In the case of RGL1, a repression was observed on Day 6 compared to Day 3 (logFC = −2.17). Additionally, this gene exhibited a marked induction on Day 6 relative to Day 0 (logFC = 11.01) and Day 3 (logFC = 13.18). Similarly, RGL2 displayed an initial repression in the Day 6 vs. Day 3 contrast (logFC = −1.93), followed by a strong induction on Day 6 compared to Day 0 (logFC = 8.12) and Day 3 (logFC = 10.05). In contrast, RGL3 showed an induction in its expression during the edible ripening stage (logFC = 3.51 for Day 3 vs. Day 0) and maintained relatively stable expression levels on Day 6 (logFC = 3.50 relative to Day 0 and 0.00 relative to Day 3). Finally, based on their gene expression patterns, RGL1 and RGL2 clustered together, consistent with their grouping in the phylogenetic analysis (Figure 1 and Figure 2a). Overall, the expression profiles of RGL1 and RGL2 exhibited similar trends, which is in agreement with their clustering in the phylogenetic analysis (Figure 1 and Figure 2a), thereby reinforcing the functional relationship between these two genes.
Figure 2.
(a) Heatmap of differentially expressed genes encoding RGL. The color scale represents gene expression levels. The x-axis corresponds to comparisons among storage days, while the y-axis represents the differentially expressed RGL isoenzymes. The color scale ranging from red (up-regulated) to blue (down-regulated) indicates the LogFC in the DEGs (Padj < 0.05); (b) GO enrichment analysis of genes encoding RGL enzymes (molecular function). The y-axis corresponds to Gene Ontology terms related to enzymatic activity, while the x-axis represents the proportion of genes involved in each category. Dot size indicates the number of associated genes, and color denotes the adjusted significance value, with more intense colors indicating higher statistical significance; (c) Co-expression network of RGL genes identified as differentially expressed. Green circles represent nodes (DEGs), and the red line indicates a positive correlation.
3.3. Functional Enrichment Analysis and Gene Co-Expression Network
The analysis revealed that the orthologous genes of the RGL isoenzymes are primarily associated with key enzymatic functions involved in the degradation of cell wall polysaccharides (Figure 2b). In the dot plot of Gene Ontology (GO) terms corresponding to the Molecular Function (MF) category, four significantly enriched terms were identified (adjusted p < 0.05): lyase activity (GO:0016829), carbohydrate binding (GO:0030246), carbon–oxygen lyase activity (GO:0016835), and carbon–oxygen lyase activity acting on polysaccharides (GO:0016837). Each of these terms exhibited a GeneRatio close to 1, indicating a high proportion of genes associated with these enzymatic functions. In addition, the GO term GO:0071555, related to cell wall organization, was identified within the Biological Process category.
On the other hand, the co-expression network constructed using the three RGL genes showed a strong positive correlation among them (Figure 2c). This pattern suggests that these genes tend to be co-expressed and likely respond to a common regulatory mechanism or physiological stimulus.
3.4. Gene Expression
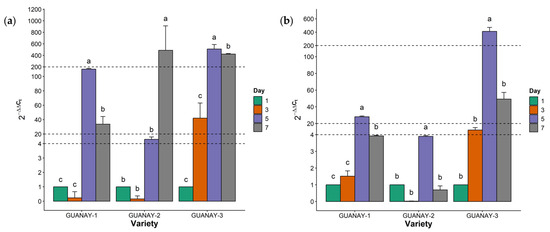
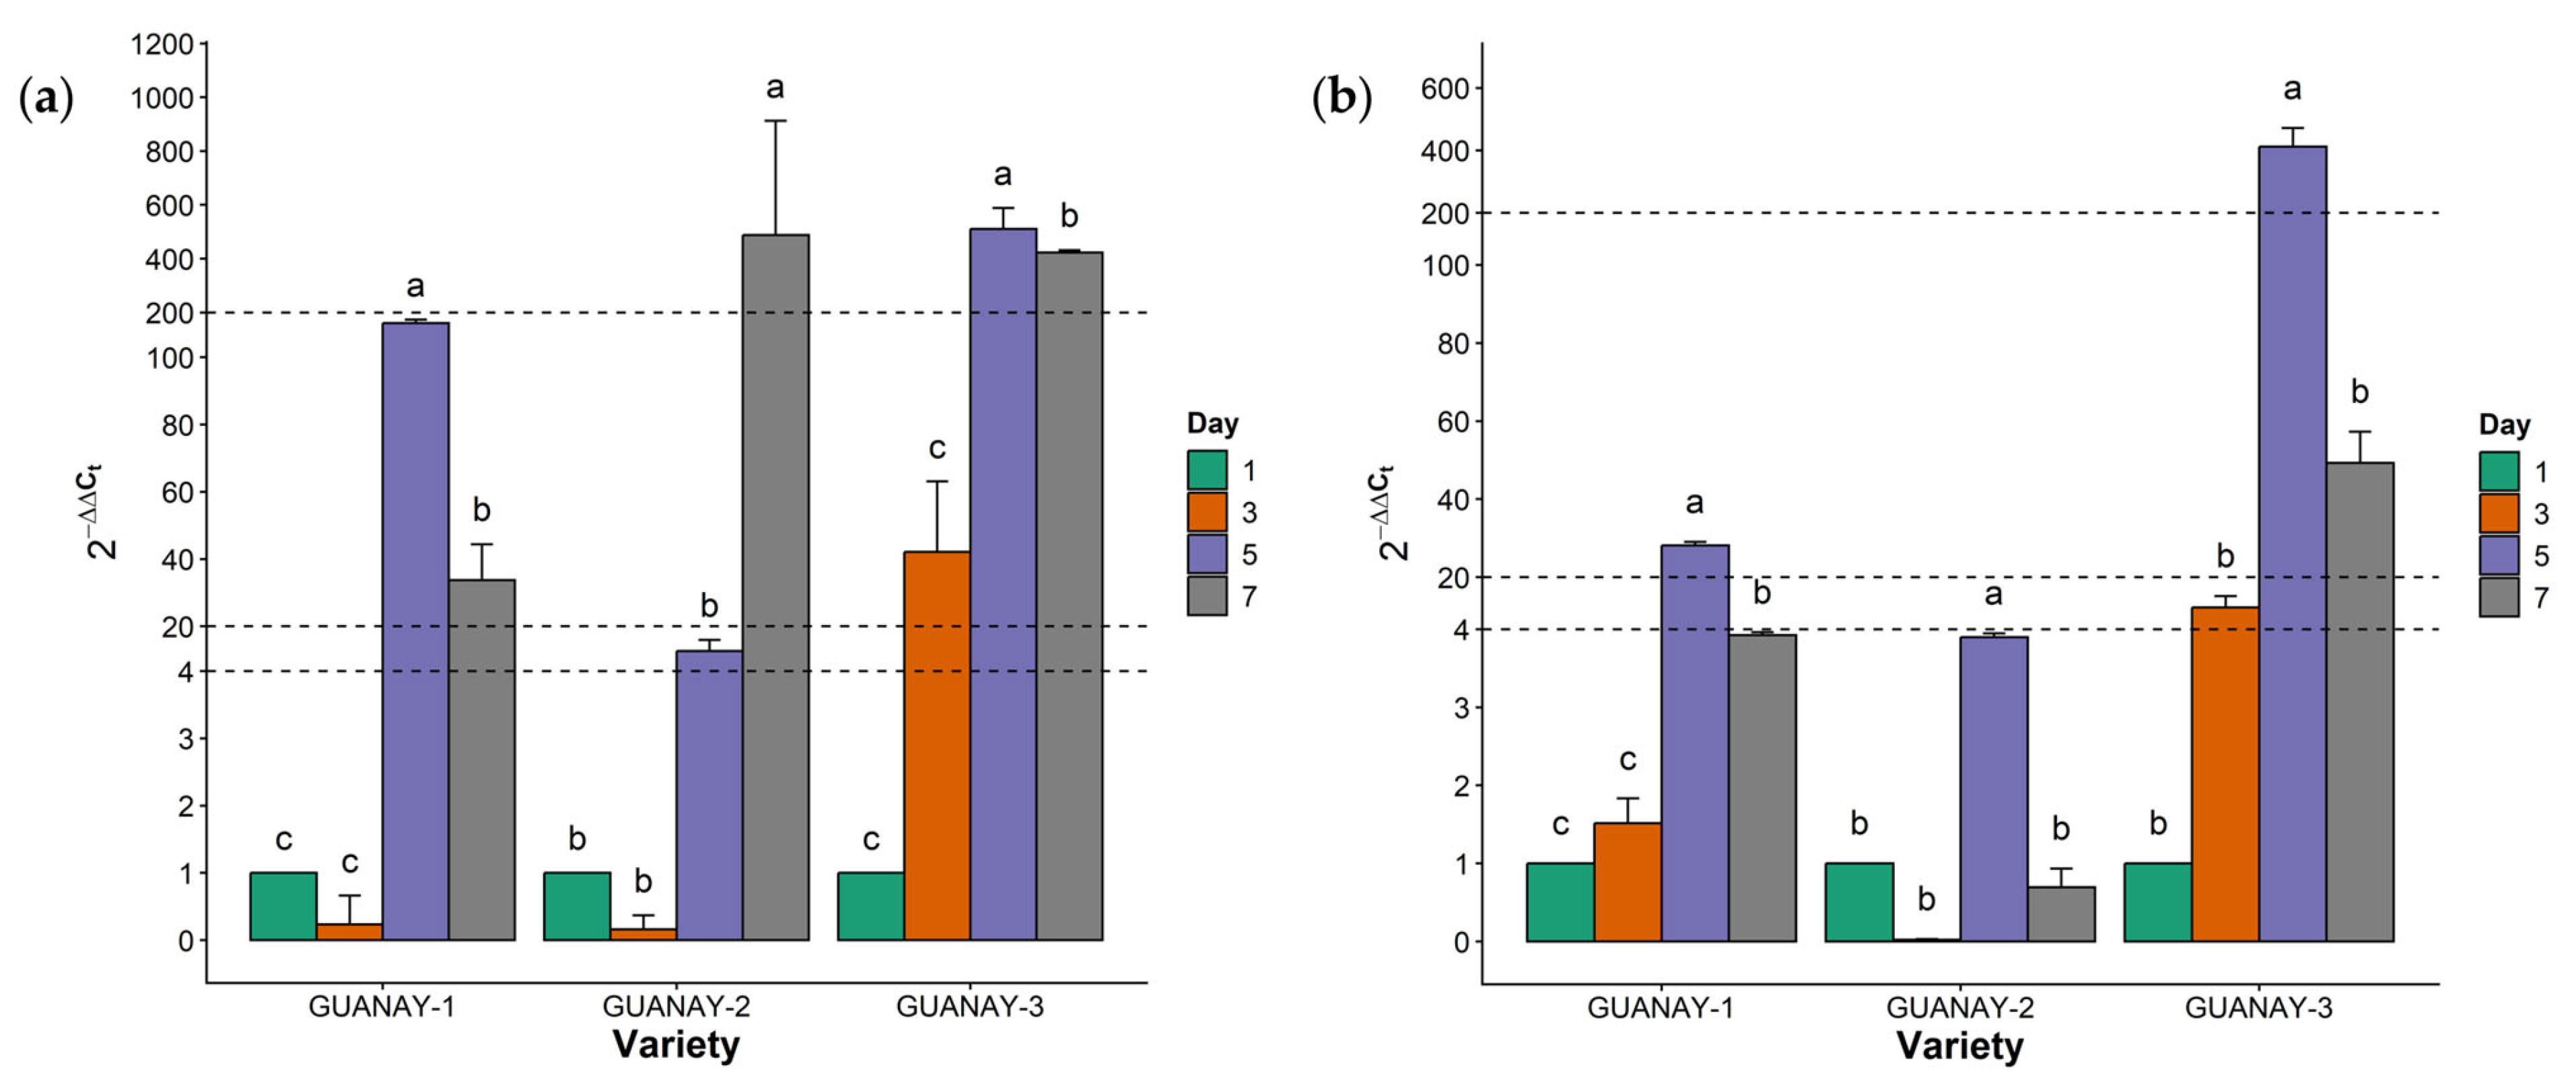
The relative expression of the RGL2 and RGL3 genes was quantified at different storage days, with expression levels normalized to day 1 (Figure 1 and Figure 2a). The highest expression of RGL2 was observed on day 5 in the GUANAY-1 and GUANAY-3 varieties and on day 7 in GUANAY-2 (Figure 3a). In GUANAY-1, RGL2 expression decreased by 0.77-fold on day 3 compared with day 1 (p > 0.05), reaching its maximum level on day 5, with a 160.82-fold increase relative to day 1 (p < 0.05). By day 7, expression decreased by 127.28-fold compared with day 5 (p < 0.05), as shown in Figure 3a. In GUANAY-2, RGL2 expression decreased by 0.84-fold on day 3 of storage (p > 0.05), followed by a progressive increase that peaked on day 7 (p < 0.05), reaching an expression level 487.21-fold higher than that of day 1 (Figure 3a). Finally, in GUANAY-3, RGL2 expression increased by 41.18-fold on day 3 relative to day 1 (p > 0.05), reaching its maximum on day 5, with expression levels 510.03-fold higher than those observed on day 1 (p < 0.05). Subsequently, on day 7, expression decreased significantly by 88.23-fold compared with day 5 (p < 0.05), as illustrated in Figure 3a.
Figure 3.
(a) Relative expression of the RGL2 gene in soursop fruits at storage days 1, 3, 5, and 7. The X-axis represents the GUANAY-1, GUANAY-2, and GUANAY-3 varieties, and the Y-axis indicates relative expression levels. Different letters indicate significant differences according to Tukey’s HSD test (p < 0.05). Vertical error bars represent the standard deviation of the means. Horizontal lines represent a break in the y-axis to display larger values; (b) relative expression of the RGL3 gene in soursop fruits during storage days 1, 3, 5, and 7. The x-axis represents the GUANAY-1, GUANAY-2, and GUANAY-3 varieties, while the y-axis corresponds to relative expression. Different letters indicate significant differences according to Tukey’s HSD test (p < 0.05). Vertical error bars represent the standard deviation of the means. Horizontal lines represent a break in the y-axis to display larger values.
The highest expression of the RGL3 gene was observed on day 5 in all three varieties (Figure 3b). In the GUANAY-1 variety, RGL3 expression increased by 0.52-fold on day 3 of storage compared to day 1 (p > 0.05), reaching its maximum level on day 5, with an expression 27.14-fold higher than that of day 1 (p < 0.05). Subsequently, on day 7, expression decreased by 22.95-fold relative to day 5 (p < 0.05). In addition, a positive correlation with RGL2 gene expression was observed (r = 0.94, p < 0.05), as shown in Figure 3b. In contrast, in the GUANAY-2 variety, RGL3 expression decreased by 0.98-fold on day 3 of storage compared to day 1 (p > 0.05), followed by an increase on day 5, reaching its maximum level with an expression 3.61-fold higher than that of day 1 (p < 0.05). Finally, on day 7, expression decreased by 0.31-fold compared to day 1 (p < 0.05), as shown in Figure 3b. Additionally, on day 5, a positive correlation with RGL2 expression was observed (r = 1.00, p < 0.05). Finally, in the GUANAY-3 variety, RGL3 expression increased by 11.28-fold on day 3 compared to day 1 (p > 0.05), reaching its maximum level on day 5, with an expression 411.80-fold higher than that of day 1 (p < 0.05). Subsequently, on day 7, expression levels decreased by 363.06-fold relative to day 5 (p < 0.05), as shown in Figure 3b. Likewise, on day 5, a positive correlation with RGL2 expression was observed (r = 0.95, p < 0.05).
3.5. Enzymatic Activity
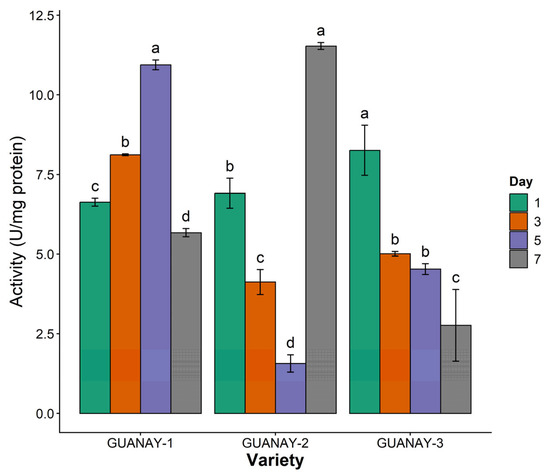
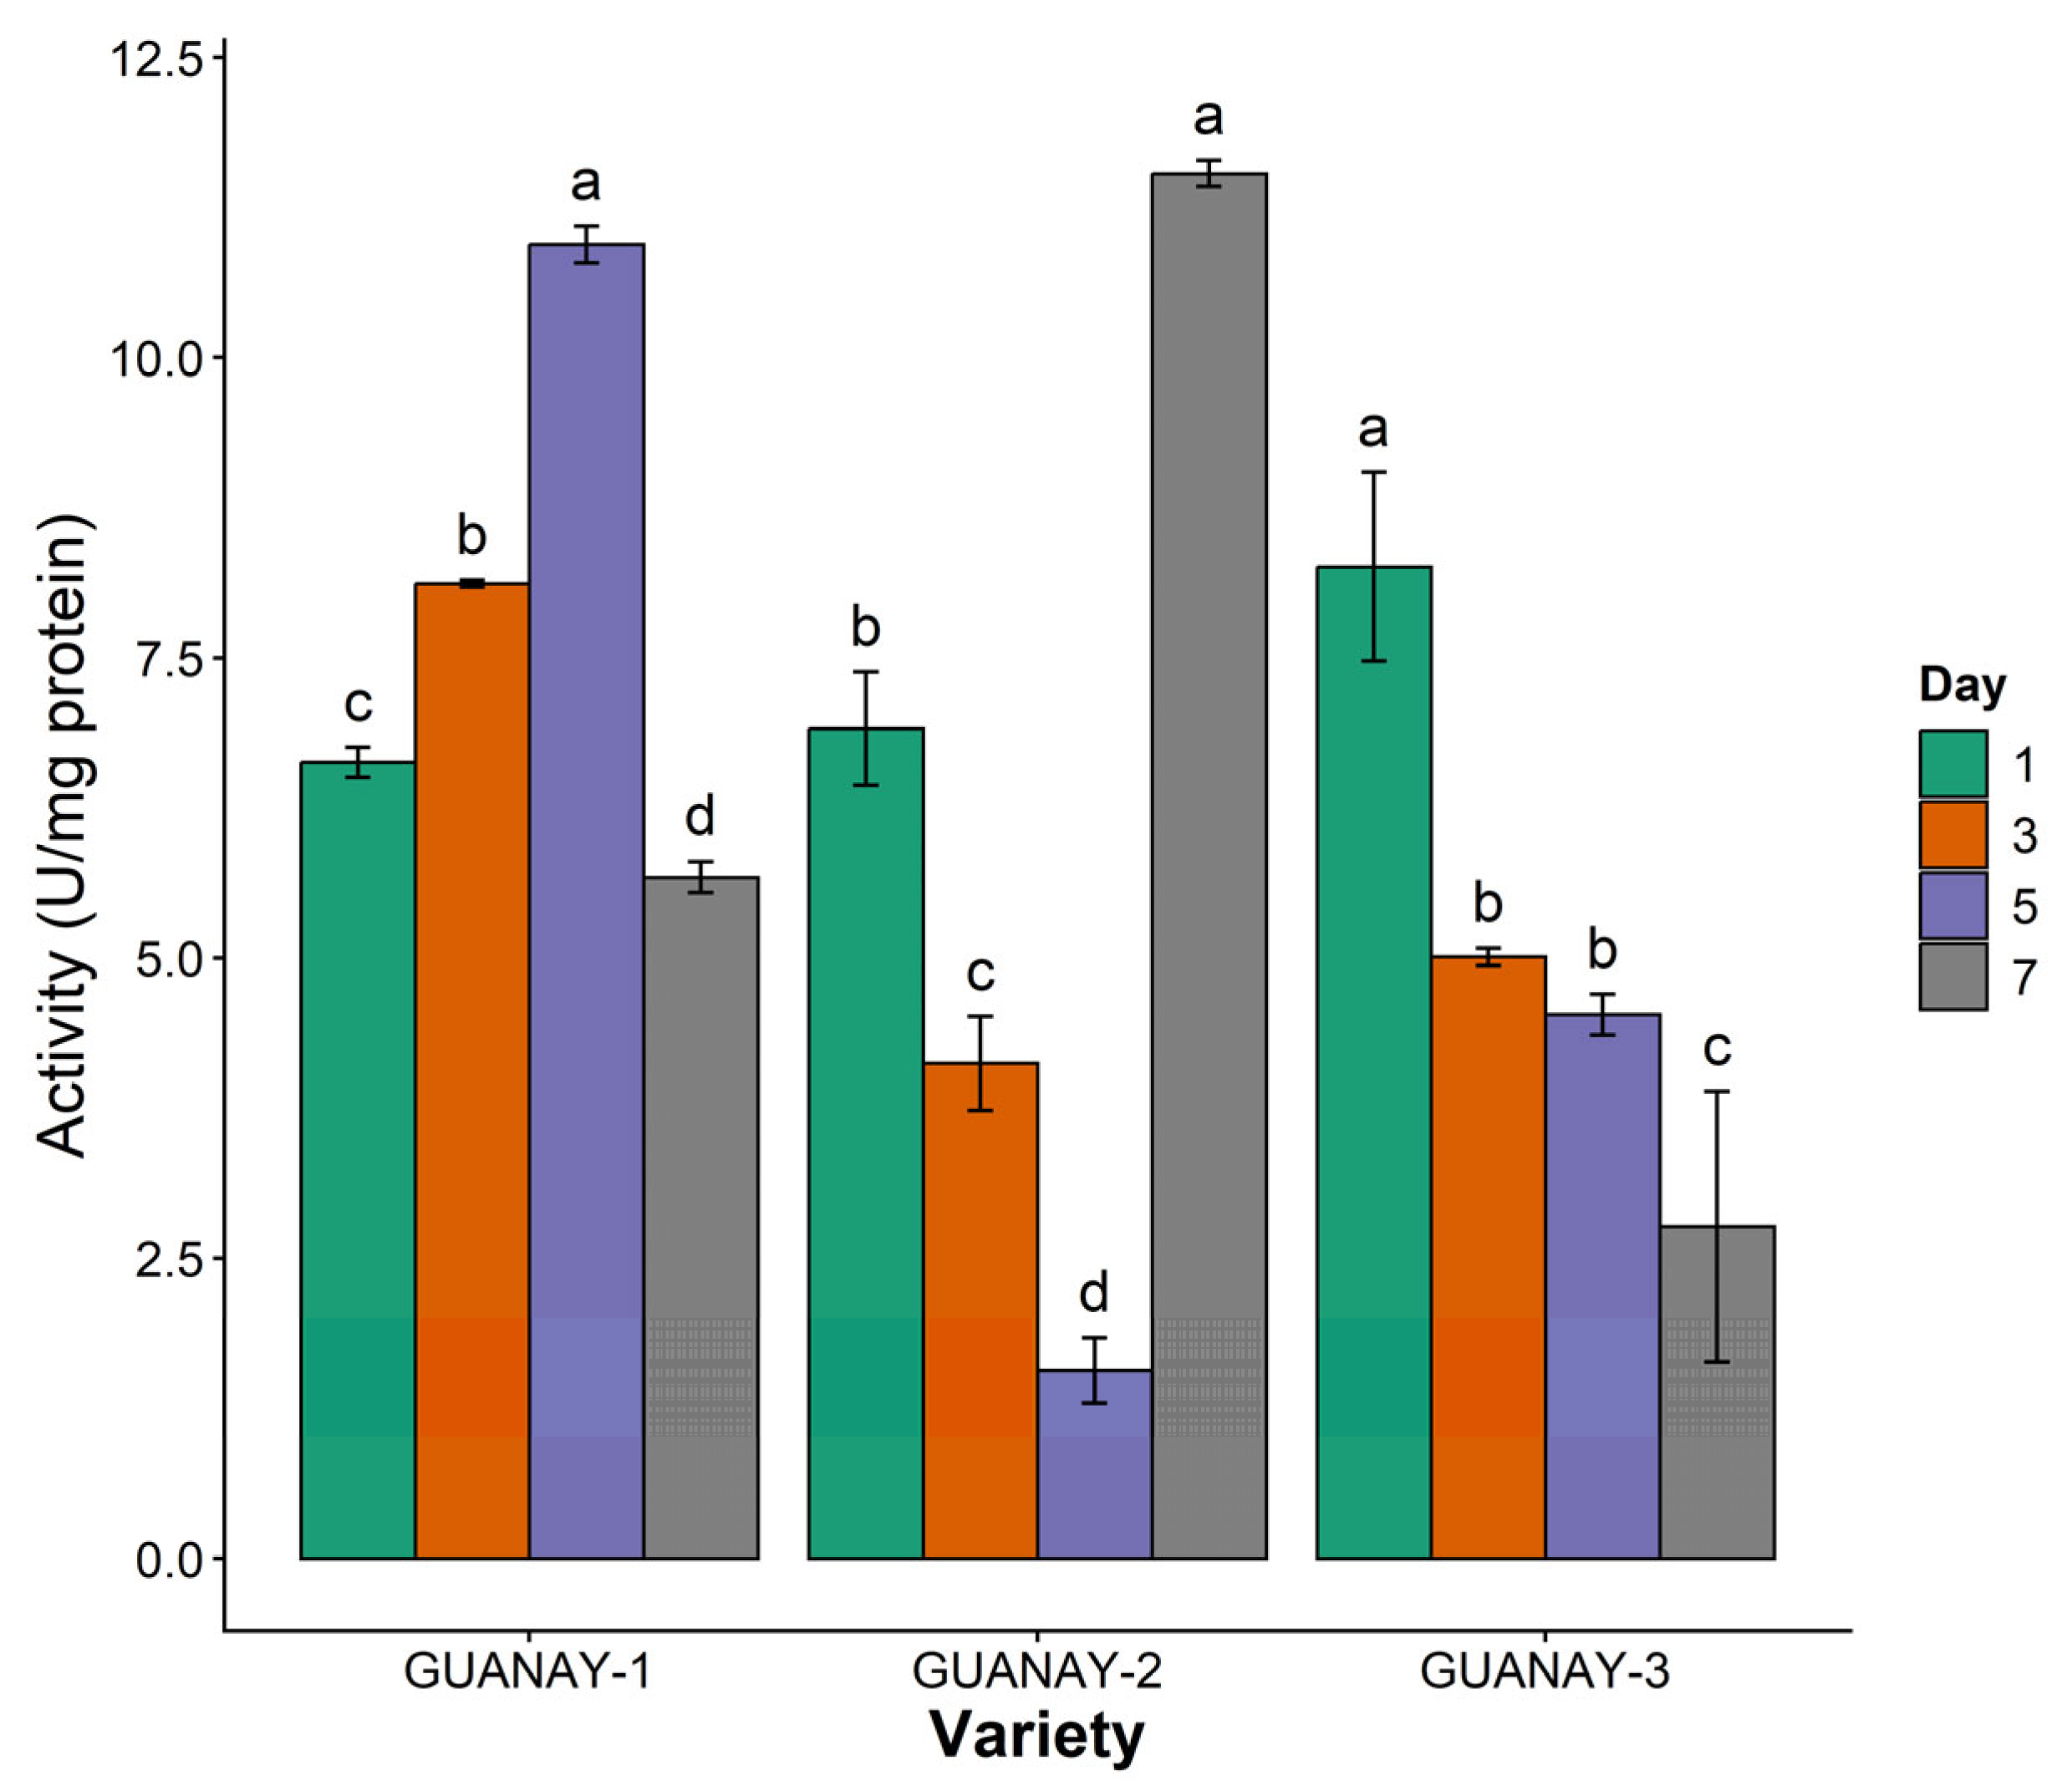
RGL enzymatic activity was quantified in the three soursop varieties throughout postharvest storage, showing significant differences among storage days within each variety (Figure 4). The GUANAY-2 variety exhibited the highest enzymatic activity on day 7 (11.53 U mg−1 protein), as shown in Figure 4. In the GUANAY-1 variety, a progressive increase in enzymatic activity was observed from day 1, reaching a maximum value of 10.94 U mg−1 protein on day 5, followed by a decrease on day 7 to 5.67 U mg−1 protein. In all cases, significant changes were detected during storage (p < 0.05), as illustrated in Figure 4. In addition, on day 3 of storage, a negative correlation was observed between enzymatic activity and RGL3 expression (r = −0.86, p < 0.05). In contrast, in the GUANAY-2 variety, enzymatic activity gradually decreased between days 1 and 5 (from 6.91 to 1.57 U mg−1 protein, respectively), followed by a marked increase on day 7, reaching 11.53 U mg−1 protein. Significant differences were observed among all storage days (p < 0.05), as shown in Figure 4. Moreover, on day 5, a negative correlation was detected between enzymatic activity and the expression of RGL2 and RGL3 (r = −0.81, p < 0.05 in both cases). Finally, in the GUANAY-3 variety, significant differences were observed among storage days (p < 0.05), with a gradual decrease in enzymatic activity from day 1 to day 7 (from 8.26 to 2.77 U mg−1 protein, respectively), as shown in Figure 4. Likewise, a negative correlation was observed between enzymatic activity and the expression of RGL2 and RGL3 (r = −0.70 and −0.99, respectively; p < 0.05).
Figure 4.
Enzymatic activity of GUANAY-1, GUANAY-2, and GUANAY-3 during storage days 1, 3, 5, and 7. The X-axis shows the soursop varieties (GUANAY-1, GUANAY-2, and GUANAY-3), and the Y-axis shows enzymatic activity expressed as U mg−1 protein. Different letters indicate significant differences according to Tukey’s HSD test (p < 0.05). Vertical error bars represent the standard deviation of the means.
3.6. PCA
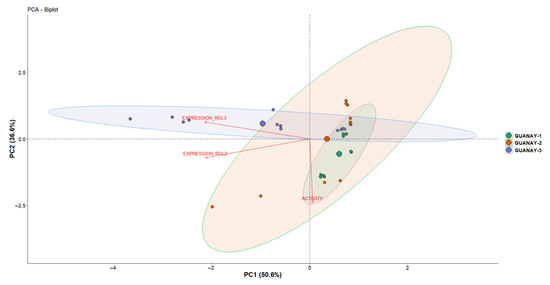
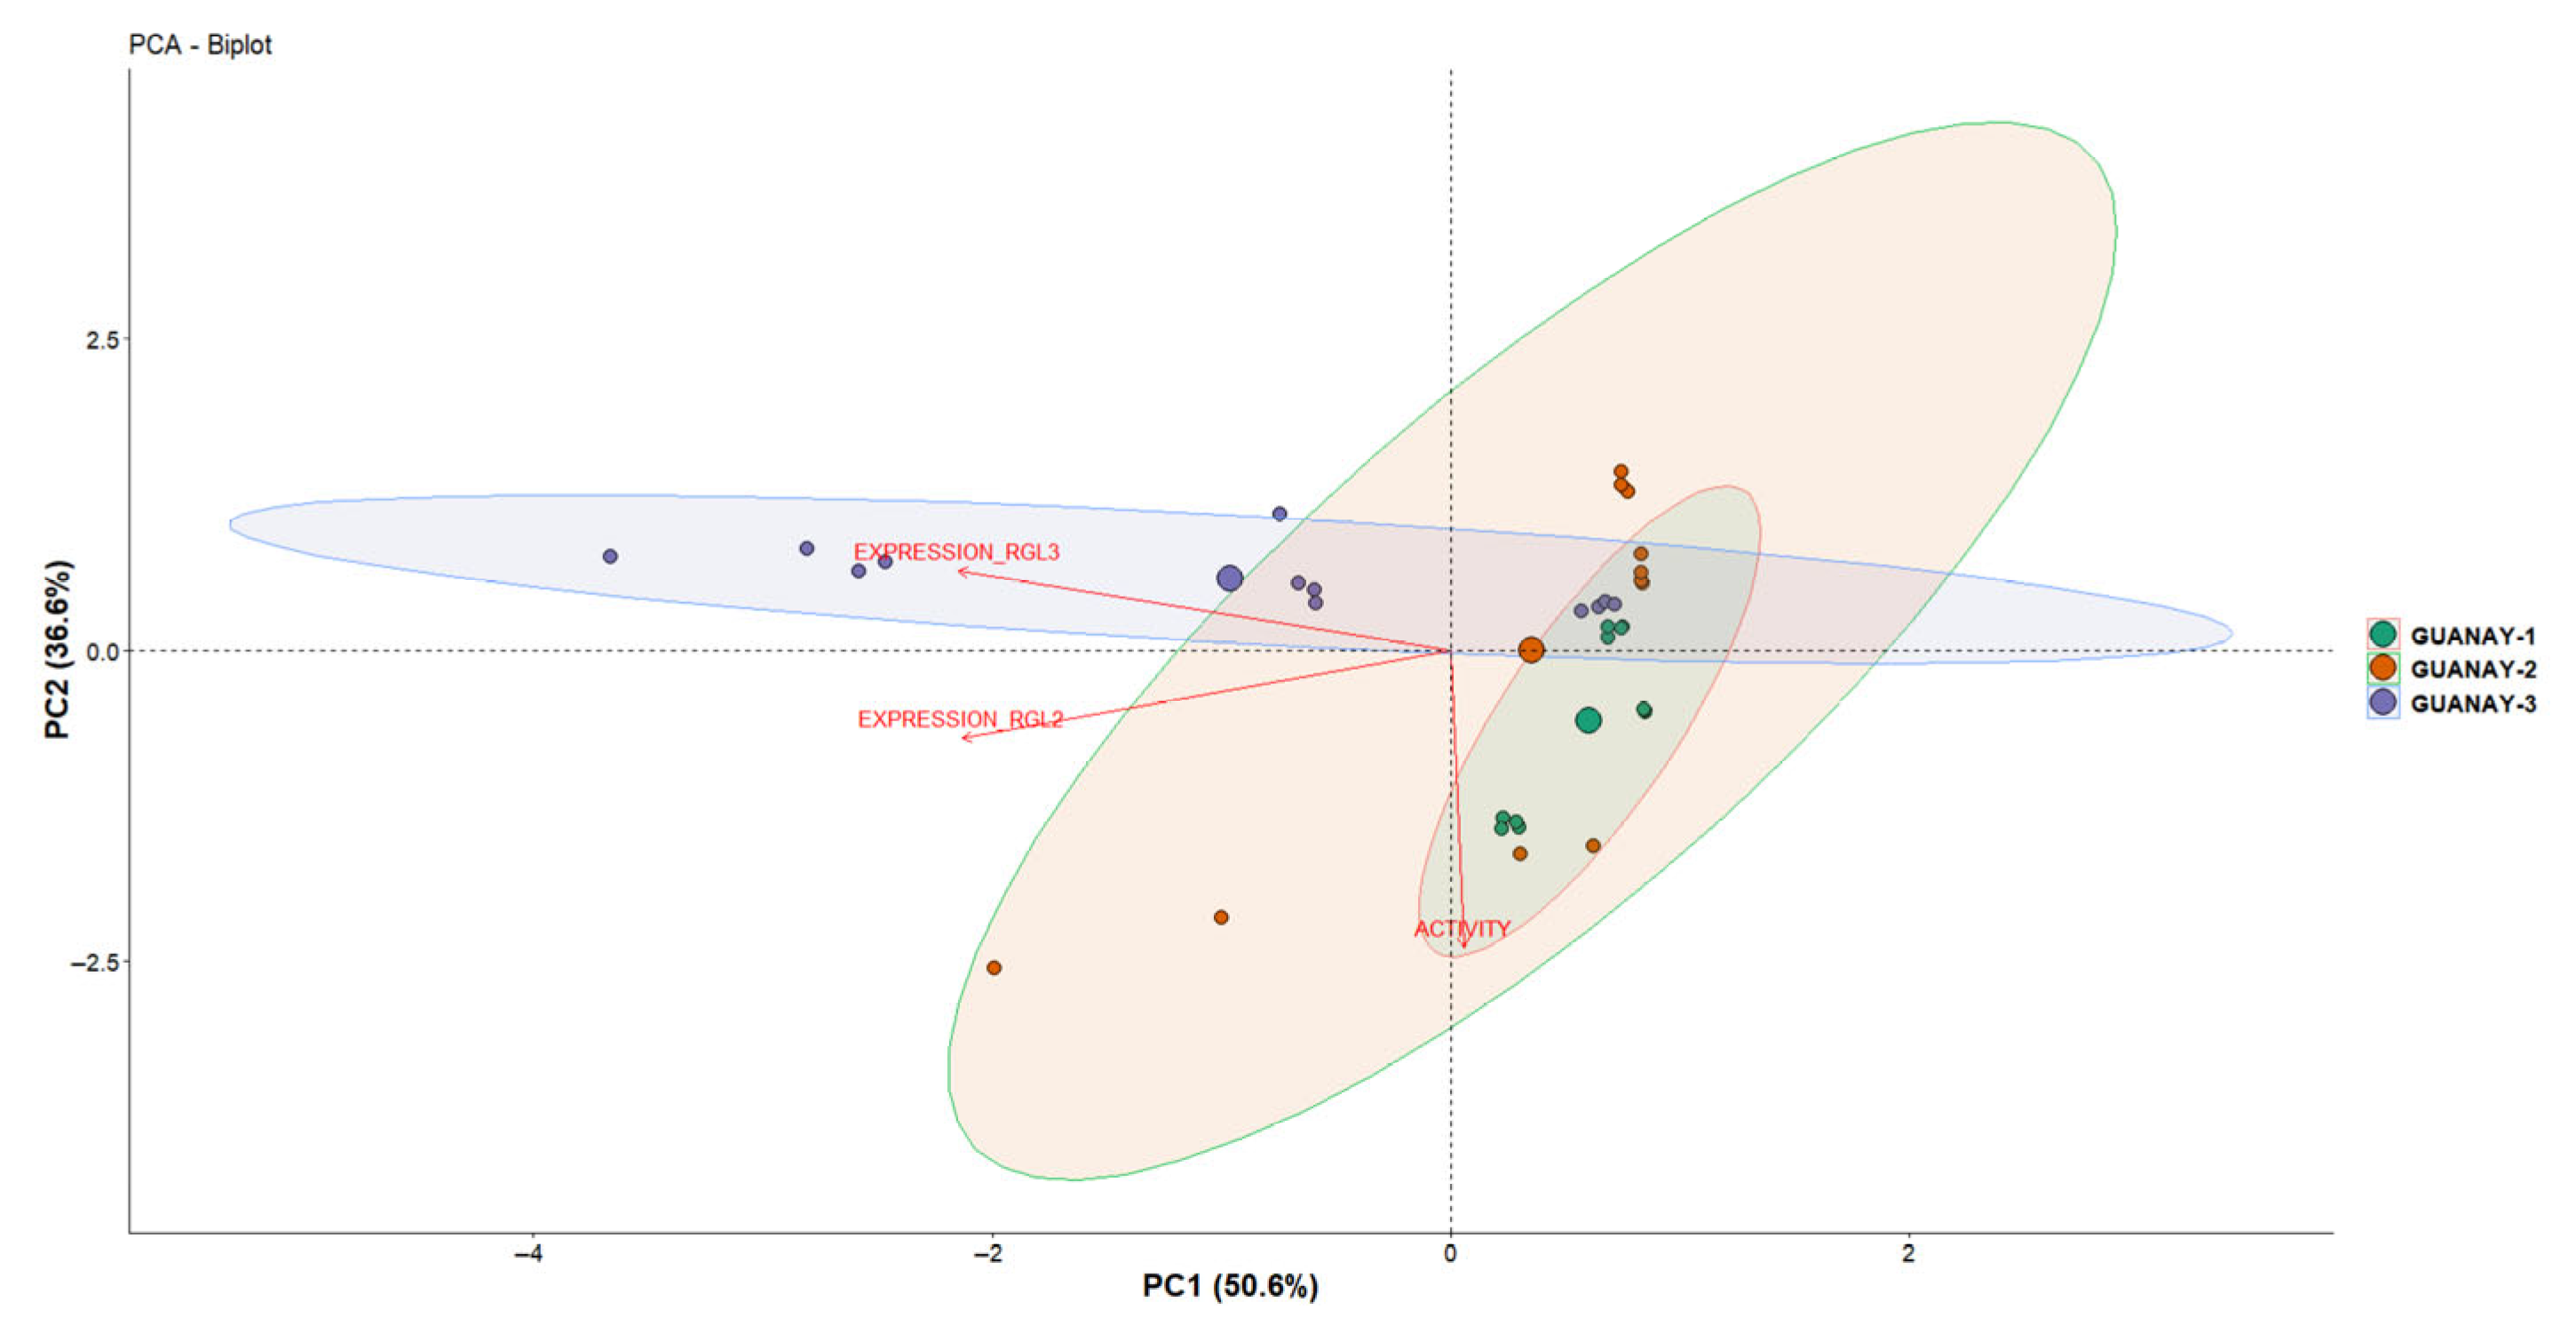
The first two principal components explained 87.2% of the total variability (Figure 5). Principal Component 1 (PC1) accounted for 50.6% of the data variance and was mainly defined by enzymatic activity, whereas Principal Component 2 (PC2) explained 36.6% and was determined by the expression of the RGL2 and RGL3 genes. The vectors for RGL2 and RGL3 are close to each other and oriented in the same direction, indicating a positive correlation, while enzymatic activity projects in a different direction, indicating a negative correlation (Figure 5). Accordingly, three main groups were observed corresponding to each variety; GUANAY-1 and GUANAY-2 cluster at the same intersection, indicating greater similarity in their behavior. In contrast, GUANAY-3 is clearly separated, demonstrating a distinct response pattern.
Figure 5.
Principal component analysis (PCA) of enzymatic activity and RGL2 and RGL3 expression in GUANAY-1, GUANAY-2, and GUANAY-3 varieties across storage days (3, 5, and 7). Arrows represent the variables; their direction indicates the gradient of increase for each variable, and their length reflects the degree of contribution to the total variance. Colored ellipses delineate sample dispersion by variety (GUANAY-1, GUANAY-2, and GUANAY-3).
4. Discussion
The results of the present study demonstrate a clear phylogenetic relationship among the RGL1, RGL2, and RGL3 genes. In particular, RGL1 and RGL2 exhibit a close evolutionary relationship, suggesting that they may share similar functional roles in soursop fruit. In contrast, RGL4 and RGL5 showed greater affinity with their orthologs in cherimoya (Figure 1), suggesting functional conservation within the genus Annona. Furthermore, its position in the tree with the other soursop isoenzymes also indicates that it has undergone specific structural adaptations. This divergence may reflect structural adaptations associated with functions not directly related to fruit softening [48]. Similarly, Ochoa-Jiménez et al. [28] reported an evolutionary differentiation of RGLs among plants, fungi, and bacteria, supporting their functional specialization.
The phylogenetic proximity among RGL1, RGL2, and RGL3 is consistent with the patterns observed in the heatmap of differentially expressed genes (Figure 2a). These three genes exhibit similar expression trends during the fruit softening stage and the onset of senescence. In this context, Ric-Varas et al. [49] demonstrated that suppression of the FaRGLyase1 gene (which encodes RGL in strawberry) increases fruit firmness by reducing RG-I degradation, highlighting the central role of this enzyme in cell wall remodeling and its consequent impact on fruit turgor and shelf life. Studies on potatoes have shown that RGL overexpression is involved in processes such as pollen fertility [32]. Likewise, Berumen-Varela et al. [34] demonstrated that altered RGL expression in genetically modified plants results in fruits with increased firmness, extended shelf life, and delayed ripening, as well as modifications in seed formation, root length, and pollen viability. These findings reinforce the notion that RGL not only participates in cell wall restructuring during fruit ripening but is also involved in other metabolic pathways, which is consistent with the lack of expression observed for RGL4 and RGL5. The functional enrichment analysis supports this interpretation. The GO terms identified (Figure 2b) are consistent with metabolic functions related to the depolymerization of the RG-I domain of pectin, a process catalyzed by RGLs through a β-elimination mechanism [50]. The co-expression network obtained in this study revealed positive correlations among the RGL1, RGL2, and RGL3 genes (Figure 2c), suggesting their coordinated participation in the same biological pathway associated with RG-I modification, as previously reported in other climacteric fruits [30,51]. In this regard, Berumen-Varela et al. [34] demonstrated that the expression of RGL-encoding genes in tomato increases specifically during ripening and is regulated by ethylene-responsive cis-elements. In that same study, expression analysis of the Solyc11g011300 gene showed that it is active in ripe tomato fruit, suggesting that RGL transcription is controlled by ethylene-dependent hormonal mechanisms and that its peak expression coincides with cell wall degradation. Similarly, Trillo-Hernández et al. [36] reported that the Solyc11g011300 gene, which encodes an RGL enzyme in tomato, plays a key role during ripening by modulating cell wall pectin structure. Its expression increases concomitantly with ethylene production, promoting fruit softening and loss of firmness. These studies demonstrate that ethylene acts as an essential phytohormone in the ripening of climacteric fruits by regulating a complex signaling cascade involving the inactivation of Constitutive Triple Response 1 (CTR1), activation of Ethylene Insensitive 2 (EIN2), and induction of the transcription factors Ethylene Insensitive 3 (EIN3) and Ethylene Insensitive-Like 1 (EIL1). These factors regulate pectinolytic genes involved in fruit softening [52,53,54]. On the other hand, Ochoa-Jiménez et al. [55] stored GUANAY-1 soursop fruits at 28 °C for six days and evaluated postharvest quality attributes along with the expression profile of genes encoding pectin-degrading enzymes. Their results showed a marked loss of fruit firmness during ripening, which coincided with the down-regulation of polygalacturonase and endoglucanase genes. In this study, RGL2 showed increased expression during storage, indicating a potential involvement in the fruit ripening process. Díaz-Rincon et al. [4] analyzed three soursop varieties during postharvest storage at 28 °C, reporting the climacteric peak on the seventh day of storage for all varieties, while ethylene production reached its maximum on day 4 in GUANAY-2 and GUANAY-3 and on day 5 in GUANAY-1. Under these same storage conditions, the three varieties exhibited a similar physiological behavior, characterized by a progressive increase in weight loss and a significant decrease in firmness, reflecting an accelerated fruit softening process. Likewise, total soluble solids increase while pH and titratable acidity decrease [4]. Nevertheless, the progression of these changes during postharvest ripening varied among the analyzed varieties. Taken together, these findings suggest that pectin metabolism during soursop ripening is a complex and finely regulated process in which multiple enzymes act in a coordinated but temporally distinct manner rather than through the activity of a single pectinolytic enzyme.
In the present study, maximum expression levels of RGL2 were detected between days 5 and 7, depending on the variety (Figure 3a), whereas RGL3 reached its highest expression on day 5 in all three varieties (Figure 3b). Based on the results of this study and those reported by Díaz-Rincon et al. [4], it is suggested that ethylene may induce the signaling cascade that activates RGL expression in soursop fruits. Moreover, RGL3 showed a trend similar to that of RGL2, although with lower expression levels, indicating possible co-expression and further supporting the findings of the present study. Yang et al. [56] demonstrated that RG-I acts as an important structural component in cell–cell adhesion in plants, supporting the notion that its degradation by RGL activity compromises cell cohesion and promotes fruit softening. In this context, the increased expression of RGL2 and RGL3 observed during the climacteric peak suggests that both isoenzymes actively participate in RG-I degradation. Subsequently, the decline in expression of both genes toward the end of storage coincides with the early stage of senescence, when most structural modifications have already been completed. This pattern is characteristic of other climacteric fruits, in which the expression of pectinolytic enzymes is associated with peaks in ethylene production and respiration [14,18,57].
Ric-Varas et al. [49] demonstrated that suppression of the FaRGLyase1 gene in strawberry through RNAi resulted in a significant increase in fruit firmness by reducing RG-I degradation and maintaining greater cell wall integrity. These results confirm that RGL enzyme activity plays an important role in fruit softening processes by modulating the depolymerization of RG-I, a key structural component of the cell wall. These findings are consistent with those observed in soursop, where the higher expression of RGL2 and RGL3 during ripening stages suggests an essential role of these enzymes in RG-I degradation and in the regulation of fruit texture. RG-I is characterized by its structural complexity, as its backbone consists of alternating repeats of rhamnose (Rha) and galacturonic acid (GalA). Recently, Al-Hinai et al. [50] confirmed RGL activity by identifying, in mature fruit tissues, the structural signature ΔUA–Rha–GalA–Rha, which is a characteristic product of the reaction catalyzed by RGL. This reaction involves the cleavage of the glycosidic bond between Rha and GalA through a β-elimination mechanism, generating a double bond between the C4 and C5 carbons of GalA, whose formation can be detected at 235 nm [30,58,59]. In GUANAY-1, the highest levels of gene expression (RGL2 and RGL3) and enzymatic activity coincided on the fifth day of storage. This suggests a direct transcriptional regulation, consistent with the fruit softening phase and the increase in ethylene production [4]. These results indicate that RGL participates in pectin degradation during the ripening of GUANAY-1 soursop fruit. In contrast, GUANAY-2 exhibited a different pattern, in which enzymatic activity decreased between days one and five and subsequently increased on day seven. This behavior may be attributed to post-transcriptional regulatory mechanisms, such as mRNA stabilization or temporary storage prior to translation, a process previously documented in fruits such as apple [57,60,61]. This type of regulation enables a rapid and efficient response through the localization, stabilization, or transient repression of mRNAs, activating translation at specific metabolic stages. In plants, this mechanism has been associated with the production of enzymes responsible for cell wall disassembly and, consequently, fruit softening [62]. Finally, GUANAY-3 showed a progressive decrease in enzymatic activity throughout storage, despite exhibiting the highest RGL3 expression levels and elevated RGL2 expression on days 5 and 7. This may indicate that RGL is regulated post-translationally and/or that the enzyme becomes inactivated due to factors such as pH, substrate availability, or protein degradation, which can affect enzyme stability or functionality and prevent increased transcription from translating into higher catalytic activity [63,64]. Furthermore, the PCA showed that the GUANAY-3 variety clustered independently in the left quadrant and was associated mainly with gene expression variables, whereas GUANAY-1 and GUANAY-2 were positioned on the right side, primarily correlated with enzymatic activity. This pattern reflects divergences in cell wall regulatory mechanisms among the varieties: in GUANAY-3, high transcriptional levels did not translate into increased enzymatic activity, reinforcing the hypothesis of post-transcriptional or post-translational regulation; in contrast, GUANAY-1 and GUANAY-2 exhibited a more direct correlation between gene expression and enzymatic activity, indicating predominantly transcriptional regulation [65].
The integration of molecular expression data with biochemical enzymatic activity indicates that differences among varieties are not solely attributable to transcriptional control, but also reflect downstream regulatory processes affecting enzyme functionality. Collectively, our findings suggest that RGL-mediated cell wall remodeling during soursop softening is not regulated through a single mechanism, but is instead modulated by varietal morphology and physiological context.
5. Conclusions
The RGL enzyme plays a key role in fruit softening and the onset of senescence in soursop. Differences in gene expression and enzymatic activity suggest that each variety (GUANAY-1, GUANAY-2, and GUANAY-3) possesses distinct strategies to regulate RGL enzyme functionality during ripening, which directly influences postharvest life. Overall, these results provide a molecular basis that helps explain the variability in softening dynamics among the evaluated varieties, demonstrating that RGL regulation is variety-specific. This knowledge represents an important advance for the development of strategies aimed at improving soursop postharvest life, as it provides key elements to optimize management practices, select materials with superior performance, and develop biotechnological approaches focused on delaying softening and preserving fruit quality.
Author Contributions
Conceptualization, formal analysis, writing—original draft, E.A.M.-O.; writing—review and editing, supervision, investigation, V.A.O.-J. and G.B.-V.; data curation, resources, supervision, G.G.L.-G. and G.R.P.-S.; investigation, supervision, methodology, A.K.H. and M.E.T.-H.; resources, project administration, funding acquisition, G.B.-V. All authors have read and agreed to the published version of the manuscript.
Funding
This research was funded by Secretaría de Ciencias, Humanidades, Tecnología e innovación (SECIHTI) for the financial support by the grant Ciencia Básica y/o Ciencia de Frontera en la modalidad Paradigmas y Controversias de la Ciencia, grant number 319996: “Análisis integral de datos transcriptómicos y metabolómicos asociados a la calidad del fruto de guanábana (Annona muricata L.) durante almacenamiento poscosecha”.
Data Availability Statement
The data presented in this study are available within the article.
Acknowledgments
The first author thanks the scholarship granted by SECIHTI for his master’s studies, grant number 1333781.
Conflicts of Interest
The authors declare no conflicts of interest.
References
- Moghadamtousi, S.; Fadaeinasab, M.; Nikzad, S.; Mohan, G.; Ali, H.; Kadir, H. Annona muricata (Annonaceae): A Review of Its Traditional Uses, Isolated Acetogenins and Biological Activities. Int. J. Mol. Sci. 2015, 16, 15625–15658. [Google Scholar] [CrossRef] [Scilit]
- Servicio de Información Agroalimentaria y Pesquera (SIAP). Producción Agrícola 2025. Available online: https://nube.agricultura.gob.mx/cierre_agricola/ (accessed on 20 December 2025).
- Jiménez-Zurita, J.O.; Balois-Morales, R.; López-Guzmán, G.G.; Palomino-Hermosillo, Y.A.; Bautista-Rosales, P.U. Guanay-1, Guanay-2 y Guanay-3: Nuevas Variedades de Guanábana Para Nayarit. Remexca 2023, 14, 633–638. [Google Scholar] [CrossRef] [Scilit]
- Díaz-Rincon, L.; Balois-Morales, R.; Bautista-Rosales, P.; Bello-Lara, J.; Ochoa-Jiménez, V.; Montalvo-González, E.; Berumen-Varela, G. Physicochemical and Physiological Changes of Three Soursop (Annona muricata L.) Varieties during Postharvest Storage. Plant Sci. Today 2025, 12, 1–10. [Google Scholar] [CrossRef] [Scilit]
- Berumen-Varela, G.; Hernández-Oñate, M.A.; Tiznado-Hernández, M.E. Utilization of Biotechnological Tools in Soursop (Annona muricata L.). Sci. Hort. 2019, 245, 269–273. [Google Scholar] [CrossRef] [Scilit]
- O’Neill, S.D. Pollination regulation of flower development. Annu. Rev. Plant Physiol. Plant Mol. Biol. 1997, 48, 547–574. [Google Scholar] [CrossRef] [Scilit]
- Iqbal, N.; Khan, N.A.; Ferrante, A.; Trivellini, A.; Francini, A.; Khan, M.I.R. Ethylene Role in Plant Growth, Development and Senescence: Interaction with Other Phytohormones. Front. Plant Sci. 2017, 8, 475. [Google Scholar] [CrossRef] [Scilit]
- dos Santos, R.S.; Arge, L.W.P.; Costa, S.I.; Machado, N.D.; de Mello-Farias, P.C.; Rombaldi, C.V.; de Oliveira, A.C. Genetic Regulation and the Impact of Omics in Fruit Ripening. Plant Omics 2015, 8, 78–88. [Google Scholar]
- Yun, Z.; Gao, H.; Jiang, Y. Insights into Metabolomics in Quality Attributes of Postharvest Fruit. Curr. Opin. Food Sci. 2022, 45, 100836. [Google Scholar] [CrossRef] [Scilit]
- Forlani, S.; Mizzotti, C.; Masiero, S. The NAC Side of the Fruit: Tuning of Fruit Development and Maturation. BMC Plant Biol. 2021, 21, 238. [Google Scholar] [CrossRef] [Scilit]
- Ventura, L.D.J.M.; Pereira, G.S.L.; Mazzottini-dos-Santos, H.C.; De Lima, J.P.; Mercadante-Simões, M.O.; Lopes, P.S.N.; Ribeiro, L.M. Cytological Aspects of Butia Capitata (Arecaceae) Fruit Maturation and Senescence. Sci. Hort. 2022, 297, 110938. [Google Scholar] [CrossRef] [Scilit]
- Giovannoni, J.J. Genetic Regulation of Fruit Development and Ripening. Plant Cell Online 2004, 16, S170–S180. [Google Scholar] [CrossRef] [Scilit]
- Seymour, G.B.; Østergaard, L.; Chapman, N.H.; Knapp, S.; Martin, C. Fruit Development and Ripening. Annu. Rev. Plant Biol. 2013, 64, 219–241. [Google Scholar] [CrossRef] [Scilit] [PubMed]
- Martínez-González, M.E.; Balois Morales, R.; Alia-Tejacal, I.; Cortes-Cruz, M.A.; Palomino-Hermosillo, Y.A.; López-Gúzman, G.G. Postcosecha de Frutos: Maduración, Ablandamiento y Control Transcripcional. Remexca 2017, 8, 4089–4101. [Google Scholar] [CrossRef] [Scilit]
- Palomino-Hermosillo, Y.A.; Berumen-Varela, G.; Ochoa-Jiménez, V.A.; Balois-Morales, R.; Jiménez-Zurita, J.O.; Bautista-Rosales, P.U.; Martínez-González, M.E.; López-Guzmán, G.G.; Cortés-Cruz, M.A.; Guzmán, L.F.; et al. Transcriptome Analysis of Soursop (Annona muricata L.) Fruit under Postharvest Storage Identifies Genes Families Involved in Ripening. Plants 2022, 11, 1798. [Google Scholar] [CrossRef] [Scilit] [PubMed]
- Ren, Y.; Sun, P.; Wang, X.; Zhu, Z. Degradation of Cell Wall Polysaccharides and Change of Related Enzyme Activities with Fruit Softening in Annona Squamosa during Storage. Postharvest Biol. Technol. 2020, 166, 111203. [Google Scholar] [CrossRef] [Scilit]
- Díaz-Rincón, L.A.; Balois-Morales, R.; Bautista-Rosales, P.U.; Ochoa-Jiménez, V.A.; Bello-Lara, J.E.; Berumen-Varela, G. Pectin-Degrading Enzymes during Soursop (Annona muricata L.) Fruit Ripening: A Bioinformatics Approach. Horticulturae 2023, 9, 1150. [Google Scholar] [CrossRef] [Scilit]
- Wei, J.; Ma, F.; Shi, S.; Qi, X.; Zhu, X.; Yuan, J. Changes and Postharvest Regulation of Activity and Gene Expression of Enzymes Related to Cell Wall Degradation in Ripening Apple Fruit. Postharvest Biol. Technol. 2010, 56, 147–154. [Google Scholar] [CrossRef] [Scilit]
- Gwanpua, S.G.; Van Buggenhout, S.; Verlinden, B.E.; Christiaens, S.; Shpigelman, A.; Vicent, V.; Kermani, Z.J.; Nicolai, B.M.; Hendrickx, M.; Geeraerd, A. Pectin Modifications and the Role of Pectin-Degrading Enzymes during Postharvest Softening of Jonagold Apples. Food Chem. 2014, 158, 283–291. [Google Scholar] [CrossRef] [Scilit]
- Gapper, N.E.; McQuinn, R.P.; Giovannoni, J.J. Molecular and Genetic Regulation of Fruit Ripening. Plant Mol. Biol. 2013, 82, 575–591. [Google Scholar] [CrossRef] [Scilit]
- Ratemo, B.; Wu, W.; Xie, X.; Mamadou, G. Ripening Genetics of the Tomato Fruit. Int. J. Agric. Crop Sci. 2015, 567, 572. [Google Scholar]
- Gigli-Bisceglia, N.; Engelsdorf, T.; Hamann, T. Plant Cell Wall Integrity Maintenance in Model Plants and Crop Species-Relevant Cell Wall Components and Underlying Guiding Principles. Cell. Mol. Life Sci. 2020, 77, 2049–2077. [Google Scholar] [CrossRef] [Scilit]
- Parra, R.; Paredes, M.A.; Labrador, J.; Nunes, C.; Coimbra, M.A.; Fernandez-Garcia, N.; Olmos, E.; Gallardo, M.; Gomez-Jimenez, M.C. Cell Wall Composition and Ultrastructural Immunolocalization of Pectin and Arabinogalactan Protein during Olea Europaea L. Fruit Abscission. Plant Cell Physiol. 2020, 61, 814–825. [Google Scholar] [CrossRef] [Scilit] [PubMed]
- Szymańska-Chargot, M.; Pękala, P.; Myśliwiec, D.; Cieśla, J.; Pieczywek, P.M.; Siemińska-Kuczer, A.; Zdunek, A. A Study of the Properties of Hemicelluloses Adsorbed onto Microfibrillar Cellulose Isolated from Apple Parenchyma. Food Chem. 2024, 430, 137116. [Google Scholar] [CrossRef] [Scilit] [PubMed]
- Mohnen, D. Pectin structure and biosynthesis. Curr. Opin. Plant Biol. 2008, 11, 266–277. [Google Scholar] [CrossRef] [Scilit] [PubMed]
- Zdunek, A.; Pieczywek, P.M.; Cybulska, J. The primary, secondary, and structures of higher levels of pectin polysaccharides. Compr. Rev. Food Sci. Food Saf. 2021, 20, 1101–1117. [Google Scholar] [CrossRef] [Scilit]
- Shin, Y.; Chane, A.; Jung, M.; Lee, Y. Recent Advances in Understanding the Roles of Pectin as an Active Participant in Plant Signaling Networks. Plants 2021, 10, 1712. [Google Scholar] [CrossRef] [Scilit]
- Ochoa-Jiménez, V.-A.; Berumen-Varela, G.; Martín-Ernesto Tiznado-Hernández, R.F.-V. Rhamnogalacturonan Lyase: A Pectin Modification Enzyme of Higher Plants. Emir. J. Food Agric. 2018, 30, 910–917. [Google Scholar] [CrossRef] [Scilit]
- Ridley, B.L.; O’Neill, M.A.; Mohnen, D. Pectins: Structure, Biosynthesis, and Oligogalacturonide-Related Signaling. Phytochemistry 2001, 57, 929–967. [Google Scholar] [CrossRef] [Scilit]
- McDonough, M.A.; Kadirvelraj, R.; Harris, P.; Poulsen, J.-C.N.; Larsen, S. Rhamnogalacturonan Lyase Reveals a Unique Three-domain Modular Structure for Polysaccharide Lyase Family 4. FEBS Lett. 2004, 565, 188–194. [Google Scholar] [CrossRef]
- Blum, M.; Chang, H.-Y.; Chuguransky, S.; Grego, T.; Kandasaamy, S.; Mitchell, A.; Nuka, G.; Paysan-Lafosse, T.; Qureshi, M.; Raj, S.; et al. The InterPro Protein Families and Domains Database: 20 Years on. Nucleic Acids Res. 2021, 49, D344–D354. [Google Scholar] [CrossRef] [Scilit]
- Oomen, R.J.F.J.; Doeswijk-Voragen, C.H.L.; Bush, M.S.; Vincken, J.; Borkhardt, B.; Van Den Broek, L.A.M.; Corsar, J.; Ulvskov, P.; Voragen, A.G.J.; McCann, M.C.; et al. In Muro Fragmentation of the Rhamnogalacturonan I Backbone in Potato (Solanum tuberosum L.) Results in a Reduction and Altered Location of the Galactan and Arabinan Side-chains and Abnormal Periderm Development. Plant J. 2002, 30, 403–413. [Google Scholar] [CrossRef] [Scilit] [PubMed]
- Dautt-Castro, M.; Ochoa-Leyva, A.; Contreras-Vergara, C.A.; Pacheco-Sanchez, M.A.; Casas-Flores, S.; Sanchez-Flores, A.; Kuhn, D.N.; Islas-Osuna, M.A. Mango (Mangifera indica L.) Cv. Kent Fruit Mesocarp de Novo Transcriptome Assembly Identifies Gene Families Important for Ripening. Front. Plant Sci. 2015, 6, 62. [Google Scholar] [CrossRef] [Scilit] [PubMed]
- Berumen-Varela, G.; Ochoa-Jiménez, V.-A.; Burgara-Estrella, A.; Trillo-Hernández, E.-A.; Ojeda-Contreras, Á.-J.; Orozco-Avitia, A.; Rivera-Domínguez, M.; Troncoso-Rojas, R.; Báez-Sañudo, R.; Datsenka, T.; et al. Functional Analysis of a Tomato (Solanum lycopersicum L.) Rhamnogalacturonan Lyase Promoter. J. Plant Physiol. 2018, 229, 175–184. [Google Scholar] [CrossRef] [Scilit] [PubMed]
- Molina-Hidalgo, F.J.; Franco, A.R.; Villatoro, C.; Medina-Puche, L.; Mercado, J.A.; Hidalgo, M.A.; Monfort, A.; Caballero, J.L.; Muñoz-Blanco, J.; Blanco-Portales, R. The Strawberry (Fragaria × ananassa) Fruit-Specific Rhamnogalacturonate Lyase 1 (FaRGLyase1) Gene Encodes an Enzyme Involved in the Degradation of Cell-Wall Middle Lamellae. J. Exp. Bot. 2013, 64, 1471–1483. [Google Scholar] [CrossRef] [Scilit]
- Trillo-Hernández, E.A.; Orozco-Avitia, J.A.; Ojeda-Contreras, Á.J.; Berumen-Varela, G.; Ochoa-Jiménez, V.A.; Troncoso-Rojas, R.; Rivera-Dominguez, M.; Baez-Flores, M.E.; Hernández-Oñate, M.Á.; Tiznado-Hernández, M.E. Expression analysis of genes encoding rhamnogalacturonan lyase isoenzymes during tomato fruit development and ripening. Rev. Fito Mex. 2021, 44, 529. [Google Scholar] [CrossRef] [Scilit]
- Hosmani, P.S.; Flores-Gonzalez, M.; Van De Geest, H.; Maumus, F.; Bakker, L.V.; Schijlen, E.; Van Haarst, J.; Cordewener, J.; Sanchez-Perez, G.; Peters, S.; et al. An Improved de Novo Assembly and Annotation of the Tomato Reference Genome Using Single-Molecule Sequencing, Hi-C Proximity Ligation and Optical Maps. bioRxiv 2019. [Google Scholar] [CrossRef] [Scilit]
- Cheng, C.; Krishnakumar, V.; Chan, A.P.; Thibaud-Nissen, F.; Schobel, S.; Town, C.D. Araport11: A Complete Reannotation of the Arabidopsis thaliana Reference Genome. Plant J. 2017, 89, 789–804. [Google Scholar] [CrossRef] [Scilit]
- Goodstein, D.M.; Shu, S.; Howson, R.; Neupane, R.; Hayes, R.D.; Fazo, J.; Mitros, T.; Dirks, W.; Hellsten, U.; Putnam, N.; et al. Phytozome: A Comparative Platform for Green Plant Genomics. Nucleic Acids Res. 2012, 40, D1178–D1186. [Google Scholar] [CrossRef] [Scilit]
- Saitou, N.; Nei, M. The Neighbor-Joining Method: A New Method for Reconstructing Phylogenetic Trees. Mol. Biol. Evol. 1987, 4, 406–425. [Google Scholar] [CrossRef] [Scilit]
- Love, M.I.; Huber, W.; Anders, S. Moderated estimation of fold change and dispersion for RNA-seq data with DESeq2. Genome Biol. 2014, 15, 550. [Google Scholar] [CrossRef] [Scilit]
- Kolde, R. Pheatmap: Pretty Heatmaps. R Package Version 1. 2019. Available online: https://rdrr.io/cran/pheatmap/ (accessed on 20 March 2025).
- Sherman, B.T.; Hao, M.; Qiu, J.; Jiao, X.; Baseler, M.W.; Lane, H.C.; Imamichi, T.; Chang, W. DAVID: A Web Server for Functional Enrichment Analysis and Functional Annotation of Gene Lists (2021 Update). Nucleic Acids Res. 2022, 50, W216–W221. [Google Scholar] [CrossRef] [Scilit]
- Thornton, B.; Basu, C. Real-time PCR (qPCR) Primer Design Using Free Online Software. Biochem. Mol. Biol. Educ. 2011, 39, 145–154. [Google Scholar] [CrossRef] [Scilit]
- Livak, K.J.; Schmittgen, T.D. Analysis of Relative Gene Expression Data Using Real-Time Quantitative PCR and the 2−ΔΔCT Method. Methods 2001, 25, 402–408. [Google Scholar] [CrossRef] [Scilit] [PubMed]
- Berumen-Varela, G.; Palomino-Hermosillo, Y.A.; Bautista-Rosales, P.U.; Peña-Sandoval, G.R.; López-Gúzman, G.G.; Balois-Morales, R. Identification of Reference Genes for Quantitative Real-Time PCR in Different Developmental Stages and under Refrigeration Conditions in Soursop Fruits (Annona muricata L.). Sci. Hort. 2020, 260, 108893. [Google Scholar] [CrossRef] [Scilit]
- Bradford, M.M. A Rapid and Sensitive Method for the Quantitation of Microgram Quantities of Protein Utilizing the Principle of Protein-Dye Binding. Anal. Biochem. 1976, 72, 248–254. [Google Scholar] [CrossRef] [PubMed]
- Moghe, G.; Last, R.L. Something Old, Something New: Conserved Enzymes and the Evolution of Novelty in Plant Specialized Metabolism. Plant Physiol. 2015, 169, 1512–1523. [Google Scholar] [CrossRef] [Scilit]
- Ric-Varas, P.; Paniagua, C.; López-Casado, G.; Molina-Hidalgo, F.J.; Schückel, J.; Knox, J.P.; Blanco-Portales, R.; Moyano, E.; Muñoz-Blanco, J.; Posé, S.; et al. Suppressing the Rhamnogalacturonan Lyase Gene FaRGLyase1 Preserves RGI Pectin Degradation and Enhances Strawberry Fruit Firmness. Plant Phys. Biochem. 2024, 206, 108294. [Google Scholar] [CrossRef] [Scilit]
- Al-Hinai, T.Z.S.; Mackay, C.L.; Fry, S.C. Fruit Softening: Evidence for Rhamnogalacturonan Lyase Action in Vivo in Ripe Fruit Cell Walls. Ann. Bot. 2024, 133, 547–558. [Google Scholar] [CrossRef] [Scilit]
- Kaczmarska, A.; Pieczywek, P.M.; Cybulska, J.; Zdunek, A. Structure and Functionality of Rhamnogalacturonan I in the Cell Wall and in Solution: A Review. Carb Polym. 2022, 278, 118909. [Google Scholar] [CrossRef] [Scilit]
- Liu, M.; Pirrello, J.; Chervin, C.; Roustan, J.-P.; Bouzayen, M. Ethylene Control of Fruit Ripening: Revisiting the Complex Network of Transcriptional Regulation. Plant Physiol. 2015, 169, 2380–2390. [Google Scholar] [CrossRef] [Scilit]
- Tipu, M.M.H.; Sherif, S.M. Ethylene and Its Crosstalk with Hormonal Pathways in Fruit Ripening: Mechanisms, Modulation, and Commercial Exploitation. Front. Plant Sci. 2024, 15, 1475496. [Google Scholar] [CrossRef] [Scilit]
- Wang, Q. Study on the Expression Regulation of the CTR1 Gene in the Ethylene Signaling Pathway. Biochem. Biophys. Res. Commun. 2024, 739, 150590. [Google Scholar] [CrossRef] [Scilit] [PubMed]
- Ochoa-Jiménez, V.A.; Balois-Morales, R.; López-Guzmán, G.G.; Jiménez-Zurita, J.O.; Guzmán, L.F.; Berumen-Varela, G. Changes in Quality and Gene Transcript Levels of Soursop (Annona muricata L.) Fruits during Ripening. Mex. J. Biotechnol. 2023, 8, 1–16. [Google Scholar] [CrossRef] [Scilit]
- Yang, H.; Benatti, M.R.; Karve, R.A.; Fox, A.; Meilan, R.; Carpita, N.C.; McCann, M.C. Rhamnogalacturonan-I Is a Determinant of Cell–Cell Adhesion in Poplar Wood. Plant Biotechnol. J. 2020, 18, 1027–1040. [Google Scholar] [CrossRef] [Scilit] [PubMed]
- Wang, S.; Liu, C.; Su, X.; Chen, L.; Zhu, Z. Transcriptome Analysis Reveals Key Metabolic Pathways and Gene Expression Involving in Cell Wall Polysaccharides-Disassembling and Postharvest Fruit Softening in Custard Apple (Annona squamosa L.). Int. J. Biol. Macrom 2023, 240, 124356. [Google Scholar] [CrossRef] [Scilit] [PubMed]
- Méndez-Yañez, A.; González, M.; Carrasco-Orellana, C.; Herrera, R.; Moya-León, M.A. Isolation of a Rhamnogalacturonan Lyase Expressed during Ripening of the Chilean Strawberry Fruit and Its Biochemical Characterization. Plant Physiol. Biochem. 2020, 146, 411–419. [Google Scholar] [CrossRef] [Scilit]
- Naran, R.; Pierce, M.L.; Mort, A.J. Detection and Identification of Rhamnogalacturonan Lyase Activity in Intercellular Spaces of Expanding Cotton Cotyledons. Plant J. 2007, 50, 95–107. [Google Scholar] [CrossRef] [Scilit]
- Bresson, S.; Shchepachev, V.; Tollervey, D. A Posttranscriptional Pathway Regulates Cell Wall mRNA Expression in Budding Yeast. Cell Rep. 2023, 42, 112184. [Google Scholar] [CrossRef] [Scilit]
- Li, Q.; Gao, Y.; Wang, K.; Sun, S.; Lu, X.; Liu, Z.; Wang, G.; Wang, L.; Li, Z.; Guo, H.; et al. Identification of microRNAs and Target Genes in Apple (Malus domestica) Scion and Rootstock with Grafted Interstock. Fruit Res. 2023, 3, 34. [Google Scholar] [CrossRef] [Scilit]
- Muñoz-Bertomeu, J.; Miedes, E.; Lorences, E.P. Expression of Xyloglucan Endotransglucosylase/Hydrolase (XTH) Genes and XET Activity in Ethylene Treated Apple and Tomato Fruits. J. Plant Physiol. 2013, 170, 1194–1201. [Google Scholar] [CrossRef] [Scilit]
- Sanz, A.B.; García, R.; Pavón-Vergés, M.; Rodríguez-Peña, J.M.; Arroyo, J. Control of Gene Expression via the Yeast CWI Pathway. Int. J. Mol. Sci. 2022, 23, 1791. [Google Scholar] [CrossRef] [Scilit]
- Xie, Q.; Tian, Y.; Hu, Z.; Zhang, L.; Tang, B.; Wang, Y.; Li, J.; Chen, G. Novel Translational and Phosphorylation Modification Regulation Mechanisms of Tomato (Solanum lycopersicum) Fruit Ripening Revealed by Integrative Proteomics and Phosphoproteomics. Int. J. Mol. Sci. 2021, 22, 11782. [Google Scholar] [CrossRef] [Scilit]
- Anwar, R.; Mattoo, A.K.; Handa, A.K. Ripening and Senescence of Fleshy Fruits. In Postharvest Biology and Nanotechnology; Paliyath, G., Subramanian, J., Lim, L., Subramanian, K.S., Handa, A.K., Mattoo, A.K., Eds.; Wiley: Hoboken, NJ, USA, 2018; pp. 15–51. [Google Scholar]

Disclaimer/Publisher’s Note: The statements, opinions and data contained in all publications are solely those of the individual author(s) and contributor(s) and not of MDPI and/or the editor(s). MDPI and/or the editor(s) disclaim responsibility for any injury to people or property resulting from any ideas, methods, instructions or products referred to in the content. |
© 2026 by the authors. Licensee MDPI, Basel, Switzerland. This article is an open access article distributed under the terms and conditions of the Creative Commons Attribution (CC BY) license.