


Abstract
Cotton is an important cash crop globally. Cotton fiber is the main economic product of cotton plants. Phosphorus, as one of the essential nutrients, plays an important role in plant growth and development. However, few studies focus on phosphorus regulating fiber elongation. In this study, we used the cotton ovule culture system in vitro to explore the effects of various phosphorus levels on fiber and ovule growth, and screened for phosphorus-responsive factor, as well as revealed its action mechanism. The results indicated that fiber elongation was more sensitive than ovule growth to phosphorus deficiency. GhPHR1, a homolog of phosphate starvation response 1 (PHR1) in upland cotton, was significantly upregulated in fibers and ovules under phosphorus-deficient conditions. GhPHR1 directly binds to the promoter of the glucosylceramide synthase gene in cotton (GhGCS1) and positively regulates its expression. Overexpressing GhGCS1 enhanced phosphorus uptake and transport in cotton, increased phosphorus content in fiber cells, and promoted fiber cell elongation. Conversely, downregulating GhGCS1 reduced phosphorus content in fiber cells and suppressed fiber elongation. These findings demonstrate the importance of the GhPHR1-GhGCS1 molecular module in regulating fiber cell elongation and elucidate the molecular mechanism by which phosphorus influences fiber elongation.
1. Introduction
Cotton is an important economic crop globally and cultivated in more than 100 countries, with China, India, and the USA leading in the global production ranking [1,2,3]. The global cotton market value is estimated at about USD 44 billion. The cotton industry employs about 7% of total labor in developing economies, and more than 350 million people are directly and indirectly employed globally [1,4]. This indicates that cotton is important to the global economy. Fiber is the main economic product of cotton plants and finds uses in a lot of textile products production, healthcare, and minting of diverse financial securities, etc. [2]. A fiber cell is one of the longest single cells in a plant and originates from the epidermal cells of the cotton ovule outer integument [5]. There are five stages in the growth and development of fiber cells: initiation, elongation (primary wall synthesis), transition, secondary cell wall synthesis, and dehydration maturation [5]. Among these, the elongation and secondary cell wall synthesis stages are two critical periods that determine fiber quality (length, strength, and fineness) and also influence fiber yield [6,7]. Therefore, studying the key genes and regulatory mechanisms governing fiber cell elongation and secondary cell wall formation is of great importance. On the other hand, as one of the longest plant cells, cotton fibers also serve as an ideal model for studying plant cell growth and development [8]. The development of new varieties is identified as one of the most significant advancements in cotton agronomy [1]. Hence, in recent years, with the publication of the cotton genome sequence, progress has been made in identifying key genes and regulatory mechanisms involved in fiber cell growth and development [9,10,11,12,13,14,15]. However, the regulatory mechanisms underlying fiber development are still not fully understood. Especially, the understanding of the function and action mechanism of plant nutrients such as phosphorus in fiber cell growth is very limited.
Phosphorus, as one of the vital macronutrients for plant growth, plays a crucial role in the process of plant development [16,17]. It not only promotes plant growth but is also involved in energy storage and supply, respiration, the biosynthesis of nucleic acids, membrane lipid metabolism, signal transduction, and photosynthesis [18,19,20]. Most plants grown in phosphorus-deficient environments exhibit stunted growth, reduced seed setting rates, decreased plant height, stem diameter, and leaf size [21,22,23,24,25]. As an indispensable nutrient, phosphorus participates in key biological processes and directly determines crop yield and quality [26,27,28,29]. Cotton is sensitive to phosphorus deficiency [30]. By supporting overall plant growth and development, phosphorus promotes root development, enhances nutrients and water absorption capacity of roots, encourages early budding and flowering, improves pollination quality, and increases the number of effective bolls, finally indirectly regulating fiber quality and yield, which in turn influences the efficiency of cotton industrial processing [31,32,33]. Studies have shown that as soil phosphorus content increased, the boll weight of cotton gradually rose, while phosphorus deficiency reduced the lint percentage of cotton. Appropriate phosphorus levels help to improve cotton fiber length and strength. Under phosphorus stress conditions, as phosphorus content increases, both fiber length and strength generally show an upward trend [30,32,34]. Recently, Sun et al. demonstrated that reducing soil available phosphorus (AP) content decreased the contents of osmotically active solutes, including potassium ions, malate, soluble sugars, and sucrose in cotton fibers, as well as reduced the activity of enzymes involved in fiber elongation, such as plasma membrane H+-ATPase, thereby inhibiting fiber elongation via osmotic regulation mediated by vacuoles [35]. Similarly, Li et al. found that phosphorus fertilization promoted fiber elongation by enhancing sucrose conversion, K+ accumulation, and malate synthesis in cotton fibers [33]. In another study, Sun et al. showed that low phosphorus stress reduced fiber strength by inhibiting carbohydrate metabolism. Specifically, soil AP deficiency declined the activity of enzymes required for fiber cell wall formation, such as soluble acid invertase, sucrose synthase, sucrose phosphate synthase, and β-1,3-glucanase, resulting in cellulose content and fiber strength decrease [36]. At the levels of crop cultivation and physiology, these studies provided evidence that phosphorus played a crucial role in fiber elongation and secondary cell wall development. However, the journey of phosphorus from soil to fiber cells involves complex processes, including uptake, transport, and utilization. Different organs, tissues, and cells exhibit significant variations in phosphorus transport and utilization efficiency. Therefore, the specific functions and regulatory mechanisms of phosphorus in governing fiber cell growth and development require further investigation.
Sphingolipids are composed of nonpolar ceramides and various glycosylated residues in plant cells [37], and are an important component of plant cell membranes [38]. They not only play a significant role in maintaining the integrity of cell membranes but also act as key signaling molecules to participate in various physiological processes within plants, including cell division and differentiation, information transmission, and plant morphogenesis [39]. In recent years, studies on Arabidopsis thaliana and other crops such as cotton and rice have gradually revealed the complex functions and regulatory networks of sphingolipid in plant growth and development [40,41,42,43,44]. For instance, overexpression of the ceramide synthase gene GhCS1 in cotton leads to the accumulation of ceramides containing long-chain fatty acids, inducing programmed cell death and inhibiting the elongation of fibers [44]. Regulating the levels and ratios of sphingosine (Sph) and sphingosine 1-phosphate (S1P) can affect the elongation of fiber cells [43]. Recently, a study has proved that phosphorus deficiency can cause changes in sphingolipid content in plants. For instance, under phosphorus-deficient conditions, Arabidopsis thaliana non-specific phospholipase C4 (NPC4) can degrade and reduce the content of glycosylinositolphosphoceramide (GIPC). Arabidopsis glucosylceramide synthase 1 (AtGCS1) responds to phosphorus-deficient conditions by remodeling the dynamic balance of sphingolipid to promote phosphorus utilization [19,45]. However, it is still unclear whether phosphorus affects sphingolipid changes during the growth and development of the cotton plant and the elongation of cotton fibers, as well as the molecular mechanism by which it regulates the elongation of cotton fibers by causing sphingolipid changes.
To explore the function and molecular mechanism of phosphorus regulating fiber cell growth and development, this study identified a phosphorus-responsive factor, GhPHR1, a homolog of phosphate starvation response 1 (PHR1) in upland cotton from fibers treated with various phosphorus concentrations. Furthermore, we clarified the regulatory relationship between this transcription factor and its target gene, Gossypium hirsutum GCS1 (GhGCS1), and demonstrated the role of GhGCS1 in fiber growth and phosphorus metabolism. These results elucidate a novel mechanism by which the GhPHR1-GhGCS1 molecular module regulates fiber cell elongation, providing new insight into the regulatory mechanism of phosphorus in cotton fiber development.
2. Materials and Methods
2.1. Plant Materials and Strains
This study used upland cotton (Gossypium hirsutum L.) cv. Jimian 14, supplied by the Cotton Research Institute of the Chinese Academy of Agricultural Sciences. Plants for phenotypic observation under phosphorus deficiency were grown in a growth chamber, whereas those used for harvesting were cultivated in the field at the Southwest University, Chongqing, China.
The strains used in this study included the following: Escherichia coli DH5α competent cells, Agrobacterium tumefaciens GV3101 competent cells, and Saccharomyces cerevisiae NMY51 competent cells.
2.2. Sample Collection and Processing
To obtain samples of ovules and fibers at corresponding developmental stages, all flowers were marked on the day of anthesis. 25 d after, leaves, roots, stems, flowers, and cotton bolls at different developmental stages were collected. The fibers were promptly separated from the ovules using autoclave-sterilized forceps and immediately frozen in liquid nitrogen. The same procedure was followed for samples obtained from in vitro ovule cultures, wherein fibers were similarly detached from the ovules with sterilized forceps and snap-frozen in liquid nitrogen. All samples were stored at −80 °C for subsequent analysis.
2.3. In Vitro Cotton Ovules Culture and Fiber Length Measurement
Cotton flowers at 2 days post-anthesis (DPA) were collected for ovule culture in vitro. After removing petals and sepals, ovaries containing ovules were retained. The ovaries were first surface-sterilized with 75% ethanol for 1 min, followed by sterilization with 0.3% hydrogen peroxide solution under continuous shaking for 10 min. Ovules were gently excised along their longitudinal axis by using a scalpel blade. Uniformly developed ovules were selected and transferred to Beasley and Ting’s (BT) medium for incubation in a 32 °C dark environment. Cultured ovules were divided into groups with incubation durations of 5, 10, or 15 d, respectively.
After 15 d of culture on BT medium, a subset of ovules was randomly selected, observed under a stereomicroscope, and photographed to document their growth status. To prepare the fiber characterization, the cultured ovules were first soaked in 30% glacial acetic acid and then heated in boiling water to disperse the individual fibers. Then we placed the ovules on a glass slide, rinsed with water 3–5 times, and finally straightened the fibers for morphological measurement.
2.4. Total RNA Extraction from Plants and qRT-PCR
Total RNA was extracted from tissues, organs, ovules, and fibers at different developmental stages using the Plant Polysaccharide and Polyphenol RNA Rapid Extraction Kit (DP441, TIANGEN, Beijing, China). The obtained RNA was either stored at −80 °C or immediately used for cDNA synthesis. cDNA was synthesized by using HiScriptⅢ RT SuperMix for qPCR (+gDNA wiper) cDNA synthesis Kit (R323-01, Vazyme, Nanjing, China). qRT-PCR analysis was performed using the SYBR Green Pro Taq HS premixed qPCR kit (AG11701, Accurate Biology, Changsha, China) with the following program: 40 cycles of 95 °C for 3 min, 95 °C for 15 s, 56 °C for 30 s, and 72 °C for 30 s. The programmed temperature of the melting curve is 65 to 95 °C. The cycle threshold (CT) of each sample was standardized using HISTONE3 (GenBank accession AF024716), and the relative folding change (FC) of gene expression was calculated based on the 2−ΔΔCT method [46]. Each sample was repeated in three groups. The specific primers of qRT-PCR are shown in Table S1.
2.5. Measurement of P Contents
When measuring phosphorus concentration, we first prepared the chromogenic solution by mixing the ammonium molybdate–sulfuric acid test solution with 10% (w/v) ascorbic acid solution at a ratio of 6:1 for later use. Subsequently, 0.5 g of fresh sample was weighed, thoroughly ground using a mortar and pestle, and diluted to 10 mL with extraction solution (0.3 M trichloroacetic acid). After thorough mixing, the mixture was incubated at 4 °C for 1 h. Following centrifugation, 0.5 mL of the supernatant was transferred into a 2 mL centrifuge tube, mixed with 1 mL of the chromogenic solution, and incubated at 40 °C for 20 min. The absorbance was then measured at 820 nm using a spectrophotometer.
The 60 mg/L standard phosphorus solution was diluted with the extractant to prepare 0.6, 1.2, 2.4, 3.6, 4.8, and 6 mg/L phosphorus standard series solutions, respectively. The reaction solutions of the extractant and the working solution were used as blanks to establish the phosphorus standard curve. Finally, the content of available phosphorus in plants (g Pi/kg FW) was obtained based on the OD conversion value Y × 0.02.
2.6. Subcellular Localization
The full-length ORF of GhPHR1 was cloned into pCAMBIA2300 of the CaMV 35S promoter to construct a plant expression vector containing the GmPHR1-eGFP fusion gene and obtain an over-expression vector of GmPHR1. The constructed 35S::GmPHR1-eGFP vector and nuclear marker NLS-mCherry were transformed into Agrobacterium tumefaciens strain GV3101 and injected into tobacco leaves for transient expression, respectively. The fluorescence signal was analyzed by confocal scanning microscopy (Leica TCS SP8; Leica Microsystems GmbH, Wetzlar, Germany) 2–3 d after injection. Three independent biological replicates were conducted on the experiment. The amplification primers are shown in Table S2.
2.7. Yeast One-Hybrid Assay
First, clone GhPHR1 into the pGADT7-AD vector to construct pGADT7-GhPHR1. The about 200 bp GhGCS1 promoter fragment containing the P1BS element sequence was cloned into the pAbAi vector to construct pAbAi-GhGCS1P as bait. The pAbAi-GhGCS1P vector was linearized by BstBI endonuclease and co-transformed with pGADT7-GhPHR1 and pGADT7-AD (negative control) to co-transform the yeast receptor NMY51, respectively. Carried DNA was placed in a PCR instrument at 95 °C for 5 min, pre-cooled on ice with PEG/LiAC conversion solution (PT1183-ZH, PYEAST, Wuhan, China). First, add 5 μL of the carried DNA to a 2 mL centrifuge tube, then add 1–3 μg of the corresponding plasmid, and finally add 100 μL NMY51. Add 500 μL of the pre-cooled conversion solution, gently flip, and incubate at 30 °C for 30 min. Add 20 μL filtered DMSO, and incubate at 42 °C for 15 min. Centrifuge at 4000 rpm for 5 min at the end and spread it onto SD/-Leu solid medium plates. Incubate in a 30 °C incubator for 2–3 d. The monoclonal clones were picked and activated and then cultured on SD-Leu selection medium containing the antibiotic basidiocin (ABA) (250 µg/mL) at 30 °C for 4 d.
2.8. LUC Activity Analysis
The GhGCS1 promoter fragment (2500 bp) was ligated onto the pGreen0800 II-LUC vector to obtain the pGreen0800II-GhGCS1-LUC vector. It was transformed into Agrobacterium tumefaciens strain GV3101 (PSoupP19) along with the aforementioned 35S::GhPHR1-GFP vector and 35S::GFP vector (negative control), and then instantaneously transformed into tobacco leaves for co-expression. Two days after inoculation, the leaves and their surfaces were treated with D-luciferin. The LUC signal was detected using a plant imaging system in 10 min. In addition, referring to the method of Yan et al. [47], the total protein in the leaves was extracted using a plant total protein extraction kit, and the luciferase activity of the total protein solution was detected by an automatic microplate reader. The activity of the promoter was calculated using the value of firefly luciferase/renilla luciferase.
2.9. Hairy Root Transformation Experiment
Construct the overexpression vectors of GhPHR1 according to the above method. We cloned the CDS reverse complementary sequence of GhPHR1 and obtained the RNA-interference (RNAi) vector. Then, cotton hypocotyls were infected with Agrobacterium rhizogenes strain K599 containing the above vectors. About two weeks later, roots grew from the incision. Gene-specific primers were used to perform PCR experiments on the transgenic hairy roots (Table S2) to confirm the overexpression of functional gene hairy roots, and GUS staining was used to prove the acquisition of antisense-inhibited functional gene hairy roots. It was proved by qRT-PCR that the expression of functional genes in hairy roots was increased or decreased. Prove that transgenic hairy roots were obtained.
2.10. Plasmid/Vector Construction and Plant Transformation
To construct plant expression vectors, the pBI121 vector was modified. The recombinant vector pBI121-GN contained the fusion genes CaMV 35S promoter::GUS::nos terminator and nos promoter::NPTII::nos terminator. The cloned GhGCS1 gene fragment was inserted into the pBI121-GN vector under the control of the CaMV 35S promoter, successfully generating the GhGCS1 overexpression vector, designated as pBI121-GN-OGCS1. Additionally, a reverse complementary fragment of a partial GhGCS1 sequence was inserted into the pBI121-GN vector to create an antisense GhGCS1 fragment, yielding the antisense suppression vector named pBI121-GN-AGCS1. Both successfully constructed plasmids were introduced into the Agrobacterium tumefaciens strain LBA4404 [41].
Cotton plant transformation was subsequently performed following a previously described method. Cotton seeds were sterilized and germinated on MS (Murashige and Skoog) medium in the dark at 28 °C for 4–5 days. The LBA4404 strain harboring the respective plasmid was cultured in YEB medium (containing 100 mg/L kanamycin and 125 mg/L streptomycin) at 28 °C for 20 h. Bacterial cells were collected by centrifugation and resuspended in MS medium supplemented with 30 g/L glucose and 100 μM acetosyringone to an OD600 of 0.8–1.0 for subsequent use. The germinated cotton hypocotyls were cut into 1 cm segments, infected with the Agrobacterium suspension for 20–30 min, placed on sterile filter paper, and transferred to co-cultivation medium. After growth in the dark at 25 °C for 2 days, the explants were transferred to selection medium for further growth. Approximately four months later, kanamycin-resistant calli formed embryogenic calli on the selection medium. Following histochemical GUS staining, embryogenic calli that were both kanamycin-resistant and GUS-positive were cultured in MSB liquid medium. These cultures were then inoculated onto elongation medium. The elongated somatic embryos were transferred to Schenk and Hildebrandt medium containing 0.5% (w/v) activated charcoal. The transgenic plants obtained were identified by histochemical GUS staining of leaf tissues. Subsequently, GUS-positive plants were transplanted into the greenhouse for cultivation [48].
2.11. Statistical Analyses
We used MEGA11 (version 11.0.13 [49]) for phylogenetic tree construction, DNAMAN (Informer Technologies Inc., Los Angeles, CA, USA) for multiple sequence alignment, and TBtools (version TBtools-I [50]) for visualization analysis. The software used for statistical data analysis is GraphPad Prism (version 9.5.0; Boston, MA, USA). Values are means ± SD. Statistical data analysis was performed by the one-tailed Student’s t-test. *, p < 0.05; **, p < 0.01; ***, p < 0.001; ****, p < 0.0001; ns, no significant.
3. Results
3.1. Phosphorus Deficiency and Excess Inhibited Fiber and Ovule Growth
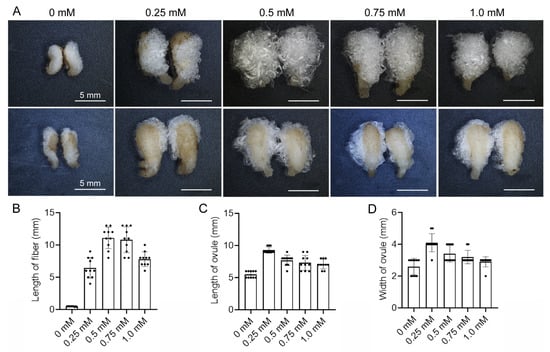
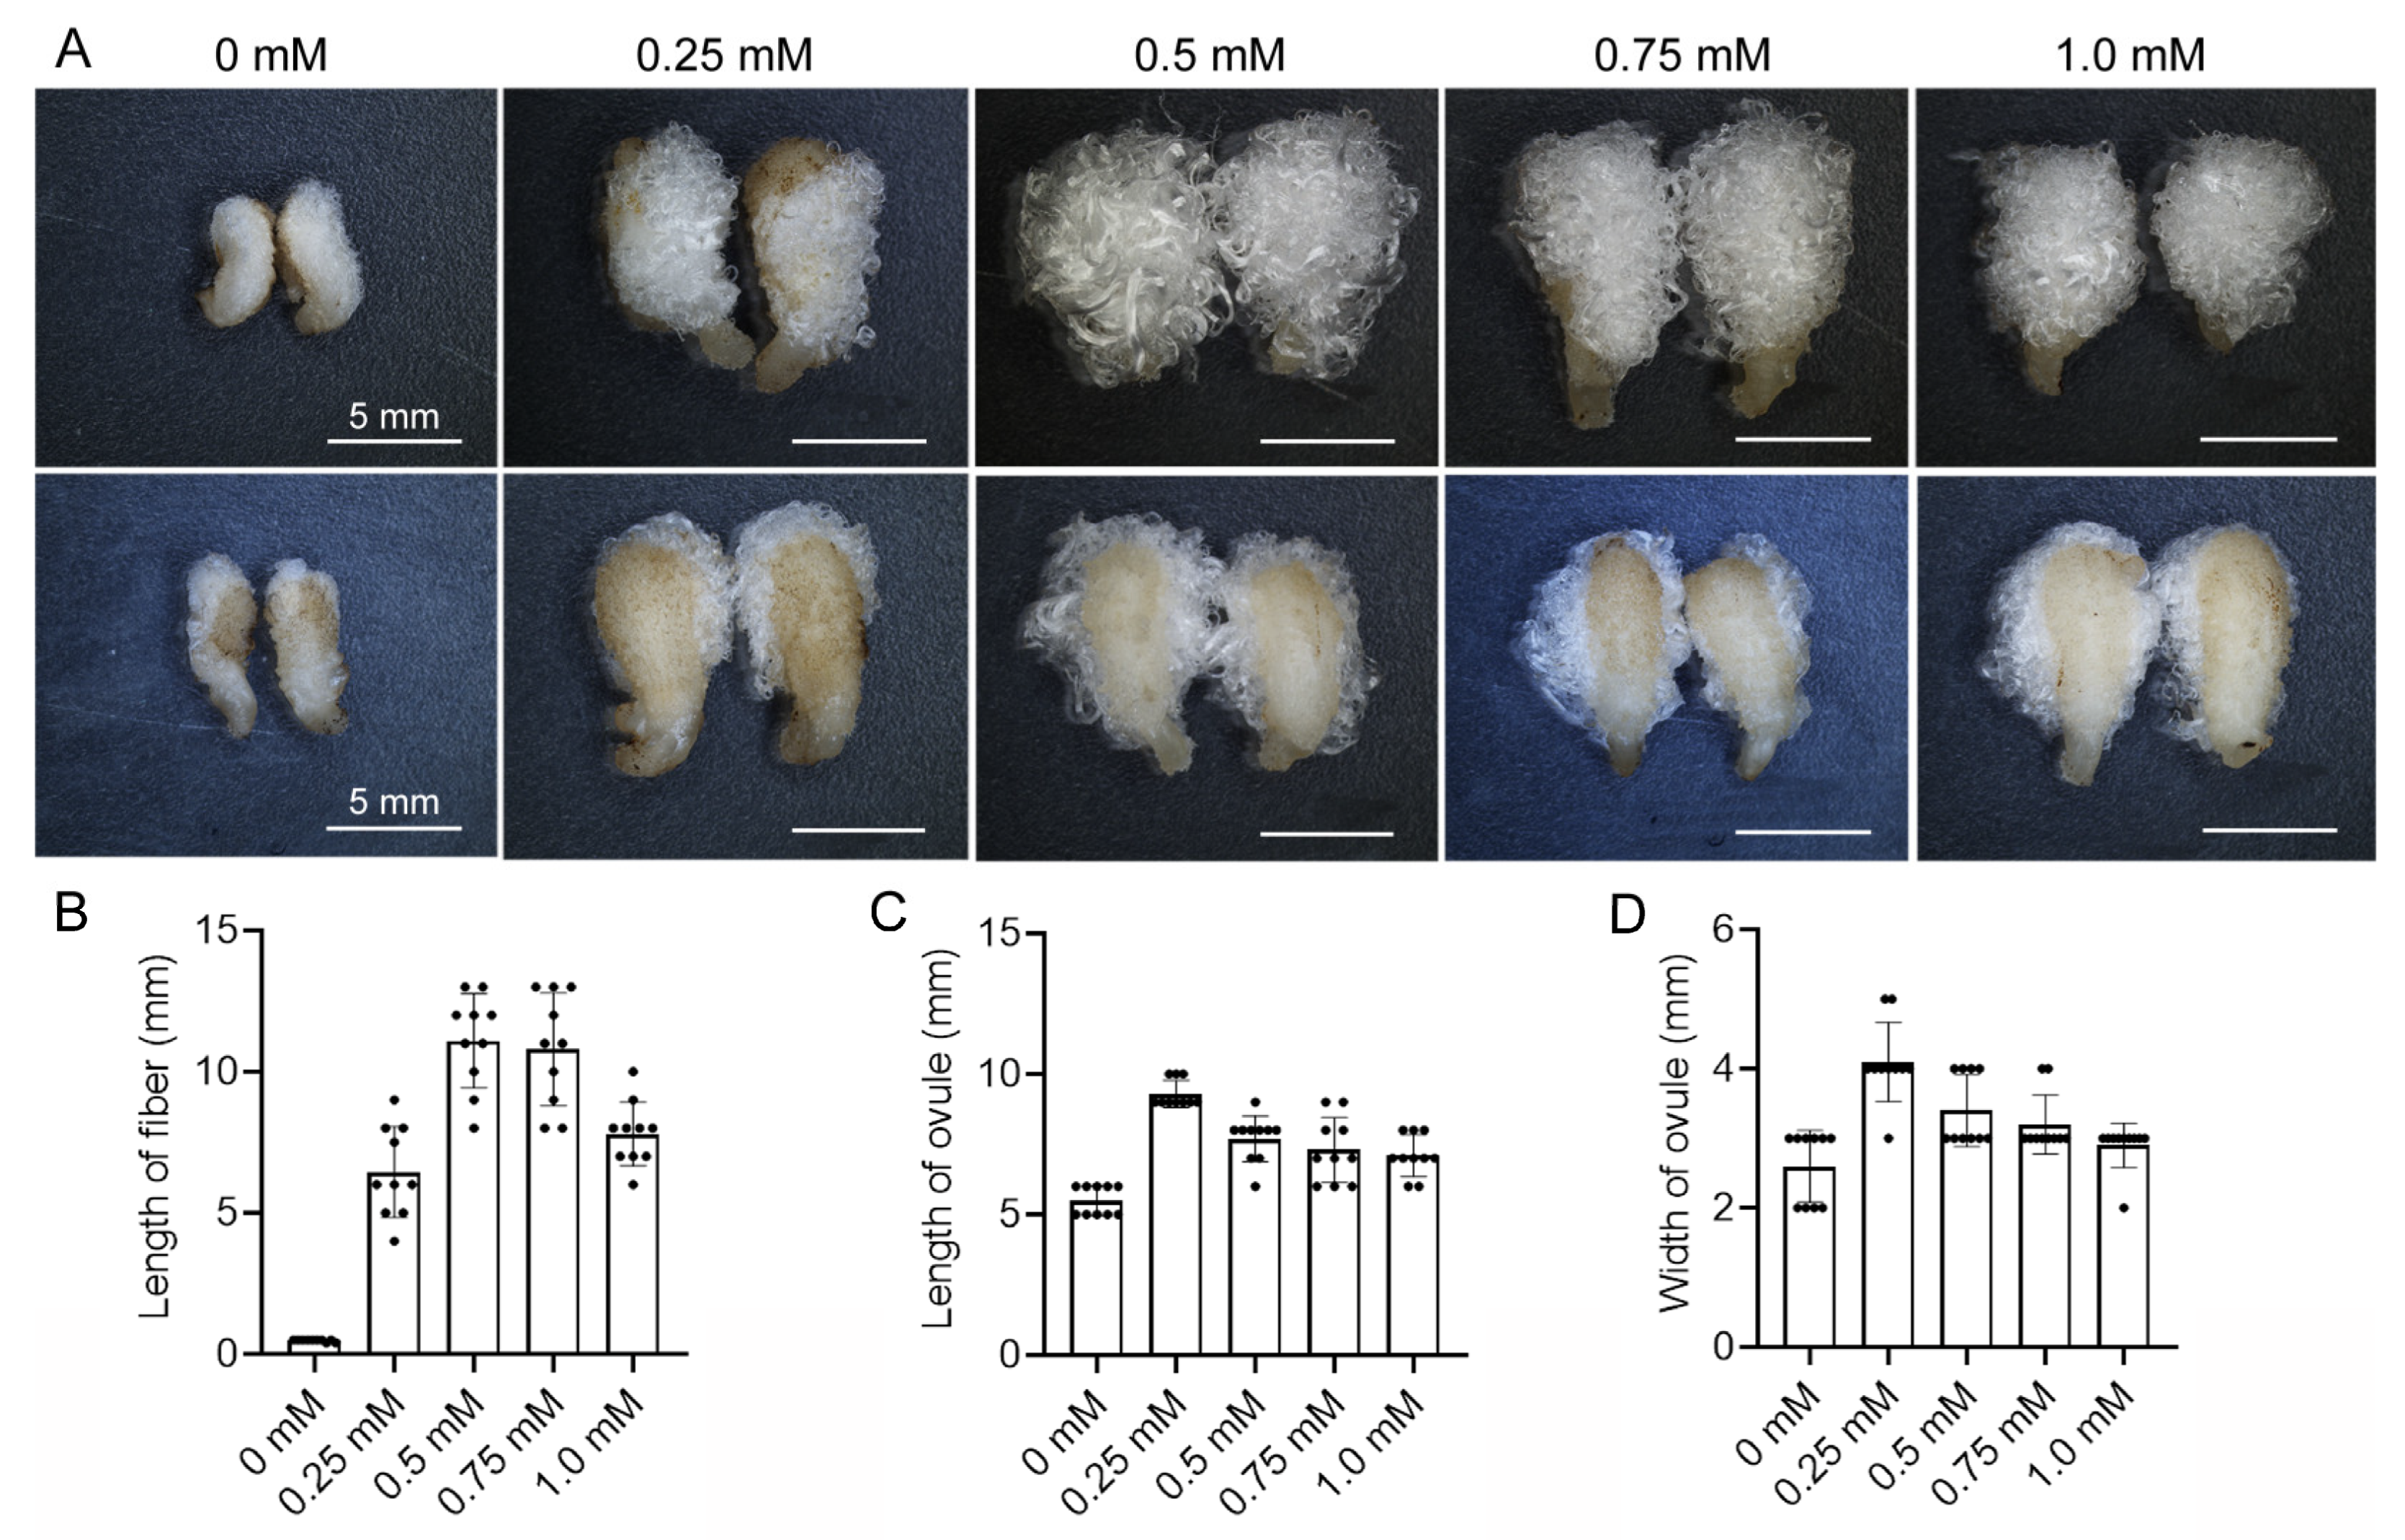
To investigate the effects of phosphorus on the growth and development of cotton fibers and ovules, we cultured cotton ovules (with attached fibers) in the medium with various phosphorus concentrations in the ovule culture system in vitro. After growing for 10 d, growth was observed and statistically analyzed. The results showed that the growth of both ovules and fibers was severely inhibited in the medium without phosphorus and was suppressed both in the medium with a low concentration of phosphorus (0.25 mmol L−1) and in the medium with a high concentration of phosphorus (1.0 mmol L−1) (Figure 1A). Based on the fiber length, phosphorus concentrations of 0.5 mmol L−1 and 0.75 mmol L−1 were the optimal concentrations for fiber growth (Figure 1A,B). In contrast, based on the ovule size, 0.25 mmol L−1 was the optimal phosphorus concentration for ovule growth, while concentrations of 0.5 mmol L−1 and 0.75 mmol L−1 exhibited inhibitory effects on ovule growth (Figure 1A,C,D). These results indicated that phosphorus concentration influenced the growth of fibers and ovules. Furthermore, the optimal phosphorus concentration for ovule growth differed from that for fiber growth. Compared to ovule growth, fiber cell growth has a higher demand for phosphorus. Under phosphorus deficiency, the ovules utilize their own phosphorus to complete ovule development as much as possible, while fiber growth is halted. These findings also suggest that phosphorus is precisely regulated in the development of ovules and fiber cells.
Figure 1.
The effects of various concentrations of phosphorus on the growth of fibers and ovules. (A) The fibers (upper panel) and ovules (lower panel) after 10 d cultured in vitro. (B) The length of fiber cells from various phosphorus concentrations. (C) The length of ovules from various phosphorus concentrations. (D) The width of ovules from various phosphorus concentrations. SD represents the standard deviation from 10 cultured ovules.
3.2. Identification of GhPHR1
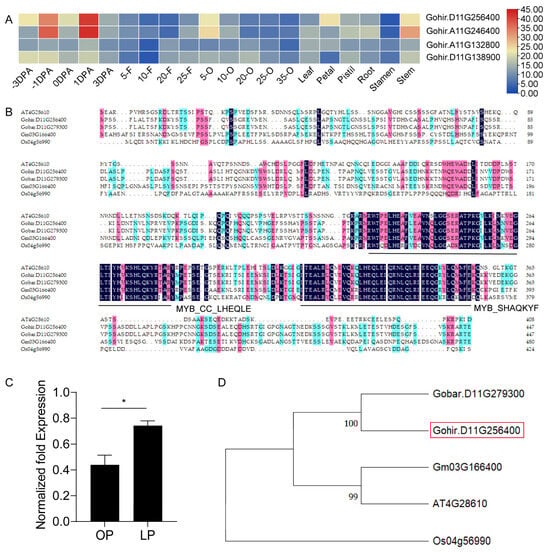
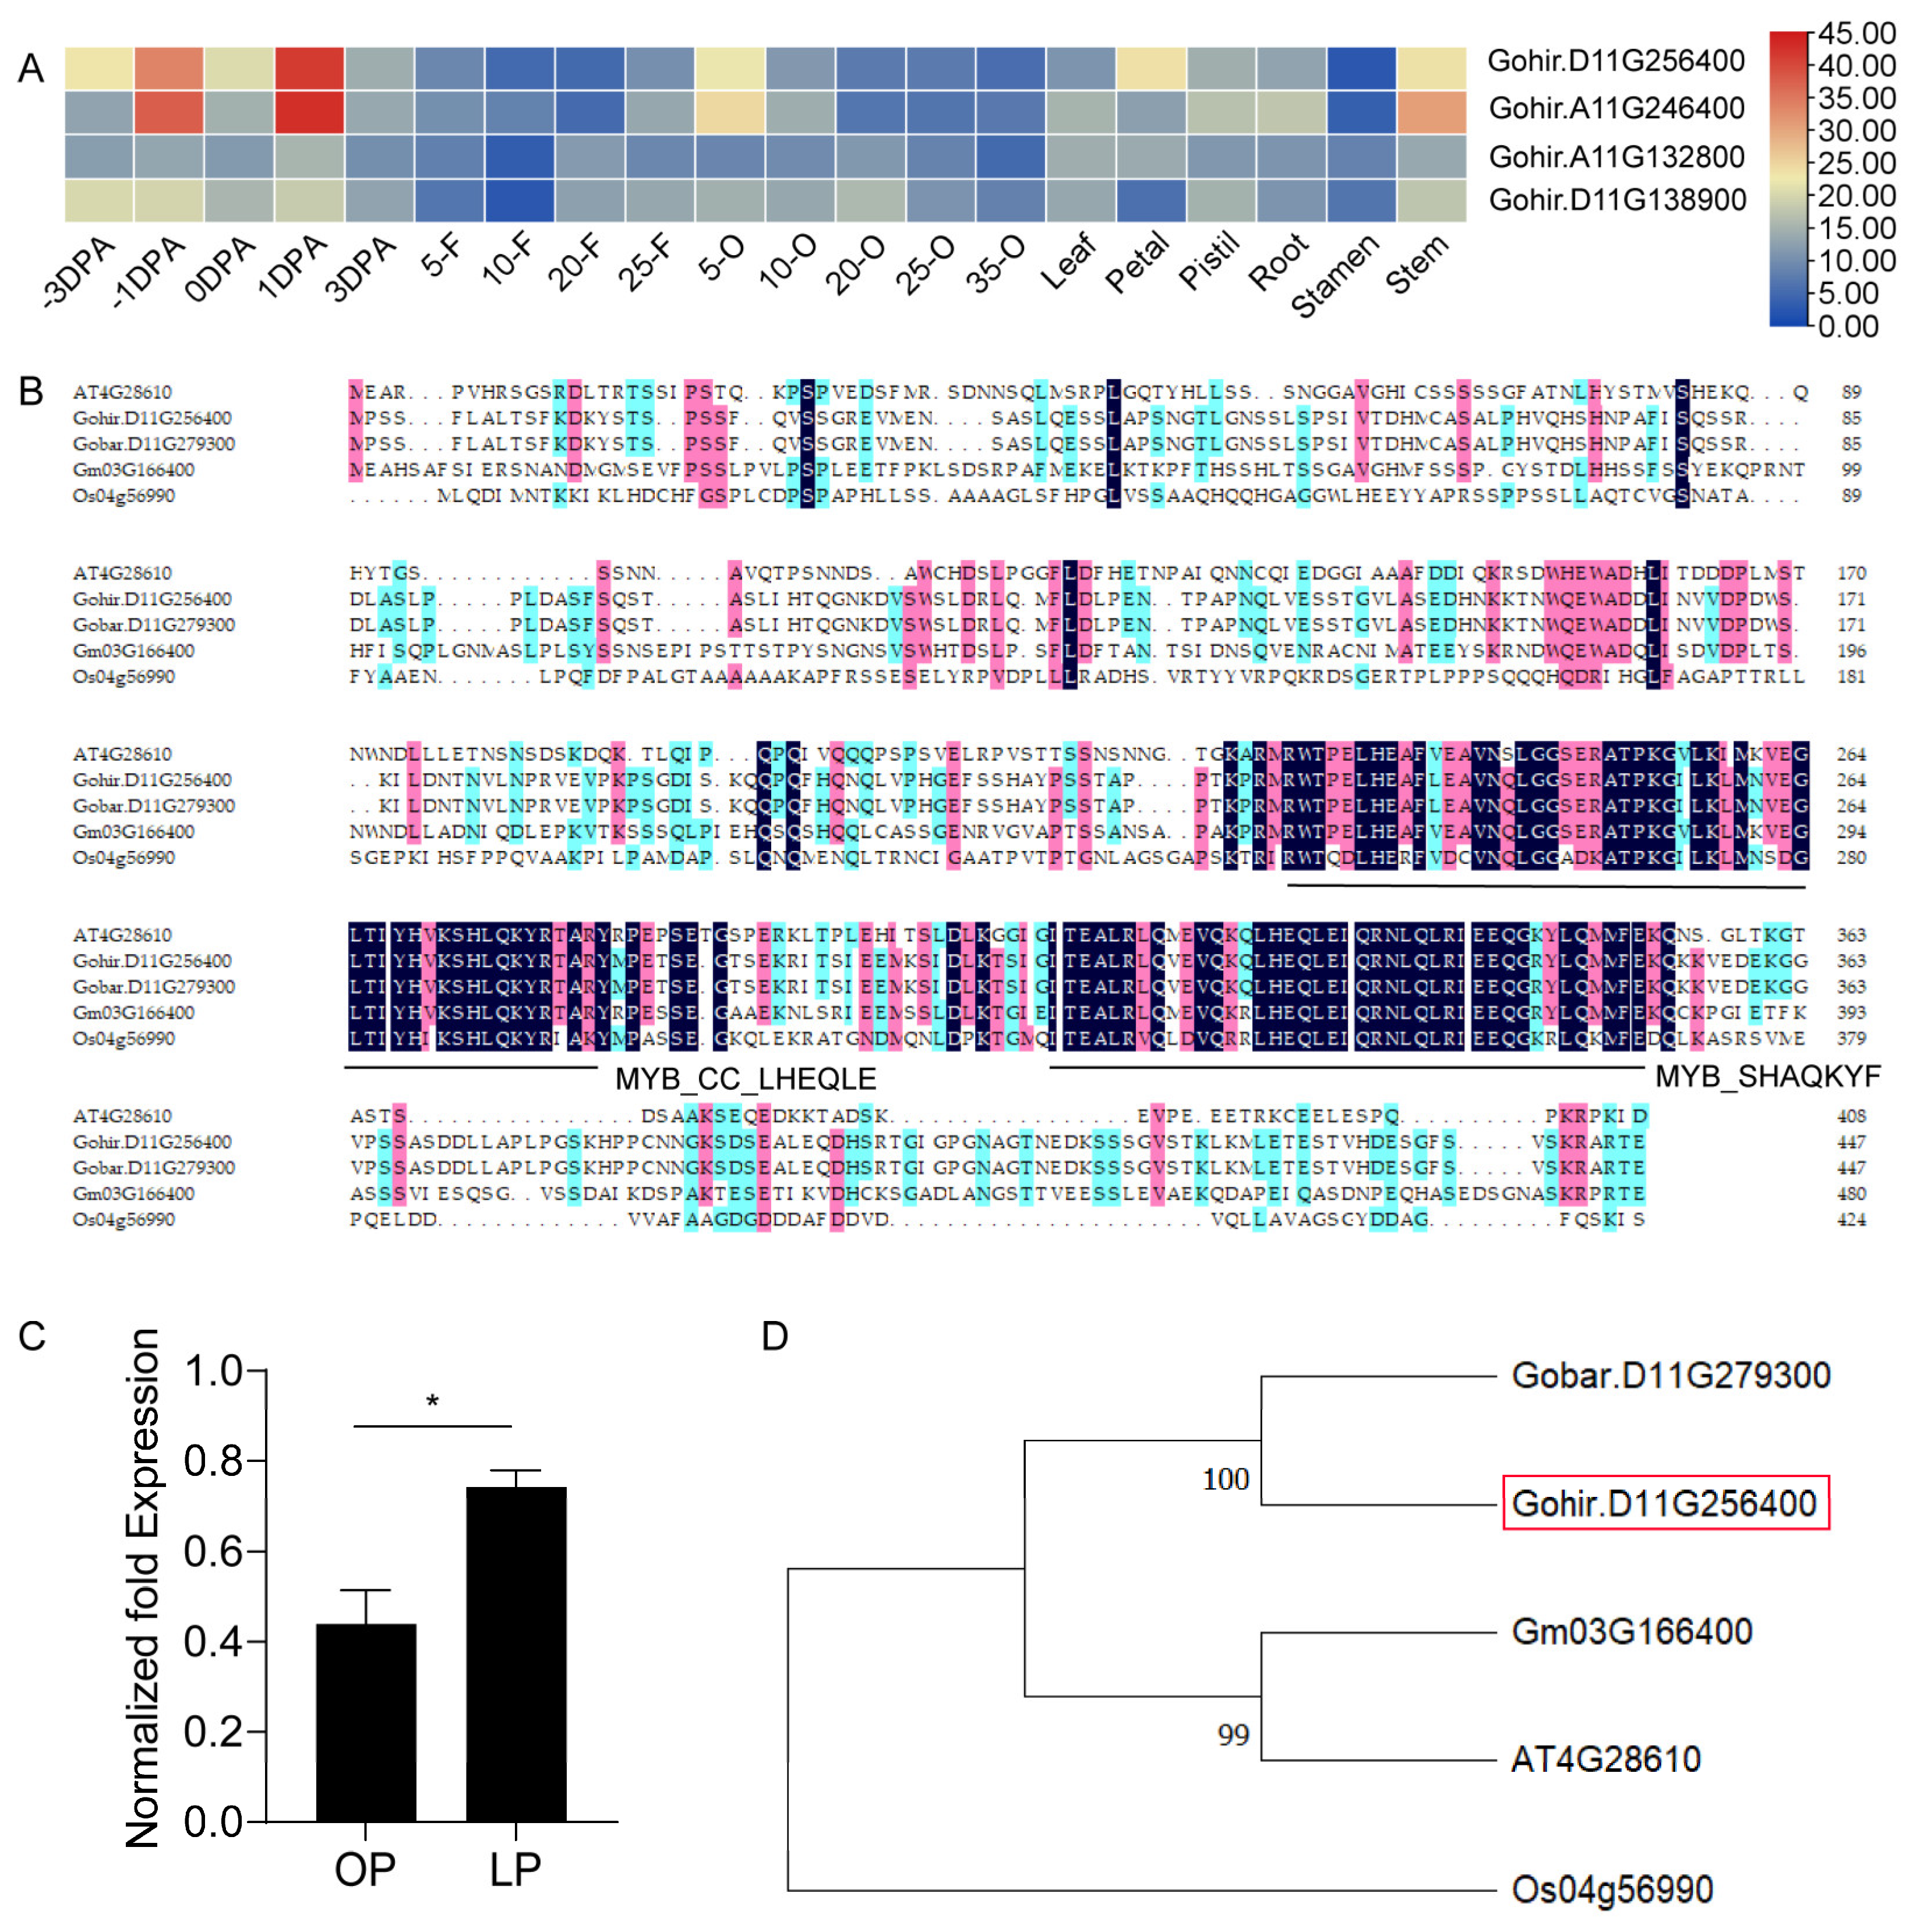
To explore the regulatory mechanism of phosphorus homeostasis in fibers and ovules, and given that phosphate starvation response 1 (PHR1) plays a key role in containing phosphorus homeostasis, we screened for PHR1 homologs in upland cotton (Gossypium hirsutum L.). There are four annotated GhPHRs in the upland cotton genome (Figure 2A). All four genes are highly expressed in the stage of fiber cell differentiation and initiation, especially the expression levels of Gohir.D11G256400 and Gohir.A11G246400 are far higher in −1 DPA and 1 DPA ovule than in the other samples (Figure 2A). Under different phosphorus treatments, the expression of GhPHR1 (Gohir.D11G256400) was significantly upregulated in fibers and ovules under phosphorus-deficient conditions (Figure 2C), suggesting GhPHR1 might play a role in phosphorus homeostasis of ovules and fiber cells. We further cloned the GhPHR1 gene from cotton fiber cells. The resulting fragment is 1347 bp in length, containing an open reading frame (ORF) encoding 448 amino acid residues. The predicted molecular weight is 49.4 kDa, and the isoelectric point is 5.76. Multiple sequence alignment using GhPHR1 and PHR1 proteins from other species showed that GhPHR1 possesses characteristic conserved domains of MYB family members, the MYB_SHAQKYF domain (225–279 AA) and the MYB_CC_LHEQLE domain (312–356 AA) (Figure 2B), indicating GhPHR1 is a MYB family member and a homolog of PHR1 in upland cotton.
Figure 2.
Sequence analysis of GhPHR1. (A) The expression profiles of four annotated GhPHRs in the upland cotton genome. (B) Multiple sequence alignment of GhPHR1 with PHR1 from other species. (C) Expression of GhPHR1 in ovules and fibers under phosphorus deficiency conditions. (D) Phylogenetic tree of GhPHR1 and PHR1 from other species. Color coding is as follows: a dark background indicates residues identical in all five sequences; pink indicates identity in four sequences; blue indicates identity in three sequences. −3 DPA and −1 DPA: the ovules at 3 days and 1 day before anthesis; 5-F~25-F: fiber cells at 5 DPA~25 DPA; 5-O~35-O: ovules at 5 DPA~35 DPA. MYB_CC_LHEQLE and MYB_SHAQKYF are characteristic conserved domains of members of the MYB family. OP: P-sufficient condition (0.5 mM KH2PO4). LP: P-deficient condition (0 mM KH2PO4). Gobar.D11G279300: Gossypium barbadense PHR1. Gohir.D11G256400: Gossypium hirsutum PHR1. Gm03G166400: Glycine max PHR1. At4G28610: Arabidopsis thaliana PHR1. Os04G56990: Oryza sativa PHR1. The red box indicates the location of the target protein, GhPHR1. Data analysis was performed using a t-test. *, p < 0.05.
Phylogenetic analysis indicated that GhPHR1 is closely related to PHR1 from Gossypium barbadense and Glycine max, but more distantly related to PHR1 from Oryza sativa (Figure 2D). These results confirm that the cloned sequence is the GhPHR1 gene, laying a foundation for further research.
3.3. Subcellular Localization and Expression Analysis of GhPHR1
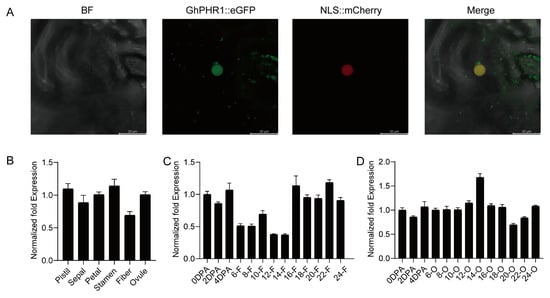
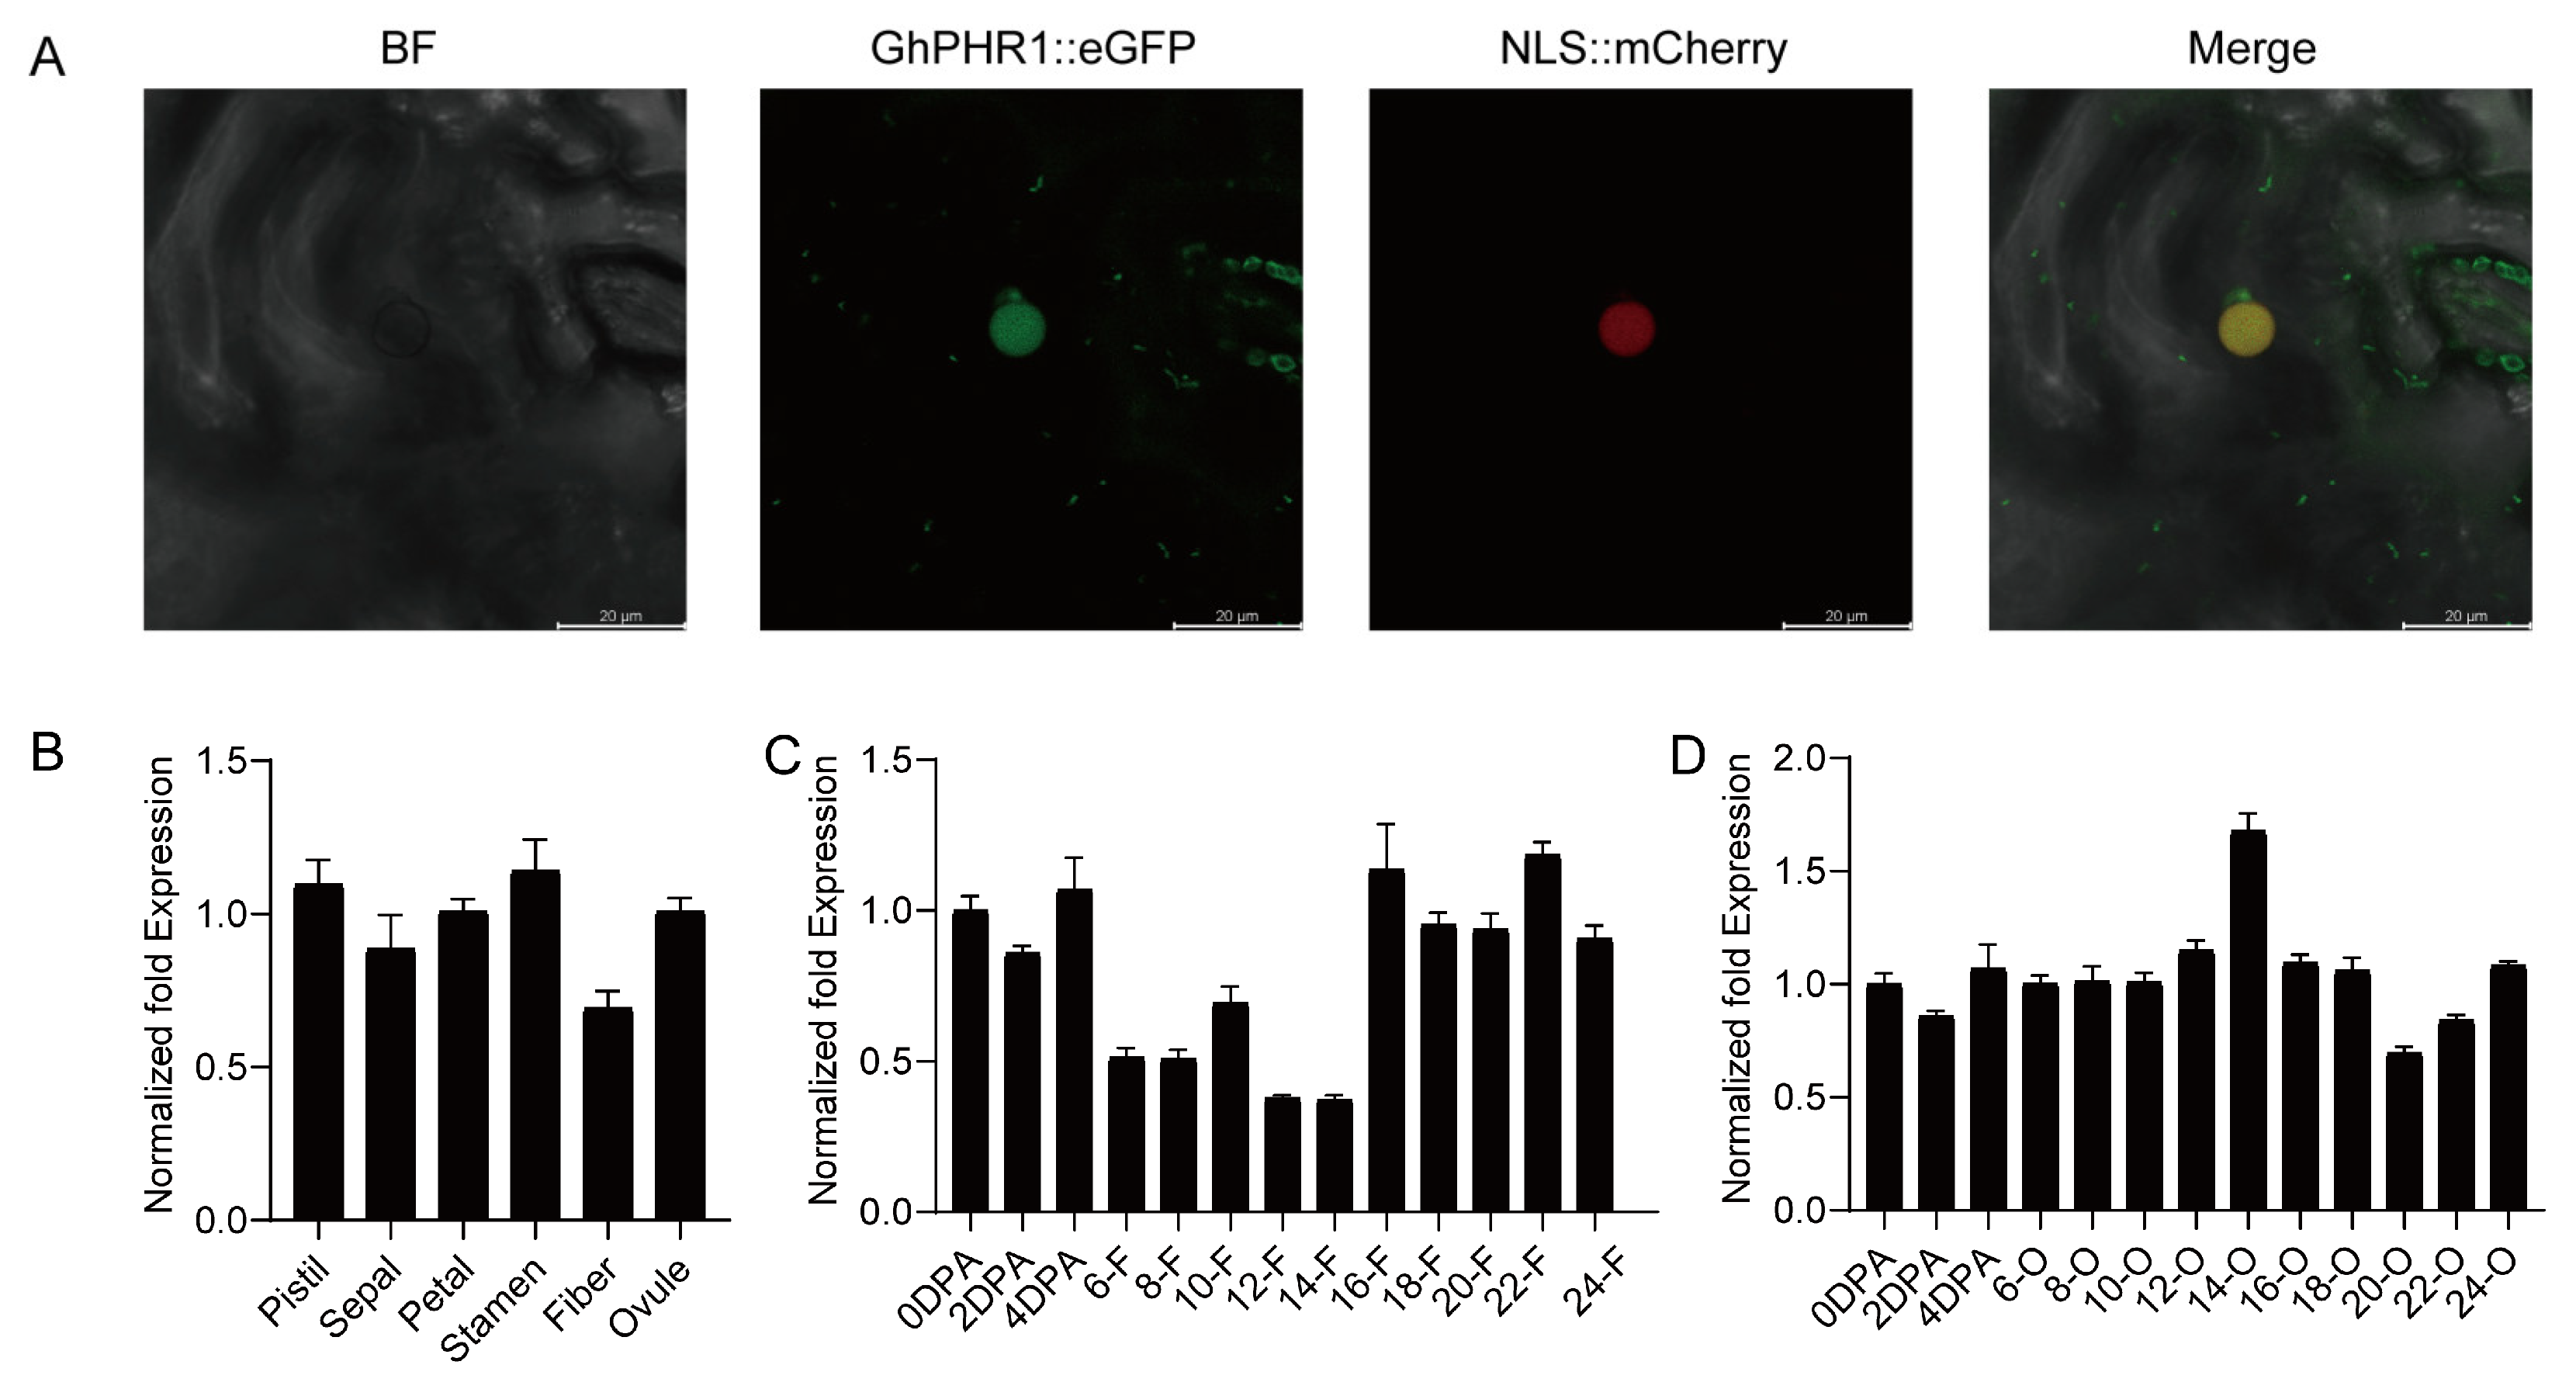
To investigate the subcellular localization of GhPHR1, we constructed a plant expression vector of GhPHR1::eGFP driven by the CaMV 35S promoter. We performed transient expression in tobacco leaf cells and observed the eGFP fluorescence signals using a confocal laser scanning microscope. The result revealed that the GhPHR1-eGFP fluorescence signal overlapped with the signal of the nuclear marker protein(NLS::mCherry) (Figure 3A), indicating that GhPHR1 localized in nuclear. Gene expression patterns can provide important clues to elucidating gene function. To clarify the expression characteristics of the GhPHR1 gene, we investigated the expression pattern of GhPHR1 in various organs and tissues, as well as in fibers and ovules at various developmental stages. The results showed that the expression level of GhPHR1 was lower at 6–14 DPA than at 16–24 DPA (Figure 3C) during fiber development, while its expression remained relatively stable in the ovules at different stages (Figure 3D). GhPHR1 was expressed in various floral tissues (Figure 3B). Given that PHR1 is a phosphorus starvation-responsive transcription factor, its lower expression during the rapid elongation stage of fiber cells (6–14 DPA) suggested that this stage might be associated with relatively high phosphorus content.
Figure 3.
Subcellular localization and expression pattern of GhPHR1. (A) Subcellular localization of GhPHR1. (B) The expression of GhPHR1 in different tissues of the floral organ. (C) The expression of GhPHR1 at different developmental stages of the fiber cell. (D) The expression of GhPHR1 at different developmental stages of the ovules. BF: bright field. 0 DPA~4 DPA: the fibers and ovules at 0 DPA~4 DPA; 6-F~24-F: fiber cells at 6 DPA~24 DPA; 6-O~24-O: ovules at 6 DPA~24 DPA.
3.4. GhGCS1 Is a Target Gene of GhPHR1
PHR1 is a central transcription factor responding to phosphorus stress in plants. It binds to the PIBS (GNATATNC) cis-regulatory element and regulates target gene expression. To elucidate the relationship between GhPHR1 and sphingolipid synthase genes in cotton, we analyzed the promoter sequences of several sphingolipid synthase genes in upland cotton. The results revealed that the promoter of the glucosylceramide synthase (GhGCS1) gene contains the PIBS element (GAATATGC), while other sphingolipid synthase genes, such as GhKDSR1 (3-Ketosphinga nine reductase 1), GhSBH1 (Sphingoid base hydroxylase 1), GhSLD1 (Sphingoid LCB desaturase 1), and GhORM1 (Orosomucoid protein 1), lack the PIBS element in their promoter sequences (Figure S1). GhGCS1 is a key rate-limiting enzyme in sphingolipid synthesis, catalyzing the combination of glucose and ceramide to produce glucosylceramide. The result suggested that GhGCS1 might be a target gene of GhPHR1.
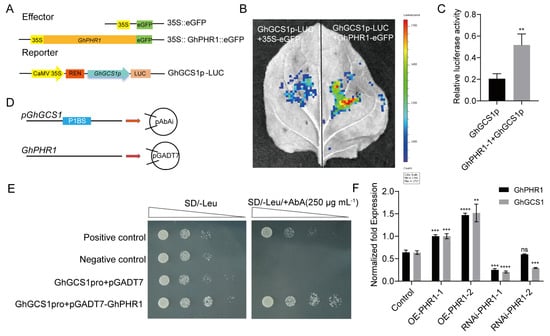
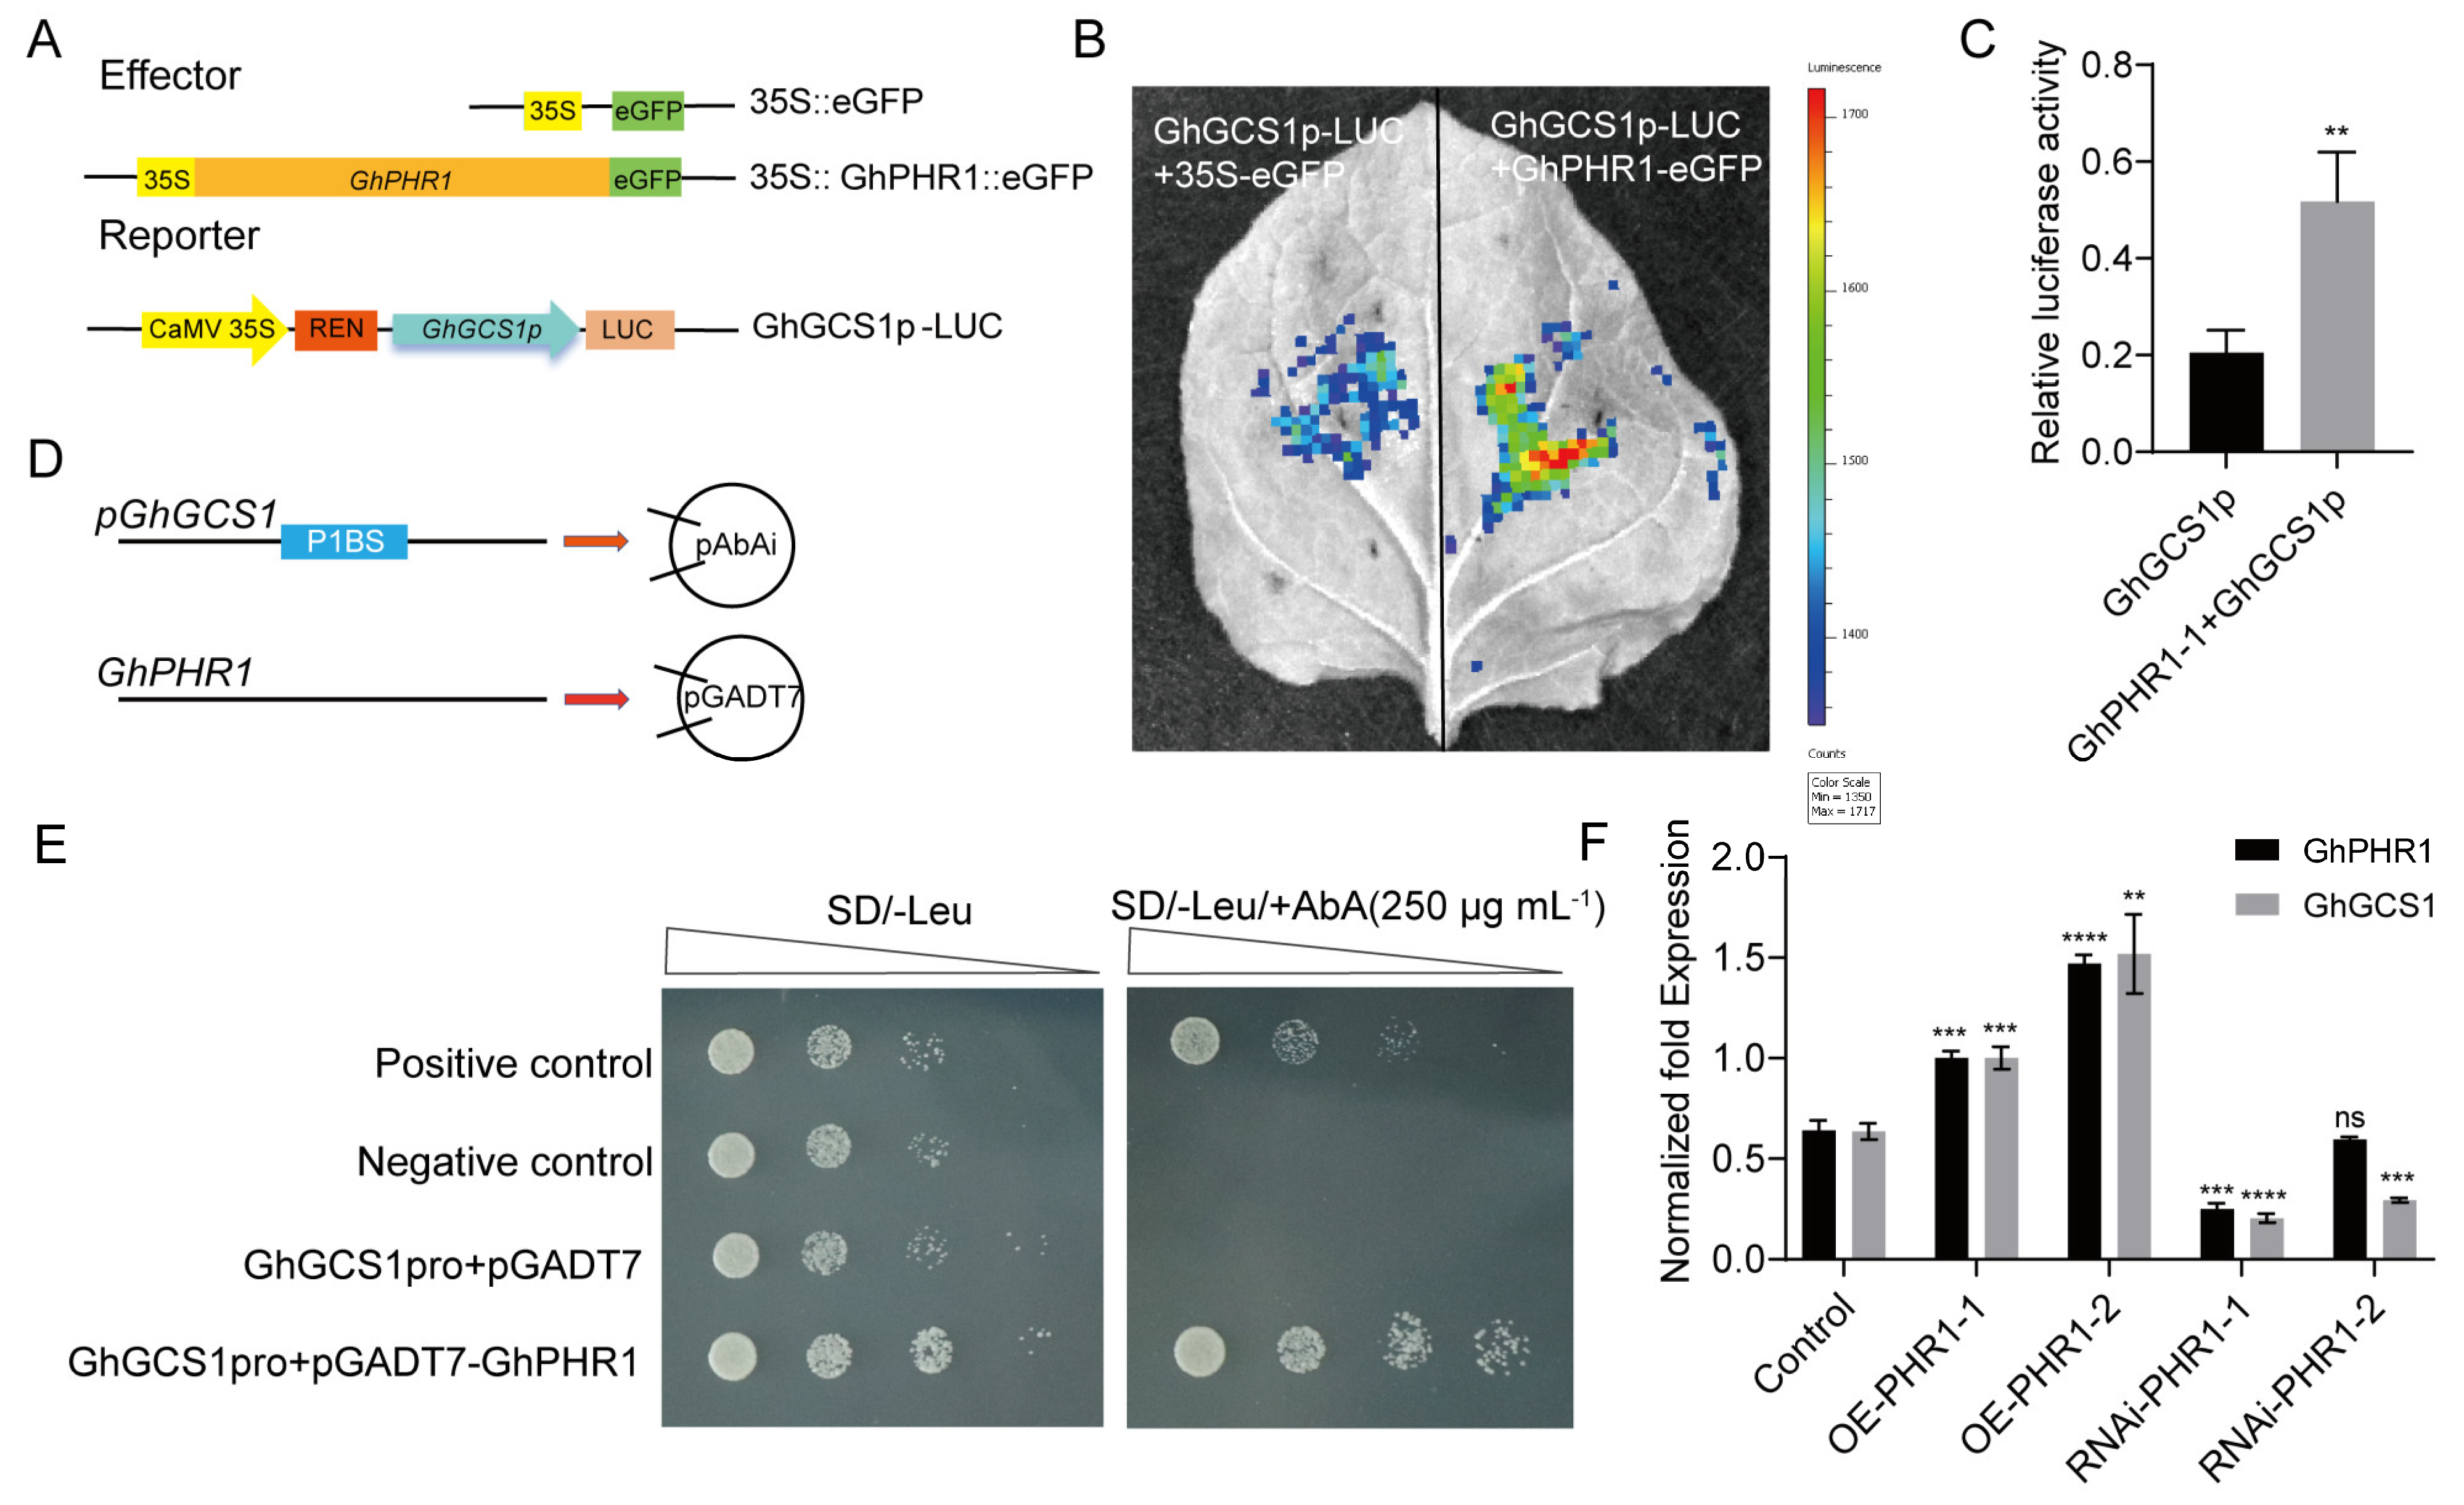
To clarify the binding and regulatory characteristics of GhPHR1 with the promoter of the GhGCS1 gene, the promoter of GhGCS1 was cloned into the pGreen0800Ⅱ-LUC reporter vector, and a constitutive effector vector was constructed in which the CaMV35S promoter drives GhPHR1 (Figure 4A). These vectors were co-expressed in tobacco leaves, and the fluorescence signal was investigated. The results demonstrated that the LUC intensity at the sites co-transformed with pGreen0800Ⅱ-GhGCS1-LUC and GhPHR1::eGFP was significantly higher than that of the control group (Figure 4B). Moreover, we extracted the total protein from the leaves and detected the luciferase activity of the total protein solution by using an automatic microplate reader. The luciferase activity is far higher in the co-expressing GhPHR1 and GhGCS1p sample than in the GhGCS1p sample (Figure 4C).
Figure 4.
GhPHR1 directly binds to the GhGCS1 promoter and positively regulates its expression. (A) The diagram of effector and reporter vectors in a dual-luciferase assay. (B) Dual-luciferase assay. (C) Relative luciferase activity in leaves. (D) The diagram of pAbAi-pGhGCS1 and pGADT7-GhPHR1 vectors. (E) Y1H assay. (F) The expression levels of GhPHR1 and GhGCS1 in transgenic roots. Positive control: pAbAi-p53 + pGADT7-53, Negative control: pAbAi-p53 + pGADT7. SD represents the standard deviation from three replications. Data analysis was performed by a t-test. **, p < 0.01; ***, p < 0.001; ****, p < 0.0001; ns, no significant.
Subsequently, we conducted yeast one-hybrid assays and dual-luciferase experiments. First, a promoter fragment of GhGCS1 containing the GAATATGC element was cloned into the pAbAi-bait vector, and the ORF of the GhPHR1 gene was constructed into the pGADT7 vector (Figure 4D). The two resulting vectors were co-transferred into yeast competent cells and allowed to grow in media containing different concentrations of AbA. The results showed that yeast colonies co-transformed with pGADT7-GhPHR1 and pAbAi-GhGCS1 were able to grow in the medium with 250 ng·mL−1 AbA, similar to the positive control (Figure 4E). This indicates that GhPHR1 can directly bind to the promoter of the GhGCS1 gene, confirming that GhGCS1 is a target gene of the GhPHR1 transcription factor.
Next, in order to further clarify the regulatory effect of GhPHR1 on GhGCS1, we constructed the overexpression vector and RNA-interference (RNAi) vector of GhPHR1 and obtained the corresponding transgenic complex through the hairy root transformation experiment. Additionally, we detected the expression of the GhGCS1 gene in the transgenic hairy roots. The results indicated that GhGCS1 expression was elevated in GhPHR1-overexpressing hairy roots but reduced in GhPHR1-RNAi hairy roots (Figure 4F), further demonstrating that GhPHR1 positively regulates the expression of GhGCS1. These results indicated that GhPHR1 directly binds to the GhGCS1 promoter and positively regulates its expression.
3.5. Upregulating GhGCS1 Gene Expression Promoted Phosphorus Uptake in Plants
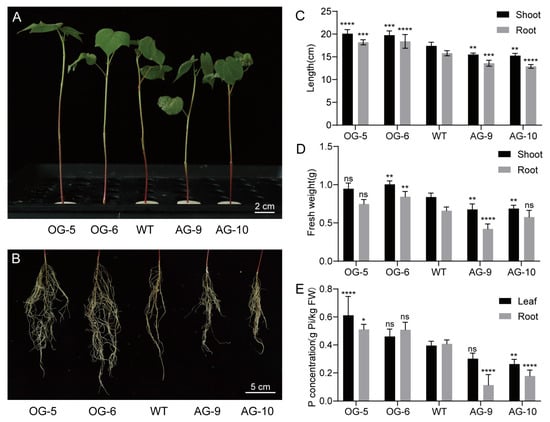
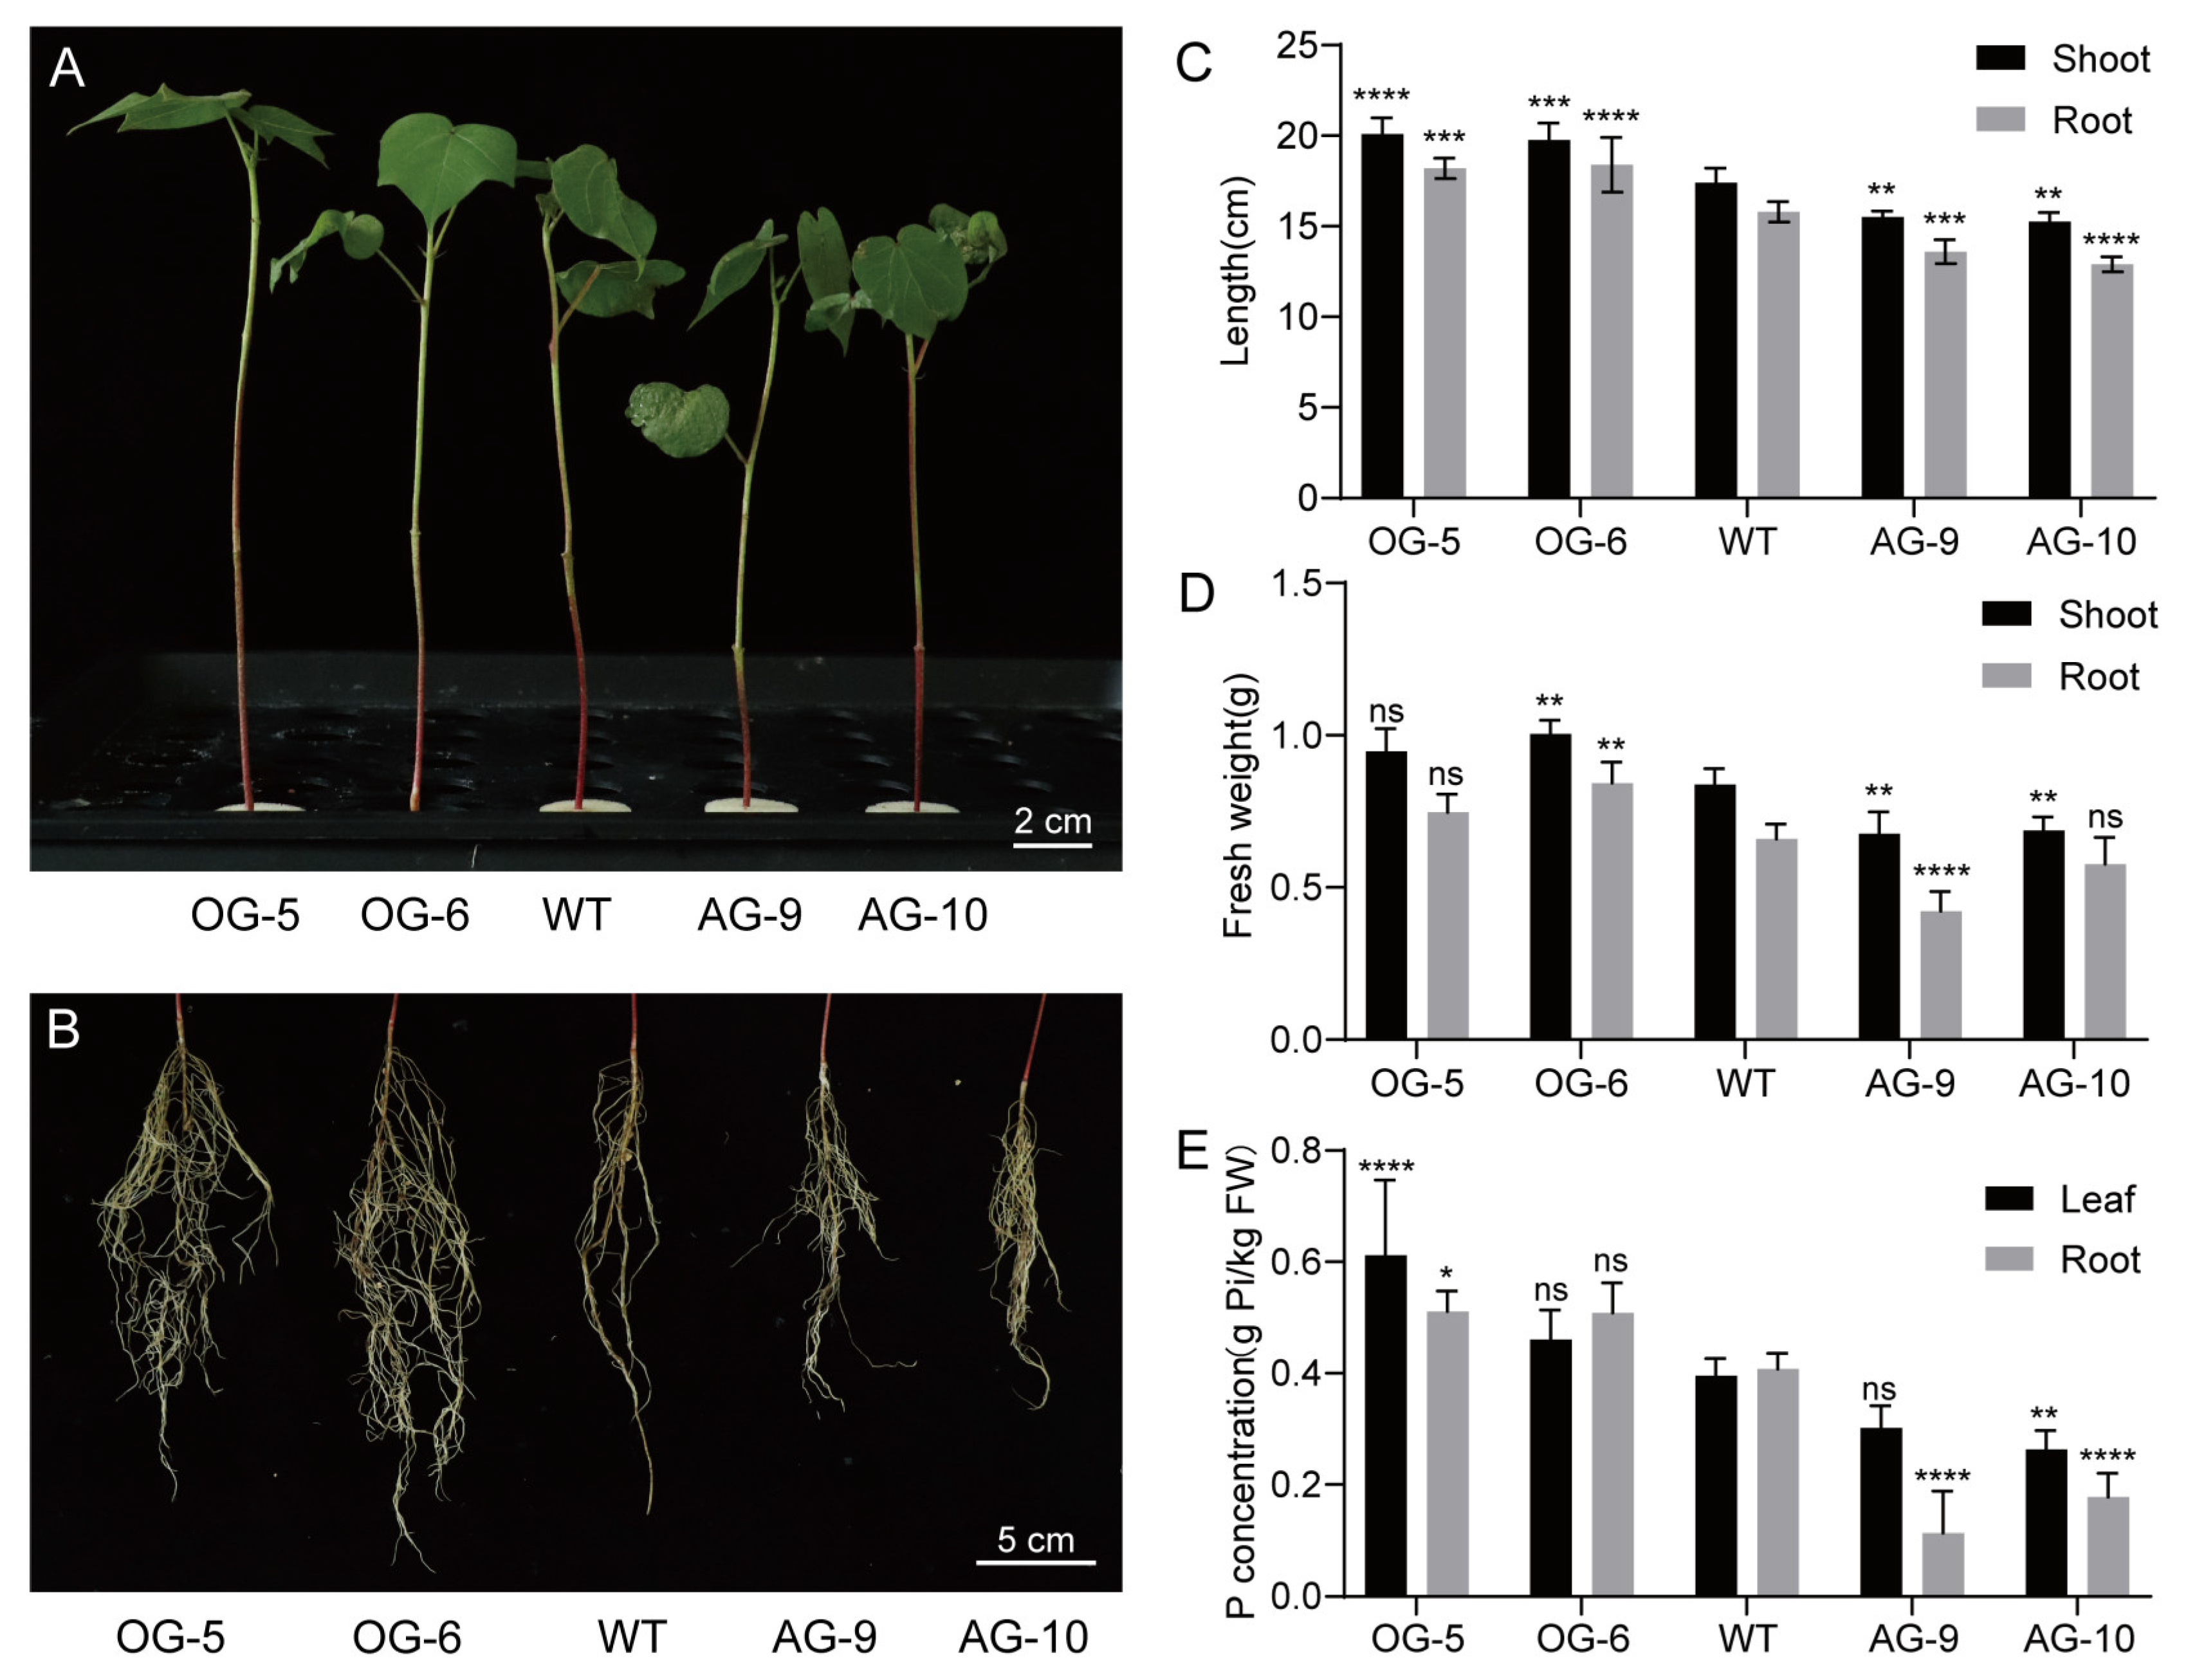
To clarify the function of the GhGCS1 gene in the uptake and utilization of phosphorus in cotton plants, we used the transgenic cotton seedlings of up- and downregulating GhGCS1 in this assay. The transgenic cotton plants and wild-type plants were treated with phosphorus deficiency, and their phenotypes were observed. The results showed that under phosphorus deficiency conditions, the growth of the overexpression line was better than that of the wild-type (Figure 5A,B). Moreover, the height of the shoot and root length were significantly higher than those of the wild-type, and the fresh weight and phosphorus content were also higher than those of the wild-type (Figure 5C–E). The growth of the RNAi transgenic lines was inferior to that of the wild-type, and the height of the shoot and the root length were significantly lower than those of the wild-type. The fresh weight and phosphorus content were also lower than those of the wild-type. These results demonstrate that increasing GhGCS1 gene expression can promote the uptake and transport of phosphorus in cotton plants.
Figure 5.
Up- or downregulating GhGCS1 expression affects plant phosphorus uptake under P-deficient conditions. (A) Phenotypes of the aboveground parts of transgenic plants and the wild-type. (B) Root phenotypes of transgenic plants and the wild-type. (C) Shoot and root length. (D) Fresh weight. (E) Phosphorus content. OG-5, OG-6: overexpressing transgenic lines of GhGCS1. AG-9, AG-10: RNA interference (RNAi)-mediated down-regulation transgenic lines of GhGCS1. WT: wild-type Jimian 14. SD represents the standard deviation from three biological replications. Data analysis was performed by a t-test. *, p < 0.05; **, p < 0.01; ***, p < 0.001; ****, p < 0.0001; ns, no significant.
3.6. GhGCS1 Promotes Phosphorus Uptake, Transport, and Utilization in Fibers
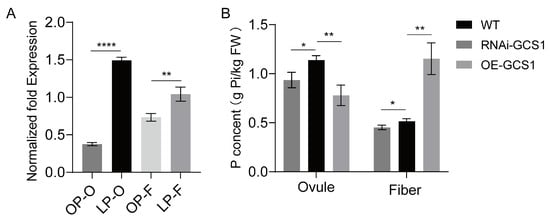
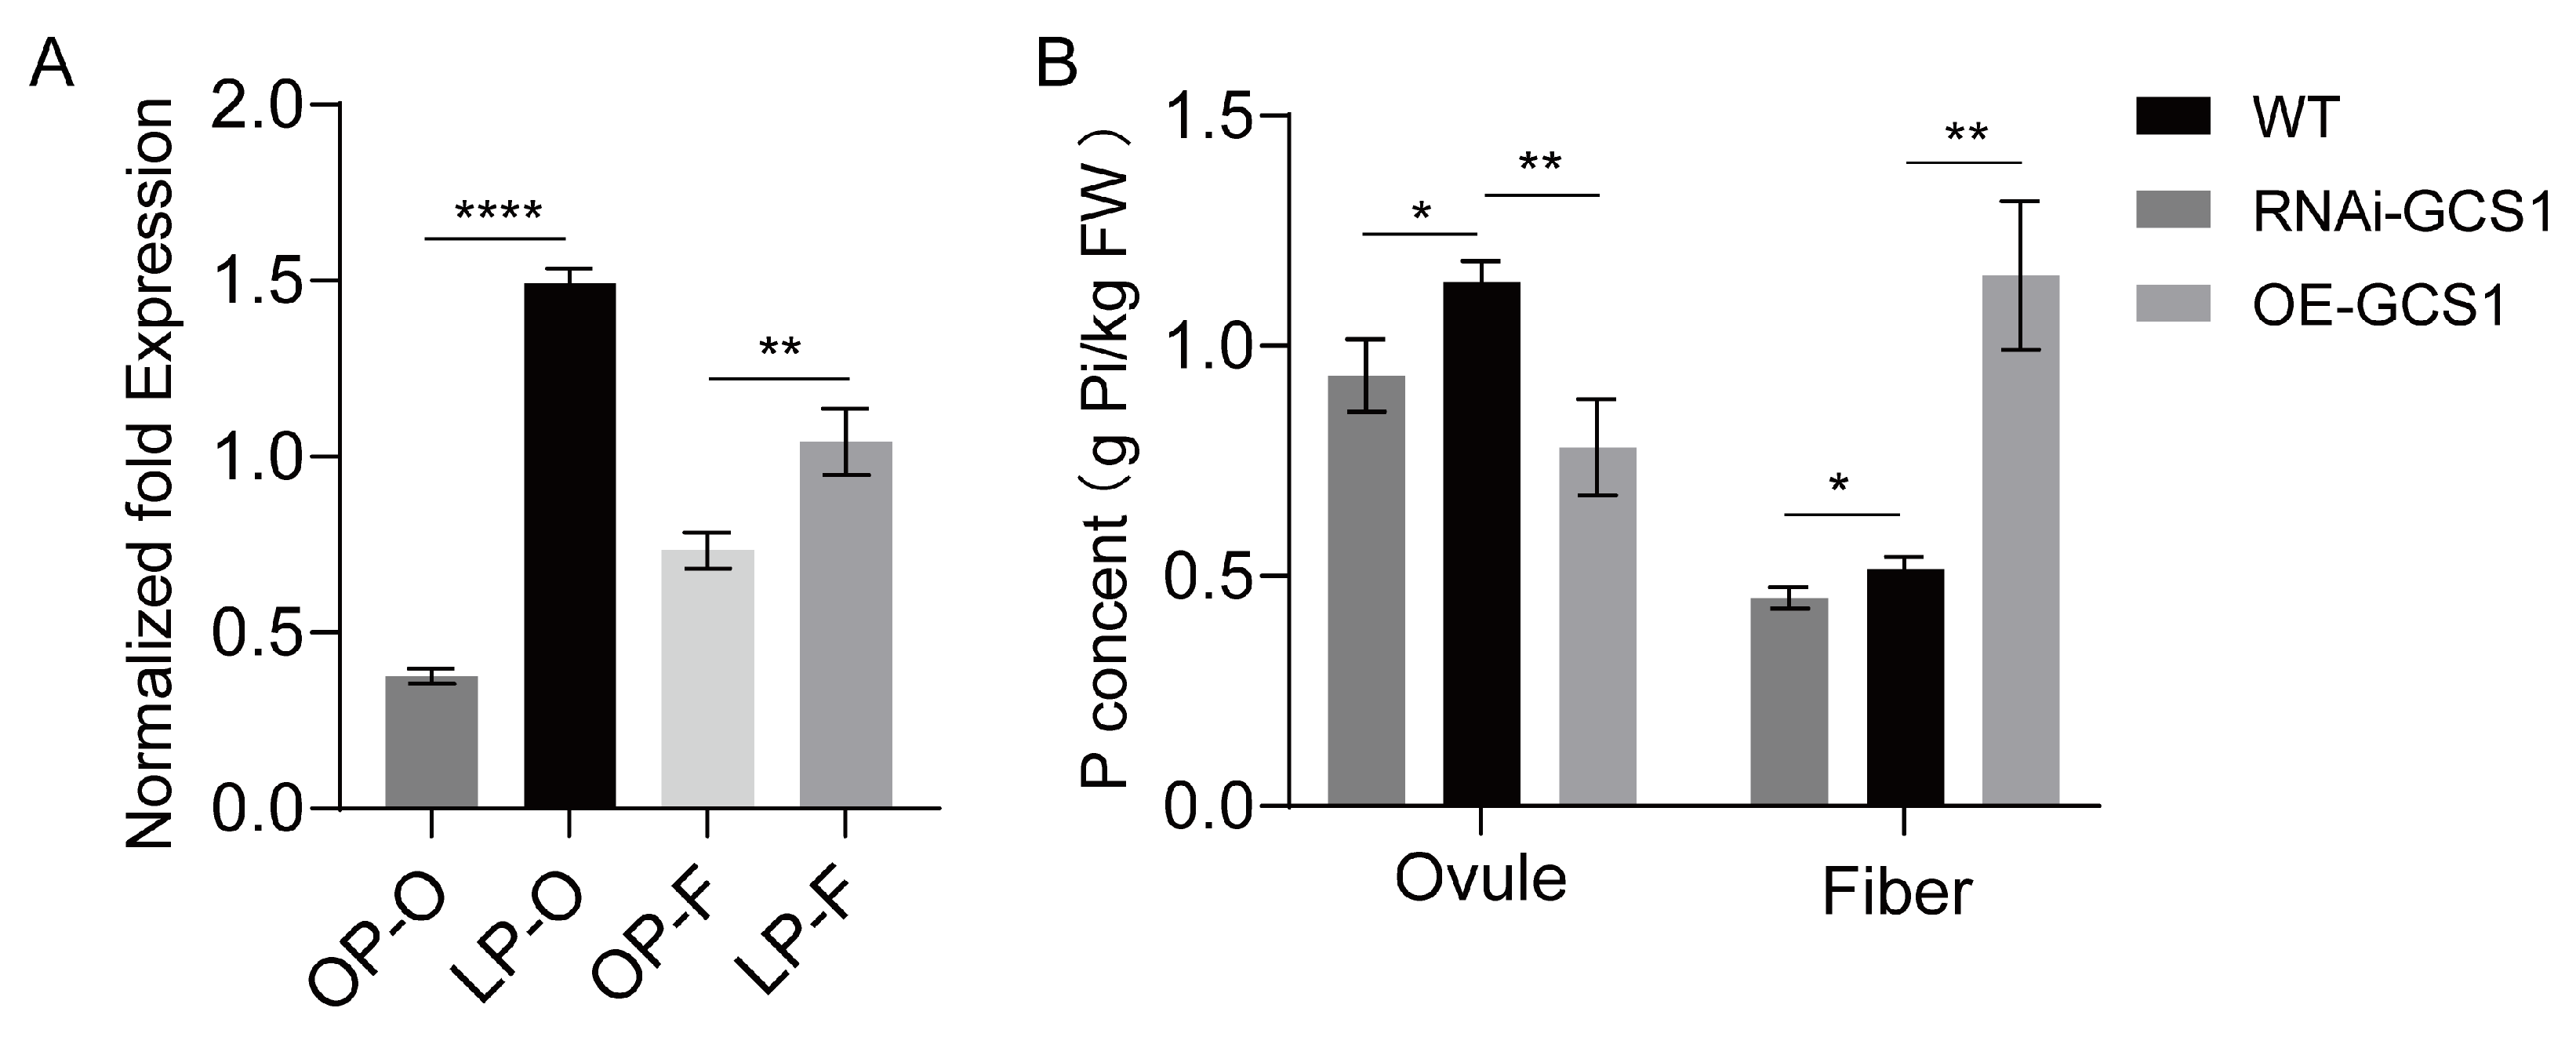
To investigate the role of GhGCS1 in phosphorus metabolism during the growth and development of cotton fibers and ovules, we analyzed the expression of GhGCS1 in cotton fibers and ovules grown in ovule culture systems under different phosphorus concentrations. The results indicated that under phosphorus deficiency conditions, the expression level of GhGCS1 was significantly upregulated both in ovules and fibers (Figure 6A), and the increase was greater in ovules. It indicates that GCS1 is involved in phosphorus metabolism in cotton fibers and ovules.
Figure 6.
GhGCS1 promotes phosphorus uptake, transport, and utilization in fibers. (A) The expression of GhGCS1 in cotton fibers and ovules cultured in ovule culture systems with different phosphorus concentrations. (B) The phosphorus content in the fibers and ovules of transgenic cotton. OP-O: ovule in P-sufficient condition (0.5 mM KH2PO4). LP-O: ovule in P-deficient condition (0 mM KH2PO4). OP-F: fiber in P-sufficient condition (0.5 mM KH2PO4). LP-F: fiber in P-deficient condition (0 mM KH2PO4). WT: wild-type Jimian14. RNAi-GCS1: the RNAi transgenic lines of GhGCS1. OE-GCS1: the overexpression line of GhGCS1. SD represents the standard deviation from three biological replications. Data analysis was performed using a t-test. *, p < 0.05; **, p < 0.01; ****, p < 0.0001.
To clarify the effect of up- or downregulating the GhGCS1 gene on the phosphorus content of transgenic ovule and fiber cell, we then measured the phosphorus content in the fibers and ovules of transgenic cotton. The results indicated that the phosphorus content in the fibers of the overexpression lines was much higher than that of the wild-type. On the contrary, the phosphorus content in the fibers of the RNAi transgenic lines was significantly lower than that of the wild-type (Figure 6B). Interestingly, the phosphorus content in the ovules of both the overexpression line and the RNAi transgenic lines was significantly lower than that of the wild type, with the reduction in phosphorus content being more significant in the overexpression line. Based on the above results, we speculate that the decrease in phosphorus content in the ovules of the RNAi transgenic line is caused by the reduced expression of GhGCS1, which is not conducive to the uptake of phosphorus by the plants.
This result further indicates that the overexpression of GhGCS1 promotes not only phosphorus uptake, transport, and utilization in cotton but also facilitates phosphorus allocation to developing fibers.
3.7. GhGCS1 Played a Role in Cotton Fiber and Ovule Growth
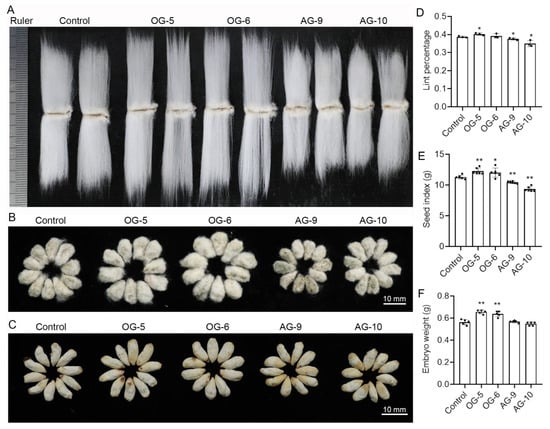
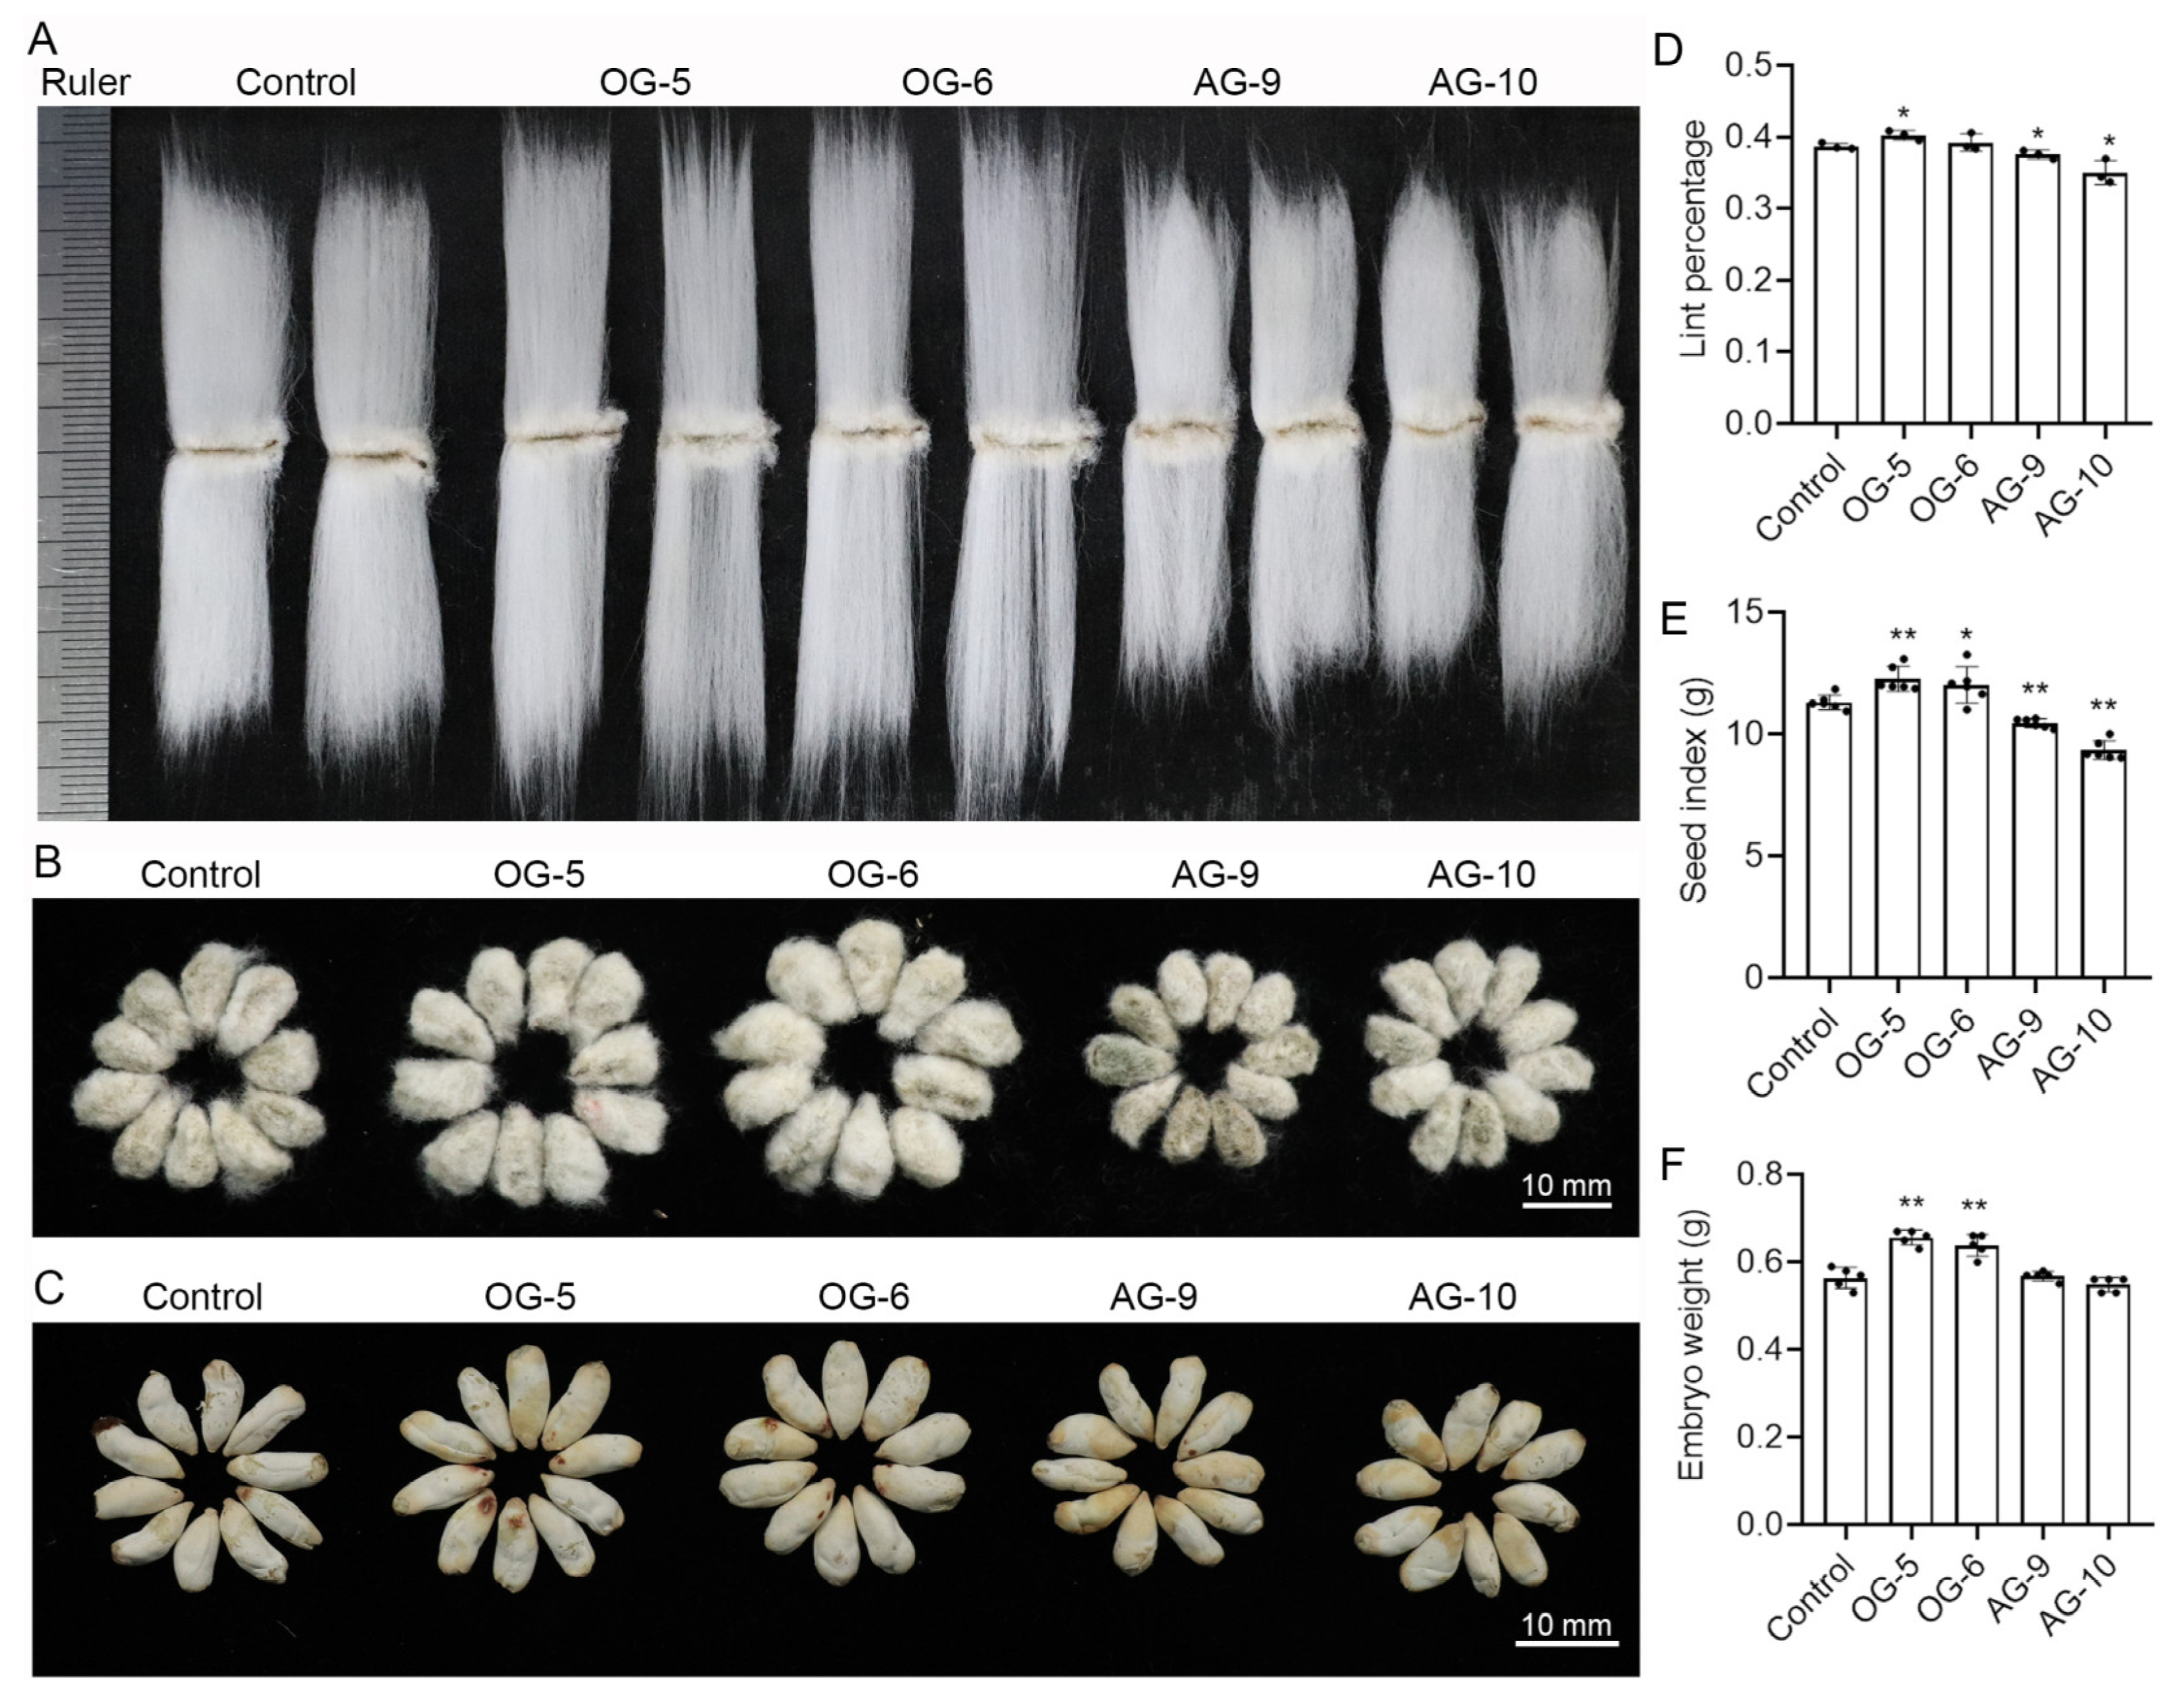
The GhPHR1 transcription factor responds to changes in phosphorus levels and regulates the expression of the GhGCS1 gene in cotton ovule and fiber. It is hypothesized that altering the expression of GhGCS1 may affect the growth of the fiber and ovule. To address this issue, we examined fiber length, as well as seed and embryo weight in transgenic cotton lines overexpressing or suppressing GhGCS1 expression. The results showed that overexpression of GhGCS1 increased the length of mature fibers, whereas suppression of this gene shortened fiber cell length (Figure 7A). Overexpression of GhGCS1 also increased the size of seeds and embryos, while suppression of the gene reduced seed and embryo size (Figure 7B,C,E,F).
Figure 7.
The effects of up- or downregulating GhGCS1 expression on the growth of fibers and ovules. (A) The length of mature fiber from control plants and transgenic plants. (B) The size of the seed from control plants and transgenic plants. The unit of the ruler is mm. (C) The size of the embryo in control plants and transgenic plants. (D) The lint percentage of control plants and transgenic plants. (E) The seed index of control plants and transgenic plants. (F) The weight of the mature embryo from control plants and transgenic plants. Control: The transgenic cotton plant was generated by the empty vector. SD represents the standard deviation from three or six biological replications. Data analysis was performed using the method of the t-test. *, p < 0.05; **, p < 0.01.
Since the lint percentage is the ratio of fiber weight to the total weight of fiber and seed, overexpression of GhGCS1 had little effect on lint percentage, likely due to a significant increase in seed weight (seed index). In contrast, suppression of GhGCS1 expression led to a reduction in seed weight and a decrease in lint percentage, indicating a greater decline in fiber weight (Figure 7D). These results demonstrate that the GhGCS1 gene plays an important role in regulating the growth and development of fibers and ovules. Furthermore, GhGCS1 could promote phosphorus uptake and transport in cotton fibers, promote fiber cell elongation, and increase seed size and weight.
4. Discussion
4.1. Phosphorus Is Important for the Growth of Ovule and Fiber While They Displayed Different Sensitivity to Phosphorus
Phosphorus, as one of the vital macronutrients for plant growth and development, functions as both an “energy hub” and a “structural cornerstone” for plant survival and growth. It participates in ATP synthesis to supply energy and serves as a key component of nucleic acids and phospholipids, thereby supporting fundamental cellular architecture [18]. Cotton fiber cells are not only the primary economic product of cotton but also an ideal model for studying plant cell growth and development [5]. However, the specific functions and mechanisms through which phosphorus directly influences fiber development remain unclear.
Under phosphorus-deficient conditions, both ovule growth and fiber elongation are severely suppressed, with fiber cell growth being relatively more inhibited and almost completely halted (Figure 1). At a low phosphorus level (0.25 mmol L−1), fiber cell growth recovers to some extent, whereas ovule growth returns to normal. When phosphorus concentration reaches 0.5 mmol L−1, fiber growth reaches its optimal value, but ovule growth begins to show some degree of inhibition. This indicates that fiber cells have a higher phosphorus demand than ovules and are more sensitive to phosphorus availability.
Under normal growth conditions, the phosphorus content in the ovules of wild-type cotton is higher than that in the fibers. However, in GhGCS1-overexpressing lines, phosphorus content in the fibers significantly increases, and that in the ovules significantly decreases (Figure 6B). This suggests that overexpression of GhGCS1 can enhance phosphorus allocation from ovules to fibers, thereby promoting the growth of fibers. In contrast, the phosphorus content in both tissues of the antisense lines was significantly decreased, indicating that reducing the expression of the GhGCS1 gene is not conducive to the uptake of phosphorus by cotton plants, weakens the transport effect of phosphorus from ovules to fibers, and thereby is not conducive to the elongation of fibers.
Under phosphorus-deficient conditions, cotton prioritizes ovule development to ensure reproductive success while restricting the growth of fiber cells, which are less critical for propagation. This differential phosphorus demand between ovules and fiber cells also suggests complex regulatory mechanisms governing phosphorus transport and utilization between them. Given that fiber cells originate from the outer epidermal layer of the ovule and given that lint percentage is defined as the ratio of fiber weight to the total weight of fibers and seeds, a critical agronomic trait in cotton production, it is hypothesized that elucidating phosphorus transport and utilization between cotton fibers and ovules holds significant theoretical value and practical application potential for improving lint percentage.
4.2. The GhPHR1-GhGCS1 Molecular Module Is a Nutritional Regulatory Mechanism That Regulates Fiber Cell Growth
The MYB family is one of the most important classes of transcription factor families in plants. Phosphate starvation response 1 (PHR1), a member of the MYB transcription factor family, is a central transcription factor mediating plant responses to phosphate starvation [51,52]. It is well known that inorganic phosphate is essential for normal plant growth and development. However, in most natural environments and agricultural ecosystems, plants frequently face phosphorus deficiency due to low availability of inorganic phosphate [17,53,54,55]. Under phosphate-deficient conditions, PHR1 could bind to the P1BS element in the promoter of the Pi starvation-induced (PSI) gene, initiating downstream phosphate response pathways [51,56,57]. In this study, we detected a significant upregulation of the PHR1 homolog GhPHR1 under phosphorus deficient condition, indicating that GhPHR1 is a phosphate starvation-responsive transcription factor (Figure 2B). PHR1 proteins can bind to the PIBS cis-regulatory element in the promoters of target genes, thereby regulating their expression. Previous studies in Arabidopsis have demonstrated that PHR1 can regulate the expression of sphingolipid synthase genes, thereby modulating phosphate metabolism pathways [7]. By screening the promoter sequences of cotton sphingolipid synthase genes, we identified that the promoter of the GhGCS1 gene contains a PIBS sequence (Figure S1). Through yeast one-hybrid and dual-luciferase assays, we further demonstrated that GhPHR1 could directly bind to GhGCS1 promoter and activate its expression (Figure 4), which is consistent with that from Arabidopsis [45].
Sphingolipids are essential both as key components of membranes and as bioactive molecules. Our previous studies revealed the role and mechanism of the glucosylceramide synthase and its product, glucosylceramide (GluCer), in cotton fiber growth [41,42,58]. GhGCS1 is preferentially expressed during the fiber elongation stage and localizes to the endoplasmic reticulum. Its overexpression promoted GluCer synthesis and fiber elongation, consistent with the effects of exogenous application of GluCer (containing very long-chain unsaturated fatty acids) in ovule culture. Conversely, suppression of GhGCS1 expression reduced both GluCer synthesis and fiber elongation, similar to the effect of the GluCer synthesis inhibitor PDMP. We further demonstrated that GhGCS1 regulates the synthesis and signaling of the important plant hormone brassinosteroid during the promotion of fiber elongation [41]. Given the diverse regulatory functions of sphingolipids in plant growth and development, and considering that nutrition and hormones are two closely interconnected and indispensable aspects during organism development, our study establishes a molecular regulatory network between sphingolipid and phosphate metabolism. In transgenic plants overexpressing GhGCS1, the contents of both GluCer and phosphorus increased, whereas in plants with suppressed GhGCS1 expression, the levels of GluCer and phosphorus decreased (Figure 5). Collectively, these results suggest that GhGCS1 and its product GluCer play important roles in both plant nutrient metabolism and hormone metabolism, potentially coordinating plant hormone and nutrient balance to regulate growth and development by perceiving environmental factors (sphingolipids are key functional components of membranes). Further in-depth research on the coordination mechanisms of these two aspects will help to elucidate the regulatory mechanisms of plant growth and development, and related studies are currently underway.
5. Conclusions
Cotton is a crucial economic crop globally and a major source of natural textile materials. Fiber quality is sensitive to phosphate fertilization, yet the specific role and regulatory mechanism of phosphorus in fiber cell growth remain poorly understood. This study investigated the effects of different phosphorus concentrations on cotton ovule and fiber development. The results demonstrate that phosphorus plays a critical role in fiber cell elongation and ovule growth, with differential sensitivity to phosphorus between ovules and fiber cells. We identified a phosphorus starvation-responsive transcription factor, GhPHR1, which localizes to the nucleus and is expressed in various tissues and organs of cotton, as well as at different developmental stages of fiber and ovules, with relatively lower expression during the fiber cell elongation stage. GhPHR1 directly binds to the promoter of GhGCS1 and activates its expression. Overexpression of GhGCS1 promotes sphingolipid synthesis in fiber cells, enhances phosphorus uptake and transport in cotton, increases phosphorus content in fiber cells, and enhances fiber elongation. Conversely, suppression of GhGCS1 expression inhibits sphingolipid synthesis, inhibits phosphorus uptake and transport in cotton, reduces phosphorus content in fiber cells, and restrains fiber elongation. These findings demonstrate the importance of the GhPHR1-GhGCS1 molecular module in regulating fiber elongation and elucidate the phosphorus nutrition regulatory mechanism underlying fiber elongation. This study provides insights into the intrinsic relationship between sphingolipid homeostasis and mineral nutrition during plant growth and development, offering a theoretical foundation for improving cotton fiber yield (e.g., increasing lint percentage) and quality (e.g., enhancing fiber length). Further study may focus on the coordination mechanisms of phosphorus, sphingolipid, and phytohormone, which will elucidate the regulatory mechanisms of plant growth under specific environmental conditions.
Supplementary Materials
The following supporting information can be downloaded at: https://www.mdpi.com/article/10.3390/agronomy16030324/s1. Figure S1: Analysis of the promoter sequence of sphingolipid synthase gene in upland cotton; Table S1: Primers used for qRT-PCR; Table S2: Primers used for PCR.
Author Contributions
Z.Q.: visualization, writing—original draft preparation; Z.Q. and J.D.: validation, investigation, software; Q.W.: methodology, investigation, writing—review and editing; X.Y. and Y.G.: conceptualization, validation, writing—review and editing; Z.Q. and Q.W.: software, validation; J.D.: investigation; P.T. and N.L.: data curation, visualization, resources; P.T. and F.L.: data curation, visualization, software; M.L.: validation, supervision, formal analysis, conceptualization, project administration. All authors have read and agreed to the published version of the manuscript.
Funding
This research was funded by the National Natural Science Foundation of China (32372114 and 31971984), the Genetically Modified Organisms Breeding Major Project of China (No.2018ZX0800921B), and the Fundamental Research Funds for the Central Universities of China (SWU-KF25037). The funding bodies did not play any role in the design of the study and data collection; in the analysis and interpretation of data; and in writing the manuscript.
Institutional Review Board Statement
Not applicable.
Informed Consent Statement
Not applicable.
Data Availability Statement
The original contributions presented in this study are included in the article and Supplementary Materials. Further inquiries can be directed to the corresponding author.
Conflicts of Interest
The authors declare no conflicts of interest.
Abbreviations
The following abbreviations are used in this manuscript:
| OP | P-sufficient condition (0.5 mM KH2PO4) |
| LP | P-deficient condition (0 mM KH2PO4) |
| OE | Overexpression |
| RNAi | RNA interference |
| WT | Wild type |
| Y1h | Yeast one-hybrid |
| OD | Optical density |
| OEF | Open reading frame |
| DPA | Day post-anthesis |
| cDNA | Complementary DNA |
| gDNA | Genomic DNA |
| qRT-PCR | Quantitative real-time PCR |
| min | Minute |
| d | Day |
| s | Second |
| h | Hour |
| GhGCS1 | Gossypium hirsutum GCS1 |
| GhPHR1 | Gossypium hirsutum PHR1 |
| GhGCS1p | Gossypium hirsutum GCS1 promoter |
References
- Adeleke, A.A. Technological advancements in cotton agronomy: A review and prospects. Technol. Agron. 2024, 4, e008. [Google Scholar] [CrossRef] [Scilit]
- Adeleke, A.A. A Review of Plastic Contamination Challenges and Mitigation Efforts in Cotton and Textile Milling Industries. AgriEngineering 2023, 5, 193–217. [Google Scholar] [CrossRef] [Scilit]
- Yang, Z.; Tang, J.; Yu, M.; Zhang, Y.; Abbas, A.; Wang, S.; Bagadeem, S. Sustainable Cotton Production through Increased Competitiveness: Analysis of Comparative Advantage and Influencing Factors of Cotton Production in Xinjiang, China. Agronomy 2022, 12, 2239. [Google Scholar] [CrossRef] [Scilit]
- Radhakrishnan, S. 2—Sustainable cotton production. In Sustainable Fibres and Textiles; Muthu, S.S., Ed.; Woodhead Publishing: Sawston, UK, 2017; pp. 21–67. [Google Scholar] [CrossRef] [Scilit]
- Haigler, C.H.; Betancur, L.; Stiff, M.R.; Tuttle, J.R. Cotton fiber: A powerful single-cell model for cell wall and cellulose research. Front. Plant Sci. 2012, 3, 104. [Google Scholar] [CrossRef] [Scilit]
- Schubert, A.M.; Benedict, C.R.; Berlin, J.D.; Kohel, R.J. Cotton Fiber Development-Kinetics of Cell Elongation and Secondary Wall Thickening. Crop Sci. 1973, 13, 704–709. [Google Scholar] [CrossRef] [Scilit]
- Sonal, J.; Gokani, V.S.T. Physiological and biochemical changes associated with cotton fiber development IX. Role of IAA and PAA. Field Crops Res. 2002, 77, 127–136. [Google Scholar] [CrossRef] [Scilit]
- Huang, G.; Huang, J.; Chen, X.-Y.; Zhu, Y.-X. Recent Advances and Future Perspectives in Cotton Research. Annu. Rev. Plant Biol. 2021, 72, 437–462. [Google Scholar] [CrossRef] [Scilit]
- Huang, J.; Chen, F.; Guo, Y.; Gan, X.; Yang, M.; Zeng, W.; Persson, S.; Li, J.; Xu, W. GhMYB7 promotes secondary wall cellulose deposition in cotton fibres by regulating GhCesA gene expression through three distinct cis-elements. New Phytol. 2021, 232, 1718–1737. [Google Scholar] [CrossRef] [Scilit] [PubMed]
- Wang, Z.; Yang, Z.; Li, F. Updates on molecular mechanisms in the development of branched trichome in Arabidopsis and nonbranched in cotton. Plant Biotechnol. J. 2019, 17, 1706–1722. [Google Scholar] [CrossRef] [Scilit]
- Wen, X.; Zhai, Y.; Zhang, L.; Chen, Y.; Zhu, Z.; Chen, G.; Wang, K.; Zhu, Y. Molecular studies of cellulose synthase supercomplex from cotton fiber reveal its unique biochemical properties. Sci. China-Life Sci. 2022, 65, 1776–1793. [Google Scholar] [CrossRef] [Scilit]
- Zhai, Z.; Zhang, K.; Fang, Y.; Yang, Y.; Cao, X.; Liu, L.; Tian, Y. Systematically and Comprehensively Understanding the Regulation of Cotton Fiber Initiation: A Review. Plants 2023, 12, 3771. [Google Scholar] [CrossRef] [Scilit]
- Yang, Z.; Liu, Z.; Ge, X.; Lu, L.; Qin, W.; Qanmber, G.; Liu, L.; Wang, Z.; Li, F. Brassinosteroids regulate cotton fiber elongation by modulating very-long-chain fatty acid biosynthesis. Plant Cell 2023, 35, 2114–2131. [Google Scholar] [CrossRef] [Scilit] [PubMed]
- Wang, M.-Y.; Zhao, P.-M.; Cheng, H.-Q.; Han, L.-B.; Wu, X.-M.; Gao, P.; Wang, H.-Y.; Yang, C.-L.; Zhong, N.-Q.; Zuo, J.-R.; et al. The Cotton Transcription Factor TCP14 Functions in Auxin-Mediated Epidermal Cell Differentiation and Elongation. Plant Physiol. 2013, 162, 1669–1680. [Google Scholar] [CrossRef] [Scilit]
- Zhao, N.; Wang, W.; Jiang, K.; Grover, C.E.; Cheng, C.; Pan, Z.; Zhao, C.; Zhu, J.; Li, D.; Wang, M.; et al. A Calmodulin-Like Gene (GbCML7) for Fiber Strength and Yield Improvement Identified by Resequencing Core Accessions of a Pedigree in Gossypium barbadense. Front. Plant Sci. 2022, 12, 815648. [Google Scholar] [CrossRef] [Scilit] [PubMed]
- Xu, X.; Zhu, T.; Nikonorova, N.; De Smet, I. Phosphorylation-Mediated Signalling in Plants. Annu. Plant Rev. Online 2019, 2, 909–932. [Google Scholar] [CrossRef] [Scilit]
- Raghothama, K.G. Phosphate acquisition. Annu. Rev. Plant Biol. 1999, 50, 665–693. [Google Scholar] [CrossRef] [Scilit]
- Hawkesford, M.; Horst, W.; Kichey, T.; Lambers, H.; Schjoerring, J.; Møller, I.S.; White, P. Chapter 6—Functions of Macronutrients. In Marschner’s Mineral Nutrition of Higher Plants, 3rd ed.; Marschner, P., Ed.; Academic Press: San Diego, CA, USA, 2012; pp. 135–189. [Google Scholar] [CrossRef] [Scilit]
- Yang, B.; Li, M.; Phillips, A.; Li, L.; Ali, U.; Li, Q.; Lu, S.; Hong, Y.; Wang, X.; Guo, L. Nonspecific phospholipase C4 hydrolyzes phosphosphingolipids and sustains plant root growth during phosphate deficiency. Plant Cell 2021, 33, 766–780. [Google Scholar] [CrossRef] [Scilit]
- Plaxton, W.C.; Shane, M.W. The Role of Post-Translational Enzyme Modifications in the Metabolic Adaptations of Phosphorus-Deprived Plants. In Annual Plant Reviews; Wiley: Hoboken, NJ, USA, 2015; Volume 48, pp. 99–123. [Google Scholar] [CrossRef] [Scilit]
- Singh, T.; Bisht, N.; Ansari, M.M.; Chauhan, P.S. From Soil to Cell: Systemic Signalling and Regulatory Networks in Zea mays Under Phosphorus Deprivation. Plant Cell Environ. 2025, 49, 786–800. [Google Scholar] [CrossRef] [Scilit] [PubMed]
- Gruber, B.D.; Giehl, R.F.H.; Friedel, S.; von Wirén, N. Plasticity of the Arabidopsis Root System under Nutrient Deficiencies. Plant Physiol. 2013, 163, 161–179. [Google Scholar] [CrossRef] [Scilit]
- Sun, H.; Tao, J.; Liu, S.; Huang, S.; Chen, S.; Xie, X.; Yoneyama, K.; Zhang, Y.; Xu, G. Strigolactones are involved in phosphate- and nitrate-deficiency-induced root development and auxin transport in rice. J. Exp. Bot. 2014, 65, 6735–6746. [Google Scholar] [CrossRef] [Scilit]
- Péret, B.; Clément, M.; Nussaume, L.; Desnos, T. Root developmental adaptation to phosphate starvation: Better safe than sorry. Trends Plant Sci. 2011, 16, 442–450. [Google Scholar] [CrossRef] [Scilit]
- Woo, H.R.; Kim, H.J.; Lim, P.O.; Nam, H.G. Leaf Senescence: Systems and Dynamics Aspects. Annu. Rev. Plant Biol. 2019, 70, 347–376. [Google Scholar] [CrossRef] [Scilit]
- Veneklaas, E.J.; Lambers, H.; Bragg, J.; Finnegan, P.M.; Lovelock, C.E.; Plaxton, W.C.; Price, C.A.; Scheible, W.R.; Shane, M.W.; White, P.J.; et al. Opportunities for improving phosphorus-use efficiency in crop plants. New Phytol. 2012, 195, 306–320. [Google Scholar] [CrossRef] [Scilit]
- de Bang, T.C.; Husted, S.; Laursen, K.H.; Persson, D.P.; Schjoerring, J.K. The molecular–physiological functions of mineral macronutrients and their consequences for deficiency symptoms in plants. New Phytol. 2020, 229, 2446–2469. [Google Scholar] [CrossRef] [Scilit] [PubMed]
- Preuss, C.P.; Huang, C.Y.; Louhaichi, M.; Ogbonnaya, F.C. Genetic variation in the early vigour of spring bread wheat under phosphate stress as characterised through digital charting. Field Crops Res. 2012, 127, 71–78. [Google Scholar] [CrossRef] [Scilit]
- Carstensen, A.; Herdean, A.; Schmidt, S.B.; Sharma, A.; Spetea, C.; Pribil, M.; Husted, S. The Impacts of Phosphorus Deficiency on the Photosynthetic Electron Transport Chain. Plant Physiol. 2018, 177, 271–284. [Google Scholar] [CrossRef] [Scilit]
- Ma, J.; He, P.; Xu, X.; He, W.; Liu, Y.; Yang, F.; Chen, F.; Li, S.; Tu, S.; Jin, J.; et al. Temporal and spatial changes in soil available phosphorus in China (1990–2012). Field Crops Res. 2016, 192, 13–20. [Google Scholar] [CrossRef] [Scilit]
- Bradow, J.M.; Hinojosa, O.; Wartelle, L.H.; Davidonis, G.; Sassenrath-Cole, G.F.; Bauer, P.J. Applications of AFIS fineness and maturity module and x-ray fluorescence. Text. Res. J. 1996, 66, 545–554. [Google Scholar] [CrossRef] [Scilit]
- Li, H.; Wang, J.; Ali, S.; Iqbal, B.; Zhang, H.; Wang, S.; Chen, B.; Zhou, Z. Agronomic traits at the seedling stage, yield, and fiber quality in two cotton (Gossypium hirsutum L.) cultivars in response to phosphorus deficiency. Soil Sci. Plant Nutr. 2020, 66, 308–316. [Google Scholar] [CrossRef] [Scilit]
- Li, H.; Wang, J.; Huang, X.; Zhou, Z.; Wang, S.; Hu, W. Phosphate fertilization promotes fiber elongation by affecting sucrose inversion, K+ accumulation, and malate synthesis in cotton fiber. Field Crops Res. 2023, 303, 109119. [Google Scholar] [CrossRef] [Scilit]
- Li, H.; Wang, J.; Huang, X.; Zhou, Z.; Wang, S.; Hu, W. Novel intra-boll yield components and Q-score can further evaluate the effect of phosphorus fertilizer on cotton yield and fiber quality. Field Crops Res. 2022, 275, 108325. [Google Scholar] [CrossRef] [Scilit]
- Sun, M.; Zheng, C.; Feng, W.; Shao, J.; Pang, C.; Li, P.; Dong, H. Low soil available phosphorus level reduces cotton fiber length via osmoregulation. Front. Plant Sci. 2023, 14, 1254103. [Google Scholar] [CrossRef] [Scilit]
- Sun, M.; Han, H.; Feng, W.; Shao, J.; Huo, F.; Pang, C.; Dong, H.; Zheng, C.; Li, P. Low Phosphorus Stress Decreases Cotton Fiber Strength by Inhibiting Carbohydrate Metabolism. J. Plant Growth Regul. 2025, 44, 3865–3883. [Google Scholar] [CrossRef] [Scilit]
- Sud, M.; Fahy, E.; Cotter, D.; Brown, A.; Dennis, E.A.; Glass, C.K.; Merrill, A.H., Jr.; Murphy, R.C.; Raetz, C.R.; Russell, D.W. Lmsd: Lipid maps structure database. Nucleic Acids Res. 2007, 35, D527–D532. [Google Scholar] [CrossRef] [Scilit]
- Sperling, P.; Heinz, E. Plant sphingolipids: Structural diversity, biosynthesis, first genes and functions. Biochim. Biophys. Acta (BBA) Mol. Cell Biol. Lipids 2003, 1632, 1–15. [Google Scholar] [CrossRef] [Scilit]
- Liu, N.-J.; Hou, L.-P.; Bao, J.-J.; Wang, L.-J.; Chen, X.-Y. Sphingolipid metabolism, transport, and functions in plants: Recent progress and future perspectives. Plant Commun. 2021, 2, 100214. [Google Scholar] [CrossRef] [Scilit]
- Wang, L.; Liu, C.; Liu, Y.; Luo, M. Fumonisin B1-Induced Changes in Cotton Fiber Elongation Revealed by Sphingolipidomics and Proteomics. Biomolecules 2020, 10, 1258. [Google Scholar] [CrossRef] [Scilit]
- Wang, Q.; Yan, X.; Niu, Q.; Zhang, H.; Tian, H.; Chen, Z.; Xu, F.; You, Y.; Gao, Y.; Qiao, Z.; et al. Glucosylceramides containing very long-acyl-chain fatty acid are critical for cotton fiber elongation by influencing brassinosteroid synthesis and signaling. Crop J. 2025, 13, 1081–1092. [Google Scholar] [CrossRef] [Scilit]
- Chen, Q.; Xu, F.; Wang, L.; Suo, X.D.; Wang, Q.L.; Meng, Q.; Huang, L.; Ma, C.X.; Li, G.M.; Luo, M. Sphingolipid Profile during Cotton Fiber Growth Revealed That a Phytoceramide Containing Hydroxylated and Saturated VLCFA Is Important for Fiber Cell Elongation. Biomolecules 2021, 11, 1352. [Google Scholar] [CrossRef] [Scilit] [PubMed]
- Zhang, J.; Meng, Q.; Wang, Q.; Zhang, H.; Tian, H.; Wang, T.; Xu, F.; Yan, X.; Luo, M. Cotton sphingosine kinase GhLCBK1 participates in fiber cell elongation by affecting sphingosine-1-phophate and auxin synthesis. Int. J. Biol. Macromol. 2024, 267, 131323. [Google Scholar] [CrossRef] [Scilit] [PubMed]
- Wu, J.X.; Li, J.; Liu, Z.; Yin, J.; Chang, Z.Y.; Rong, C.; Wu, J.L.; Bi, F.C.; Yao, N. The Arabidopsis ceramidase At ACER functions in disease resistance and salt tolerance. Plant J. 2015, 81, 767–780. [Google Scholar] [CrossRef] [Scilit]
- Yang, B.; Peng, Y.; Zhang, G.; Liu, R.; Hao, S.; Ren, Y.; Lu, S.; Wang, X.; Guo, L. Regulation of glucosylceramide synthase and sphingolipid remodeling in the plant response to phosphate deficiency. Plant Cell 2025, 37, koaf138. [Google Scholar] [CrossRef] [Scilit] [PubMed]
- Livak, K.J.; Schmittgen, T.D. Analysis of Relative Gene Expression Data Using Real-Time Quantitative PCR and the 2−ΔΔCT Method. Methods 2001, 25, 402–408. [Google Scholar] [CrossRef] [Scilit]
- Yan, Q.; Wang, Y.; Li, Q.; Zhang, Z.; Ding, H.; Zhang, Y.; Liu, H.; Luo, M.; Liu, D.; Song, W.; et al. Up-regulation of GhTT2-3A in cotton fibres during secondary wall thickening results in brown fibres with improved quality. Plant Biotechnol. J. 2018, 16, 1735–1747. [Google Scholar] [CrossRef] [Scilit]
- Luo, M.; Xiao, Y.; Li, X.; Lu, X.; Deng, W.; Li, D.; Hou, L.; Hu, M.; Li, Y.; Pei, Y. GhDET2, a steroid 5α-reductase, plays an important role in cotton fiber cell initiation and elongation. Plant J. 2007, 51, 419–430. [Google Scholar] [CrossRef] [Scilit]
- Tamura, K.; Stecher, G.; Kumar, S. MEGA11: Molecular evolutionary genetics analysis version 11. Mol. Biol. Evol. 2021, 38, 3022–3027. [Google Scholar] [CrossRef] [Scilit]
- Chen, C.; Chen, H.; Zhang, Y.; Thomas, H.R.; Frank, M.H.; He, Y.; Xia, R. TBtools: An integrative toolkit developed for interactive analyses of big biological data. Mol. Plant. 2020, 13, 1194–1202. [Google Scholar] [CrossRef] [Scilit] [PubMed]
- Rubio, V.; Linhares, F.; Solano, R.; Martín, A.C.; Iglesias, J.; Leyva, A.; Paz-Ares, J. A conserved MYB transcription factor involved in phosphate starvation signaling both in vascular plants and in unicellular algae. Genes Dev. 2001, 15, 2122–2133. [Google Scholar] [CrossRef] [Scilit] [PubMed]
- Sun, L.; Song, L.; Zhang, Y.; Zheng, Z.; Liu, D. Arabidopsis PHL2 and PHR1 act redundantly as the key components of the central regulatory system controlling transcriptional responses to phosphate starvation. Plant Physiol. 2016, 170, 499–514. [Google Scholar] [CrossRef] [Scilit]
- Raghothama, K. Phosphate transport and signaling. Curr. Opin. Plant Biol. 2000, 3, 182–187. [Google Scholar] [CrossRef]
- Cong, W.-F.; Suriyagoda, L.D.; Lambers, H. Tightening the phosphorus cycle through phosphorus-efficient crop genotypes. Trends Plant Sci. 2020, 25, 967–975. [Google Scholar] [CrossRef] [Scilit] [PubMed]
- Dissanayaka, D.; Ghahremani, M.; Siebers, M.; Wasaki, J.; Plaxton, W.C. Recent insights into the metabolic adaptations of phosphorus-deprived plants. J. Exp. Bot. 2021, 72, 199–223. [Google Scholar] [CrossRef] [Scilit] [PubMed]
- Zhou, J.; Jiao, F.; Wu, Z.; Li, Y.; Wang, X.; He, X.; Zhong, W.; Wu, P. OsPHR2 is involved in phosphate-starvation signaling and excessive phosphate accumulation in shoots of plants. Plant Physiol. 2008, 146, 1673–1686. [Google Scholar] [CrossRef] [Scilit]
- Nilsson, L.; Müller, R.; Nielsen, T.H. Increased expression of the MYB-related transcription factor, PHR1, leads to enhanced phosphate uptake in Arabidopsis thaliana. Plant Cell Environ. 2007, 30, 1499–1512. [Google Scholar] [CrossRef] [Scilit]
- Wang, Q.; Meng, Q.; Xu, F.; Chen, Q.; Ma, C.; Huang, L.; Li, G.; Luo, M. Comparative Metabolomics Analysis Reveals Sterols and Sphingolipids Play a Role in Cotton Fiber Cell Initiation. Int. J. Mol. Sci. 2021, 22, 11438. [Google Scholar] [CrossRef] [Scilit] [PubMed]
Disclaimer/Publisher’s Note: The statements, opinions and data contained in all publications are solely those of the individual author(s) and contributor(s) and not of MDPI and/or the editor(s). MDPI and/or the editor(s) disclaim responsibility for any injury to people or property resulting from any ideas, methods, instructions or products referred to in the content. |
© 2026 by the authors. Licensee MDPI, Basel, Switzerland. This article is an open access article distributed under the terms and conditions of the Creative Commons Attribution (CC BY) license.