


Abstract
Because fresh waxy maize is harvested as whole ears within the brief milk-stage (R3) window, its yield formation hinges on building a strong canopy and ear foundation before silking; nitrogen (N) applied afterward mainly provides supplementary support. A split-plot trial conducted in 2024–2025 in Xinjiang’s Ili River Valley used the cultivar Wannuo 2000 to test how fertigation-N scheduling and plant density jointly govern canopy function and marketable yield. Five N regimes, each supplying 300 kg N ha−1, were compared: conventional flood irrigation (CK) and drip fertigation split across three to six applications (DT-3 through DT-6), at densities of 79,500–88,500 plants ha−1. CK and DT differed in irrigation amount, and the highest planting density of 88,500 plants ha−1 was only set in 2025. Relative to DT-3, DT-5 sustained a larger canopy at R1 and a slower decline through R3, raising post-silking dry-matter accumulation by 24.9–25.8% over CK. Fresh-ear yield rose 10.8–11.8%, and the marketable-ear rate climbed from 81.4% to 87.7% (p < 0.001). Shifting 30% of N to after silking under DT-6, however, failed to offset a less balanced pre-/post-silking distribution: yield, marketable-ear rate, and net return all fell short of DT-5 by 478 kg ha−1, 1.37 percentage points, and 1301 CNY ha−1, respectively (p ≤ 0.026). Post-silking dry matter correlated positively with plot-level yield (r = 0.76), though this response to N scheduling weakened at the highest density (D × N, p < 0.001). These findings show that profitable fresh waxy maize production demands season-long coordination of N supply with crop demand, achieved jointly with density management, and that marketable-ear formation, not yield alone, should anchor how such strategies are judged.
1. Introduction
Abundant solar radiation, favorable thermal conditions, and the rapid spread of mulched drip irrigation and high-density planting have made Xinjiang, in northwestern China, a major maize-producing region. Precision systems built for grain maize here pair dense planting with stage-specific irrigation and N supply, lifting yield while improving N-use sustainability [1,2,3]. These gains offer a technical foundation for extending intensive drip-irrigated production to fresh waxy maize, a crop whose cultivation and mechanized processing are expanding quickly across the Ili River Valley. Yet management developed for grain maize cannot simply be carried over, since the two systems diverge in harvest timing, yield formation, and how the product is ultimately judged.
Fresh waxy maize (Zea mays L.) is harvested near the R3 milk stage and sold as whole ears, so its commercial value rests on ear size, kernel filling, and uniformity as much as on population yield [4,5]. Because the R3 window is narrow and harvest precedes physiological maturity, fresh-ear yield and marketability must largely be settled before harvest, leaving little room for late-season correction. The canopy and ear foundation established before silking sets the population’s capacity for light interception, assimilate production, and ear development, while post-silking growth chiefly sustains canopy function and carries ear filling through to completion. Practices that boost total biomass or mature-grain yield will not necessarily maximize marketable fresh-ear output.
Plant density governs much of this balance. Higher density improves population-level light capture and biomass, but also sharpens competition for light, water, and nutrients; pushed too far, it shrinks individual-plant growth, ear size, and filling uniformity, and ultimately drags down the marketable-ear rate [6,7,8]. Accordingly, fresh waxy maize is grown at lower densities than grain maize across China. But keeping density low for its own sake caps population productivity and squanders the benefits of intensive water and fertilizer management. The real production question, then, is not whether density should rise, but how population size and resource supply can be tuned together to secure productivity without sacrificing marketable-ear formation.
Drip fertigation offers a practical way to align N supply with crop demand across the season [9,10,11,12]. N delivered before and after silking serves related but distinct roles: pre-silking N drives canopy establishment, population-level biomass accumulation, and the build-out of the reproductive foundation, whereas post-silking N helps maintain green-leaf function, sustain photosynthesis, and support dry-matter and N accumulation as ears fill [13,14,15,16]. Well-timed N scheduling has been shown to improve lodging resistance, source–sink balance, and N accumulation, especially under high density [17,18,19,20,21]. Still, shifting more N to after silking cannot reliably make up for weak canopy and ear development beforehand; when the R1–R3 interval is short, late N mainly supplements an already-established source–sink system rather than substituting for the pre-silking groundwork.
Environmental stress and density further shape how much this timing matters. Post-silking water deficit accelerates leaf senescence and curbs photosynthesis in waxy maize, limiting the assimilate supply available for ear development [22]; appropriate N management can soften stress-related losses in photosynthesis and yield [23], and ample pre-silking N reserves help buffer subsequent water or N stress [24]. Green-leaf persistence and post-silking N accumulation are likewise sensitive to planting density [25,26,27]. Taken together, these results suggest that any given N schedule’s value depends on population structure and on the crop’s capacity to convert available N into functional canopy and marketable ears, so the operative question is not how many times N should be split, but whether its seasonal pattern tracks crop demand at a given density.
Earlier work has examined how density, total N rate, irrigation, or split N application affect maize yield and resource-use efficiency [8,9,10,11,12,17,18,19,20,21,28,29,30], but mostly frames split application in terms of application number or total N input, giving little attention to how N is redistributed between pre- and post-silking periods in fresh waxy maize specifically. Studies anchored in grain yield or total biomass can also miss the commercial stakes of density and N management when ears are harvested as early as R3. For fresh waxy maize, marketable-ear formation therefore deserves standing as a central evaluation criterion alongside fresh-ear yield and economic return.
A companion study at the same site and production period evaluated an integrated precision-management package, combining drip fertigation, split N application, and reduced irrigation, against conventional flood management [31]. That work established the package’s overall value for improving ear commercial traits, water and N productivity, and economic return, but its combined treatments could not isolate N scheduling’s individual contribution from that of irrigation management. The present study was carried out at the same experimental site and in the same growing seasons as our earlier companion study; keeping site, season, and total N input constant, it focuses on the temporal allocation of N rather than on split number alone, and examines how alternative fertigation-N schedules interact with plant density to shape canopy development, post-silking dry-matter accumulation, ear formation, marketable-ear rate, fresh-ear yield, resource productivity, and economic return of fresh waxy maize in Xinjiang. In this paper, the gradient nitrogen operation treatments of the DT-3 to DT-6 fertigation-N schedules were systematically analyzed for the first time, focusing on the regulatory effects of nitrogen distribution patterns in different growth stages on canopy development, dry matter accumulation, and yield formation after silking. Under the experimental conditions, the most favorable N-scheduling strategy was selected, and the relationship between nitrogen distribution ratio before and after silking and the source–sink relationship of waxy maize was clarified.
We hypothesized that (i) because fresh waxy maize is harvested within a short R3 window, a N schedule that adequately supports pre-silking canopy and ear establishment would provide a stronger basis for marketable production than one that shifts excessive N to the post-silking period; (ii) post-silking N would function primarily to maintain canopy function and support ear development rather than fully compensate for a weak pre-silking foundation; and (iii) N scheduling’s effects would depend on plant density, with the optimal combination determined by how population demand, seasonal N supply, and marketable-ear formation align. This framework guided our search for principles to jointly optimize plant density and N management in high-value fresh waxy maize production.
2. Materials and Methods
2.1. Site, Soil, and Climate
Field trials ran in 2024 and 2025 at the Yili Tianyi Agriculture Co. planting base in the Ili River Valley, Xinjiang, Northwest China (43°40′ N, 80°51′ E). The soil is a sandy loam; pre-sowing properties of the 0–30 cm layer were measured each year (Table S1). The growing season spanned 1 May to 20 August. Total precipitation reached 211.7 mm in 2024 and 213.4 mm in 2025, while mean daily air temperature was 24.0 °C and 25.9 °C, respectively (Figure S1). The two seasons therefore differed more in thermal conditions than in rainfall: mean temperature ran 1.9 °C higher in 2025 against nearly identical precipitation totals. The significant year effect on fresh-ear yield and marketable-ear rate may thus trace to differences in temperature distribution, developmental rate, and the timing of weather during silking and ear filling rather than to total rainfall; stage-specific weather data were not analyzed, so this interpretation remains indicative rather than causal.
2.2. Experimental Design
Both years used a split-plot design with three replications, planting density as the main plot and N management as the subplot. Densities were 79,500 (D1), 84,000 (D2), and 88,500 plants ha−1 (D3); D1 and D2 ran in both years, while D3 was added in 2025 only. Each 140 m2 subplot received one of five N-management regimes at identical total N, P2O5, and K2O inputs (300, 90, and 180 kg ha−1): CK, conventional flood irrigation with 45 kg ha−1 pre-plant N and the remaining 255 kg ha−1 topdressed once at V6; and DT-3 through DT-6, drip fertigation carrying the same pre-plant N but splitting the topdressing into three to six fertigations between V6 and R1 + 10 d (Table 1). Irrigation totaled 6000 m3 ha−1 for CK (flood, four events) versus 4500 m3 ha−1 for all DT treatments (drip, ten events), which is 25% less water.
Table 1.
Nitrogen and irrigation management under the five treatments: per-event N rates by growth stage, and the pre-/post-silking split of total N.
Because CK and the DT treatments differed simultaneously in irrigation method, water volume, N timing, and split frequency, we treat the CK–DT contrast as an integrated water–nitrogen management effect rather than isolating any single factor. The four DT treatments, by contrast, held irrigation method, water volume, and total N-P-K inputs constant, varying only in how the fertigation-N was distributed over time: the final application extended to R1 + 10 d under DT-6 alone, and the post-silking share of total N was 20% for DT-3, 0% for DT-4, 10% for DT-5, and 30% for DT-6, the last obtained by trimming the three mid-season per-event doses (V9 to V12 + 10 d) from 45/45/60 to 30/30/30 kg ha−1 and extending the final application to R1 + 10 d (Table 1). The DT-3–DT-6 series thus captures fertigation-N scheduling as a whole, split number together with per-event dose, timing of the last application, and pre-/post-silking allocation, rather than split frequency alone; we return to this distinction in the Discussion Section. A companion paper in Chinese [31] already reports the CK-versus-DT-5 comparison at this site, including ear commercial traits, water and N productivity, and economic return. The present paper instead analyzes the fertigation-N scheduling axis (DT-3 to DT-6) and the canopy and dry-matter processes underlying it, neither of which appeared in that earlier report; CK and DT-5 values are included here only as reference baselines.
The waxy maize cultivar Wannuo 2000 was sown on 2 May 2024 and 15 May 2025 and harvested at the milk stage (R3) on 8 August and 20 August, respectively. Plants were grown in wide–narrow rows (70/30 cm), with one drip tape centered in each narrow row under the DT treatments. Pest control and other management followed local high-yield practice. The 2024 and 2025 trials occupied different, adjacent fields.
2.3. Measurements
Canopy. Leaf area index (LAI) was determined at V6, V9, V12, R1, and R3 by measuring the length and maximum width of every leaf on five uniformly growing plants. Individual leaf area was estimated as length × maximum width × 0.75; mean per-plant leaf area was scaled to plot level by multiplying by the plant number per plot and dividing by the plot ground area. Leaf area duration (LAD, LAI-days) between consecutive stages was calculated by the trapezoidal method, and the percentage decline in LAI from R1 to R3 was calculated as (LAIR1 − LAIR3)/LAIR1 × 100%.
Dry matter. Aboveground biomass was sampled at R1 and R3 by organ (leaf, stem, ear, tassel). Post-silking dry matter accumulation (PAA) was calculated as R3 minus R1 biomass. Apparent pre-silking reserve remobilization was estimated from the decline in vegetative-organ dry matter between R1 and R3; in the absence of isotope evidence, this is an apparent rather than a directly measured quantity. The contribution of post-silking accumulation to ear dry matter was calculated on a remobilization basis (Table S6).
Yield and marketability. At R3, all ears within three fixed 2 m × 5 m quadrats per plot were harvested and harvested-ear and barren-plant numbers recorded per plot. Ears meeting the commercial grading standard, encompassing length 16–24 cm, diameter ≥ 4.0 cm, single-ear fresh weight ≥ 250 g, and free of severe pest damage or malformation, were classed as marketable; marketable-ear rate (%) = marketable ears/harvested ears × 100. Ear traits (length, diameter, bare-tip length, single-ear mass) were measured on 30 ears per plot selected by the mean-ear-weight method. This sampling was performed independently of the marketability classification, and the sample set included both marketable and non-marketable ears. Marketable fresh-ear yield was not weighed directly; we report marketable-ear number as the marketable-output variable and treat total fresh-ear yield × marketable-ear rate only as an estimated proxy, as noted in the text.
Resource productivity and economics. Irrigation water productivity (IWP, kg m−3) was fresh-ear yield divided by applied irrigation water, an irrigation-input index rather than an evapotranspiration-based water-use efficiency. Partial factor productivity of applied N (PFP_N, kg kg−1) was calculated by dividing the fresh-ear yield by the common 300 kg ha−1 N input; since the total N input did not vary among treatments, PFP_N essentially reflects differences in fresh-ear yield and is reported as a production-efficiency rather than an N-recovery metric. Economic analysis drew on plot-level records: gross revenue = marketable-ear number × wholesale price (0.70 CNY ear−1 in 2024; 0.80 CNY ear−1 in 2025); variable costs covered labor, irrigation water, seed, drip-equipment depreciation, machinery, fertilizer, plastic film, and pesticide (itemized in Table S5). Net return = gross revenue − total costs; output: input ratio = gross revenue/total costs.
2.4. Statistical Analysis
The primary analysis drew on the balanced two-year dataset, D1 and D2 across the five N regimes (n = 60 plots). Because D3 was tested only in 2025, its effects were examined separately in a supplementary 2025-only three-density analysis (n = 45) rather than pooled into the two-year model, where the resulting imbalance would distort interaction tests.
For the balanced dataset, split-plot ANOVA treated year (Y), density (D), and N treatment (N) as fixed factors, with randomization decomposed into three error strata: block (Y) (df = 4), against which Y was tested; the block × D (Y) main-plot error (df = 4), against which D and Y × D were tested; and the pooled block × N (Y × D) subplot error (df = 32), against which N and all N-involving interactions were tested. The 2025-only analysis followed the same structure (D: df = 2, error df = 4; N and D × N against subplot error, df = 24). Planned contrasts pitted DT-5 against DT-6, DT-4, DT-3, and CK, each tested against the subplot error; we report estimated marginal means (EMMs), 95% confidence intervals, and 5% LSD values (Table S10), with treatment means within density–year combinations separated by LSD. The four planned contrasts were pre-specified, each addressing a distinct single-degree-of-freedom question; no family-wise correction was applied to this contrast set, and 5% LSD values are reported alongside so that readers can apply alternative criteria. Because the estimated main-plot variance component sat at the boundary (ANOVA estimate ≤ 0), the D and Y × D tests and the key planned contrasts were cross-checked with a REML mixed model (Y × D × N fixed; Year:Block and Year:Block:Density random) using Satterthwaite degrees of freedom; in these fits the main-plot (Year:Block:Density) variance component was set to zero at the boundary (method-of-moments estimates were negative for all three key variables), while the Year:Block component remained positive (≈1.05 × 10⁵ for fresh-ear yield, 0.54 for marketable-ear rate, and 4.6 × 10⁵ for net return), and the cross-checks returned concordant results (DT-5 − DT-6: p = 0.021 for fresh-ear yield, p = 0.009 for marketable-ear rate). As further sensitivity checks, the DT-5-versus-DT-6 contrast was re-fitted to the full 75-plot dataset by REML with Satterthwaite degrees of freedom, and the marketable-ear rate was analyzed on raw, arcsine-square-root, and logit scales under the same split-plot error structure, with conclusions unchanged (p = 0.012, 0.011, and 0.012, respectively). On the original measurement scales, Shapiro–Wilk and Levene tests were satisfactory for fresh-ear yield (p = 0.31 and 0.85) but showed a marginal normality departure for marketable-ear rate (W = 0.96, p = 0.048) and heterogeneous variances for marketable-ear rate and net return (Levene p = 0.038 for both); variance heterogeneity was resolved on the logit and log scales (Levene p = 0.28 and 0.089), whereas the transformations did not uniformly improve normality, so the original-scale analyses were retained as primary, with all key conclusions unchanged across scales. To characterize the response to fertigation number beyond pairwise contrasts, linear-plus-plateau and quadratic models were fitted to fresh-ear yield and marketable-ear rate against fertigation number (3–6) using the balanced plot-level dataset. All analyses used Python (version 3.9; Python Software Foundation, Wilmington, USA) with statsmodels 0.14 and SciPy, and the mixed-model cross-check was run in R (version 4.6.1; R Foundation for Statistical Computing, Vienna, Austria) using lme4, lmerTest, and emmeans.
3. Results
3.1. Canopy Development and Post-Silking Dry Matter Accumulation
Canopy differences among the N-splitting regimes sharpened as the season advanced. In 2025, treatment effects on leaf area index (LAI) were modest through the early vegetative stages (V6–V9) but grew pronounced from V12 onward (Table S4). At R1, DT-5 reached an LAI of 5.43 at D1 and 5.47 at D2, 6.9–7.7% above DT-3 and 12.3–14.3% above CK. From R1 to R3, LAI fell 2.7–3.1% under DT-5 versus 4.6–5.4% under DT-3; CK declined 3.7–3.8%, but from a substantially lower R1 starting point. The gap between DT-5 and the other treatments thus reflected both a larger R1 canopy and greater post-silking canopy retention.
In the balanced two-year analysis, N-splitting regime and year both significantly affected R1 LAI (p < 0.01), while the density × N-splitting interaction was not significant (p > 0.05), indicating that the scheduling effect on R1 LAI held consistently across both densities, unmodified by density itself.
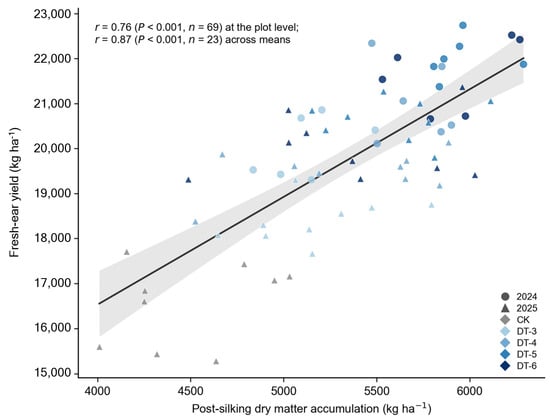
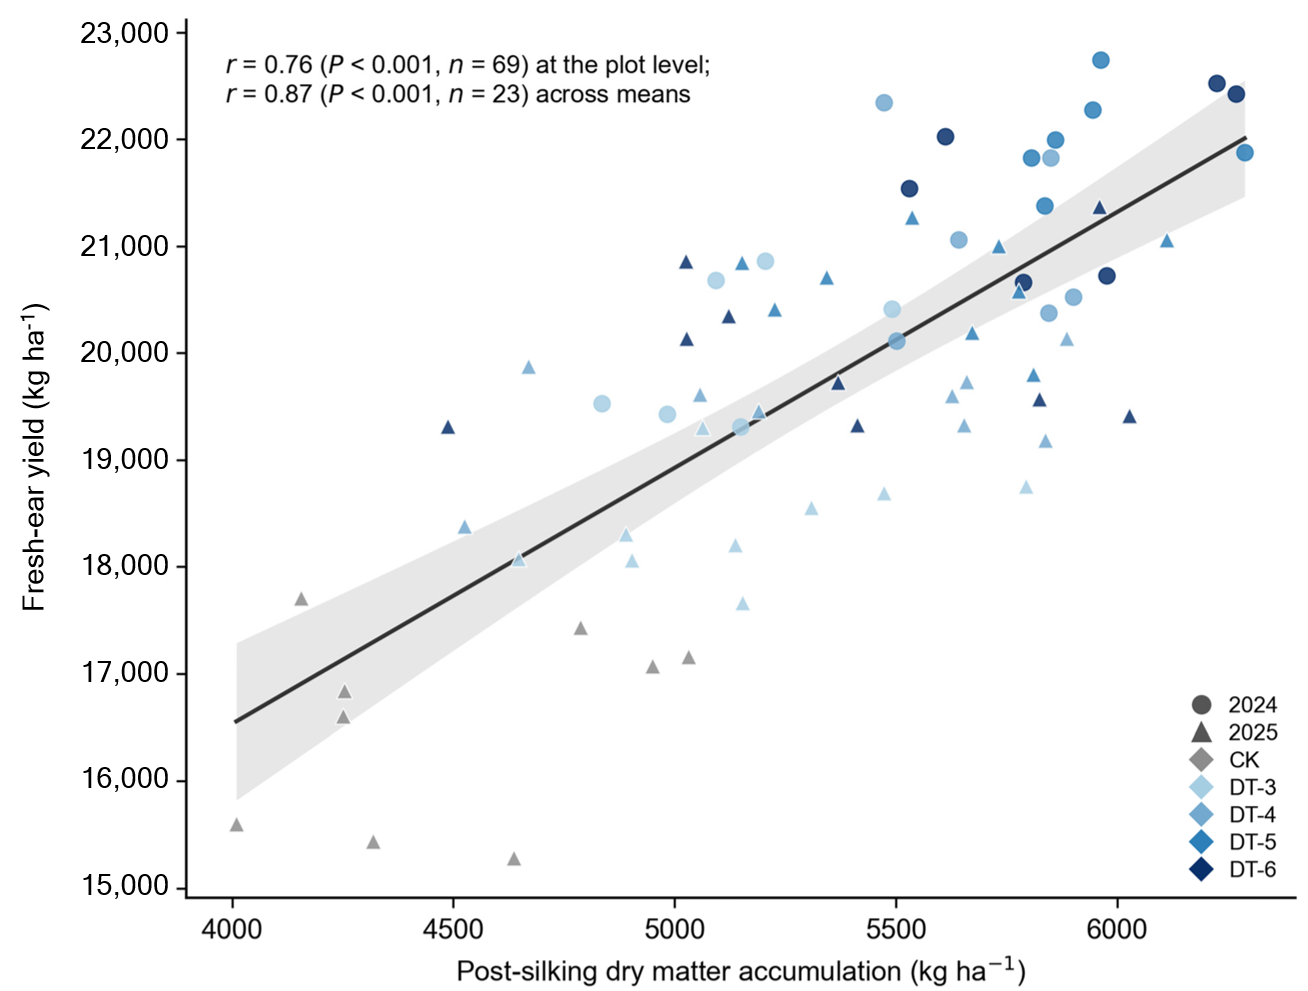
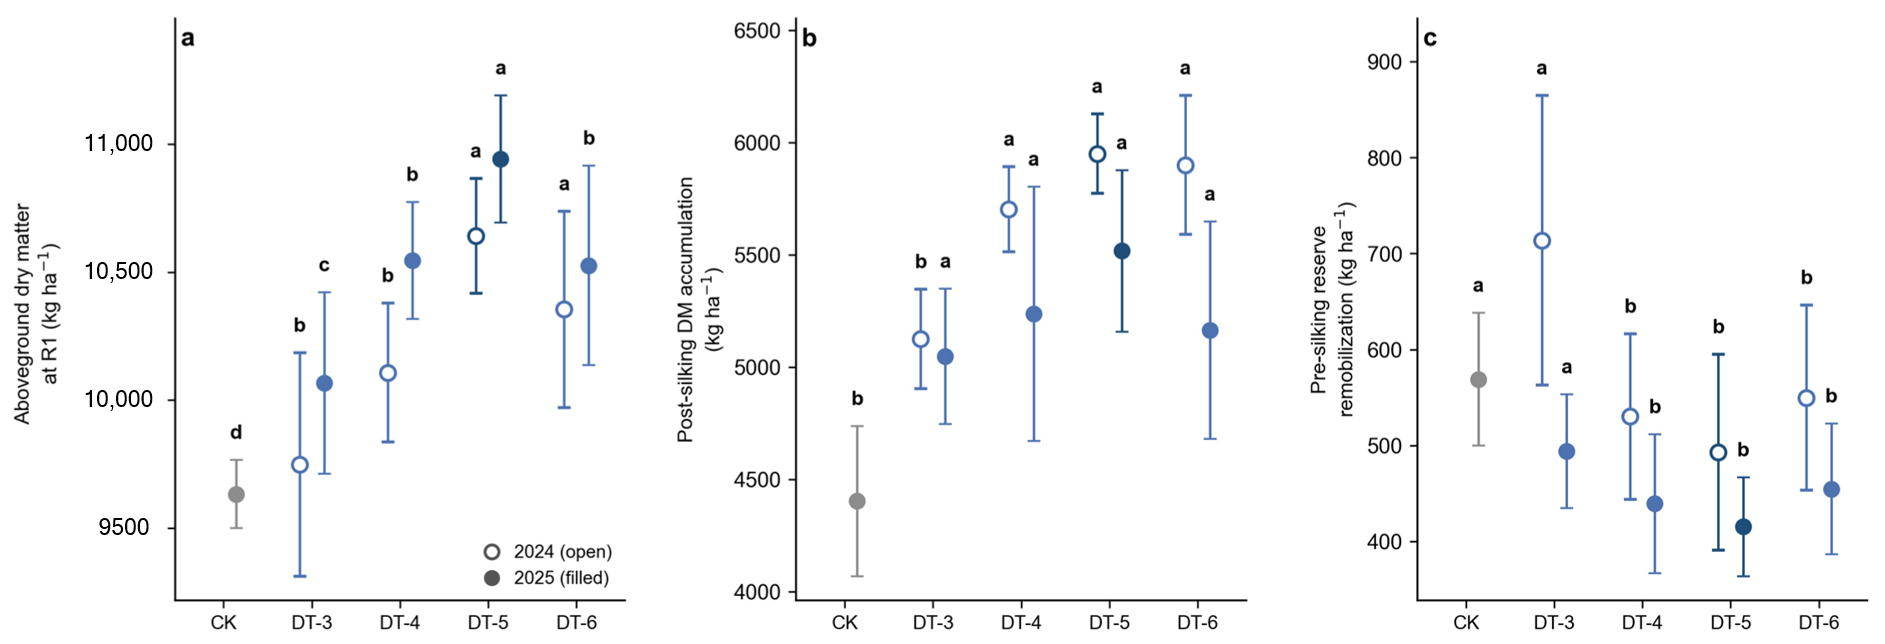
These canopy differences carried through to post-silking dry matter accumulation. Across the 23 density–year–treatment combinations with physiological measurements, post-anthesis accumulation (PAA) correlated strongly with fresh-ear yield (r = 0.87, p < 0.001; Figure 1). In 2025, DT-5 raised R3 aboveground biomass by 16.8–17.7% and PAA by 24.9–25.8% relative to CK (Table 2; Figure 2b). The share of ear dry matter attributable to post-silking accumulation reached 92.2–92.9% under DT-5 versus 85.8–87.4% under CK, a gain of 4.7–6.4 percentage points, whereas the apparent contribution of pre-silking reserve remobilization did not rise across the tested regimes and even trended slightly downward as splitting frequency increased.
Figure 1.
Post-silking dry matter accumulation (PAA) versus fresh-ear yield at the plot level (n = 69; circles, 2024; triangles, 2025; colors denote N treatment; CK and the D3 density appear in 2025 only). The solid line is the ordinary least-squares fit with its 95% CI band: r = 0.76 (p < 0.001) at the plot level, rising to r = 0.87 (p < 0.001) across the 23 density–year–treatment means.
Table 2.
Aboveground dry matter and post-silking accumulation.
Figure 2.
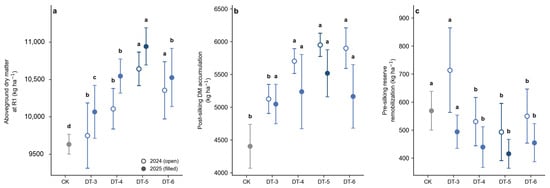
Canopy and dry-matter responses to fertigation-N scheduling across both seasons (open symbols, 2024; filled, 2025; D1/D2 means ± SD, n = 6; CK present in 2025 only): (a) aboveground dry matter at R1; (b) post-silking dry matter accumulation (PAA, R3−R1); (c) apparent pre-silking reserve remobilization (DMR). The density × N interaction was non-significant for every year–variable combination (p ≥ 0.26); within each year, density-pooled means sharing no letter differ at p < 0.05 (LSD test).
Together, these results point to DT-5′s yield advantage arising chiefly from stronger post-silking canopy persistence and dry matter accumulation rather than enhanced remobilization of pre-silking reserves, consistent with hypothesis (i).
3.2. Fresh-Ear Yield and Marketable-Ear Formation
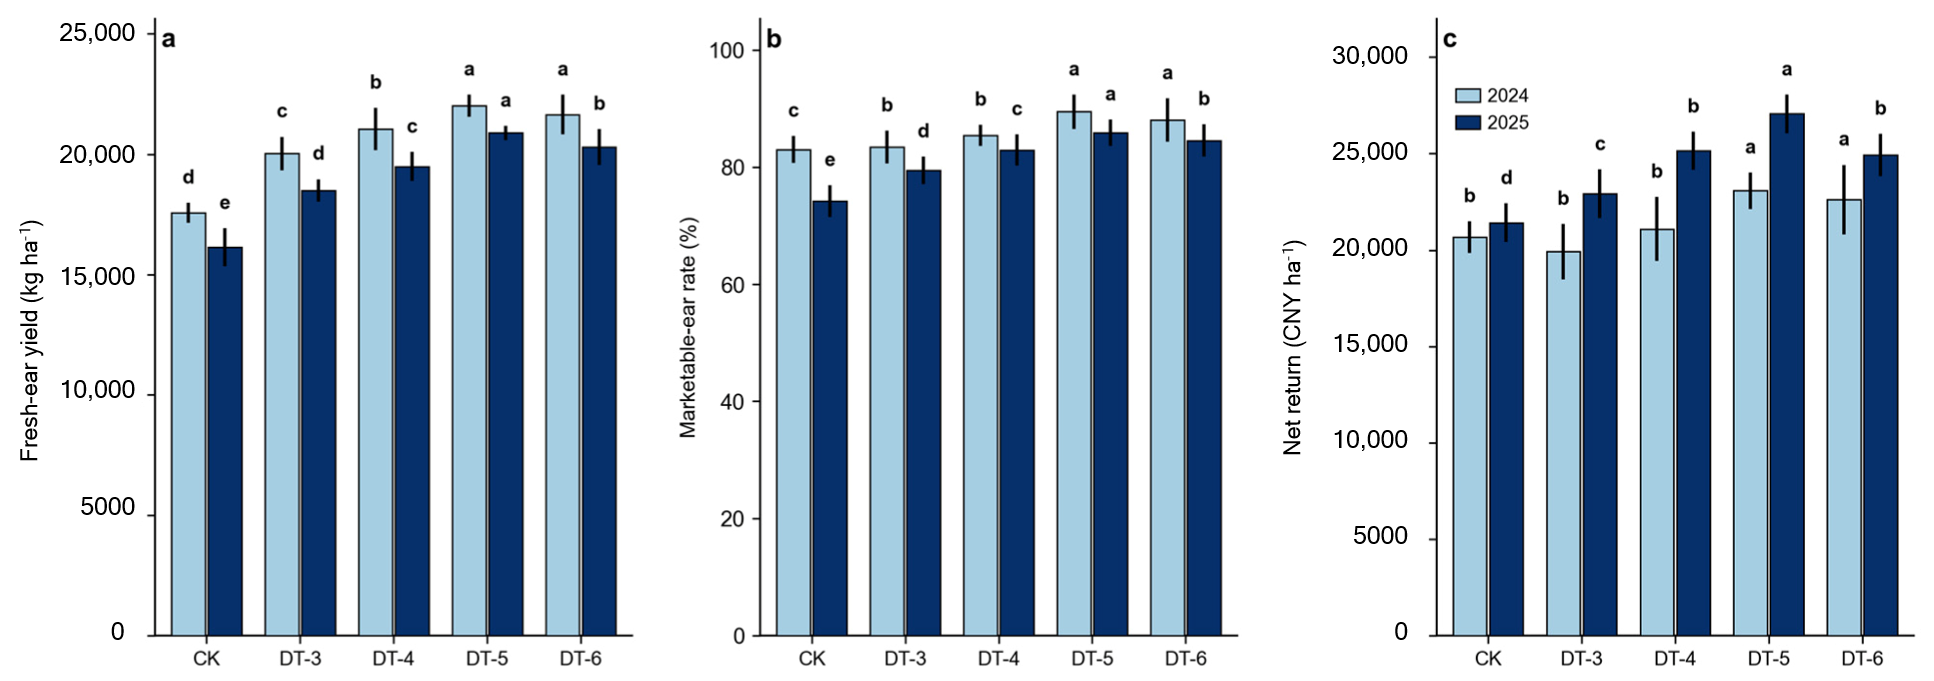
Marketable-ear number and marketable-ear rate, the primary marketable-output variables, responded strongly to N management. Averaged across D1/D2 and both years, marketable-ear rate rose from 78.6% (CK) and 81.4% (DT-3) to 86.3% (DT-6) and 87.7% (DT-5); DT-5 exceeded CK by 6.3–12.1 percentage points across the four balanced density–year combinations and exceeded DT-6 by 1.37 points (95% CI 0.33–2.41; p = 0.012) (Figure 3b; Table 3). Marketable-ear number peaked at 60,364–63,254 ears ha−1 under DT-5 at D1. Barren plant number rose with density but fell with N splitting (EMMs: 4197 plants ha−1 under CK versus 3140 under DT-5; both p < 0.05; Table S3), and DT-5 also produced the heaviest single-ear mass, longest ears, widest diameter, and shortest bare tip (Table S2).
Figure 3.
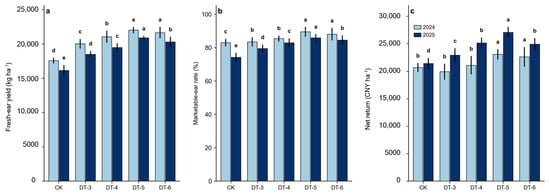
Fresh-ear yield (a), marketable-ear rate (b), and net return (c) in the balanced two-year dataset (D1/D2, 2024–2025; n = 60 plots). Bars give treatment means pooled across the two densities (±SD, n = 6); pale bars, 2024; dark bars, 2025. Within each year and panel, means topped by different letters differ at p < 0.05 (LSD test on the split-plot subplot error, df = 16). The density × N interaction was significant for yield in 2025 (p = 0.007); that year’s letters compare density-averaged means (see Table 3 for within-density comparisons). Density effects themselves are not annotated.
Table 3.
Fresh-ear yield, ear number, marketable-ear number, and marketable-ear rate (plot means; n = 3).
Total fresh-ear yield tracked the same pattern (Table S8; Figure 3a). In the balanced two-year analysis, N treatment dominated the variance (F = 158.4, p < 0.001); density was statistically significant (F = 15.8, p = 0.017; p = 0.012 against the pooled error in the mixed-model cross-check) but added only 332 kg ha−1 at D2 over D1, an order of magnitude below the N effect. No two-way interaction involving N reached significance, and the three-way interaction was borderline (p = 0.058; p = 0.044 under the mixed-model cross-check) (Table S8). Averaged across D1/D2 and both years, yields were CK 16,857, DT-3 19,269, DT-4 20,266, DT-6 20,973, and DT-5 21,451 kg ha−1, with every pairwise difference significant (5% LSD = 417 kg ha−1; Table 3). Within the fertigated series, DT-5 outyielded DT-3 by 10.8–11.8% as two-year means at each density (8.9–15.0% across the four balanced density–year combinations) and exceeded DT-4 by 1185 kg ha−1 (p < 0.001); the sixth fertigation, conversely, cost DT-6 478 kg ha−1 relative to DT-5 (95% CI 61–895; p = 0.026). A linear-plus-plateau model fitted to the balanced plot-level data placed the join point at DT-5 (plateau 21,258 kg ha−1; R2 = 0.96); marketable-ear rate traced the same curve (81.4, 84.2, 87.7, and 86.3% from DT-3 to DT-6). From DT-3 to DT-6, the response therefore peaked at DT-5 rather than rising monotonically. Relative to the conventional reference (CK; integrated contrast), DT-5 raised yield by 15.8–34.1% across the four balanced density–year combinations (two-year means: +30.2% at D1, +24.5% at D2) and achieved the highest yield in all five density–year combinations. The DT-5–DT-6 gap reached significance in two of those five combinations (2025 D1: +984 kg ha−1, p = 0.022; 2025 D3: +756 kg ha−1, p = 0.004) and in the pooled two-year analysis; a REML sensitivity model across all 75 plots confirmed the direction with a larger effect size (−534 kg ha−1 for the sixth split; 95% CI 198–869; p = 0.002). DT-6 entered R1 with lower aboveground biomass than DT-5 in all five density–year combinations (by 138–695 kg ha−1; Table 2), a deficit that persisted or widened by R3. Model uncertainty supported a cautious reading: the linear-plus-plateau join point was estimated at 4.8 fertigations (95% CI 3.95–5.59), and the quadratic vertex was estimated at 5.2 (95% CI 4.36–6.14), with the two models statistically indistinguishable (ΔAIC < 0.1); within the tested 3–6 range, the response therefore peaked near DT-5, but five applications should not be read as a precisely identified biological optimum.
3.3. Resource Productivity and Economic Return
Cutting seasonal irrigation from 6000 to 4500 m3 ha−1 under drip management lifted irrigation water productivity (IWP) substantially under DT-5 relative to CK, by 54.4–78.8% across the density–year combinations. Because total N input was fixed at 300 kg ha−1 across treatments, partial factor productivity of N (PFPN) simply mirrored the fresh-ear yield pattern, ranging from 51.5 kg kg−1 under CK (2025, D1) to 73.4 kg kg−1 under DT-5 (2024, D1).
Net return peaked under DT-5, ranging from 22,677 to 27,691 CNY ha−1 across the evaluated combinations, with a two-year mean of 25,584 CNY ha−1 at D1 (Table 4), an 11.2–28.2% gain over CK. Within the DT-3–DT-6 series, DT-5′s net return exceeded DT-6′s by 1301 CNY ha−1 (95% CI 448–2154; p = 0.004), with DT-5 ahead in four of the five density–year combinations.
Table 4.
Net return by treatment, year, and density (plot means; CNY ha−1).
The DT-6, in short, brought no further gain in fresh-ear yield, marketable-ear rate, or net return, and it trailed DT-5 on all three measures. Within the tested range of fertigation-N schedules, DT-5 therefore offered the more favorable combination of yield, marketable-ear formation, and economic return. The CK-versus-fertigated contrasts capture the integrated water–N management effect already reported in the companion study [31], whereas the DT-3–DT-6 series compares overall fertigation-N scheduling regimes, reflecting the combined effects of split frequency and the pre-/post-silking N distribution ratio.
3.4. Supplementary Analysis Across Three Planting Densities
Extending the analysis to include D3 revealed significant effects of planting density and the density × N-splitting interaction on fresh-ear yield in 2025 (density: F (2,4) = 13.09, p = 0.018; density × N-splitting: F = 9.74, p < 0.001; Table S8; Figure S2). The DT-5–DT-3 yield gap was 2018 kg ha−1 at D1, 2751 kg ha−1 at D2, and 1984 kg ha−1 at D3, indicating that the response to the fertigation-N schedule was not uniform across densities.
Density also reshaped the conventional and fertigated systems differently. Under CK, fresh-ear yield climbed from 15,441 to 17,435 kg ha−1 as density rose from D1 to D3, whereas DT-5 yield held within a narrower 20,193–21,061 kg ha−1 band across the same range. The DT-5-over-CK advantage accordingly shrank from 34.1% at D1 to 15.8% at D3, a product of the two systems’ diverging density responses rather than DT-5′s advantage growing with population size.
Marketable-ear rate moved in the opposite direction. At D3, it fell below the D1 and D2 values under both CK and DT-5: CK dropped to 68.7% at D3 against 71.8–76.7% at the lower densities, and DT-5 fell to 78.3% against 83.9–87.9%. This decline occurred even though population LAI and aboveground biomass at D3 matched or exceeded those at D1 and D2 (Figure S2), implying that the highest density boosted crop-level biomass without a matching gain in individual-ear marketability. The 2025 data thus lend partial support to hypothesis (ii), though this density-dependent pattern warrants caution, as D3 was evaluated in only one year; conclusions about the density × N-splitting interaction should accordingly be read as specific to the 2025 season rather than generalized across years.
4. Discussion
4.1. Disentangling the Effects of Fertigation-N Scheduling from Those of Irrigation and Total N Input
A companion study at the same site and across the same experimental years evaluated an integrated precision-management system, including drip fertigation, split N application, higher planting density, and a 25% cut in irrigation input, against conventional flood-irrigated management. That integrated system raised marketable-ear number and marketable-ear rate and improved irrigation water productivity, partial factor productivity of applied N, and net return [31]. But because several management components shifted simultaneously relative to the conventional control, that comparison established the package’s overall value without isolating any single component’s contribution.
The present study offers a sharper test of fertigation-N scheduling specifically: irrigation method, irrigation volume, and total N input were held constant across the DT treatments, with only the timing, number, and size of individual N applications varied. Within this common drip-fertigation framework, DT-5 lifted two-year fresh-ear yield by 10.8–11.8% over DT-3 and raised marketable-ear rate by 6.3 percentage points. These gains are agronomically substantial compared with the broader contrasts between integrated drip-fertigation treatments and conventional management: 23.9–34.1% for fresh-ear yield and 6.3–12.1 percentage points for marketable-ear rate. The two sets of effects cannot be partitioned additively, but together they indicate that N’s temporal distribution within an already-established drip-fertigation system contributed materially to gains in fresh-ear production and marketability. Where drip infrastructure is already in place, further productivity gains may hinge less on total N input than on matching N supply to crop demand across the pre- and post-silking periods.
Variation among the fertigation-N schedules dwarfed the average density effect in the balanced two-year dataset: fresh-ear yield spanned 4594 kg ha−1 across N schedules against an overall density difference of just 332 kg ha−1. These figures are not directly comparable measures of statistical effect size, but they point to fresh-ear production being particularly sensitive to N timing within the density range tested here. Comparable patterns appear in drip-fertigated grain maize, where N management substantially shaped canopy development, assimilate production, and source–sink relations across moderate density ranges [19,20,32].
The non-linear response across the DT schedules also echoes grain-maize evidence that yield gains can plateau once N supply is well synchronized with crop demand under integrated water-and-fertilizer management [28]. Earlier work has further shown that post-silking N can sustain canopy function and source–sink coordination during reproductive growth, particularly under dense planting [18,21]. Our results extend this principle to fresh waxy maize harvested at R3, where management performance must be judged not just by biomass or area yield but by marketable-ear formation.
4.2. Post-Silking Canopy Persistence and Dry Matter Accumulation
Canopy size at silking and canopy persistence thereafter emerge as related but distinct components of fresh-ear yield formation. Among the drip-fertigated treatments, DT-5 carried a larger leaf area at silking (R1) and a smaller relative decline from R1 to R3 than DT-3 (2.7–3.1% versus 4.6–5.4%), whereas CK’s decline rate (3.7–3.8%) was comparable to DT-5’s despite an 11.0–12.5% smaller R1 leaf area. This pattern suggests conventional management’s canopy constraint came mainly from limited pre-silking development, while differences among fertigation-N schedules appeared more in post-silking persistence. The weak correlation between relative leaf-area decline and fresh-ear yield across treatments (r = 0.08) also showed that canopy persistence mattered only relative to the canopy size established at silking; a slow rate of decline offers little benefit when starting leaf area was limited. This aligns with earlier work showing canopy size, leaf longevity, and stay-green traits to be closely related yet functionally distinct contributors to maize productivity [13,14,25,26,27].
The dry-matter data point to the same conclusion about sustained post-silking growth. DT-5 outpaced CK in post-silking dry-matter accumulation, with post-silking accumulation contributing 4.8–7.1 percentage points more to ear dry matter under DT-5, while apparent remobilization of pre-silking dry matter showed no consistent increase across the fertigation-N schedules. Post-silking dry-matter accumulation also correlated positively with fresh-ear yield (r = 0.87). Together, these results suggested the greater fresh-ear yield under DT-5 was accompanied by a larger leaf area index at the R1 stage, sustained leaf area retention through R3, and enhanced post-silking dry matter accumulation. These covariations are consistent with the hypothesized pathway that improved canopy maintenance and post-silking carbon gain support ear growth and marketable yield formation [15,16]. Post-silking dry matter accumulation is an integrative growth index; although it aligns with the expectation of higher photosynthetic input, it alone cannot confirm photosynthesis as the causal driver or reveal specific carbon allocation pathways. In addition, the correlation between post-silking dry matter accumulation and fresh-ear yield is descriptive and does not statistically control for the shared effects of year, planting density, and nitrogen scheduling treatment. Observations are not statistically independent because plots within the same year, density, or treatment share common environmental and management drivers. Therefore, these correlation values may overestimate the strength of the direct association between post-silking dry matter accumulation and fresh-ear yield.
Post-silking growth likely carries outsized weight in fresh waxy maize precisely because harvest falls near R3. The R1–R3 interval spans rapid kernel development and ear growth and is therefore tightly linked to single-ear weight, kernel filling, bare-tip formation, and marketable-ear quality [33,34]. The heavier single ears, shorter bare tips, and higher marketable-ear rate under DT-5 align with its greater post-silking dry-matter accumulation, suggesting that a favorable balance between pre-silking canopy establishment and post-silking canopy maintenance supported ear development through the period that chiefly determines marketable yield. That said, our measurements cannot fully resolve the underlying carbon and N processes: apparent remobilization was inferred from organ dry-mass changes rather than measured by isotope tracing or direct assimilate-transport data [13], and DT-5′s larger R1 canopy may also have carried greater pre-silking C and N reserves that themselves fed post-silking ear growth [24]. Without measurements of plant N uptake, tissue N concentration, or leaf- or canopy-level photosynthesis, the relative contributions of current assimilation versus reserve remobilization remain uncertain. These findings nonetheless underscore the importance of coordinating pre-silking canopy establishment with post-silking persistence and dry-matter production across R1–R3; clarifying the underlying physiological mechanisms will require direct measurement of plant N dynamics and canopy carbon assimilation.
4.3. Stage-Specific N Allocation for Fresh Waxy Maize
Fresh-ear yield responded non-monotonically to the fertigation-N schedules, with DT-5 outperforming DT-6 on fresh-ear yield, marketable-ear rate, and net return alike. Relative to DT-5, DT-6 cut fresh-ear yield by 478 kg ha−1 (p = 0.026), marketable-ear rate by 1.4 percentage points (p = 0.012), and net return by 1301 CNY ha−1 (p = 0.004); a comparable 534 kg ha−1 gap (p = 0.002) held when all three density treatments were included. This consistency across yield, marketability, and economic return suggests DT-6’s shortfall was not confined to one response variable but reflected an unfavorable balance between N supplied during pre-silking canopy and reproductive development and N supplied afterward.
This pattern speaks directly to how fresh-ear and grain production systems differ. In grain maize, sustaining green leaf area after silking can extend assimilate supply across a relatively long grain-filling period. Fresh waxy maize, by contrast, is harvested near R3, typically just 2–3 weeks after silking in this production system, leaving little time for additional post-silking dry-matter accumulation. Marketable-ear formation instead depends on processes beginning before silking and running through early kernel development: establishing reproductive potential, building an adequately sized and physiologically active canopy, and then supplying enough assimilate and N after silking to carry kernel development and ear growth forward.
The treatment design and crop responses bear this out. Relative to DT-5, DT-6 trimmed the three mid-season N applications (V9 through V12 + 10 d) from 45/45/60 to 30/30/30 kg N ha−1, shifting the freed 60 kg N ha−1 to R1 and R1 + 10 d, raising the post-silking share of total N from 10% under DT-5 to 30% under DT-6 while the pre-silking share fell from 90% to 70%. DT-6 carried lower aboveground biomass at R1 across all five density–year combinations (138–695 kg ha−1 lower), with R1 leaf area following the same pattern; this gap persisted or widened by R3 in every combination, and post-silking dry-matter accumulation was also lower under DT-6 in four of the five. In short, the larger post-silking N share did not offset the smaller canopy and weaker dry-matter base built before silking. We did not measure plant N uptake, tissue N concentration, or leaf photosynthetic performance, so these results cannot pin down the physiological mechanism directly, but they do show that shifting a substantial share of N from pre- to post-silking was not advantageous under these conditions. Without a factorial design that independently manipulates split frequency and nitrogen partitioning ratio, we cannot disentangle whether the benefits of DT-5 originate from the number of splits, the particular pre-/post-silking nitrogen allocation, or their interaction. Future factorial trials are warranted to separate these two factors explicitly.
Ear-trait responses reinforce this reading. DT-6 produced more barren plants and a lower marketable-ear rate in all five density–year combinations, and lower single-ear mass in the 2024 comparisons. In combination with the largest yield gap, DT-6 yielded 3891 fewer harvested ears ha−1 than DT-5, a 5.7% shortfall. The yield response thus tracked differences in both canopy development and ear formation: reduced pre-silking biomass and leaf area signal a weaker production base, while the added barren plants, fewer ears, and lighter single-ear mass show that ear establishment and subsequent growth suffered too. That said, DT-6 differed from DT-5 in both the size of the mid-season applications and the timing of the redistributed N, so this design cannot separate the effects of reduced mid-season dosing from those of delayed application. The results should accordingly be read as the response to DT-6′s integrated scheduling pattern, not as proof that the sixth application or late N timing alone drove the yield loss.
The DT-3–DT-5–DT-6 contrast offers a broader window onto the optimal schedule for this system. Yield rose from DT-3 to DT-5 before falling under DT-6, and both the linear-plus-plateau and quadratic models placed the response peak at DT-5. DT-5′s edge came with a greater pre-silking N share, a more evenly distributed mid-season supply, and a comparatively modest R1 application; raising the post-silking share to 30% under DT-6, conversely, coincided with lower R1 biomass and weaker fresh-ear performance. Under the tested conditions, then, the most favorable schedule weighted N toward canopy establishment and reproductive development before silking while retaining a modest post-silking input to sustain canopy function, kernel development, and ear growth. This does not mean prolonging post-silking leaf function has no value in fresh waxy maize; it means its contribution is limited by the short silking-to-R3 interval and the need to establish adequate source and sink capacity beforehand. The relevant management task for this crop is thus coordinating three processes in time: reproductive development before silking, a sufficiently large and functional canopy by silking, and continued assimilation and N supply through the brief post-silking window of kernel development.
The economic results track the agronomic ones. In fresh-ear production, revenue hinges on the number and quality of marketable ears rather than on grain mass at physiological maturity, so any drop in ear number, marketable-ear rate, or single-ear mass feeds directly into gross return. DT-6′s extra fertigation event entailed no additional input cost within this system, as water, fertilizer, labor, and machinery inputs were identical across the DT-3–DT-6 series, but it likewise brought no compensating gain in yield or marketability. Within this production system, at a plant density of 79,500 plants ha−1, DT-5 struck the best balance among pre-silking crop establishment, post-silking ear development, and economic return. N scheduling for fresh waxy maize should therefore track the timing of marketable-ear formation and the length of the fresh-ear harvest window, rather than borrowing directly from grain-maize strategies built around prolonging grain fill. The economic analysis in this study was calculated based on local fertilizer price, manual fertilization labor cost, and the prevailing fresh waxy ear market price during the experimental years. It should be noted that the income level of the DT-5 nitrogen operation scheme is affected by input cost and market price fluctuations, and it needs to be comprehensively judged by combining local cost and market conditions before it is extended to large-scale production.
4.4. Density Contingency, Marketability as the Optimization Criterion, and Boundaries
The 2025 three-density trial showed that the N-scheduling response depended on plant density (D × N interaction, p < 0.001). DT-5′s yield advantage over DT-3 was smallest at the highest density, 88,500 plants ha−1 (+1984 kg ha−1), against 2018–2751 kg ha−1 at the two lower densities, and the fertigated-versus-conventional yield gap likewise narrowed from 34.1% at D1 to 15.8% at D3. This convergence stemmed chiefly from rising CK yield as density increased, while fertigated yield tended to plateau at the highest density. Yet the accompanying rise in population-level LAI and aboveground biomass at D3 brought no gain in marketable-ear rate, consistent with the population-versus-individual trade-off typical of fresh waxy maize: greater density builds stand-level canopy but intensifies interplant competition for light and assimilate, constraining individual ear initiation and growth, an effect that shading-driven shifts in canopy microclimate and plant morphogenesis may compound further [6,7]. A larger population canopy, in other words, does not automatically translate into more marketable ears.
The weakening N-scheduling response at high density further suggests that density and N management should be treated as interacting rather than independent levers. At moderate density, a well-chosen N schedule can strengthen canopy establishment and ear development enough to produce a sizable yield gain; at high density, interplant competition and each plant’s reduced capacity to convert added N into a marketable ear likely cap that same benefit. This reading aligns with evidence that density compensation grows progressively less effective under precision water–fertilizer management in oasis agroecosystems [35], echoes earlier calls to jointly optimize density and N supply in waxy maize [6], and matches reported interactions between density and post-silking canopy senescence in grain maize [25,26]. The two-year combined averages reported in this study mainly reflect treatment effects at the D1 and D2 densities, which supports the advantages of DT-5. However, the density × nitrogen interaction was detected only in the 2025 dataset containing D3. Further evaluation across more growing seasons, field sites, and cultivars is necessary to verify the interactive responses between planting density and nitrogen scheduling strategy, especially before extending the high-density treatment to large-scale commercial production. In practice, refining the fertigation-N schedule paid off most at moderate density and least at the highest density tested, so the optimal schedule should be set jointly with plant population rather than as a standalone decision.
These findings also bear on how agronomic optimum should be defined. Grain maize typically evaluates management against total grain yield or final dry-matter production, but in fresh waxy maize, total fresh-ear yield alone understates production value, since ears falling short of market standards contribute little or nothing to revenue. Here, marketable-ear rate, single-ear mass, and bare-tip length responded more sharply to density and N scheduling than total fresh-ear yield did in several comparisons, traits that speak more directly to the number and quality of ears actually available for sale. Optimizing fresh waxy maize production should therefore weigh marketable output, including marketable-ear rate and the principal quality attributes, rather than relying on aggregate fresh-ear yield alone [4,5]. Total yield remains an important indicator, but should be read alongside marketability and ear-quality traits when identifying the agronomic and economic optimum.
A few methodological and contextual caveats merit note. First, the CK-versus-fertigated comparison is an integrated water-and-N contrast, not an isolated N effect; the DT-3–DT-6 comparisons, made within the fertigated series under a common irrigation regime, supply the proper basis for evaluating N-scheduling responses specifically. Second, irrigation water productivity (IWP) was calculated as an input-based efficiency index without incorporating evapotranspiration or soil-water-balance data, a production-per-unit-irrigation measure rather than a direct estimate of crop water-use efficiency or field-scale hydrology [9,36]; partial factor productivity of N (PFP_N) likewise reflects fresh-ear output per unit of applied N and should not be equated with N recovery or agronomic N-use efficiency [20]. Third, the trial covered a single cultivar at a single site across two seasons; physiological measurements were unavailable for the conventional control in 2024, the highest density (D3) was tested in only one season, and soil mineral-N dynamics, including residual nitrate and nitrification, went unmonitored. These gaps limit direct inference about N-uptake and soil-N-supply mechanisms. Because the 2024 and 2025 trials occupied different, albeit adjacent, fields, the year effect reported here cannot be statistically separated from field-specific effects and should be interpreted as a combined year-and-site effect. Accordingly, validation across additional environments, cultivars, sowing dates, and soil-N backgrounds is needed before extending these recommendations beyond the present system, consistent with the multi-environment validation framework already established for maize production in northwestern China [12].
5. Conclusions
For R3-harvested fresh waxy maize, N management should rest on coordinating N supply with crop demand across the whole season. Adequate pre-silking N is essential for building a productive canopy and reproductive potential, while post-silking N should serve mainly to support kernel development, fresh-ear growth, and canopy function. Adding more late-season N cannot fully offset insufficient pre-silking development, especially given the short interval between silking and harvest. The optimum strategy, then, is defined not by maximizing total N input or application number, but by matching N supply to the crop’s developmental needs at each growth stage.
Plant density and N management likewise need to be optimized together rather than separately. Higher density can boost population-level biomass and leaf area, but it also intensifies interplant competition and can erode individual ear development and marketability. Management optimization should therefore weigh total fresh-ear yield alongside marketable-ear rate, ear quality, and economic return. These findings support a production framework that evaluates stage-specific N supply, plant population, and marketable-ear formation jointly. The recommended nitrogen scheduling strategy in this study was evaluated under a single cultivar, location, and fixed total nitrogen application rate. Further validation across cultivars, environments, soil-N conditions, and planting dates will be needed to establish how broadly these principles apply.
Supplementary Materials
The following supporting information can be downloaded at https://www.mdpi.com/article/10.3390/agronomy16212198/s1. Figure S1. Daily weather across the 2024–2025 growing seasons. Figure S2. Density contingency in 2025: (a) fresh-ear yield and (b) marketable-ear rate at 79,500 (D1), 84,000 (D2), and 88,500 (D3) plants ha−1. Bars show treatment means (±SD, n = 3); within each density, means topped by different letters differ at p < 0.05 (LSD test on the split-plot subplot error, df = 24), with density effects left unannotated. (c) DT-5−DT-3 fresh-ear yield increment at each density (bars ± SE of the difference; every increment significant at p < 0.05). Table S1. Pre-sowing soil properties (0–30 cm). Table S2. Ear traits at harvest (2024 only; ear-trait records were not taken in 2025). Table S3. Barren plant number (plants ha−1). Table S4a. Leaf area index across five stages (2024: DT treatments only, since CK lacked physiological sampling that year; 2025: all treatments). Table S4b. Leaf area duration between consecutive stages. Table S5. Economic detail (means of three replications; 104 CNY ha−1). Table S6. Apparent pre-silking dry-matter remobilization and post-silking accumulation (2024: DT treatments only; 2025: all treatments). Table S7. Analysis of variance (F, with p in parentheses) for aboveground dry matter at R1 and R3, post-silking accumulation (PAA), and PAA/R3. Table S8. Analysis of variance (F, with p in parentheses) for fresh-ear yield, harvested ear number, marketable-ear number, and marketable-ear rate. Table S9. Analysis of variance (F, with p in parentheses) for net return. Table S10. Estimated marginal means (EMMs) with 95% confidence intervals and pre-specified planned contrasts for fresh-ear yield, marketable-ear rate, and net return.
Author Contributions
Conceptualization, B.M.; methodology, B.M. and J.L.; validation, J.L., W.D. and Y.T.; formal analysis, J.L.; investigation, J.L., Q.L. (Qi Liu), B.L. and Q.L. (Qiang Liu); resources, W.D., Y.T., Y.W., J.X., H.R. and Z.H.; data curation, J.L.; writing—original draft preparation, J.L.; writing—review and editing, B.M., H.Y. and S.L.; visualization, J.L.; supervision, B.M. and S.L.; project administration, B.M.; funding acquisition, S.L. All authors have read and agreed to the published version of the manuscript.
Funding
This study was funded by the Xinjiang Uygur Autonomous Region Key R&D Program (2023B02041-2), the earmarked fund for the China Agriculture Research System (CARS-02), and the Agricultural Science and Technology Innovation Program (CAAS-ZDRW202004).
Data Availability Statement
The original contributions presented in this study are included in the article/Supplementary Material. Further inquiries can be directed to the corresponding author.
Conflicts of Interest
The authors declare no conflicts of interest.
References
- Zhou, B.; Sun, X.; Ding, Z.; Ma, W.; Zhao, M. Multisplit Nitrogen Application via Drip Irrigation Improves Maize Grain Yield and Nitrogen Use Efficiency. Crop Sci. 2017, 57, 1687–1703. [Google Scholar] [CrossRef] [Scilit]
- Liu, M.; Liang, F.; Li, Q.; Wang, G.; Tian, Y.; Jia, H. Enhancement Growth, Water Use Efficiency and Economic Benefit for Maize by Drip Irrigation in Northwest China. Sci. Rep. 2023, 13, 8392. [Google Scholar] [CrossRef] [Scilit] [PubMed]
- Mastrodomenico, A.T.; Haegele, J.W.; Seebauer, J.R.; Below, F.E. Yield Stability Differs in Commercial Maize Hybrids in Response to Changes in Plant Density, Nitrogen Fertility, and Environment. Crop Sci. 2018, 58, 230–241. [Google Scholar] [CrossRef] [Scilit]
- Zhang, W.Q.; Fan, Y.L.; Zhang, S.; Lu, B.S.; Duan, L.S.; Li, Z.H.; Tan, W.M. Waxy maize yield in response to a novel plant growth regulator and plant density. Int. J. Agric. Biol. 2019, 22, 304–312. [Google Scholar]
- Wang, Z.H.; Niu, S.D.; Yao, X.Y.; Chen, G.Q.; Guo, J.; Li, G.H.; Lu, D.L. Grain yield and nutrient uptake and utilization in spring-sown waxy maize under varying plant densities and fertilization regimes. J. Integr. Agric. 2025, in press. [Google Scholar] [CrossRef] [Scilit]
- Jiang, C.X.; Yu, J.N.; Liu, H.T.; Li, N.; Liu, E.K. Balancing individual trade-offs for population gain: Optimizing nitrogen and density secures fresh-ear yield in rain-fed waxy maize. Front. Plant Sci. 2026, 17, 1831472. [Google Scholar] [CrossRef] [Scilit] [PubMed]
- Pierik, R.; de Wit, M. Shade avoidance: Phytochrome signalling and other aboveground neighbour detection cues. J. Exp. Bot. 2014, 65, 2815–2824. [Google Scholar] [CrossRef] [Scilit] [PubMed]
- Xie, L.; Su, B.-J.; Zhang, Y.-N.; Zhang, D.-S.; Han, J.-J.; Li, H.-M.; Feng, W.-J.; Du, T.-Q.; Cui, F.-Z.; Xue, J.-F. Optimizing plant density and row spacing enhances growth, yield and quality of waxy maize on the Loess Plateau. Plants 2025, 14, 2902. [Google Scholar] [CrossRef] [Scilit] [PubMed]
- Guo, Q.; Huang, G.M.; Guo, Y.L.; Zhang, M.C.; Zhou, Y.Y.; Duan, L.S. Optimizing irrigation and planting density of spring maize under mulch drip irrigation system in the arid region of Northwest China. Field Crops Res. 2021, 266, 108141. [Google Scholar] [CrossRef] [Scilit]
- Zhang, G.Q.; Liu, C.W.; Xiao, C.H.; Xie, R.Z.; Ming, B.; Hou, P.; Liu, G.Z.; Xu, W.J.; Shen, D.P.; Wang, K.R.; et al. Optimizing water use efficiency and economic return of super high yield spring maize under drip irrigation and plastic mulching in arid areas of China. Field Crops Res. 2017, 211, 137–146. [Google Scholar] [CrossRef] [Scilit]
- Fernandez, J.A.; Nippert, J.B.; Prasad, P.V.V.; Messina, C.D.; Ciampitti, I.A. Post-Silking 15N Labelling Reveals an Enhanced Nitrogen Allocation to Leaves in Modern Maize (Zea Mays) Genotypes. J. Plant Physiol. 2022, 268, 153577. [Google Scholar] [CrossRef] [Scilit] [PubMed]
- He, H.; Hu, Q.; Li, R.; Pan, X.; Huang, B.; He, Q. Regional Gap in Maize Production, Climate and Resource Utilization in China. Field Crops Res. 2020, 254, 107830. [Google Scholar] [CrossRef] [Scilit]
- Ning, P.; Li, S.; Yu, P.; Zhang, Y.; Li, C.J. Post-silking accumulation and partitioning of dry matter, nitrogen, phosphorus and potassium in maize varieties differing in leaf longevity. Field Crops Res. 2013, 144, 19–27. [Google Scholar] [CrossRef] [Scilit]
- Kosgey, J.R.; Moot, D.J.; Fletcher, A.L.; McKenzie, B.A. Dry matter accumulation and post-silking N economy of ‘stay-green’ maize (Zea mays L.) hybrids. Eur. J. Agron. 2013, 51, 43–52. [Google Scholar] [CrossRef] [Scilit]
- Shao, H.; Wu, X.; Duan, J.; Zhu, F.; Chi, H.; Liu, J.; Shi, W.; Xu, Y.; Wei, Z.; Mi, G. How Does Increasing Planting Density Regulate Biomass Production, Allocation, and Remobilization of Maize Temporally and Spatially: A Global Meta-Analysis. Field Crops Res. 2024, 315, 109430. [Google Scholar] [CrossRef] [Scilit]
- Li, R.F.; Hu, D.D.; Ren, H.; Yang, Q.L.; Dong, S.T.; Zhang, J.W.; Zhao, B.; Liu, P. How delaying post-silking senescence in lower leaves of maize plants increases carbon and nitrogen accumulation and grain yield. Crop J. 2022, 10, 853–863. [Google Scholar] [CrossRef] [Scilit]
- Ahmad, I.; Ahmad, S.; Yang, X.N.; Meng, X.P.; Yang, B.P.; Liu, T.; Han, Q.F. Effect of Uniconazole and Nitrogen Level on Lodging Resistance and Yield Potential of Maize under Medium and High Plant Density. Plant Biol. 2021, 23, 485–496. [Google Scholar] [CrossRef] [Scilit] [PubMed]
- Deng, T.; Wang, J.H.; Gao, Z.; Shen, S.; Liang, X.G.; Zhao, X.; Chen, X.M.; Wu, G.; Wang, X.; Zhou, S.L. Late split-application with reduced nitrogen fertilizer increases yield by mediating source–sink relations during the grain filling stage in summer maize. Plants 2023, 12, 625. [Google Scholar] [CrossRef] [Scilit] [PubMed]
- Hisse, I.R.; D’Andrea, K.E.; Otegui, M.E. Source-Sink Relations and Kernel Weight in Maize Inbred Lines and Hybrids: Responses to Contrasting Nitrogen Supply Levels. Field Crops Res. 2019, 230, 151–159. [Google Scholar] [CrossRef] [Scilit]
- Ciampitti, I.A.; Vyn, T.J. Physiological Perspectives of Changes over Time in Maize Yield Dependency on Nitrogen Uptake and Associated Nitrogen Efficiencies: A Review. Field Crops Res. 2012, 133, 48–67. [Google Scholar] [CrossRef] [Scilit]
- Mueller, S.M.; Vyn, T.J. Can Late-Split Nitrogen Application Increase Ear Nitrogen Accumulation Rate During the Critical Period in Maize? Crop Sci. 2018, 58, 1717–1728. [Google Scholar] [CrossRef] [Scilit]
- Ye, Y.X.; Wen, Z.R.; Yang, H.; Lu, W.P.; Lu, D.L. Effects of post-silking water deficit on the leaf photosynthesis and senescence of waxy maize. J. Integr. Agric. 2020, 19, 2216–2228. [Google Scholar] [CrossRef] [Scilit]
- Song, X.-D.; Irshad, A.; Zhang, H.-M.; Zhang, Z.-L.; Zhou, G.-F.; Chen, G.-Q.; Mao, Y.-X.; Lu, H.-H.; Hao, D.-R. Low nitrogen with split application strategy enhances antioxidative defense, photosynthesis, and enzymatic activities to waxy maize under heat stress. J. Plant Growth Regul. 2025, 44, 4798–4819. [Google Scholar] [CrossRef] [Scilit]
- Nasielski, J.; Earl, H.; Deen, B. Luxury vegetative nitrogen uptake in maize buffers grain yield under post-silking water and nitrogen stress: A mechanistic understanding. Front. Plant Sci. 2019, 10, 318. [Google Scholar] [CrossRef] [Scilit] [PubMed]
- Zhang, L.L.; Zhou, X.L.; Fan, Y.; Fu, J.; Hou, P.; Yang, H.L.; Qi, H. Post-silking nitrogen accumulation and remobilization are associated with green leaf persistence and plant density in maize. J. Integr. Agric. 2019, 18, 1882–1892. [Google Scholar] [CrossRef] [Scilit]
- Antonietta, M.; Fanello, D.D.; Acciaresi, H.A.; Guiamet, J.J. Senescence and yield responses to plant density in stay green and earlier-senescing maize hybrids from Argentina. Field Crops Res. 2014, 155, 111–119. [Google Scholar] [CrossRef] [Scilit]
- Chibane, N.; Revilla, P.; Yannam, V.R.R.; Marcet, P.; Covelo, E.F.; Ordás, B. Impact of irrigation, nitrogen fertilization, and plant density on stay-green and its effects on agronomic traits in maize. Front. Plant Sci. 2024, 15, 1399072. [Google Scholar] [CrossRef] [Scilit] [PubMed]
- Ning, P.; Fritschi, F.B.; Li, C. Temporal Dynamics of Post-Silking Nitrogen Fluxes and Their Effects on Grain Yield in Maize under Low to High Nitrogen Inputs. Field Crops Res. 2017, 204, 249–259. [Google Scholar] [CrossRef] [Scilit]
- Gao, X.J.; Li, G.H.; Lu, W.P.; Lu, D.L. Effects of mixing controlled-release and normal urea on yield, nitrogen absorption and utilization in waxy maize. J. Plant Nutr. Fert. 2022, 28, 1614–1625. (In Chinese) [Google Scholar]
- Fu, F.B.; Li, F.S.; Kang, S.Z. Alternate partial root-zone drip irrigation improves water- and nitrogen-use efficiencies of sweet-waxy maize with nitrogen fertigation. Sci. Rep. 2017, 7, 17256. [Google Scholar] [CrossRef] [Scilit] [PubMed]
- Lü, J.Y.; Ding, W.H.; Liu, Q.; Zhang, P.P.; Tang, Y.; Ren, H.S.; Xue, J.; Ming, B.; Li, S.K. Effects of precision regulation technology for dense planting on commercial quality of fresh waxy maize in Xinjiang. Crops 2026, 3, 64–70. (In Chinese) [Google Scholar]
- Lai, Z.L.; Liao, Z.Q.; Kong, H.; Liu, Y.Y.; Kou, H.T.; Wang, K.C.; Li, Z.J.; Fan, J.L. Optimized planting density and nitrogen improve grain yield and water productivity in drip-fertigated maize through improved canopy function and source–sink balance. Front. Plant Sci. 2026, 17, 1740500. [Google Scholar] [CrossRef] [Scilit] [PubMed]
- Yang, H.; Gu, X.T.; Ding, M.Q.; Lu, W.P.; Lu, D.L. Weakened carbon and nitrogen metabolisms under post-silking heat stress reduce the yield and dry matter accumulation in waxy maize. J. Integr. Agric. 2020, 19, 78–88. [Google Scholar] [CrossRef] [Scilit]
- Wang, J.; Fu, P.X.; Lu, W.P.; Lu, D.L. Application of moderate nitrogen levels alleviates yield loss and grain quality deterioration caused by post-silking heat stress in fresh waxy maize. Crop J. 2020, 8, 1081–1092. [Google Scholar] [CrossRef] [Scilit]
- Fan, H.; Yin, W.; Hu, F.L.; Fan, Z.L.; Zhao, C.; Yu, A.Z.; He, W.; Sun, Y.L.; Wang, F.; Chai, Q. Compensation potential of dense planting for maize yield under reduced nitrogen fertilizer in an oasis irrigation area. Sci. Agric. Sin. 2024, 57, 1709–1721. (In Chinese) [Google Scholar] [CrossRef]
- Ma, Y.N.; Yang, S.J.; Ding, R.S.; Du, T.S.; Kang, S.Z.; Tong, L. Mild water deficit under reasonable dense planting ensures maize yield and improves water use efficiency by coordinating source–sink relationship. Field Crops Res. 2025, 327, 109888. [Google Scholar] [CrossRef] [Scilit]

Disclaimer/Publisher’s Note: The statements, opinions and data contained in all publications are solely those of the individual author(s) and contributor(s) and not of MDPI and/or the editor(s). MDPI and/or the editor(s) disclaim responsibility for any injury to people or property resulting from any ideas, methods, instructions or products referred to in the content. |
© 2026 by the authors. Licensee MDPI, Basel, Switzerland. This article is an open access article distributed under the terms and conditions of the Creative Commons Attribution (CC BY) license.