


Abstract
In agricultural disease images, lesions often exhibit large-scale variations, irregular shapes, gradual boundary transitions, and high texture similarity to surrounding backgrounds. These characteristics make models prone to insufficient lesion-body response, biased contextual discrimination, and unstable contour localization during segmentation. To address the fine-grained segmentation difficulties caused by imbalanced regional representation, semantic discrimination, and boundary constraints, this paper proposes DHB-DeepLabV3+, an agricultural disease image segmentation model. Based on lightweight feature extraction, the proposed model further organizes lesion segmentation beyond pixel-wise classification by jointly modeling lesion regions, contextual semantics, and boundary structures, thereby improving the completeness and boundary stability of disease regions in complex scenes. The proposed model was evaluated on three datasets, including a rice disease dataset, a leaf disease dataset, and the PlantSeg dataset. Across five independent runs, DHB-DeepLabV3+ achieved mean mIoU values of 88.45%, 82.52%, and 81.72% on the rice disease, leaf disease, and PlantSeg datasets, respectively, with corresponding standard deviations of 0.26, 0.35, and 0.38 percentage points. The lightweight version reduced the number of parameters to 6.67 M and the computational cost to 2.36 GFLOPs, and it was deployed on an RK3568 edge device for validation. Experimental results show that the proposed method achieves stable segmentation performance and has potential for edge-device application in complex agricultural disease segmentation scenarios.
1. Introduction
Recent advances in artificial intelligence have promoted plant disease analysis from traditional image-level recognition toward more comprehensive intelligent agricultural applications, including disease detection, severity assessment, localization, and pixel-level segmentation. Deep learning-based approaches have shown promising potential for early disease diagnosis and quantitative evaluation of crop health status, providing important support for precision agriculture and crop management decisions [1,2]. However, practical agricultural environments introduce various challenges, including heterogeneous backgrounds, illumination variations, and differences in disease appearance across crops and growth conditions. These factors can significantly affect the robustness of vision models when applied to real-world scenarios. Meanwhile, the increasing demand for real-time agricultural applications has further promoted the development of efficient and lightweight vision models with reduced computational costs for resource-constrained devices [3]. In addition, with the increasing demand for reliable AI-assisted agricultural decision-making, model interpretability has also become an important consideration, encouraging the development of approaches that can provide visual evidence in addition to accurate predictions [4].
Within this broader AI-based agricultural analysis framework, pixel-level disease segmentation remains one of the most challenging tasks because it requires not only disease recognition but also precise delineation of lesion regions and boundaries. The difficulty of agricultural disease segmentation is not due to insufficient feature extraction alone, but rather the lack of sufficient coordination between lesion scale response, contextual semantic discrimination, and boundary structure constraints [5,6,7,8]. The model needs to have sensitivity to small regions, discriminative ability for complex contexts, and the ability to characterize fuzzy boundaries [9,10]. In the task of semantic segmentation of agricultural diseases, DeepLabV3+ introduces a lightweight decoder based on dilated convolution and dilated spatial pyramid pooling structure, which can better adapt to the characteristics of obvious scale changes and easy loss of boundary details in agricultural disease segmentation. Therefore, it is suitable as a basic framework for agricultural disease segmentation [11]. However, in real agricultural segmentation scenarios, DeepLabV3+ still has certain limitations [12,13,14]. Its ASPP branches usually independently extract features at different scales, and there is a lack of sufficient interaction between these features before fusion; the decoding stage mainly relies on simple concatenation to restore spatial information, making it difficult to adaptively bridge the gap between semantic context and spatial details [15]. Meanwhile, under the supervision of conventional loss functions, the model is more susceptible to being dominated by the overall pixel classification results, with insufficient constraints on fuzzy boundaries and low-confidence regions, further affecting the stability of lesion boundary localization [16].
To improve the applicability of the DeepLabV3+ model in agricultural disease segmentation, researchers have attempted to strengthen lesion representation by modifying network architectures and incorporating attention mechanisms. Zhou et al. [17] redesigned the atrous spatial pyramid pooling (ASPP) module by incorporating a conditional selection mechanism, which dynamically suppresses irrelevant background noise and strengthens the model’s attention to disease regions. Zeng and He [18] used CBAM-RepViT as the backbone network to enhance channel-wise and spatial feature extraction in the rice disease segmentation task, and introduced a lightweight upsampling operator CARAFE in the decoder to effectively improve the reconstruction quality of edge details. Xu et al. [19] addressed the segmentation challenge of cotton wilt disease in complex field environments by introducing a parameter-free 3D attention mechanism SimAM to enhance the perception of disease spots, adding an intelligent and zero-cost feature filter to the DeepLabV3+ model. Ding et al. [20] attempted to introduce a dynamic dilation rate prediction and adjustment mechanism in the ASPP module to tackle the issues of small lesion areas and variable morphology in apple leaf lesion segmentation.
In addition to improvements in feature expression, the loss function and supervision method also affect the learning performance of the model for small lesions, fuzzy boundaries, and difficult-to-distinguish pixels. Nasiri et al. [21] applied a weighted fusion of Dice loss and focal loss to the weed segmentation task in sugar beet fields, doing so in order to enhance the model’s learning ability for small targets and difficult-to-distinguish pixels. Wang et al. [22] designed a weight compression loss by introducing a modulation factor before the cross entropy loss to alleviate the optimization offset caused by the imbalance between foreground and background pixels. Fan et al. [23] proposed dynamic stage weighted loss DPW-Loss, which adjusts the weights of different loss items according to the training stage, gradually shifting the model from learning from the base region to refining the boundaries. Feng et al. [24] proposed a decoupled boundary-aware hybrid loss, which separately models the region loss and boundary loss to strengthen the supervision of lesion boundary regions. Sun et al. [25] introduced gradient-guided boundary prediction and a boundary-aware selective scanning mechanism from the perspective of feature modeling to enhance feature representation in uncertain boundary regions, demonstrating the importance of explicit boundary priors for refining plant disease lesion contours.
Although existing studies have focused on feature enhancement and boundary guidance, most works still separate scale representation, hierarchical detail restoration, and boundary constraints, making it difficult to form continuous modeling for lesion structural integrity in the same segmentation process. To address these issues, we propose DHB-DeepLabV3+, an agricultural disease image segmentation model based on DeepLabV3+. By enhancing the synergistic expression among lesion regions, semantic details, and ambiguous boundaries, the proposed model improves the completeness and boundary stability of disease regions in complex scenarios.
The proposed method provides the following contributions:
- A Dynamic Gated Feature Interaction (DGFI) module is designed to enhance the ASPP structure, enabling multi-scale contextual features to undergo information interaction and adaptive screening before fusion, thereby improving the model’s capability to represent lesions with varying scales.
- A decoding enhancement strategy consisting of a Hierarchical Gated Context Aggregation (HGCA) module and a Boundary-Aware Feature Enhancement (BAFE) module is constructed to establish more effective associations among semantic context, spatial details, and boundary structures, alleviating issues of incomplete lesion regions and insufficient edge details under complex backgrounds.
- An Enhanced Boundary-Sensitive Loss (EBS Loss) is proposed, which leverages multi-scale boundary priors and prediction uncertainty to strengthen constraints on ambiguous boundaries and easily confused pixels. The effectiveness and application feasibility of the model are validated through multi-dataset experiments, lightweight evaluation, and deployment on an RK3568 edge device.
2. Materials and Methods
2.1. Data Collection and Preprocessing
In order to evaluate the segmentation performance of DHB-DeepLabV3+ on datasets representing different agricultural disease segmentation scenarios, this paper selected the rice disease dataset [26] (CC BY 4.0), the leaf disease dataset (CC0: Public Domain), and the PlantSeg large-scale field plant disease segmentation dataset [27] (CC BY-NC-ND 4.0) for experiments. These three datasets correspond to single-crop diseases, multiple types of leaf diseases, and complex multi-crop scenarios, respectively. The model was trained and tested separately on each dataset to assess within-dataset segmentation performance under different dataset characteristics.
Independence between the training and test subsets at the plant, leaf, or acquisition-session level could not be verified, particularly for the rice disease dataset containing offline augmented samples. Potential dependence between related samples may affect the extent to which the reported scores reflect generalization to independent samples. All methods were trained and evaluated using the same dataset partitions and experimental settings, providing a consistent basis for comparing segmentation performance within the adopted benchmark protocol.
2.1.1. Rice Disease Dataset
The rice disease dataset comprises 1991 image–mask pairs covering two diseases: brown spot and rice tungro disease. This study used the dataset in its originally released form, which already includes offline augmented samples generated using photometric distortion, perspective transformation, and scale transformation. The augmentation was balanced across the two disease classes. We retained the fixed split provided with the dataset, comprising 1592 training samples and 399 test samples. No additional online data augmentation was applied during model training.
2.1.2. Leaf Disease Dataset
The leaf disease dataset contains 588 original images, which were divided into training and test sets at an approximate ratio of 8:2, comprising 470 and 118 images, respectively. The dataset also provides augmented samples generated from the training set, expanding it to 2350 images in total, while the test set remains unchanged and contains only the 118 original images. Because augmentation was applied only to the training set, the test set contains no augmented samples. Consequently, neither the original test images nor their augmented derivatives are included in the training set. No additional online data augmentation was applied during training.
2.1.3. PlantSeg Dataset
The PlantSeg dataset contains 11,458 images with pixel-level disease annotations, covering 34 host plants and 115 disease categories. The images were obtained from online sources and depict real-world field conditions, with variations in background, illumination, viewpoint, and lesion scale. This study followed the predefined partition provided with the dataset: the test set was stratified by disease category, with 20% of the images in each category selected for testing, resulting in 2295 test images; the remaining 9163 images were used for model training. The PlantSeg dataset was used in its original released form, without offline data augmentation before data partitioning. Therefore, no cross-set samples derived from offline augmentation were present in the training and test sets.
2.1.4. Image Preprocessing
All images underwent uniform size scaling to pixels and channel normalization before being fed into the network. This fixed resolution was adopted to standardize input conditions across datasets and comparison methods and to control the computational and memory demands of training and inference.
2.2. DHB-DeepLabV3+
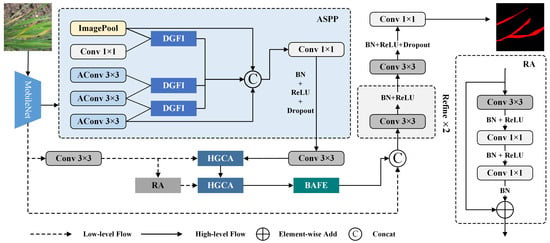
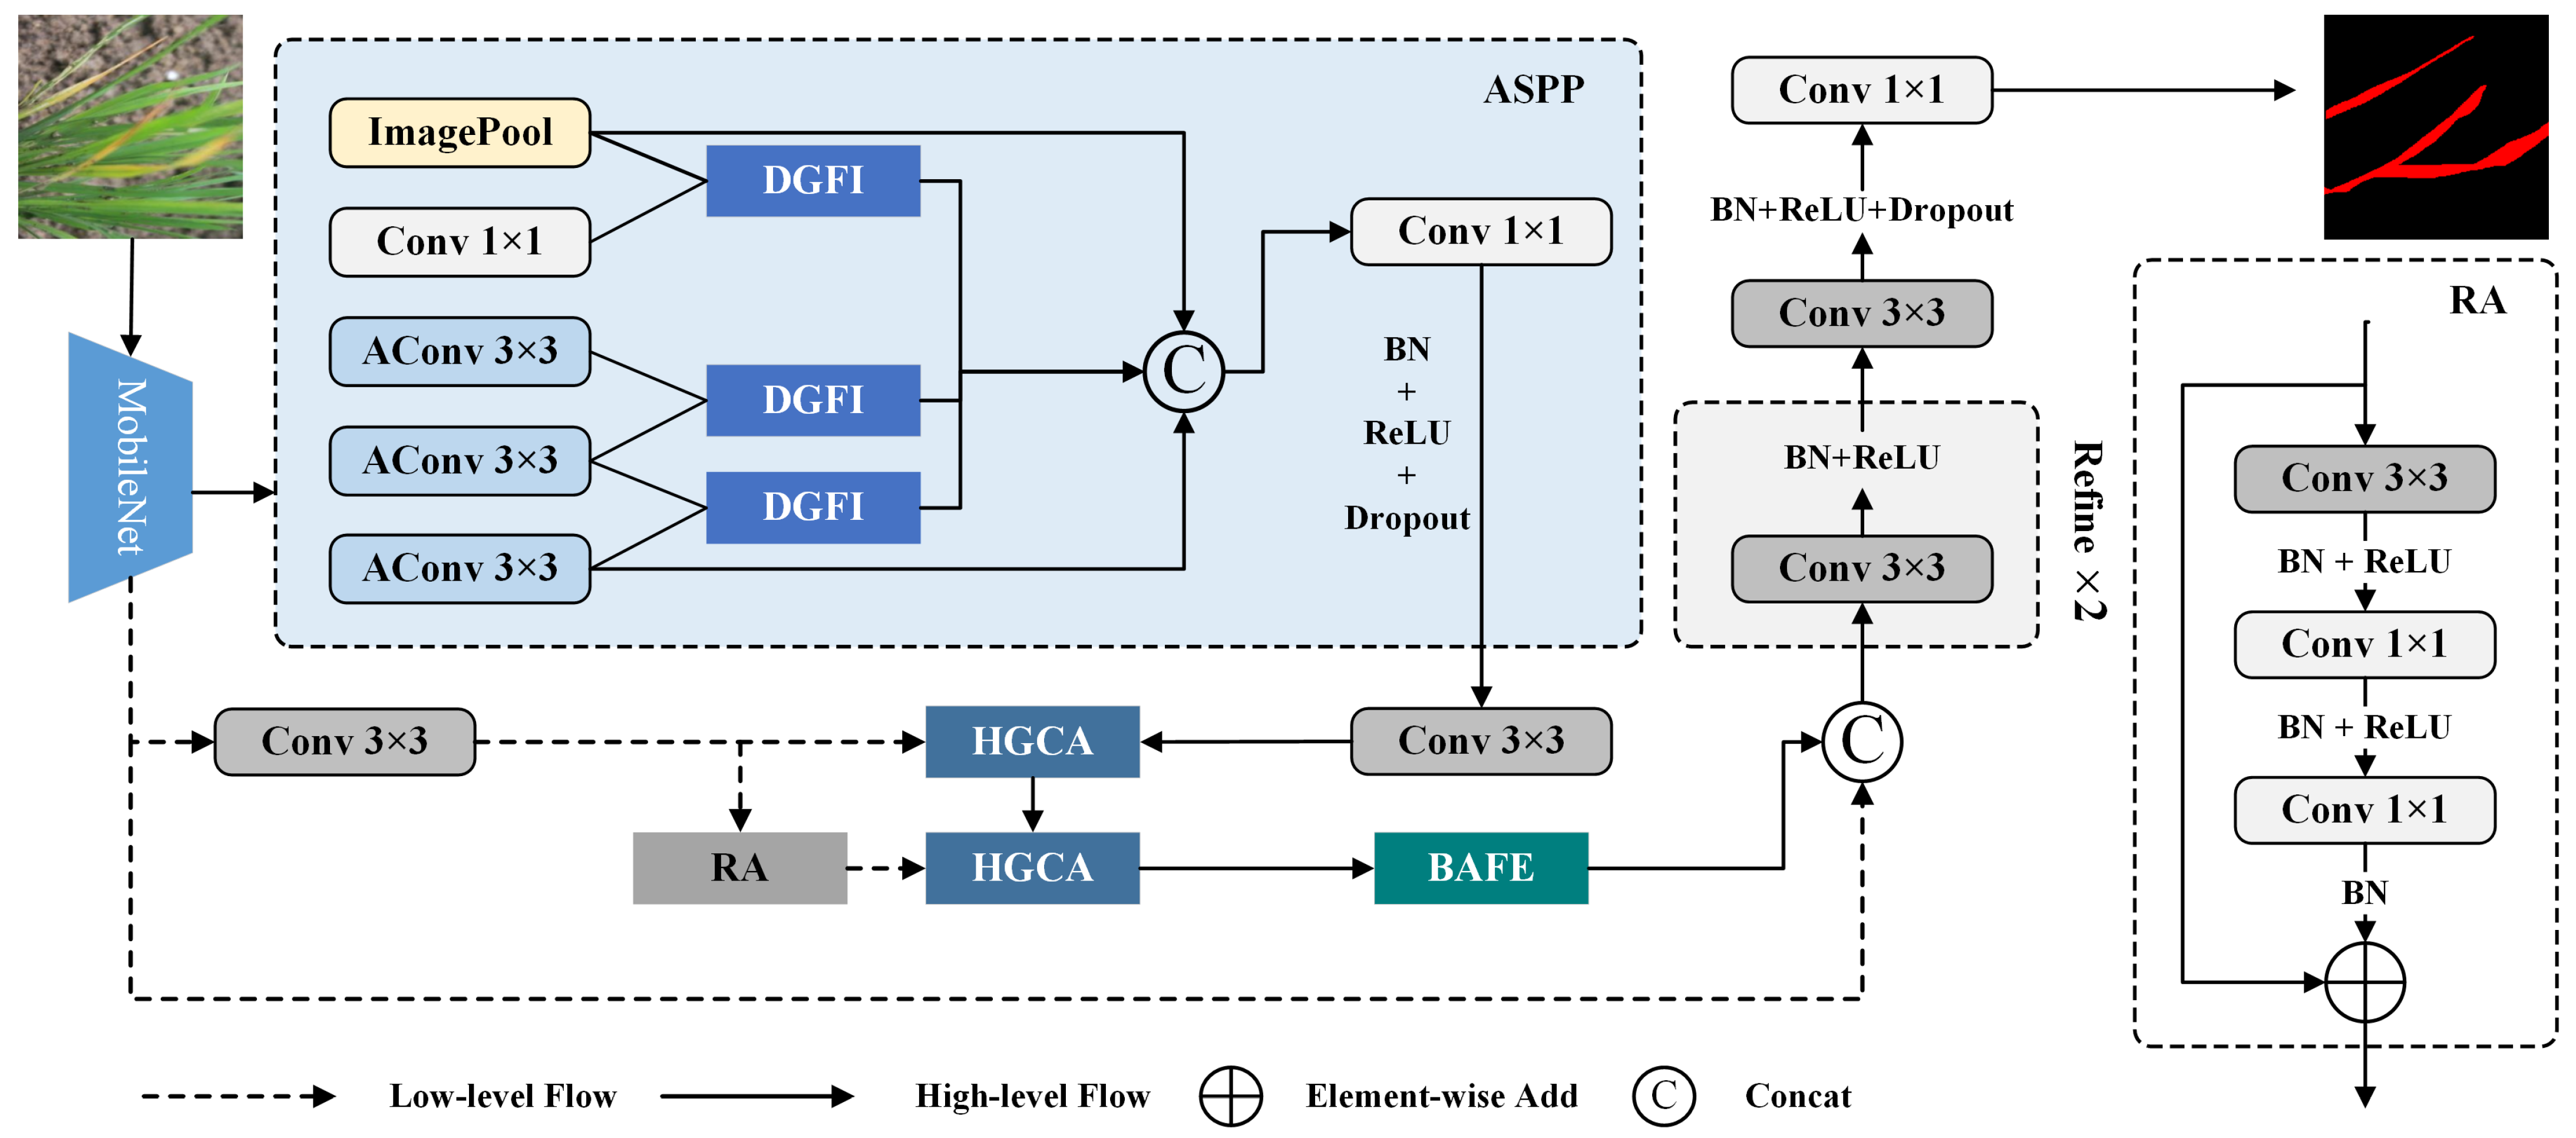
DHB-DeepLabV3+ is constructed based on the DeepLabV3+ framework, and its overall architecture is shown in Figure 1. In the high-level semantic path, ASPP no longer only concatenates the outputs of different receptive field branches at the end, but completes cross-branch information exchange and gate selection (DGFI) before scale fusion, so that the responses of lesions at different scales can complement each other. Subsequently, deep-layer semantic representations and shallow-layer spatial information are subjected to hierarchical aggregation (HGCA) after channel adaptation, suppressing irrelevant texture interference with semantic information and supplementing local structures with low-level details to alleviate semantic and detail misalignment caused by simple concatenation. Before decoding the output, the model further utilizes boundary clues to enhance the feature response of lesion contours and easily confused areas (BAFE), so that the final prediction preserves edge transition information while completing region discrimination. Finally, the boundary-enhanced features are integrated with projection features from shallow layers, and the segmentation results are generated through convolutional refinement and classification mapping.
Figure 1.
Architecture overview of the proposed DHB-DeepLabV3+ model.
2.2.1. Dynamic Gated Feature Interaction (DGFI) Module
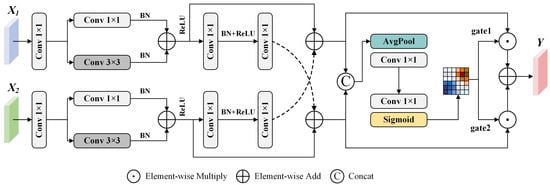
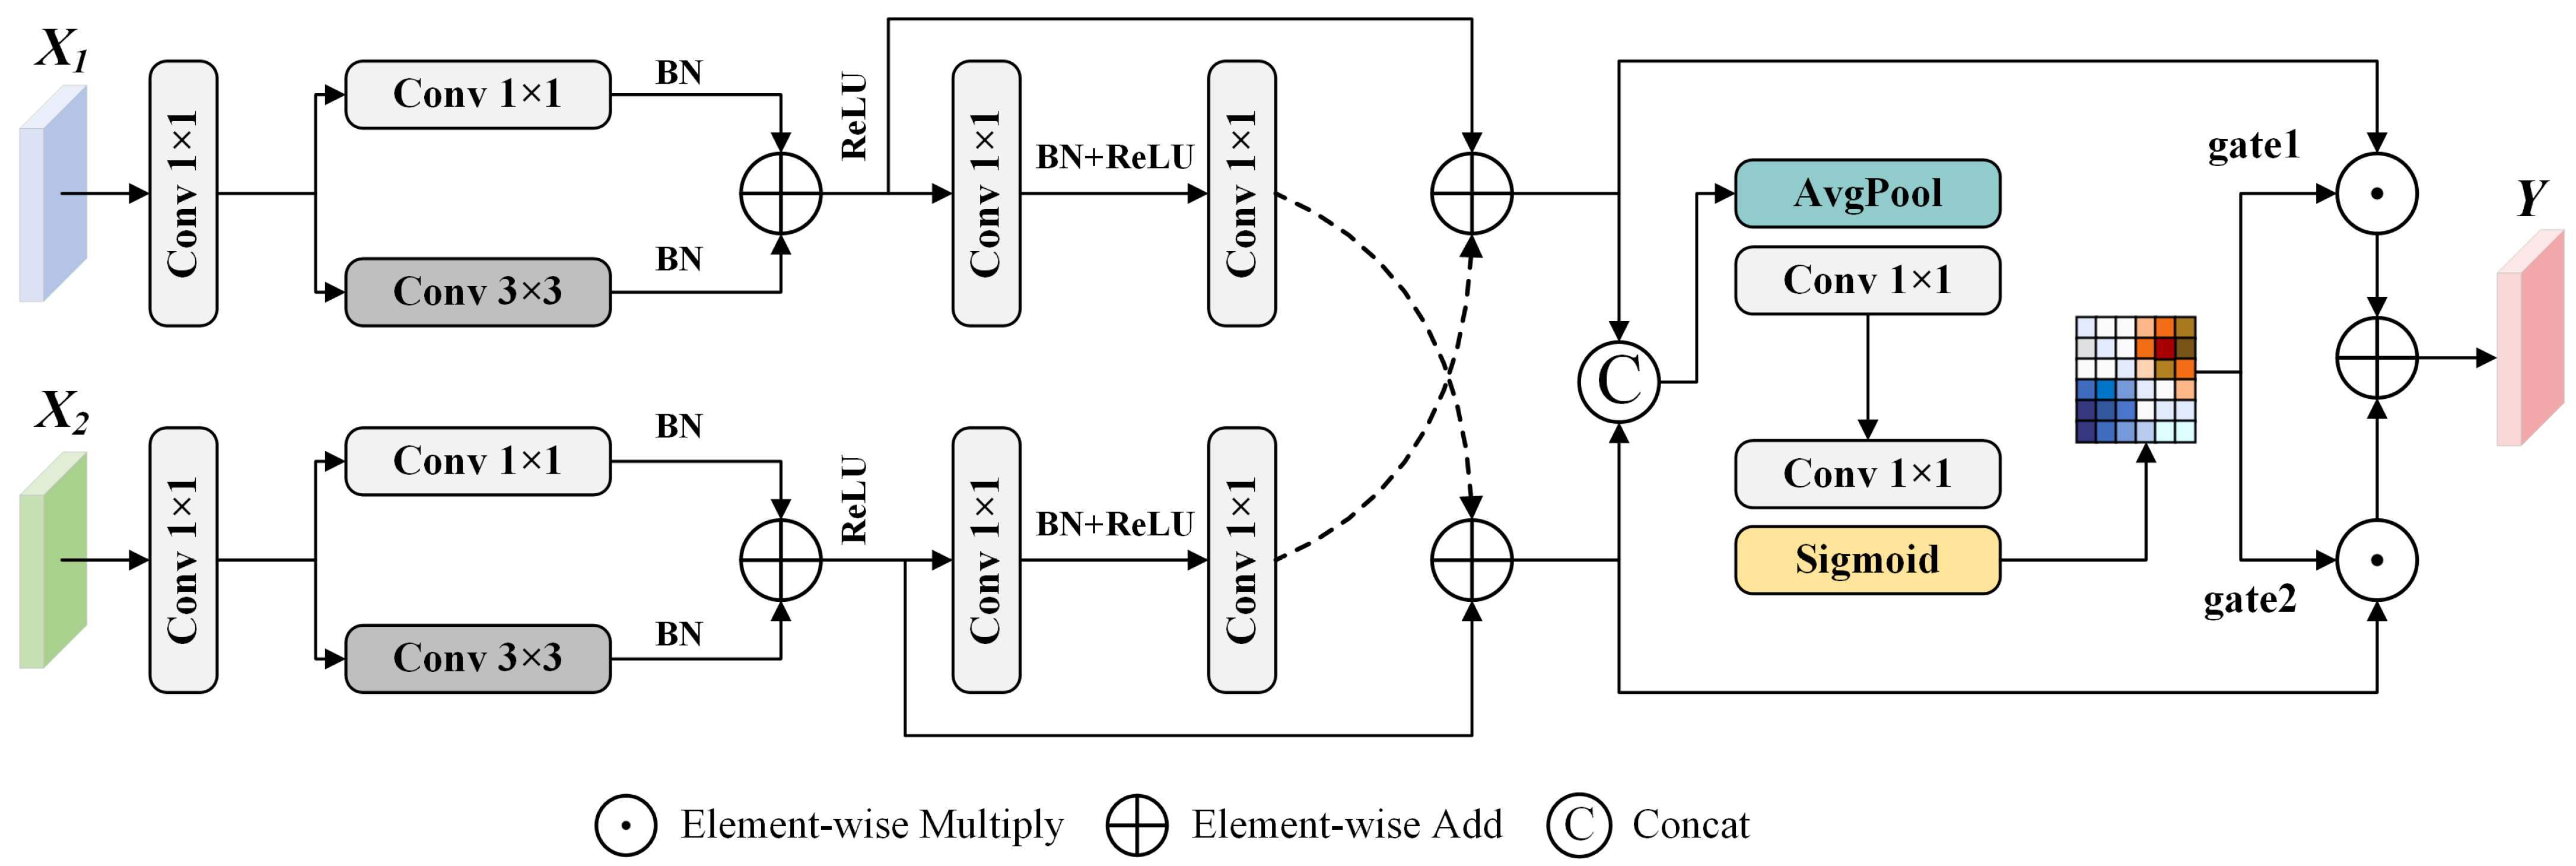
Although ASPP aggregates features from multiple receptive fields, its independent branch processing and final concatenation restrict effective communication among different scales. To enhance the cross-scale information interaction capability within ASPP, we design a Dynamic Gated Feature Interaction (DGFI) module, as illustrated in Figure 2. The DGFI module employs dual-branch symmetric mapping, cross-branch residual interaction, and dynamic gating fusion to enable information reorganization and adaptive screening of features at different scales before final concatenation.
Figure 2.
Structure of the Dynamic Gated Feature Interaction (DGFI) module.
Given two scale branch features , the DGFI module performs channel projection on the two scale features and obtains aligned scale representations through structurally consistent dual-branch transformations. Subsequently, a cross-branch residual interaction mechanism is introduced to enable each feature to receive contextual supplementation from the other scale branch while maintaining its own scale response:
denotes the channel projection mapping of scale branch i, denotes the nonlinear feature transformation of the corresponding branch, denotes the cross-branch information transfer function from branch j to branch i, and is the nonlinear activation function. This process ensures that different scale branches no longer exist as independent feature responses, but instead form bidirectionally complemented interactive representations prior to fusion. After the cross-branch interaction, DGFI further leverages global context to generate dynamic gating weights, enabling selective fusion of multi-scale responses:
represents the gating generation function, represents the dynamic weight of scale branch i, represents the output projection mapping, and ⊙ indicates element-wise multiplication.
2.2.2. Hierarchical Gated Context Aggregation (HGCA) Module
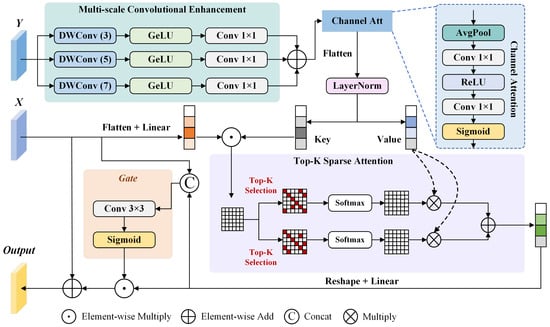
DeepLabV3+ restores spatial information by fusing high-level semantic features with low-level detail features, but its direct fusion method still has limited ability to characterize the relationships between features at different levels. In response to the above issues, we design a Hierarchical Gated Context Aggregation (HGCA) module, as shown in Figure 3. This module combines multi-scale context modeling, channel response recalibration, and dual-path Top-K sparse attention to achieve adaptive integration of semantic context with spatial details, thus improving the discriminative feature representation of lesion areas.
Figure 3.
Structure of the Hierarchical Gated Context Aggregation (HGCA) module. Solid arrows indicate feature flow; blue dashed lines link the Channel Att block to its detailed view, while black dashed arrows show the value features supplied to the two sparse-attention branches. Colored backgrounds distinguish functional blocks.
The HGCA module receives two sets of features as inputs, namely the main branch feature and the auxiliary branch feature . The main branch feature mainly provides the semantic representation of the current stage, while the auxiliary branch feature is used to supplement spatial details or contextual information after residual transformation. The HGCA module performs multi-scale convolution enhancement on auxiliary branch features; extracts contextual responses under different receptive fields through three parallel deep convolution branches of , , and ; and uses learnable weights to achieve scale-adaptive fusion:
represents the deep convolution branch with a kernel size of , and represents the learnable weight of the corresponding branch.
The HGCA module uses the main branch features as query information and the enhanced auxiliary features as key and value information to perform cross-branch contextual modeling in a multi-head attention space. To reduce the interference of complex background regions on feature aggregation, HGCA introduces a dual-path Top-K sparse attention mechanism. The binary mask for attention head h under sparse path r is defined as
represents the correlation scores between the i-th query position in the h-th attention head and all key positions, is the length of the spatial sequence flattened by the auxiliary branch features, and is used to control the Top-K retention ratio. This mask only retains highly correlated positions for attention calculation, thereby reducing irrelevant background responses.
Based on the Top-K mask, HGCA assigns negative infinity to unselected positions before Softmax, thereby retaining only highly correlated key–value features for context aggregation. The attention weights under the r-th sparse path are represented as
The dual-path attention output is further expressed as
represents the attention weights under the r-th sparse path, represents the value matrix in the h-th attention head, and is the learnable fusion coefficient of the corresponding path. By filtering context at different sparsity levels, HGCA can reduce redundant attention to irrelevant background regions while enhancing key semantic responses and preserving useful context in lesion regions.
Finally, HGCA introduces a gated residual fusion mechanism to regulate contextual information integration according to response differences at different spatial positions, maintaining a trade-off between key semantic enhancement and original detail retention, thereby enhancing the discriminative expression of lesion areas in complex backgrounds.
2.2.3. Boundary-Aware Feature Enhancement (BAFE) Module
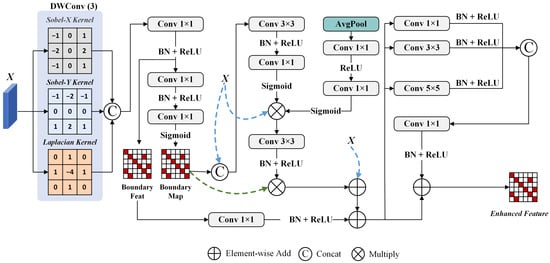
In agricultural disease segmentation, the boundaries of lesions are often affected by factors such as smooth color transitions, similar textures, and irregular shapes, making precise boundary localization challenging for models. To enhance the structural perception capability in boundary regions, we design a Boundary-Aware Feature Enhancement (BAFE) module, as illustrated in Figure 4. This module guides feature responses with explicit edge priors, enabling the network to enhance the expression of lesion contour details while performing semantic discrimination.
Figure 4.
Structure of the Boundary-Aware Feature Enhancement (BAFE) module. Black solid arrows indicate the main data flow. Blue dashed arrows indicate direct routing of the input features to feature concatenation, attention modulation, and residual addition. The green dashed arrow indicates the boundary map used for element-wise modulation of the attention-refined features.
The BAFE module processes the input feature . It extracts first-order directional gradients and second-order structural changes using Sobel and Laplacian operators, and fuses them to obtain boundary features and boundary strength maps:
and , respectively, represent the Sobel operators in the horizontal and vertical directions; represents the Laplacian operator; E is the boundary structure feature; and is the boundary strength map. This process converts abrupt changes in local intensity or texture into explicit boundary constraints, providing structural priors for subsequent feature enhancement.
Subsequently, BAFE uses boundary intensity maps to jointly modulate spatial attention and channel attention, making the enhancement process more focused on the contour area of the lesion:
and represent spatial attention and channel attention, respectively, while represents boundary enhancement mapping. This design avoids uniform enhancement of the entire feature map and instead improves the discriminative expression of the lesion edge region by adaptively controlling the injection position and intensity of the feature response through boundary strength. To adapt to different widths and shapes of lesion boundaries, this module further uses multi-scale convolution branches to refine the enhanced features:
Among them, , , and represent convolutional mappings of different scales, and represents the feature fusion operation. By refining multi-scale boundaries, BAFE can simultaneously enhance the expressive power of narrow edges, diffuse edges, and irregular contour areas.
2.3. DHB-DeepLabV3+ (Lite)
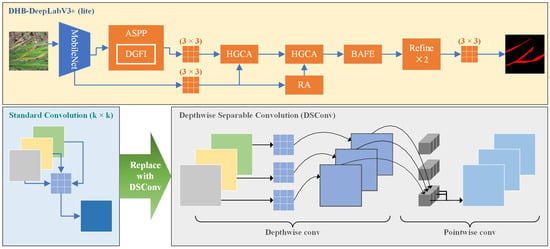
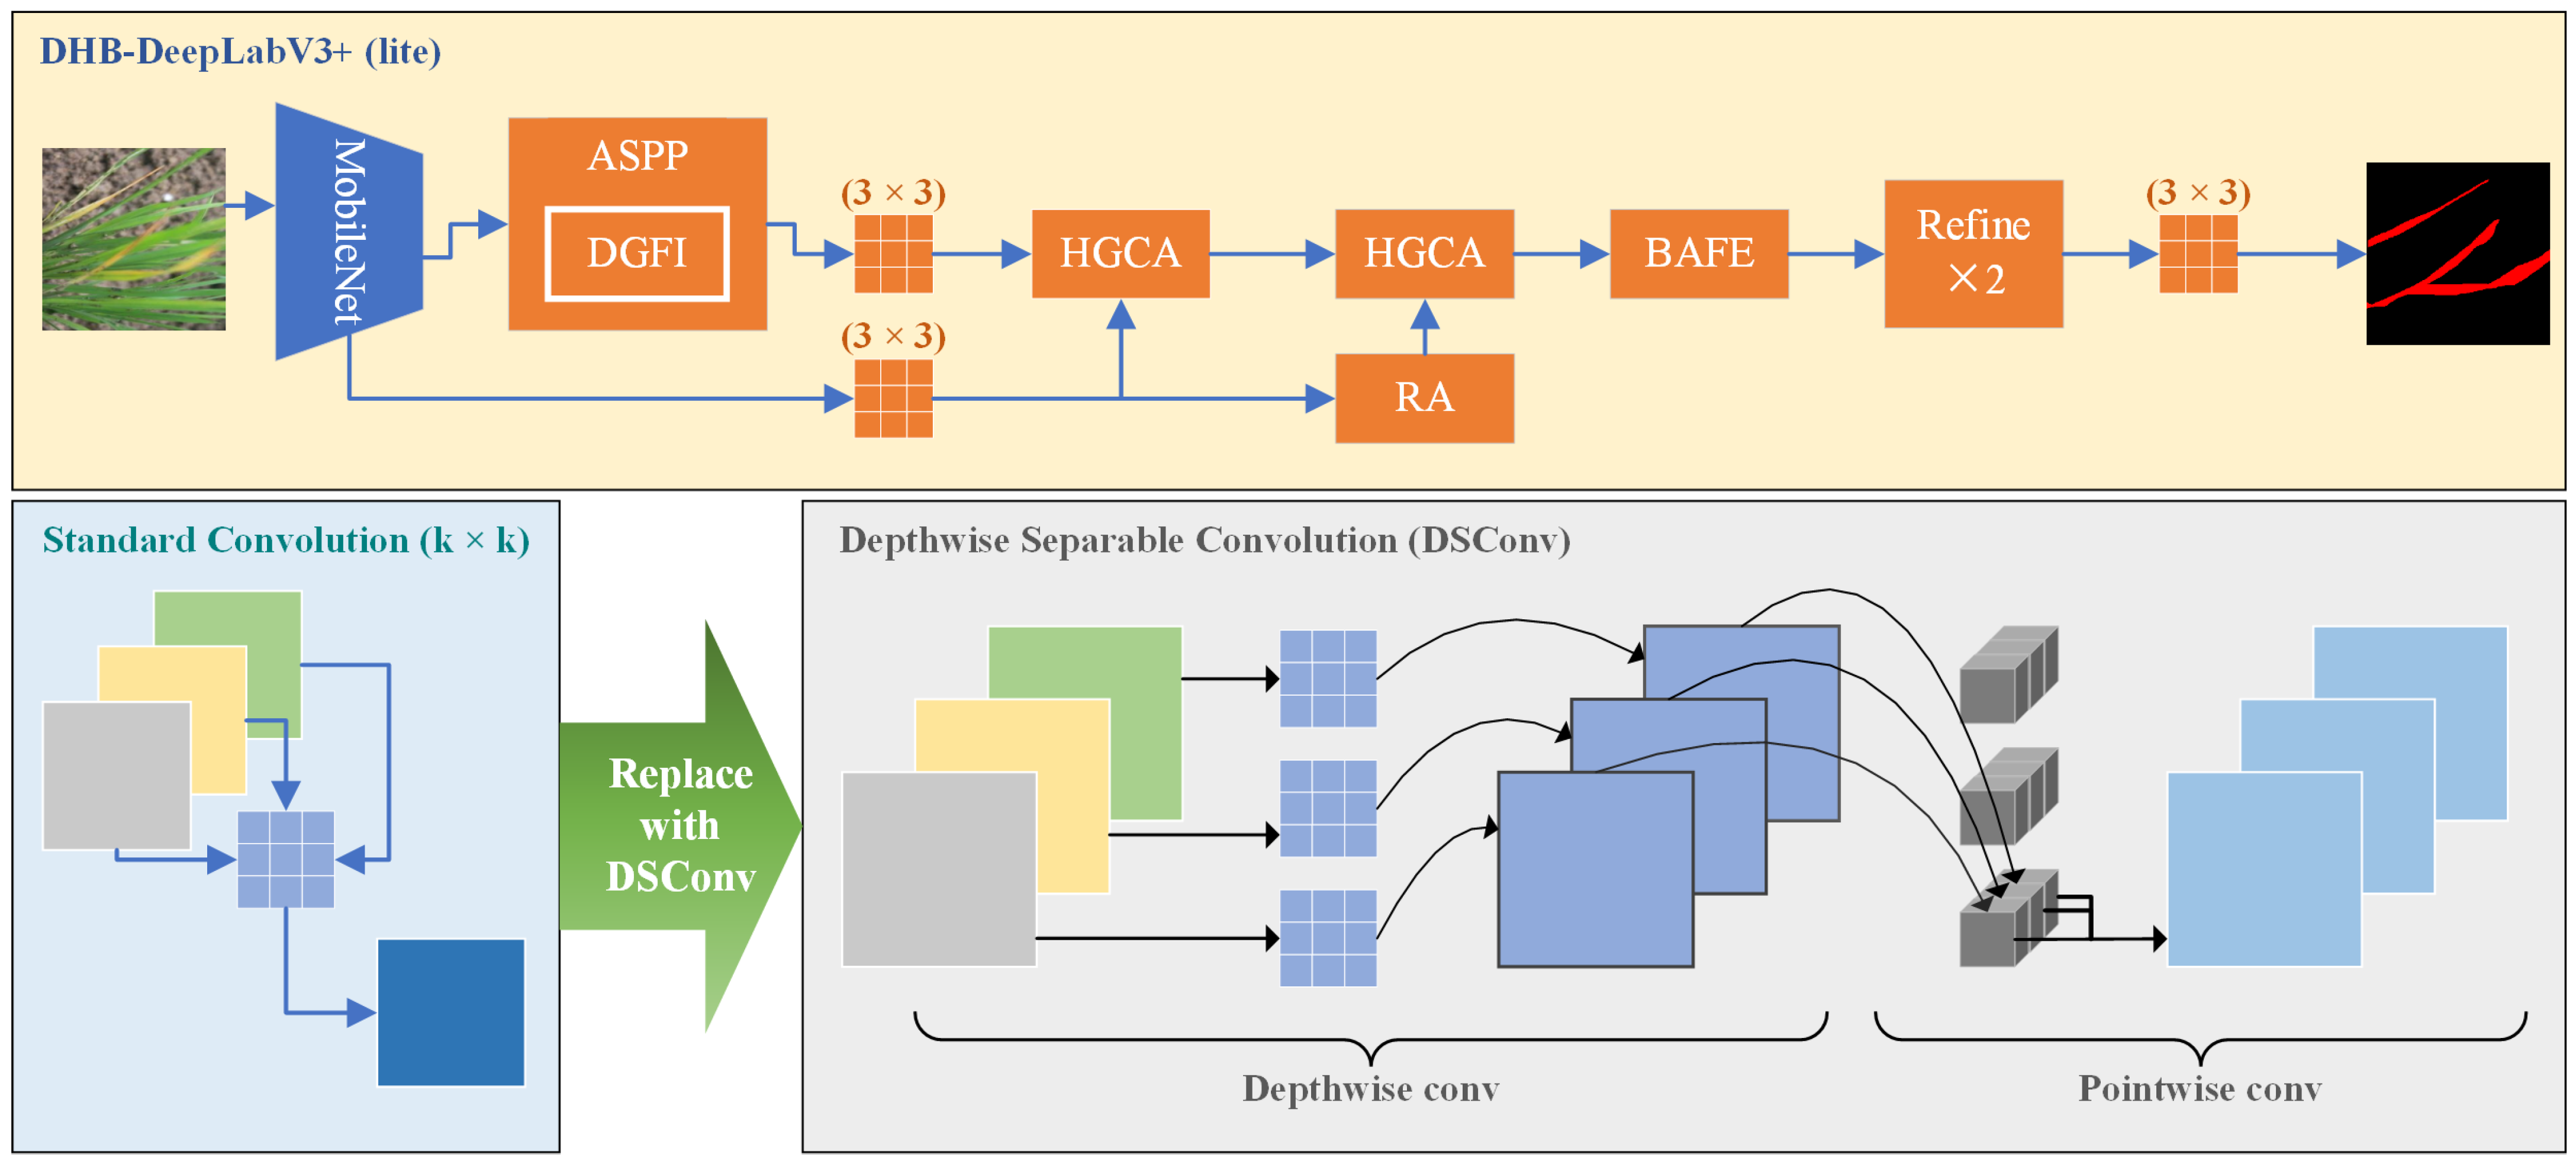
To reduce computational complexity and facilitate deployment on resource-constrained devices, a lightweight variant of DHB-DeepLabV3+, denoted as DHB-DeepLabV3+ (lite), is introduced, as illustrated in Figure 5. The lightweight architecture maintains the overall network structure and feature enhancement modules of DHB-DeepLabV3+. It reduces model complexity by replacing partial standard convolutions with depthwise separable convolutions (DSConv).
Figure 5.
Lightweight architecture of DHB-DeepLabV3+ (lite). Orange highlights the layers and modules in which selected standard convolutions with kernel sizes larger than are replaced by depthwise separable convolutions (DSConv). The lower panel illustrates the corresponding depthwise and pointwise convolution operations.
Compared with the standard DHB-DeepLabV3+, the lightweight version does not modify the backbone network, feature propagation paths, or the connections between modules. Instead, it focuses on optimizing computationally intensive spatial convolution operations. In the feature processing stage after encoder output, the 3 × 3 convolutions used for high-level semantic feature adjustment and low-level feature refinement are replaced with DSConv. In the multi-scale context extraction stage, the three 3 × 3 dilated convolutions in the ASPP module are replaced with DSConv to reduce the computational cost of multi-scale feature representation.
In the HGCA module, the 3 × 3, 5 × 5, and 7 × 7 convolutions in the multi-scale feature extraction branches, as well as the 3 × 3 spatial convolution for feature fusion, are replaced with DSConv. In the DGFI module, the 3 × 3 spatial convolutions used for hierarchical feature processing and interaction are similarly optimized. Furthermore, the 3 × 3 convolutions used for low-level and high-level feature fusion and feature refinement in the decoder are replaced with DSConv to further reduce computational overhead.
For the BAFE module, its core function is to achieve accurate boundary modeling through explicit boundary information extraction and boundary-guided feature enhancement. Therefore, the boundary information extraction mechanism is retained, while only the spatial convolutions involved in boundary feature fusion and enhancement are optimized. Specifically, the 3 × 3 convolution in the boundary-guided attention module and the 3 × 3 and 5 × 5 convolutions in multi-scale boundary feature fusion are replaced with DSConv.
2.4. EBS Loss
In the task of agricultural disease semantic segmentation, issues such as small area proportion, blurred boundary transitions, and local category confusion often exist in the lesion areas. Cross-entropy loss is prone to being dominated by background regions. Although Dice loss can alleviate class imbalance, it provides limited supervision for pixels near ambiguous boundaries. To address the aforementioned issues, we propose the Enhanced Boundary Sensitive Loss (EBS Loss), which jointly generates pixel-level weights through multi-scale boundary priors and prediction uncertainty. This enables the model to maintain regional consistency while paying more attention to lesion contours and easily confused areas.
Given the prediction map P and ground-truth labels Y, the boundary prior B is generated from the local class variations in the true labels at different neighborhood scales. When different class labels coexist within a local window, the corresponding position is considered as a boundary candidate region. Furthermore, prediction uncertainty is introduced to construct pixel-level weights:
p denotes the pixel position, represents the multi-scale boundary prior, signifies the prediction probability of pixel p belonging to class c, stands for the boundary enhancement coefficient, and is the difficulty adjustment coefficient. The weight function simultaneously characterizes the structural properties and prediction difficulty of pixels: when a pixel is located in a boundary region and the model’s prediction confidence is low, its loss weight is correspondingly increased; for non-boundary or high-confidence pixels, relatively lower loss weights are assigned. As a result, the training process can be more focused on lesion edges, category transition zones, and easily confused pixels, rather than imposing uniform constraints on all locations.
In terms of the overall objective, EBS Loss contains a boundary-weighted cross-entropy term together with a base region constraint term:
represents the set of effective pixels; and represent the cross-entropy loss and Dice loss, respectively; and is the balance coefficient between them. The first term reinforces the pixel-level classification constraint in local fuzzy regions through boundary difficulty weights, while the second term maintains the consistency of global region distribution and the overlap constraint of foreground regions. Together, the two terms enhance discrimination at lesion boundaries while preserving consistency within lesion regions. This helps avoid the loss of lesion-region integrity associated with simple boundary weighting, improving segmentation completeness and contour accuracy in complex backgrounds.
3. Results and Analysis
3.1. Implementation Details
The hardware, software, and training hyperparameters used in our study are shown in Table 1. To ensure a fair comparison, all methods were trained using the same experimental settings, including the optimizer, learning rate, input resolution, training epochs, batch size, and loss function. Therefore, the performance comparison reflects the effectiveness of different network architectures under a unified training protocol.
Table 1.
Experimental environment and training settings.
The implementation settings of the proposed modules and EBS Loss are summarized in Table 2. In the table, Fixed denotes predefined architectural settings, loss hyperparameters, or non-trainable edge-operator kernels, whereas Learnable denotes model parameters optimized through backpropagation.
Table 2.
Implementation settings of the proposed modules and EBS Loss (fixed hyperparameters were prespecified).
The datasets were divided into training and testing subsets according to the predefined partition strategy. The training subset was used for model training and parameter optimization, while the test subset was only used for final performance evaluation. No additional independent validation subset was introduced in this study. All models were optimized for a predefined number of epochs, and the trained models after completing the training process were used for testing. During training, the network parameters were jointly updated through backpropagation based on the EBS Loss. The test data were not involved in model training, parameter adjustment, or architectural design. The five repeated runs used different random seeds while keeping the training and test partitions fixed for each dataset. The resulting statistics characterize variability due to stochastic training under these fixed partitions and do not resolve potential sample dependence between the subsets.
3.2. Evaluation Indicators
To evaluate the segmentation performance of DHB-DeepLabV3+ and other models, we adopt mean intersection over Union (mIoU) as the primary metric, with mean accuracy (mAcc), Recall, and the Dice coefficient (Dice) as supplementary indicators. The parameter count (#Params) and computational cost (GFLOPs) are employed to assess model efficiency. Parameter counts are reported in millions (M); 1 M represents one million parameters. The computational complexity was evaluated under the same input resolution of . The GFLOP values were calculated using the THOP profiling tool (version 0.1.1.post2209072238) based on the PyTorch framework.
The corresponding formulas of these metrics are given below:
and denote the numbers of true-positive, false-positive, and false-negative pixels for class c, respectively, and and denote the corresponding numbers for the lesion class.
Segmentation performance near lesion boundaries was evaluated within a ground-truth boundary band using GT-band precision, GT-band recall, GT-band IoU, and GT-band F1-score, denoted by , , , and , respectively. All measures were calculated at a resolution of pixels. The predicted segmentation mask was obtained by selecting the class with the highest output score at each pixel.
For each test image, the boundary band was extracted from the binary ground-truth mask, where lesion and background pixels were labeled as 1 and 0, respectively. Horizontal and vertical gradient responses were computed using the following Sobel kernels:
The convolutions used stride 1 and zero padding of one pixel. For test image n, the gradient magnitude and boundary evaluation region were defined as follows:
Here, denotes the ground-truth mask, denotes the image pixel domain, and ∗ denotes convolution. The band width was determined by the non-zero responses of the Sobel operator, without additional thinning or dilation. For a straight horizontal or vertical class transition in the image interior, the band typically spans two pixel rows or columns across the transition. Its local shape varies with boundary orientation and structure. Responses caused by zero padding where lesions touch the image border were retained.
Within the ground-truth boundary band, lesion classification was evaluated by comparing predicted and reference labels at identical pixel coordinates, without a spatial matching tolerance. The evaluation region was determined solely from the ground-truth mask; no contour was extracted from the predicted mask. Let denote the predicted segmentation mask. The true-positive, false-positive, and false-negative counts were pooled over all test images:
The indicator function equals 1 when the specified condition is satisfied and 0 otherwise. The index n runs over all test images. Images with an empty boundary band contributed no counts. For each test run, the four measures were calculated from the counts pooled over all test images, rather than by averaging image-level metric values:
A constant was added to each denominator for numerical stability. GT-band precision and recall measure the precision and recall of lesion classification within the reference-defined band. GT-band IoU measures lesion-mask intersection over union restricted to this band, while GT-band F1-score summarizes classification precision and recall in the same region. The GT-band metrics assess classification agreement within a reference-defined region and are distinct from standard Boundary IoU and contour-based boundary F1. False-positive predictions outside the ground-truth boundary band are excluded from and do not directly affect the GT-band scores. These measures therefore characterize local segmentation agreement near reference boundaries and are interpreted alongside the full-image segmentation metrics.
For each method or experimental configuration, five training runs with different random seeds were evaluated separately on the same test partition. For each run, , , and were accumulated across all test images within their respective ground-truth boundary bands before calculating the GT-band metrics. The reported mean and standard deviation were calculated from the five run-level scores for each metric.
3.3. Comparison Experiments
3.3.1. Comparison of Different Loss Functions
To verify the effectiveness of EBS Loss in overall segmentation and segmentation near reference boundaries, we compared it with standard cross-entropy loss (CE), focal loss, combined loss (CE+Dice), and weighted cross-entropy loss (WCE) on two disease datasets. All experiments were repeated multiple times, and the results are reported as mean ± standard deviation. The quantitative comparisons on the rice disease dataset and the leaf disease dataset are presented in Table 3 and Table 4, respectively.
Table 3.
Performance of different loss functions on the rice disease dataset. Segmentation scores are reported as mean ± standard deviation (SD) over five independent runs (). Best values are shown in bold.
Table 4.
Performance of different loss functions on the leaf disease dataset. Segmentation scores are reported as mean ± standard deviation (SD) over five independent runs (). Best values are shown in bold.
On the rice disease dataset, EBS Loss achieved the best overall segmentation performance, with an mIoU of 88.45 ± 0.26% and an mAcc of 92.49 ± 0.35%, obtaining the highest values among all comparison methods. Compared with the standard CE Loss, EBS Loss improved mIoU and mAcc by 1.70 and 1.63 percentage points, respectively. Compared with WCE Loss, which achieved the second-best overall performance, EBS Loss obtained improvements of 0.39 and 0.33 percentage points in mIoU and mAcc, respectively. Similar improvements in overall segmentation performance were observed on the leaf disease dataset, where EBS Loss achieved the highest mIoU of 82.52 ± 0.35% and an mAcc of 88.93 ± 0.64%. These results indicate that EBS Loss can effectively improve the segmentation consistency of lesion regions.
For GT-band performance, EBS Loss exhibited competitive performance on both datasets. On the rice disease dataset, EBS Loss achieved the highest , , and values, reaching 54.95 ± 0.31%, 70.93 ± 0.26%, and 69.71 ± 1.08%, respectively. These results indicate that EBS Loss can effectively improve segmentation agreement within the ground-truth boundary band. Although WCE Loss achieved a slightly higher value than EBS Loss (72.68 ± 1.65% vs. 72.20 ± 0.65%), EBS Loss obtained a higher value, indicating higher lesion recall within this band. On the leaf disease dataset, WCE Loss achieved higher , , and values, while EBS Loss obtained the highest value of 65.58 ± 0.52%. Considering both overall segmentation performance and GT-band performance, EBS Loss provides a favorable balance between near-boundary lesion segmentation performance and lesion region consistency among the evaluated loss functions.
3.3.2. Comparison on Rice Disease Dataset
To evaluate the segmentation performance of DHB-DeepLabV3+, we selected the classic semantic segmentation methods UNet [28], SegNet [29], and Swin-UNet [30], as well as representative methods in the field of agricultural disease segmentation such as EBMA-Net [31], FFAE-UNet [32], CS-Net [33], and AISOA-SSformer [26] for comparison. All methods were evaluated under identical experimental conditions, with the quantitative results provided in Table 5.
Table 5.
Performance comparison of different segmentation methods on the rice disease dataset (the best results are shown in bold).
DHB-DeepLabV3+ achieved 88.23% mIoU and 87.39% Dice on the rice disease dataset, obtaining the best results across all compared methods. Relative to EBMA-Net, DHB-DeepLabV3+ showed an increase of 1.93 and 2.43 percentage points in mIoU and Dice. Meanwhile, the parameter count and computational complexity decreased from 26.08 M and 62.95 GFLOPs to 15.81 M and 8.51 GFLOPs, respectively. Compared with UNet, SegNet, FFAE-UNet, and CS-Net, DHB-DeepLabV3+ achieved higher mIoU, Dice, Recall, and mAcc values. Although Swin-UNet achieved 85.05% mIoU, its parameter count reached 111.88 M, resulting in higher computational costs. With a parameter count of 6.67 M and a computational cost of 2.36 GFLOPs, the lightweight version still achieved 87.94% mIoU. Its Recall and mAcc reached 86.97% and 93.19%, respectively, both higher than those of the standard version.
To further assess the stability of the experimental results, five independent runs were conducted for EBMA-Net and the proposed models, and the corresponding statistical results are summarized in Table 6. The results show that DHB-DeepLabV3+ achieves an average mIoU of 88.45 ± 0.26%, which is higher than that of EBMA-Net by 1.91 percentage points. The relatively small standard deviations and narrow 95% confidence intervals indicate that the performance of the proposed model remains stable across different runs. The lightweight variant obtains an average mIoU of 87.75 ± 0.63%, slightly below that of the standard version, while maintaining competitive segmentation performance. These results further support the effectiveness and stability of the proposed models under repeated experiments.
Table 6.
Performance comparison of EBMA-Net and the proposed models on the rice disease dataset. Results are reported as mean ± standard deviation (SD) over five independent runs (). The 95% confidence intervals (CIs) of the means are also provided. Best values are shown in bold.
3.3.3. Comparison on Leaf Disease Dataset
To better assess the adaptability of DHB-DeepLabV3+ to more complex disease morphologies, we performed comparative experiments on the leaf disease dataset, with the results summarized in Table 7. Unlike the rice disease dataset, this dataset covers multiple plant leaf diseases with greater variations in color, shape, texture, and boundary clarity of the lesions, thus imposing stricter requirements on the model’s feature discrimination, boundary preservation, and complex lesion recognition capabilities.
Table 7.
Performance comparison of different segmentation methods on the leaf disease dataset (the best results are shown in bold).
As shown in Table 7, DHB-DeepLabV3+ achieved 82.46% mIoU, 83.23% Dice, 81.79% Recall, and 89.42% mAcc. Among these metrics, DHB-DeepLabV3+ achieved competitive performance in Recall and mAcc, obtaining the highest values among the compared methods in the single-run evaluation. This indicates that the proposed model can effectively capture lesion regions and maintain reliable pixel-level classification performance. EBMA-Net achieved 82.79% mIoU and 83.51% Dice, which were 0.33 and 0.28 percentage points higher than those of DHB-DeepLabV3+, but its computational cost reached 62.95 GFLOPs, approximately 7.4 times that of DHB-DeepLabV3+ at 8.51 GFLOPs, and its parameter count was also higher, increasing from 15.81 M for the proposed model to 26.08 M.
The mIoU values of UNet, SegNet, and CS-Net are approximately 75%. The Swin-UNet parameter count reaches 111.88 M, but the mIoU is only 72.75%. AISOA-SSformer has lower computational complexity, yet its Recall falls 5.60 percentage points short of that of our model. The lightweight version still achieved 81.83% mIoU with only 6.67 M parameters and a computational cost of 2.36 GFLOPs. Its mIoU was higher than those of all comparison methods except EBMA-Net and the standard DHB-DeepLabV3+ model.
To further evaluate the stability of the obtained results, five independent runs were conducted for EBMA-Net, AISOA-SSformer, and the proposed models, with the corresponding statistical results summarized in Table 8. The results show that the performance ranking remains generally consistent with the single-run evaluation. EBMA-Net achieves slightly higher average mIoU and Dice than DHB-DeepLabV3+, while the proposed model obtains higher Recall and mAcc values, indicating better lesion coverage and pixel-level classification capability. The relatively small standard deviations and 95% confidence intervals suggest that the models maintain stable performance across repeated experiments. The lightweight variant achieves an average mIoU of 81.90 ± 0.15%, with slightly reduced accuracy compared with the standard version but lower performance variation, demonstrating a favorable balance between segmentation capability and computational efficiency.
Table 8.
Performance comparison of EBMA-Net, AISOA-SSformer, and the proposed models on the leaf disease dataset. Results are reported as mean ± standard deviation (SD) over five independent runs (). The 95% confidence intervals (CIs) of the means are also provided. Best values are shown in bold.
3.3.4. Comparison on PlantSeg Dataset
The lesion delineation capability of the model in complex field scenes involving multiple crops and disease types was further evaluated on the PlantSeg dataset, with the results summarized in Table 9. This dataset has richer crop categories, disease types, and collection environments compared to the previous two datasets, and it better reflects the scene diversity encountered in real agricultural applications. The focus of this experiment is not just to compare the highest accuracy on a single dataset, but to examine the model’s ability to distinguish lesions from complex backgrounds.
Table 9.
Performance comparison of different segmentation methods on the PlantSeg dataset (the best results are shown in bold).
From the table, it can be seen that DHB-DeepLabV3+ achieved 81.85% mIoU and 83.66% Dice on the PlantSeg dataset, both of which are the highest values among all comparison methods. Compared with EBMA-Net, DHB-DeepLabV3+ achieved gains of 3.12 and 3.16 percentage points in mIoU and Dice, respectively, and of 2.00 and 1.64 percentage points in Recall and mAcc, respectively.
To further evaluate the stability of the proposed models under complex field conditions, five independent runs were conducted for DHB-DeepLabV3+ and DHB-DeepLabV3+ (lite), and the corresponding statistical results are summarized in Table 10. The results show that DHB-DeepLabV3+ achieves an average mIoU of 81.72 ± 0.38%, which is close to the single-run evaluation result, indicating consistent performance across repeated experiments. The lightweight variant obtains an average mIoU of 80.62 ± 0.46%, with slightly lower segmentation accuracy but comparable stability. In addition, the lightweight model achieves higher Recall and mAcc values than the standard version, suggesting that the depthwise separable convolution-based design maintains effective feature extraction capability while reducing computational cost.
Table 10.
Performance comparison between the standard and lightweight versions of DHB-DeepLabV3+ on the PlantSeg dataset. Results are reported as mean ± standard deviation (SD) over five independent runs (). The 95% confidence intervals (CIs) of the means are also provided. Best values are shown in bold.
Under separate training and testing on each dataset, some methods showed different performance across the three datasets. The mIoU of AISOA-SSformer on the rice disease dataset was 83.10%, while it decreased to 73.99% on the PlantSeg dataset; Swin-UNet achieved 85.05% mIoU on the rice disease dataset, but decreased to 74.16% on the PlantSeg dataset. DHB-DeepLabV3+ achieved mIoU values of 88.23%, 82.46%, and 81.85% on the rice disease, leaf disease, and PlantSeg datasets, respectively, and achieved the best mIoU and Dice on the PlantSeg dataset. The lightweight version achieved 80.69% mIoU and 82.65% Dice on the PlantSeg dataset, while Recall and mAcc reached 85.33% and 89.89%, respectively, both higher than those of the standard DHB-DeepLabV3+.
3.3.5. Visual Comparison of Segmentation Results
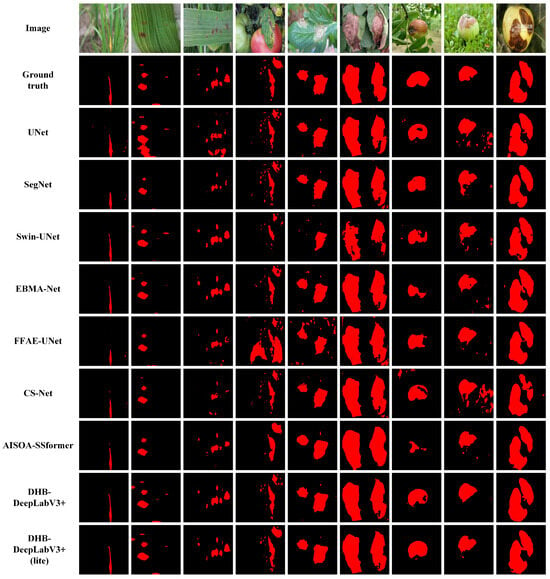
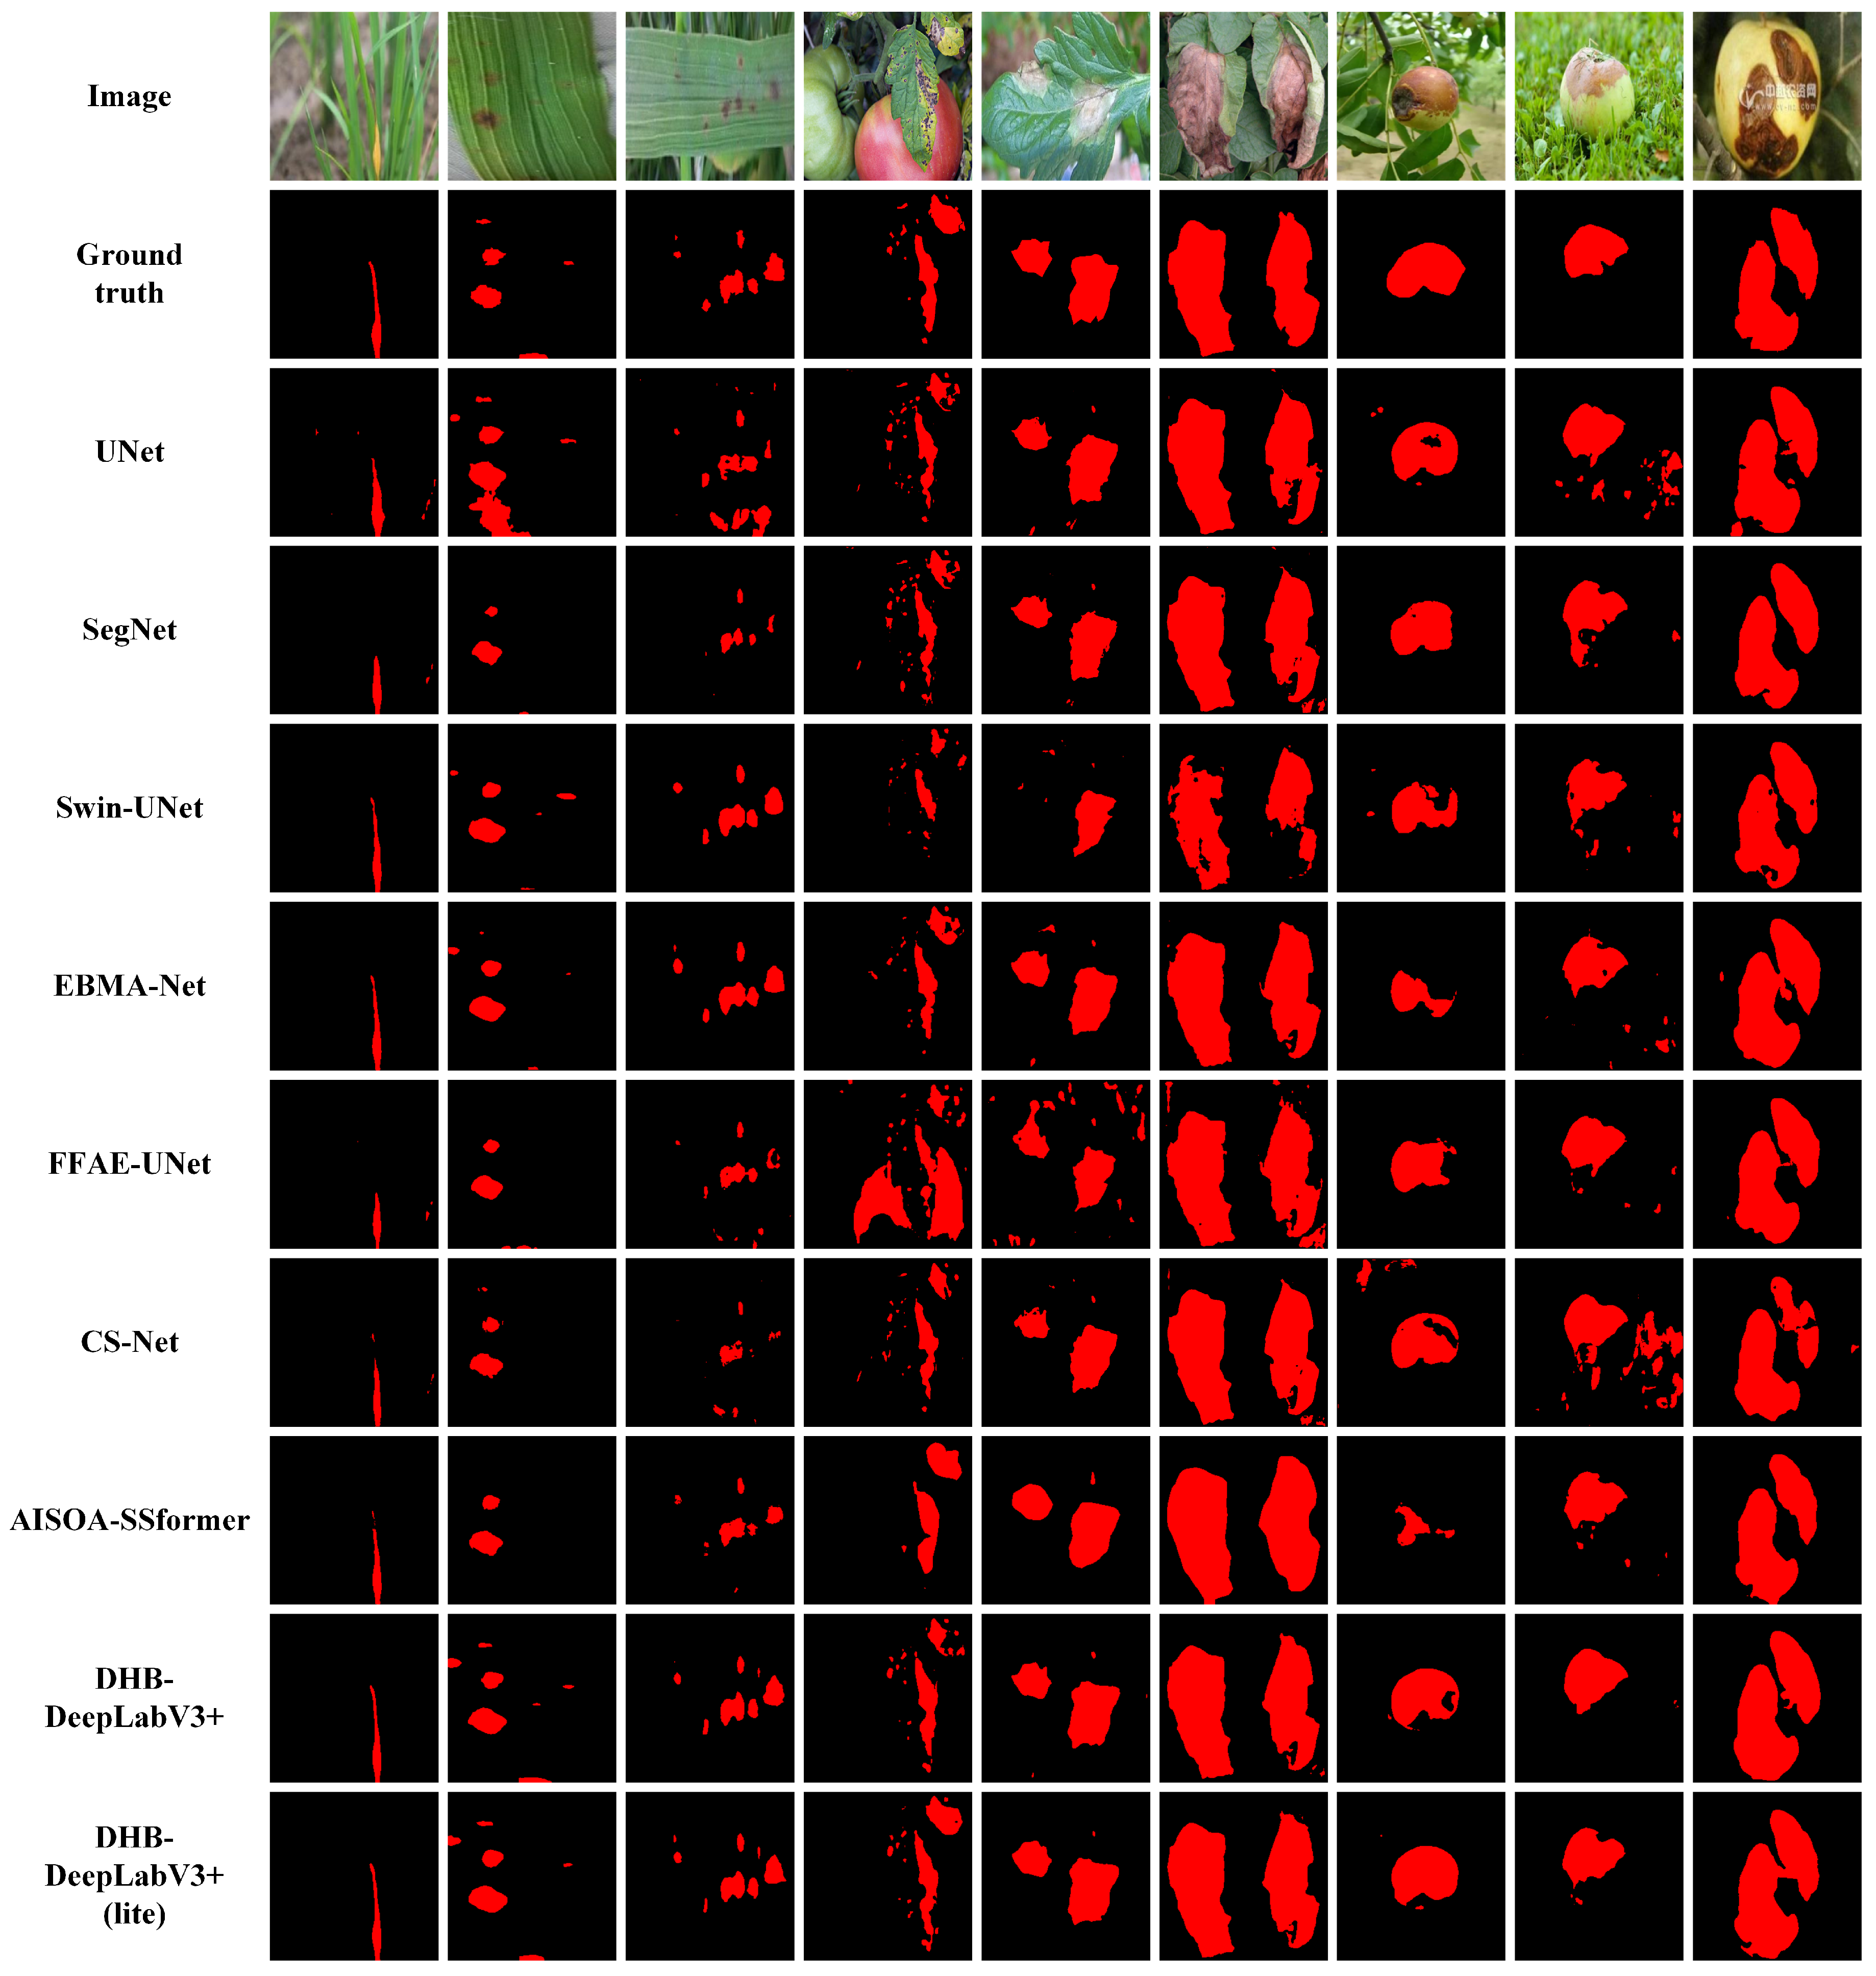
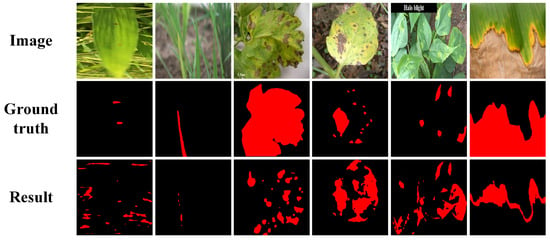
To further compare the differences in lesion localization, boundary preservation, and background suppression between different methods, this study randomly sampled three images without replacement from the test subset of each dataset using a fixed random seed (42) for visualization analysis, with the visual comparisons provided in Figure 6. Predictions from all methods are displayed on the same sampled images.
Figure 6.
Segmentation results by different methods on the rice disease dataset (columns 1–3, CC BY 4.0), the leaf disease dataset (columns 4–6, CC0: Public Domain), and the PlantSeg dataset (columns 7–9, CC BY-NC-ND 4.0).
Some comparison methods are prone to missed classification, boundary adhesion, or background misclassification in small lesions, low-contrast areas, and complex backgrounds. In contrast, DHB-DeepLabV3+ provides more complete coverage of the main lesion area and maintains good contour consistency in the boundary transition region. In the displayed PlantSeg examples, DHB-DeepLabV3+ more effectively suppresses interference from background textures.
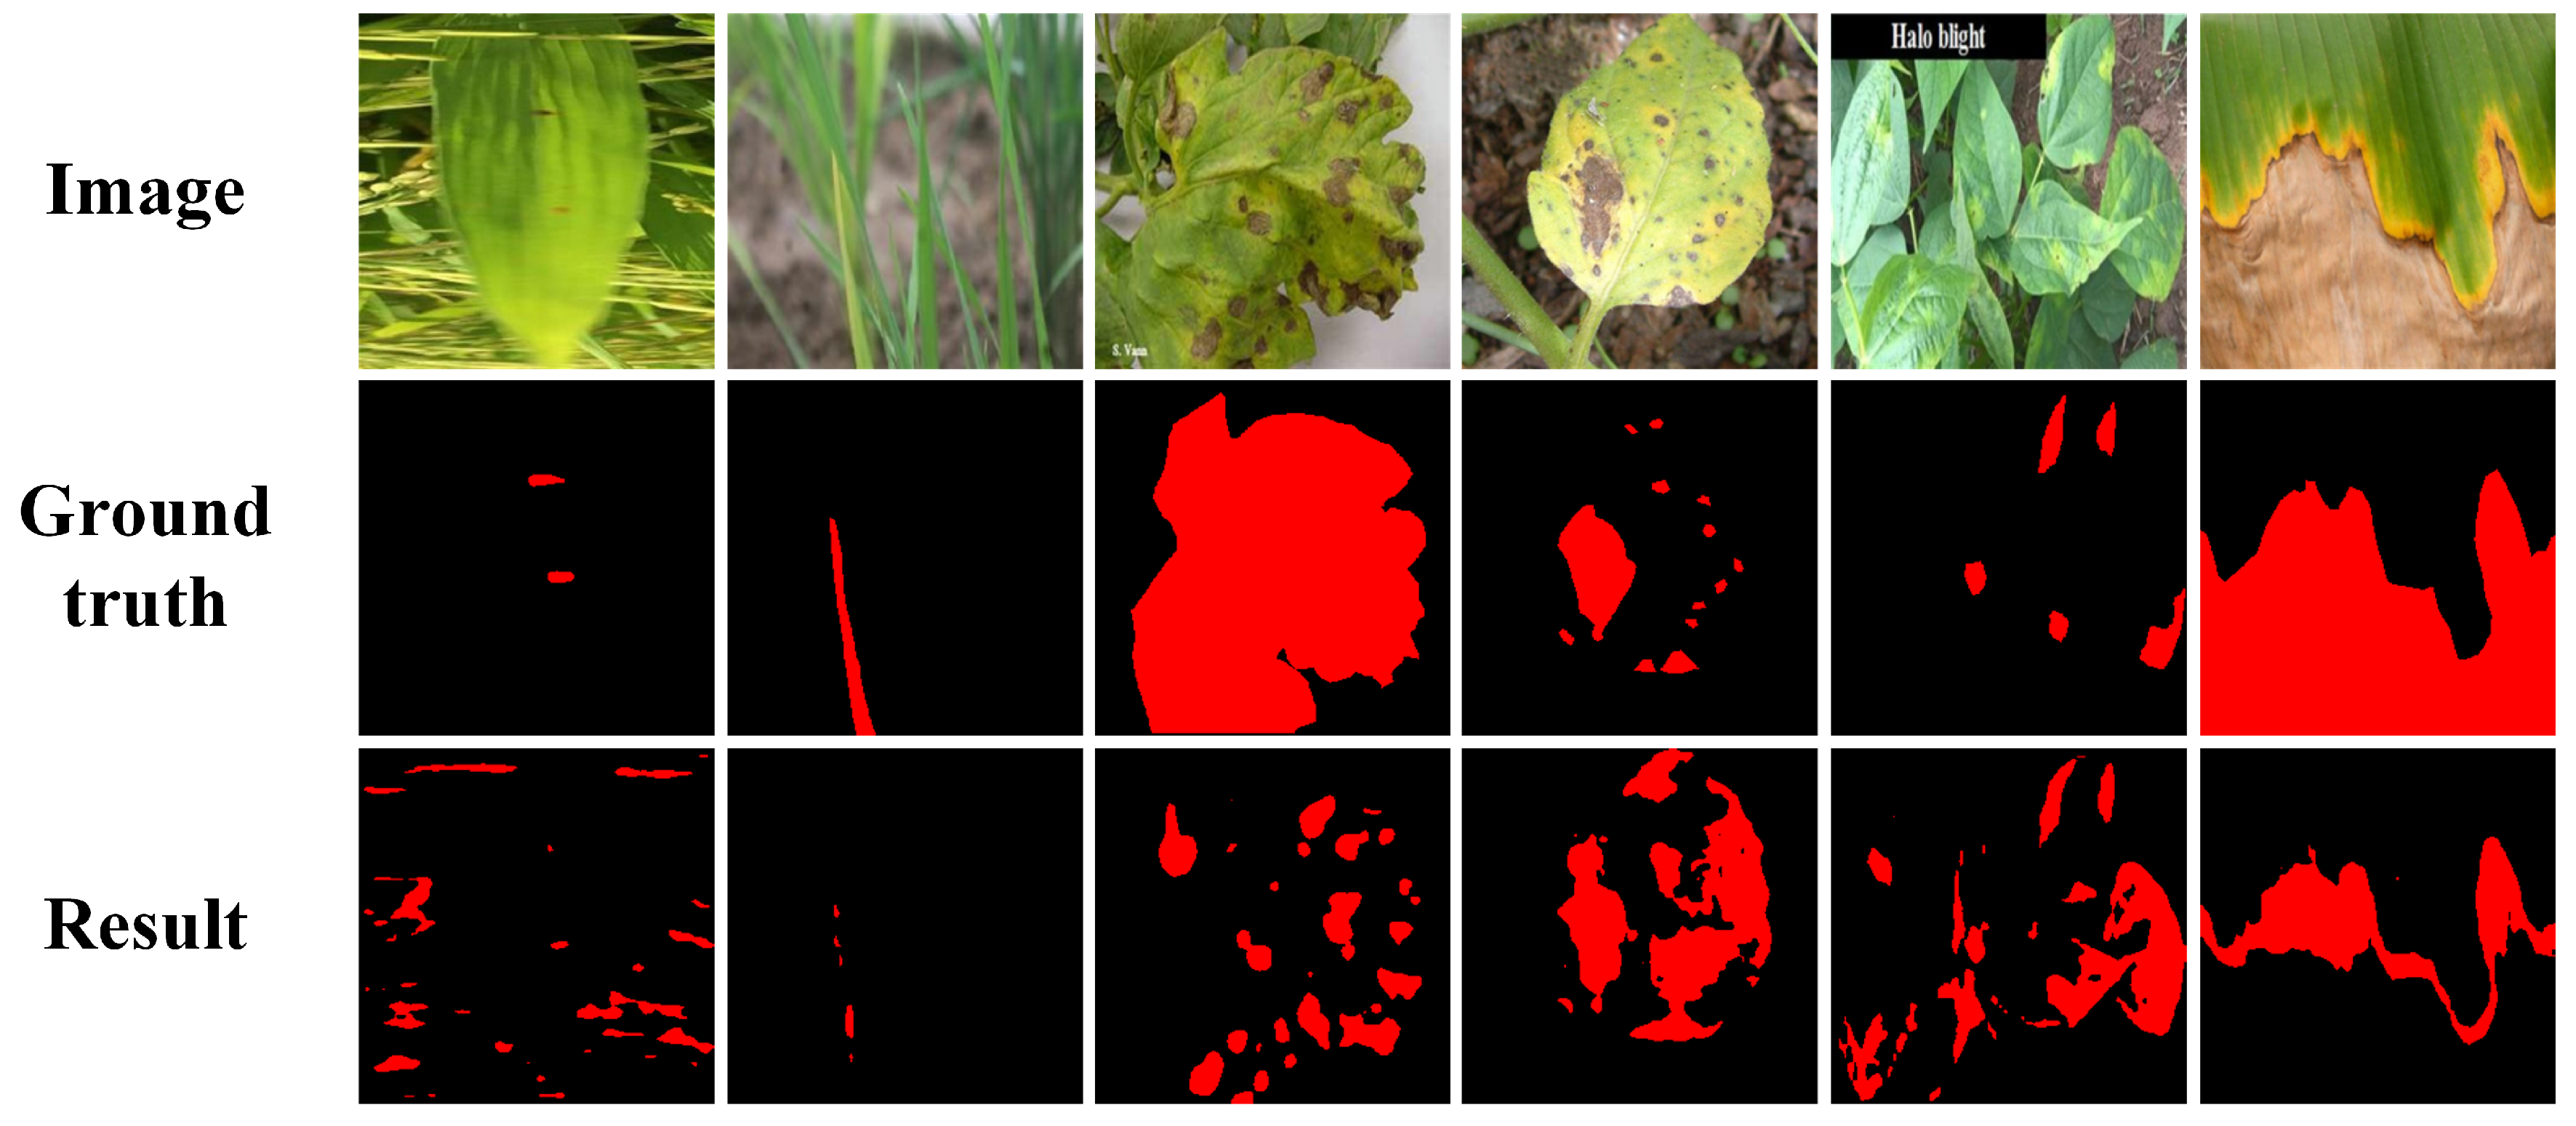
To provide a more balanced qualitative assessment, additional failure cases of DHB-DeepLabV3+ on the three datasets are presented in Figure 7. In some examples, the model still produces false-positive predictions, missed regions, and incomplete lesion coverage. These errors may be associated with weak lesion contrast and complex texture interference, highlighting remaining limitations in lesion discrimination and region completeness under challenging conditions.
Figure 7.
Failure cases of DHB-DeepLabV3+ on the rice disease dataset (columns 1–2, CC BY 4.0), the leaf disease dataset (columns 3–4, CC0: Public Domain), and the PlantSeg dataset (columns 5–6, CC BY-NC-ND 4.0).
3.4. Ablation Experiments
To assess the individual and combined contributions of HGCA, DGFI, and BAFE to overall segmentation performance, we conducted ablation experiments on the leaf disease dataset. We additionally evaluated lesion segmentation performance within ground-truth-defined boundary bands for four selected configurations: the Baseline, Baseline + BAFE, DHB-DeepLabV3+, and DHB-DeepLabV3+ (lite). The overall segmentation and GT-band scores are reported as mean ± standard deviation over five independent runs.
In the ablation experiments, the DeepLabV3+ configuration without any proposed modules was denoted as Baseline. This configuration adopts the same backbone as the other experiments, retains the standard ASPP module and the original DeepLabV3+ decoder, and is optimized with the proposed EBS Loss. The decoder consists of low-level feature projection through a convolution, high-level semantic feature extraction using ASPP, and feature fusion for final prediction. All ablation experiments were conducted under the same training strategy and experimental settings to ensure fair comparisons. The overall segmentation performance and model complexity of all ablation configurations are summarized in Table 11, while the GT-band results for the four selected configurations are presented in Table 12.
Table 11.
Ablation experiment results on the leaf disease dataset. Segmentation scores are reported as mean ± standard deviation (SD) over five independent runs (). Best values are shown in bold.
Table 12.
GT-band segmentation performance of the Baseline, Baseline + BAFE, DHB-DeepLabV3+, and DHB-DeepLabV3+ (lite) models on the leaf disease dataset. GT-band scores are reported as mean ± standard deviation (SD) over five independent runs (). Best values are shown in bold.
Adding HGCA and DGFI individually improves segmentation performance, supporting the effectiveness of semantic enhancement and feature interaction. HGCA increases mIoU from 78.00% to 80.18%, while DGFI increases it to 79.39%. The larger improvement achieved by HGCA highlights the importance of multi-scale contextual features for lesion feature extraction. Meanwhile, DGFI facilitates information exchange between features at different levels and improves segmentation performance with relatively low computational overhead.
Adding BAFE alone to the Baseline decreases overall region-level segmentation scores while increasing the reported mean GT-band scores. Specifically, mIoU, Dice, Recall, and mAcc decrease from 78.00%, 78.08%, 74.93%, and 85.76% to 76.93%, 76.96%, 74.08%, and 85.12%, respectively. Meanwhile, the parameter count increases from 5.22 M to 9.69 M, and the computational cost increases from 4.28 to 7.06 GFLOPs.
However, all four mean GT-band scores increase: from 39.86% to 42.44%, from 57.00% to 59.58%, from 62.32% to 64.23%, and from 52.52% to 55.57%. These results indicate improved lesion segmentation within the ground-truth boundary band, although this local improvement does not translate into better overall segmentation performance. Predictions outside the band are excluded from the GT-band statistics, so these scores do not capture segmentation errors throughout the full image.
A possible explanation is that the gradient-based responses used by BAFE also enhance leaf veins, texture variations, or illumination transitions when semantic discrimination is insufficient. Such non-lesion responses may compromise lesion-region consistency despite improved classification within the evaluated boundary band. This explanation is consistent with the observed results, but the effects of these individual sources of interference were not directly quantified.
The overall segmentation results show that the effect of BAFE depends on the module configuration. Adding BAFE to Baseline + HGCA increases mean mIoU from 80.18% to 80.87%, while adding it to Baseline + DGFI increases mean mIoU from 79.39% to 81.15%. Compared with the HGCA+DGFI configuration, the complete model further improves mIoU from 81.47% to 82.52%. Together with the decrease observed when BAFE is added to the Baseline alone, these comparisons suggest that its benefit to overall segmentation is conditional on the accompanying semantic and contextual representations.
Among the four configurations listed in Table 12, DHB-DeepLabV3+ achieves the highest mean GT-band scores, with , , , and reaching 43.98%, 61.08%, 65.58%, and 57.20%, respectively. Thus, the full model achieves the highest overall segmentation scores among the ablation configurations and the highest GT-band means among the four selected models. The selected GT-band comparison, however, does not isolate the incremental effect of BAFE on the HGCA+DGFI configuration.
The lightweight version achieves a favorable balance between computational cost and segmentation performance. By replacing computationally intensive spatial convolutions with depthwise separable convolutions, DHB-DeepLabV3+ (lite) reduces the parameter count from 15.81 M to 6.67 M and the computational cost from 8.51 to 2.36 GFLOPs. Although segmentation performance decreases slightly, the lightweight model retains an mIoU of 81.90%, an of 43.52%, and an of 60.65%. These values are only 0.62, 0.46, and 0.43 percentage points below those of the full model, respectively. The results indicate that the lightweight design effectively reduces computational cost while maintaining competitive overall and GT-band segmentation performance.
3.5. Edge-Device Deployment and Inference Validation
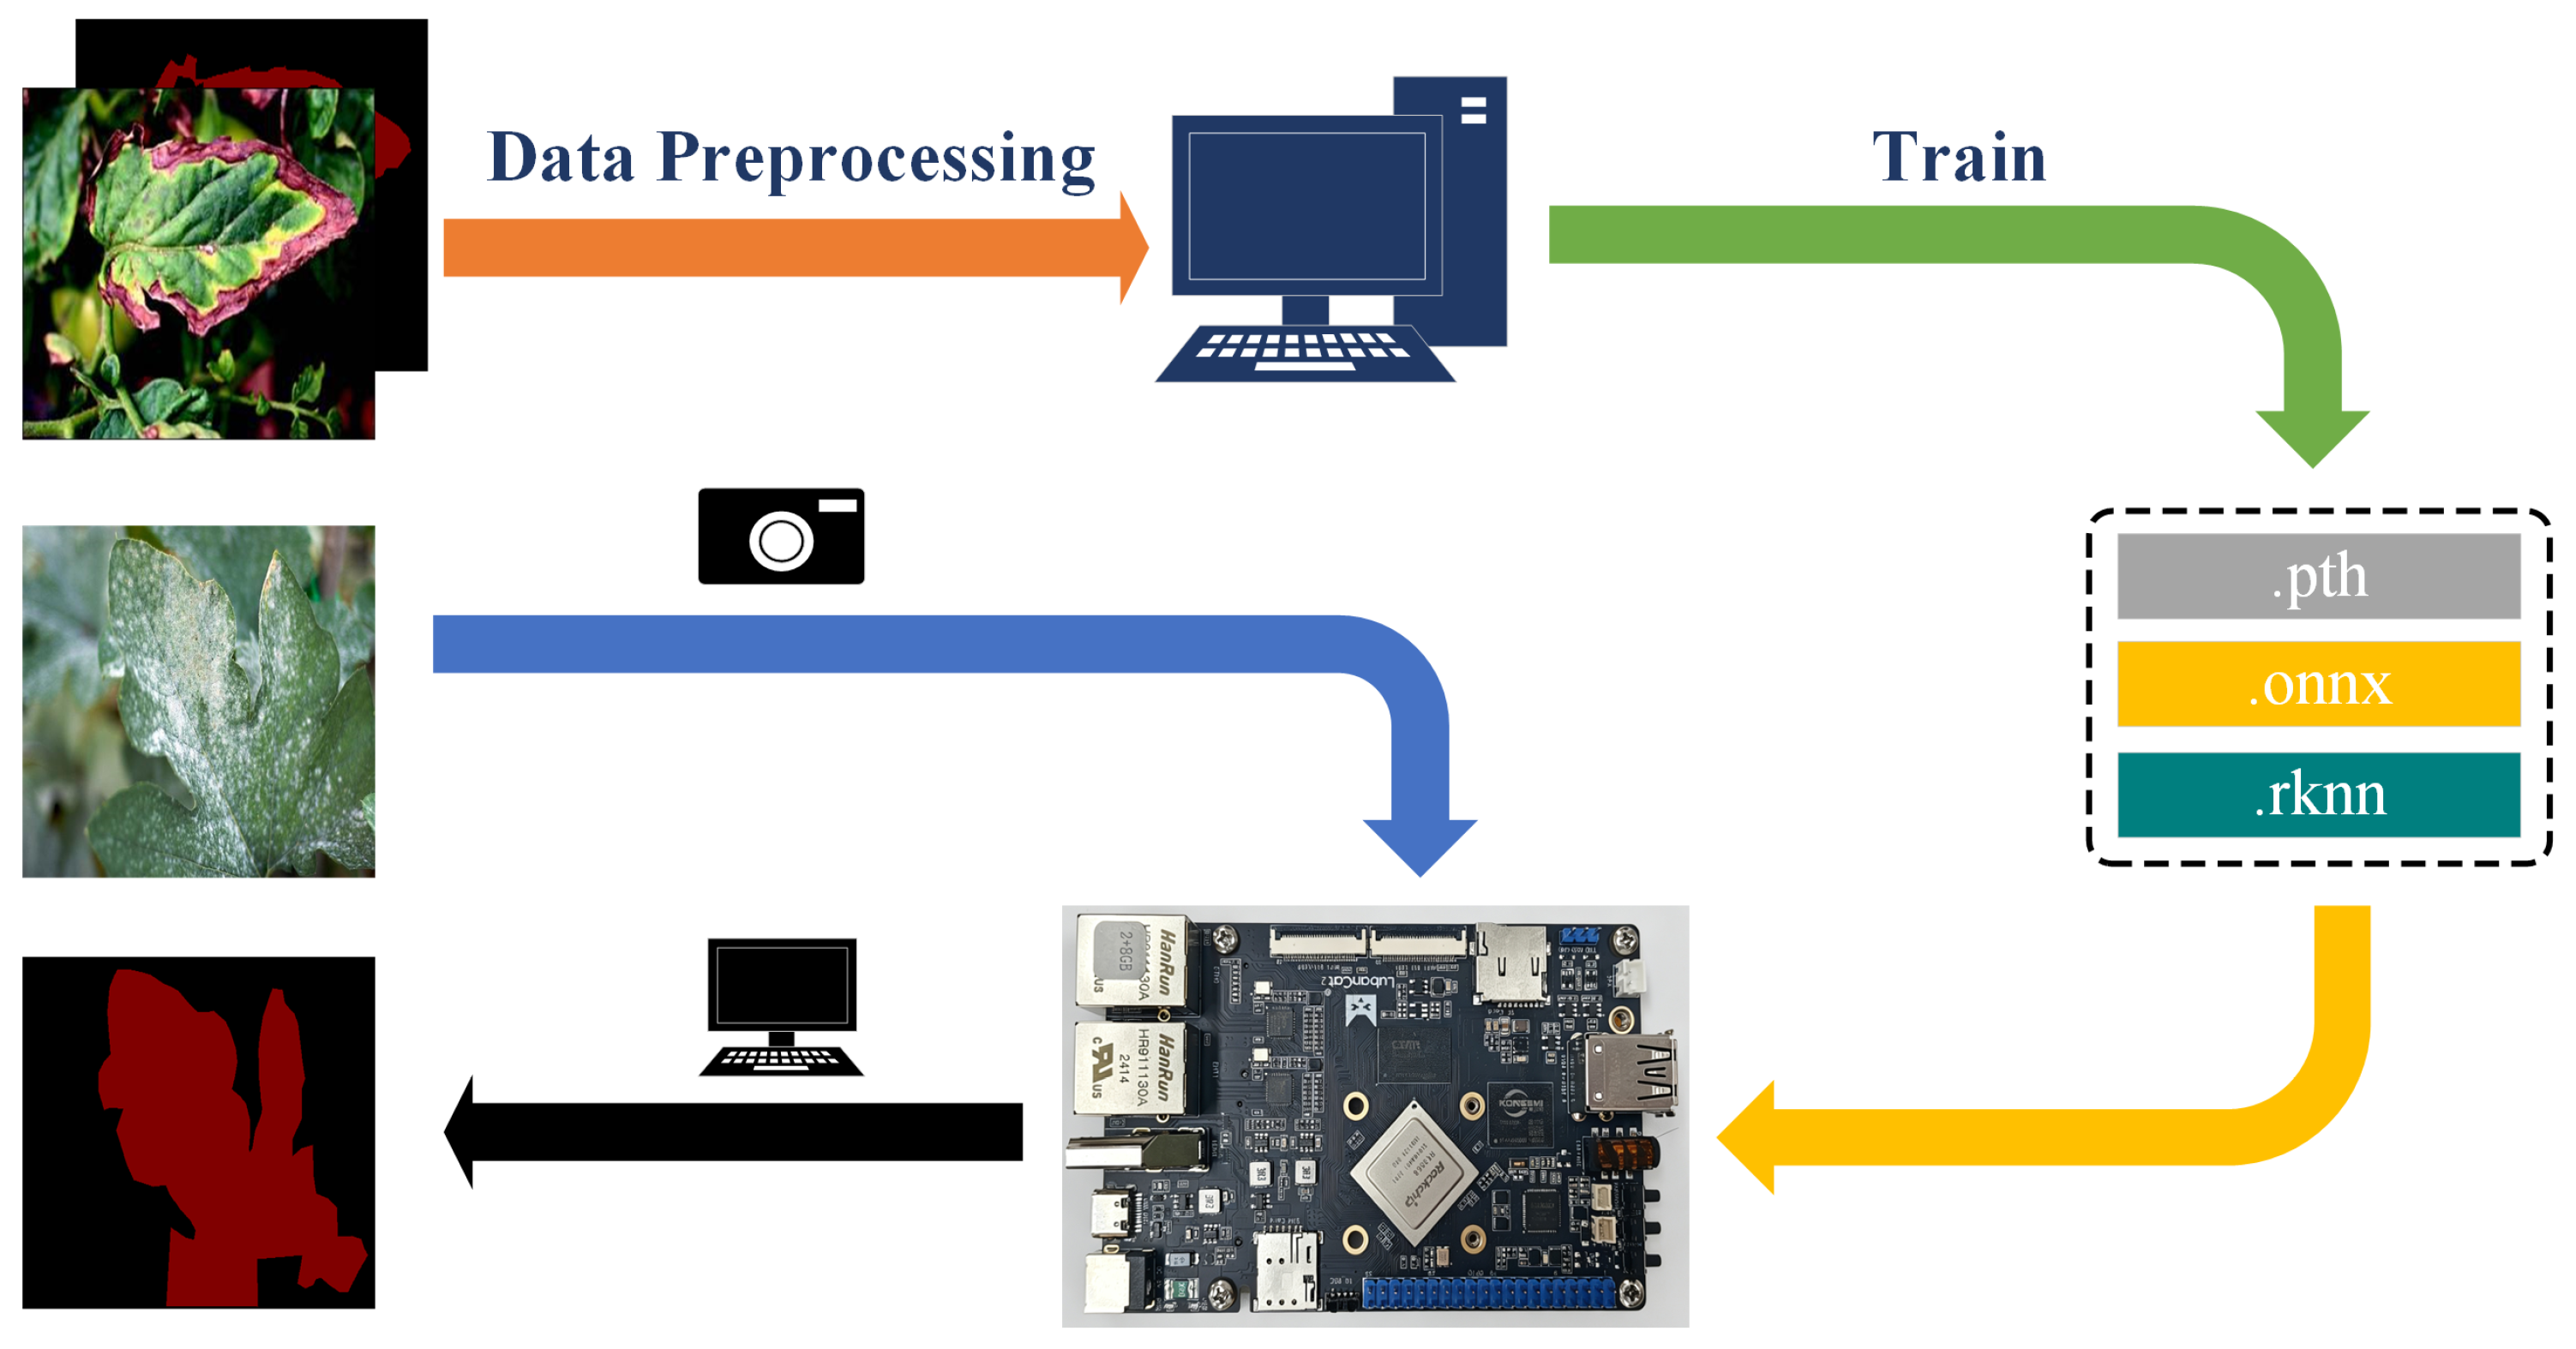
To evaluate the deployment feasibility of the DHB-DeepLabV3+ disease segmentation model on an embedded platform, the trained model weights were converted into an ONNX intermediate representation and further transformed into the RKNN format supported by the RK3568 NPU. The deployment process enables the model to be executed on the embedded platform and provides a preliminary verification of its compatibility with edge computing devices.
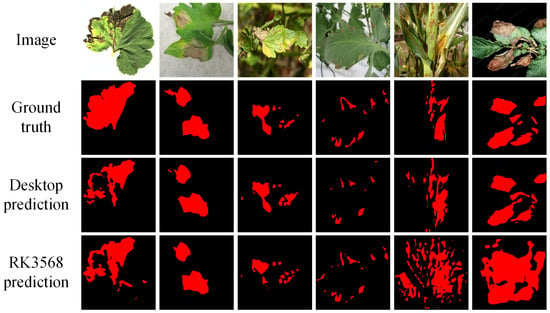
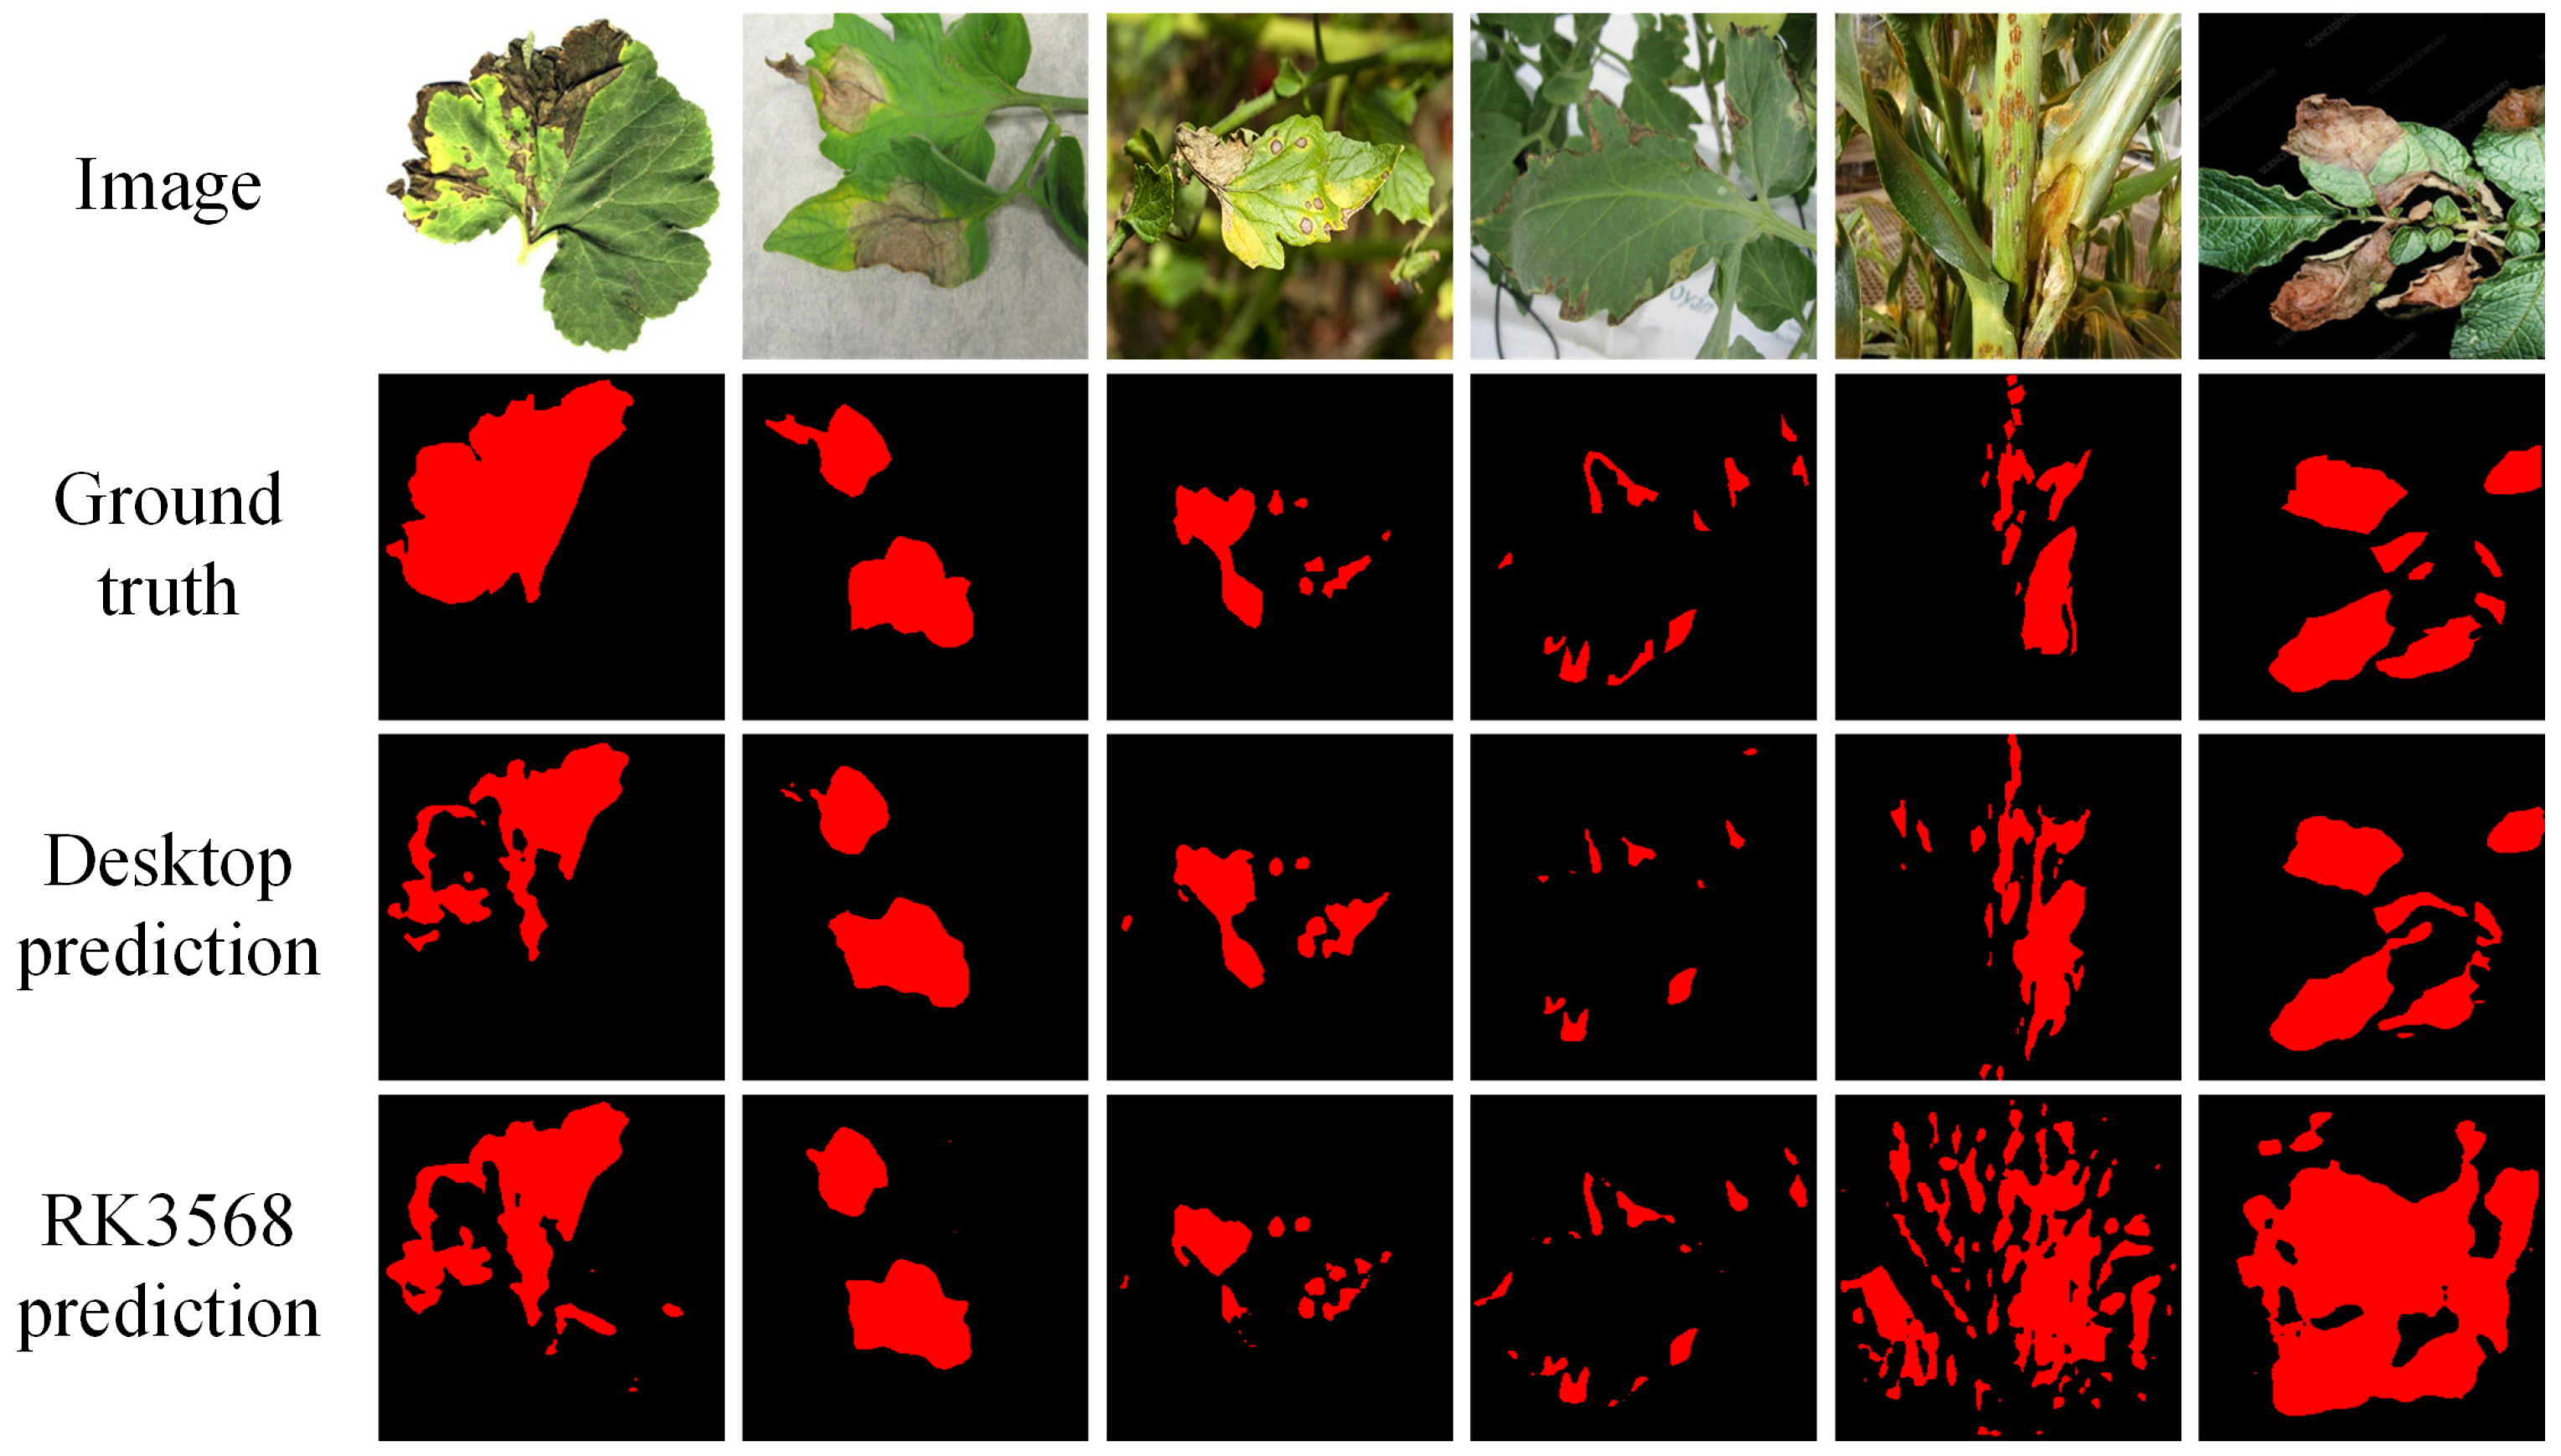
The overall deployment workflow is illustrated in Figure 8. Then, we selected test images from the leaf disease dataset that were not involved in the model training process and performed inference on the LubanCat 2 RK3568 development board (Dongguan EmbedFire Electronic Technology Co., Ltd., Dongguan, China) with the deployed DHB-DeepLabV3+ model. The inference results are shown in Figure 9.
Figure 8.
Deployment workflow of the DHB-DeepLabV3+ model on the RK3568 development board (agricultural disease images from the leaf disease dataset, CC0: Public Domain). The orange arrow indicates preprocessing of the image–mask pairs for model training. The green arrow represents model training on the desktop computer and subsequent conversion of the trained model from PyTorch (.pth) through ONNX (.onnx) to RKNN (.rknn) format. The yellow arrow indicates deployment of the converted RKNN model to the RK3568 development board. The blue arrow represents the input of test images for on-device inference, and the black arrow indicates the output and display of the predicted segmentation masks.
Figure 9.
Inference results of the RK3568-deployed DHB-DeepLabV3+ model on test images from the leaf disease dataset (CC0: Public Domain). The last two columns illustrate failure cases of the deployed model.
Figure 9 presents six samples from the test set of the leaf disease dataset, including the original images, ground-truth masks, desktop predictions, and RK3568 predictions. The deployed model successfully performed disease segmentation inference on the RK3568 platform, with the first four examples showing broadly corresponding lesion locations between the desktop and device predictions despite local differences in region coverage and contours. To provide a more balanced qualitative assessment, the last two columns illustrate failure cases in which the RK3568 predictions contain more extensive false-positive regions and merge separate lesion areas compared with the desktop results. These errors suggest confusion between lesions and surrounding plant structures, identifying foreground discrimination and region separation as specific aspects for further refinement. These results indicate that the ONNX-to-RKNN deployment workflow enables the trained network to execute on the RK3568 NPU and complete pixel-wise disease segmentation on actual embedded hardware. Together with the retained lesion localization responses in several examples, this demonstrates the technical feasibility of deploying DHB-DeepLabV3+ for embedded agricultural disease segmentation.
4. Discussion
The experimental results from three datasets collectively demonstrate that as lesion morphological complexity, scale variations, and background complexity increase, the performance differences among various methods gradually become apparent. Traditional encoder–decoder methods have relatively limited performance under multiple types of lesions and complex boundary conditions, and larger model capacities may not necessarily translate into stable disease segmentation performance. For example, Swin-UNet has a large parameter scale, but has not shown corresponding advantages on more complex datasets; EBMA-Net achieved slightly higher mIoU and Dice on the leaf disease dataset, indicating its competitive ability to characterize complex lesions. However, its computational cost was significantly higher than DHB-DeepLabV3+, and this advantage was not maintained on the PlantSeg dataset. DHB-DeepLabV3+ achieved consistent segmentation performance across three datasets with different characteristics, indicating that the key to agricultural disease segmentation is not simply increasing model capacity, but how to effectively coordinate disease spot information, semantic context, and boundary structure at different scales.
However, agricultural disease segmentation remains challenging when image characteristics vary across crops, acquisition environments, and disease appearances. Such distribution variations may affect the direct transfer of segmentation models to practical scenarios, especially when background information and lesion morphology differ significantly from the training data [34,35]. Therefore, improving the robustness of models under diverse data conditions remains an important consideration for practical agricultural vision applications.
The loss-function comparisons and ablation experiments show that overall segmentation performance and GT-band performance do not necessarily improve together. On the leaf disease dataset, WCE achieves higher mean , , and than EBS Loss, but lower overall segmentation scores. Similarly, adding BAFE alone to the Baseline improves all four mean GT-band scores while reducing overall segmentation performance and increasing model complexity. In contrast, the matched ablation comparisons show mIoU gains when BAFE is added to configurations containing HGCA, DGFI, or both. These findings support interpreting BAFE as a complementary structural feature enhancement component whose benefit to overall segmentation is conditional on the accompanying semantic and contextual representations. The GT-band scores measure lesion classification performance within reference-defined bands and do not directly establish improved contour localization or reduced false-positive predictions outside those bands.
Although the experiments demonstrate the effectiveness of DHB-DeepLabV3+, several aspects of the method still require further improvement. The BAFE module uses Sobel and Laplacian operators to capture explicit structural changes. In regions with dense leaf veins, complex textures, or gradual color transitions, these operators may also respond to structures unrelated to true lesion boundaries. The decrease in overall segmentation scores, despite higher GT-band scores, when BAFE is added to the Baseline alone suggests that its benefit to overall segmentation depends on the accompanying semantic and contextual representations. In addition, the multi-scale representation capability of DHB-DeepLabV3+ is still based on predefined multi-scale features and sparse selection mechanisms. When lesion scales vary more widely or lesion morphology becomes more complex, a limited set of scale candidates may not fully capture all useful representations. Resizing high-resolution field images to pixels may obscure very small lesions and fine boundary details. This effect has not been specifically quantified in the present study; comparing aggregate segmentation metrics across input resolutions alone would not isolate the impact on small lesions. Future work will quantify the retention of annotated lesion regions during resizing, evaluate region-level recall stratified by lesion size against the original-resolution annotations, and investigate overlapping patches extracted from the original images with global context fusion to improve the preservation of local lesion details.
Furthermore, although the three datasets cover different crops, disease categories, and imaging characteristics, each dataset was independently divided into training and testing subsets. Therefore, the current experiments mainly reflect the robustness of DHB-DeepLabV3+ under different dataset characteristics rather than a strict cross-domain generalization evaluation. Assessing model transferability across unseen domains remains an important direction for future research, and domain adaptation strategies provide a potential approach for reducing distribution differences between agricultural scenarios [36].
The lightweight design of DHB-DeepLabV3+ (lite) reduces computational complexity while maintaining competitive segmentation performance, providing potential for deployment in resource-limited scenarios. Lightweight architectures have been increasingly investigated for agricultural vision applications where computational resources are constrained [37,38]. However, the current RK3568 experiment mainly verifies the feasibility of model conversion and execution on an embedded platform. Further studies will focus on systematic edge-device evaluation, including inference efficiency and resource consumption, to comprehensively assess the deployment performance of DHB-DeepLabV3+.
5. Conclusions
This study proposes DHB-DeepLabV3+ for agricultural disease image segmentation, with a focus on large variations in lesion scale, complex background interference, and ambiguous boundaries. Built on DeepLabV3+, the model strengthens interaction among multi-scale features and improves the integration of high-level semantics with spatial details. In this way, lesion-region representation and boundary information can be optimized in a more coordinated manner. In addition, EBS Loss combines multi-scale boundary priors with prediction uncertainty to provide stronger supervision for ambiguous boundaries and easily confused regions, while preserving the integrity of the lesion area.
Across five independent runs, DHB-DeepLabV3+ achieved mean mIoU values of 88.45 ± 0.26%, 82.52 ± 0.35%, and 81.72 ± 0.38% on the rice disease dataset, leaf disease dataset, and PlantSeg dataset, respectively (mean ± standard deviation). The loss-function comparison and ablation experiments further confirmed the benefit of coordinating scale modeling, semantic aggregation, and boundary constraints. The lightweight version reduced the parameter count and computational cost to 6.67 M and 2.36 GFLOPs, respectively, while retaining segmentation performance close to that of the full model. The model was also successfully deployed and evaluated on an RK3568 development board. Overall, DHB-DeepLabV3+ provides a favorable balance between segmentation accuracy and model complexity and demonstrates the feasibility of deployment for fine-grained agricultural disease segmentation on the RK3568 platform.
Author Contributions
Conceptualization, L.S., K.S. and Z.J.; methodology, Y.W. and X.J.; investigation, Y.W. and Z.L.; validation, L.S.; visualization, K.S.; writing—original draft, K.S.; writing—review and editing, L.S., Y.W., Z.L., H.L., Z.J. and X.J.; supervision, H.L. and X.J.; funding acquisition, Z.J. All authors have read and agreed to the published version of the manuscript.
Funding
This study was funded by the National Key Research and Development Program of China (2017YFE0135700) and Zhejiang A&F University Research Startup Funds (203402004501).
Institutional Review Board Statement
Not applicable.
Informed Consent Statement
Not applicable.
Data Availability Statement
The datasets analyzed in this study are openly available from their respective public repositories. The rice disease dataset is openly available in GitHub at https://github.com/ZhouGuoXiong/Rice-Leaf-Disease-Segmentation-Dataset-Code (accessed on 2 May 2026) under the CC BY 4.0 license (DOI: https://doi.org/10.34133/plantphenomics.0218). The leaf disease dataset is openly available in Kaggle at https://www.kaggle.com/datasets/fakhrealam9537/leaf-disease-segmentation-dataset under the CC0: Public Domain license (accessed on 3 June 2026). The PlantSeg dataset is openly available in Zenodo at https://doi.org/10.5281/zenodo.14935094 under the CC BY-NC-ND 4.0 license (DOI: https://doi.org/10.1038/s41597-025-06513-4).
Conflicts of Interest
The authors declare no conflicts of interest.
Abbreviations
The following abbreviations are used in this manuscript:
| ASPP | Atrous Spatial Pyramid Pooling |
| BAFE | Boundary-Aware Feature Enhancement |
| DGFI | Dynamic Gated Feature Interaction |
| EBS Loss | Enhanced Boundary Sensitive Loss |
| HGCA | Hierarchical Gated Context Aggregation |
| mIoU | mean intersection over Union |
| mAcc | mean accuracy |
References
- Kundu, N.; Rani, G.; Dhaka, V.S.; Gupta, K.; Nayaka, S.C.; Vocaturo, E.; Zumpano, E. Disease detection, severity prediction, and crop loss estimation in MaizeCrop using deep learning. Artif. Intell. Agric. 2022, 6, 276–291. [Google Scholar] [CrossRef] [Scilit]
- Dhaka, V.S.; Kundu, N.; Rani, G.; Zumpano, E.; Vocaturo, E. Role of Internet of Things and Deep Learning Techniques in Plant Disease Detection and Classification: A Focused Review. Sensors 2023, 23, 7877. [Google Scholar] [CrossRef] [Scilit] [PubMed]
- Gangwar, A.; Dhaka, V.S.; Rani, G.; Khandelwal, S.; Zumpano, E.; Vocaturo, E. Time and Space Efficient Multi-Model Convolution Vision Transformer for Tomato Disease Detection from Leaf Images with Varied Backgrounds. Comput. Mater. Contin. 2024, 79, 117–142. [Google Scholar] [CrossRef] [Scilit]
- Maurmo, D.; Gagliardi, M.; Ruga, T.; Zumpano, E.; Vocaturo, E. Boosting Agricultural Diagnostics: Cassava Disease Detection with Transfer Learning and Explainable AI. In Proceedings of the 2024 IEEE International Conference on Big Data (BigData); IEEE: Piscataway, NJ, USA, 2024; pp. 4702–4710. [Google Scholar] [CrossRef] [Scilit]
- Bhatti, M.A.; Syam, M.; Chen, H.; Hu, Y.; Keung, L.W.; Zeeshan, Z.; Ali, Y.A.; Sarhan, N. Utilizing convolutional neural networks (CNN) and U-Net architecture for precise crop and weed segmentation in agricultural imagery: A deep learning approach. Big Data Res. 2024, 36, 100465. [Google Scholar] [CrossRef] [Scilit]
- Kotwal, J.; Kashyap, R.; Pathan, S. Agricultural plant diseases identification: From traditional approach to deep learning. Mater. Today Proc. 2023, 80, 344–356. [Google Scholar] [CrossRef] [Scilit]
- Mao, R.; Zhang, Y.; Wang, Z.; Hao, X.; Zhu, T.; Gao, S.; Hu, X. DAE-Mask: A novel deep-learning-based automatic detection model for in-field wheat diseases. Precis. Agric. 2024, 25, 785–810. [Google Scholar] [CrossRef] [Scilit]
- Polly, R.; Devi, E.A. Semantic segmentation for plant leaf disease classification and damage detection: A deep learning approach. Smart Agric. Technol. 2024, 9, 100526. [Google Scholar] [CrossRef] [Scilit]
- Wu, X.; Liu, Y.; Xing, M.; Yang, C.; Hong, S. Image segmentation for pest detection of crop leaves by improvement of regional convolutional neural network. Sci. Rep. 2024, 14, 24160. [Google Scholar] [CrossRef] [Scilit] [PubMed]
- Haider, A.; Arsalan, M.; Hong, J.S.; Sultan, H.; Ullah, N.; Park, K.R. Multi-scale and multi-receptive field-based feature fusion for robust segmentation of plant disease and fruit using agricultural images. Appl. Soft Comput. 2024, 167, 112300. [Google Scholar] [CrossRef] [Scilit]
- Wang, Y.; Yang, L.; Liu, X.; Yan, P. An improved semantic segmentation algorithm for high-resolution remote sensing images based on DeepLabv3+. Sci. Rep. 2024, 14, 9716. [Google Scholar] [CrossRef] [Scilit] [PubMed]
- Chen, H.; Qin, Y.; Liu, X.; Wang, H.; Zhao, J. An improved DeepLabv3+ lightweight network for remote-sensing image semantic segmentation. Complex Intell. Syst. 2024, 10, 2839–2849. [Google Scholar] [CrossRef] [Scilit]
- Li, Y. The research on landslide detection in remote sensing images based on improved DeepLabv3+ method. Sci. Rep. 2025, 15, 7957. [Google Scholar] [CrossRef] [Scilit] [PubMed]
- Zhang, X.; Li, F.; Zheng, H.; Mu, W. UPFormer: U-sharped perception lightweight transformer for segmentation of field grape leaf diseases. Expert Syst. Appl. 2024, 249, 123546. [Google Scholar] [CrossRef] [Scilit]
- Wang, H.; Ma, Z.; Ren, Y.; Du, S.; Lu, H.; Shang, Y.; Hu, S.; Zhang, G.; Meng, Z.; Wen, C.; et al. Interactive image segmentation based field boundary perception method and software for autonomous agricultural machinery path planning. Comput. Electron. Agric. 2024, 217, 108568. [Google Scholar] [CrossRef] [Scilit]
- Borse, S.; Wang, Y.; Zhang, Y.; Porikli, F. Inverseform: A loss function for structured boundary-aware segmentation. In Proceedings of the 2021 IEEE/CVF Conference on Computer Vision and Pattern Recognition (CVPR); IEEE: Piscataway, NJ, USA, 2021; pp. 5897–5907. [Google Scholar] [CrossRef] [Scilit]
- Zhou, H.; Peng, Y.; Zhang, R.; He, Y.; Li, L.; Xiao, W. GS-DeepLabV3+: A mountain tea disease segmentation network based on improved shuffle attention and gated multidimensional feature extraction. Crop Prot. 2024, 183, 106762. [Google Scholar] [CrossRef] [Scilit]
- Zeng, W.; He, M. Rice disease segmentation method based on CBAM-CARAFE-DeepLabv3+. Crop Prot. 2024, 180, 106665. [Google Scholar] [CrossRef] [Scilit]
- Xu, Y.; Ma, B.; Yu, G.; Zhang, R.; Tan, H.; Dong, F.; Bian, H. Accurate cotton verticillium wilt segmentation in field background based on the two-stage lightweight DeepLabV3+ model. Comput. Electron. Agric. 2025, 229, 109814. [Google Scholar] [CrossRef] [Scilit]
- Ding, Y.; Yang, W.; Zhang, J. An improved DeepLabV3+ based approach for disease spot segmentation on apple leaves. Comput. Electron. Agric. 2025, 231, 110041. [Google Scholar] [CrossRef] [Scilit]
- Nasiri, A.; Omid, M.; Taheri-Garavand, A.; Jafari, A. Deep learning-based precision agriculture through weed recognition in sugar beet fields. Sustain. Comput. Inform. Syst. 2022, 35, 100759. [Google Scholar] [CrossRef] [Scilit]
- Wang, J.; Jia, J.; Zhang, Y.; Wang, H.; Zhu, S. RAAWC-UNet: An apple leaf and disease segmentation method based on residual attention and atrous spatial pyramid pooling improved UNet with weight compression loss. Front. Plant Sci. 2024, 15, 1305358. [Google Scholar] [CrossRef] [Scilit] [PubMed]
- Fan, Y.; Yu, M.; Shen, L.; Ma, J.; Zeng, Z.; Wang, H. Robust plant disease segmentation in complex field environments: An in-depth analysis and validation with STAR-Net. Front. Plant Sci. 2026, 16, 1706072. [Google Scholar] [CrossRef] [Scilit] [PubMed]
- Feng, C.; Fan, Y.; Chen, X.; Wang, H. PlantFormer: A precise plant disease segmentation network with interactive backbone and global-anisotropic context aggregation. Front. Plant Sci. 2026, 17, 1853571. [Google Scholar] [CrossRef] [Scilit] [PubMed]
- Sun, G.; Li, T.; Pan, Y.; Zhu, Z.; Yang, T.; Shao, F.; Guo, J.; Xin, J. Gradient-guided boundary-aware selective scanning with multi-scale context aggregation for plant lesion segmentation. Front. Plant Sci. 2025, 16, 1727075. [Google Scholar] [CrossRef] [Scilit] [PubMed]
- Dai, W.; Zhu, W.; Zhou, G.; Liu, G.; Xu, J.; Zhou, H.; Hu, Y.; Liu, Z.; Li, J.; Li, L. AISOA-SSformer: An effective image segmentation method for rice leaf disease based on the transformer architecture. Plant Phenomics 2024, 6, 0218. [Google Scholar] [CrossRef] [Scilit] [PubMed]
- Wei, T.; Chen, Z.; Yu, X.; Chapman, S.; Melloy, P.; Huang, Z. A large-scale in-the-wild dataset for plant disease segmentation. Sci. Data 2026, 13, 205. [Google Scholar] [CrossRef] [Scilit] [PubMed]
- Ronneberger, O.; Fischer, P.; Brox, T. U-net: Convolutional networks for biomedical image segmentation. In Proceedings of the International Conference on Medical Image Computing and Computer-Assisted Intervention; Springer: Cham, Switzerland, 2015; pp. 234–241. [Google Scholar] [CrossRef] [Scilit]
- Badrinarayanan, V.; Kendall, A.; Cipolla, R. Segnet: A deep convolutional encoder-decoder architecture for image segmentation. IEEE Trans. Pattern Anal. Mach. Intell. 2017, 39, 2481–2495. [Google Scholar] [CrossRef] [Scilit] [PubMed]
- Cao, H.; Wang, Y.; Chen, J.; Jiang, D.; Zhang, X.; Tian, Q.; Wang, M. Swin-unet: Unet-like pure transformer for medical image segmentation. In Computer Vision–ECCV 2022 Workshops; Springer: Cham, Switzerland, 2023; pp. 205–218. [Google Scholar] [CrossRef] [Scilit]
- Shu, X.; Ding, J.; Wang, W.; Jiao, Y.; Wu, Y. Enhanced disease segmentation in pear leaves via edge-aware multi-scale attention network. Sensors 2025, 25, 5058. [Google Scholar] [CrossRef] [Scilit] [PubMed]
- Wang, W.; Ding, J.; Shu, X.; Xu, W.; Wu, Y. FFAE-UNet: An efficient pear leaf disease segmentation network based on U-shaped architecture. Sensors 2025, 25, 1751. [Google Scholar] [CrossRef] [Scilit] [PubMed]
- Liu, L.; Li, G.; Du, Y.; Li, X.; Wu, X.; Qiao, Z.; Wang, T. CS-net: Conv-simpleformer network for agricultural image segmentation. Pattern Recognit. 2024, 147, 110140. [Google Scholar] [CrossRef] [Scilit]
- Xu, M.; Park, J.E.; Lee, J.; Yang, J.; Yoon, S. Plant disease recognition datasets in the age of deep learning: Challenges and opportunities. Front. Plant Sci. 2024, 15, 1452551. [Google Scholar] [CrossRef] [Scilit] [PubMed]
- Tunio, M.H.; Li, J.P.; Zeng, X.; Ahmed, A.; Shah, S.A.; Shaikh, H.U.; Mallah, G.A.; Yahya, I.A. Advancing plant disease classification: A robust and generalized approach with transformer-fused convolution and Wasserstein domain adaptation. Comput. Electron. Agric. 2024, 227, 109574. [Google Scholar] [CrossRef] [Scilit]
- Quan, S.; Wang, J.; Jia, Z.; Xu, Q.; Yang, M. Real-time field disease identification based on a lightweight model. Comput. Electron. Agric. 2024, 226, 109467. [Google Scholar] [CrossRef] [Scilit]
- Khan, A.A.T.; Jensen, S.M.; Khan, A.R.; Li, S. Plant disease detection model for edge computing devices. Front. Plant Sci. 2023, 14, 1308528. [Google Scholar] [CrossRef] [Scilit] [PubMed]
- Guan, H.; Fu, C.; Zhang, G.; Li, K.; Wang, P.; Zhu, Z. A lightweight model for efficient identification of plant diseases and pests based on deep learning. Front. Plant Sci. 2023, 14, 1227011. [Google Scholar] [CrossRef] [Scilit] [PubMed]

Disclaimer/Publisher’s Note: The statements, opinions and data contained in all publications are solely those of the individual author(s) and contributor(s) and not of MDPI and/or the editor(s). MDPI and/or the editor(s) disclaim responsibility for any injury to people or property resulting from any ideas, methods, instructions or products referred to in the content. |
© 2026 by the authors. Licensee MDPI, Basel, Switzerland. This article is an open access article distributed under the terms and conditions of the Creative Commons Attribution (CC BY) license.