


Abstract
Cotton production under drip irrigation is common in arid and semi-arid Northwest China. Drip line placement determines the location of fertilizer application; therefore, evaluating the appropriate drip line layout and N application rate is essential for maintaining yield and reducing N losses. A two-year field experiment (2024–2025) was conducted at a single site with three independent replicates per treatment in a randomized complete block design arranged as a 2 × 2 factorial: two drip line layouts (wide-row and narrow-row) crossed with two N rates (300 and 240 kg N ha−1; W300, W240, N300, and N240). Under the wide-row layout, root length density was higher (p < 0.05), and soil NO3−-N was mainly distributed in the 0–60 cm layer during one fertigation cycle and across the fertilization period, overlapping with the root distribution. W240 significantly reduced NO3−-N leaching and residual soil NO3−-N (p < 0.05) and increased root length density and nitrogen partial factor productivity (PFPN) (p < 0.05), without reducing boll biomass, total N uptake, or seed cotton yield (p > 0.05). Under the narrow-row layout, soil NO3−-N migrated rapidly downward and accumulated in the 60–100 cm layer; N240 reduced NO3−-N leaching and residual soil NO3−-N (p < 0.05) but also reduced cotton N uptake and seed cotton yield (p < 0.05), whereas N300 increased residual soil NO3−-N and leaching and reduced PFPN (p < 0.05). Overall, under the soil, climate, cultivar, and irrigation conditions of this two-year single-site experiment, the wide-row layout with 240 kg N ha−1 maintained seed cotton yield while reducing the measured NO3−-N leaching and residual soil NO3−-N.
1. Introduction
Nitrogen (N) is among the most essential nutrients for plants, and both crop growth and yield formation depend heavily on N fertilizer application [1,2]. To maintain high crop yields, N fertilizer is often overapplied [3]. However, over-fertilization with N reduces N use efficiency (NUE) and raises leaching risk [4]. Many studies have indicated that N overapplication causes substantial damage to environmental quality and human health, and can also lead to nutrient imbalance by disrupting the balance among N, P, K, and other nutrients and altering soil nutrient availability [5,6,7,8,9]. Therefore, optimizing N fertilizer management is an effective strategy to increase NUE and reduce N loss [10,11,12].
Cotton (Gossypium hirsutum L.) serves as a key cash crop worldwide. Due to its high economic value, cotton planting areas have increased dramatically [13]. The inland northwest of China is currently the largest cotton-growing region in the country, where drip irrigation is widely used [14]. However, inefficient N fertilization, which leads to low NUE, threatens sustainable cotton production in this region [15,16]. Therefore, identifying factors influencing fertilizer efficiency is essential to reduce N inputs without reducing yield.
Under drip irrigation, water and fertilizer are supplied to crops simultaneously. Drip line layout is critical, as it determines fertilizer placement and may alter water and nutrient distribution in the root zone, thereby affecting yield [17,18,19]. Previous maize studies reported that narrower drip line spacing increased nitrate-N in deep soil and the risk of water and N leaching [20]. In soybean, reduced drip line spacing promoted NO3−-N movement to the root zone, reduced gaseous N losses, and improved yield and N fertilizer use efficiency [21]. Previous studies have focused on the effects of drip line layout on soil moisture and salt distribution and crop growth [22,23,24]. However, studies on the effects of drip line layout on the spatial distribution and dynamics of soil N in cotton fields, as well as on N losses, soil N content, and cotton N uptake, are still lacking.
The root system links plants and soil, and its growth, development, and distribution affect plant N uptake [25,26]. Root length density is a good indicator of a crop’s ability to take up nutrients, and its distribution characteristics are essential for improving water use efficiency and NUE in crops [27,28]. The solubility of NO3−-N in water and its high mobility make it one of the main forms of N loss in farmland. Regulating the location of N supply is one of the most important ways to promote crop root uptake [29]. In drip-irrigated fields, the amount of N leaching depends on soil NO3−-N content and root distribution. Optimizing drip line layout and N application rate is an important measure to control NO3−-N distribution and leaching [30].
Given the current adoption of drip irrigation in cotton production, the location of N fertilizer supply varies with drip line layout. However, knowledge regarding the effects of drip line layout and N application rate on soil NO3−-N distribution, cotton root growth, N uptake and yield remains insufficient. Therefore, the objectives of this study were (1) to investigate the effects of two drip line layouts and N application rates on soil NO3−-N distribution; (2) to determine the distribution characteristics of cotton root length density under the two drip line layouts and N application rates; and (3) to determine the effects of drip line layout and N application on cotton N uptake and yield.
2. Materials and Methods
2.1. Experimental Site
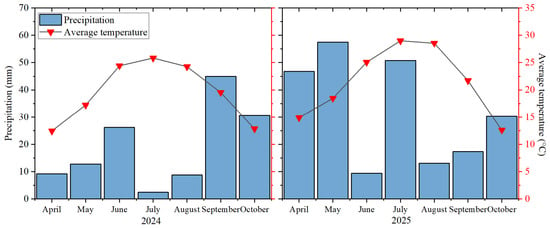
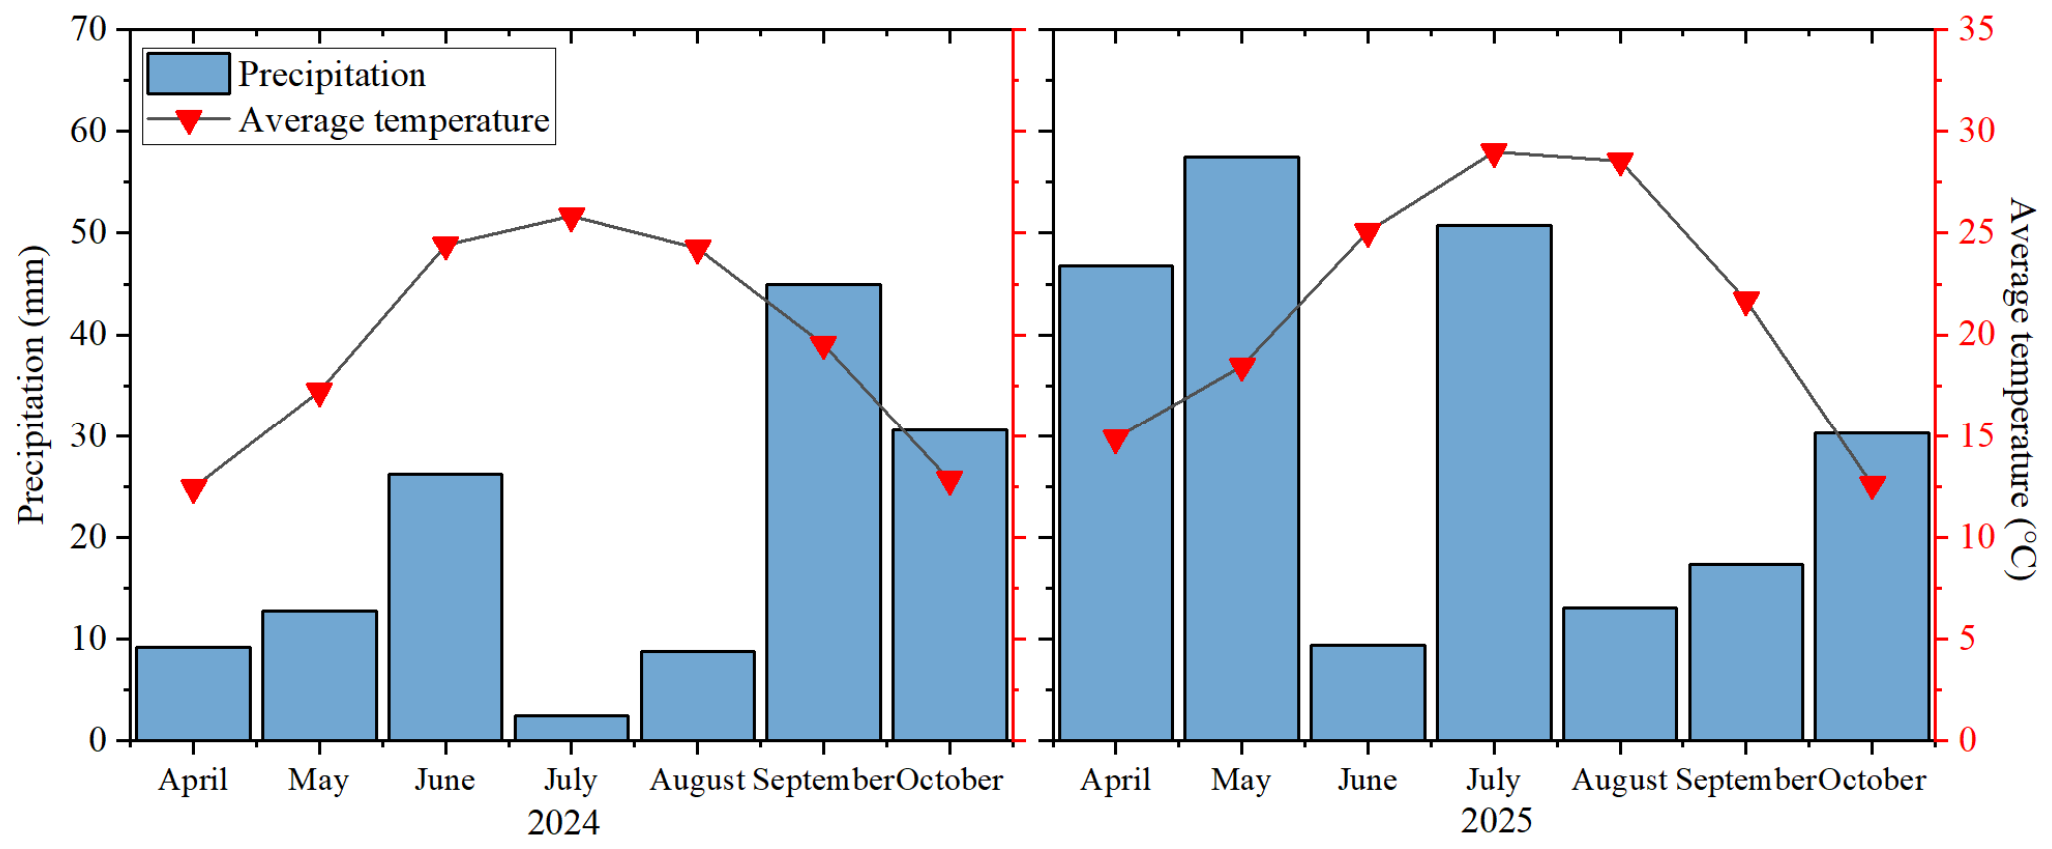
Field experiments were conducted during 2024–2025 in a cotton field at Baotou Lake Farm, Korla City, Xinjiang, China (41.69° N, 85.87° E). The site has a warm temperate continental arid climate, with annual sunshine totaling 2873–3051 h, a frost-free period of 209–216 days, a mean annual temperature of 10.5–11.5 °C, and an effective accumulated temperature of 3996–4280 °C. It is a typical area for long-term, large-scale cotton cultivation in Xinjiang, China. Growing-season climate data (average temperature and precipitation) are presented in Figure 1.
Figure 1.
Cotton growing-season average temperature and precipitation in 2024 and 2025.
The soil is classified as a gray desert soil with a loam texture. Properties of the 0–100 cm layer at the experimental site are listed in Table 1. Groundwater lies approximately 6 m below the surface. Cotton (Gossypium hirsutum L.) cv. ‘Xinluzao 64′ is the test cultivar.
Table 1.
Properties of the 0–100 cm layer at the experimental site.
2.2. Experimental Design and Field Management
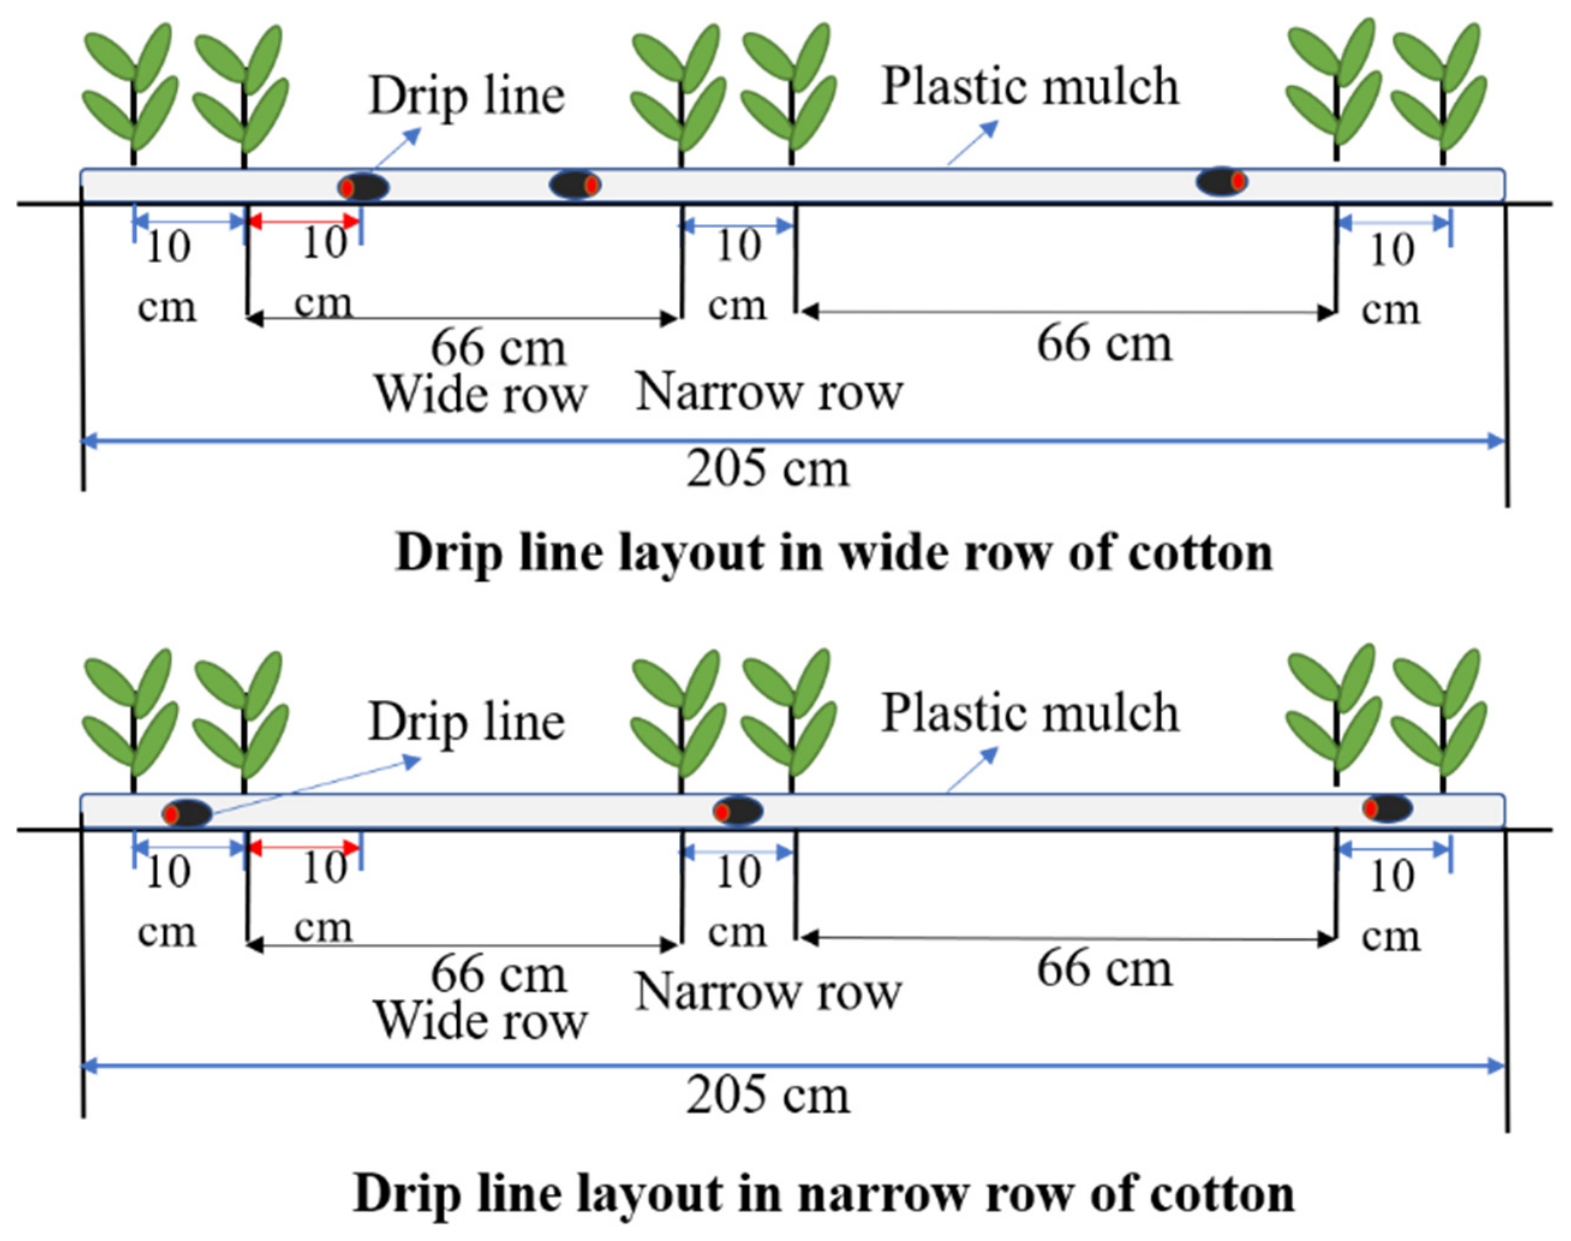
The field experiment used a “one mulch, three drip lines, and six rows of cotton” planting pattern. Two drip line layouts (Figure 2) were combined with two N rates giving four different treatments. For a drip line layout in a wide row of cotton, the application rate of N was 300 kg ha−1 (traditional N application, W300) [31] and 240 kg ha−1 (reduced N application, W240), and for a drip line layout in a narrow row of cotton, the application rates of N was 300 kg ha−1 (N300) and 240 kg ha−1 (N240). The experiment followed a randomized complete block design with three replicates per treatment, giving 12 plots of 70 m2 (7 m × 10 m) each.
In this experiment, white transparent polyethylene (PE) plastic mulch film with a thickness of 0.01 mm and a width of 2.05 m was applied. All drip lines used were single-wing labyrinth emitters, spaced 30 cm apart, and had a flow rate of 2.4 L h−1 for each individual emitter. Cotton was irrigated with 30 mm at sowing. The cotton crop received a seasonal total of 450 mm irrigation water, applied at 7–10 days. Irrigation started in mid-June and ended in late August. The irrigation water was shallow groundwater (pH 7.8), free of pollutants, with a nitrate nitrogen (NO3−-N) concentration of <1 mg L−1. In the experiment, urea (CO(NH2)2, 46% N) served as the N fertilizer, potassium dihydrogen phosphate (KH2PO4, 52% P2O5, 34% K2O) as the P fertilizer, and potassium chloride (KCl, 57% K2O) as the K fertilizer. All fertilizers were applied as topdressing by drip irrigation with water, and the same amounts of phosphorus and potassium fertilizer were applied to all treatments: 105 kg ha−1 of P2O5 and 75 kg ha−1 of K2O. Fertilizers were applied six times and irrigation nine times during the cotton reproductive period, with the amount of irrigation and the proportion of N allocated as shown in Table 2.
Table 2.
Irrigation and N application schedule.
Figure 2.
Diagram of planting pattern and drip line layout methods.
2.3. Sampling and Measurement Methods
2.3.1. Soil NO3−-N Content and Residual Amount
Following the fifth fertigation (boll setting stage), the 0–100 cm soil profile was sampled in 20 cm increments at 24, 48, 72, 96, 120, 144, and 168 h. The same sampling protocol was applied at the full bud, full flowering, boll setting, boll opening, and harvest stages of cotton. Soil samples were collected at the planting positions of the two cotton rows within the narrow row (Figure S1). Soil NO3−-N was extracted with 2 mol L−1 KCl and determined by UV spectrophotometry. Changes in soil NO3−-N during a fertilization cycle, its vertical distribution at different growth stages, and the residual amount at harvest were investigated.
Soil NO3−-N residual amount was calculated using the following equation:
where RN is the total soil NO3−-N residual amount in the 0–100 cm profile (kg ha−1); Ci is the soil NO3−-N concentration in the ith soil layer (mg kg−1, oven-dry soil basis); ρi is the soil bulk density of the ith layer (g cm−3); hi is the thickness of the ith layer (m); n is the number of soil layers; and 10 is the conversion factor used to express the result in kg ha−1.
2.3.2. NO3−-N Leaching Amount
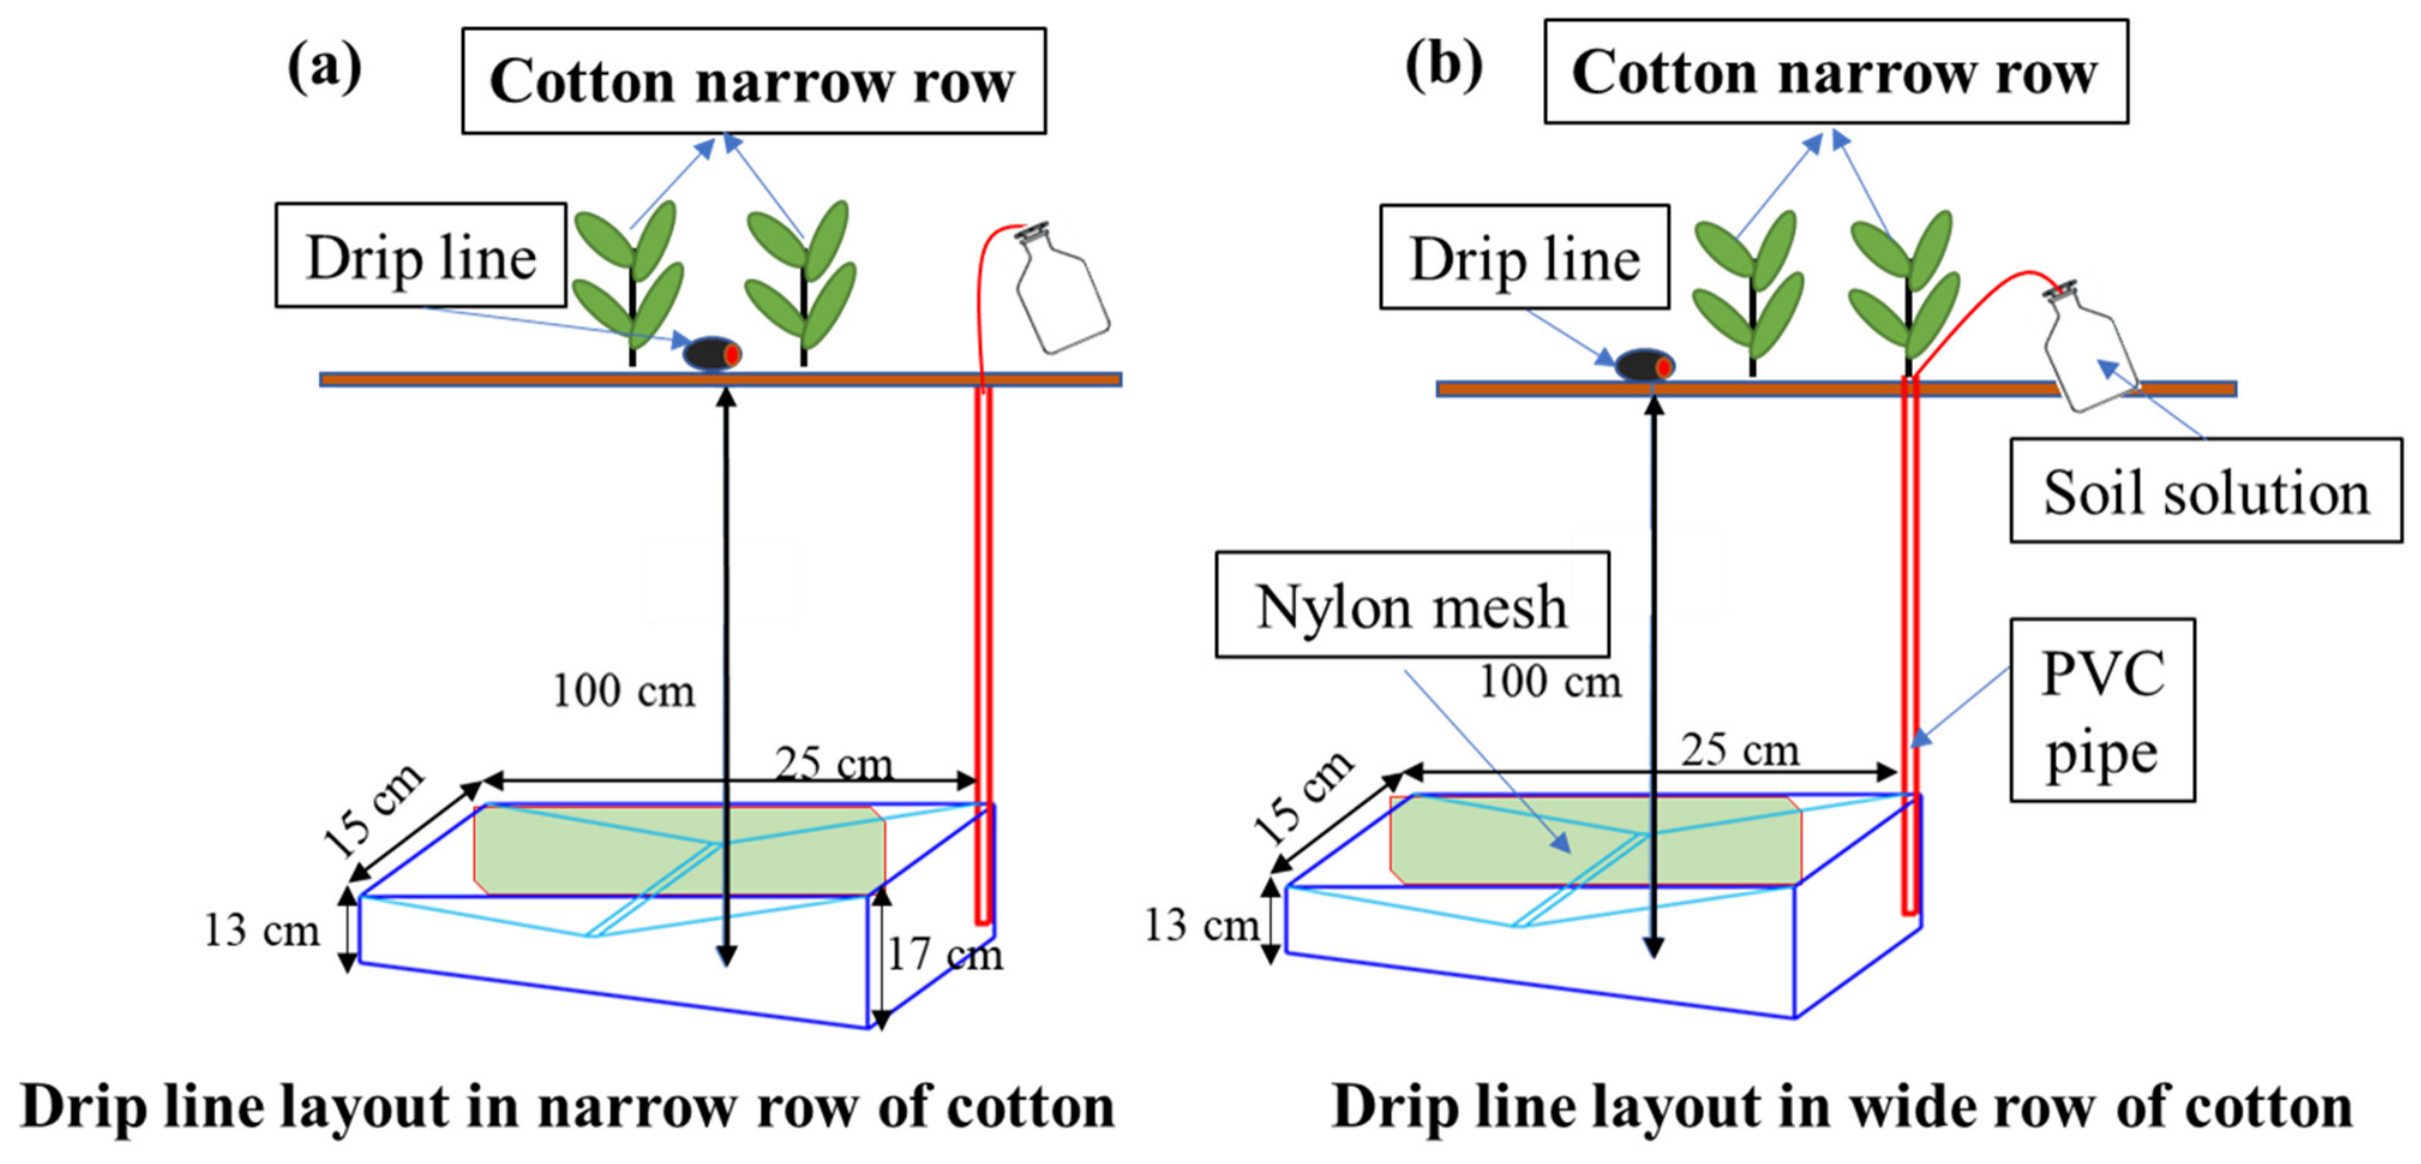
Each plot was equipped with three leachate collection devices prior to cotton sowing (Figure 3). The leachate collection device was installed directly beneath the emitter at a depth of 100 cm, with a collection area of 0.0375 m2. Soil leachate was collected 3–4 days after each fertigation event, and a total of six collection events were conducted during the whole growth period. The leachate volume and NO3−-N content were measured on each sampling occasion. Finally, cumulative NO3−-N leaching was calculated for the whole growth period.
NO3−-N leaching amount was calculated using the following equation:
where L(Total) is the cumulative NO3−-N leaching loss (kg ha−1); n = 6; Ci and Vi are the NO3−-N concentration (mg L−1) and leachate volume (L) of the ith sampling, respectively; A is the collection area of the leachate collector (0.0375 m2); and 0.01 is the conversion factor from mg m−2 to kg ha−1.
Figure 3.
Soil leachate collecting device. Note: (a) is a schematic diagram of the leachate collection device installation under the drip line layout in the narrow row; the center of the leachate collector is located directly below the emitter. (b) is a schematic diagram of the leachate collection device installation under the drip line layout in the wide row; the center of the leachate collector is likewise located directly below the emitter.
2.3.3. Cotton Root System
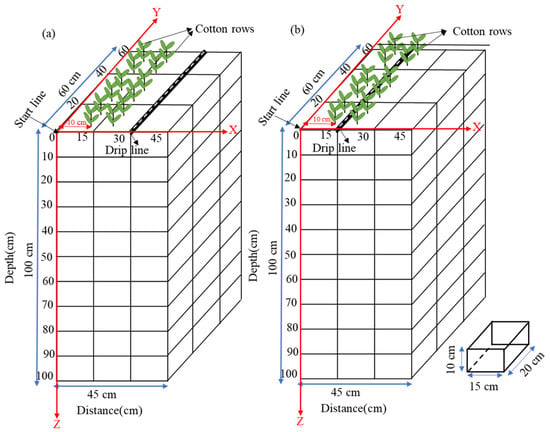
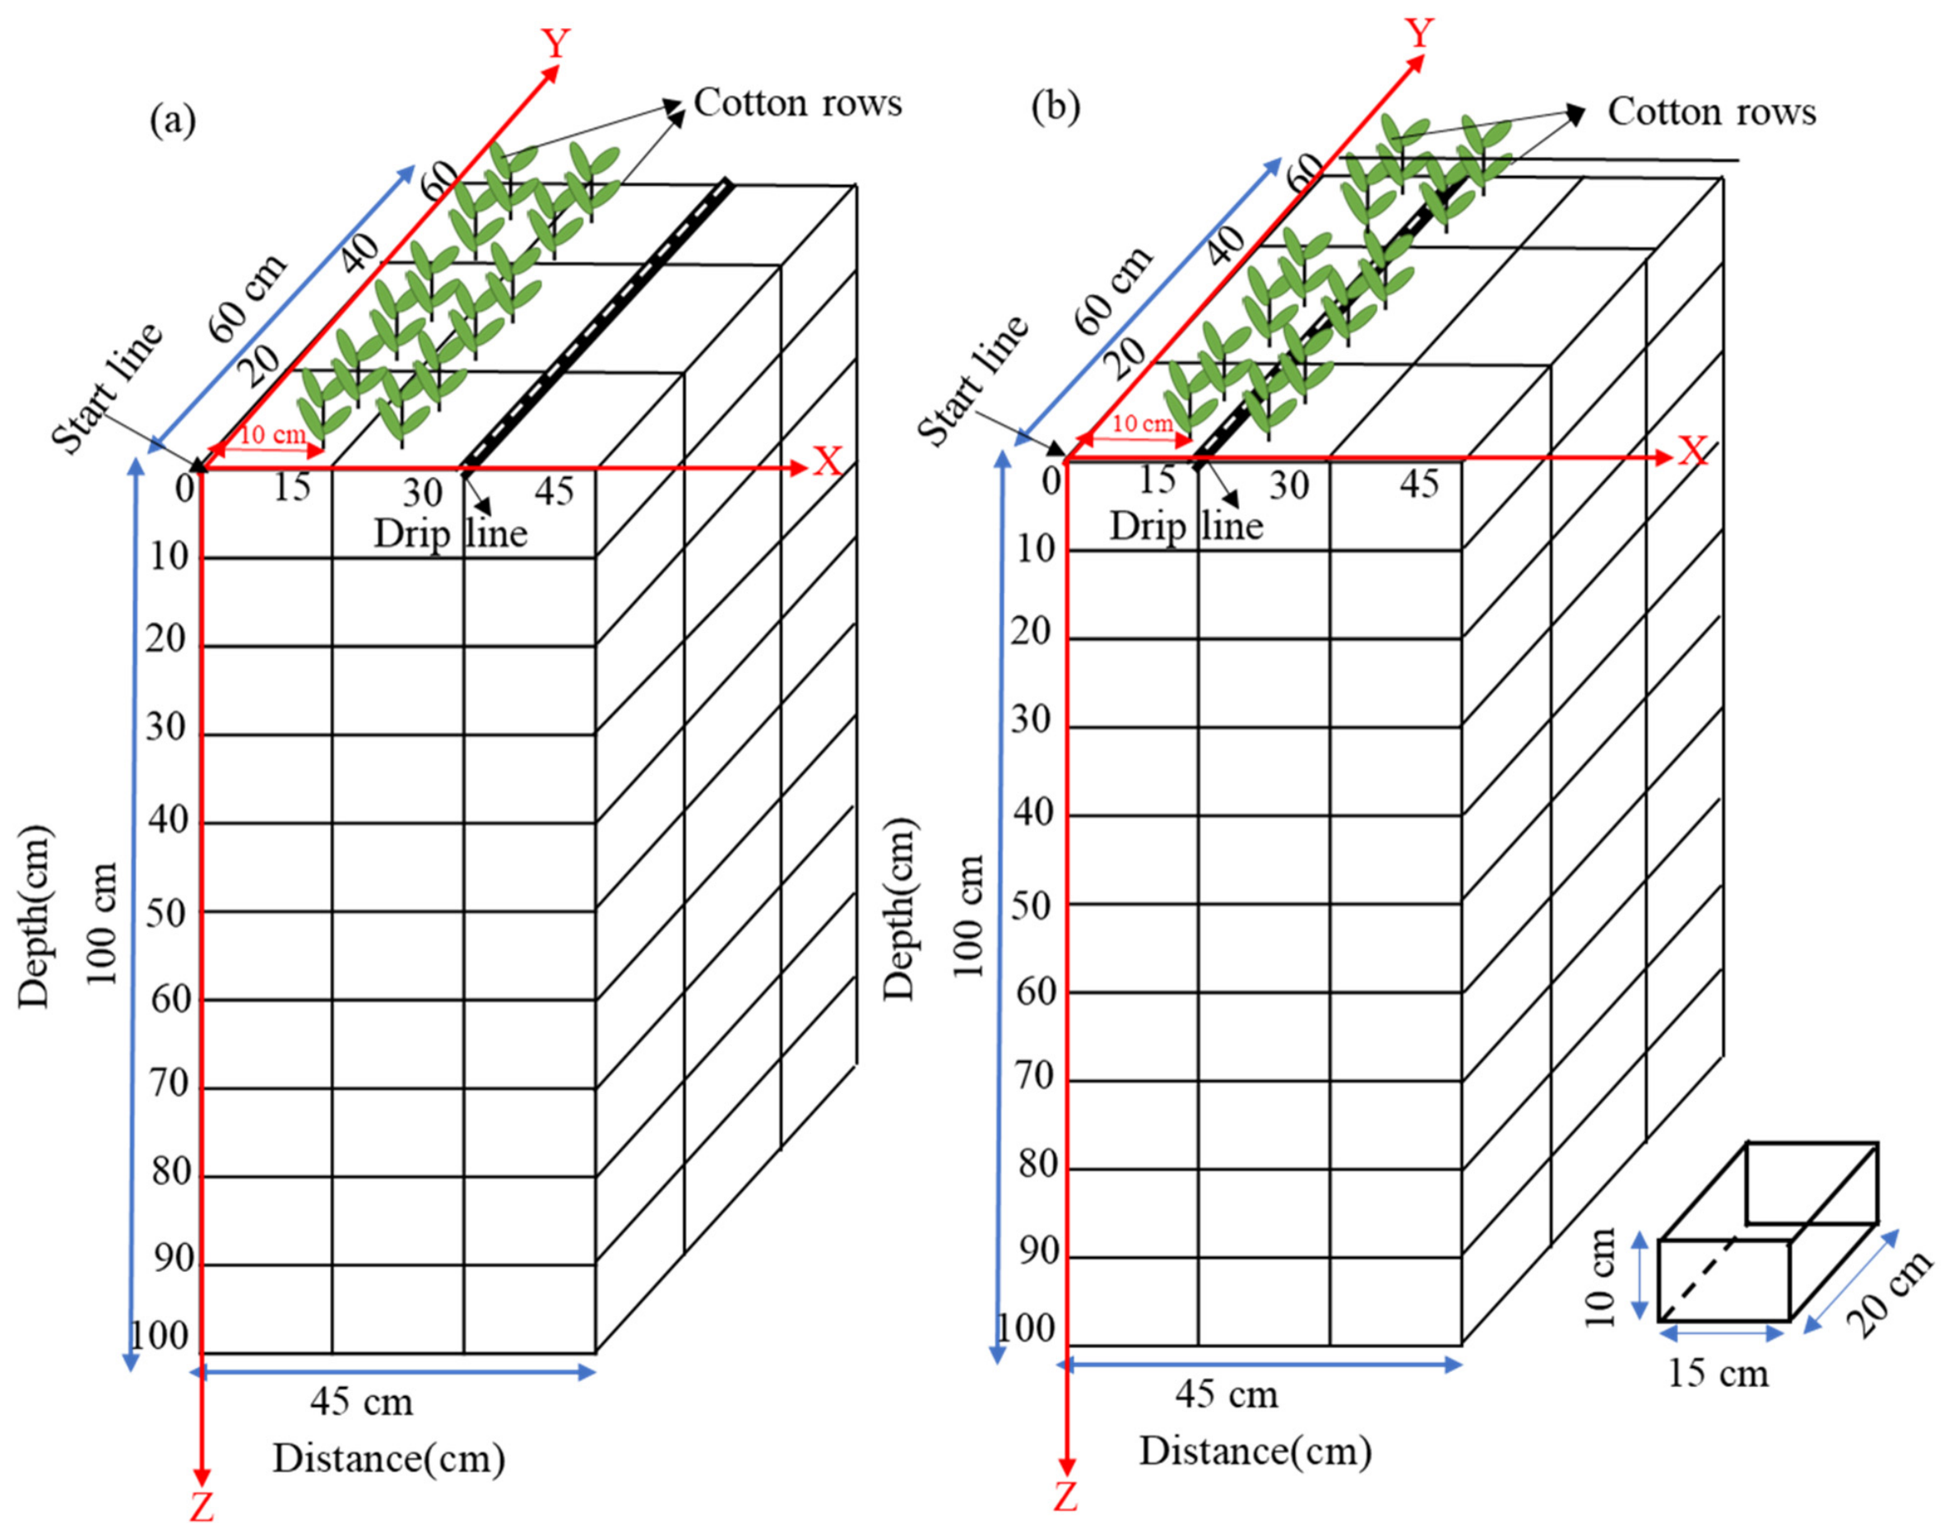
Root traits were measured when the cotton plants reached the boll setting stage (2 August 2025), 24 h after the fifth fertigation. Based on the method of Chen et al. (2020) [27] and Liu et al. (2025) [26], a baseline was established 10 cm from the narrow row (Figure 4). Each slice was defined as a soil block measuring 45 cm along the X-axis, 100 cm along the Z-axis, and 20 cm along the Y-axis. The sampling space was divided into three slices, which served as three replicates and yielded 90 cubes in total. All cotton roots within the soil cubes were collected, passed through a 0.125 mm sieve, and rinsed with deionized water to remove impurities. The roots were then scanned at 300 dpi, and the images were analyzed using WinRhizo software version 2001 (Regent Instruments, Quebec, Canada) to obtain root length data for the soil cubes. Each slice contained the roots of four cotton plants. Root length density (RLD) was calculated as the total root length of the four cotton plants in a slice divided by the total soil volume of that slice:
where ∑RLslice is the total root length (cm) of the four cotton plants in a slice, and Vslice is the total soil volume of the slice (45 × 100 × 20 = 90,000 cm3). RLD is expressed in cm cm−3.
Figure 4.
Schematic of cotton root sampling layout. Note: (a) is a schematic diagram of cotton root sampling under the drip line layout in the wide row, and (b) is a schematic diagram of cotton root sampling under the drip line layout in the narrow row.
2.3.4. Cotton Plant Samples and Yield
At boll opening (15 August 2024 and 18 August 2025), aboveground cotton plants were cut at the soil surface for biomass measurement. Leaves, stems, and bolls were separated and oven-dried at 75 °C. The cotton plant samples were then ground to pass a 0.125 mm sieve and digested with concentrated H2SO4–H2O2 before elemental analysis [32]. An automatic Kjeldahl nitrogen analyzer (B-339, Buchi Labotechnikag, Switzerland) was used to quantify total N in each sample. Nitrogen uptake was calculated using the following equation:
where Nuptake is the organ-specific nitrogen uptake (kg ha−1), CN is the tissue nitrogen concentration (g kg−1), B is the dry biomass per unit land area (kg ha−1), and 1000 converts g ha−1 to kg ha−1. Total plant nitrogen uptake was calculated as the sum of all organs and expressed in kg ha−1.
Ntotal = Nstem + Nleaf + Nboll
At harvest, a representative quadrat was randomly selected in each plot. Plant counts and bolls per plant were recorded for each quadrat, from which plant density was derived. Yield per unit area and boll weight were subsequently determined from a uniform actual harvest.
2.3.5. Water and Nitrogen Partial Factor Productivity (PFPN)
Irrigation water use efficiency (IWUE, kg m−3) was determined as follows: IWUE = seed cotton yield/total gross irrigation water amount [33].
PFPN (kg kg−1) was obtained from: PFPN = seed cotton yield/N application total amount [34].
2.4. Data Analyses
All statistical work was run in SPSS version 21.0 (SPSS Inc., Chicago, IL, USA). Residual normality and variance homogeneity were examined by the Shapiro–Wilk and Levene tests, respectively. ANOVA (Tables S1 and S2) served to compare each parameter among treatments, and Duncan’s multiple range test (p < 0.05) followed for multiple comparisons. OriginPro 2024 (OriginLab Corporation, Northampton, MA, USA) produced the graphs, whereas Surfer 10.0 (Golden Software, Golden, CO, USA) generated the spatial distribution maps.
3. Results
3.1. Changes in Soil NO3−-N During a Fertigation Cycle
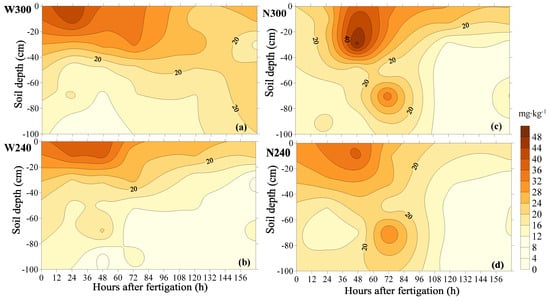
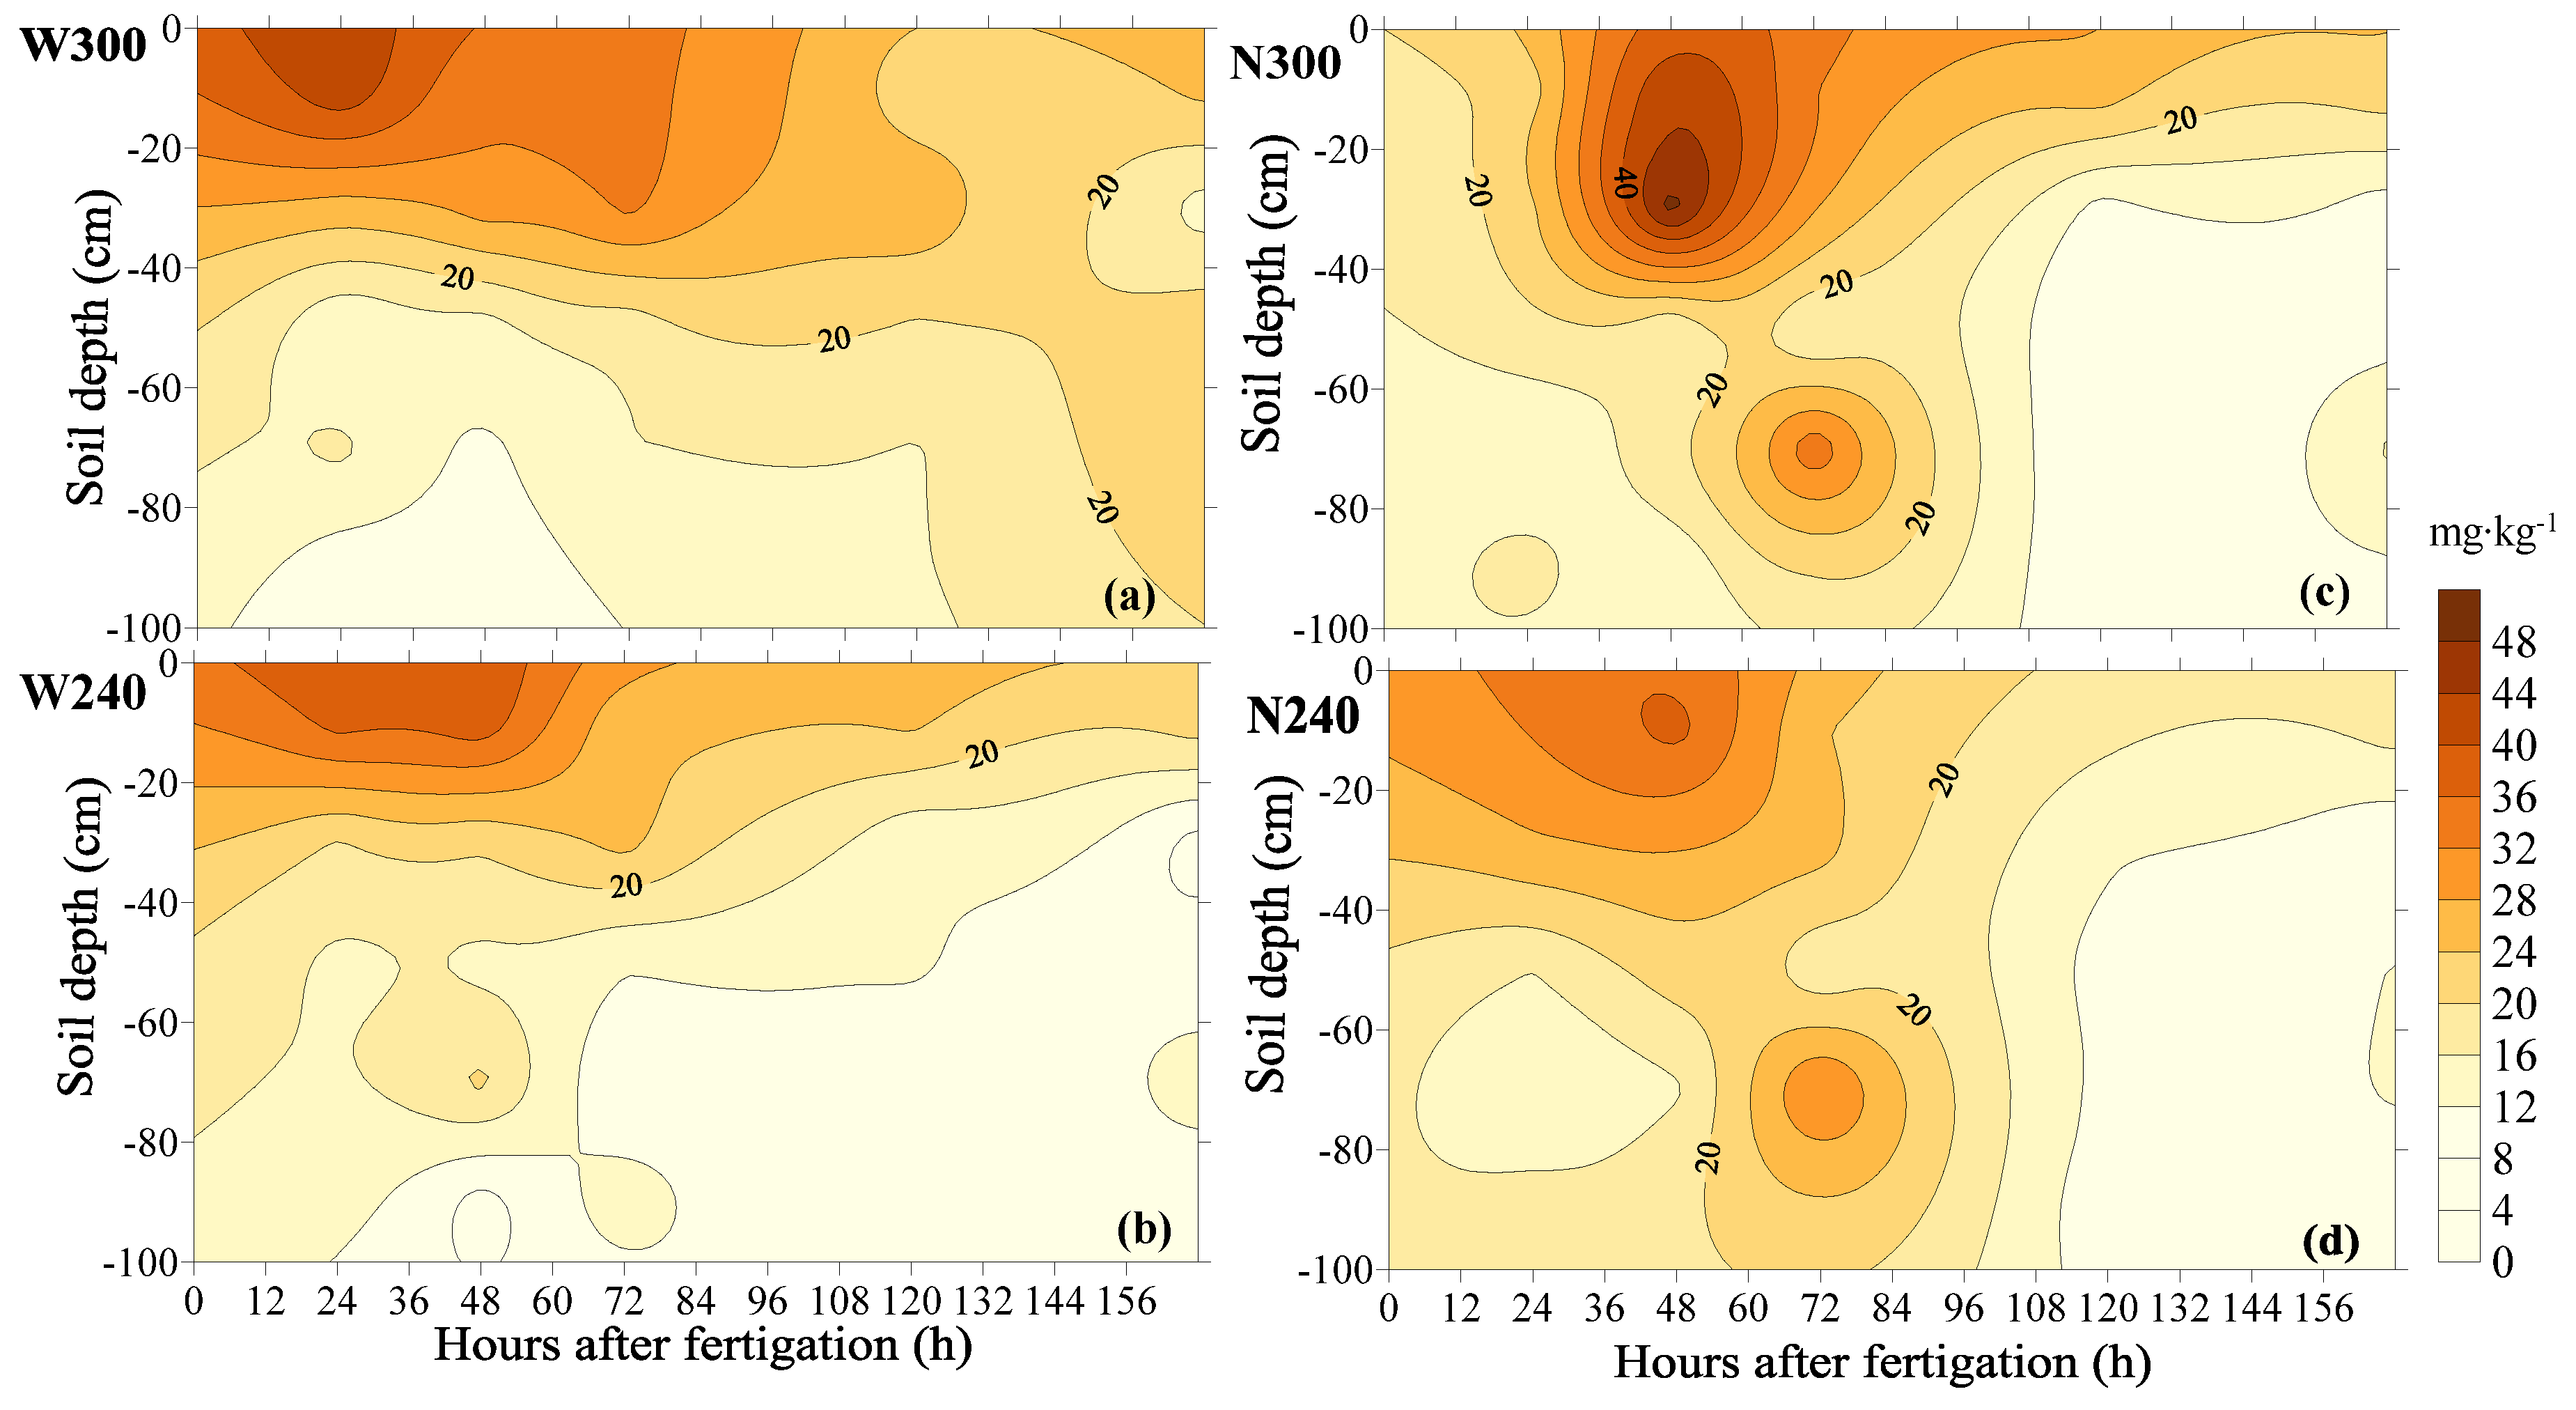
Different drip line layouts and N application rates affected changes in soil NO3−-N content. The migration characteristics of soil NO3−-N were similar under the same drip line layout (Figure 5). Under the wide-row drip line layout, NO3−-N was mainly distributed in the 0–60 cm soil layer and increased and then decreased. In the W300 treatment, soil NO3−-N remained in the upper soil layer (0–40 cm; NO3−-N > 20 mg kg−1) within 120 h after irrigation and fertilization, and migrated to the deeper soil layer (60–100 cm) after 120 h (Figure 5a). Within 72 h after irrigation and fertilization, NO3−-N in the W240 treatment was mainly distributed in the upper soil layer (0–40 cm; >20 mg kg−1); at 96 h, it was distributed in the shallow soil layer and was very low in the deeper soil layer (40–100 cm; <12 mg kg−1) (Figure 5b). Under the narrow-row drip line layout, NO3−-N exhibited strong downward migration after irrigation and fertilization. At 24 h after irrigation and fertilization, NO3−-N in the N300 treatment increased rapidly in the upper soil layer (0–40 cm; >30 mg kg−1), migrated to the deeper soil layer during 48–96 h (60–100 cm; <20 mg kg−1), and by 96 h was mainly distributed in the shallow soil layer (0–20 cm) and decreased rapidly in the deep soil layer (Figure 5c). The migration characteristics of soil NO3−-N in the N240 treatment were similar to those in the N300 treatment, but the soil NO3−-N content was relatively lower than that in the N300 treatment (Figure 5d).
Figure 5.
Changes in soil NO3−-N during a fertigation cycle (2025). Note: (a–d) show the changes in soil NO3−-N during an irrigation and fertilization cycle for the W300, W240, N300 and N240 treatments, respectively.
3.2. Vertical Distribution of Soil No3−-N in Different Growth Periods
Under the same drip line layout, soil NO3−-N content in the 0–60 cm layer was higher under the traditional N application rate than under the reduced N application rate (Figure 6). At different growth stages (FB, FF, BS, and BO), soil NO3−-N content in the W300 and W240 treatments (wide-row drip line layout) decreased with increasing soil depth. At the full bud, full flowering, and boll setting stages, NO3−-N content in the N300 and N240 treatments (narrow-row drip line layout) showed a decreasing then increasing trend with increasing soil depth. Compared with the narrow-row drip line layout (N300 and N240), the wide-row drip line layout (W300 and W240) increased NO3−-N content in the 0–40 cm soil layer. By contrast, at the stages of full bud, full bloom, and boll formation, the 60–100 cm soil layer showed greater NO3−-N concentrations in narrow-row drip line configurations relative to wide-row configurations.
3.3. NO3−-N Leaching
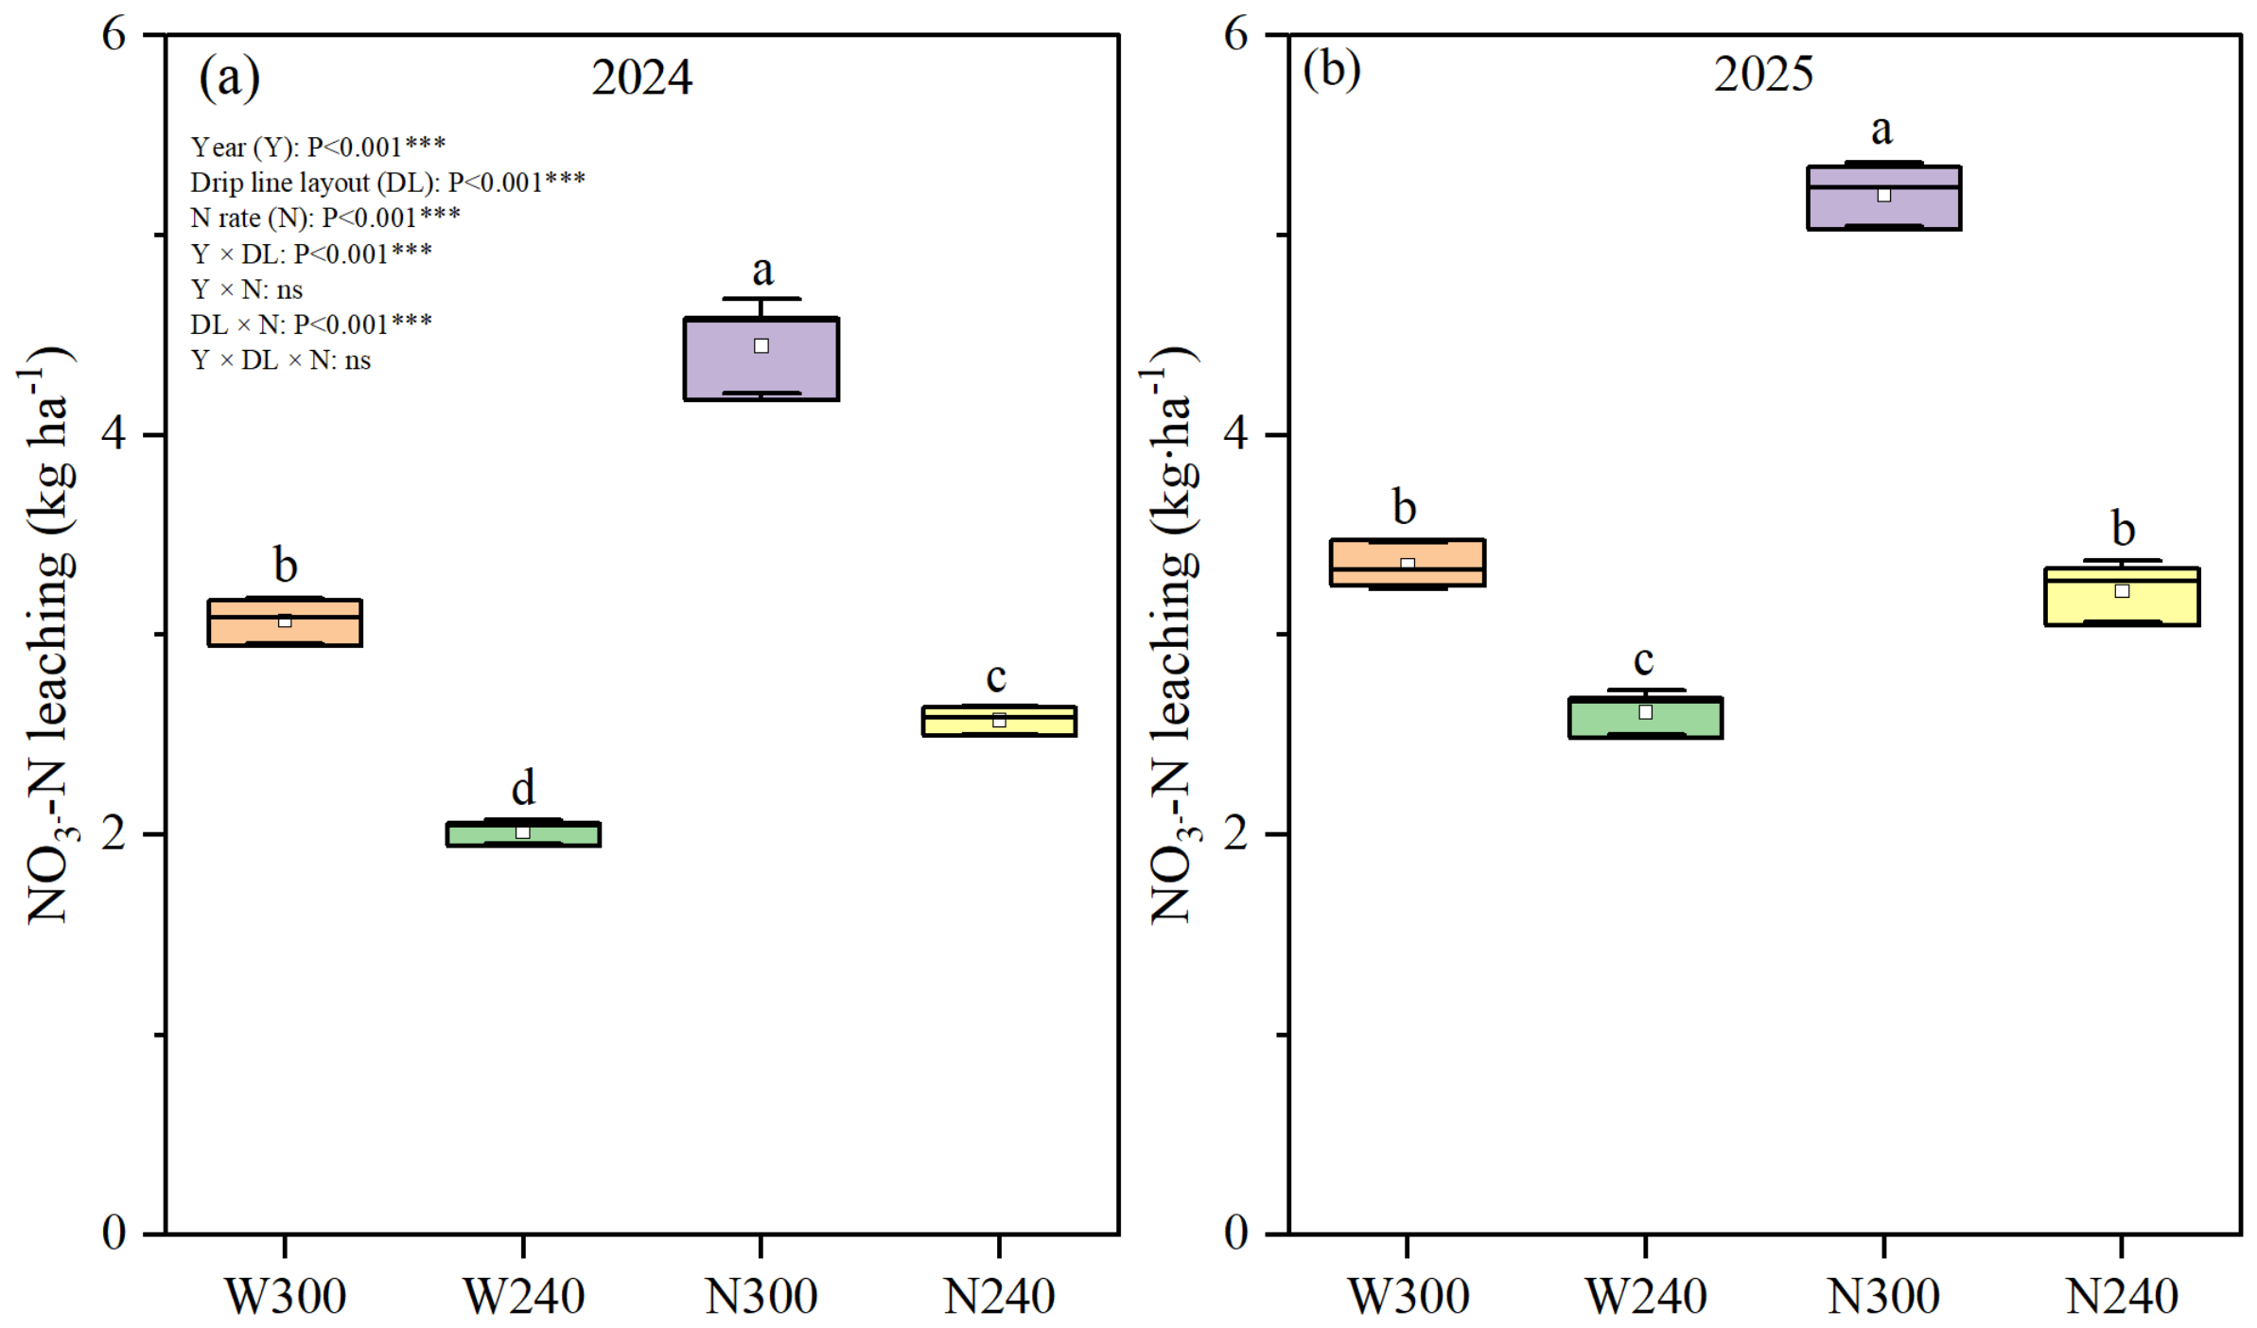
Nitrate nitrogen (NO3−-N) leaching was significantly affected by year (Y), drip line layout (DL), nitrogen application rate (N), and the Y × DL and DL × N interactions (p < 0.05). In contrast, the Y × N and Y × DL × N interactions were not significant (Table S2). Given the significant DL × N interaction, the effects of DL and N were examined within each level of the other factor. At the same N rate, the wide-row layout consistently reduced leaching relative to the narrow-row layout in both years (Figure 7). At 300 kg N ha−1, W300 reduced leaching by 31.0% in 2024 and 35.7% in 2025 compared with N300. At 240 kg N ha−1, W240 reduced leaching by 21.7% in 2024 and 18.8% in 2025 compared with N240. Within the wide-row layout, reducing N from 300 to 240 kg ha−1 decreased leaching by 34.3% in 2024 and 22.0% in 2025. Within the narrow-row layout, the corresponding reduction when N was lowered from 300 to 240 kg ha−1 was 42.1% in 2024 and 38.2% in 2025. Although the Y × DL interaction was significant, the direction of the DL effect was consistent across years (wide-row < narrow-row), with only the magnitude differing. Across all four treatments and both years, W240 resulted in the lowest NO3−-N leaching.
Figure 6.
Vertical distribution of soil NO3−-N across cotton fertility stages in 2025. Note: FB: Full bud stage; FF: Full flowering stage; BS: Boll setting stage; BO: Boll opening stage.
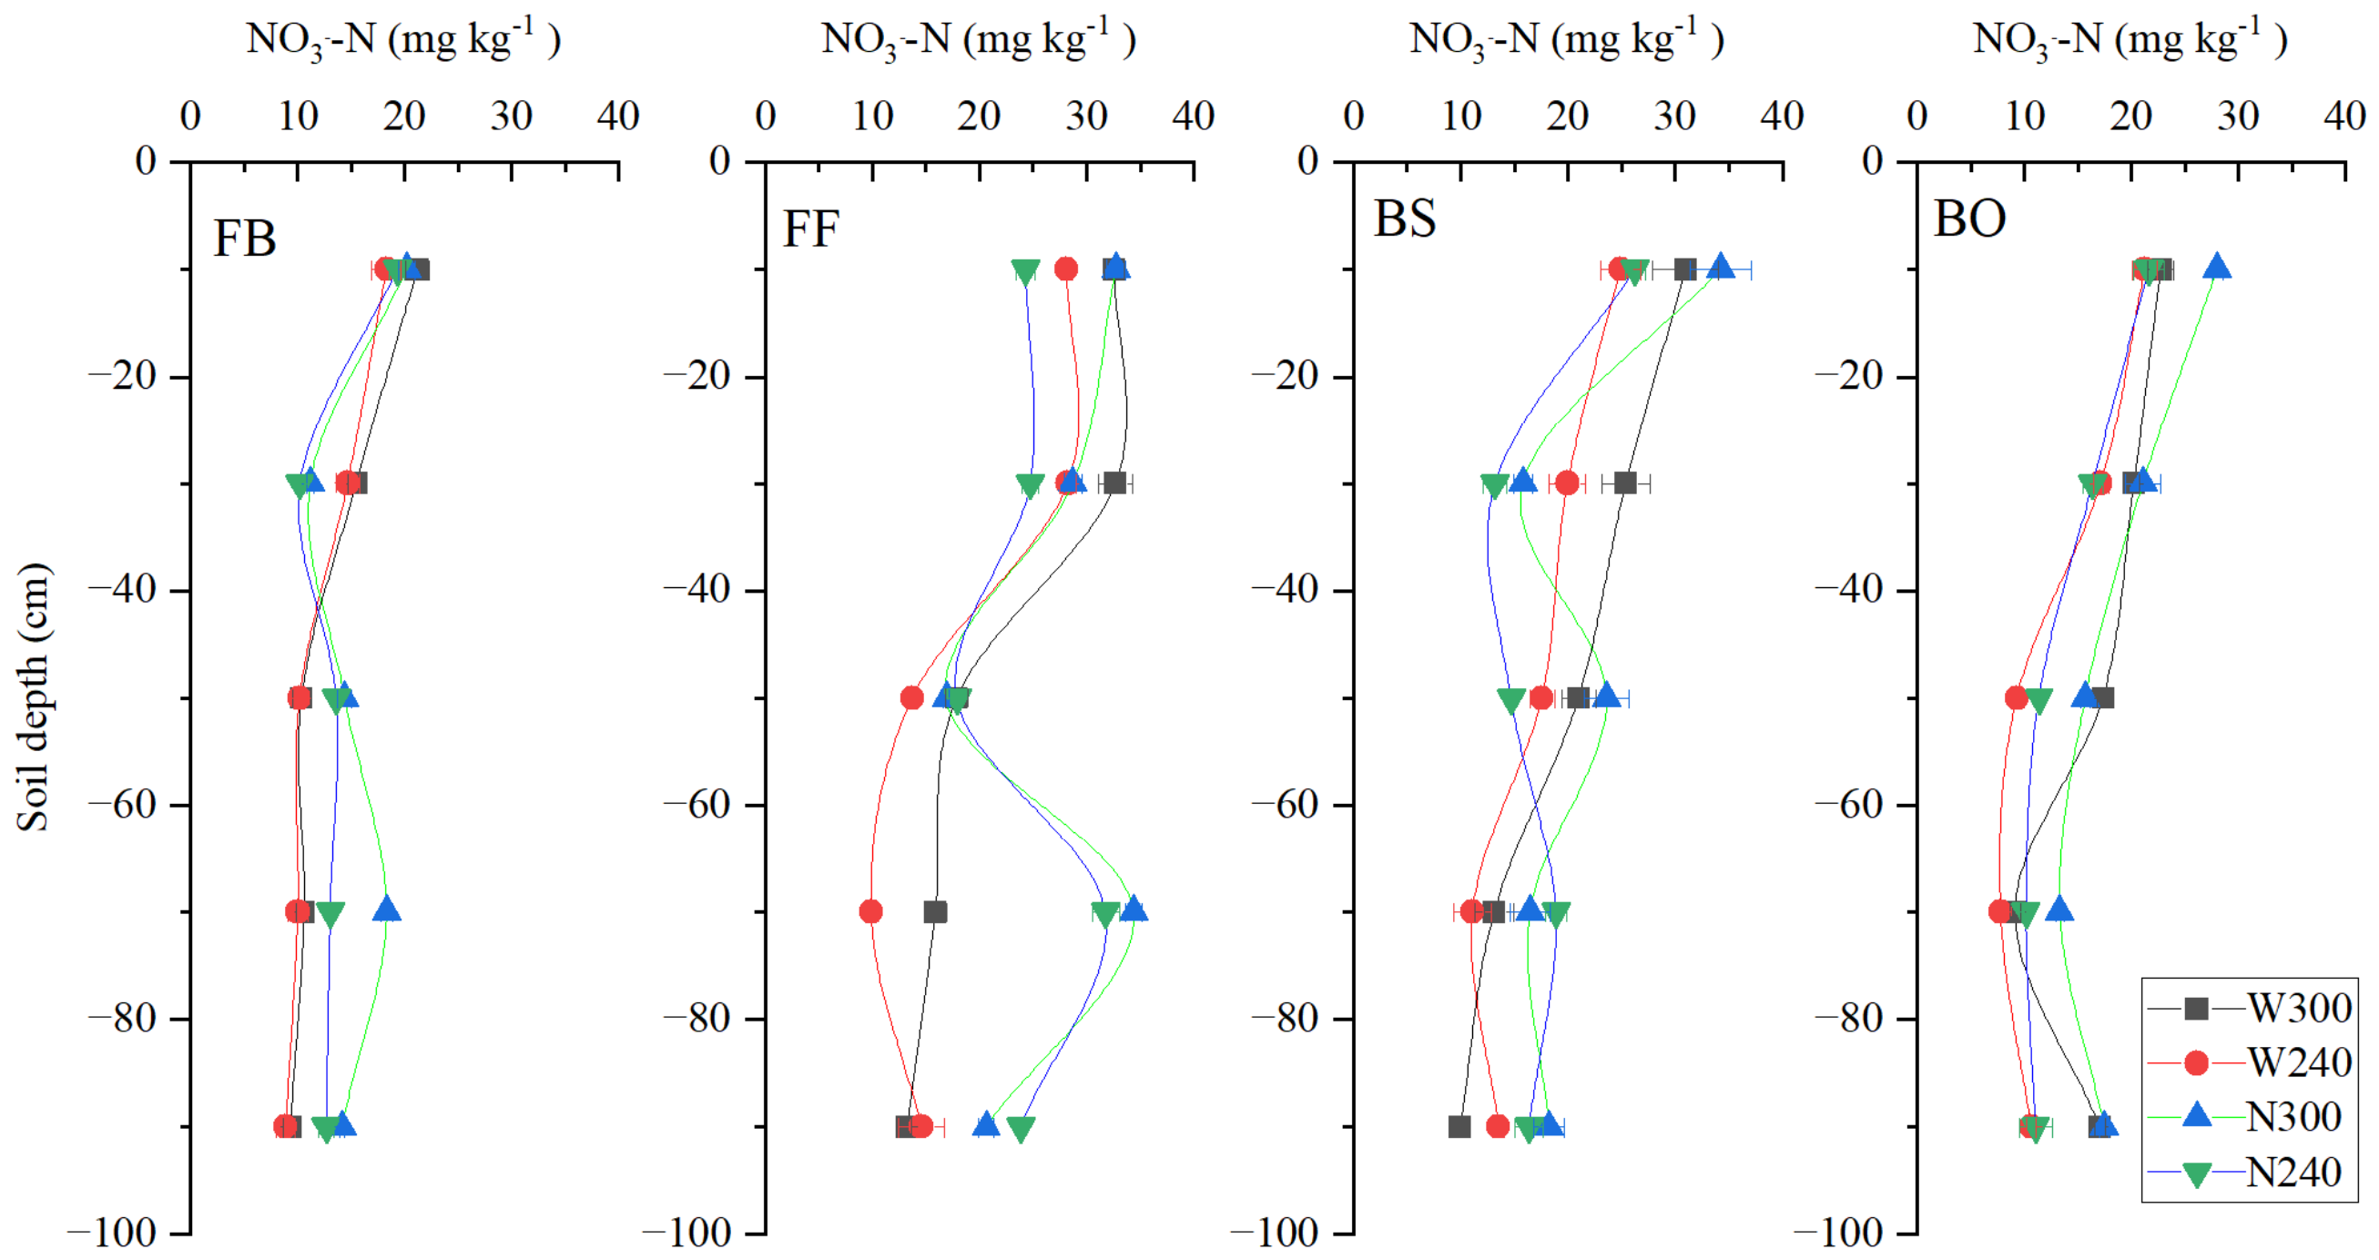
Figure 7.
NO3−-N leaching in 2024 (a) and 2025 (b). Note: Standard deviation (SD) is shown by the error bars (n = 3). Duncan’s test (p < 0.05) was used to identify significant treatment differences, which are indicated by different lowercase letters. Y, year; DL, drip line layout; N, nitrogen application rate; Y × DL, year × drip line layout interaction; Y × N, year × nitrogen application rate interaction; DL × N, drip line layout × nitrogen application rate interaction; Y × DL × N, year × drip line layout × nitrogen application rate interaction.*** indicate statistical significance at p < 0.001; ns indicates no significant difference.
3.4. NO3−-N Residual Amount
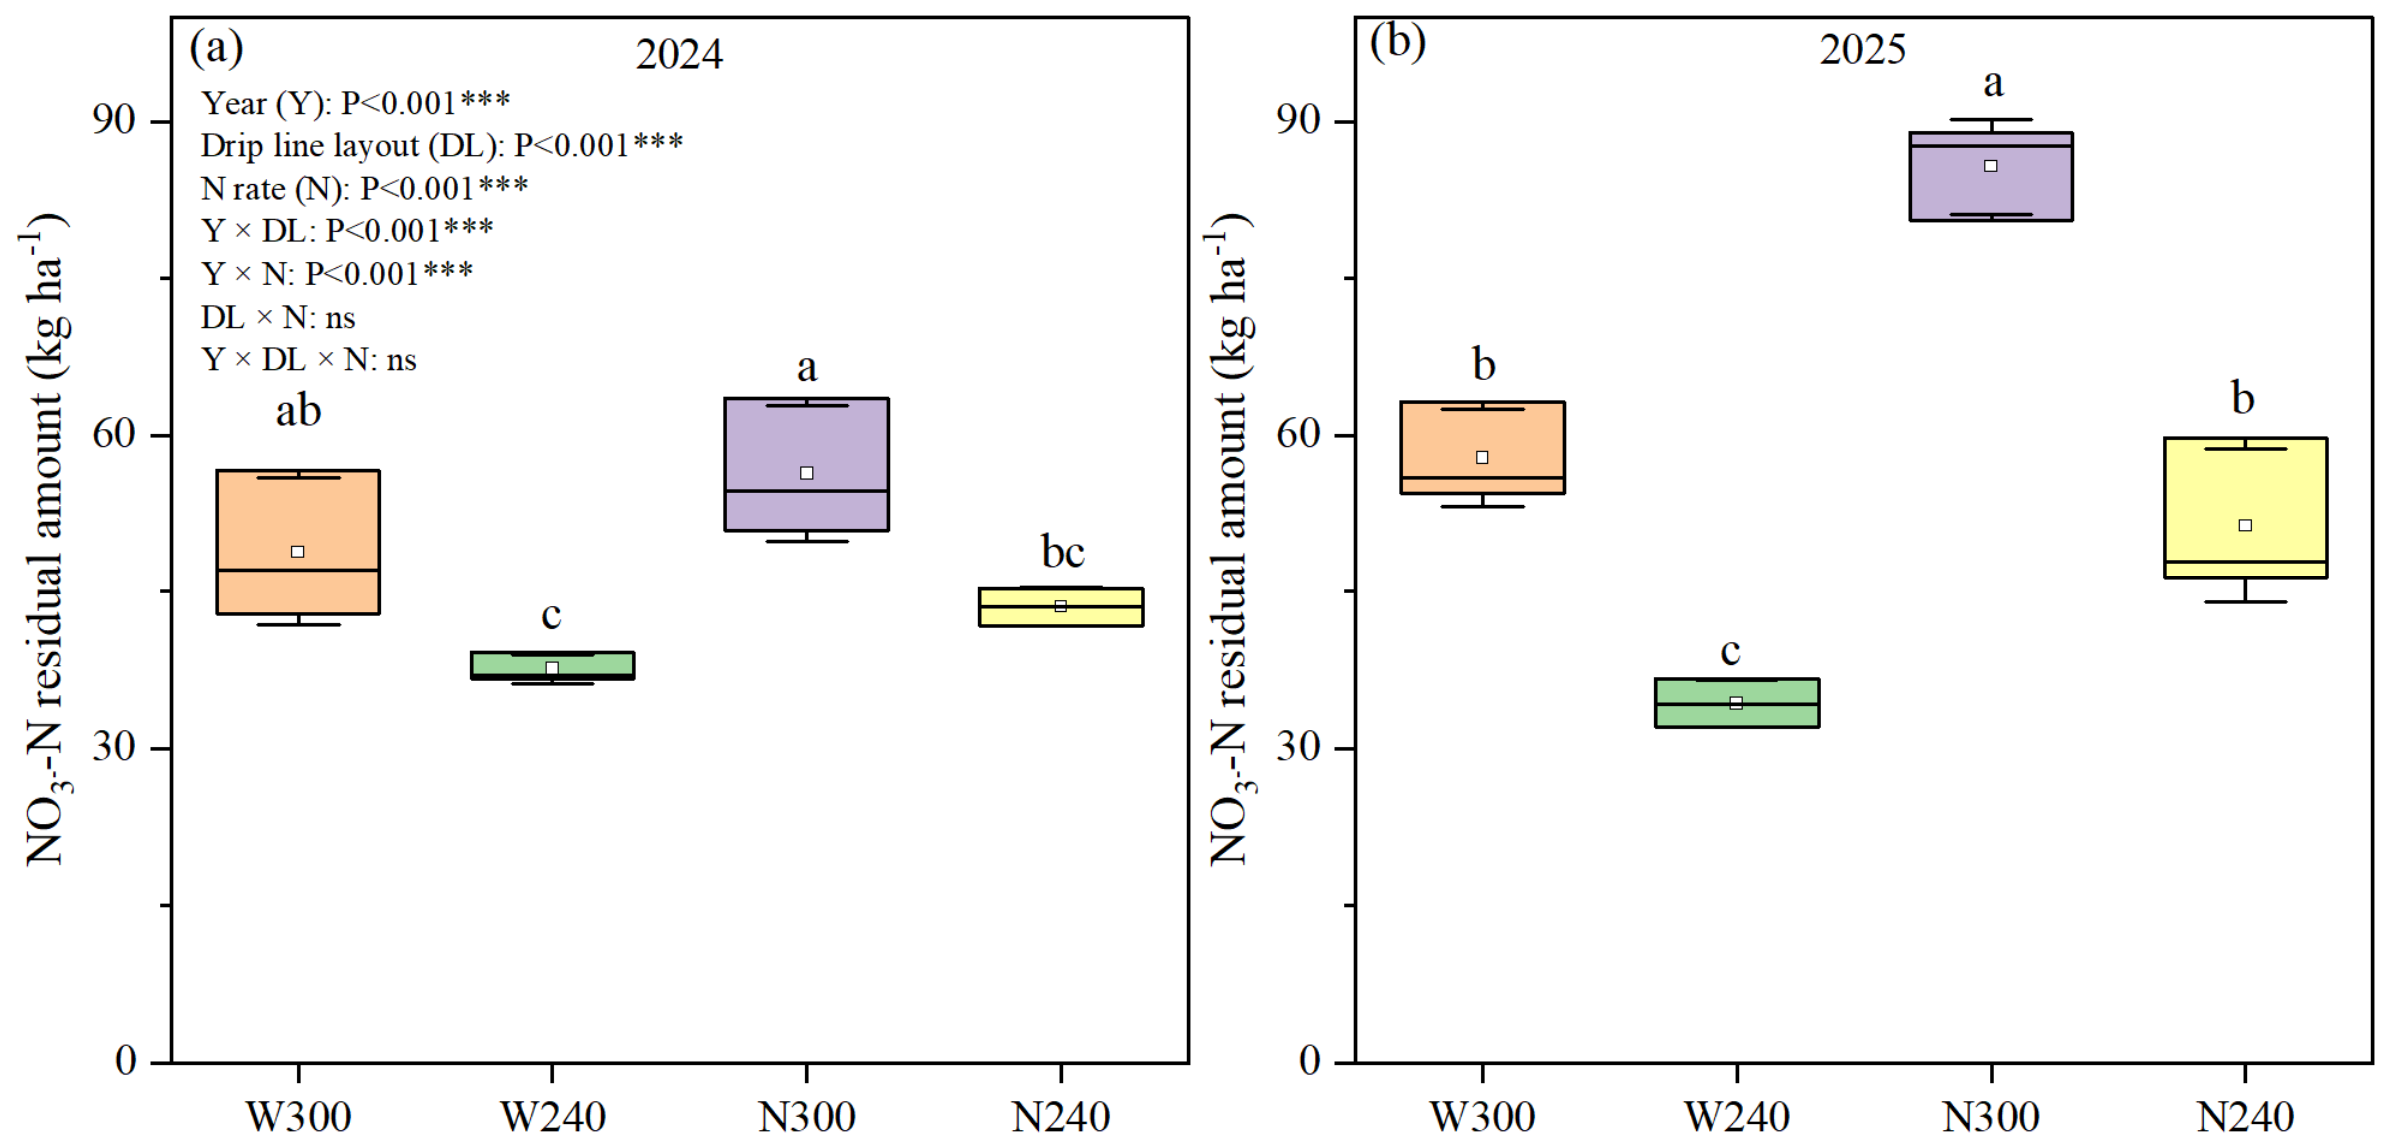
The NO3−-N residual amount was significantly affected by Y, DL, and N. The Y × DL (p < 0.01) and Y × N (p < 0.001) interactions were also significant, whereas the DL × N and Y × DL × N interactions were not (Table S2). Because both significant interactions involved Y, the effects of DL and N were tested within each year.
The wide-row layout reduced the NO3−-N residual amount relative to the narrow-row layout in both years. However, the reduction was larger in 2025 than in 2024. At 300 kg N ha−1, W300 lowered the NO3−-N residual amount by 13.3% in 2024 and by 32.5% in 2025 compared with N300 (Figure 8). At 240 kg N ha−1, W240 lowered it by 13.6% and 33.2%, respectively, compared with N240.
Reducing N from 300 to 240 kg ha−1 also decreased the NO3−-N residual amount in both years. This effect was again stronger in 2025. Within the wide-row layout, W240 reduced the NO3−-N residual amount by 23.0% in 2024 and by 40.7% in 2025 relative to W300. Within the narrow-row layout, N240 reduced it by 22.8% and 40.1%, respectively, relative to N300.
The non-significant DL × N interaction indicates that, within a given year, the proportional reduction in the NO3−-N residual amount caused by the wide-row layout was consistent across N rates. Across all treatments, W240 gave the lowest NO3−-N residual amount in both years, whereas N300 gave the highest, particularly in 2025.
Figure 8.
NO3−-N residual amount in 2024 (a) and 2025 (b). Note: Standard deviation (SD) is shown by the error bars (n = 3). Duncan’s test (p < 0.05) was used to identify significant treatment differences, which are indicated by different lowercase letters. Y, year; DL, drip line layout; N, nitrogen application rate; Y × DL, year × drip line layout interaction; Y × N, year × nitrogen application rate interaction; DL × N, drip line layout × nitrogen application rate interaction; Y × DL × N, year × drip line layout × nitrogen application rate interaction *** indicate statistical significance at p < 0.001; ns indicates no significant difference.
3.5. Root Length Density and Distribution
3.5.1. Root Length Density
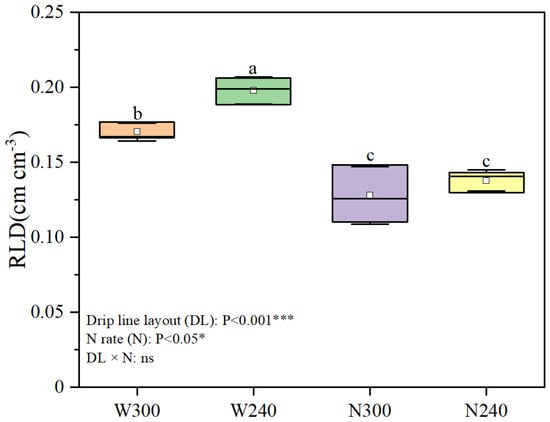
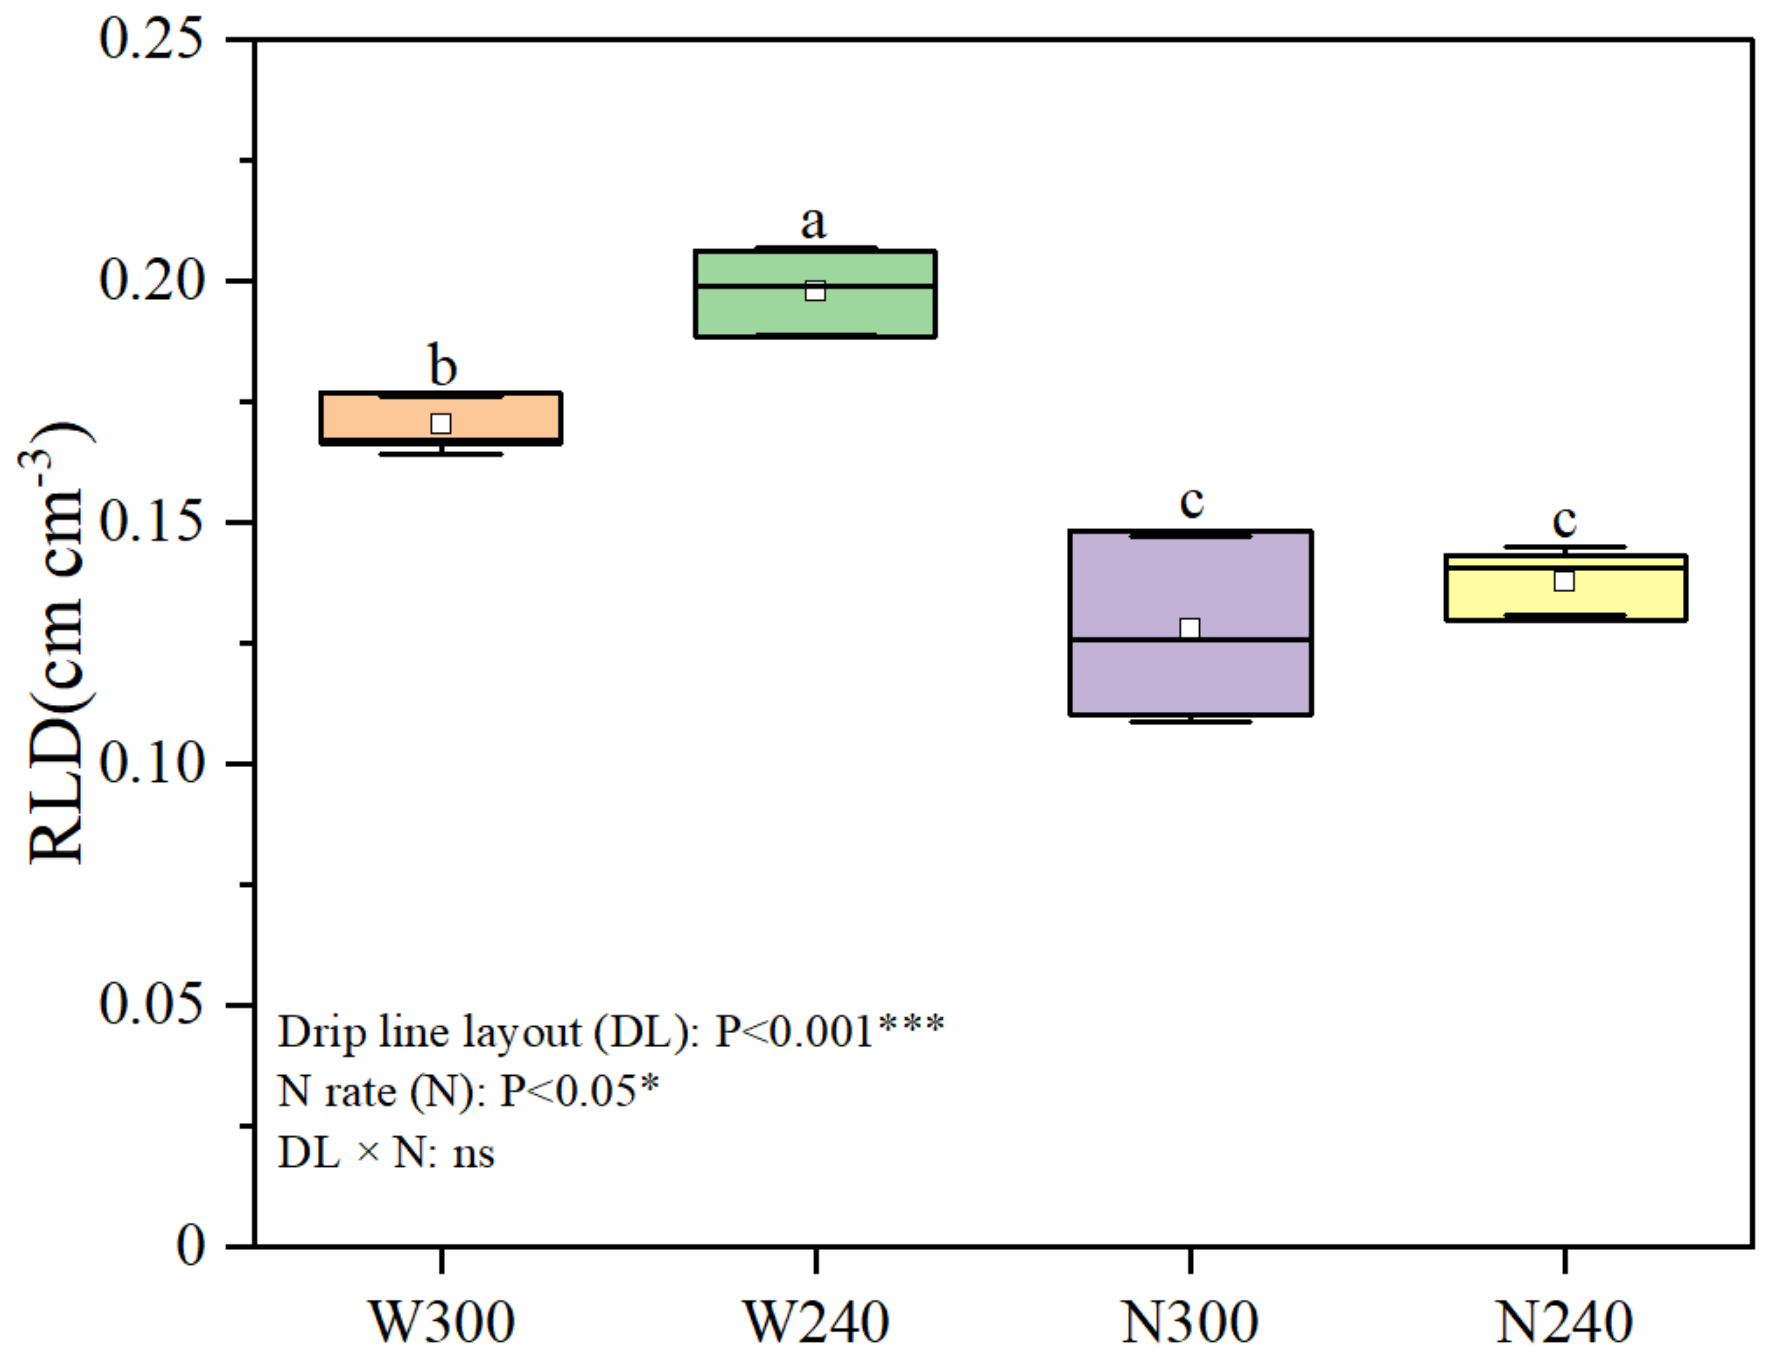
In 2025, drip line layout and N rate significantly affected cotton root length density (p < 0.001 and p < 0.05, respectively), whereas the DL × N interaction was not significant. Different drip line layouts significantly affected cotton root length density (Figure 9). Compared with the N240 treatment, cotton root length density under the W240 treatment significantly increased by 43.60%. Cotton root length density under the W300 treatment significantly increased by 32.91% compared with the N300 treatment.
Figure 9.
Root length density in 2025. Note: Standard deviation (SD) is shown by the error bars (n = 3). Duncan’s test (p < 0.05) was used to identify significant treatment differences, which are indicated by different lowercase letters. DL, drip line layout; N, nitrogen application rate; DL × N, drip line layout × nitrogen application rate interaction.*and *** indicate statistical significance at p < 0.05 and p < 0.001, respectively; ns indicates no significant difference.
3.5.2. Spatial Distribution of Root Length Density
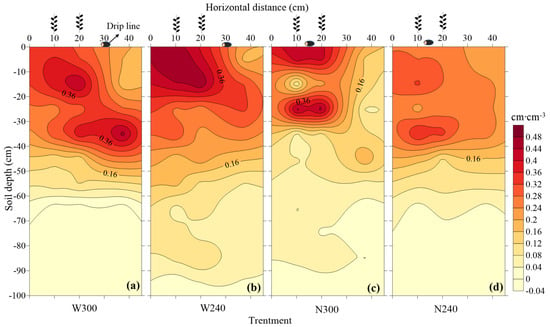
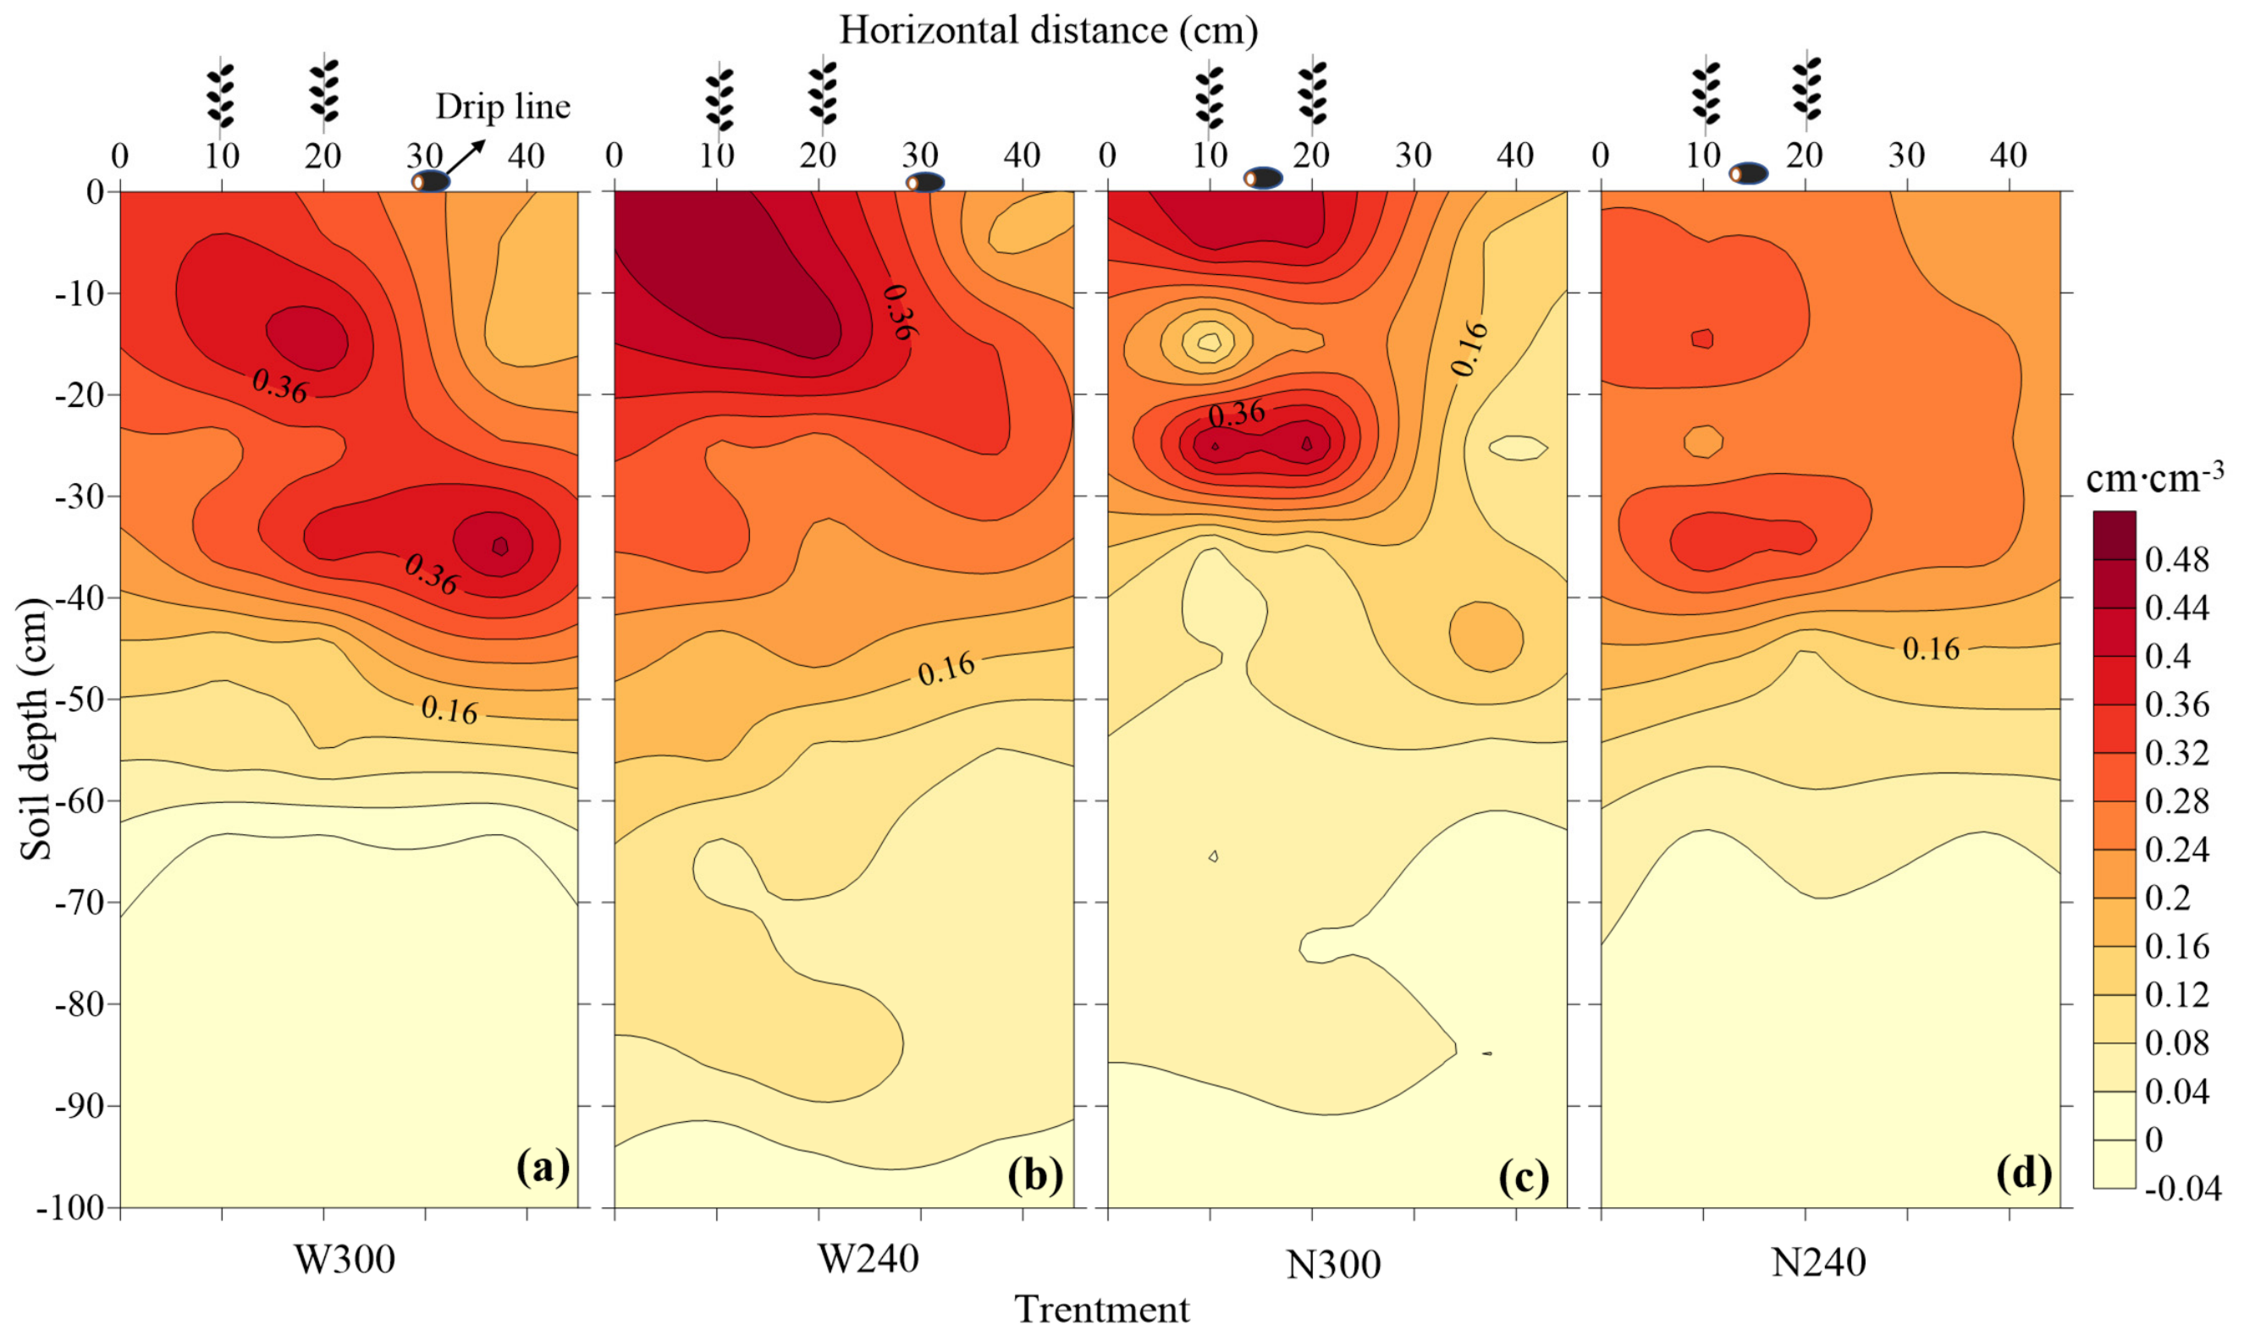
Cotton root length density (RLD) was mainly distributed in the 0–60 cm soil layer. Under the wide-row drip line layout, RLD was distributed over a larger range. In the W300 treatment, RLD was mainly distributed from the drip line to the lower part of the crop row (depth: 0–50 cm, horizontal distance: 0–30 cm, RLD > 0.28 cm cm−3), with greater RLD on the side away from the drip line (Figure 10a). In the W240 treatment, RLD was mainly distributed from the drip line to the lower part of the crop row (depth: 0–50 cm, horizontal distance: 0–40 cm, RLD > 0.28 cm cm−3), and was concentrated on the side away from the drip line (depth: 0–30 cm, horizontal distance: 0–20 cm, RLD > 0.32 cm cm−3; Figure 10b). In the N300 treatment, RLD was mainly distributed in the shallow soil layer (depth: 0–30 cm, horizontal distance: 0–30 cm, RLD > 0.28 cm cm−3), and the distribution was concentrated below the drip line (Figure 10c). In the N240 treatment, RLD was mainly distributed in the shallow soil layer (depth: 0–30 cm, horizontal distance: 0–40 cm, RLD > 0.24 cm cm−3) and was loosely distributed (Figure 10d).
Figure 10.
Spatial distribution of cotton root length density in 100 cm soil in 2025. Note: Figure 10 presents the spatial distribution of root length density under the four treatments: panel (a) corresponds to W300, (b) to W240, (c) to N300, and (d) to N240.
3.6. Cotton Biomass and N Uptake
Drip line layout and N application rate significantly affected cotton biomass (Table 3). Compared with the N300 and N240 treatments, the total biomass, stem biomass, and leaf biomass of the W300 treatment were significantly increased by 4.48–4.99% and 14.40–19.98%, 8.84–10.23% and 15.23–21.27%, and 2.82–6.46% and 12.69–37.35%, respectively. No significant differences in total biomass or boll biomass were observed between the N300 and W240 treatments. Compared with the N240 treatment, the total biomass, leaf biomass, and boll biomass of the W240 treatment were significantly increased by 5.39–11.33%, 2.33–24.79%, and 8.89–13.18%, respectively. Under the wide-row drip line layout, boll biomass did not differ significantly between the W300 and W240 treatments. Under the narrow-row drip line layout, total biomass and leaf and boll biomass were significantly reduced in the reduced N application treatment (N240).
The trends in N uptake and biomass were similar. Total N uptake ranked as follows: W300 > N300 > W240 > N240. At the conventional N application rate, N uptake by bolls, leaf, and stems showed no significant difference between the W300 and N300 treatments. However, under the reduced N application rate, cotton N uptake was significantly reduced under the narrow-row drip line layout. Compared with the W240 treatment, total N uptake and boll N uptake in the N240 treatment were significantly reduced by 6.54–11.62% and 8.05–16.88%, respectively. These findings indicate that, under the wide-row drip line layout, reducing the N application rate relative to the conventional rate did not significantly decrease cotton boll N uptake or total N uptake.
Table 3.
The effects of different drip line layouts and N application rates on cotton biomass and N uptake in 2024 and 2025.
3.7. Cotton Yield
Boll number per plant was significantly affected by Y, DL, N, and the DL × N interaction (p < 0.001), whereas Y × DL, Y × N, and the three-way interaction were not significant (Table 4). Because the DL × N interaction was consistent across years, treatments were compared within each factor level. Under the wide-row layout, reduced N did not decrease boll number; W240 was 2.2% higher than W300 in 2024, and the two treatments did not differ significantly in 2025. Under the narrow-row layout, reduced N decreased boll number by 5.2% in 2024 and 5.5% in 2025. At the same N rate, the wide-row layout increased boll number by 1.7–2.9% at 300 kg N ha−1 and by 7.6–9.6% at 240 kg N ha−1, with a larger advantage at the lower N rate.
Boll weight showed a significant DL × N interaction (p < 0.001), despite a non-significant N main effect. Under the wide-row layout, W300 exceeded W240 by 2.5% in 2024, whereas the two treatments did not differ significantly in 2025. Under the narrow-row layout, reduced N did not decrease boll weight; N240 exceeded N300 by 2.5% in 2025. At 300 kg N ha−1, the wide-row layout increased boll weight by 1.8–3.8% relative to the narrow-row layout, whereas at 240 kg N ha−1 no significant difference was detected between layouts. The significant interaction therefore reflected the reversal in the direction of the N effect between layouts, which offset each other and produced a non-significant N main effect.
Seed cotton yield was significantly affected by Y, DL, and N (p < 0.01), with no significant interaction. Yield was higher in 2025 than in 2024 and higher under the wide-row layout than under the narrow-row layout. At the same N rate, the wide-row layout increased yield by 4.8–5.2% at 300 kg N ha−1 and by 6.2–8.8% at 240 kg N ha−1. Reducing N from 300 to 240 kg ha−1 slightly decreased yield by 0.2–1.9% under the wide-row layout and by 3.1–3.5% under the narrow-row layout. Because the interaction was not significant and the yield gain from the wide-row layout exceeded the yield loss from reduced N, W240 achieved yields comparable to or slightly higher than N300, being 5.0% higher in 2024 and 2.9% higher in 2025.
Table 4.
The effects of different drip line layouts and N application rates on cotton yield in 2024 and 2025.
3.8. Water and N Use Efficiency
3.8.1. Irrigation Water Use Efficiency (IWUE)
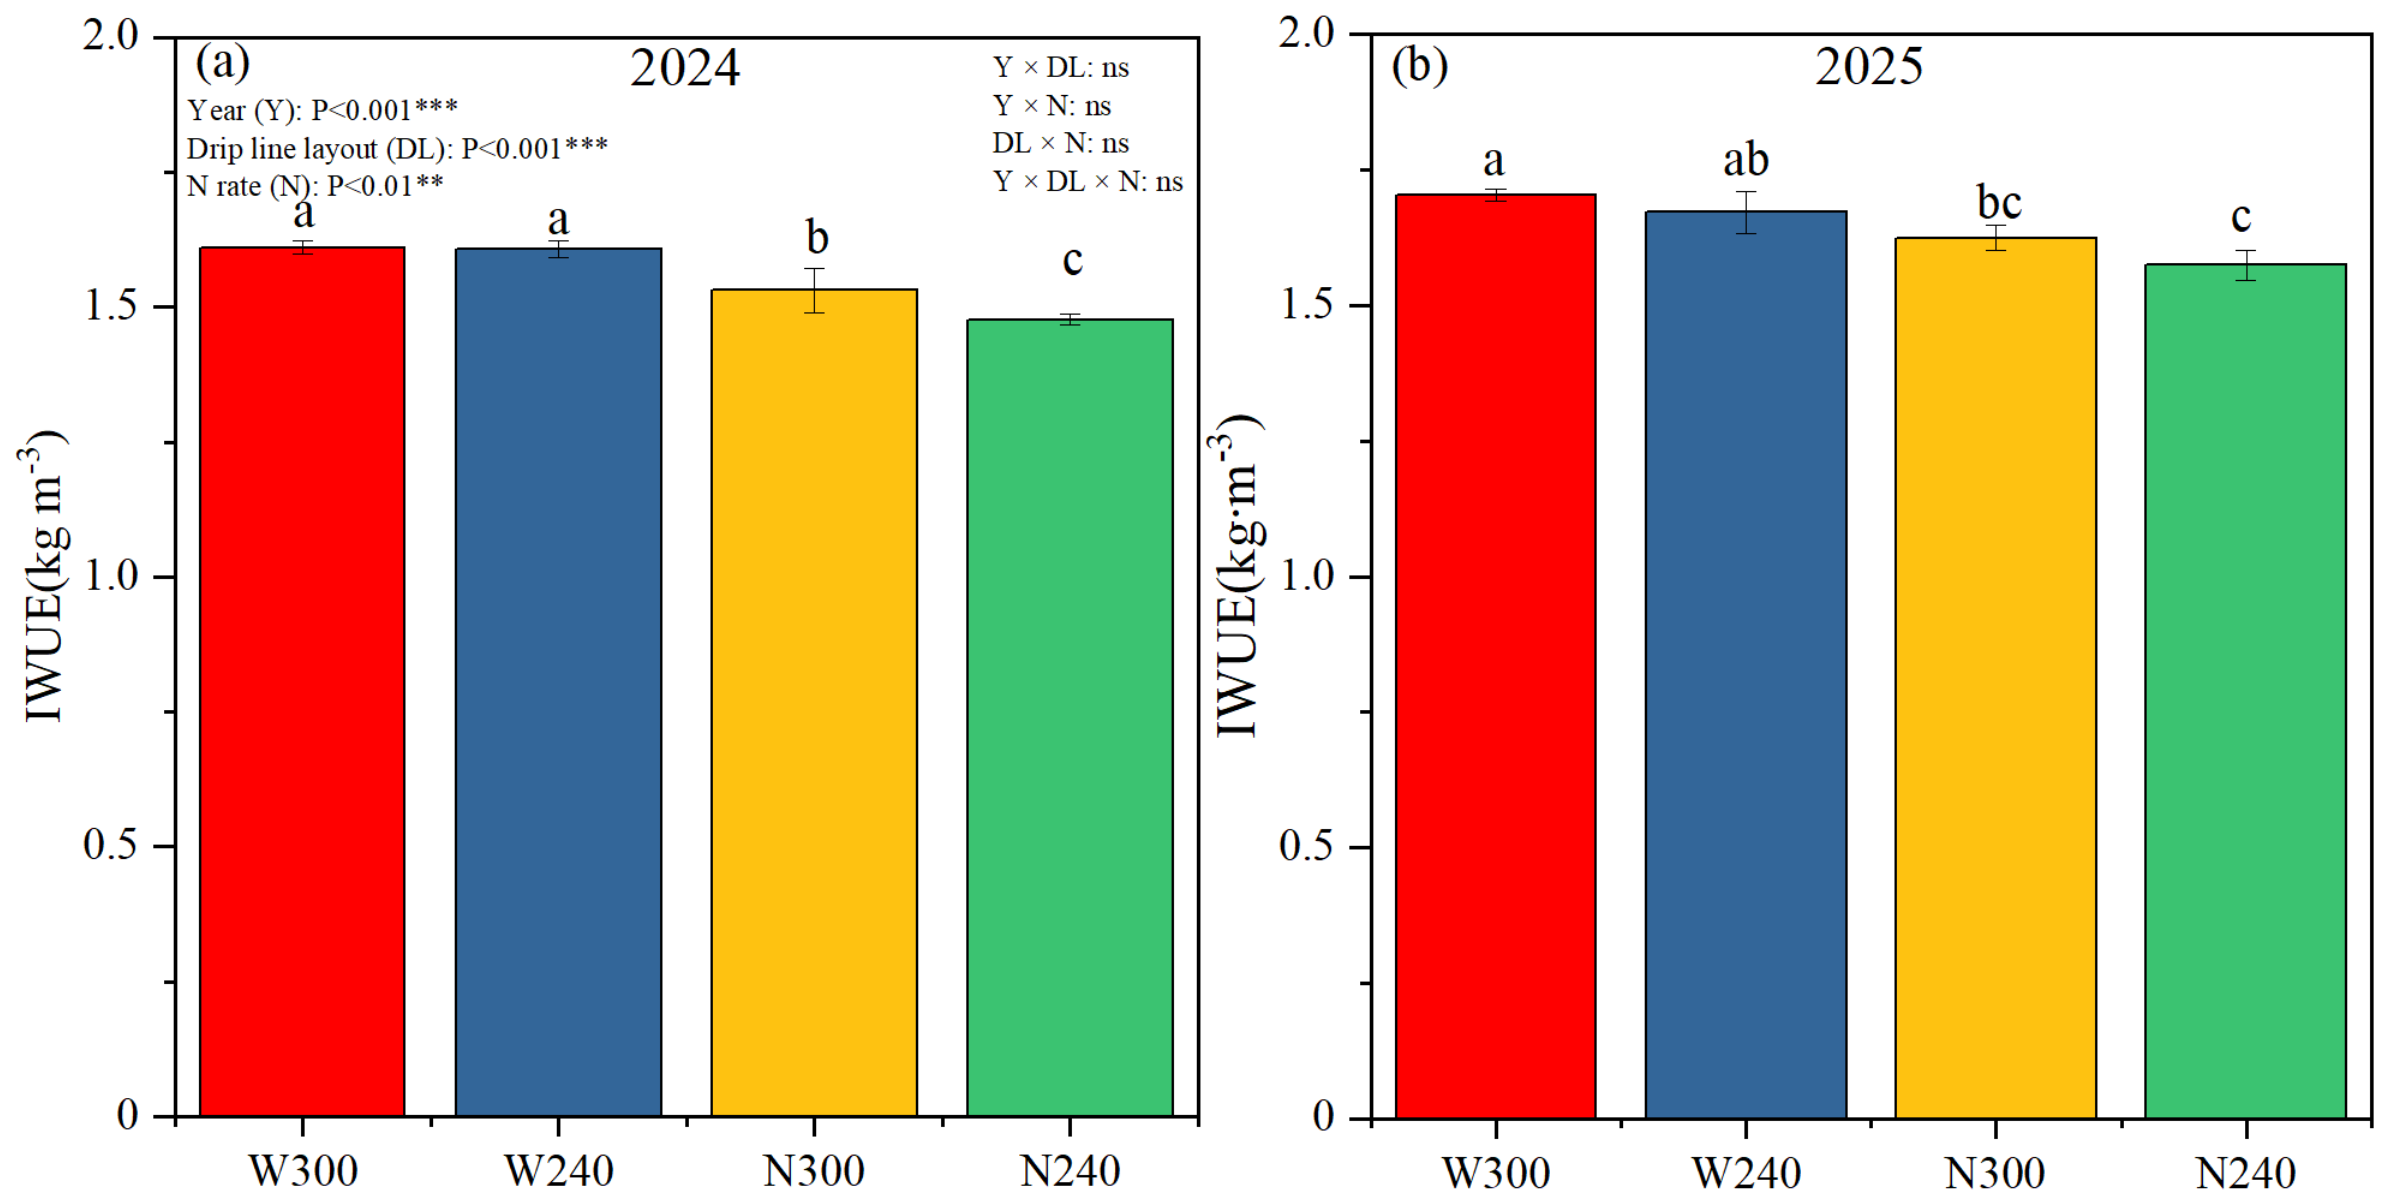
IWUE was significantly affected by Y, DL, and N (p < 0.01), with no significant interactions. The wide-row layout increased IWUE by 7.0% in 2024 and 5.5% in 2025 relative to the narrow-row layout. The 300 kg N ha−1 rate increased IWUE by 1.9% in 2024 and 2.5% in 2025 relative to 240 kg N ha−1. IWUE was higher in 2025 than in 2024. These two advantages were additive, consistent with the non-significant interactions. The wide-row advantage was similar at both N rates (5.2–8.8% in 2024; 4.8–6.2% in 2025). W300 and W240 did not differ significantly in either year, whereas N240 had the lowest IWUE in both years. Thus, the wide-row layout with reduced N maintained IWUE comparable to that with conventional N, and both exceeded the narrow-row treatments (Figure 11).
Figure 11.
Irrigation water use efficiency (IWUE) in 2024 (a) and 2025 (b). Note: Standard deviation (SD) is shown by the error bars (n = 3). Duncan’s test (p < 0.05) was used to identify significant treatment differences, which are indicated by different lowercase letters. Y, year; DL, drip line layout; N, nitrogen application rate; Y × DL, year × drip line layout interaction; Y × N, year × nitrogen application rate interaction; DL × N, drip line layout × nitrogen application rate interaction; Y × DL × N, year × drip line layout × nitrogen application rate interaction. **, and *** indicate statistical significance at p < 0.01 and p < 0.001, respectively; ns indicates no significant difference.
3.8.2. Nitrogen Partial Factor Productivity (PFPN)
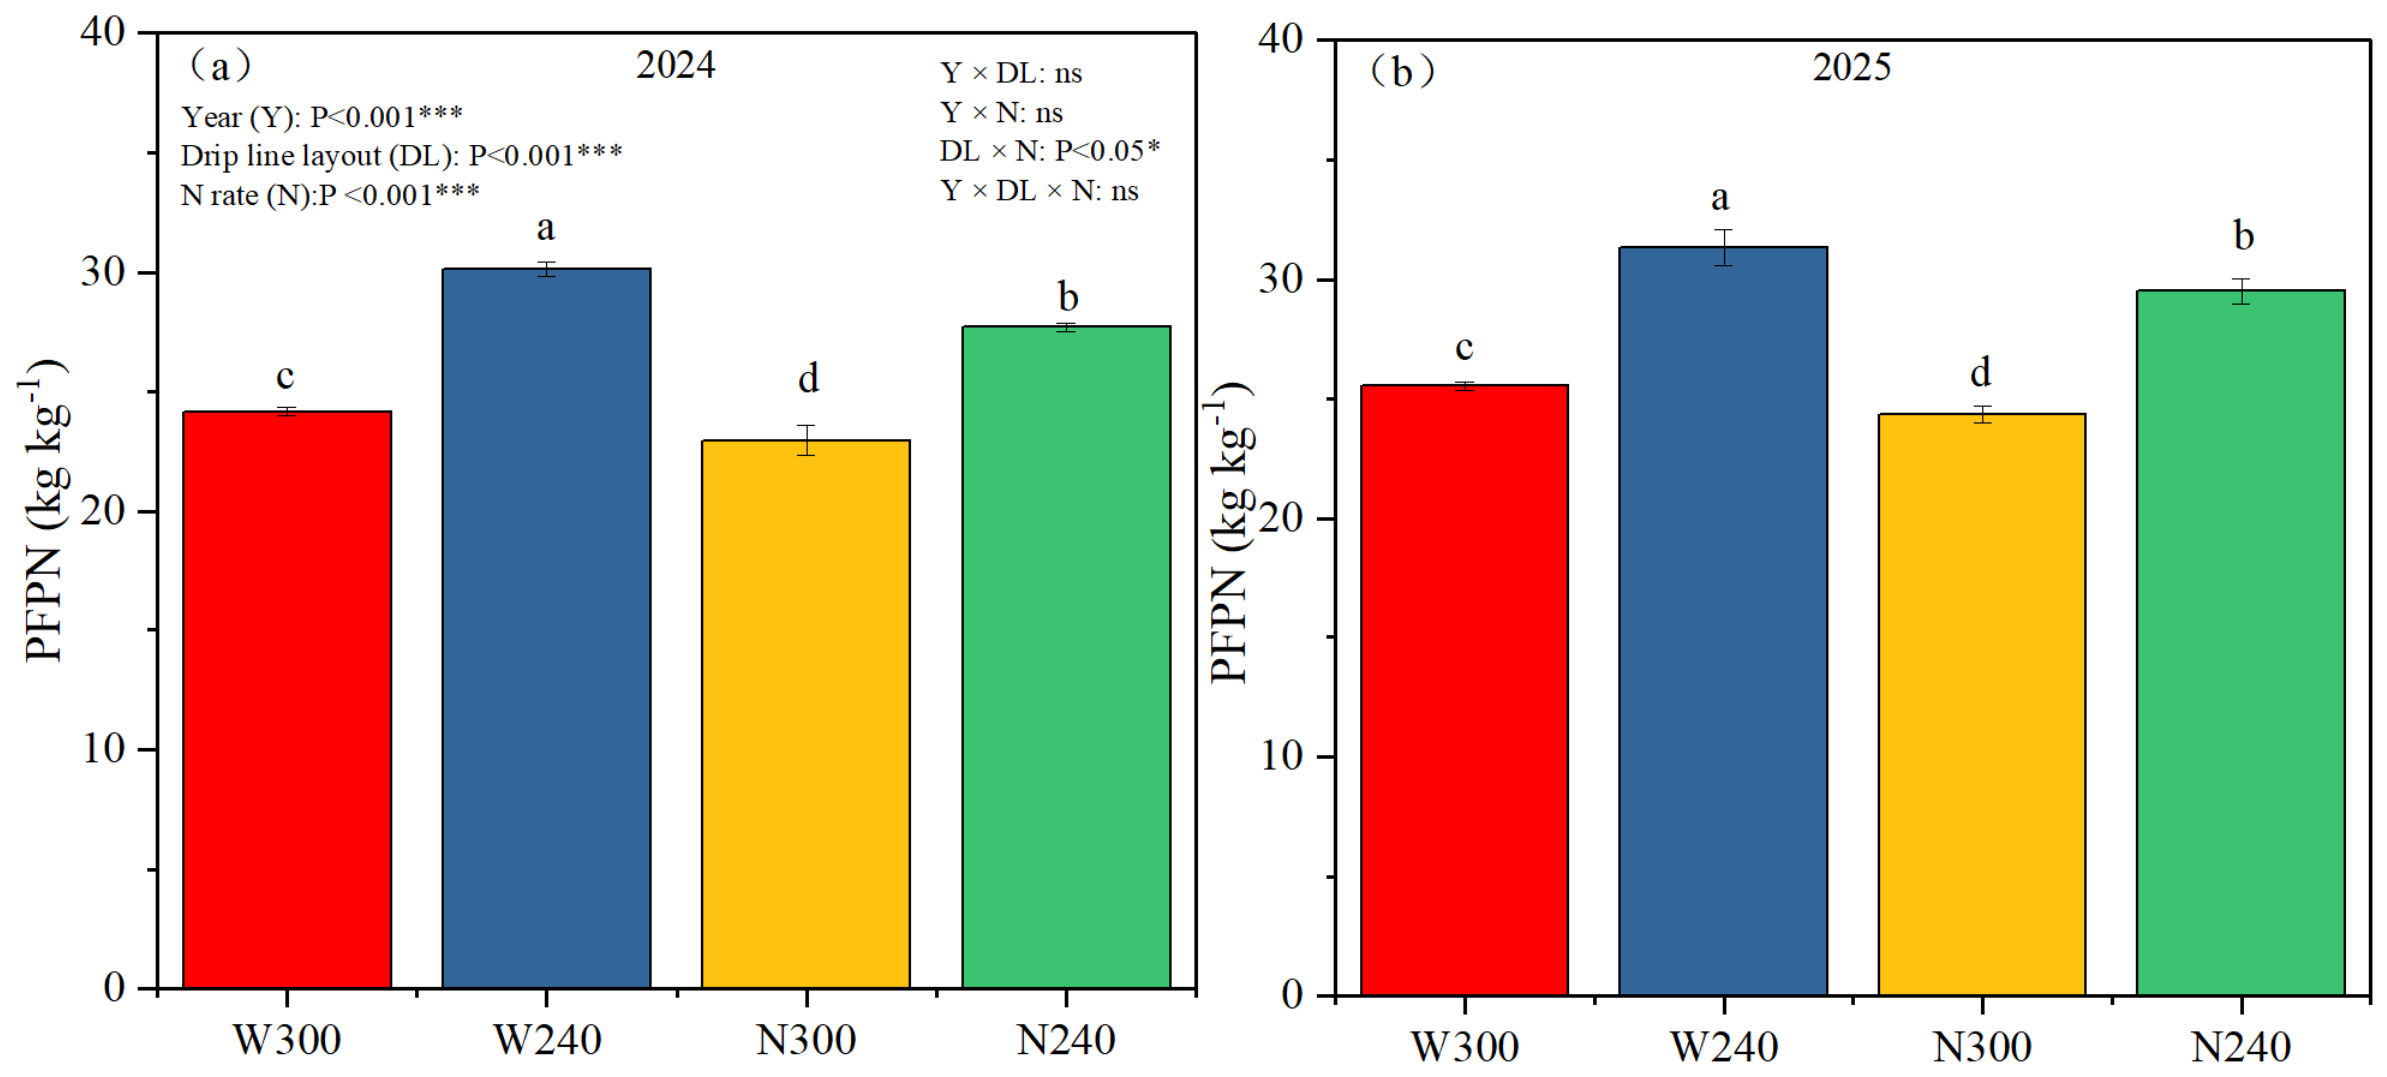
PFPN was significantly affected by Y, DL, N, and the DL × N interaction (p < 0.05), whereas Y × DL, Y × N, and the three-way interaction were not significant. Because the DL × N interaction was consistent across years, treatments were compared within each factor level. Under the wide-row layout, reduced N increased PFPN by 24.7% in 2024 and 22.7% in 2025. Under the narrow-row layout, the corresponding increases were 20.6% and 21.1%. At 300 kg N ha−1, the wide-row layout increased PFPN by 5.2% in 2024 and 4.8% in 2025 relative to the narrow-row layout. At 240 kg N ha−1, the corresponding increases were 8.8% and 6.2%. PFPN was higher in 2025 than in 2024. Across treatments, W240 had the highest PFPN in both years, followed by N240, W300, and N300. The interaction reflected the larger benefit of reduced N under the wide-row layout and the larger layout effect at the lower N rate (Figure 12).
Figure 12.
PFPN in 2024 (a) and 2025 (b). Note: Standard deviation (SD) is shown by the error bars (n = 3). Duncan’s test (p < 0.05) was used to identify significant treatment differences, which are indicated by different lowercase letters. Y, year; DL, drip line layout; N, nitrogen application rate; Y × DL, year × drip line layout interaction; Y × N, year × nitrogen application rate interaction; DL × N, drip line layout × nitrogen application rate interaction; Y × DL × N, year × drip line layout × nitrogen application rate interaction. *, **, and *** indicate statistical significance at p < 0.05, p < 0.01, and p < 0.001, respectively; ns indicates no significant difference.
4. Discussion
Irrigation and fertilization usually lead to differences in soil water and nutrient distribution [35,36]. In drip-irrigated cotton fields, the transport and distribution of soil water and N are influenced by drip line layout [24]. Our results showed that under the wide-row drip line layout, soil NO3−-N was mainly distributed in the shallow 0–50 cm soil layer during one fertigation cycle (Figure 5a,b). However, under the narrow-row drip line layout, NO3−-N exhibited strong downward migration after irrigation and fertilization. Soil NO3−-N migrated rapidly to the deeper 60–100 cm soil layer at 48–96 h after irrigation and fertilization (Figure 5c,d). Drip irrigation provides an efficient and continuous water supply, creating a wetted soil volume [37]. At the same time, soil nutrients accumulate at the boundary of the wetted volume. Under drip irrigation, the wetting pattern is controlled by soil texture, structure, emitter spacing and discharge rate, and irrigation frequency [38]. Soil moisture distribution and wetting-front dynamics were not measured directly in this experiment. However, previous studies have shown that water is an important factor driving soil nitrogen movement under drip irrigation, and that soil moisture distribution is consistent with the spatial extent of nitrogen distribution [18,24,26]. We therefore infer that differences in soil moisture distribution under different drip-line layouts may be an important factor causing differences in soil NO3−-N distribution. In addition, variation in the spatial distance between drip emitters and crop rows should also be considered as a cause of nutrient distribution differences. Therefore, the mechanisms by which drip-tape placement and nitrogen application rate affect soil nitrogen distribution require further investigation integrated with soil moisture dynamics.
Nitrogen leaching is an important pathway of N loss in agricultural systems. In this study, NO3−-N leaching was significantly affected by year (Y), drip line layout (DL), N rate (N), and the Y × DL and DL × N interactions (p < 0.05), but not by Y × N or Y × DL × N (Table S2). At the same N rate, the wide-row layout consistently reduced leaching relative to the narrow-row layout in both years. Reducing N from 300 to 240 kg N ha−1 decreased leaching by 34.3% and 22.0% under the wide-row layout and by 42.1% and 38.2% under the narrow-row layout in 2024 and 2025, respectively. Although the Y × DL interaction was significant, the direction of the DL effect was consistent across years (wide-row < narrow-row), with only the magnitude differing. Previous studies have also identified NO3−-N as the dominant component of soil N leaching loss and shown that increasing N application increases leaching [39]. In oasis cotton fields, wide-row drip-tape layouts reduced soil NO3−-N leaching, consistent with our findings [18].
Excessive fertilizer application leaves substantial N in the soil and harms the environment [40]. Earlier work indicates that NO3−-N distribution in the soil during crop reproduction influences residual soil N. Residual N in soil is mainly distributed at a depth of 0–60 cm at crop harvest. An insufficient N application rate leads to decreased soil fertility, whereas excessive N fertilizer application results in a large amount of NO3−-N residue [41]. In this study, the NO3−-N residual amount was significantly affected by Y, DL, and N, and the Y × DL (p < 0.01) and Y × N (p < 0.001) interactions were also significant. The wide-row layout reduced the NO3−-N residual amount relative to the narrow-row layout in both years, but the reduction was larger in 2025 than in 2024. The non-significant DL × N interaction indicates that, within a given year, the proportional reduction in the NO3−-N residual amount caused by the wide-row layout was consistent across N rates. Across all treatments, W240 gave the lowest NO3−-N residual amount in both years, whereas N300 gave the highest, particularly in 2025. In addition, our study found that the narrow-row drip line layout (N300 and N240) significantly increased soil NO3−-N content in the 60–100 cm layer during the full bud, full flowering, and boll setting stages of cotton and significantly increased soil NO3−-N residue at harvest. The wide-row drip line layout is a feasible practice for reducing NO3−-N leaching and residual accumulation. However, this study focused only on NO3−-N leaching loss; further research is needed on the effects of drip-tape layout and N application rate on other N loss pathways and associated environmental impacts.
Root length density is an important indicator of crop nutrient uptake capacity, and its spatial distribution characteristics are essential for improving crop nutrient acquisition [27,36]. Earlier studies indicate that root growth responds markedly to N application rate [36]. Generally, lowering the N rate promotes root growth and increases root length density, enabling roots to explore a larger soil volume and thereby enhancing spatial N availability [42]. In this study, in 2025, drip line layout and N rate significantly affected cotton root length density (p < 0.001 and p < 0.05, respectively), whereas the DL × N interaction was not significant. Compared with N240, root length density under W240 was significantly increased by 43.60%, and root length density under W300 was significantly increased by 32.91% compared with N300. However, the reduced N application treatment (N240) significantly reduced root length density under the narrow-row drip line layout. This is consistent with the finding that persistent N deficiency hinders root growth due to insufficient N supply [43]. Under the narrow-row layout, cotton root length density was mainly distributed in the 0–60 cm soil layer (Figure 10), whereas soil NO3−-N rapidly migrated to the deeper 60–100 cm soil layer (Figure 5c,d), resulting in a mismatch between root and NO3−-N distribution. In the present study, root and soil samples used for the distribution comparison were collected during the fifth fertigation cycle at the boll setting stage in 2025, at the same soil depth sand at equivalent horizontal positions relative to the drip emitter (Figure S1). Thus, the comparison between root length density and soil NO3−-N distribution was made at the same depths and equivalent horizontal positions. However, cotton root distribution was monitored only in 2025, limiting the interpretation of its alignment with soil NO3−-N distribution. Better matching of the root system to soil nutrient supply increases crop N uptake and biomass [36]. The wide-row drip line layout combined with the reduced N application treatment (W240) matched the distribution of cotton roots with that of NO3−-N (Figure 5, Figure 6 and Figure 10). As a result, cotton N uptake and boll biomass were not significantly reduced compared with conventional N application (Table 3). Previous studies have shown that a high N application rate increases cotton stem and leaf biomass and N uptake. However, an appropriate reduction in N application rate did not decrease boll biomass and N uptake of cotton [1]. In this study, cotton biomass and N uptake were significantly reduced in the reduced N application treatment (N240) under the narrow-row drip line layout. Therefore, to maintain normal growth and N uptake of cotton while reducing the N application rate, a suitable drip line layout should be selected.
In our study, seed cotton yield was significantly affected by Y, DL, and N (p < 0.01), with no significant interaction. Cotton yield under the wide-row drip line layout was significantly higher than that under the narrow-row drip line layout. In addition, under the wide-row drip line layout, seed cotton yield in the reduced N application treatment (W240) was not significantly reduced (Table 4), whereas under the narrow-row drip line layout, seed cotton yield in the reduced N application treatment (N240) was reduced. Because the interaction was not significant and the yield gain from the wide-row layout exceeded the yield loss from reduced N, W240 achieved yields comparable to or slightly higher than N300 (5.0% higher in 2024 and 2.9% higher in 2025). Previous studies have demonstrated that different drip line layouts can result in variations in soil moisture and salt distribution within the root zone, thereby potentially influencing water and nutrient uptake by cotton plants and ultimately leading to differences in seed cotton yield [17,23]. This hypothesis can also be used to explain the yield differences between the two drip line layouts in the current study.
PFPN was significantly affected by Y, DL, N, and the DL × N interaction (p < 0.05), whereas the Y × DL, Y × N, and three-way interactions were not significant. The results of this study showed that, under the same drip line layout, PFPN in the reduced N application treatment was significantly higher than that in the traditional N application treatment. Zhao et al. (2020) found that PFPN decreased significantly as N application rate increased [44]. This result agrees with our findings. Bai et al. [31] found a significant interaction between irrigation amount and N rate on PFPN, and that under adequate water supply, a high N rate can also increase PFPN. In contrast, our study found that at the same N rate, PFPN was significantly higher under the wide-row drip-tape layout than under the narrow-row layout. This may be attributable to differences in water and nutrient supply caused by different drip irrigation layouts.
A few limitations should be noted. Overall, the experiment was conducted at a single site using one cotton cultivar, one irrigation regime, and only two N rates (240 and 300 kg N ha−1); consequently, the results support the wide-row layout combined with 240 kg N ha−1 only under the specific soil, climate, cultivar, and irrigation conditions tested, and this combination should not be presented as a universally optimal management strategy. A precise optimum N rate cannot be established from two rates alone. In addition, root distribution was assessed only in 2025, and other N loss pathways (ammonia volatilization, N2O emissions, and dinitrogen losses) were not quantified. Additional validation across multiple sites, soil types, cultivars, and N rates, together with direct measurements of soil water dynamics and the full N balance, would be required before broader recommendations can be made.
5. Conclusions
In this two-year single-site field experiment with one cotton cultivar and two N rates (240 and 300 kg N ha−1), soil NO3−-N distribution, NO3−-N leaching, cotton root distribution, and seed cotton yield were affected by the drip line layout and N application rate. Under the narrow-row layout, soil NO3−-N migrated rapidly downward and increased in the 60–100 cm layer, whereas cotton roots were mainly distributed in the 0–60 cm layer, so the NO3−-N distribution did not match that of the roots; although 240 kg N ha−1 significantly reduced the measured NO3−-N leaching and residual soil NO3−-N, cotton N uptake and seed cotton yield were also significantly reduced compared with 300 kg N ha−1. Under the wide-row layout, soil NO3−-N was mainly distributed in the 0–60 cm layer during one fertigation cycle and throughout the growth period; in 2025, this distribution was associated with higher root length density and a closer spatial overlap between roots and NO3−-N-enriched areas, and 240 kg N ha−1 significantly reduced the measured NO3−-N leaching loss and residual soil NO3−-N stock relative to 300 kg N ha−1 without significantly reducing boll biomass, total N uptake, or seed cotton yield. Overall, under the soil, climate, cultivar, and irrigation conditions of this two-year single-site experiment, the wide-row layout combined with 240 kg N ha−1 maintained seed cotton yield while improving PFPN and reducing measured NO3−-N leaching and residual soil NO3−-N relative to 300 kg N ha−1.
Supplementary Materials
The following supporting information can be downloaded at: https://www.mdpi.com/article/10.3390/agronomy16212155/s1, Figure S1: Schematic of soil sampling sites; Table S1: Analysis of variance (F values) for nitrate-N leaching, nitrate-N residue, stem dry matter weight, leaf dry matter weight, boll dry matter weight, total dry matter weight, stem nitrogen uptake, leaf nitrogen uptake, boll nitrogen uptake, total nitrogen uptake, boll number per plant, boll weight, yield, irrigation water use efficiency, and nitrogen partial factor productivity as affected by year, drip line layout, nitrogen application rate, and their interactions; Table S2: Analysis of variance (p values) for nitrate-N leaching, nitrate-N residue, stem dry matter weight, leaf dry matter weight, boll dry matter weight, total dry matter weight, stem nitrogen uptake, leaf nitrogen uptake, boll nitrogen uptake, total nitrogen uptake, boll number per plant, boll weight, yield, irrigation water use efficiency, and nitrogen partial factor productivity as affected by year, drip line layout, nitrogen application rate, and their interactions.
Author Contributions
K.L. contributed to the conceptualization, methodology, investigation, data collection, acquisition framework, data analysis, and writing of the original draft manuscript in terms of the scientific content. H.M. and S.P. contributed to the investigation and the sample collection. S.P. and X.M. contributed to conceptualization, data collection, the acquisition framework, supervision, and the design of the experiment. All authors have read and agreed to the published version of the manuscript.
Funding
This research was funded by the Project of Fund for Stable Support to Agricultural Sci-Tech Renovation (Grant No. xjnkywdzc-2026001-51).
Data Availability Statement
Data will be made available on request.
Acknowledgments
We would like to thank Xinjiang Academy of Agricultural Sciences for providing us with the test site. We would also like to thank the Key Laboratory of Agro-Environment of Northwest Oasis Ministry of Agriculture and Rural Affairs for providing experimental support.
Conflicts of Interest
The authors declare that they have no conflicts of interest.
References
- Wang, T.; Wang, Z.; Zhang, J.; Ma, K. An optimum combination of irrigation amount, irrigation water salinity and nitrogen application rate can improve cotton (for fiber) nitrogen uptake and final yield. Ind. Crop. Prod. 2022, 187, 115386. [Google Scholar] [CrossRef] [Scilit]
- Cun, S.; Fırat, Z.; Sakin, E.; Yanardağ, İ.H.; Beyyavaş, V.; Cevheri, C.İ.; Yıldırım, H. Growth and biomass responses of cotton to nitrogen and molybdenum applied via seed, foliar, and soil pathways. J. Soil. Sci. Plant Nutr. 2026, 26, 4625–4640. [Google Scholar]
- Ren, K.; Xu, M.; Li, R.; Zheng, L.; Liu, S.; Reis, S.; Wang, H.; Lu, C.; Zhang, W.; Gao, H.; et al. Optimizing nitrogen fertilizer use for more grain and less pollution. J. Clean. Prod. 2022, 360, 132180. [Google Scholar] [CrossRef] [Scilit]
- Zhang, C.; Rees, R.M.; Ju, X. Cropping system design can improve nitrogen use efficiency in intensively managed agriculture. Environ. Pollut. 2021, 280, 116967. [Google Scholar] [CrossRef] [Scilit] [PubMed]
- Chang, J.; Havlík, P.; Leclère, D.; de Vries, W.; Valin, H.; Deppermann, A.; Hasegawa, T.; Obersteiner, M. Reconciling regional nitrogen boundaries with global food security. Nat. Food 2021, 2, 700–711. [Google Scholar] [CrossRef] [Scilit] [PubMed]
- Guo, Y.; Chen, Y.; Searchinger, T.D.; Zhou, M.; Pan, D.; Yang, J.; Wu, L.; Cui, Z.; Zhang, W.; Zhang, F.; et al. Air quality, nitrogen use efficiency and food security in China are improved by cost-effective agricultural nitrogen management. Nat. Food 2020, 1, 648–658. [Google Scholar] [CrossRef] [Scilit] [PubMed]
- Yu, C.; Huang, X.; Chen, H.; Godfray, H.C.J.; Wright, J.S.; Hall, J.W.; Gong, P.; Ni, S.; Qiao, S.; Huang, G.; et al. Managing nitrogen to restore water quality in China. Nature 2025, 567, 516–520. [Google Scholar] [CrossRef] [Scilit] [PubMed]
- Zhang, X.; Davidson, E.A.; Mauzerall, D.L.; Searchinger, T.D.; Dumas, P.; Shen, Y. Managing nitrogen for sustainable development. Nature 2015, 528, 51–59. [Google Scholar] [CrossRef] [Scilit] [PubMed]
- Ramazanoğlu, E.; Cun, S.; Cevheri, C.İ.; Beyyavaş, V.; Sakin, E. Cottonseed meal soil application, nutrient uptake, biochemical attributes of cotton (Gossypium hirsutum L.) and activities of soil enzymes in saline soil. J. Elem. 2024, 29(3), 647-664. [Google Scholar] [CrossRef] [Scilit]
- Yahaya, S.M.; Mahmud, A.A.; Abdullahi, M.; Haruna, A. Recent advances in the chemistry of N, P, K as fertilizer in soil – a review. Pedosphere 2022, 33, 385–406. [Google Scholar] [CrossRef] [Scilit]
- Zhang, L.; Zhang, W.; Cui, Z.; Hu, Y.; Schmidhalter, U.; Chen, X. Environmental, human health, and ecosystem economic performance of long-term optimizing nitrogen management for wheat production. J. Clean. Prod. 2021, 311, 127620. [Google Scholar] [CrossRef] [Scilit]
- Ma, H.; Wu, Q.; Wu, X.; Zhu, Q.; Pu, S.; Ma, X. Irrigation Intensities Drive Soil N2O Emission Reduction in Drip-Irrigated Cotton Fields. Plants 2025, 14, 987. [Google Scholar] [CrossRef] [Scilit] [PubMed]
- Wu, H.; Xu, M.; Peng, Z.; Chen, X. Quantifying the potential impacts of meltwater on cotton yields in the Tarim River Basin, Central Asia. Agr. Water Manag. 2022, 269, 107639. [Google Scholar] [CrossRef] [Scilit]
- Dai, J.; Dong, H. Intensive cotton farming technologies in China: Achievements, challenges and countermeasures. Field Crop. Res. 2014, 155, 99–110. [Google Scholar] [CrossRef] [Scilit]
- Luo, Z.; Liu, H.; Li, W.; Zhao, Q.; Dai, J.; Tian, L.; Dong, H. Effects of reduced nitrogen rate on cotton yield and nitrogen use efficiency as mediated by application mode or plant density. Field Crop. Res. 2018, 218, 150–157. [Google Scholar] [CrossRef] [Scilit]
- Liao, H.; Liu, K.; Hao, H.; Yong, Y.; Zhang, W.; Hou, Z. Effects of Irrigation Amount and Nitrogen Rate on Cotton Yield, Nitrogen Use Efficiency, and Soil Nitrogen Balance under Drip Irrigation. Agronomy 2024, 14, 1671. [Google Scholar] [CrossRef] [Scilit]
- Guo, L.; Cao, H.; Helgason, W.D.; Yang, H.; Wu, X.; Li, H. Effect of drip-line layout and irrigation amount on yield, irrigation water use efficiency, and quality of short-season tomato in northwest China. Agr. Water Manag. 2022, 270, 107731. [Google Scholar] [CrossRef] [Scilit]
- Liu, K.; Liao, H.; Hao, H.; Hou, Z. Water and nitrogen supply at spatially distinct locations improves cotton water productivity and nitrogen use efficiency and yield under drip irrigation. Agric. Water Manag. 2024, 296, 108808. [Google Scholar] [CrossRef] [Scilit]
- Cun, S.; Beyyavaş, V.; Cevheri, C.İ.; Akın, S.; Sakin, E.; Fırat, Z.; Ramazanoğlu, E. Effects of chemical fertilizer and biogas slurry on cotton (Gossypium hirsutum L.) yield and soil properties under different irrigation levels. BMC Plant Biol. 2026, 26, 410. [Google Scholar] [CrossRef] [Scilit] [PubMed]
- Zhou, L.; Feng, H.; Zhao, Y.; Qi, Z.; Zhang, T.; He, J.; Dyck, M. Drip irrigation lateral spacing and mulching affects the wetting pattern, shoot-root regulation, and yield of maize in a sand-layered soil. Agric. Water Manag. 2017, 184, 114–123. [Google Scholar] [CrossRef] [Scilit]
- Ardenti, F.; Abalos, D.; Capra, F.; Lommi, M.; Maris, S.C.; Perego, A.; Bertora, C.; Tabaglio, V.; Fiorini, A. Matching crop row and dripline distance in subsurface drip irrigation increases yield and mitigates n2o emissions. Field Crop. Res. 2022, 289, 108732. [Google Scholar] [CrossRef] [Scilit]
- Firouzabadi, A.G.; Baghani, J.; Jovzi, M.; Albaji, M. Effects of wheat row spacing layout and drip tape spacing on yield and water productivity in sandy clay loam soil in a semi-arid region. Agr. Water Manag. 2021, 251, 106868. [Google Scholar] [CrossRef] [Scilit]
- Lin, X.; Wang, Z.; Li, J. Identifying the factors dominating the spatial distribution of water and salt in soil and cotton yield under arid environments of drip irrigation with different lateral lengths. Agr. Water Manag. 2021, 250, 106834. [Google Scholar] [CrossRef] [Scilit]
- Wang, R.; Wan, S.; Kang, Y.; Dou, C. Assessment of secondary soil salinity prevention and economic benefit under different drip line placement and irrigation regime in northwest China. Agr. Water Manag. 2014, 131, 41–49. [Google Scholar] [CrossRef] [Scilit]
- Zhang, G.; Hou, Y.; Zhang, H.; Fan, H.; Wen, X.; Han, J.; Liao, Y. Optimizing planting pattern and nitrogen application rate improves grain yield and water use efficiency for rain-fed spring maize by promoting root growth and reducing redundant root growth. Soil. Till. Res. 2022, 220, 105385. [Google Scholar] [CrossRef] [Scilit]
- Liu, K.; Liu, S.; Liao, H.; Hou, Z. Effects of drip tape placement position and dripper type on root distribution, N use efficiency and yield of cotton under drip irrigation in Xinjiang, China. Field Crops Res. 2025, 327, 109894. [Google Scholar] [CrossRef] [Scilit]
- Chen, W.; Jin, M.; Ferre, T.P.A.; Liu, Y.; Huang, J.; Xian, Y. Soil conditions affect cotton root distribution and cotton yield under mulched drip irrigation. Field Crop. Res. 2020, 249, 107743. [Google Scholar] [CrossRef] [Scilit]
- Chen, W.; Chen, F.; Lai, S.; Jin, M.; Xu, S.; Liu, Y.; Liang, X.; Ferre, T.P.A. Spatial distribution and dynamics of cotton fine root under film-mulched drip irrigation. Ind. Crop. Prod. 2022, 179, 114693. [Google Scholar] [CrossRef] [Scilit]
- Anas, M.; Liao, F.; Verma, K.K.; Sarwar, M.A.; Mahmood, A.; Chen, Z.; Li, Q.; Zeng, X.; Liu, Y.; Li, Y. Fate of nitrogen in agriculture and environment: Agronomic, eco-physiological and molecular approaches to improve nitrogen use efficiency. Biol. Res. 2020, 53, 47. [Google Scholar] [CrossRef] [Scilit] [PubMed]
- Lu, Y.; Wang, E.; Zhao, Z.; Liu, X.; Tian, A.; Zhang, X. Optimizing irrigation to reduce n leaching and maintain high crop productivity through the manipulation of soil water storage under summer monsoon climate. Field Crop. Res. 2021, 265, 108110. [Google Scholar] [CrossRef] [Scilit]
- Bai, Z.; Bai, W.; Xie, C.; Yu, J.; Dai, Y.; Pei, S.; Zhang, F.; Li, Y.; Fan, J.; Yin, F. Irrigation depth and nitrogen rate effects on seed cotton yield, fiber quality and water-nitrogen utilization efficiency in southern Xinjiang, China. Agric. Water Manag. 2023, 290, 108583. [Google Scholar] [CrossRef] [Scilit]
- Bremner, J.M.; Mulvaney, C.S. Nitrogen—Total. In Methods of Soil Analysis: II. Chemical and Microbiological Properties; Page, A.L., Ed.; ASA and SSSA: Madison, WI, 1982; Volume 2, pp. 595–624. [Google Scholar]
- Unlu, M.; Kanber, R.; Koc, D.L.; Tekin, S.; Kapur, B. Effects of deficit irrigation on the yield and yield components of drip irrigated cotton in a mediterranean environment. Agr. Water Manag. 2011, 98, 597–605. [Google Scholar] [CrossRef] [Scilit]
- Chen, Z.; Li, Y.; Zhang, X.; Xiong, Y.; Huang, Q.; Jin, S.; Sun, S.; Chi, D.; Huang, G. Effects of lignite bioorganic product on sunflower growth, water and nitrogen productivity in saline-sodic farmlands at northwest China. Agr. Water Manag. 2022, 271, 107806. [Google Scholar] [CrossRef] [Scilit]
- He, Y.; Xi, B.; Li, G.; Wang, Y.; Jia, L.; Zhao, D. Influence of drip irrigation, nitrogen fertigation, and precipitation on soil water and nitrogen distribution, tree seasonal growth and nitrogen uptake in young triploid poplar (populus tomentosa) plantations. Agr. Water Manag. 2021, 243, 106460. [Google Scholar] [CrossRef] [Scilit]
- Xue, X.; Mai, W.; Zhao, Z.; Zhang, K.; Tian, C. Optimized nitrogen fertilizer application enhances absorption of soil nitrogen and yield of castor with drip irrigation under mulch film. Ind. Crop. Prod. 2017, 95, 156–162. [Google Scholar] [CrossRef] [Scilit]
- Al-Ogaidi, A.A.M.; Wayayok, A.; Rowshon, M.K.; Abdullah, A.F. Wetting patterns estimation under drip irrigation systems using an enhanced empirical model. Agr. Water Manag. 2016, 176, 203–213. [Google Scholar] [CrossRef] [Scilit]
- Bajpai, A.; Kaushal, A. Soil moisture distribution under trickle irrigation: A review. Water Supply 2020, 20, 761–772. [Google Scholar] [CrossRef] [Scilit]
- Du, S.; Zhang, Z.; Chen, P.; Li, T.; Han, Y.; Song, J. Fate of each period fertilizer n in mollisols under water and n management: A 15n tracer study. Agr. Water Manag. 2022, 272, 107872. [Google Scholar] [CrossRef] [Scilit]
- Yang, W.; Jiao, Y.; Yang, M.; Wen, H.; Gu, P.; Yang, J.; Liu, L.; Yu, J. Minimizing soil nitrogen leaching by changing furrow irrigation into sprinkler fertigation in potato fields in the northwestern China plain. Water 2020, 12, 2229. [Google Scholar] [CrossRef] [Scilit]
- Wang, D.; Mo, Y.; Li, G.; Wilkerson, C.J.; Hoogenboom, G. Improving maize production and decreasing nitrogen residue in soil using mulched drip fertigation. Agr. Water Manag. 2021, 251, 106871. [Google Scholar] [CrossRef] [Scilit]
- Zhu, L.; Liu, L.; Sun, H.; Zhang, K.; Zhang, Y.; Li, A.; Bai, Z.; Wang, G.; Liu, X.; Dong, H.; et al. Low nitrogen supply inhibits root growth but prolongs lateral root lifespan in cotton. Ind. Crop. Prod. 2022, 189, 115733. [Google Scholar] [CrossRef] [Scilit]
- Wu, B.; Zhang, L.; Tian, J.; Zhang, G.; Zhang, W. Nitrogen rate for cotton should be adjusted according to water availability in arid regions. Field Crop. Res. 2022, 285, 108606. [Google Scholar] [CrossRef] [Scilit]
- Zhao, W.; Shan, Z.; Li, J.; Li, Y. Effects of fertigation splits through center pivot on the nitrogen uptake, yield, and nitrogen use efficiency of winter wheat grown in the north china plain. Agr. Water Manag. 2020, 240, 106291. [Google Scholar] [CrossRef] [Scilit]

Disclaimer/Publisher’s Note: The statements, opinions and data contained in all publications are solely those of the individual author(s) and contributor(s) and not of MDPI and/or the editor(s). MDPI and/or the editor(s) disclaim responsibility for any injury to people or property resulting from any ideas, methods, instructions or products referred to in the content. |
© 2026 by the authors. Licensee MDPI, Basel, Switzerland. This article is an open access article distributed under the terms and conditions of the Creative Commons Attribution (CC BY) license.