


Abstract
Brace roots are important organs affecting maize resistance to lodging. Analyzing the genetic basis of the brace-root traits can help to improve maize lodging resistance. In this study, an association panel of 508 maize inbred lines was evaluated for three brace-root traits and subjected to genome-wide association analysis of tier number (TN), brace-root number (RN), and radius of brace-root circle (RBR), across two environments. Using the fixed and random model circulating probability unification (FarmCPU) combined with Bonferroni and Benjamini–Hochberg false discovery rate (FDR) correction, we identified suggestive candidate associations (p < 1 × 10⁻⁵) and four groups of environment-specific linkage disequilibrium single nucleotide polymorphisms (SNPs); no SNP reached genome-wide significance after multiple-testing correction. Within the linkage disequilibrium (LD) intervals of these SNPs, 14 candidate genes were identified and functionally annotated. The genetic loci and candidate genes associated with variation in maize brace-root traits mined in this study can help to further reveal their genetic basis and provide a theoretical basis for future functional studies of relevant regulatory genes.
1. Introduction
Maize (Zea mays L.) is an important source of food and feed globally, and its output needs to be constantly boosted with the global population growth. However, the limitation of total arable land area necessitates increasing the total maize output by improving the yield per unit area, such as through a reasonable increase in planting density [1]. However, the increase in maize planting density is mainly constrained by plant lodging [2]. Lodging resistance is influenced by several factors, including root system architecture [3]. The maize root system is very particular in that it possesses a special type of root, brace or aerial roots, which arise from the lower above-ground nodes of the plant. In maize, two types of nodal roots—subterranean crown and aerial brace roots—function in anchorage and water uptake and preferentially express multiple water and nutrient transporters [4]. Revealing the genetic basis of the brace-root development and identifying the corresponding candidate regulatory genes can provide a strong theoretical basis for molecular design breeding of maize.
Brace-root angle, brace-root number per whorl, and the number of brace-root tiers are positively correlated with lodging resistance [5,6]. Genetic analyses have demonstrated that brace-root number (RN), tier number (TN), and radius of the brace-root circle (RBR) are complex quantitative traits governed by multiple small-effect loci [7]. A genome-wide association study (GWAS) and quantitative trait locus (QTL) mapping are effective approaches for identifying genomic regions significantly associated with phenotypic variation in quantitative traits. Several quantitative-trait loci (QTLs) associated with brace-root traits have been identified through QTL mapping [8].
Using maize recombinant inbred line (RIL) and F2 populations combined with 13,603 single nucleotide polymorphism (SNP) markers, QTL mapping was performed for total brace-root tiers and effective brace-root tiers across three environments. In the RIL population, six QTLs associated with total brace-root tiers and four QTLs associated with effective brace-root tiers were identified; in the F2 population, eight QTLs for total brace-root tiers and seven QTLs for effective brace-root tiers were detected, among which seven QTLs were associated with effective brace-root tiers. Notably, a QTL interval (umc1873–umc1077) on chromosome 10, associated with both total and effective brace-root tiers, was consistently detected in both populations and exhibited the largest positive additive effect [8,9].
In another study, QTLs for RN, TN, and RBR were mapped in an RIL population evaluated across three environments using 13,603 markers [10]. High heritability estimates were obtained for all three traits, with genotype, environment, and their interaction each contributing significantly to phenotypic variation. A total of eight QTLs were mapped (three for TN, three for RN, and two for RBR), which were distributed on chromosomes 1, 2, 9, and 10. In the corresponding regions, 60 functionally annotated genes were identified, with predicted roles in signal transduction, regulation of gene expression, and metabolic processes [9]. Although several loci controlling brace-root traits in maize have been identified in previous studies, brace-root traits are complex quantitative traits, and mapping results often vary due to differences in genetic materials and analytical methods. Therefore, further exploration of novel loci associated with brace-root traits in maize is warranted.
In this study, an association panel of 508 maize inbred lines was used to characterize phenotypic variation in three brace-root traits, tier number (TN), brace-root number (RN), and brace-root circle radius (RBR) across two environments and to perform GWAS. We identified a series of loci and candidate genes associated with RBR, TN, and RN, providing valuable molecular markers and candidate-gene resources for further research on maize brace-root development.
2. Materials and Methods
2.1. Association Panel
The association panel for GWAS comprised 508 genetically diverse maize inbred lines drawn from three germplasm sources: 60 accessions from the Germplasm Enhancement of Maize (GEM) program of the United States, 223 lines from the International Maize and Wheat Improvement Center (CIMMYT) in Mexico, and 225 lines of Chinese origin. Lines derived from CIMMYT were predominantly tropical and subtropical germplasm, whereas the US and Chinese materials were largely temperate in adaptation. Yang et al. [11] previously performed kinship analysis on the 508 maize inbred lines and separated the association panel into four subgroups: stiff stalk (SS, n = 27), non-stiff stalk (NSS, n = 70), tropical–subtropical (TST, n = 196), and admixed (MIXED, n = 215). Temperate lines were assigned to the SS and NSS subgroups, tropical and subtropical lines fell into the TST subgroup, and the remaining admixed lines were grouped into the MIXED subgroup. These 508 inbred lines have been characterized previously in terms of population structure, linkage disequilibrium, and genetic diversity [11,12].
2.2. Field Experiments and Phenotyping
All 508 inbred lines of the association panel were planted in two environments in China: Shenyang City, Liaoning Province in 2022 (SY, 41°48′ N, 123°26′ E), and Xinxiang City, Henan Province in 2023 (XX, 35°11′ N,113°55′ E). All lines were planted using a randomized block design with two replicates. Each inbred line was planted in a single 2-m row with 0.6 m between rows, and 10–15 plants per row depending on the target planting density. This moderate-to-high density regime was intentionally adopted to: (i) mimic real-world production conditions, ensuring that the identified quantitative trait loci (QTL) or markers are relevant to practical breeding scenarios, especially given that the effects of population density on disease severity and combining ability have been extensively validated in maize breeding populations; and (ii) improve screening efficiency by allowing a reasonable number of replicates within limited field space, while still maintaining uniform light interception and nutrient availability per plant. Importantly, consistent with previous reports, this density range has been demonstrated to effectively elevate disease pressure without inducing severe lodging or yield collapse, thus rendering it suitable for both genetic dissection and resistance breeding programs [13]. Three maize brace-root traits including RBR, RN, and TN were measured during the reproductive growth stage, using the method described by Hostetler et al. [14].
2.3. Statistical Analysis of Phenotypes
Analysis of variance (ANOVA) and best linear unbiased prediction (BLUP) were performed for RBR, RN, and TN using linear mixed models implemented in the lme4 package of META-R v6.0 [15]: for individual environment analysis, for across environments analysis, where Yijk is the phenotype of interest, µ is the mean effect, Envi is the effect of the ith environment, Repj (Envi) is the effect of the jth replicate within the ith environment, Genl is the effect of the lth genotype, Envi × Genl is the environment × genotype interaction, and εijk is the error. Broad-sense heritability was respectively calculated at individual environment and multiple environments as follows: and , where is the genetic variance, is the residual error, is the interaction of genotype and environment, and n represents the number of environments and replications [16]. For calculating BLUPs and broad-sense heritability, all effects were random.
2.4. GWAS
For the GWAS, genotypic data comprising 558,629 SNPs (minor allele frequency > 5%) were obtained from a public maize dataset [17,18]. The association analysis for the BLUP value of phenotype in two individual environments and across all environments were performed by the fixed and random-model circulating probability unification (FarmCPU) method in the GAPIT v3 package, which separates a multiple locus linear mixed model into fixed and random effect models to reduce false negatives that can result from a confounding population structure, kinship, and SNPs [19,20].
To account for multiple testing, marker–trait associations were evaluated using both Bonferroni correction (p < 8.95 × 10⁻⁸, based on n = 558,629 SNPs) and the Benjamini–Hochberg false discovery rate (FDR) procedure (q < 0.05). No SNP reached either genome-wide significance threshold across all scans. Associations meeting the threshold of p < 1 × 10⁻⁵ were retained as suggestive candidate associations for exploratory interpretation [21]. We used this suggestive threshold of p < 1.0 × 10⁻⁵ for GWAS, since RBR, RN, and TN are complex quantitative traits controlled by multiple small-effect loci, for which overly stringent thresholds would eliminate biologically meaningful associations. Population structure was controlled using the P matrix of three subgroups (NSS, SS, TST), and kinship was accounted for by the FarmCPU model, both of which reduce false-positive associations. Therefore, this threshold provides a reasonable balance between statistical stringency and power for detecting genuine associations.
The proportion of phenotypic variance explained by SNPs was assessed using the anova function in R v4.2.1. After controlling for population structure, R2 for each suggestive SNP was obtained from two linear models: Y = Xiαi + Pβ + ε, which estimated the combined variance across all suggestive SNPs, and Y = Xα + Pβ + ε, which estimated the variance for individual suggestive SNPs. Here, Y and X denote the phenotype and SNP genotype vectors, respectively; P is the matrix of the three subgroups (NSS, SS, TST); and α, β, and ε represent SNP, subgroup, and random effects, respectively.
2.5. Annotation of Candidate Genes
SNPs were grouped into LD clusters using PLINK clumping with an r2 threshold of 0.2. SNPs with r2 > 0.2 were considered to be in the same LD cluster, and the SNP with the smallest p-value within each cluster was selected to represent the locus. The physical locations of SNPs were determined in reference to the B73 RefGen_v2 genome. Genes within 50 kb upstream and downstream of each suggestive SNP were identified [12,22], and functionally annotated based on homology to Arabidopsis thaliana and rice genes.
2.6. Heat Map of Candidate Genes
The expression levels of candidate genes from different maize tissues of B73 were downloaded from the MaizeGDB qTeller database (https://qteller.maizegdb.org/). Values used for heatmap construction were computed as log10(n + 1), where n is the TPM value.
3. Results
3.1. Descriptive Statistics and Correlation Analysis
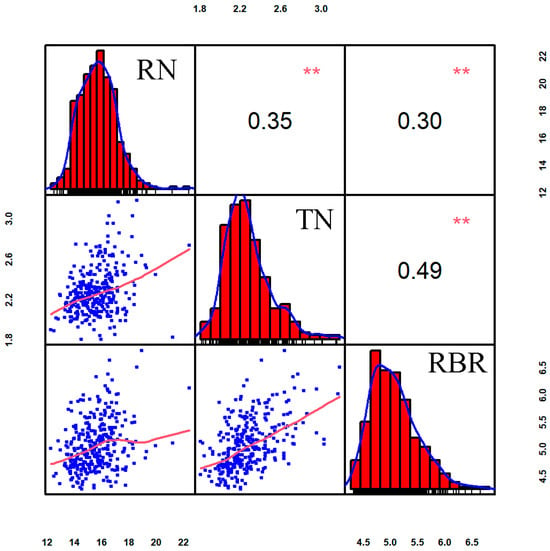
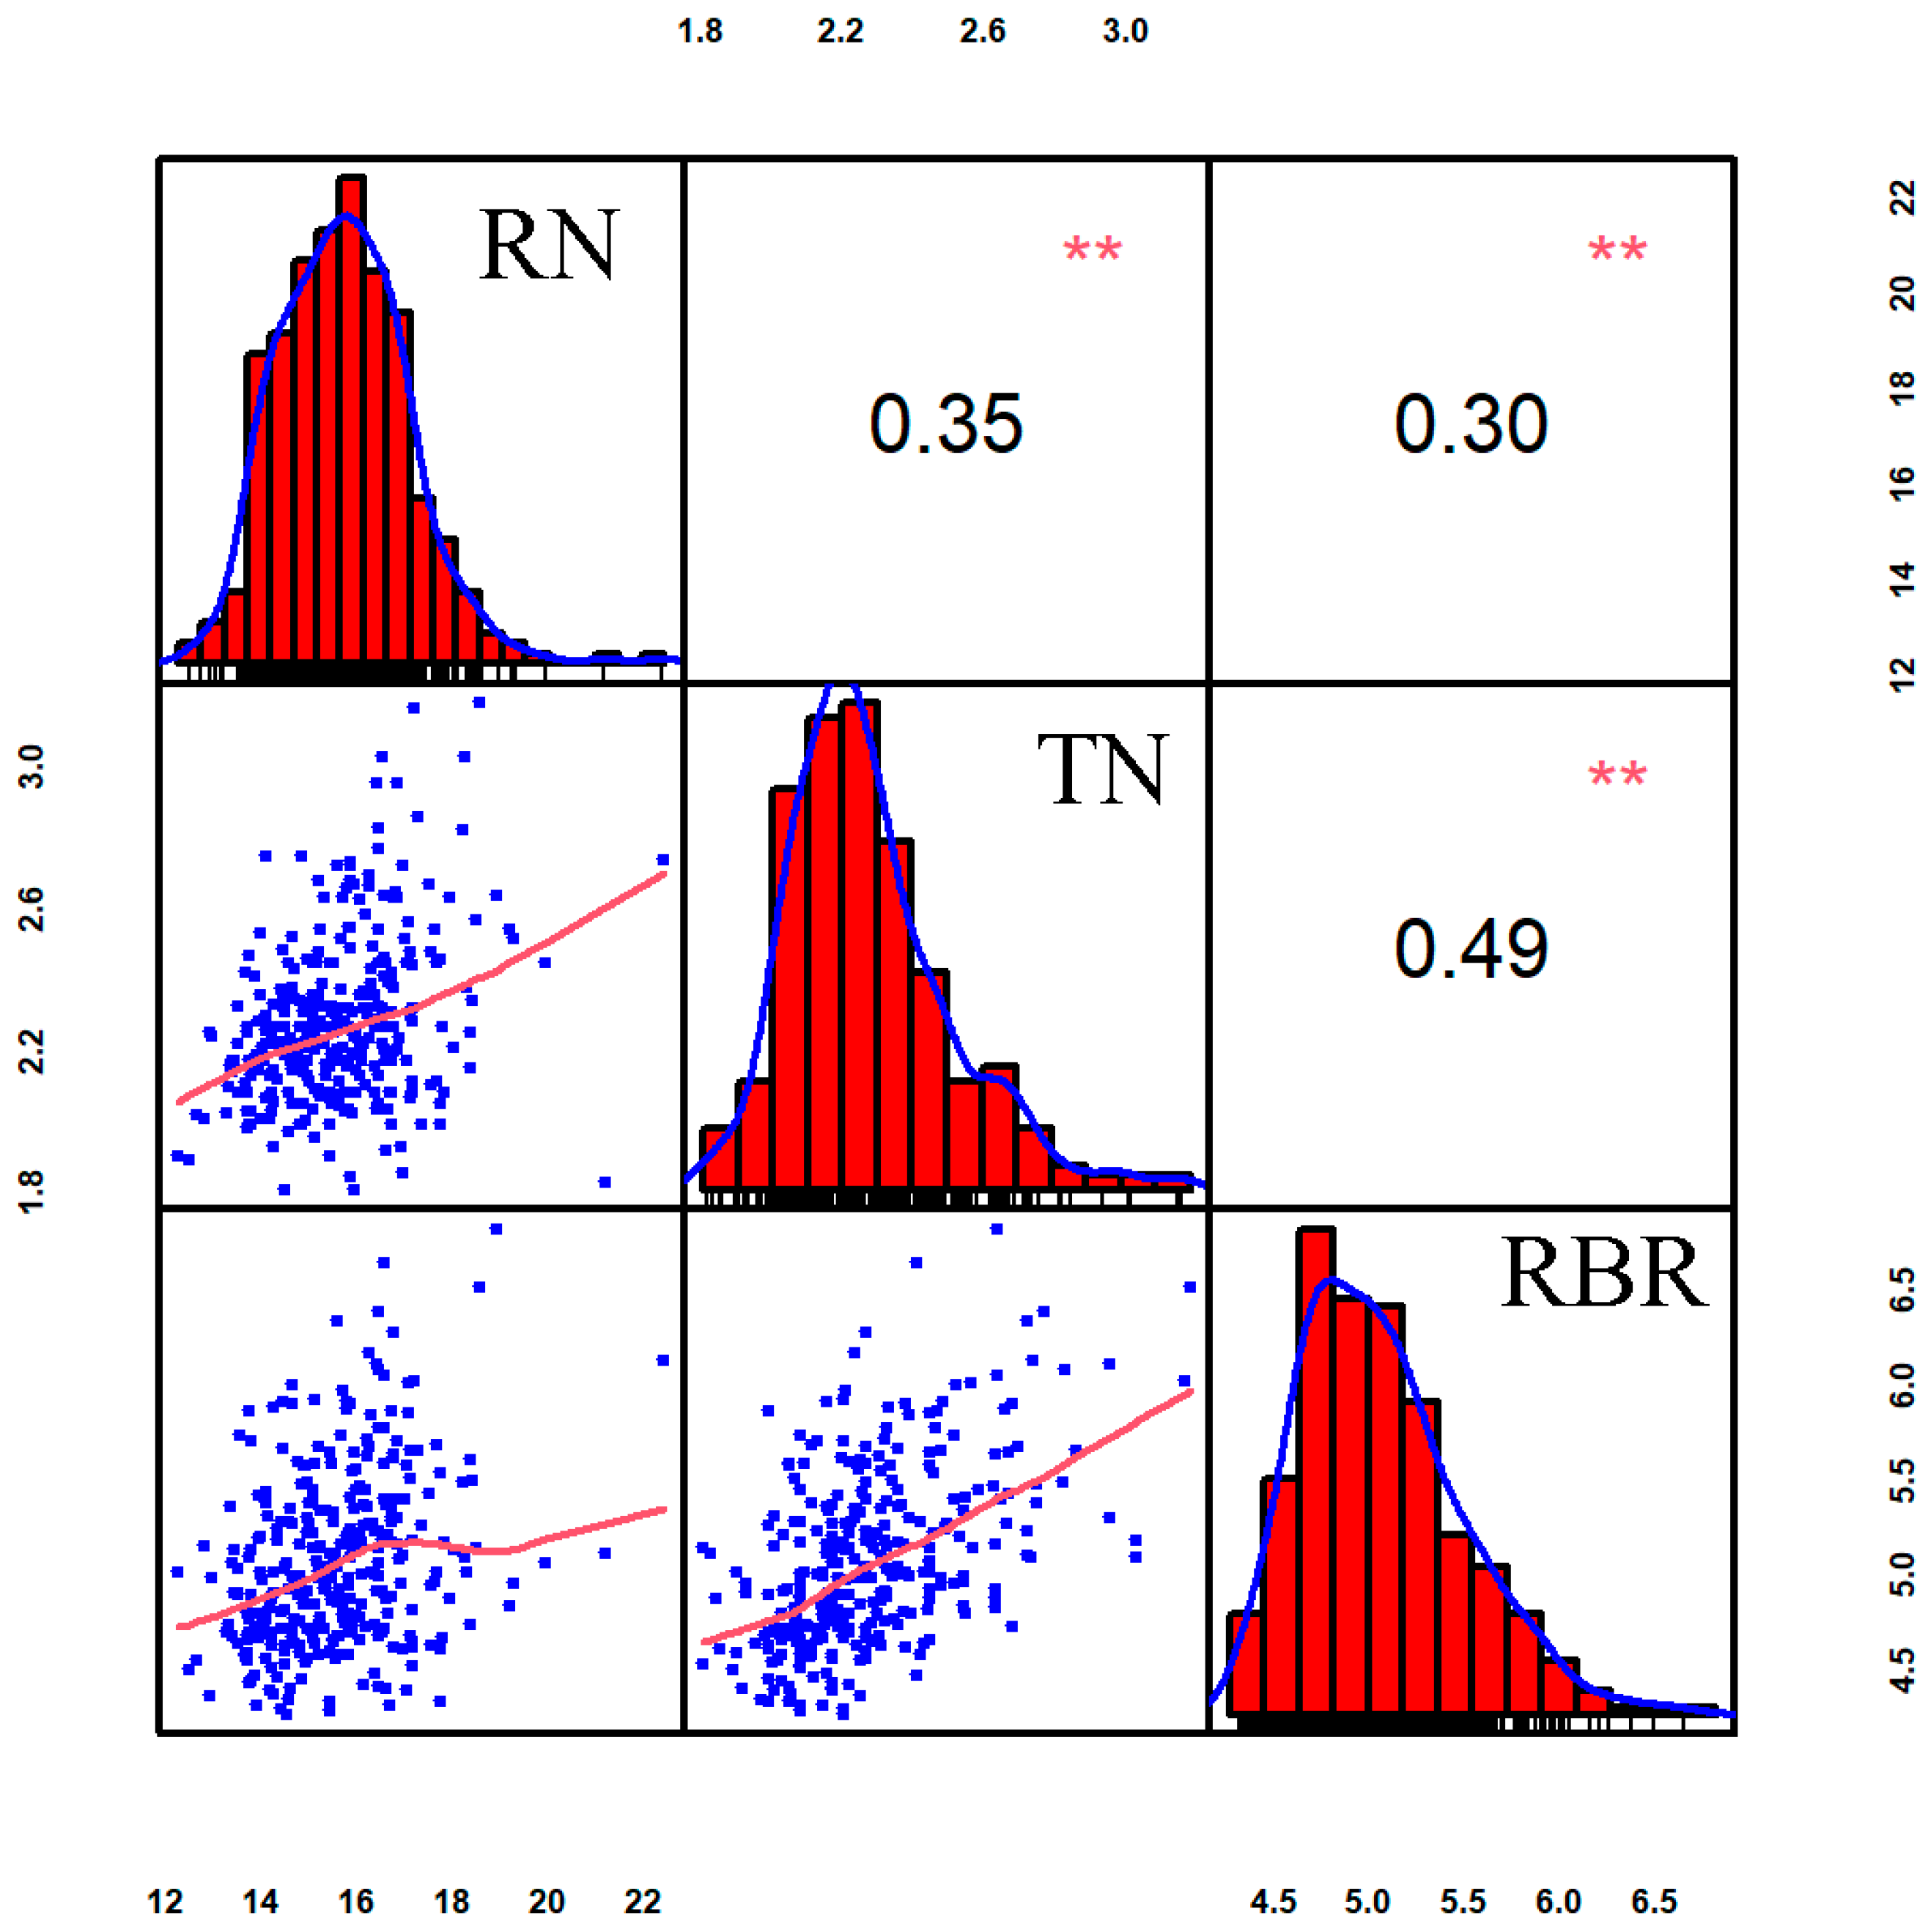
Phenotypic variation analysis revealed that brace-root RN, TN, and RBR in the association panel exhibited extensive phenotypic variation, following a normal distribution with a slight left skew, which is consistent with the inheritance of quantitative traits (Figure 1). The broad-sense heritability (h2) of RN, TN, and RBR ranged from 0.69 to 0.96 in single environments (SY: 0.69–0.80; XX: 0.93–0.96) and from 0.40 to 0.63 across environments (Table 1). The reduction in across-environment heritability was accompanied by significant genotype × environment interaction (G × E) effects for all three traits (p < 0.01). Variance analysis revealed that genotypic variance was highly significant (p < 0.01) for RN, TN, and RBR in both single and combined environments.
Figure 1.
Correlation coefficients of maize brace-root number (RN), tier number (TN), and radius of the brace-root circle (RBR) based on best linear unbiased prediction (BLUP) values. The red bars and blue curves in the diagonal panels represent the frequency distribution and fitted distribution of each trait; the blue dots indicate pairwise BLUP phenotypic values, and the red lines denote regression trend lines between paired traits. **, significant at p ≤ 0.01.
Table 1.
Variance composition and broad-sense heritability of maize brace-root number (RN), tier number (TN) and radius of the brace-root circle (RBR) in the association panel with two and across environments.
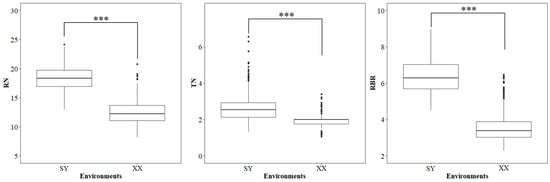
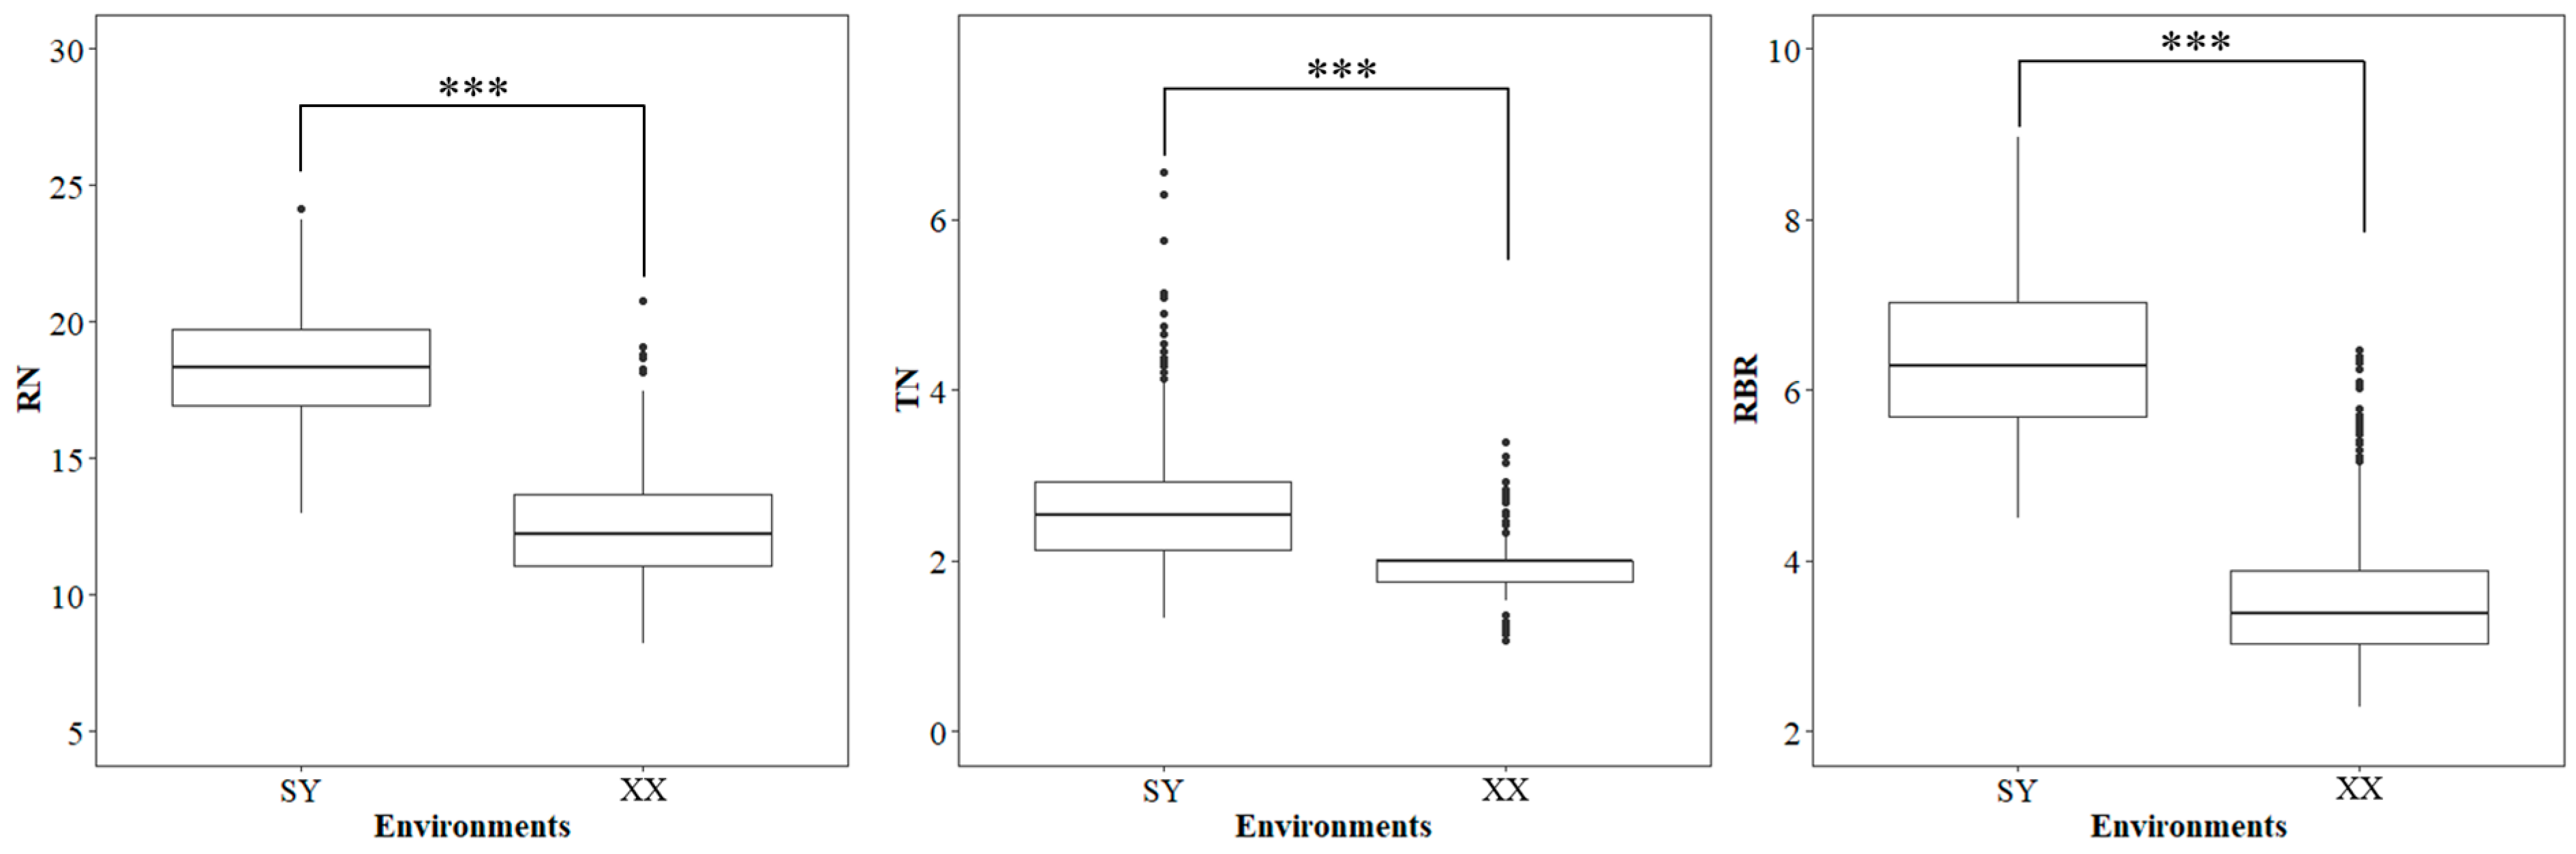
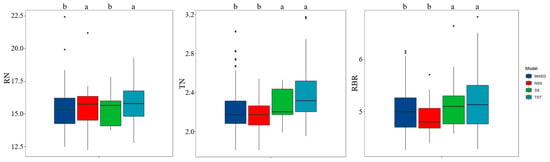
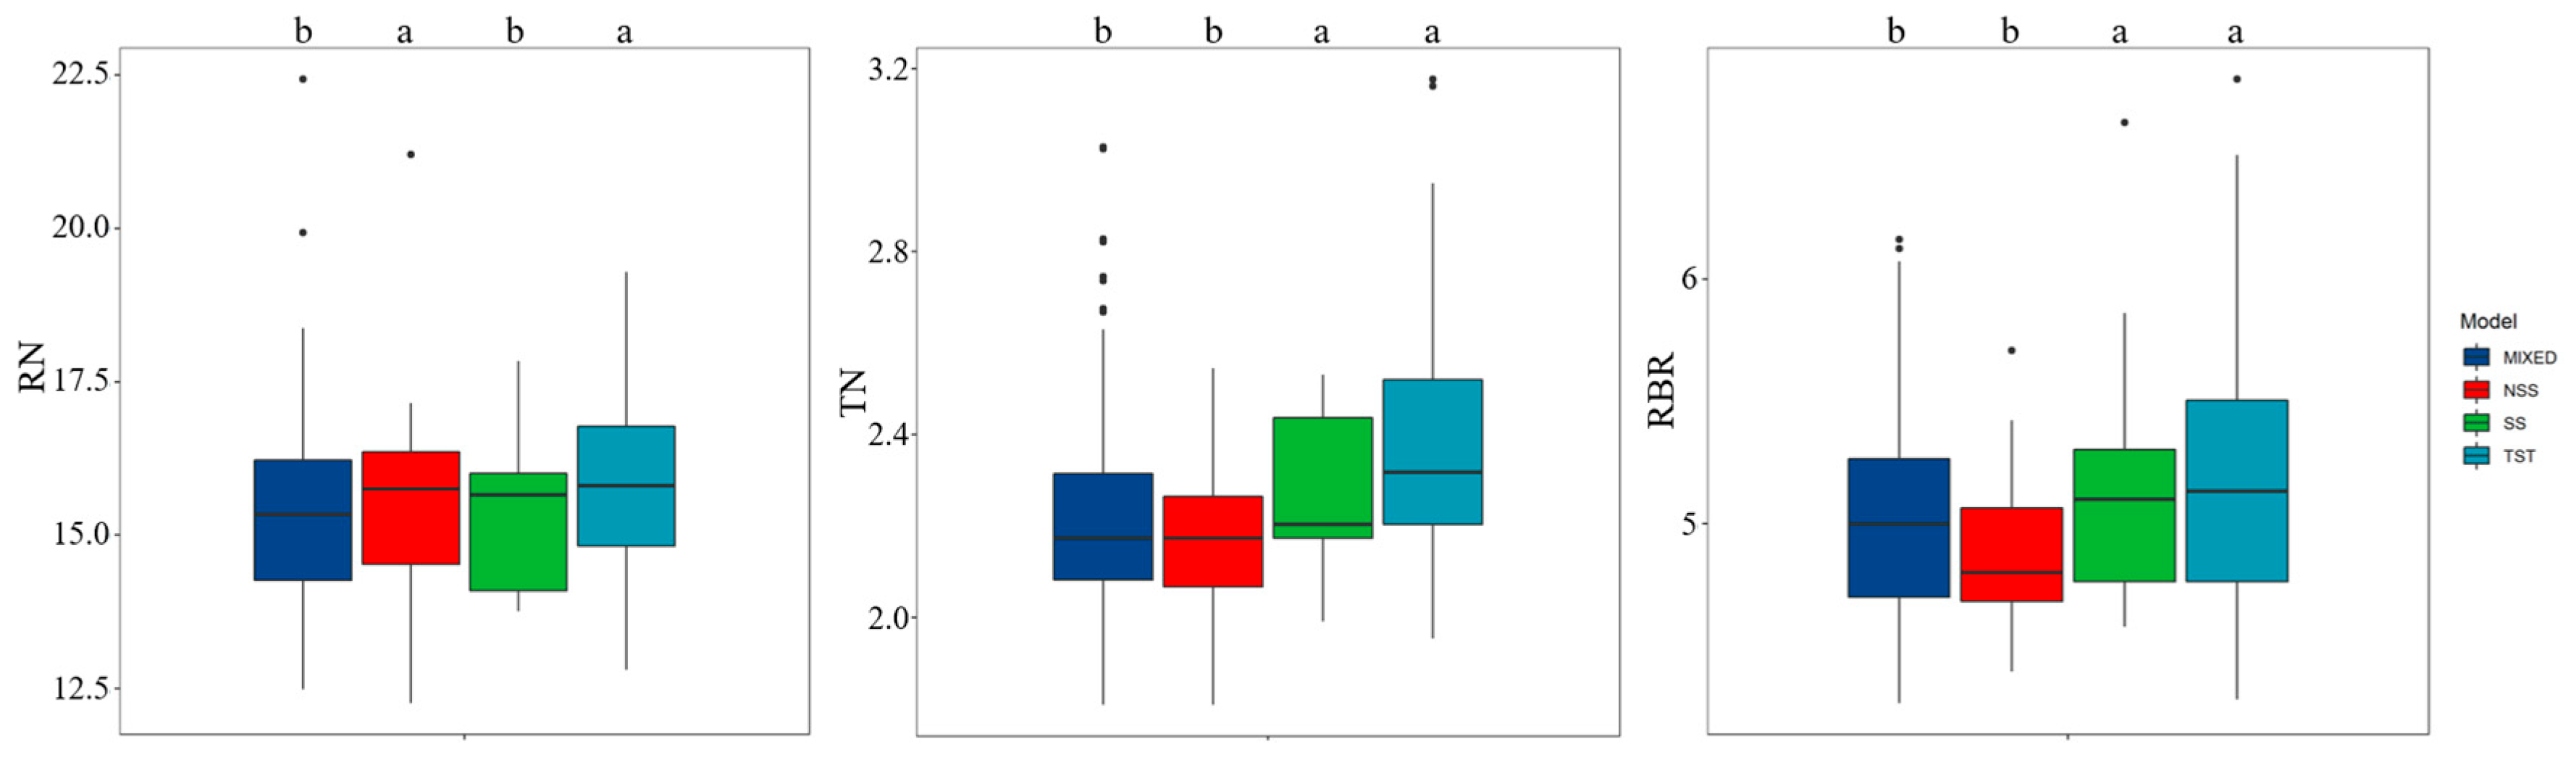
The correlation analysis showed that RN was positively correlated with TN (r = 0.35, p < 0.01) and RBR (r = 0.30, p < 0.01), and TN was positively correlated with RBR (r = 0.49, p < 0.01) (Figure 1). These correlation coefficients were low to moderate (r = 0.30–0.49, i.e., r < 0.5), but all were statistically significant. This indicates that the three traits are related but genetically partially independent, supporting their separate analysis in the GWAS. Additionally, the phenotypic variance of RN, TN, and RBR in different environments (SY and XX) was analyzed independently. Significant differences were detected in RN, TN, and RBR between two environments (Figure 2). The average of RN, TN, and RBR was 18.48, 2.67, and 6.45 in SY, respectively, and significantly higher than that in XX (12.52, 1.88, and 3.61). Phenotypic variation in RN, TN, and RBR was further compared among subgroups to evaluate the effect of population structure (Figure 3). For RN, mean values were significantly higher in the NSS and TST subgroups than in the MIXED and SS subgroups. For TN and RBR, the TST and SS subgroups had significantly higher means than the NSS and MIXED subgroups. In conclusion, RN, TN, and RBR exhibit a wide range of differences depending on genetic background and environment.
Figure 2.
Boxplot of maize brace-root number (RN), tier number (TN), and radius of the brace-root circle (RBR) distribution in different environments. Analysis of variance (ANOVA) was applied to examine the difference of phenotypes among different environments. *** p ≤ 0.001.
Figure 3.
Boxplot of maize brace-root number (RN), tier number (TN), and radius of the brace-root circle (RBR) distribution in different subgroups. The dots represent outlier observations. Different lowercase letters (a, b) above boxes indicate significant differences between subgroups (p < 0.05). Analysis of variance (ANOVA) was applied to examine the difference of phenotypes among different subgroups.
3.2. GWAS of Brace-Root Traits of Maize
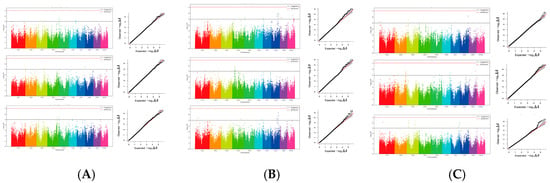
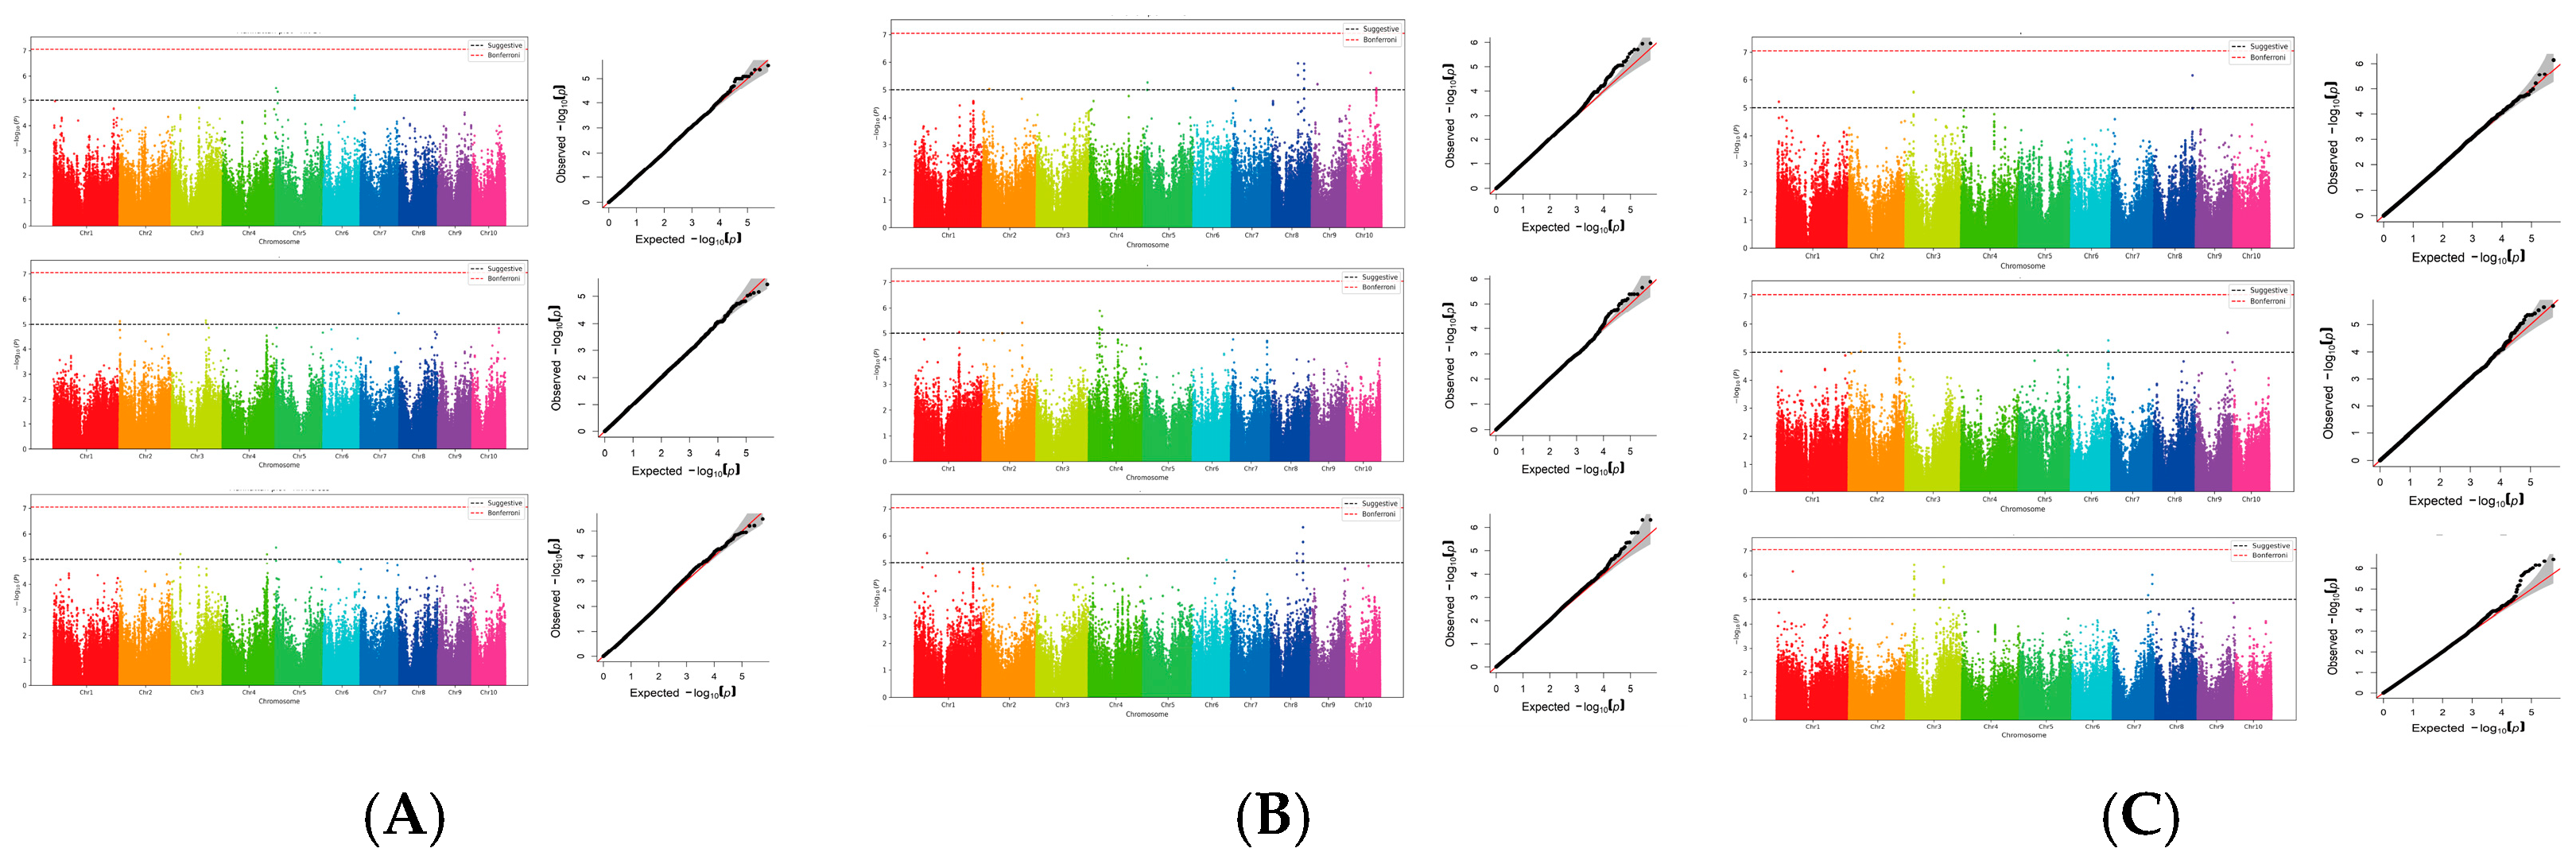
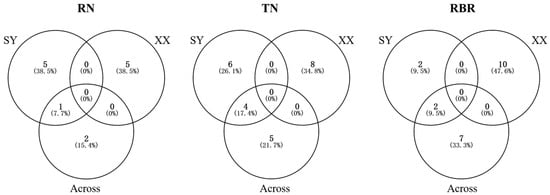
The GWAS was performed using the FarmCPU method with a threshold of p < 1.0 × 10⁻⁵. To account for multiple testing, we applied both Bonferroni correction (p < 8.95 × 10⁻⁸) and Benjamini–Hochberg FDR correction (q < 0.05). No SNP reached either genome-wide significance threshold; the minimum observed FDR q-value was 0.095. Associations at p < 1 × 10⁻⁵ are therefore reported as suggestive candidate associations for exploratory interpretation. For RN, we detected six, five, and three suggestive SNPs on chromosomes 2, 3, 4, 5, 6, and 7 in SY, XX, and across environments, which accounted for 4.21% to 10.15% of individual phenotypic variation and explained 19.34%, 11.07%, and 19.43% of total phenotypic variation, respectively (Table 2, Figure 4). For TN, we detected ten, eight, and nine suggestive SNPs on nine chromosomes except chromosome 3 in SY, XX, and across environments, which accounted for 3.98% to 22.19% of phenotypic variation and 38.08%, 15.53%, and 30.26% of total phenotypic variation, respectively (Table 2, Figure 4). For RBR, we detected four, ten, and nine suggestive SNPs on chromosomes 1, 2, 3, 5, 6, 7, 8, and 9 in SY, XX, and across environments, which accounted for 3.93% to 12.78% of individual phenotypic variation and explained 18.65%, 22.31%, and 24.64% of total phenotypic variation, respectively (Table 2, Figure 4). Among the above suggestive SNPs, twenty-six suggestive SNPs accounted for >10% of phenotypic variation, seven suggestive SNPs were detected in one single environment and across environments analysis (Figure 5). The −log10(p) values of the significant SNPs ranged from 5.02 to 6.42 (Table 2), corresponding to a moderate significance level. This is expected for complex quantitative traits such as brace-root traits, where individual loci typically explain a small proportion of phenotypic variation. It should be noted that recurrence between a single-environment scan and the Across BLUP analysis does not constitute independent replication, as the Across analysis includes data from both environments. These suggestive associations should be interpreted as exploratory candidate loci requiring further validation in independent populations.
Table 2.
Exploratory suggestive SNP associations and chromosomal positions for maize brace-root traits.
Figure 4.
Combined Manhattan and QQ plots for maize brace-root RN, TN, and RBR under different environments. Manhattan plots are shown on the left, and the corresponding QQ plots on the right for each trait and environment combination. (A) Manhattan plots for RN in SY, XX, and across-environment analysis, respectively; (B) Manhattan plots for TN in SY, XX, and across-environment analysis, respectively; (C) Manhattan plots for RBR in SY, XX, and across-environment analysis, respectively. Within each trait, the panels follow the order SY, XX, and Across. The black horizontal line denotes the exploratory suggestive threshold of p = 1.0 × 10⁻⁵ (−log10(p) = 5), not a genome-wide corrected significance threshold. The per-scan Bonferroni threshold is p = 8.95 × 10⁻⁸ (−log10(p) = 7.05) and is not drawn in these retained plots. The differently colored dots in Manhattan plots represent SNPs located on different chromosomes. In QQ plots, black dots represent observed −log10(p) values, the red solid line indicates the expected diagonal line, and the grey shaded area shows the 95% confidence band.
Figure 5.
Venn plots of exploratory suggestive SNPs for maize RN, TN, and RBR across the SY, XX, and Across analyses. Note that overlap with the Across analysis does not constitute independent replication, because the Across dataset includes both SY and XX.
The corresponding QQ plots are presented in the same environmental order (SY, XX, and across-environment) for each trait.
In the Manhattan plots, the black horizontal line indicates the exploratory suggestive threshold (p < 1.0 × 10⁻⁵).
3.3. Genetic Overlap of Three Brace-Root Traits
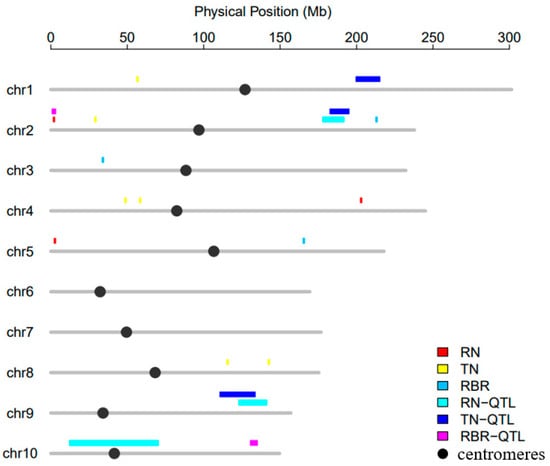
Some QTLs associated with RN, TN, and RBR were identified by previous researchers through QTL localization, which inspired us to further explore whether suggestive SNP identified in this study had overlap with previous studies. The positional information on QTLs for RN, TN, and RBR were downloaded [14]. A co-localization analysis of these QTLs with the significant SNPs identified in this study is shown in Figure 6. Two significant SNPs associated with RN on chromosome 2 overlapped with the QTL qRBR2-1 for RBR, whereas there was no genetic overlap between significantly SNPs and QTLs for the same trait (Figure 6).
Figure 6.
Exploratory co-localization of current-study suggestive SNPs (RN: red squares; TN: yellow diamonds; RBR: cyan squares) and previously mapped QTLs (RN-QTL: teal squares; TN-QTL: blue squares; RBR-QTL: magenta squares) on maize chromosomes 1–10. Centromeres are shown as black circles. Current-study suggestive SNPs are retained for exploratory positional comparison only.
3.4. Descriptive Genotype Effects at Suggestive SNPs
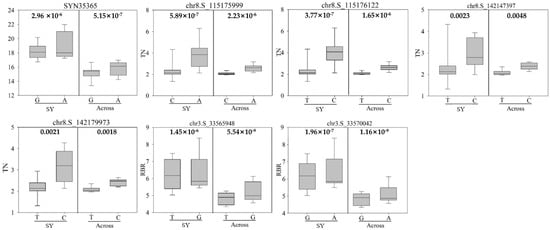
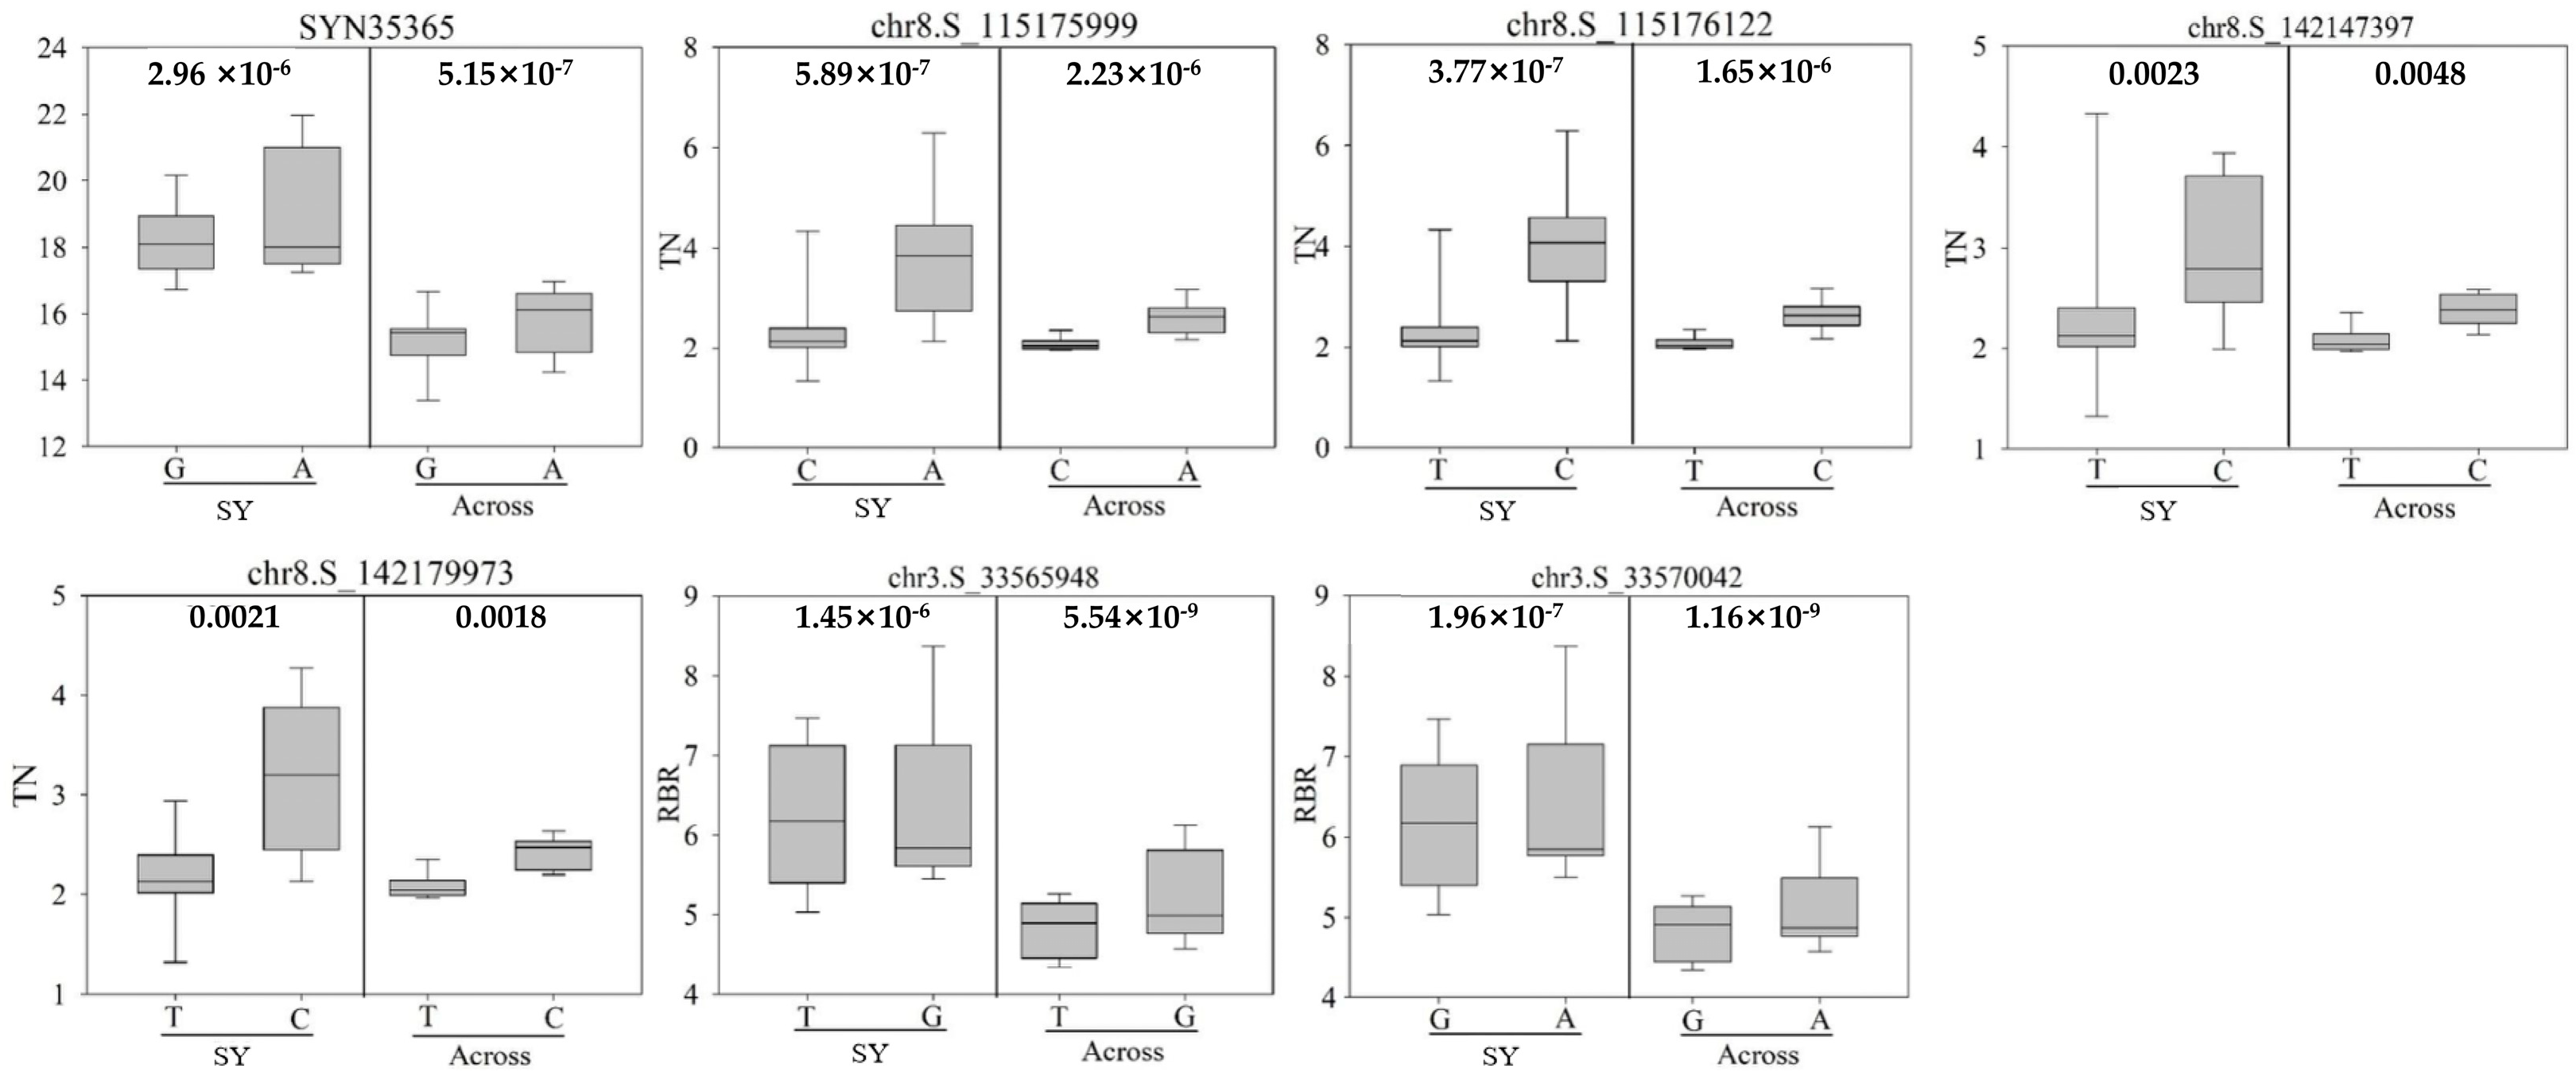
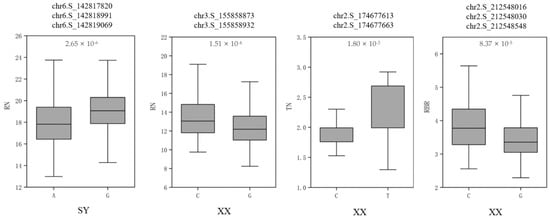
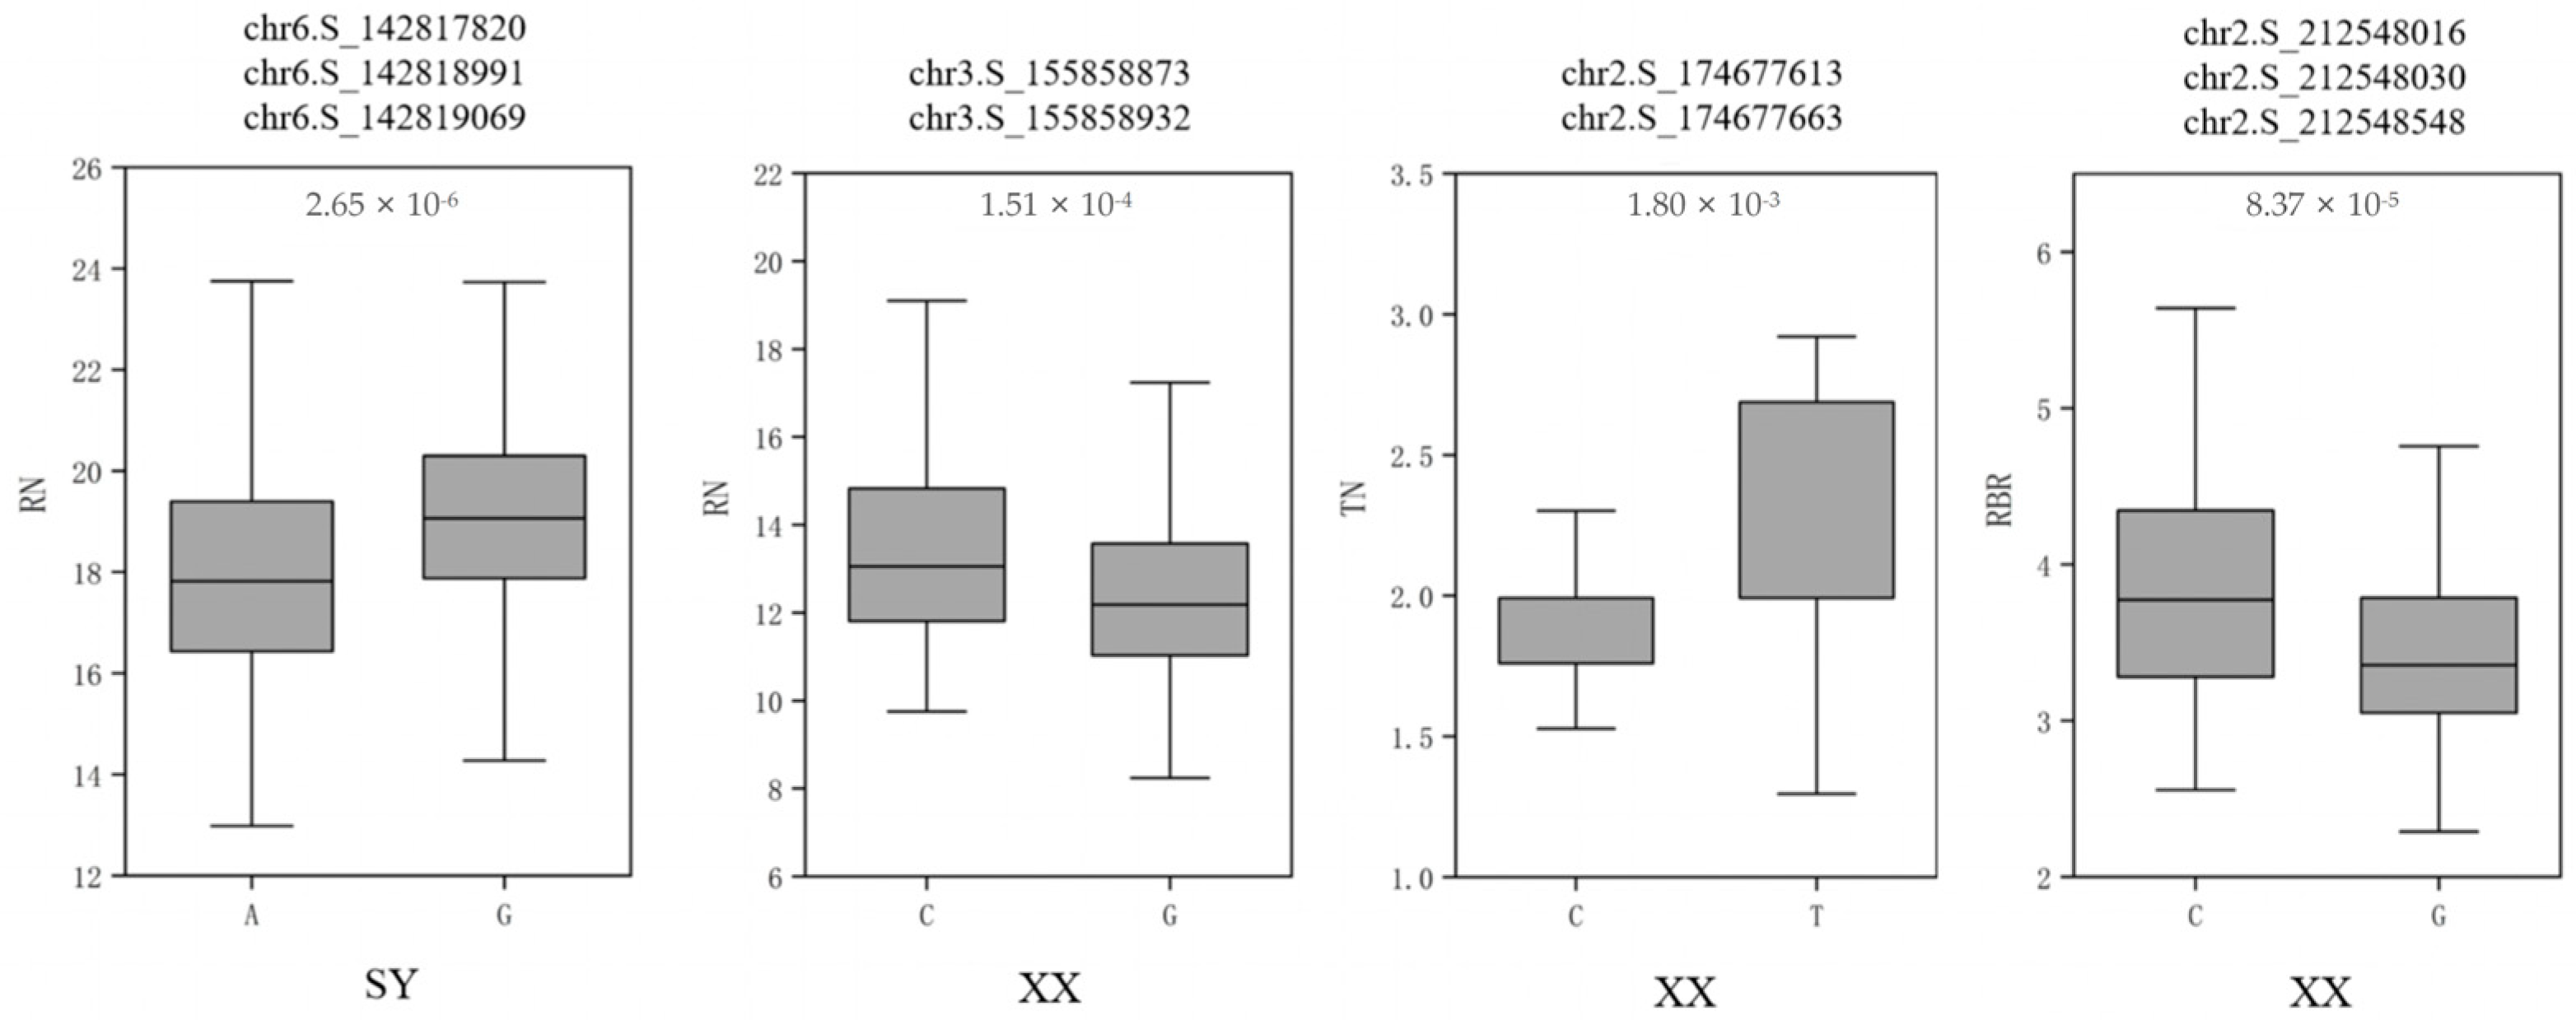
The allele effects of the seven suggestive SNPs recurring between single-environment and across-environment analyses were evaluated using Figure 7. Differences in phenotypic distribution between major and minor alleles were observed for RN, TN, and RBR (Figure 7). Furthermore, four groups of environment-specific nearby suggestive SNPs were also analyzed (Figure 8). The Student’s t-test p values shown are unadjusted for multiple testing and should be interpreted as exploratory.
Figure 7.
Phenotypic distributions by major and minor alleles at seven suggestive SNPs recurring between a single-environment analysis and Across for RN, TN, or RBR. Boxes represent interquartile ranges, the horizontal line inside each box indicates the median, and whiskers extend to the farthest data points within 1.5 × interquartile range. Student’s t-test p values are shown above each panel as exploratory, unadjusted allele-group comparisons in the discovery panel. These SNPs are not Bonferroni- or FDR-significant.
Figure 8.
Boxplots comparing phenotypic distributions between major- and minor-allele carriers at four contiguous environment-specific suggestive SNPs associated with maize brace-root number (RN), tier number (TN), and brace-root circle radius (RBR). Boxes represent interquartile ranges, the horizontal line inside each box indicates the median, and whiskers extend to the farthest data points within 1.5 × interquartile range. The p-values (Student’s t-test) of the allelic effects are exploratory and unadjusted for multiple testing.
3.5. Annotation and Expression Patterns of Positional Candidate Genes
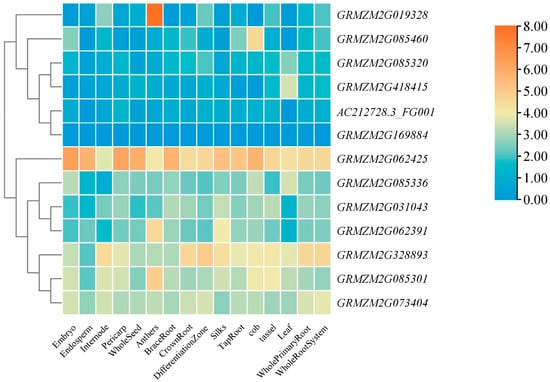
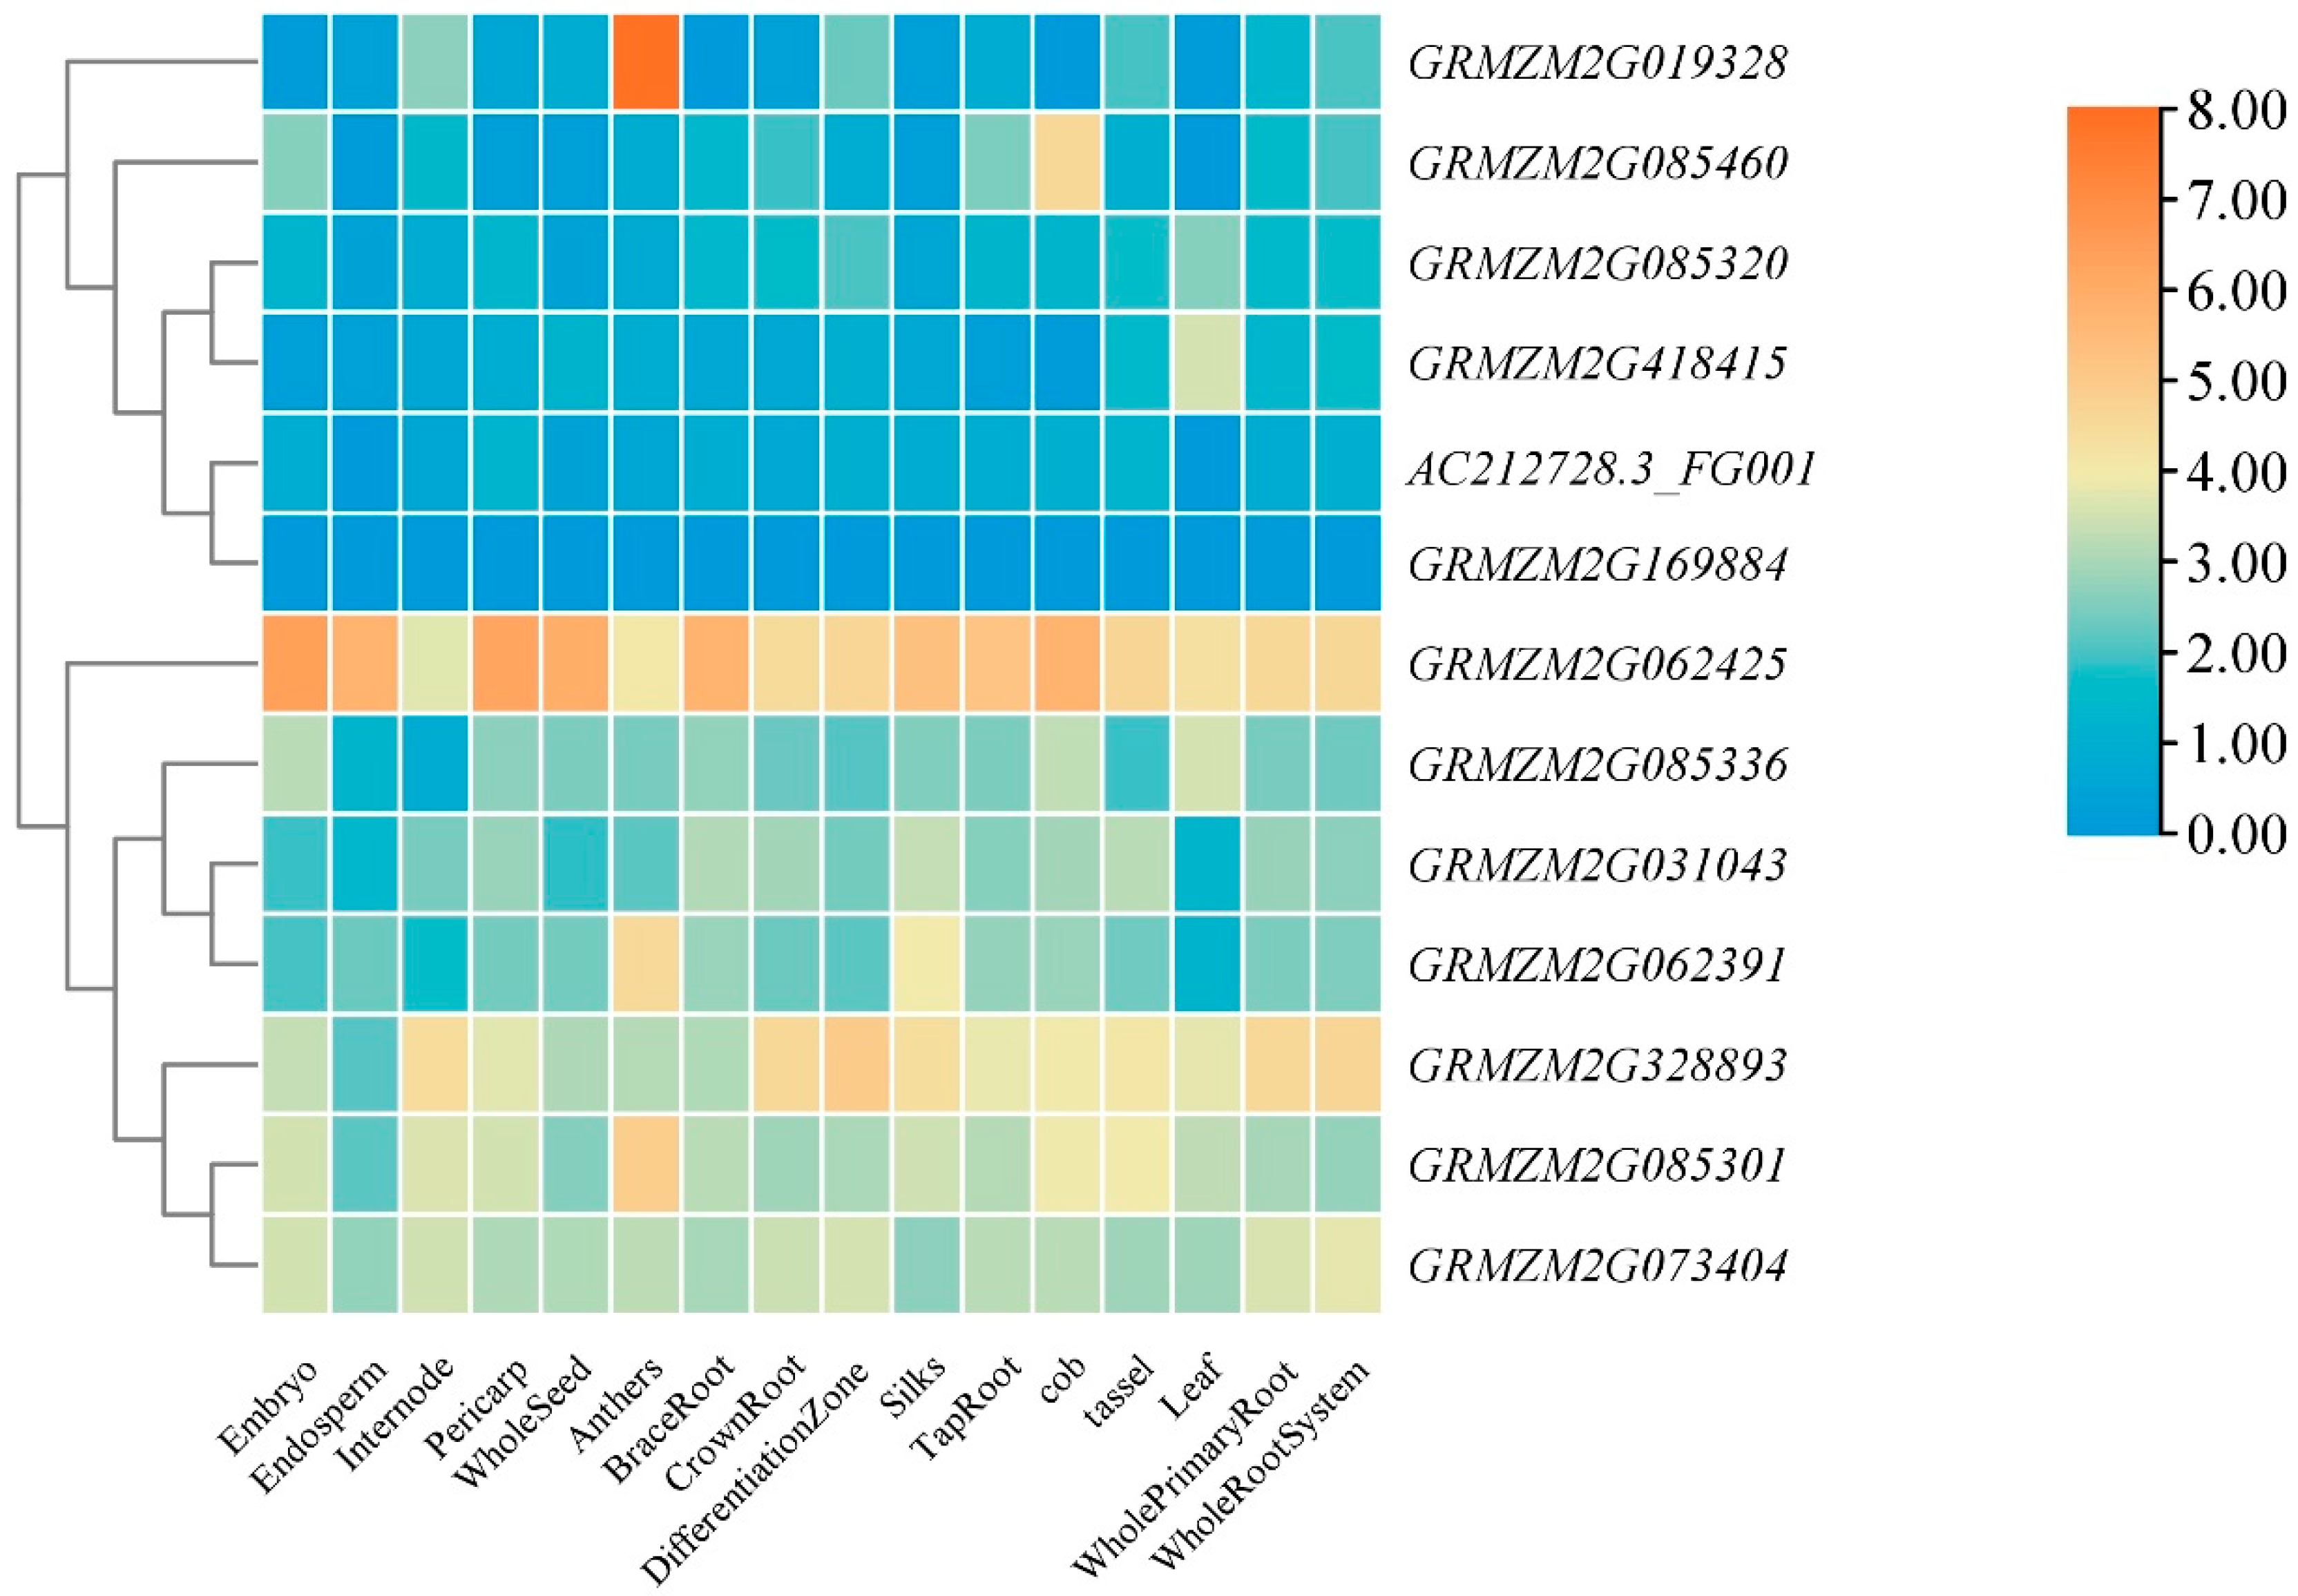
A total of nine genes were found within a 50-kb range upstream and downstream of above seven recurrent suggestive SNPs (Table 3). Of these genes, eight have been functionally annotated. According to the functional annotation, they encode Bowman–Birk protease inhibitors, thioesterase superfamily proteins, the Ypt/Rab-GAP structural domain of gyp1p superfamily proteins, O-acetylserine (thiol) cleavage enzyme B (OASB), and other drought-responsive and defense-functional proteins, respectively. In addition to this, four genes were identified and annotated in environment-specific suggestive contiguous SNPs. According to the functional annotation, GRMZM2G062391 encodes a bZIP-type transcription factor, GRMZM2G062425 encodes an appr-1-p processing enzyme family protein, GRMZM2G169884 encodes a CCAAT-HAP3 transcription factor, and GRMZM2G418415 encodes an α/β-hydrolase superfamily protein. To further assess potential functions of these genes, their expression patterns were analyzed using published RNA-seq datasets from 16 different tissues, including brace roots (Figure 9). Seven genes were expressed in most tissues without tissue specificity. Among them GRMZM2G062425 had significant expression data in 16 different tissues. Among these genes, seven genes were expressed in brace root (Figure 9). These expression patterns were derived from publicly available RNA-seq datasets and provide biological context for the candidate genes; however, they do not constitute statistical evidence of association and should be interpreted as exploratory.
Table 3.
Exploratory positional candidate genes near recurrent and environment-specific suggestive SNPs for maize brace-root traits. Recurrence refers to overlap between a single-environment scan and Across, rather than independent environmental validation.
Figure 9.
Heatmap of expression patterns of candidate genes identified by GWAS in different tissues. The values used in the figure were the log10(n + 1) transformed of normalized TPM values. Columns and rows were ordered according to similarity (hierarchical cluster analysis). Expression profiles provide biological context rather than statistical evidence of association.
4. Discussion
4.1. Summary of Main Results
In this study, an association panel of 508 maize inbred lines was used to systematically phenotype three brace-root traits—tier number (TN), brace-root number (RN), and brace-root circle radius (RBR)—under two environmental conditions. A genome-wide association study (GWAS) was performed using the FarmCPU model. No SNP reached genome-wide significance after Bonferroni correction (p < 8.95 × 10⁻⁸) or Benjamini–Hochberg FDR correction (q < 0.05); we identified suggestive associations at p < 1 × 10⁻⁵, leading to the detection of 11 single nucleotide polymorphisms (SNPs) suggestively associated with TN, 14 SNPs suggestively associated with RN, and 14 SNPs suggestively associated with RBR. Further analysis revealed seven recurrent suggestive SNPs and four groups of SNPs that exhibited strong, environment-specific linkage disequilibrium. Within the LD intervals of these suggestive SNPs, 14 candidate genes were identified and functionally annotated. These suggestive loci represent exploratory candidate associations requiring further validation in independent populations. The loci and candidate genes uncovered here deepen our understanding of the genetic architecture underlying brace-root traits in maize and establish a basis for future functional dissection of the regulatory genes that control brace-root development.
4.2. Variation and Heritability of Brace-Root Traits
As key structural organs in maize, the number, tier count, and spatial distribution of brace roots directly influence lodging resistance [23,24]. The phenotypic variation in brace-root traits observed under two environmental conditions in this study reflects substantial differences in brace-root development among inbred lines, consistent with previous reports that maize root system traits exhibit extensive natural variation [25,26]. The multiple stably inherited loci detected by GWAS—particularly the suggestive SNPs shared between environments—along with the identification of recurrent suggestive SNPs, suggest that brace-root traits are under relatively strong genetic control. Previous studies have reported that the heritability of brace-root tier number in maize ranges from 0.54 to 0.71, while that of brace-root number ranges from 0.48 to 0.68 [27,28]. These values are moderately high and are consistent with the multi-environment stable genetic loci observed in this study. Notably, some SNP loci exhibited environmental specificity, suggesting that genotype-by-environment interaction also plays an important role in brace-root development. This finding aligns with the view that root system developmental plasticity is strongly influenced by environmental conditions [23,29]. The moderate across-environment heritability (0.40–0.63) observed here is typical for complex root traits, which are strongly affected by environmental conditions and G × E interactions (Table 1). In contrast, the single-environment heritability was relatively high (0.69–0.96), indicating strong genetic control under uniform environmental conditions. The low-to-moderate phenotypic correlations (r = 0.30–0.49, p < 0.01) among RN, TN, and RBR further suggest that these traits share some genetic components but also have independent genetic bases. Therefore, separate GWAS for each trait is justified. It should be noted that recurrence between a single-environment scan and the Across BLUP analysis does not constitute independent replication, as the Across analysis includes data from both environments.
4.3. Distribution and Population Specificity of GWAS Suggestive Loci
In this study, the FarmCPU model was employed to separate and iteratively apply the fixed-effect model (FEM) and the random-effect model (REM), thereby completely eliminating the confounding effect between the tested markers and kinship and effectively controlling the interference of population structure and relatedness on GWAS results [19]. Extensive validations using both simulated and real data have confirmed that FarmCPU achieves an optimal balance between false positive control and statistical power, outperforming traditional mixed linear models [30]. Using this model, we identified multiple suggestive SNP associated with brace-root traits in 508 inbred lines. It should be noted that the p-values of the identified SNPs were moderate (−log10(p) = 5.02–6.42), and no SNP reached genome-wide significance after Bonferroni or FDR correction. Several factors may account for this. First, brace-root traits are polygenic quantitative traits, and the effect of each individual locus is relatively small, which is a common feature of GWAS for complex traits in maize [31,32]. Second, stringent control of population structure and kinship by FarmCPU reduces false positives but may also reduce statistical power for individual loci [19]. Third, the moderate population size (508 lines) limits the power to detect small-effect loci. Similar significance levels have been reported in other maize GWAS studies with comparable panel sizes [25,32]. Strict Bonferroni or FDR < 0.05 thresholds can be overly conservative for complex traits and may increase false negatives. A simulation study across maize, soybean, and rice showed that Bonferroni and FDR corrections “may be overly conservative and may lead to an increase in false negatives”, whereas a heritability-based threshold identified more true positive associations [33]. Maize, with its rapid LD decay, required higher thresholds than soybean and rice, suggesting that strict corrections may be particularly problematic for maize GWAS [33]. Similarly, in maize GWAS, multiple comparison adjustments were found to be overly conservative for single-locus mixed models, which failed to identify any significant markers, whereas multilocus methods using less conservative FDR thresholds identified a number of QTLs closer to the simulated true number [30]. Given the polygenic architecture of brace-root traits and the moderate population size, we used p < 1.0 × 10⁻⁵ as a suggestive threshold to retain candidate loci for exploratory interpretation. Importantly, the exploratory reliability of the identified loci is further supported by their consistency with previously reported QTLs (Figure 6) and by the identification of candidate genes with plausible functions in brace-root development (Section 4.4).
Regarding chromosomal distribution, the suggestive loci for TN were mainly located on chromosomes 1, 3, and 5, whereas those for RN and RBR were concentrated on chromosomes 2, 4, and 8. This trait-specific distribution pattern is consistent with previous GWAS findings for root-system architecture traits in maize [32,34]. Notably, three of the seven recurrent suggestive SNP loci identified in this study were located within previously reported QTL regions associated with root development [35], suggesting that these regions may harbor key regulatory genes for brace roots. Further analysis revealed that four groups of SNP loci exhibited high environmental specificity in linkage disequilibrium. This finding is consistent with the report that flowering-time-associated loci in maize show environment-dependent effects [36], indicating that the genetic architecture of brace-root traits may vary dynamically across environments. Regarding differences among subpopulations, although a stratified GWAS was not performed in this study, the 508 inbred lines encompass diverse germplasm types. Thus, differences in allele frequencies among subpopulations may account for the detection of certain loci only in specific environments [37].
4.4. Functional Analysis of Candidate Genes
Within the linkage disequilibrium intervals of suggestive SNPs, 14 candidate genes were identified and functionally annotated. Based on their stability across different environments, these genes could be classified into recurrent and environment-specific types, providing important insights into the genetic regulation of brace-root traits.
Among the recurrent candidate genes, the candidate gene AC212728.3_FG001 located on chromosome 5 encodes a protein containing a Bowman–Birk serine-protease inhibitor domain. Bowman–Birk inhibitors in plants are involved not only in defense responses but also in cell division and developmental regulation [38]. This genomic interval also contains genes encoding an major facilitator superfamily (MFS) transporter transporter, a thioesterase superfamily protein, and a nucleobase-ascorbate transporter, suggesting that this region may coordinately influence brace-root development through substance transport and metabolic regulation. GRMZM2G073404 on chromosome 8 encodes sumov1, a small ubiquitin-related modifier, which participates in protein post-translational modification and plays important roles in plant stress responses and developmental regulation [39]. GRMZM2G031043 on chromosome 3 encodes a Ypt/Rab-GAP domain protein, which is involved in the regulation of vesicle transport and may affect cell-wall material transport and brace-root primordium initiation [40]. Another candidate gene on chromosome 3, GRMZM2G328893, encodes O-acetylserine (thiol) lyase B (OASB), a key enzyme in cysteine synthesis and sulfur metabolism that is closely associated with root development and stress adaptation [41].
Among the environment-specific candidate genes, GRMZM2G418415 on chromosome 2 and GRMZM2G169884 on chromosome 3 both encode α/β-hydrolase superfamily proteins. Members of the α/β-hydrolase family are widely involved in the metabolism and signaling of plant hormones such as auxin and brassinosteroids [42], suggesting that these environment-specific loci may regulate the response of brace roots to environmental changes via hormone pathways. GRMZM2G117357 on chromosome 6 encodes the peroxisomal fatty acid β-oxidation multifunctional protein multifunctional protein 2 (MFP2), which is involved in fatty acid degradation and the synthesis of signaling molecules such as jasmonic acid [43]; the jasmonic acid signaling pathway is known to play a regulatory role in adventitious root formation [44]. GRMZM2G111204 on chromosome 2 encodes alpha-glucosidase 2, which is involved in carbohydrate metabolism and may function in energy supply during brace-root development [45].
In summary, the candidate genes identified in this study cover multiple functional categories, including protease inhibition, post-translational modification, vesicle transport, sulfur metabolism, hormone signaling, fatty-acid metabolism, and carbohydrate metabolism. Among them, recurrent genes may serve as core regulatory components of brace-root development, whereas environment-specific genes may mediate the adaptive regulation of brace roots to environmental conditions. These genes provide new entry points for dissecting the molecular regulatory network of brace-root development and offer potential targets for improving maize lodging resistance through genetic engineering. It should be noted that the candidate genes identified in this study were predicted based on suggestive GWAS signals, linkage disequilibrium intervals, and functional annotation, and their expression in brace roots was supported by publicly available RNA-seq data (Figure 9). However, direct experimental validation, such as quantitative reverse transcription PCR (qRT-PCR) and transgenic approaches, was not performed in the current study. Therefore, the functions of these candidate genes in brace-root development should be interpreted with caution as exploratory hypotheses and require further validation in future studies.
4.5. Significance and Prospects
This study systematically dissected the genetic basis of three key brace-root traits in maize, namely the number of brace-root tiers (TN), the number of brace roots (RN), and the radius of the brace-root circle (RBR). By employing the FarmCPU model combined with phenotypic data from two environments, we identified multiple suggestive SNP loci and screened 14 candidate genes. Our findings not only enrich the molecular regulatory network of root-system development in maize but also provide important genetic resources for improving maize lodging resistance through marker-assisted selection. From the perspective of breeding application, the close association between brace-root traits and lodging resistance has been confirmed in several studies [46,47]; therefore, the suggestive genetic loci identified in this study may hold exploratory potential for breeding applications. Nevertheless, this study has certain limitations. On the one hand, due to the population structure and the distance of linkage disequilibrium decay, some candidate gene intervals are relatively large, necessitating further functional validation via fine mapping or gene-editing approaches. On the other hand, this study only included phenotypic data from two environments, making it difficult to comprehensively assess the complexity of genotype-by-environment interactions [48]. In addition, the candidate genes identified here require further experimental validation, including qRT-PCR to confirm their expression in brace roots and transgenic or gene-editing approaches to verify their functions. These experiments will be carried out in our future work. In the future, integrating multi-omics data such as transcriptomics and metabolomics, dissecting the molecular regulatory mechanisms of key genes, and conducting multi-year, multi-location phenotypic evaluations will help elucidate the genetic regulatory network underlying brace-root traits and provide more precise molecular targets for lodging resistance breeding in maize.
Author Contributions
M.A. and Y.R. initiated and designed the overall study. A.Z., S.J., X.K. and Y.Z. performed and coordinated the field experiments and phenotypic data collection. M.L. carried out the data analysis. H.Z. interpreted the results and wrote the manuscript. All authors contributed to manuscript editing. All authors have read and agreed to the published version of the manuscript.
Funding
The authors declare that financial support was received for the research and/or publication of this article. This work was supported by the National Natural Science Foundation of China (31801442), the Major Special Subproject of the Liaoning Provincial Department of Science and Technology (2024JH1/11700007-3), the Liaoning Province Germplasm Innovation Grain Storage Special Program (2023JH1/10200009, 2023JH1/1020000903), and the Shenyang Key Laboratory for Genome Selection Breeding of Maize.
Data Availability Statement
The genotyping dataset used in this study is available from MaizeGO Resources (accessed on 15 February 2026). All other data supporting the findings of this study are available within the article.
Conflicts of Interest
The authors declare no conflicts of interest.
Abbreviations
| RN | brace-root number |
| TN | brace-root tier number |
| RBR | brace-root circle radius |
| SS | stiff stalk |
| NSS | non-stiff stalk |
| TST | tropical–subtropical |
| GWAS | genome-wide association study |
| BLUP | the best linear unbiased prediction |
| SNP | single nucleotide polymorphism |
| QTL | quantitative trait locus |
| SY | Shenyang |
| XX | Xinxiang |
References
- Zhang, G.; Cui, C.; Lv, Y.; Wang, X.; Wang, X.; Zhao, D.; Hu, F.; Wen, X.; Han, J.; Liao, Y. Is it necessary to increase the maize planting density in China? Eur. J. Agron. 2024, 159, 127235. [Google Scholar] [CrossRef] [Scilit]
- Tabaracci, K.; Bokros, N.T.; Oduntan, Y.; Kunduru, B.; DeKold, J.; Mengistie, E.; McDonald, A.; Stubbs, C.J.; Sekhon, R.S.; DeBolt, S.; et al. Biomechanical phenotyping pipeline for stalk lodging resistance in maize. MethodsX 2024, 12, 102562. [Google Scholar] [CrossRef] [Scilit] [PubMed]
- Maqbool, S.; Hassan, M.A.; Xia, X.; York, L.M.; Rasheed, A.; He, Z. Root system architecture in cereals: Progress, challenges and perspective. Plant J. 2022, 110, 23–42. [Google Scholar] [CrossRef] [Scilit] [PubMed]
- Hostetler, A.N.; Erndwein, L.; Reneau, J.W.; Stager, A.; Tanner, H.G.; Cook, D.; Sparks, E.E. Multiple brace root phenotypes promote anchorage and limit root lodging in maize. Plant Cell Environ. 2022, 45, 1573–1583. [Google Scholar] [CrossRef] [Scilit] [PubMed]
- Guingo, E.; Hebert, Y.; Charcosset, A. Genetic analysis of root traits in maize. Agronomie 1998, 18, 225–235. [Google Scholar] [CrossRef] [Scilit]
- Pellerin, S.; Trendel, R.; Duparque, A.; Blatz, A.; Petit, B. Relation entre quelques caracteres morphologiques et la sensibilite a la verse en vegetation du mais (Zea mays L.). Agronomie 1990, 10, 439–446. [Google Scholar] [CrossRef] [Scilit]
- Zhu, J.; Kaeppler, S.M.; Lynch, J.P. Mapping of QTLs for lateral root branching and length in maize (Zea mays L.) under differential phosphorus supply. Theor. Appl. Genet. 2005, 111, 688–695. [Google Scholar] [CrossRef] [Scilit] [PubMed]
- Zhang, A.; Cui, Z.; Li, C.; Luo, J.; Guan, Y.; Liu, L.; Zhang, Z.; Zhang, L.; He, Y.; Ruan, Y.; et al. Identification of maize brace-root quantitative trait loci in a recombinant inbred line population. Euphytica 2018, 214, 168. [Google Scholar] [CrossRef] [Scilit]
- Ku, L.X.; Sun, Z.H.; Wang, C.L.; Zhang, J.; Zhao, R.F.; Liu, H.Y.; Tai, G.Q.; Chen, Y.H. QTL mapping and epistasis analysis of brace root traits in maize. Mol. Breed. 2012, 30, 697–708. [Google Scholar] [CrossRef] [Scilit]
- Liu, M.; Zhang, M.; Yu, S.; Li, X.; Zhang, A.; Cui, Z.; Dong, X.; Fan, J.; Zhang, L.; Li, C.; et al. A genome-wide association study dissects the genetic architecture of the metaxylem vessel number in maize brace roots. Front. Plant Sci. 2022, 13, 847234. [Google Scholar] [CrossRef] [Scilit] [PubMed]
- Yang, X.; Gao, S.; Xu, S.; Zhang, Z.; Prasanna, B.M.; Li, L.; Li, J.; Yan, J. Characterization of a global germplasm collection and its potential utilization for analysis of complex quantitative traits in maize. Mol. Breed. 2011, 28, 511–526. [Google Scholar] [CrossRef] [Scilit]
- Jiang, S.; Zhang, H.; Ni, P.; Yu, S.; Dong, H.; Zhang, A.; Cao, H.; Zhang, L.; Ruan, Y.; Cui, Z. Genome-wide association study dissects the genetic architecture of maize husk tightness. Front. Plant Sci. 2020, 11, 861. [Google Scholar] [CrossRef] [Scilit] [PubMed]
- Faria, M.V.; Mendes, M.C.; Rossi, E.S.; Possatto Junior, O.; Rizzardi, D.A.; Gralak, E.; Silva, C.A.; Faria, C.M.D.R. Analise dialelica da produtividade e do progresso da severidade de doencas foliares em hibridos de milho em duas densidades populacionais. Semin. Cienc. Agrar. 2015, 36, 123–134. [Google Scholar] [CrossRef] [Scilit]
- Hostetler, A.N.; Erndwein, L.; Ganji, E.; Reneau, J.W.; Killian, M.L. Maize brace root mechanics vary by whorl, genotype and reproductive stage. Ann. Bot. 2022, 129, 657–668. [Google Scholar] [CrossRef] [Scilit] [PubMed]
- Alvarado, G.; Rodriguez, F.M.; Pacheco, A.; Burgueno, J.; Crossa, J.; Vargas, M.; Pérez-Rodríguez, P.; Lopez-Cruz, M.A. META-R: A software to analyze data from multi-environment plant breeding trials. Crop J. 2020, 8, 745–756. [Google Scholar] [CrossRef] [Scilit]
- Carena, M.J.; Hallauer, A.R.; Miranda Filho, J.B. Quantitative Genetics in Maize Breeding; Springer: New York, NY, USA, 2010. [Google Scholar] [CrossRef] [Scilit]
- Li, H.; Peng, Z.; Yang, X.; Wang, W.; Fu, J.; Wang, J.; Han, Y.; Chai, Y.; Guo, T.; Yang, N.; et al. Genome-wide association study dissects the genetic architecture of oil biosynthesis in maize kernels. Nat. Genet. 2013, 45, 43–50. [Google Scholar] [CrossRef] [Scilit] [PubMed]
- Yang, N.; Lu, Y.; Yang, X.; Huang, J.; Zhou, Y.; Ali, F.; Wen, W.; Liu, J.; Li, J.; Yan, J. Genome-wide association studies using a new nonparametric model reveal the genetic architecture of 17 agronomic traits in an enlarged maize association panel. PLoS Genet. 2014, 10, e1004573. [Google Scholar] [CrossRef] [Scilit] [PubMed]
- Liu, X.; Huang, M.; Fan, B.; Buckler, E.S.; Zhang, Z. Iterative usage of fixed and random effect models for powerful and efficient genome-wide association studies. PLoS Genet. 2016, 12, e1005767, Correction in PLoS Genet. 2016, 12, e1005957. [Google Scholar] [CrossRef] [Scilit] [PubMed]
- Cui, Z.H.; Luo, J.H.; Qi, C.Y.; Ruan, Y.Y.; Li, J.; Zhang, A.; Yang, X.; He, Y. Genome-wide association study (GWAS) reveals the genetic architecture of four husk traits in maize. BMC Genom. 2016, 17, 946. [Google Scholar] [CrossRef] [Scilit] [PubMed]
- Benjamini, Y.; Hochberg, Y. Controlling the false discovery rate: A practical and powerful approach to multiple testing. J. R. Stat. Soc. Ser. B (Methodol.) 1995, 57, 289–300. [Google Scholar] [CrossRef] [Scilit]
- Cui, Z.H.; Dong, H.X.; Zhang, A.; Ruan, Y.Y.; Jiang, S.; He, Y.; Zhang, Z. Denser markers and advanced statistical method identified more genetic loci associated with husk traits in maize. Sci. Rep. 2020, 10, 8165. [Google Scholar] [CrossRef] [Scilit] [PubMed]
- Hochholdinger, F.; Yu, P.; Marcon, C. Genetic control of root system development in maize. Trends Plant Sci. 2018, 23, 79–88. [Google Scholar] [CrossRef] [Scilit] [PubMed]
- Hostetler, A.N.; Khangura, R.S.; Dilkes, B.P.; Sparks, E.E. Bracing for sustainable agriculture: The development and function of brace roots in members of Poaceae. Curr. Opin. Plant Biol. 2021, 59, 101985. [Google Scholar] [CrossRef] [Scilit] [PubMed]
- Pace, J.; Gardner, C.; Romay, C.; Ganapathysubramanian, B.; Lubberstedt, T. Genome-wide association analysis of seedling root development in maize (Zea mays L.). BMC Genom. 2015, 16, 47. [Google Scholar] [CrossRef] [Scilit] [PubMed]
- Rogers, E.D.; Benfey, P.N. Regulation of plant root system architecture: Implications for crop advancement. Curr. Opin. Biotechnol. 2015, 32, 93–98. [Google Scholar] [CrossRef] [Scilit] [PubMed]
- Gu, D.; Mei, X.; Yu, T.; Sun, N.; Xu, D.; Liu, C.; Cai, Y. QTL identification for brace-root traits of maize in different generations and environments. Crop Sci. 2017, 57, 13–21. [Google Scholar] [CrossRef] [Scilit]
- Lin, S.; Xu, X.; Fan, Z.; Jiang, J.; Zeng, Y.; Meng, Y.; Ren, J.; Wu, P. Genome-wide association study and genomic selection of brace root traits related to lodging resistance in maize. Sci. Rep. 2024, 14, 31898. [Google Scholar] [CrossRef] [Scilit] [PubMed]
- Uga, Y.; Kitomi, Y.; Ishikawa, S.; Yano, M. Genetic improvement for root growth angle to enhance crop production. Breed. Sci. 2015, 65, 111–119. [Google Scholar] [CrossRef] [Scilit] [PubMed]
- Kaler, A.S.; Gillman, J.D.; Beissinger, T.; Purcell, L.C. Comparing different statistical models and multiple testing corrections for association mapping in soybean and maize. Front. Plant Sci. 2020, 10, 1794. [Google Scholar] [CrossRef] [Scilit] [PubMed]
- Hirschhorn, J.N. Genomewide association studies-Illuminating biologic pathways. N. Engl. J. Med. 2009, 360, 1699–1701. [Google Scholar] [CrossRef] [Scilit] [PubMed]
- Buckler, E.S.; Holland, J.B.; Bradbury, P.J.; Acharya, C.B.; Brown, P.J.; Browne, C.; Ersoz, E.; Flint-Garcia, S.; Garcia, A.; Glaubitz, J.C.; et al. The genetic architecture of maize flowering time. Science 2009, 325, 714–718. [Google Scholar] [CrossRef] [Scilit] [PubMed]
- Kaler, A.S.; Purcell, L.C. Estimation of a significance threshold for genome-wide association studies. BMC Genom. 2019, 20, 618. [Google Scholar] [CrossRef] [Scilit] [PubMed]
- Wu, B.; Ren, W.; Zhao, L.; Li, Q.; Sun, J.; Chen, F.; Pan, Q. Genome-wide association study of root system architecture in maize. Genes 2022, 13, 181. [Google Scholar] [CrossRef] [Scilit] [PubMed]
- Karnatam, K.S.; Chhabra, G.; Saini, D.K.; Singh, R.; Kaur, G.; Praba, U.P.; Kumar, P.; Goyal, S.; Sharma, P.; Ranjan, R.; et al. Genome-wide meta-analysis of QTLs associated with root traits and implications for maize breeding. Int. J. Mol. Sci. 2023, 24, 6135. [Google Scholar] [CrossRef] [Scilit] [PubMed]
- Jin, M.; Liu, H.; Liu, X.; Guo, T.; Guo, J.; Yin, Y.; Ji, Y.; Li, Z.; Zhang, J.; Wang, X.; et al. Complex genetic architecture underlying the plasticity of maize agronomic traits. Plant Commun. 2023, 4, 100473. [Google Scholar] [CrossRef] [Scilit] [PubMed]
- Wang, H.; Wei, J.; Li, P.; Wang, Y.; Ge, Z.; Qian, J.; Fan, Y.; Ni, J.; Xu, Y.; Yang, Z.; et al. Integrating GWAS and gene expression analysis identifies candidate genes for root morphology traits in maize at the seedling stage. Genes 2019, 10, 773. [Google Scholar] [CrossRef] [Scilit] [PubMed]
- Grosse-Holz, F.M.; van der Hoorn, R.A.L. Juggling jobs: Roles and mechanisms of multifunctional protease inhibitors in plants. New Phytol. 2016, 210, 794–807. [Google Scholar] [CrossRef] [Scilit] [PubMed]
- Miura, K.; Hasegawa, P.M. Sumoylation and other ubiquitin-like post-translational modifications in plants. Trends Cell Biol. 2010, 20, 223–232. [Google Scholar] [CrossRef] [Scilit] [PubMed]
- Ebine, K.; Ueda, T. Roles of membrane trafficking in plant cell wall dynamics. Front. Plant Sci. 2015, 6, 878. [Google Scholar] [CrossRef] [Scilit] [PubMed]
- Takahashi, H.; Kopriva, S.; Giordano, M.; Saito, K.; Hell, R. Sulfur assimilation in photosynthetic organisms: Molecular functions and regulations of transporters and assimilatory enzymes. Annu. Rev. Plant Biol. 2011, 62, 157–184. [Google Scholar] [CrossRef] [Scilit] [PubMed]
- Mindrebo, J.T.; Nartey, C.M.; Seto, Y.; Burkart, M.D.; Noel, J.P. Unveiling the functional diversity of the alpha/beta hydrolase superfamily in the plant kingdom. Curr. Opin. Struct. Biol. 2016, 41, 233–246, Correction in Curr. Opin. Struct. Biol. 2016, 41, 256–257. [Google Scholar] [CrossRef] [Scilit] [PubMed]
- Pan, R.; Liu, J.; Wang, S.; Hu, J. Peroxisomes: Versatile organelles with diverse roles in plants. New Phytol. 2020, 225, 1410–1427. [Google Scholar] [CrossRef] [Scilit] [PubMed]
- Gutierrez, L.; Mongelard, G.; Flokova, K.; Pacurar, D.I.; Novak, O.; Staswick, P.; Kowalczyk, M.; Păcurar, M.; Demailly, H.; Geiss, G.; et al. Auxin controls Arabidopsis adventitious root initiation by regulating jasmonic acid homeostasis. Plant Cell 2012, 24, 2515–2527. [Google Scholar] [CrossRef] [Scilit] [PubMed]
- Frandsen, T.P.; Svensson, B. Plant alpha-glucosidases of the glycoside hydrolase family 31: Molecular properties, substrate specificity, reaction mechanism, and comparison with family members of different origin. Plant Mol. Biol. 1998, 37, 1–13. [Google Scholar] [CrossRef] [Scilit] [PubMed]
- Reneau, J.W.; Khangura, R.S.; Stager, A.; Erndwein, L.; Weldekidan, T.; Cook, D.D.; Dilkes, B.P.; Sparks, E.E. Maize brace roots provide stalk anchorage. Plant Direct 2020, 4, e00284. [Google Scholar] [CrossRef] [Scilit] [PubMed]
- Robertson, D.J.; Julias, M.; Lee, S.Y.; Cook, D.D. Maize stalk lodging: Morphological determinants of stalk strength. Crop Sci. 2017, 57, 926–934. [Google Scholar] [CrossRef] [Scilit]
- Kusmec, A.; Srinivasan, S.; Nettleton, D.; Schnable, P.S. Distinct genetic architectures for phenotype means and plasticities in Zea mays. Nat. Plants 2017, 3, 715–723. [Google Scholar] [CrossRef] [Scilit] [PubMed]

Disclaimer/Publisher’s Note: The statements, opinions and data contained in all publications are solely those of the individual author(s) and contributor(s) and not of MDPI and/or the editor(s). MDPI and/or the editor(s) disclaim responsibility for any injury to people or property resulting from any ideas, methods, instructions or products referred to in the content. |
© 2026 by the authors. Licensee MDPI, Basel, Switzerland. This article is an open access article distributed under the terms and conditions of the Creative Commons Attribution (CC BY) license.