


Abstract
Maize–mustard rotation dominates sloping purple farmland in the Three Gorges Reservoir Area, where nitrogen (N) and phosphorus (P) losses jointly threaten reservoir water quality. This paper presents the P component of a combined N–P study and shares the same in situ runoff-plot platform as its parallel N migration study. A two-year in situ runoff-plot campaign at the National Purple Soil Fertility and Fertilizer Efficiency Monitoring Base quantified 0–60 cm soil P migration patterns across four rainfall regimes (TR, HR, MR, LR) and four growth stages (CPS, SFS, MPS, WFS). Results showed that rainfall runoff drove P migration both horizontally and vertically. TR and HR events, which accounted for only 6.05% of rainfall events, produced 73.26% of annual surface P loss (1.076 kg ha−1 yr−1) and 58.85% of annual subsurface leaching (0.440 kg ha−1 yr−1); over 78% of the total P load occurred during the maize planting stage. Soil depth dominated transport attenuation: PP fell from 93.42% at the surface (L0) to 52.57% at 40–60 cm (L3), and the 20–60 cm subsoil produced a net reduction of 83.33% in downward P flux leached from the topsoil, lowering the risk of P migration to deeper layers. Combined with the companion N study, both elements share extreme-rainfall drivers and the maize-stage critical loss window but diverge vertically: nitrate N shows stronger deep mobility, while the subsoil buffers P as a stable sink. This coupled N–P evidence supports site-specific control of agricultural non-point source pollution.
1. Introduction
Diffuse phosphorus loss from agricultural non-point sources (ANPS) represents a primary driver of eutrophication in adjacent aquatic ecosystems, triggering harmful cyanobacterial blooms; this process has emerged as a critical and pervasive threat to the ecological security of agricultural water environments [1,2]. As an essential macronutrient for crop growth, global agricultural phosphorus inputs have increased tenfold over the past 50 years to meet rising food demands [3]. However, in most agricultural systems, phosphorus application far exceeds crop requirements. Globally, plants absorb only 12.6% of inorganic phosphorus fertilizers [4]. In China, the average phosphorus fertilizer application rate is 71.4 kg/ha, nearly three times the global average, while the comprehensive fertilizer use efficiency in major cereal crops is only 43.3% [5]. Agricultural soils lose 40–60% of excess phosphorus via surface and subsurface runoff [6]. Eutrophication occurs in downstream water bodies when phosphorus lost through runoff accumulates to a critical threshold [7].
Purple soil is a representative cultivated soil in the hilly regions of southwestern China, and in the WRB 2022 system it generally falls within the Reference Soil Groups of Cambisol or Regosol. The soil in this study contains a well-developed cambic horizon and is accordingly classified as a Cambisol following the official WRB 2022 classification criteria [8]. It is mainly distributed in the Three Gorges Reservoir Area (TGRA), where over 60% of the cultivated land is purple-soil sloped land [9]. Derived from purple parent rock through rapid weathering, purple soil has a loose structure, high porosity, strong permeability, and low erosion resistance. Coupled with concentrated rainfall and intensive farming practices, its nutrients pose a significantly higher risk of vertical migration than those in other agricultural soils. Monitoring data indicate that annual fertilizer loss in the purple soil zone of the TGRA reaches 1.06 × 10⁴ t, accounting for 8.9% of regional fertilizer consumption [10]. Nitrogen and phosphorus losses represent 34.5% and 6.4% of applied fertilizer, respectively, while their leaching losses account for 34.3% and 5.1% [11]. Agricultural phosphorus loss has become a key problem for water quality and sustainable agricultural development in the region.
Phosphorus migration in soil is a complex biogeochemical process that involves profile accumulation, adsorption–desorption dynamics, and hydrological transport. Hydrological transport and biogeochemical supply processes co-regulate agricultural phosphorus migration [12,13]. It is widely confirmed that only ~30% of applied phosphorus fertilizer is taken up by crop roots, while the remainder is either retained in soil pools or exported via surface and subsurface runoff: particulate phosphorus (PP) is mainly transported by eroded sediments in surface runoff, while dissolved phosphorus dominates phosphorus migration in subsurface flow and soil leachate [14,15,16]. Most studies focus only on surface phosphorus loss resulting from sediment transport and treat topsoil erosion as the primary pathway of soil phosphorus loss [17,18,19]. As a result, long-term in situ observations of soil phosphorus stratification and its regulatory mechanisms across different rainfall intensities remain critically lacking [20], which hinders precise mechanistic elucidation and targeted management of phosphorus loss from purple soil sloping farmlands.
To fill this research gap, a two-year in situ field monitoring campaign was conducted at the National Purple Soil Fertility and Fertilizer Efficiency Monitoring Base, with three interlinked objectives: (1) clarifying the interactive effects of soil depth and rainfall events on vertical phosphorus migration; (2) characterizing vertical phosphorus loss dynamics under different rainfall patterns; (3) identifying phosphorus migration patterns across all crop growth stages. This work provides critical support for understanding layered phosphorus transport in purple sloping farmland, revealing local phosphorus cycling mechanisms and optimizing site-specific field management strategies. Beyond these independent values, the present study is deliberately designed as a direct companion to a parallel nitrogen migration paper from the same research group [21].
Both studies share the identical experimental platform, runoff-plot infrastructure, consecutive 2023–2025 monitoring period, unified rainfall classification (TR, HR, MR and LR), crop growth stage classification (CPS, SFS, MPS and WFS), and 0–60 cm soil sampling protocol. The companion paper quantifies vertical soil nitrogen migration under the same maize–mustard rotation, while the present study focuses on phosphorus processes. Because N and P losses are driven by identical rainfall–runoff processes and coupled via crop nutrient stoichiometry, the two datasets cannot be interpreted in isolation; together, they constitute a complete coupled N-P migration system. We do not repeat the methods here; readers are referred to [21], and we present the cross-referenced N-P coupled analysis in Section 4.4 and the Conclusions. This paired design enables a holistic assessment of maize and mustard N-P coupled nutrition dynamics, which single-element studies cannot achieve. Prior work on this platform quantified profile-scale N and P migration but did not resolve rainfall-depth and soil-layer effects on P transport. This study first systematically quantifies stratified vertical P migration loads at this site and explicitly disentangles their interaction using a well-specified linear mixed-effects model, filling this key data gap.
2. Materials and Methods
2.1. Study Site
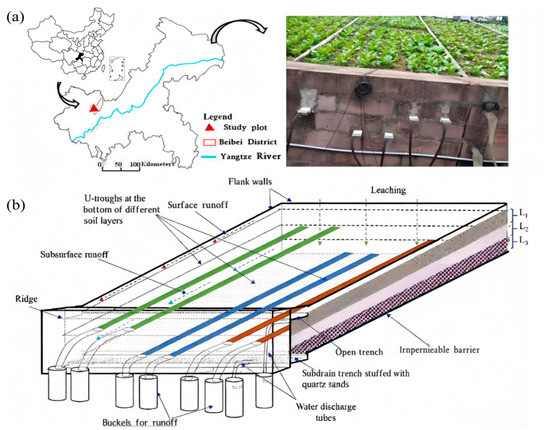
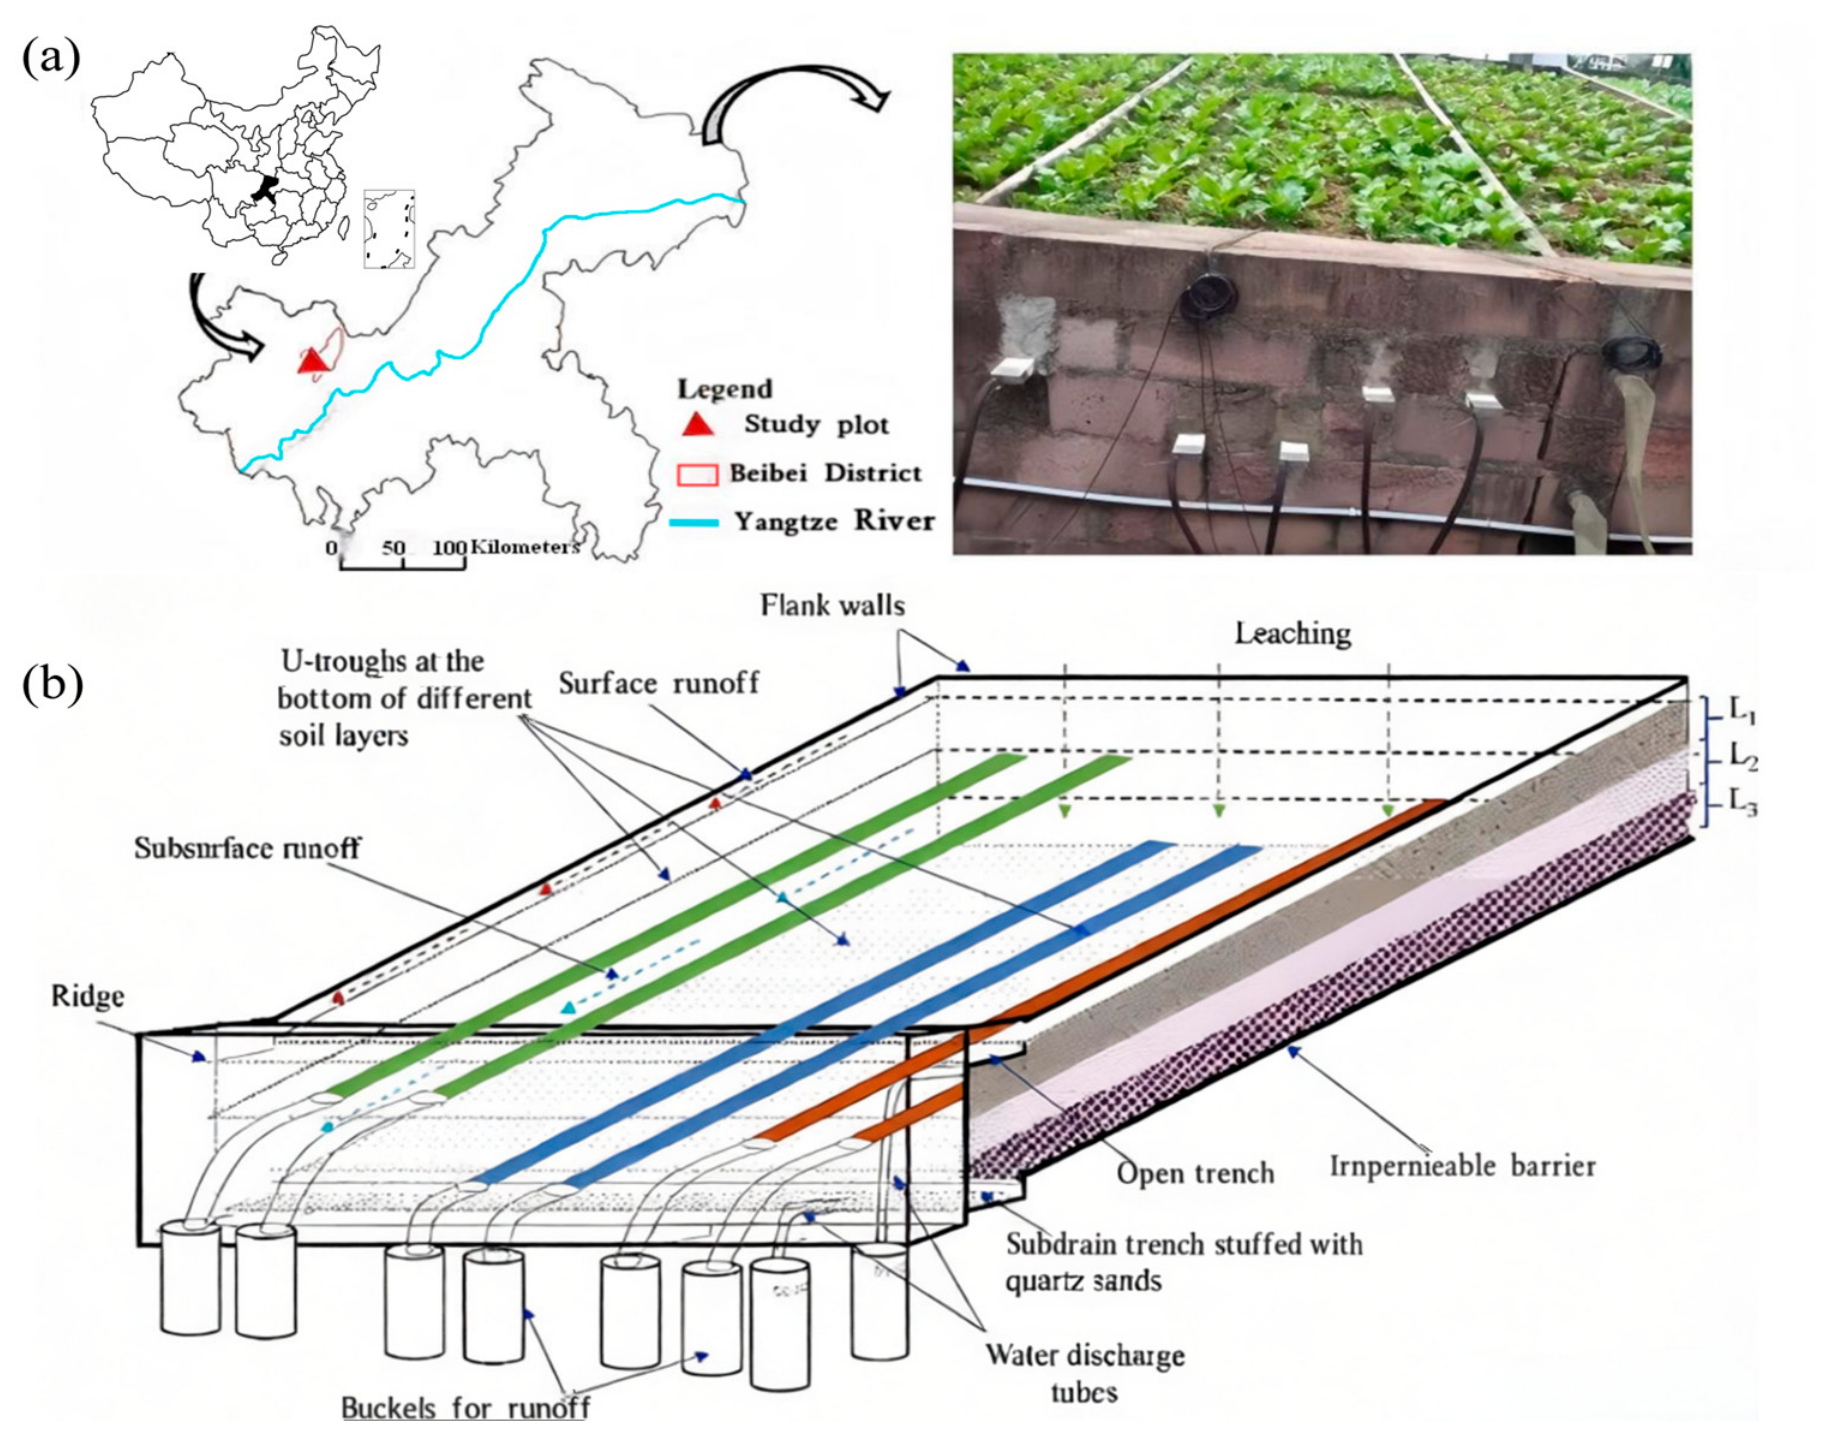
The study site is situated at the National Monitoring Base for Purple Soil Fertility and Fertilizer Efficiency (29°48′38″ N, 106°24′40.6″ E) in Beibei District, Chongqing, China, at an elevation of 240–255 m (Figure 1a). This region has a typical subtropical humid climate, with a mean annual temperature of 18.3 °C and a mean annual precipitation of 1105.4 mm. Over 70% of total annual rainfall occurs from May to October, coinciding with the hot growing season. Hilly, sloped farmland dominates the landscape. The predominant soil type is purple soil, which is relatively shallow (30–80 cm in depth) and underlain by low-permeability bedrock.
Figure 1.
Geographic location of the study site and schematic layout of the experimental runoff plots: (a) location of the study area; (b) structural schematic of the runoff field [21]. Notes: L1, L2, and L3 correspond to the 0–20 cm, 20–40 cm, and 40–60 cm soil layers, respectively. The red dashed arrow marks the primary direction of surface runoff; the blue and green dashed arrows indicate downslope subsurface flow and vertical infiltration in the soil profile, respectively. The solid black arrows indicate site structure objects.
2.2. Experimental Design
We established three runoff plots with identical geographic location and slope aspect as experimental replicates. Each plot was 3 m wide, 9 m long, and 0.8 m deep, with a 0.6 m repacked soil profile above an impermeable reinforced concrete base constructed to simulate the low-permeability parent rock layer. The plot construction procedure was fully consistent with the description in previously published related nitrogen studies [21,22]. The repacked soil strictly restored the natural in situ stratification, defined as L1 (0–20 cm), L2 (20–40 cm), and L3 (40–60 cm). Table 1 lists the physicochemical properties of each soil layer.
Table 1.
The basic soil physicochemical properties of the three layers.
This study systematically characterized phosphorus migration in agricultural purple soil across four depth layers (L0: 0 cm; L1: 0–20 cm, L2: 20–40 cm, L3: 40–60 cm), under four rainfall regimes (TR: torrential rain, HR: heavy rain, MR: moderate rain, LR: light rain) and four maize-mustard rotation stages (CPS: maize (corn) planting stage, SFS: summer fallow stage, MPS: mustard planting stage, WFS: winter fallow stage). This study ran for two consecutive years, from 1 March 2023 to 1 March 2025. We adopted a typical local crop rotation system: summer maize (Zea mays L.) followed by winter mustard (Brassica juncea var. tumida; common name: swollen-stem mustard; local name: Zhacai). Both farming practices and fertilization followed local farmers’ planting traditions. Maize was planted in a wide-narrow row pattern with 80 cm wide-row spacing, 50 cm narrow-row spacing, and 30 cm plant spacing. Tuber mustard was sown in a uniform equidistant row pattern with 40 cm row spacing and 30 cm plant spacing. The fertilizer application rates in this experiment were determined based on traditional field surveys. The fertilization practices during the experimental period were as follows [21].
Maize planting stage (26 March 2023–17 July 2023; 28 March 2024–21 July 2024): 330 kg/ha N, 120 kg/ha P2O5, 150 kg/ha K2O, with one-third applied as seedling fertilizer (1 April 2023; 5 April 2024), and the others as maize top-dressing (16 May 2023; 18 May 2024).
Summer fallow stage (18 July 2023–17 October 2023; 22 July 2024–15 October 2024): During these stages, no fertilizers were applied, and maize stalks covered the soil surface.
Mustard planting stage (18 October 2023–12 February 2024; 16 October 2024–15 February 2025): 510 kg/ha N, 255 kg/ha P2O5, and 285 kg/ha K2O were applied as seedling fertilizer for mustard (21 November 2023; 17 November 2024).
Winter fallow stage (1 March 2023–25 March 2023; 13 February 2024–27 March 2024; 16 February 2025–28 February 2025): During these stages, no fertilizers were applied, and mustard residual vegetables covered the soil surface.
All crops across growth stages received combined fertilization with urea (N, 46%), superphosphate (P2O5,12%) and potassium sulfate (K2O, 50%). Fertilizers were broadcast directly on the soil surface following local conventional farmer practice, consistent with the regional mainstream fertilization pattern, to ensure the representativeness of the experimental treatments.
2.3. Sampling and Measurement
We collected composite soil samples from each plot using the five-point auger method before planting and after each harvest, then immediately transported them to the lab for pre-treatment. Open ditches collected surface runoff (L0, generated at the 0 cm soil surface). At the same time, pre-buried U-shaped PVC collectors fully intercepted interflow and leachate at each layer and conveyed them to downhill collection troughs (Figure 1b). Runoff collected by the three collector fields in the same runoff plot represents sequential percolation that moves continuously through the soil profile. To minimize cross-interference between adjacent collectors and ensure sampling accuracy, we arranged the three troughs in a staggered layout along the vertical soil profile. After each rainfall–runoff event, we collected samples from sealed barrels. To ensure consistent sampling representativeness, we prepared 300 mL homogenized composite samples for each target soil layer in every plot by mixing equal aliquots from two parallel U-shaped collectors at the corresponding depth. We excluded runoff events with total volume below the 300 mL threshold, as the volume could not support full phosphorus fractionation analyses. We defined a continuous rainfall–runoff sequence as successive runoff events with <24 h inter-event dry period, a threshold pre-calibrated for local purple sloping farmland based on observed 24 h subsurface interflow lag. We merged all runoff events within a continuous sequence ≤ 7 days into one composite sample; for sequences exceeding 7 days, we collected discrete samples for each new runoff event after day 7. We assigned each merged continuous rainfall–runoff event to the rainfall category that dominated runoff generation across the combined sampling period. Table 2 summarizes full records of rainfall, runoff volume, and valid sampling events over the two-year experiment.
Table 2.
Rainfall, runoff generation, and sampling events recorded during the experimental period.
We determined basic soil physicochemical properties using the methods reported by Huang [23]. For water samples, we measured total phosphorus (TP) concentrations without filtration. We filtered water samples through 0.45 μm membranes before analyzing orthophosphate phosphorus (PO43−-P) and total dissolved phosphorus (TDP) [23]. The following equation was used to calculate the particulate phosphorus (PP) concentration: PP = TP-TDP. After persulfate digestion, we quantified TP and TDP by molybdenum blue colorimetry [23]. We measured PO43−-P concentration using the same method as TDP, without digestion. For all phosphorus fractions in aquatic samples, we used the Molybdenum Blue colorimetric reaction for chromogenic development, followed by quantification at 700 nm using an ultraviolet-visible spectrophotometer (UV-1200, Macy Analysis Instrument inc.,,Songjiang District, Shanghai, China).
We calibrated analytical instruments before each measurement. Within each analytical batch, we randomly selected 5% of samples for reanalysis as parallel samples; we accepted a batch only when the absolute deviation of pH was below 0.2, the relative deviation of soil bulk density was below 15%, and the remaining parameters met their corresponding tolerance limits.
2.4. Experimental Data Collection and Processing
An automatic weather station near the research site acquired hourly meteorological data. Daily rainfall was aggregated from hourly precipitation records over the 0–24 h period. Rainfall events were categorized into four classes following the official grading criteria from the China Meteorological Administration [21]. The defined thresholds were: torrential rain (TR, 50 mm ≤ 24 h precipitation < 100 mm), heavy rain (HR, 25 mm ≤ 24 h precipitation < 50 mm), moderate rain (MR, 10 mm ≤ 24 h precipitation < 25 mm), and light rain (LR, 0.1 mm ≤ 24 h precipitation < 10 mm). The two-year monitoring campaign ran from 1 March 2023 to 1 March 2025, during which we documented 314 independent rainfall events, with a total cumulative precipitation of 2106.4 mm (Table 2). Among the 101 observed runoff-producing events, we collected 48 valid sampling batches; the discrepancy was attributed to two scenarios: runoff volume below the 300 mL sampling threshold for some events, and the application of the composite sampling protocol for consecutive runoff events. The surface runoff volume, subsurface interflow volume, and coupled phosphorus loss loads corresponding to the ith sampling event were determined using the set of equations presented below [21]:
Here:
qni is the phosphorus migration load (g/ha) calculated for the nth soil layer during the ith valid sampling event;
rni is the runoff volume (L) collected during the ith valid sampling event;
cni is the phosphorus concentration (mg/L) in runoff collected from the nth soil layer during the ith valid sampling event;
A is the runoff field surface area (m2); 15° is the runoff field surface slope.
k is 10, the constant conversion factor for unit transformation, derived from the following formula: 1 mg/m2 = 10−3·g/10−4·ha = 10 · g/ha.
Qns is the cumulative total migration load (g/ha) from the nth soil layer under the sth cluster (same rainfall pattern, planting stage or planting year);
i ∈ Φs is the unique serial identifier for each sampling event that is categorized into the corresponding s-th cluster, with grouping criteria defined as identical rainfall pattern, consistent cropping stage, or same experimental year.
Qn is the cumulative total phosphorus (TP) migration load (g/ha) calculated from the nth soil layer (g/ha) during the experimental period;
is the cumulative total net migration loss calculated from the nth soil layer among the sth cluster (same rainfall pattern, planting stage or planting year), and when n = 1, Q0s represents the migration loss through surface runoff.
represents the difference between the measured P migration loss at the bottom of the nth and the bottom of the (n−2)th soil layer, calculated as in Equation (5). A negative indicates a net reduction in downward P flux during vertical migration from the (n−2)th to the nth soil layer. In contrast, a positive represents a net increase.
All “annual migration load” values in this study are defined as the total nutrient export within one full maize-mustard rotation crop-year, which sequentially covers the entire growth period of spring maize (sowing to harvest), followed by the entire growth period of autumn-sown mustard, until its harvest in the next spring. All reported annual load data are the average of two consecutive years of field monitoring observations.
For all excluded runoff events (<300 mL) across the three experimental plots, the ratio of surface runoff volume to total monitored runoff is below 0.12%, and their corresponding total P loss contribution is less than 0.07%; the ratio of subsurface runoff volume to total monitored runoff is below 0.03%, with corresponding total P loss contribution less than 0.01%. A paired t-test confirmed no significant difference in annual P loss loads before and after exclusion (p > 0.05), verifying that this filtering procedure does not cause significant underestimation.
2.5. Statistical Analysis
All raw monitoring data were pre-processed with strict quality control via batch parallel sample validation. Normality was assessed using the Kolmogorov–Smirnov (K-S) test for the full raw dataset and the Shapiro–Wilk test for model conditional residuals, supplemented by visual inspection of Q-Q plots. None of the raw phosphorus data passed normality testing; after natural log-transformation, residual Q-Q plots confirmed an approximately normal distribution, satisfying the normality assumption for preliminary correlation and descriptive statistical analyses.
All statistical computations were performed in IBM SPSS Statistics 26, and all data visualizations were generated in GraphPad Prism 8. The significance threshold for all hypothesis tests was set at p = 0.05.
We defined each runoff plot as the true independent experimental unit to avoid pseudoreplication, treating individual rainfall events as nested repeated temporal observations rather than independent replicates. A preliminary one-way ANOVA confirmed no significant inter-plot differences in runoff and phosphorus loss metrics across tillage seasons and rainfall intensity groups (all p > 0.05), validating the three plots as homogeneous independent replicates. For annual phosphorus load comparisons, we computed one aggregated load value per plot and based all corresponding inferences on these three independent plot-level observations.
A linear mixed-effects model (LMM) was fitted to test the interactive effects of rainfall amount and soil layer on phosphorus vertical transport. The model specified Field_id (runoff plot) as the subject (random intercept) to control for unobserved baseline heterogeneity across plots, with Layer_id and Rainfall_event_id defined as nested repeated measures, and a first-order autoregressive [AR(1)] covariance structure to account for temporal autocorrelation among sequential rainfall events. Raw phosphorus monitoring data were used directly as the dependent variable, as LMMs are robust to mild deviations from normality at the raw data level; Layer_id was specified as a fixed factor, and rainfall amount was included as a continuous covariate. Full fixed and random effect specifications are documented in Table 3. We re-verified conditional residual normality using the Shapiro–Wilk test and residual Q-Q plots, with no significant violations of model assumptions detected (p > 0.05), confirming the appropriateness of the current model structure.
Table 3.
Model Dimension of LMM in this study.
3. Results
3.1. Vertical Migration of Soil Phosphorus Across Soil Depth Layers
3.1.1. Effects of Rainfall Patterns on Soil Phosphorus Vertical Migration
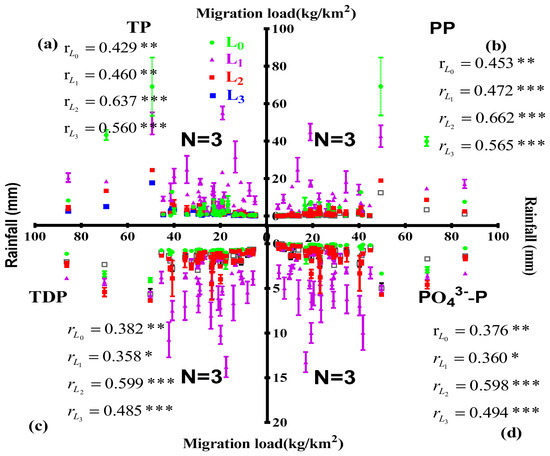
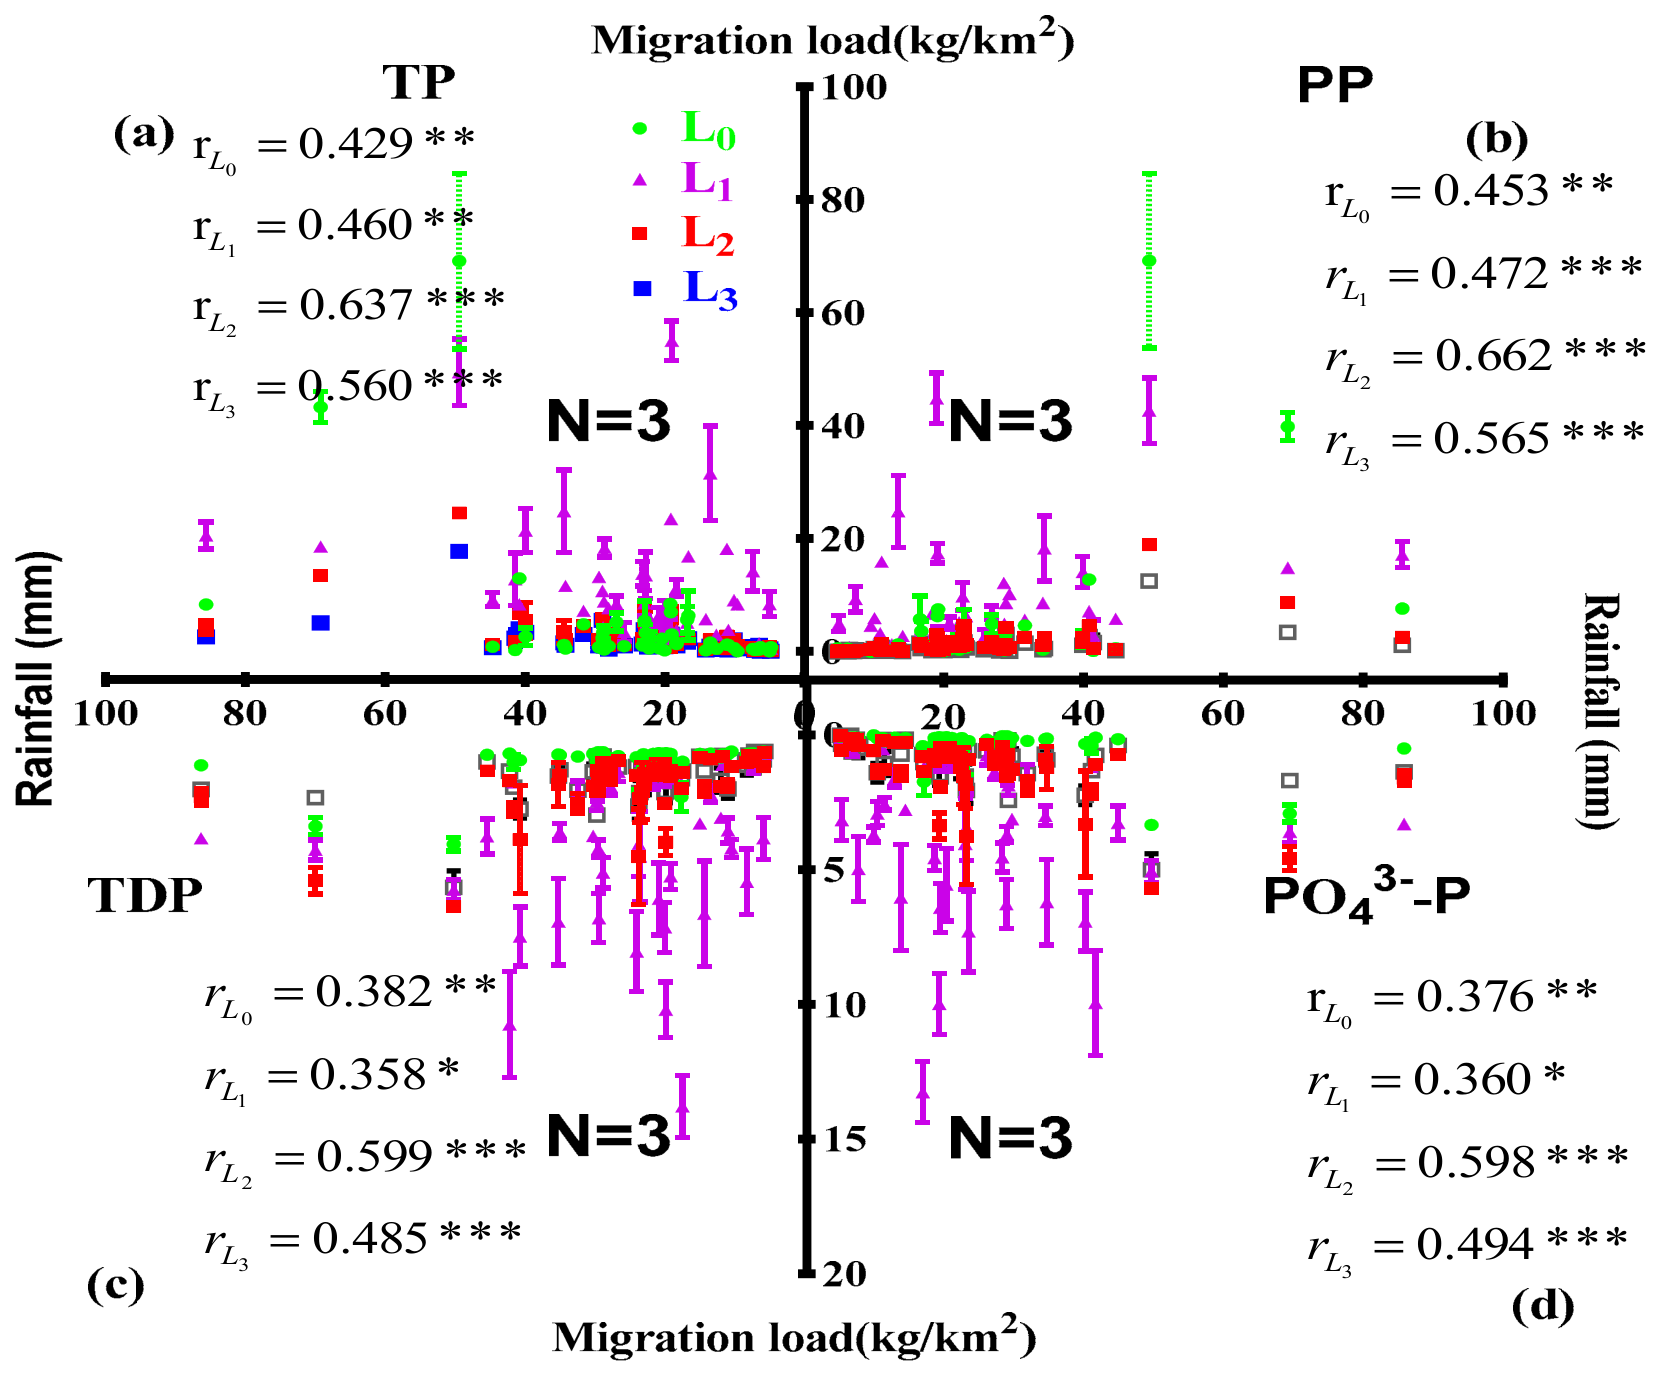
Figure 2 illustrates the distribution patterns of phosphorus migration loads for four forms—total phosphorus (TP), total dissolved phosphorus (TDP), orthophosphate phosphorus (PO43−-P), and particulate phosphorus (PP)—at different soil depths under varying rainfall conditions. Here, L0 represents the phosphorus migration load from surface runoff, while L1, L2, and L3 correspond to vertical downward migration loads at soil depths of 20 cm, 40 cm, and 60 cm, respectively. Spearman’s rank correlation analysis reveals a significant monotonic positive correlation between phosphorus migration loads and rainfall intensity at all soil depths, with all coefficients statistically significant (p < 0.05). The correlation coefficients generally increase, then decline slightly as soil depth increases.
Figure 2.
The migration loads of (a) TP, (b) PP, (c) TDP, and (d) PO43−-P under different rainfall conditions. Notes: L0 indicates the phosphorus migration loads obtained from surface runoff. L1, L2, and L3 indicate the phosphorus downward migration loads from soil depths of 20 cm, 40 cm, and 60 cm, respectively. TP, TDP, PO43−-P, and PP denote total phosphorus, total dissolved phosphorus, orthophosphate phosphorus, and particulate phosphorus, respectively. r denotes Spearman’s rank correlation coefficient. Here, * indicates a significant monotonic correlation (p < 0.05), ** indicates a significant monotonic correlation (p < 0.01), and *** indicates a significant monotonic correlation (p < 0.001). N denotes the number of samples included in the statistical analysis. N = 3 refers to the three independent runoff plots, and the rainfall-phosphorus correlation analysis is performed on the plot-aggregated dataset.
At 40 cm, the correlation coefficient between PP and rainfall peaked at 0.662; at this depth, all four phosphorus forms showed statistically significant correlations (p < 0.001). The migration load of particulate phosphorus (PP) showed highly significant correlations (p < 0.01) with rainfall across all soil layers.
3.1.2. Effect of Soil Depth on Soil Phosphorus Vertical Migration
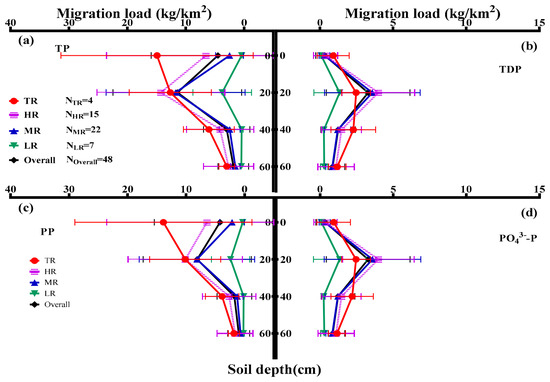
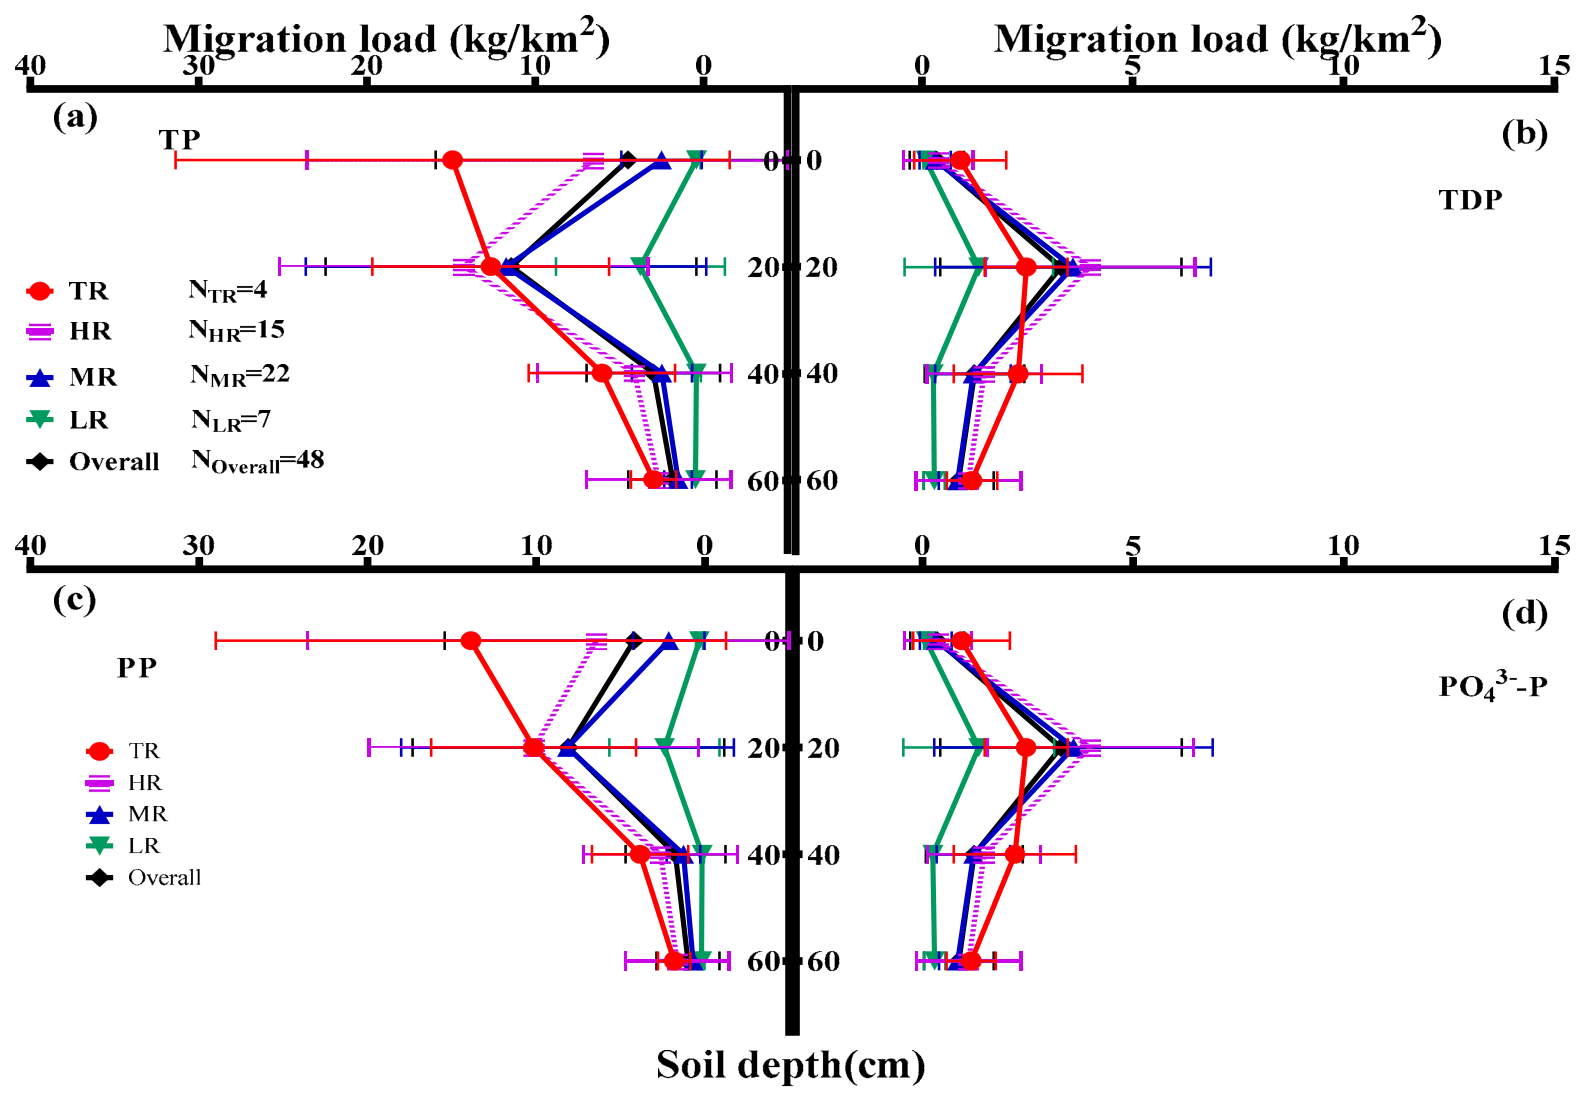
Figure 3 quantitatively illustrates the average migration load distributions of total phosphorus (TP), total dissolved phosphorus (TDP), orthophosphate phosphorus (PO43−-P), and particulate phosphorus (PP) across the 0–60 cm soil profile under four typical rainfall patterns (TR, HR, MR, LR). The surface soil layer is the primary interface for phosphorus transport on slopes, and rainfall intensity strongly affects surface phosphorus loss in a magnitude-dependent way. Based on in situ monitoring datasets, the average surface TP loss load across all scenarios in the study area is 4.484 kg/km2. The average surface TP loss load under torrential rain reaches 14.896 kg/km2, which is 36.78 times that under light rain (0.405 kg/km2). Particulate phosphorus (PP) dominates phosphorus export via surface runoff: the average surface PP loss load under torrential rain is 13.871 kg/km2, accounting for 93.12% of the TP load in the same layer, with a contribution ratio far higher than that of dissolved phosphorus fractions (TDP and PO43−-P).
Figure 3.
Phosphorus migration loads of (a) TP, (b) TDP, (c), PP and (d) PO43−-P at different soil depths under four rainfall regimes (TR, HR, MR, LR) during average rainfall–runoff events. Notes: TR, HR, MR, and LR represent torrential, heavy, moderate, and light rain, respectively. TP, TDP, PO43−-P, and PP denote total phosphorus, total dissolved phosphorus, orthophosphate phosphorus, and particulate phosphorus, respectively. N denotes the number of samples included in the statistical analysis.
From the perspective of fluctuation characteristics of the loss process, the dispersion of surface phosphorus migration under different rainfall magnitudes shows significant differences: the standard deviations of surface TP loss load under torrential rain and heavy rain reach 16.46 kg/km2 and 17.02 kg/km2, respectively, which are remarkably higher than those under moderate rain (2.39 kg/km2) and light rain (0.243 kg/km2). This indicates that, compared with conventional rainfall events, extreme rainfall, such as torrential rain, exerts a much stronger effect on surface runoff generation and significantly increases stochasticity and uncertainty. The average phosphorus load per event, across all four P fractions and the entire 0–60 cm monitored soil profile, strictly follows the descending order TR > HR > MR > LR. This rainfall-gradient effect is most pronounced for particulate phosphorus (PP): the average PP load in the 0 cm surface layer under LR events is only 0.311 kg/km2, accounting for less than 2.3% of the corresponding value under TR events. In situ leaching monitoring data at depths of 20 cm, 40 cm, and 60 cm clearly reveal the progressive attenuation mechanism of phosphorus migration to deep soil along with infiltrating water.
The average TP leaching load in the profile decreases from 11.420 kg/km2 at 20 cm to 2.971 kg/km2 at 40 cm, and finally drops to 1.833 kg/km2 at 60 cm. The average TDP leaching loads at 20 cm, 40 cm, and 60 cm are 3.292 kg/km2, 1.247 kg/km2, and 0.871 kg/km2, respectively. Their proportions in the TP load at the corresponding depths gradually increase from 28.83% to 41.97% and 47.52%, indicating that the contribution of total dissolved phosphorus (TDP) to deep phosphorus migration rises with increasing soil depth. The vertical migration attenuation effect of particulate phosphorus (PP) is the most significant: the PP leaching loads at 40 cm and 60 cm are only 21.52% and 12.37% of the corresponding value at 20 cm, respectively, and the physical interception of the soil matrix exerts a far stronger blocking effect on PP than on total dissolved phosphorus (TDP). The migration loads of all phosphorus fractions simultaneously satisfy the rainfall gradient characteristic of TR > HR > MR > LR and the profile distribution law of continuously decreasing with increasing soil depth. Further dispersion analysis shows that the standard deviation of the migration load for each phosphorus fraction gradually narrows with increasing soil depth, confirming that as the infiltration path extends, the soil matrix’s adsorption and filtration effects continuously weaken fluctuations in phosphorus migration. Vertical phosphorus transport in deep soil tends to be more stable.
3.1.3. Rainfall-Soil Phosphorus Interaction on Vertical P Migration
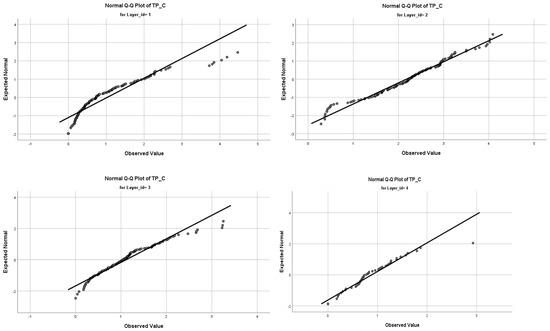
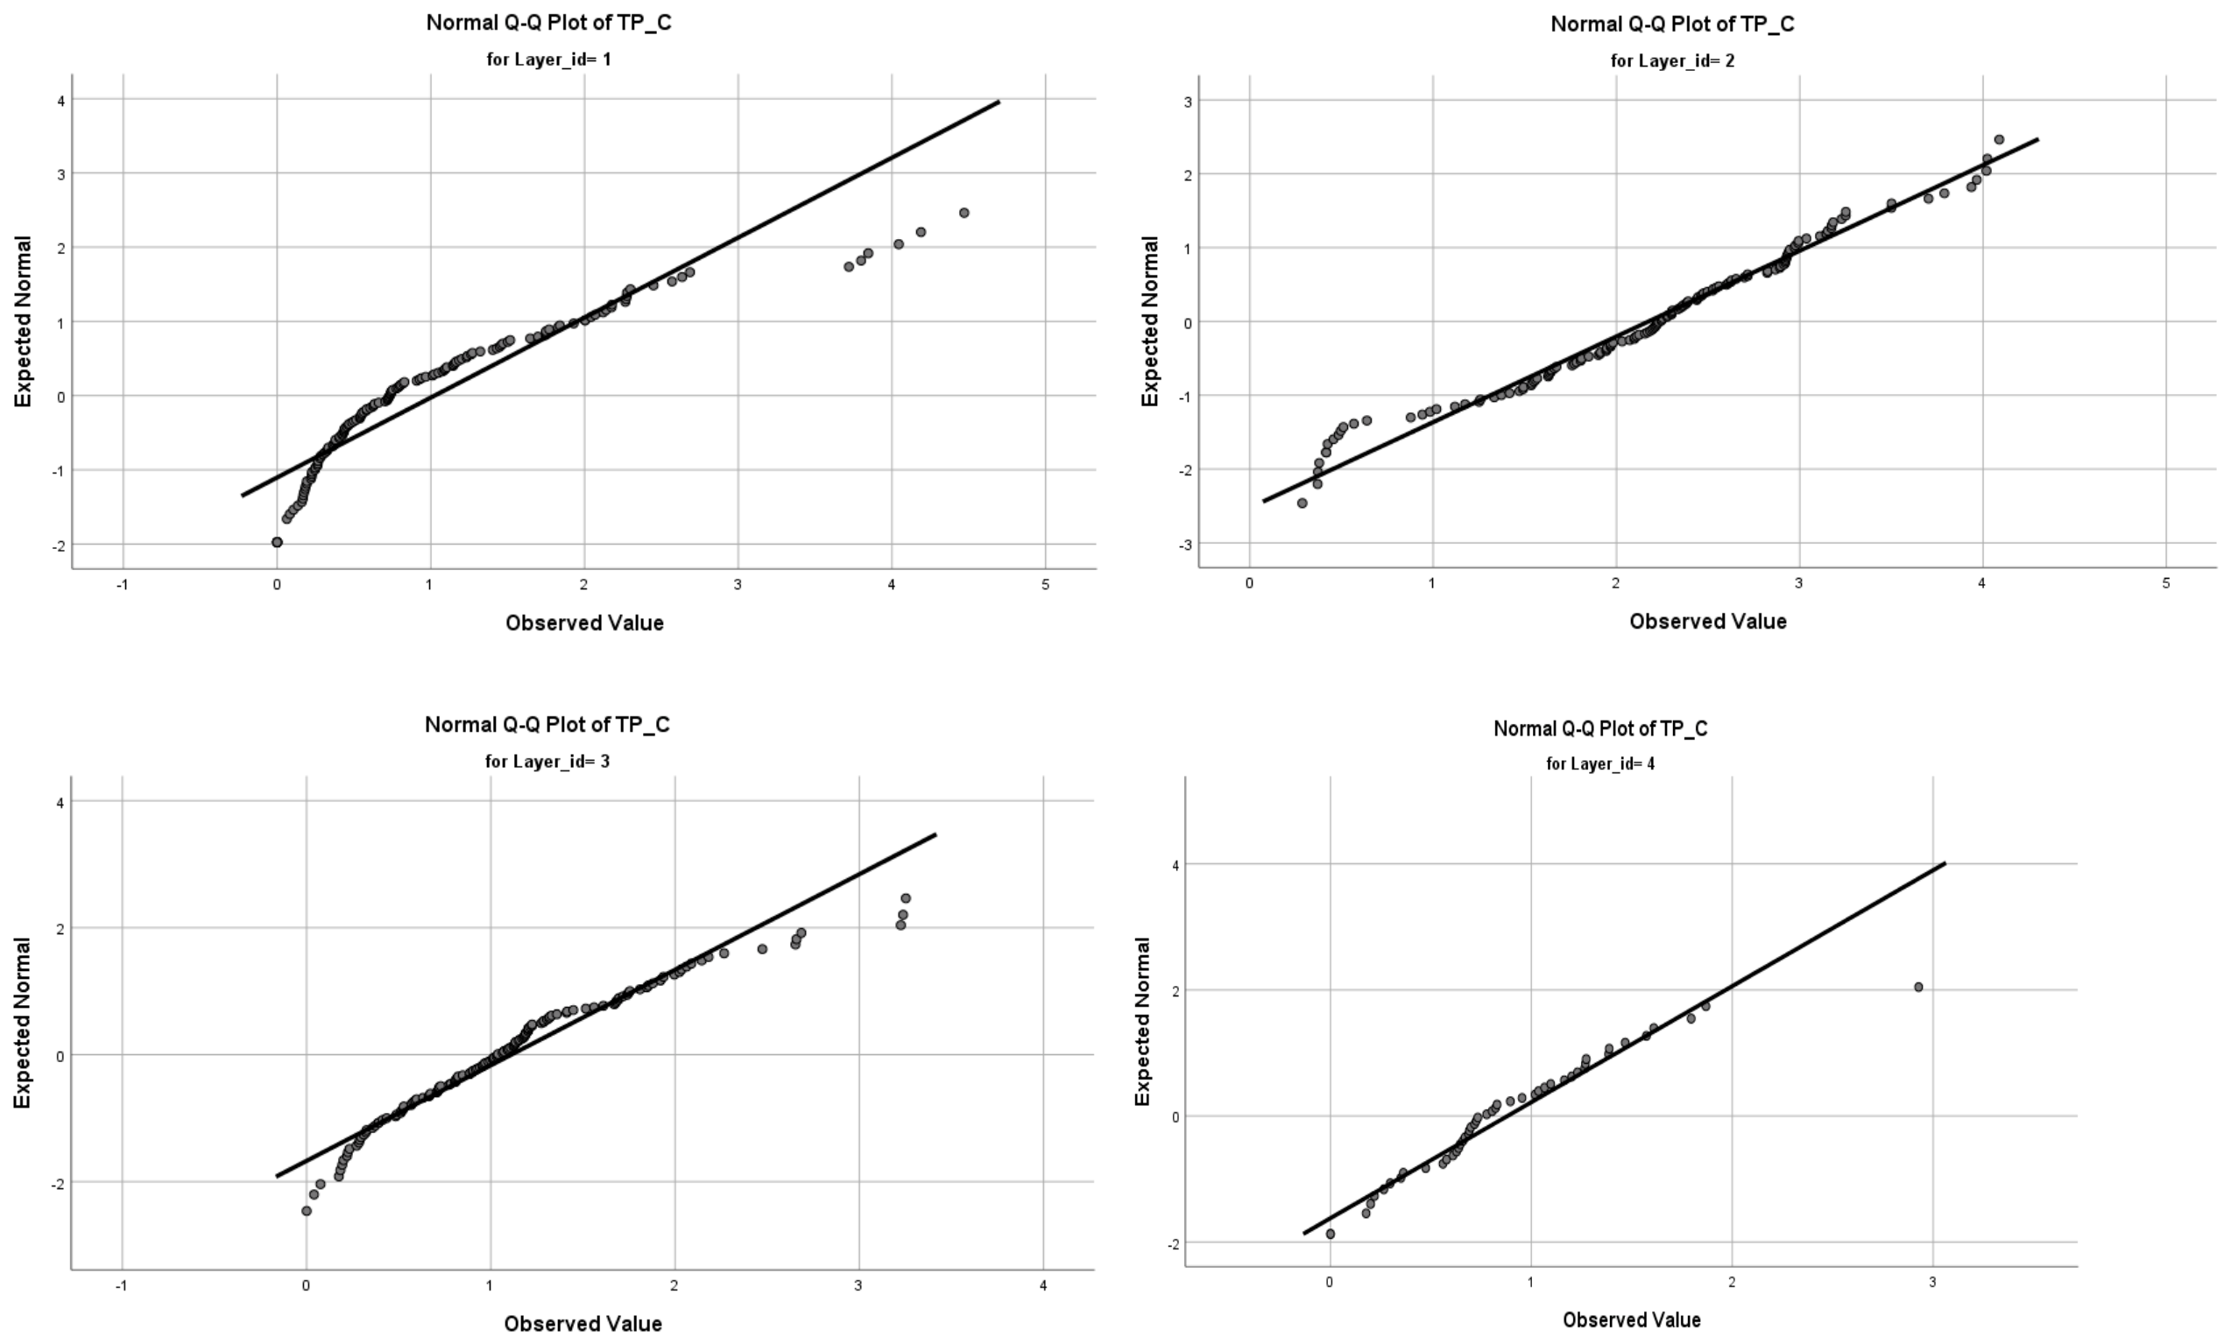
Table 4 shows that the normality of soil phosphorus fraction datasets after natural logarithmic transformation exhibits significant hierarchical heterogeneity across soil layers. The Kolmogorov–Smirnov (K-S) test results show that the bilateral significance levels (Sig.) for the TP_C, TDP_C, PO43−-P_C, and PP_C datasets in the 0 cm soil layer are all 0.000, indicating that their distributions deviate extremely significantly from the standard normal distribution. Except that the normality significance p-values of TP_C and PP_C from the 20 cm soil layer are higher than 0.05, all other logarithm-transformed phosphorus-fraction datasets from different soil layers failed the Kolmogorov–Smirnov normality test (p < 0.05). Further verification via normal Q-Q plots shows that all sample points in the TP_C, TDP_C, PO43−-P_C, and PP_C datasets are closely distributed along the theoretical diagonal, confirming that their distributions approximately follow a normal distribution and satisfy the precondition assumptions for subsequent parametric statistical analyses. Figure 4 shows the Normal Q-Q Plots for the log-transformed total phosphorus dataset (TP_C) across soil layers.
Table 4.
Normality test results for natural-log-transformed data for TP, TDP, PO43−-P, and PP at different soil depths.
Figure 4.
Normal Q-Q Plots for the log-transformed total phosphorus dataset (TP_C) across soil layers (0 cm, Layer_id = 1; 0–20 cm, Layer_id = 2; 20–40 cm, Layer_id = 3; 40–60 cm, Layer_id = 4). Notes: Dots denote empirical quantiles of log-transformed runoff TP values for the target layer, and the straight line is the standard normal theoretical quantile reference line.
We fitted a linear mixed model with Type III fixed effects to the natural-log-transformed, normally distributed soil phosphorus dataset. Table 5 provides all model outputs. Soil layer (Layer_id), rainfall amount (Rainfall), and their two-way interaction (Layer_id * Rainfall) significantly influenced almost all measured soil phosphorus components. For the TP fraction, soil layer (F = 13.496, p < 0.001), rainfall amount (F = 271.023, p < 0.001), and their interaction (F = 24.432, p < 0.001) all reached the predefined significance threshold. TDP was significantly affected by all three explanatory terms, with F = 12.144 (soil layer, p < 0.001), F = 213.825 (rainfall amount, p < 0.001), and F = 8.49 (their interaction, p < 0.001) and for PP, soil layer (F = 13.306, p < 0.001), rainfall amount (F = 231.611, p < 0.001), and their cross term (F = 31.972, p < 0.001) had significant effects. Consistent with these trends, soil layer (F = 12.028, p < 0.001), rainfall amount (F = 207.789, p < 0.001), and their cross term (F = 8.376, p < 0.001) significantly regulated PO43−-P.
Table 5.
Type III Fixed Effects Tests for soil P fractions (Linear Mixed Model).
3.2. Annual Phosphorus Migration Load Under Contrasting Rainfall Regimes
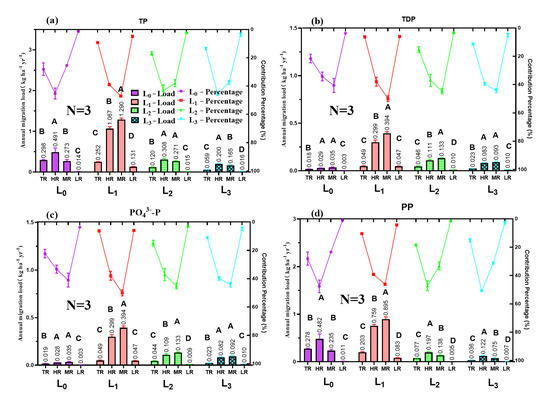
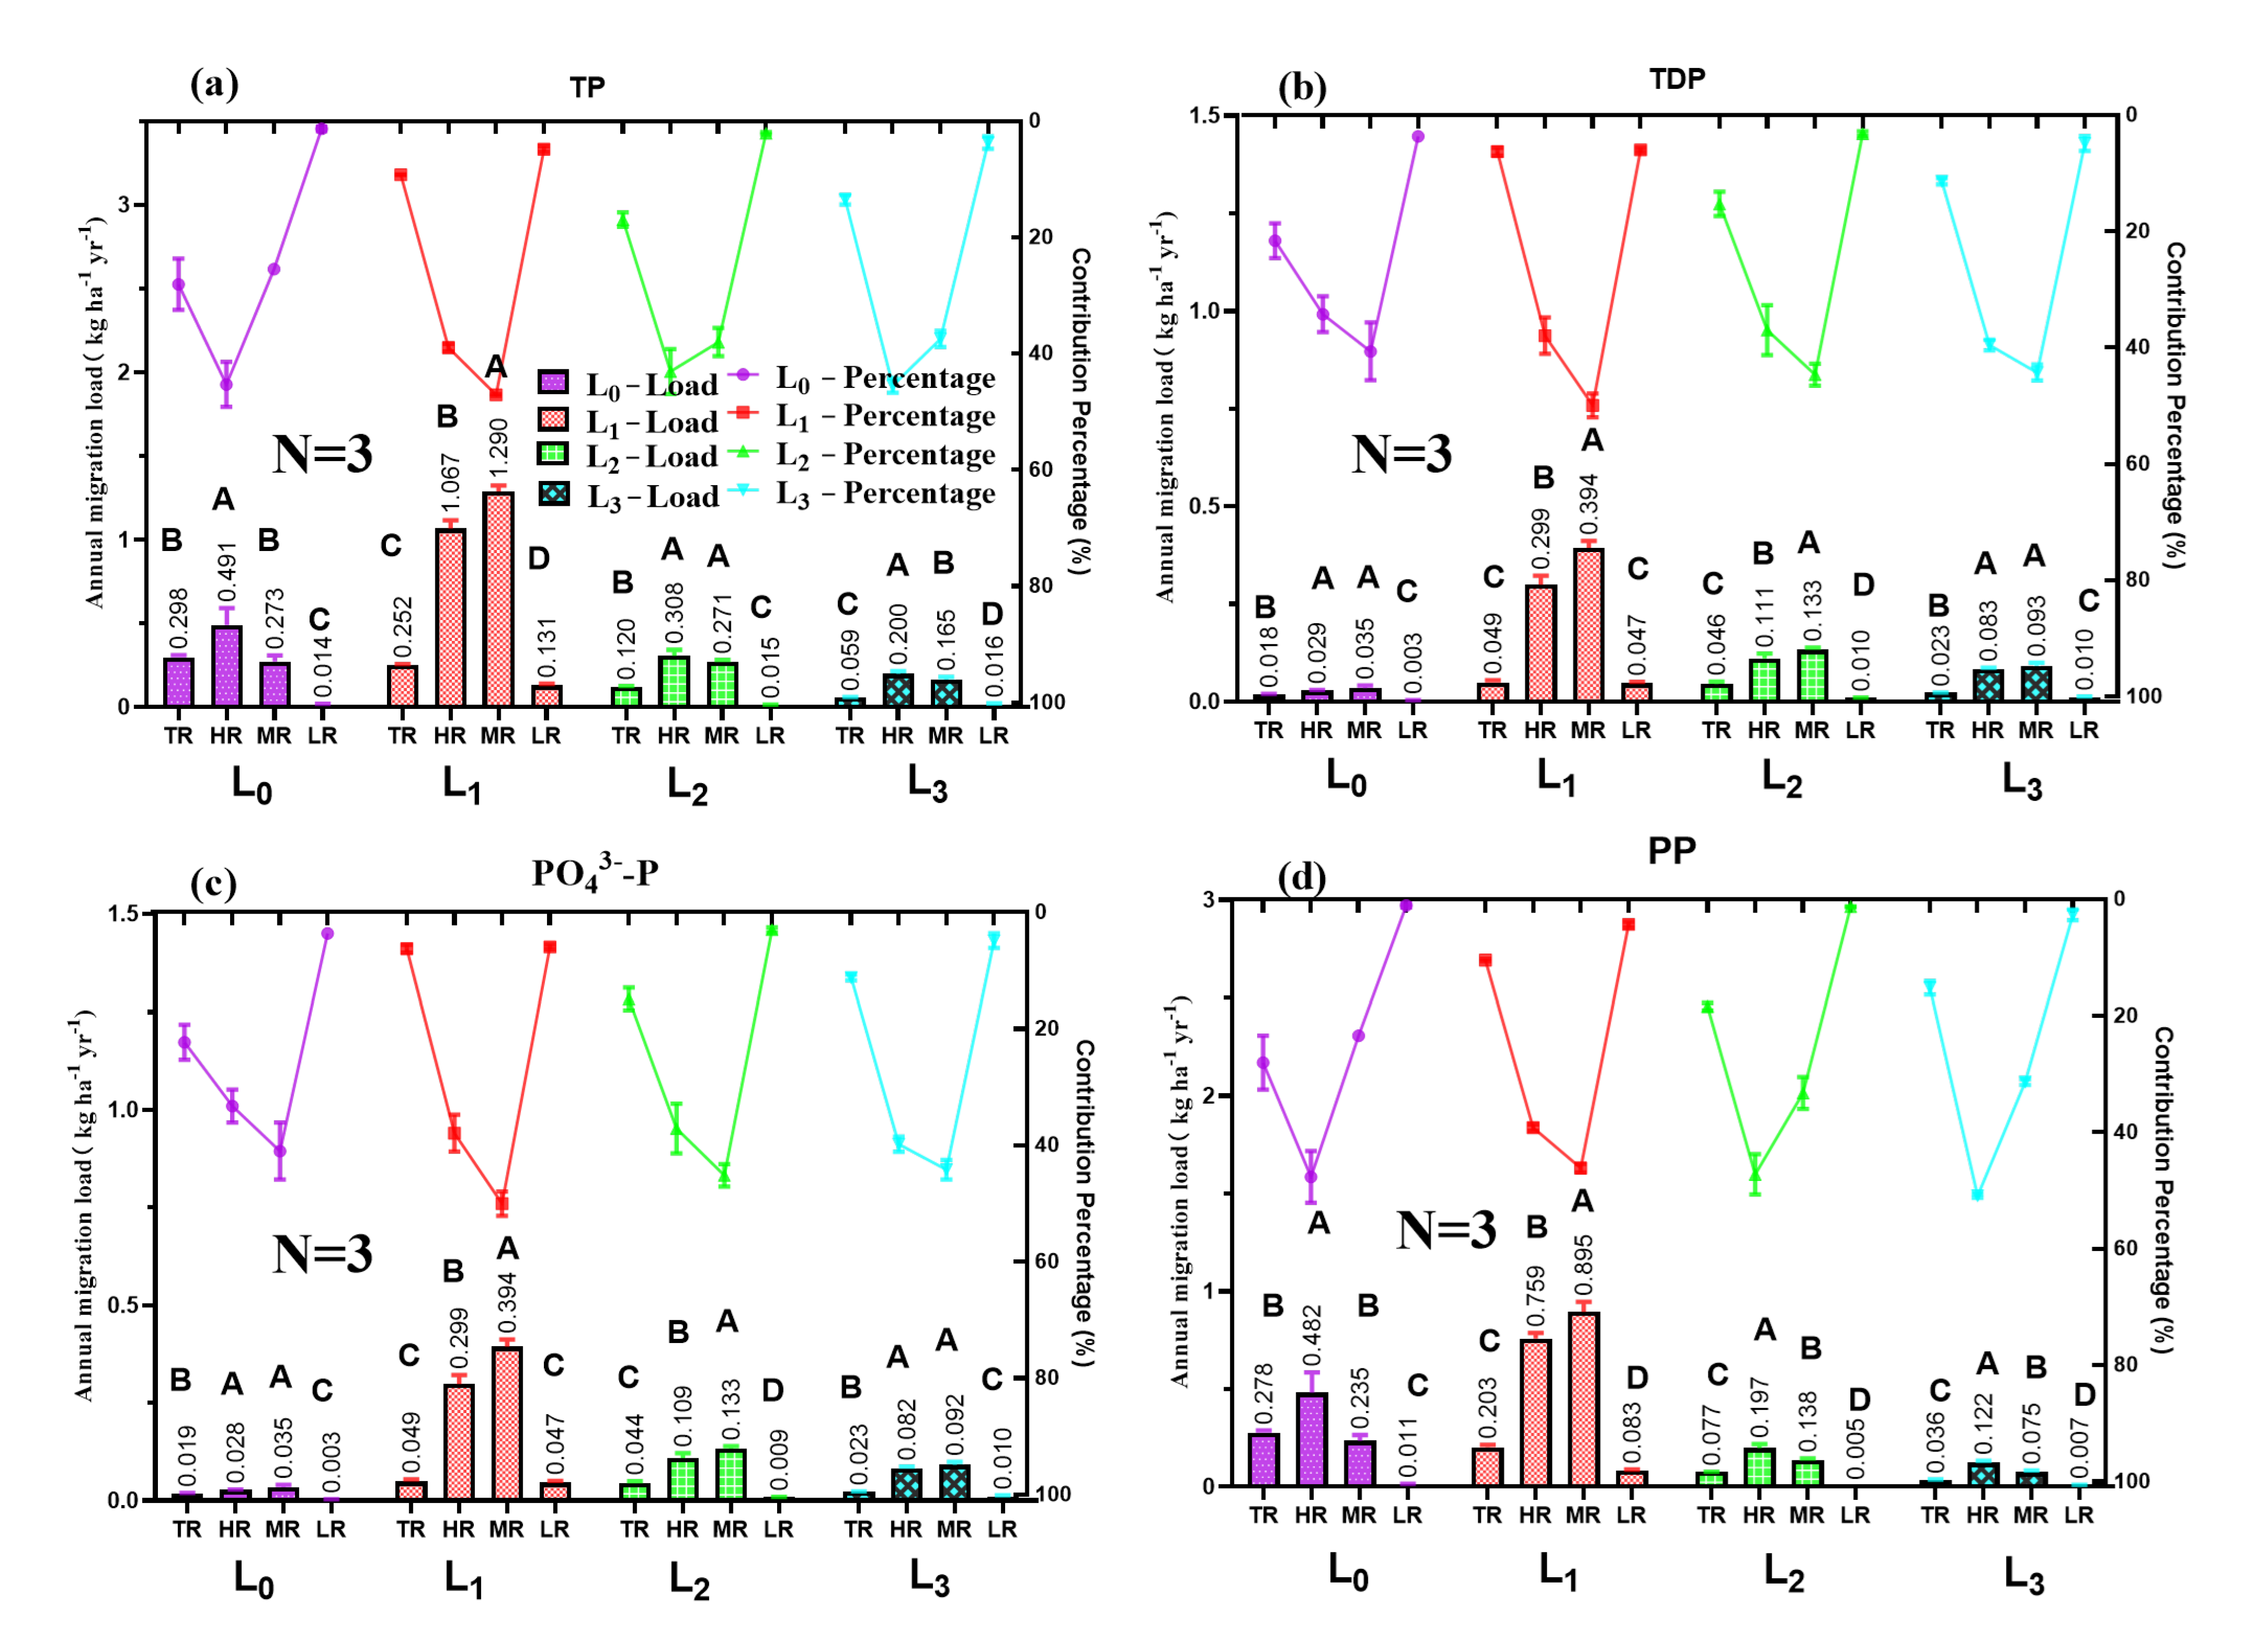
Figure 5 synthesizes the full annual phosphorus migration dataset across the soil profile, presenting both absolute annual loads and proportional contributions of four phosphorus fractions across four soil layers (L0, L1, L2, and L3) under four classified rainfall regimes: torrential rain (TR), heavy rain (HR), moderate rain (MR), and light rain (LR). The visualized outputs show that each rainfall regime’s relative contribution to vertical phosphorus transport varies substantially with soil depth, forming distinct stratification-dependent patterns.
Figure 5.
Annual migration loads of (a) TP, (b) TDP, (c) PO43−-P and (d) PP under different rainfall patterns. Notes: L0 = Annual phosphorus load via surface runoff; L1, L2, L3 = Annual subsurface phosphorus loads at 20 cm, 40 cm, 60 cm soil depth. TR, HR, MR, LR = Torrential, heavy, moderate, light rain. Different uppercase letters denote significant differences among rainfall patterns at the same depth (p < 0.05, one-way ANOVA, LSD post hoc). N = Sample size for statistical analysis.
Across all four soil layers, TP showed the highest absolute annual migration load, with a peak of 2.742 kg ha−1 yr−1 in the L1 layer, followed by 1.076 kg ha−1 yr−1 in L0, 0.713 kg ha−1 yr−1 in L2, and 0.440 kg ha−1 yr−1 in L3. In the surface L0 layer, HR dominated TP migration with a 45.58% contribution (0.490 kg ha−1 yr−1), followed by TR (27.68%), MR (25.42%), and LR (only 1.32%). This dominance of heavy rainfall persisted through deeper layers: HR contributed 38.95% of TP load in L1, 43.11% in L2, and 45.41% in L3, while MR became the top contributor in L1 at 47.06% and remained the second-largest contributor in L2 (37.95%) and L3 (37.44%). TR accounted for 9.21–16.89% of TP migration across subsurface layers, and LR consistently contributed less than 5% at all depths below L0.
For dissolved phosphorus fractions, TDP showed a distinct depth-dependent load distribution, with the maximum annual migration load of 0.789 kg ha−1 yr−1 occurring in L1, followed by 0.299 kg ha−1 yr−1 in L2, 0.210 kg ha−1 yr−1 in L3, and the minimum 0.085 kg ha−1 yr−1 in L0. Unlike TP, MR was the primary driver of TDP migration across nearly all soil layers, contributing 40.81% of TDP load in L0, 49.89% in L1, 44.62% in L2, and 44.26% in L3. HR ranked as the second major contributor, accounting for 34.09% (L0), 37.89% (L1), 36.97% (L2), and 39.50% (L3) of TDP transport, while TR and LR consistently contributed below 16% and 6%, respectively, across all measured layers.
The rainfall-driven migration patterns of PP closely mirrored those of bulk TP, following a consistent overall contribution order of HR > MR > TR > LR across the subsurface profile. In L1, MR contributed the largest share (46.11%), followed by HR (39.13%), TR (10.46%), and LR (4.30%). In L2 and L3, HR led with 47.26% and 50.86% contributions, respectively, while MR remained the second-largest factor at 33.12% and 31.33%. For PO43−-P, the contribution sequence was almost identical to that of TDP, ranking as MR > HR > TR > LR across all subsurface layers. MR occupied the highest proportion at 49.98% (L1), 45.10% (L2), and 44.14% (L3); HR followed closely with 37.85%, 33.12%, and 39.76%, respectively, while TR and LR each accounted for less than 15% and 6% of the total PO43−-P migration load in all three deep layers. LR events accounted for 81% of all rainfall events (253/314) but contributed only 11.7% to annual total phosphorus (TP) loss. By contrast, TR events, representing only 1.3% of events (4/314), drove 58.85% of total subsurface phosphorus leaching.
The combined effect of event-scale P load and total event frequency correlates strongly with each rainfall regime’s relative contribution to annual phosphorus export. As documented in Table 2, low-rainfall (LR) events constituted 81% of all recorded events (253 out of 314) but collectively contributed only 11.7% of total annual P loss. By contrast, extreme total-rainstorm (TR) events, though they represented only 1.3% of total events (4 out of 314), accounted for 58.85% of total subsurface P leaching. This stark observed contrast indicates that low-frequency, high-magnitude extreme events are the primary contributors to annual P export, even though low-intensity, high-frequency rainfall accounts for most event counts across the two monitoring years.
3.3. Annual Phosphorus Migration Load Across Different Planting Stages
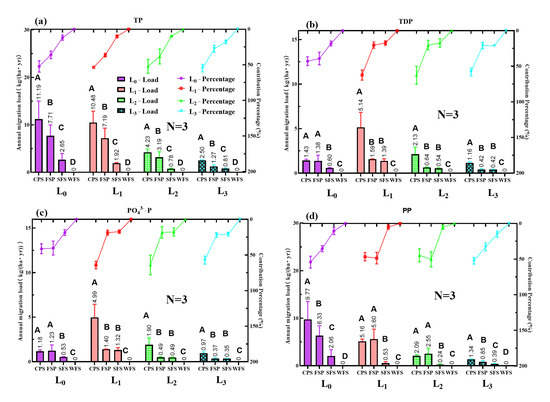
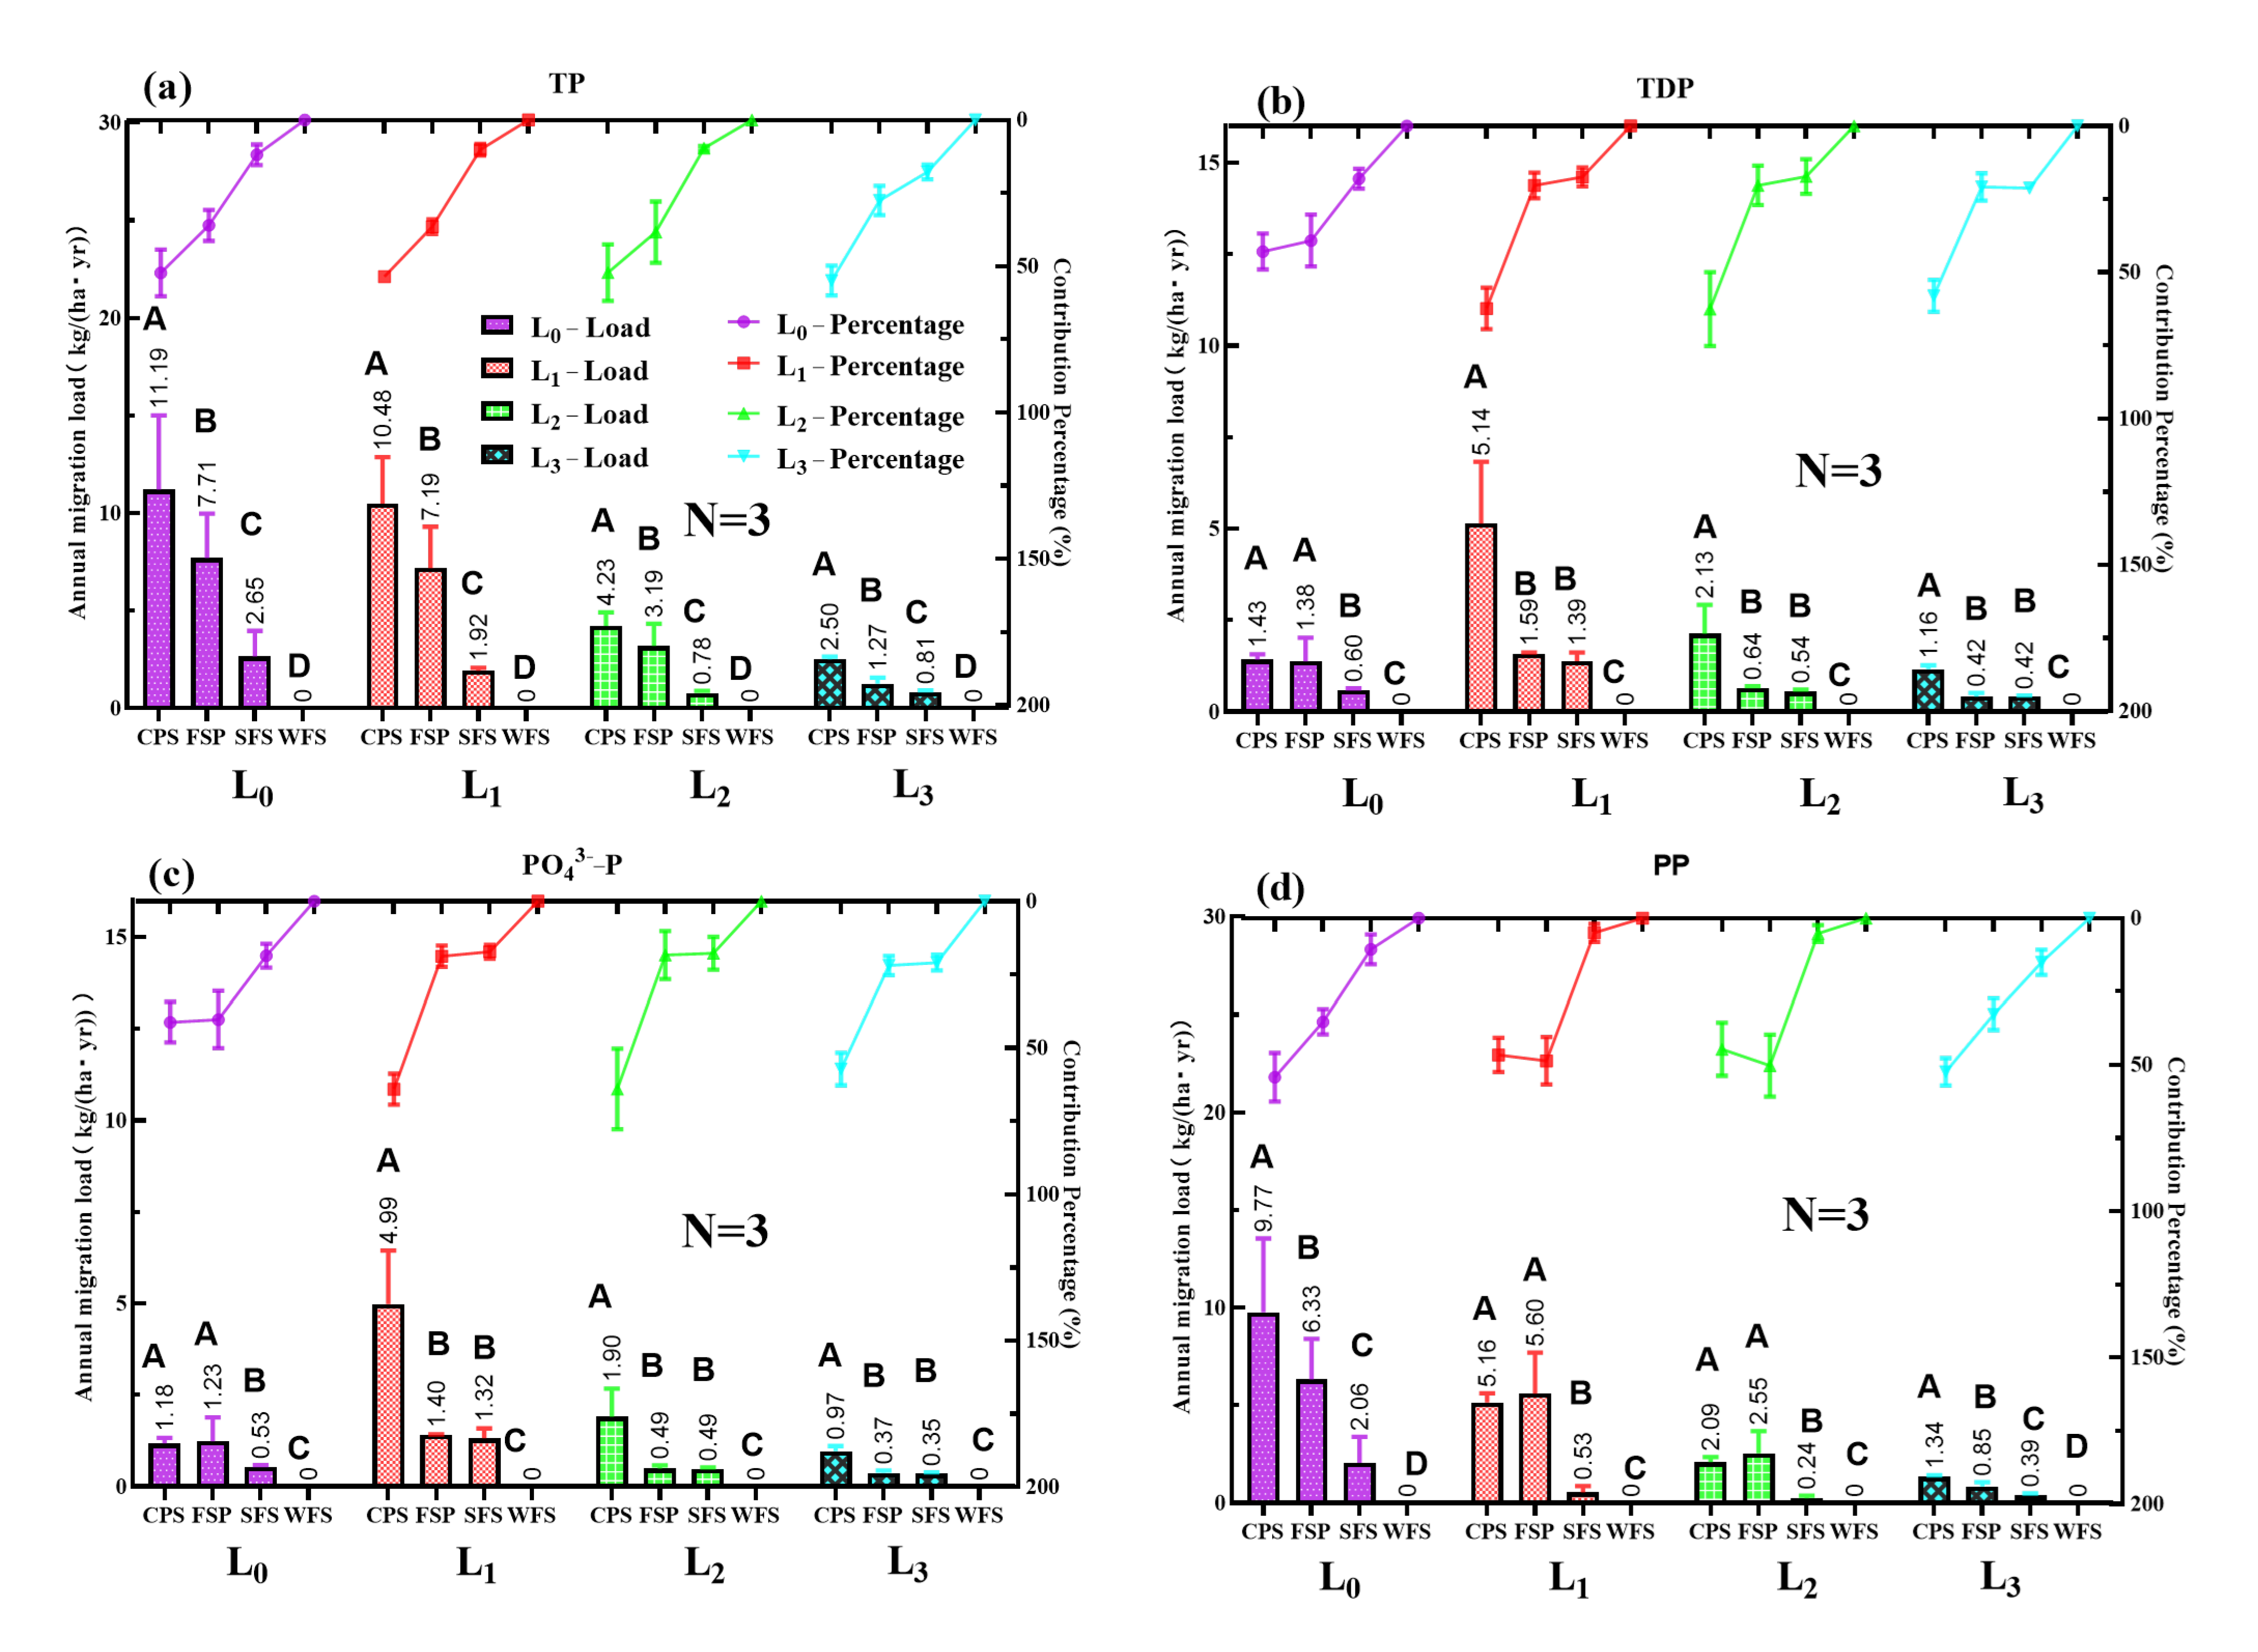
Figure 6 presents the annual vertical migration loads and proportional contributions of total phosphorus (TP), total dissolved phosphorus (TDP), orthophosphate phosphorus (PO43−-P), and particulate phosphorus (PP) across four soil layers (L0, L1, L2, L3) at four distinct crop growing stages: CPS, SFS, MPS, and WFS. Across all measured soil depths, the relative contribution of planting stages to the migration of every phosphorus fraction followed a consistent descending order: CPS > SFS > MPS > WFS.
Figure 6.
Annual migration loadsof (a) TP, (b) TDP, (c) PO43−-P and (d) PP across different crop growing stages. Notes: L0 indicates annual phosphorus migration loads via surface runoff. L1, L2, and L3 indicate annual phosphorus migration loads monitored via subsurface runoff at soil depths of 20 cm, 40 cm, and 60 cm, respectively. CPS, SFS, MPS, WFS = maize planting stage, summer fallow stage, mustard planting stage, winter fallow stage. Different Uppercase letters indicate significant differences in planting stages at the same depth (p < 0.05), based on one-way ANOVA with LSD post hoc comparison. N denotes the number of samples included in the statistical analysis.
In the surface topsoil layer L0, the annual migration loads of TP, TDP, PO43−-P, and PP during the maize planting stage (CPS) reached 0.841 kg ha−1 yr−1, 0.056 kg ha−1 yr−1, 0.056 kg ha−1 yr−1, and 0.802 kg ha−1 yr−1, respectively, which accounted for 78.19%, 65.62%, 65.64%, and 79.74% of the corresponding total annual phosphorus migration loads in this layer. In the following SFS and MPS stages, annual TP migration loads were 0.208 kg ha−1 yr−1 and 0.026 kg ha−1 yr−1, with particulate phosphorus (PP) accounting for 87.02% and 84.62% of these total TP loads, respectively. No valid observations of vertical phosphorus migration were collected during the winter fallow stage (WFS).
At the L1 soil layer, annual TP, TDP, PO43−-P, and PP migration loads during CPS were 1.926 kg ha−1 yr−1, 0.541 kg ha−1 yr−1, 0.540 kg ha−1 yr−1, and 1.370 kg ha−1 yr−1, respectively, contributing 70.28%, 68.47%, 68.43%, and 70.58% to the corresponding total annual phosphorus flux at this depth. These proportional contributions are substantially higher than those recorded in the other three planting stages. This consistent ranking pattern of annual phosphorus migration loads and their relative proportions (i.e., CPS > SFS > MPS > WFS) was further validated in the deeper L2 and L3 soil layers. Moreover, as soil depth increased from 20 cm (L1) to 60 cm (L3), annual phosphorus migration loads for each phosphorus form decreased significantly in a stepwise manner. The annual phosphorus migration loads for all phosphorus forms followed the CPS > SFS > MPS > WFS order in each soil layer, with significant differences among planting stages.
4. Discussion
4.1. Hydrological Drivers and the Depth-Stratified Response of Phosphorus Transport
This study found that rainfall is the primary driver of phosphorus migration in soil. The interaction between precipitation intensity and soil depth significantly influences this process, consistent with previous studies [24,25]. Phosphorus migration exhibits distinct patterns under different rainfall conditions. Surface runoff accounts for over 65% of total migration under heavy rainfall events. Heavy rainfall drives rapid infiltration, which directly mobilizes large amounts of surface-adsorbed phosphorus, while the corresponding leached phosphorus fraction remains relatively low. During light rainfall, surface runoff is nearly non-existent. Phosphorus moves downward only through subsurface leaching, with migration amounts remaining extremely low (<0.5 kg/km2) at all soil depths. Figure 3 and Figure 5 indicate that under moderate-to-torrential rainfall conditions, both surface runoff and subsurface leaching affect soil phosphorus migration. As soil depth increases, the vertical migration load of soil phosphorus via leaching decreases significantly. Notably, combining Table 2 and Figure 5, torrential, heavy, and moderate rainfall events—accounting for 19.43% of all precipitation events—contributed over 95% of total phosphorus (TP) leaching across all soil layers. These torrential and heavy rainfall events, which accounted for only 6.05% of total rainfall events, accounted for 73.26% of surface phosphorus loss and 58.85% of subsurface phosphorus leaching. This shows that extreme rainfall worsens soil phosphorus loss through erosion-driven surface P removal and enhanced infiltration for deep P transport [26,27,28]. This confirms that low-frequency extreme rainfall dominates annual phosphorus export, even though low-intensity events are far more frequent.
Different forms of phosphorus show markedly different vertical migration patterns in this study. Total phosphorus (TP) and particulate phosphorus (PP) show higher overall migration loads, with their contributions most pronounced in surface runoff and the shallow 20 cm soil layer, indicating that rainfall-driven surface runoff erosion and particle transport in shallow soils are the primary mechanisms for these phosphorus species. In contrast, total dissolved phosphorus (TDP) and orthophosphate phosphorus (PO43−-P) migrate vertically downward more readily with water flow, showing a marked increase in migration intensity at 40 cm depth—with some samples reaching as deep as 60 cm—and exhibiting significantly greater migration stability than PP. As phosphorus leaching loads progressively decrease with increasing soil depth, the decline of particulate phosphorus (PP) dominates.
All phosphorus forms in this study follow a clear gradient pattern (TR> HR> MR> LR) in migration load, which continues to diminish with depth; simultaneously, the standard deviation of migration loads for each form narrows progressively, reflecting strong rainfall dependence and significant variability in shallow-layer phosphorus migration versus stable processes in deeper layers. Given the high permeability and pore-structure characteristics of purple soils [29], this stratified response pattern provides preliminary empirical guidance for regional phosphorus management strategies.
4.2. Profile Transport Attenuation Patterns and Associated Environmental Implications
Phosphorus loss morphology varies significantly with soil depth. Surface runoff phosphorus is dominated by particulate phosphorus (PP) in this study, accounting for 93.42% of total surface phosphorus loss, consistent with findings by McDowell [30] and aligning closely with the 85–94.1% range reported by Xie [31]. With increasing depth, the proportion of PP in total phosphorus (TP) loss declines markedly: from 70.81% in the L1 layer to 58.47% in L2, and further to 52.57% in L3, which indicates that the mobility of particulate phosphorus (PP) weakens in deep soil layers.
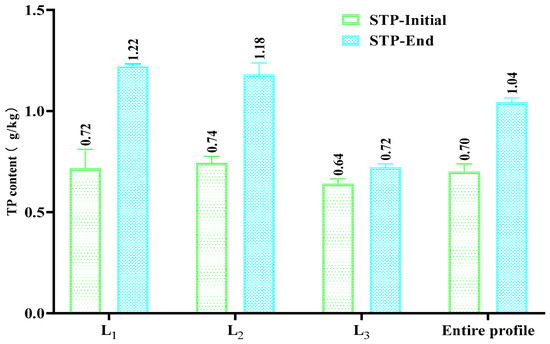
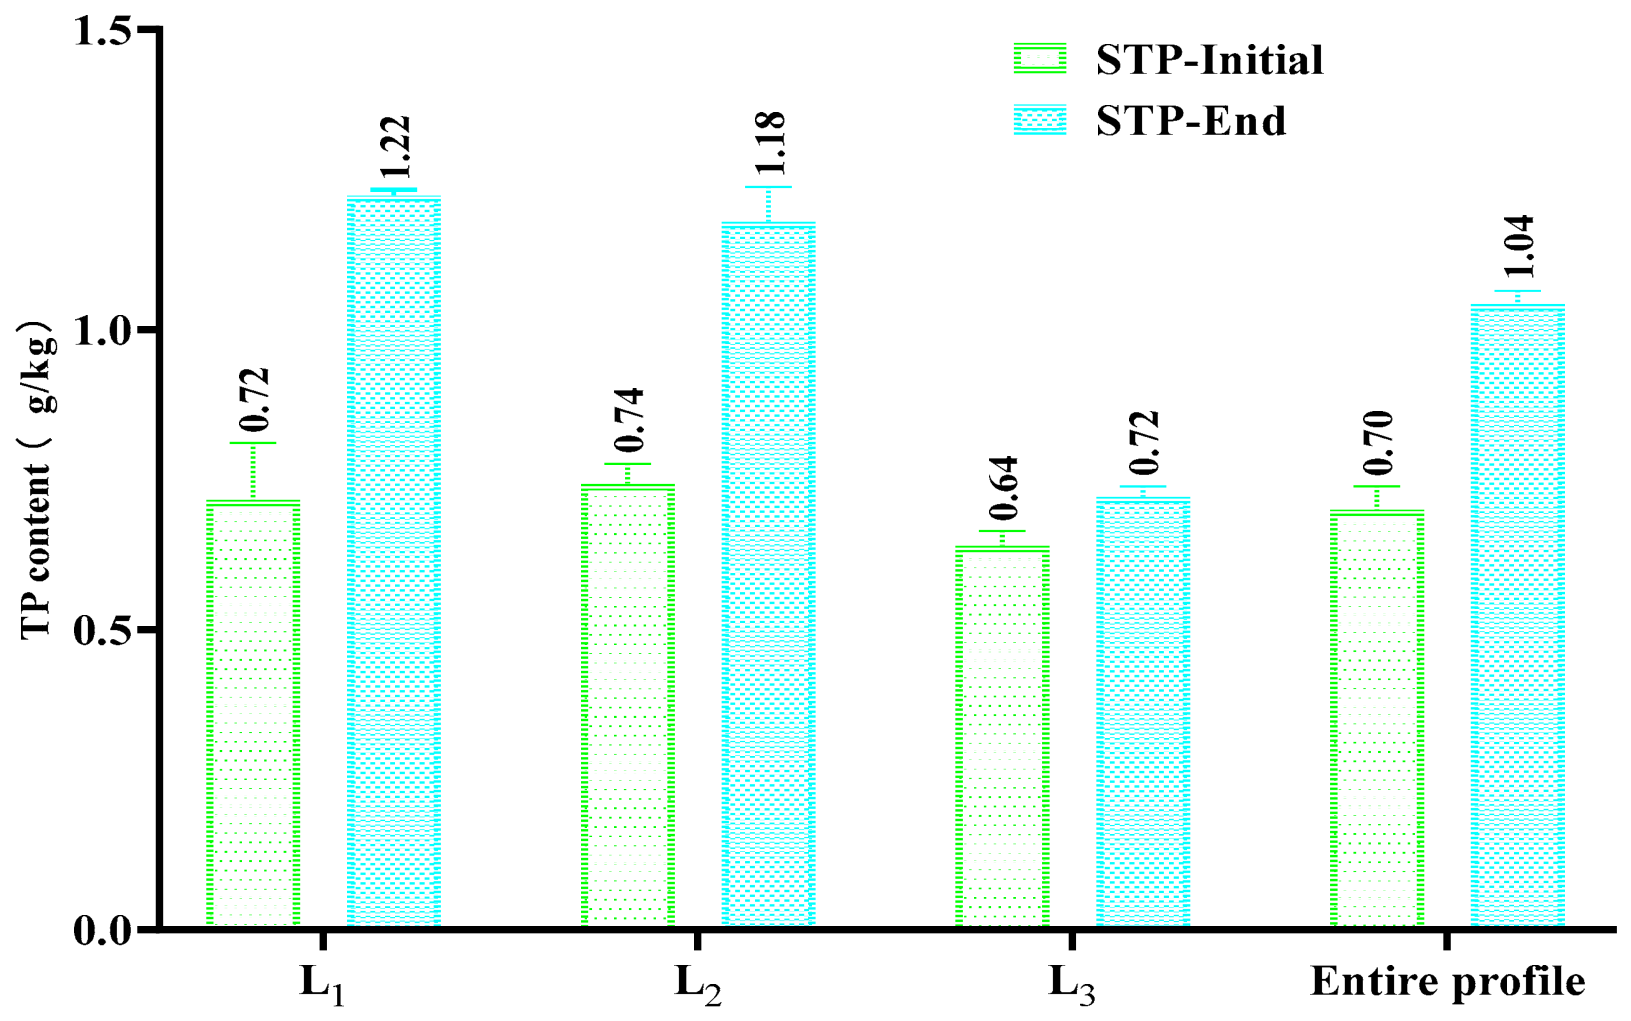
The subsoil layers (L2 and L3) function as a critical zone for phosphorus transport attenuation, producing a net reduction in downward phosphorus flux of 83.33% for leached P from the topsoil layer in this study, consistent with the >80% downward flux attenuation reported by Gachter [32]. This attenuation effect arises from dual mechanisms. Firstly, preferential flow through macropores and fissures in the cultivated layer, driven by root activity and tillage, facilitates downward transport of particulate phosphorus (PP) [33,34]. Second, progressive compaction and porosity reduction in deeper layers, driven by long-term gravitational settling and percolation forces, physically restrict the migration of adsorbed phosphorus-bearing particles [32], as Wang [22] observed a sharp decline in the 0.002 mm sediment fraction with depth. Figure 7 provides supporting evidence for phosphorus accumulation: total phosphorus (TP) in L1, L2, and L3 increased by 72.81% (0.50 g/kg), 59.12% (0.44 g/kg), and 12.99% (0.08 g/kg), respectively, relative to the initial of experiment, which means that The entire soil profile can function as a transport-regulating medium [24,32] to produce a net reduction in downward flux for a portion of leached phosphorus derived from exogenous P inputs [34]. Furthermore, phosphorus flux in subsurface flow decreased progressively from the 20 cm layer (L1) to the 60 cm layer (L3), with the lowest flux observed at 60 cm. This pattern confirms that the net reduction in downward phosphorus flux intensifies with increasing soil depth, which substantially lowers the risk of P leaching to deeper subsurface layers. These findings are fully consistent with long-term studies showing that 67.2% of external phosphorus fertilizers remain in the soil [4] and with 1.2- to 2.5-fold increases in subsoil phosphorus content observed under continuous fertilization regimes [32]. Deep soils can produce a strong net reduction in downward transport of most particulate nutrients leached from the topsoil layer [34]. These results provide crucial empirical evidence for agricultural non-point source phosphorus pollution control.
Figure 7.
Changes in soil total phosphorus (STP) in different soil layers during the experimental period.
4.3. Management Measures and Critical Control Periods
The combined application of chemical fertilizers with the coincident rainy season renders the maize growth period the dominant phase of phosphorus loss in purple soil sloping farmland. This study confirms that both surface phosphorus loss and subsurface phosphorus leaching show a significant positive linear correlation with rainfall amount (p < 0.05), consistent with McDowell [30]. Intense rainfall events predominantly coincide with the maize planting stage and the summer fallow stage. In contrast, moderate and light rainfall events are more frequent but insufficient to generate measurable surface runoff during the mustard planting stage. The observed sharp increases in phosphorus loss are most strongly associated with the synergistic interaction between fertilizer management and well-developed preferential flow pathways, consistent with previously reported field observations [35,36]. Consequently, the annual total phosphorus (TP) loss and the proportion of particulate phosphorus (PP) are markedly higher during the maize growth period and significantly lower during the mustard planting stage.
At the interannual scale, heavy rainfall and storm events primarily affect surface phosphorus loss in this study, while both intense and moderate rainfall influence subsurface phosphorus leaching. Rainfall intensity and total depth are strongly associated with surface phosphorus loss: higher intensity correlates with greater splash erosion and runoff volume, corresponding to elevated particulate phosphorus (PP) transport. In contrast, rainfall intensity and infiltration rate modulate phosphorus leaching. Both intense and moderate rainfall events can generate sufficient splash-deposited particles and sustain stable runoff, facilitating nutrient leaching and transport—a mechanism corroborated by Pu [37], who demonstrated that intense rainfall exacerbates nitrogen and phosphorus losses in surface runoff.
The rainfall-associated phosphorus loss patterns and high-risk export periods identified in this study provide a clear empirical basis for developing low-cost source-control management strategies in the purple sloping farmland of the Three Gorges Reservoir Area. For the local maize-mustard rotation system, the optimized phosphorus management scheme combines split-hole fertilization (base fertilization before sowing + topdressing at the maize seedling stage) with partial organic fertilizer substitution to dynamically adjust phosphorus inputs to meet crop yield targets. It effectively inhibits excessive topsoil phosphorus accumulation before the concentrated rainy season and reduces residual phosphorus leaching across the plow pan.
Long-term in situ field validation conducted on sloping purple farmland in the Three Gorges Reservoir Area under the identical maize-mustard rotation system [31] confirms that this site-adapted phosphorus management regime can reduce conventional P fertilizer input by 20% without any crop yield loss. This finding is consistent with well-documented evidence that split, low-rate P applications reduce phosphorus transport risk under high rainfall-prone conditions [38]. Based on continuous in situ P flux monitoring data in the present study, this fertilization strategy was further verified to improve cost–benefit performance while mitigating agricultural non-point source pollution.
Consistent with the observed P loss peak characteristics in this study, phosphorus loss mitigation in purple soil sloping farmland must prioritize targeted interception of phosphorus migration during the maize growth period and summer fallow period.
4.4. Coupled Vertical Migration of Nitrogen and Phosphorus and Its Significance for Maize–Mustard Nutrition
The paired two-year monitoring datasets from the identical experimental runoff plots show that nitrogen and phosphorus losses in the purple sloping maize-mustard system share a highly consistent hydrological association pattern, where extreme TR and HR rainfall events accounting for only 6.05% of total events generate more than 60% of the annual N migration load in the previously published companion N study [21], 73.26% of annual surface P loss and 58.85% of subsurface P leaching. The maize planting stage acts as the unified high-risk export window for both elements, contributing over 70% of N loss [21] and more than 78% of P loss. This observation indicates that N and P are co-mobilized by the same surface runoff and infiltration processes on the sloping purple soil, rather than operating through independent transport pathways. Despite this shared driver, the two elements exhibit sharply divergent vertical transport attenuation behaviors: weakly adsorbed nitrate N remains highly mobile throughout the 0–60 cm soil profile and shows limited interception by the subsoil before moving towards groundwater [21], while in the previously published companion N study, the 20–60 cm subsoil produces a net reduction of 83.33% in downward P flux leached from the cultivated topsoil, with the 20–40 cm layer accounting for 73.95% of this transport attenuation and the PP fraction declining from 93.42% at the surface to 52.57% at 40–60 cm. This stark contrast shows that the same soil profile functions as a permeable conduit for nitrate but a strong transport-attenuation zone for phosphorus, and the continuously accumulating P pool in the subsoil should be regarded as a potential long-term legacy source rather than a permanently immobilized nutrient.
The coupled transport and divergent transport attenuation characteristics of N and P are further functionally associated with the nutrient stoichiometry of the local maize-mustard rotation system. Summer maize has high simultaneous N and P demand during vegetative and grain-filling stages. In contrast, winter mustard has a shorter, cooler growing season with comparatively lower nutrient uptake. The coincidence of the rainy season with the maize fertilization period makes the nutrients applied for maize far more vulnerable to loss, a pattern that strongly correlates with the observed co-occurrence of N and P export peaks during the maize stage.
Disproportionate N leaching may shift the topsoil nutrient regime toward potential P limitation. In contrast, sustained P transport attenuation in the subsoil reduces the downward P flux that could otherwise return to the surface nutrient pool, a pattern that corresponds to the maize planting stage being the period when the soil N:P balance is most vulnerable to disruption. The integrated analysis of the two companion studies supports a coordinated N-P management strategy that outperforms isolated single-element regulation. General runoff and erosion control measures that reduce peak hydrological connectivity can simultaneously lower the co-transport flux of N and P, while supplementary element-specific measures—including source control to improve N-use efficiency and long-term P surplus limitation—can mitigate their distinct vertical migration risks. Targeting the shared high-risk window during the maize planting stage achieves the most efficient non-point source pollution control for the typical agroecosystem in the Three Gorges Reservoir Area.
4.5. Limitations and Outlook
This study systematically clarifies how rainfall intensity and soil horizon properties synergistically regulate phosphorus transport in purple sloping farmland. The profile-scale synchronous analysis further reveals a continuous vertical phosphorus transport pattern, providing new observational evidence for regional soil phosphorus cycling mechanisms.
Three main limitations should be noted. First, field observations were limited to purple soil sloping farmland, restricting direct generalization to other soil types and land-use scenarios. Second, this work focuses on multi-path phosphorus transport fluxes, while in-depth insights into phosphorus fraction transformation and associated soil microbial community responses during migration remain insufficient. Third, all experiments were conducted at hillslope runoff plot scale, which may constrain accurate extrapolation to larger units such as watersheds. In addition, this in situ multi-factor coupled observation at this scale was not designed to experimentally isolate the independent effect of each individual driver on P transport, so all process-related inferences presented in this study are correlational rather than strictly causal.
Future work will expand observations across more soil types and land-uses and integrate soil microbiology and watershed hydrology to support cross-scale coupling research. These efforts are expected to underpin precise agricultural non-point source pollution management and sustainable regional farmland regulation.
5. Conclusions
This study presents two consecutive years of in situ observational evidence of soil phosphorus vertical migration under maize-mustard rotation on purple sloping farmland in the Three Gorges Reservoir Area, interpreted alongside its paired companion nitrogen study conducted on the identical experimental platform. For both elements, rainfall intensity strongly and positively associates with nutrient export magnitude. Extreme rainstorms, which account for only 6.05% of all rainfall events, contributed 73.26% of total surface P loss, 58.85% of subsurface P leaching, and over 60% of total N migration reported in the companion study. The maize planting stage was identified as the shared high-risk export window, associated with over 78% of annual P load and more than 70% of annual N load.
The two nutrients show divergent profile transport behaviors: particulate phosphorus (PP) dominated surface P loss, accounting for 93.42% of total surface P, while its relative proportion declined to 52.57% in the 40–60 cm deeper layer, making dissolved phosphorus the more mobile fraction in subsoil flow. The observed 83.33% net reduction in downward P flux within the 0–60 cm monitored purple soil profile substantially lowers the P mass load that can potentially migrate into layers below the monitoring depth. In contrast, the companion study documents that nitrate N remained highly mobile and readily transported to deeper layers, making the same subsoil an ineffective barrier for N. Under the studied conditions of sloping purple soil in the Three Gorges Reservoir Area, maize–mustard rotation system and natural rainfall regime, the 0–60 cm soil profile was observed to function as a P transport attenuation zone but a N transport conduit.
The coupled N-P transport pattern becomes fully interpretable only when both datasets are analyzed in combination. The two studies are complementary components of one unified N-P migration system, sharing a common rainfall-associated transport pathway and identical high-risk loss period while differing in vertical transport attenuation performance and therefore should not be treated as fully independent works. This integrated perspective delivers actionable local management guidance: for the maize-mustard rotation on purple sloping farmland in the Three Gorges Reservoir Area, hole-applied phosphorus fertilization combined with organic fertilizer substitution can reduce conventional phosphorus input by 20% without measurable yield loss, lowering phosphorus loss risk and associated non-point source pollution, and provides a low-cost, practical pathway for regional precise farmland nutrient management.
Author Contributions
Y.W.: Conceptualization, Methodology, and Writing—original draft; J.N.: Conceptualization and Methodology; X.H.: Writing—review and editing and Supervision; R.T.: Data curation and Formal analysis; J.Z.: Writing—review and editing and Supervision. All authors have read and agreed to the published version of the manuscript.
Funding
This work was supported by the Natural Science Foundation of Chongqing, China (Grant No. CSTB2023NSCQMSX0436) and the Municipal Special Fund for Scientific Research of Chongqing, China (Grant No. KYLX20250600166 and Grant No. cqaas2023sjczsy011).
Data Availability Statement
The original contributions presented in this study are included in the article. Further inquiries can be directed to the corresponding authors.
Conflicts of Interest
The authors declare no conflicts of interest.
Abbreviations
The following abbreviations are used in this manuscript:
| STN | Soil total nitrogen in soil samples |
| SAN | Soil available nitrogen in soil samples |
| STP | Soil total phosphorus in soil samples |
| SAP | Soil available phosphorus in soil samples |
| STK | Soil total potassium in soil samples |
| SAK | Soil available potassium in soil samples |
| TP | Total phosphorus in runoff samples |
| TDP | Total dissolved phosphorus in runoff samples |
| PO43−-P | Orthophosphate phosphorus in runoff samples |
| PP | Particulate phosphorus in runoff samples |
| TR | Torrential rain |
| HR | Heavy rain |
| MR | Moderate rain |
| LR | Light rain |
| CPS | Maize (corn) planting stage |
| SFS | Summer fallow stage |
| MPS | Mustard planting stage |
| WFS | Winter fallow stage |
References
- Cheng, Y.T.; Li, P.; Xu, G.C.; Wang, X.K.; Li, Z.B.; Cheng, S.D.; Huang, M.S. Effects of dynamic factors of erosion on soil nitrogen and phosphorus loss under freeze-thaw conditions. Geoderma 2021, 390, 114972. [Google Scholar] [CrossRef] [Scilit]
- Hanrahan, B.R.; King, K.W.; Duncan, E.W.; Shedekar, V.S. Cover crops differentially influenced nitrogen and phosphorus loss in tile drainage and surface runoff from agricultural fields in Ohio, USA. J. Environ. Manag. 2021, 293, 112910. [Google Scholar] [CrossRef] [Scilit] [PubMed]
- FAO. Fertilizers Indicators. 2026. Available online: http://www.fao.org/faostat/en/#data/EF/visualize (accessed on 12 May 2026).
- Luo, X.Z.; Elrys, A.S.; Zhang, L.L.; Ibrahim, M.M.; Liu, Y.; Fu, S.L.; Yan, J.H.; Ye, Q.; Wen, D.Z.; Hou, E.Q. The global fate of inorganic phosphorus fertilizers added to terrestrial ecosystems. One Earth 2024, 7, 1402–1413. [Google Scholar] [CrossRef] [Scilit]
- NSB. China Statistical Yearbook 2025; China Statistics Press: Beijing, China, 2026; ISBN 978-7-5230-0799-0. (In Chinese) [Google Scholar]
- Wesstrom, I.; Joel, A.; Messing, I. Controlled drainage and subirrigation: A water management option to reduce non-point source pollution from agricultural land. Agric. Ecosyst. Environ. 2014, 198, 74–82. [Google Scholar] [CrossRef] [Scilit]
- He, S.; Li, F.Y.; Liu, Z.W.; Wang, Z.R.; Wu, S.S.; Zhang, T.Y.; Cao, Y.C.; Liang, X.Q. Retarding effect of migration of colloidal phosphorus in three types of soil (in Chinese with English abstract). J. Zhejiang Univ. (Agric. Life Sci.) 2019, 45, 205–210. [Google Scholar] [CrossRef]
- Schad, P. World Reference Base for Soil Resources—Its fourth edition and its history. J. Plant Nutr. Soil Sci. 2023, 186, 481–489. [Google Scholar] [CrossRef] [Scilit]
- Wang, M.; Pendall, E.; Fang, C.M.; Li, B.; Nie, M. A global perspective on agroecosystem nitrogen cycles after returning crop residue. Agric. Ecosyst. Environ. 2018, 266, 49–54. [Google Scholar] [CrossRef] [Scilit]
- MEP. Ecological and Environmental Monitoring of the Yangtze Three Gorges Project Bulletin 2018; Ministry of Environmental Protection, PRC: Beijing, China, 2020. Available online: http://english.mee.gov.cn/Resources/Reports/ (accessed on 6 May 2026).
- Li, H.Y.; Wang, S.C.; Gao, M.N.; Xia, L.Z.; Han, Q.Z.; Wang, Q.L.; Wu, Y.L. Leaching is the main pathway of nitrogen and phosphorus losses for citrus orchards with sandy soil in Three Gorges Reservoir area. Acta Pedol. Sin. 2022, 59, 1078–1088. [Google Scholar] [CrossRef]
- Plach, J.M.; Macrae, M.L.; Ali, G.A.; Brunke, R.R.; English, M.C.; Ferguson, G.; Lam, W.V.; Lozier, T.M.; McKague, K.; O’Halloran, I.P.; et al. Supply and Transport Limitations on Phosphorus Losses from Agricultural Fields in the Lower Great Lakes Region, Canada. J. Environ. Qual. 2018, 47, 96–105. [Google Scholar] [CrossRef] [Scilit] [PubMed]
- Hua, K.K.; Zhu, B. Phosphorus loss through surface runoff and leaching in response to the long-term application of different organic amendments on sloping croplands. J. Soils Sediments 2020, 20, 3459–3471. [Google Scholar] [CrossRef] [Scilit]
- Cameron, K.C.; Di, H.J.; Moir, J.L. Nitrogen losses from the soil/plant system: A review. Ann. Appl. Biol. 2013, 162, 145–173. [Google Scholar] [CrossRef] [Scilit]
- Bah, H.D.; Zhou, M.H.; Ren, X.; Hu, L.; Dong, Z.X.; Zhu, B. Effects of organic amendment applications on nitrogen and phosphorus losses from sloping cropland in the upper Yangtze River. Agric. Ecosyst. Environ. 2020, 302, 107086. [Google Scholar] [CrossRef] [Scilit]
- Chen, A.; Arai, Y. Current uncertainties in assessing the colloidal phosphorus loss from soil. Adv. Agron. 2020, 163, 117–151. [Google Scholar] [CrossRef] [Scilit]
- McDowell, R.W.; Norris, M.; Cox, N. Using the provenance of sediment and bioavailable phosphorus to help mitigate water quality impact in an agricultural catchment. J. Environ. Qual. 2016, 45, 1276–1285. [Google Scholar] [CrossRef] [Scilit] [PubMed]
- Pisani, O.; Liebert, D.; Bosch, D.D.; Coffin, A.W.; Endale, D.M.; Potter, T.L.; Strickland, T.C. Element losses from fields in conventional and conservation tillage in the Atlantic Coastal Plain, Georgia, United States. J. Soil Water Conserv. 2020, 75, 376–386. [Google Scholar] [CrossRef] [Scilit]
- Deng, L.Z.; Fei, K.; Sun, T.Y.; Zhang, L.P.; Fan, X.J.; Wu, Y.H.; Ni, L. Characteristics of phosphorus loss from the weathered granite slopes of Southeast China. Pol. J. Environ. Stud. 2020, 29, 2139–2150. [Google Scholar] [CrossRef] [Scilit] [PubMed]
- Li, J.M.; Tong, X.X.; Ding, W.F.; Pu, J.; Ren, H.Y.; Sun, B.Y.; Zhang, C.W.; Ran, W.J.; Xu, W.S.; Liu, J.G. Runoff-sediment interactions on purple soil sloping farmland in the Three Gorges Reservoir Area: Responses to different land use types and rainfall regimes. J. Hydrol. Reg. Stud. 2026, 64, 103266. [Google Scholar] [CrossRef] [Scilit]
- Wang, Y.; Ni, J.P.; Hang, X.N.; Yang, X.T.; Liao, D.X.; Xie, D.T. Vertical Migration Characteristics and Driving Mechanisms of Soil Nitrogen in Sloped Croplands of Purple Soil Regions. Agriculture 2026, 16, 1241. [Google Scholar] [CrossRef] [Scilit]
- Wang, Y.; Ni, J.P.; Ni, C.S.; Wang, S.; Xie, D.T. Effect of natural rainfall on the migration characteristics of runoff and sediment on purple soil sloping cropland during different planting stages. J. Water Clim. Change 2021, 12, 3064–3081. [Google Scholar] [CrossRef] [Scilit]
- Huang, R.; Gao, X.S.; Wang, F.H.; Xu, G.X.; Long, Y.; Wang, C.Q.; Wang, Z.F.; Gao, M. Effects of biochar incorporation and fertilizations on nitrogen and phosphorus losses through surface and subsurface flows in a sloping farmland of Entisol. Agric. Ecosyst. Environ. 2020, 300, 106988. [Google Scholar] [CrossRef] [Scilit]
- Wang, Y.; Chen, F.X.; Zhao, H.; Xie, D.T.; Ni, J.P.; Liao, D.X. Characteristics of agricultural phosphorus migration in different soil layers on purple soil sloping cropland under natural rainfall conditions. Front. Environ. Sci. 2023, 11, 1230565. [Google Scholar] [CrossRef] [Scilit]
- Xiao, H.B.; Chen, Y.P.; Hu, T.Z.; Hu, R.G. Rainfall patterns and catchment characteristics interactively regulate nitrogen and phosphorus dynamics in agricultural ponds. Catena 2026, 265, 109895. [Google Scholar] [CrossRef] [Scilit]
- Zhou, A.Q.; Yuan, C.X. Global warming intensifies once-in-a-decade extreme precipitation in summer in China. Atmos. Ocean. Sci. Lett. 2025, 18, 100561. [Google Scholar] [CrossRef] [Scilit]
- Ilampooranan, I.; Van Meter, K.J.; Basu, N.B. Intensive agriculture, nitrogen legacies, and water quality: Intersections and implications. Environ. Res. Lett. 2022, 17, 035006. [Google Scholar] [CrossRef] [Scilit]
- Gedle, A.; Rientjes, T.; Haile, A.T.; Mekuria, W.; Hallett, P.; Smith, J. Responses of surface runoff and soil water-erosion to changes in seasonal land cover and rainfall intensity; the case of Shilansha watershed, Rift Valley Basin of Ethiopia. J. Hydrol. Reg. Stud. 2025, 58, 102289. [Google Scholar] [CrossRef] [Scilit]
- Zhu, B.; Wang, Z.H.; Zhang, X.B. Phosphorus fractions and release potential of ditch sediments from different land uses in a small catchment of the upper Yangtze River. J. Soils Sediments 2011, 12, 278–290. [Google Scholar] [CrossRef] [Scilit]
- McDowell, R.; Sharpley, A.; Brookes, P.; Poulton, P. Relationship between soil test phosphorus and phosphorus release to solution. Soil Sci. 2001, 166, 137–149. [Google Scholar] [CrossRef] [Scilit]
- Xie, D.T.; Ni, J.P.; Ding, E.J. Study on Control Technology of Agricultural Non-Point Source Pollution in Three Gorges Reservoir Area; Science Press: Beijing, China, 2014; pp. 64–130. ISBN 978-7-03-042100-5. (In Chinese) [Google Scholar]
- Gachter, R.; Steingruber, S.M.; Reinhardt, M.; Wehrli, B. Nutrient transfer from soil to surface waters: Differences between nitrate and phosphate. Aquat. Sci. 2004, 66, 117–122. [Google Scholar] [CrossRef] [Scilit]
- Brock, E.H.; Ketterings, Q.M.; Kleinman, P.J.A. Phosphorus leaching through intact soil cores as influenced by type and duration of manure application. Nutr. Cycl. Agroecosyst. 2007, 77, 269–281. [Google Scholar] [CrossRef] [Scilit]
- Makowski, V.; Julich, S.; Feger, K.H.; Julich, D. Soil phosphorus translocation via preferential flow pathways: A comparison of two sites with different phosphorus stocks. Front. Glob. Change 2020, 3, 48. [Google Scholar] [CrossRef] [Scilit]
- Gachter, R.; Ngatiah, J.M.; Stamm, C. Transport of phosphate from soil to surface waters by preferential flow. Environ. Sci. Technol. 1998, 32, 1865–1869. [Google Scholar] [CrossRef] [Scilit]
- Stamm, C.; Fluhler, H.; Gachter, R.; Leuenberger, J.; Wunderli, H. Preferential transport of phosphorus in drained grassland soils. J. Environ. Qual. 1998, 27, 515–522. [Google Scholar] [CrossRef] [Scilit]
- Bechmann, M.; Greipsland, I.; Ogaard, A.F. Implementation of Mitigation Measures to Reduce Phosphorus Losses: The Vestre Vansjo Pilot Catchment. Agriculture 2019, 9, 15. [Google Scholar] [CrossRef] [Scilit]
- González Jiménez, J.L.; Daly, K.; Roberts, W.M.; Healy, M.G. Split phosphorus fertiliser applications as a strategy to reduce incidental phosphorus losses in surface runoff. J. Environ. Manag. 2019, 242, 114–120. [Google Scholar] [CrossRef] [Scilit] [PubMed]

Disclaimer/Publisher’s Note: The statements, opinions and data contained in all publications are solely those of the individual author(s) and contributor(s) and not of MDPI and/or the editor(s). MDPI and/or the editor(s) disclaim responsibility for any injury to people or property resulting from any ideas, methods, instructions or products referred to in the content. |
© 2026 by the authors. Licensee MDPI, Basel, Switzerland. This article is an open access article distributed under the terms and conditions of the Creative Commons Attribution (CC BY) license.