


Abstract
Mechanized rice transplanting is a key method for large-scale cultivation. To enable rapid, accurate seedling detection and evaluate rice transplanting quality, this paper proposes an improved YOLOv12n model, YOLOv12n-SCA. First, this study embeds SCA hybrid attention modules into the YOLOv12n backbone and neck networks, integrating the advantages of SCSA (Spatial and Channel Synergistic Attention) and CA (Coordinate Attention) modules to enhance the model’s ability to extract and locate seedling features against complex paddy field backgrounds. Second, clustering analysis and a plant-spacing discrimination rule, based on seedling detection coordinates, automatically identify areas with missed transplanted seedlings. Experimental results show that the YOLOv12n-SCA model achieved precision, recall, mAP@0.5, and mAP@0.5:0.95 of 93.6%, 90.3%, 95.3%, and 79.8%, respectively, with overall performance superior to that of the original YOLOv12n and single-attention-based improved models. In experiments on an independent dataset, the detection algorithm for rice seedlings in missed transplants achieved 82.34% accuracy and a counting error of 2.06%, indicating that it can effectively identify rice seedling locations and provide quality assessment results. These results show that YOLOv12n-SCA can support intelligent rice seedling detection, rice transplant quality evaluation, and smart field management in complex rice paddy environments.
1. Introduction
Rice is one of the most important crops, providing a stable food source for more than half of the world’s population [1]. In 2024, global rice production was approximately 523.8 million metric tons, with a cultivated area of approximately 168 million hectares [2]. In recent years, with the ongoing advancement of agricultural modernization, mechanized rice planting technologies have been widely adopted [3]. Among these, rice transplanters-with their advantages of high efficiency and cost savings-have effectively addressed prominent issues such as labor shortages and low production efficiency associated with traditional manual transplanting methods, and have become the mainstream method for large-scale rice production [4]. However, during actual field operations, due to the combined effects of multiple factors-including the complex topography of paddy fields, soil heterogeneity, the stability of agricultural machinery, and variations in operator skill levels-rice transplanters are prone to quality defects such as missed transplants, lodging seedlings, damaged seedlings, and uneven plant-to-row spacing [5]. These issues directly result in insufficient basic plant density and an imbalanced plant population structure, thereby limiting improvements in rice yield and quality [6]. At the same time, traditional quality inspection of rice transplanting operations largely relies on manual field sampling surveys, which suffer from drawbacks such as high labor intensity, low inspection efficiency, strong subjectivity, and poor timeliness, making it difficult to meet the demands of modern agricultural production for real-time, precise assessment of transplanting quality. Combining UAV imagery with deep learning offers an efficient, non-destructive approach to assessing rice transplanting quality. UAVs capture field-scale seedling distributions, while deep learning models extract features and identify targets to support quality assessment and field management [7]. Rapid and accurate assessment methods are therefore relevant to precision rice cultivation [8].
UAV-based collection and inspection of rice seedling images primarily rely on computer vision. Spectral feature analysis is commonly used for plant classification and identification [9] and can distinguish characteristics of seeds, leaves, and entire crops [10]. For example, Tan et al. proposed the DeepBGS hyperspectral feature analysis framework, which achieved 98.18% accuracy in identifying barnyard grass at the 2–3-leaf stage, validating the feasibility of hyperspectral imaging for early barnyard grass detection [11]. Similarly, Tsuchiya et al. attempted to integrate synthetic aperture radar (SAR) and optical imagery for crop classification [12]. However, spectral detection methods have significant drawbacks: high equipment costs, large amounts of redundant data, low field data-collection efficiency, and susceptibility to environmental disturbances, such as lighting conditions and muddy water in paddy fields [13]. Additionally, the models lack interpretability, making it difficult to scale them for widespread application [14]. In contrast, computer vision analyzes standard RGB imagery captured by UAVs, offering lower equipment costs, simpler operation, and greater adaptability. It better meets the practical needs of precision agriculture for rapid, accurate, and non-destructive detection. Therefore, this study adopts a technical approach that combines UAV imagery with computer vision.
In recent years, deep learning has been widely applied in agricultural engineering, particularly to image classification, object detection, and crop growth assessment [15]. By automatically learning image features, it supports yield estimation [16], pest and disease detection [17], weed identification [18], and crop growth monitoring [19]. Traditional approaches typically combine manually designed color or texture features with classifiers such as random forests or support vector machines. Using UAV imagery, Tseng et al. found that CNN-based models, including EfficientDet-D0, outperformed HOG-SVM in both rice seedling detection accuracy and speed [20].
Among deep learning models, the YOLO series has been widely used in agricultural remote sensing recognition using UAVs because it balances detection accuracy and inference speed. Specifically, Gan et al. achieved precise detection of rice seedling rows by combining the semi-supervised semantic segmentation framework Unimatch with region labeling, enabling quantitative evaluation of rice transplanters’ operational quality [21]. Luo et al., focusing on rice transplanting quality, developed an improved YOLOv8n model to enable intelligent detection of missing seedlings and skipped transplants in the field, thereby providing data support for unmanned farmland management [22]. Chen et al. utilized the YOLO algorithm to identify and count rice seedlings in UAV remote sensing imagery [23]. Together, these studies show that UAV-based models can support the evaluation of rice transplanting quality by detecting, counting, and assessing seedling conditions using field seedling-row and column patterns [24]. Moreover, UAV aerial photography can reliably capture and record the trajectories of seedling rows [25]. Agricultural machinery operation quality is often quantified using statistical indicators such as the mean, standard deviation, and root mean square error, providing a well-established framework for quantitative analysis of rice transplanter performance [26].
Most of the above studies have focused on improving seedling-recognition accuracy, evaluating the planting quality of rice transplanters based on seedling-row shape, or using remote sensing images for recognition [27]. Few studies have used UAV-based seedling image recognition to specifically locate gaps in seedling rows to assess field planting quality. Therefore, this study employs an improved lightweight YOLOv12n model to identify seedling status in UAV images and uses a clustering-based mathematical model to detect missing seedlings in seedling rows, thereby constructing a comprehensive and stable detection system that spans seedling recognition, gap detection, and planting-quality evaluation in farm fields.
To improve seedling detection and support gap localization, this paper incorporated SCA modules into the YOLOv12n backbone and neck, along with cross-layer feature fusion to combine deep semantic information with shallow spatial details. The main contributions are summarized as follows.
(1) A UAV-based rice seedling dataset with 5813 annotated images was built under real paddy-field conditions. Data augmentation increased sample diversity and model generalization.
(2) A hybrid attention module (SCA) integrating SCSA and CA was introduced to enhance spatial, channel, and positional feature representation, suppress background interference, and improve detection of qualified and lodging seedlings.
(3) To strengthen multiscale seedling representation while preserving lightweight characteristics, a multilevel feature enhancement strategy was developed by embedding SCA modules into the backbone and neck of YOLOv12n and combining them with cross-layer feature fusion.
(4) A two-stage transplanting quality assessment method was established that combines seedling detection, row clustering, and spacing-based missing-seedling identification. Using this framework, YOLOv12n-SCA achieved 93.6% precision, 90.3% recall, 95.3% mAP@0.5, and 79.8% mAP@0.5:0.95, outperforming the baseline and existing rice seedling detection methods.
2. Materials and Methods
2.1. Image Acquisition
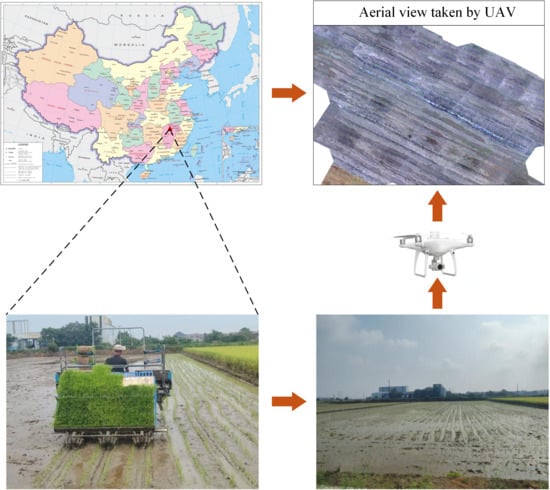
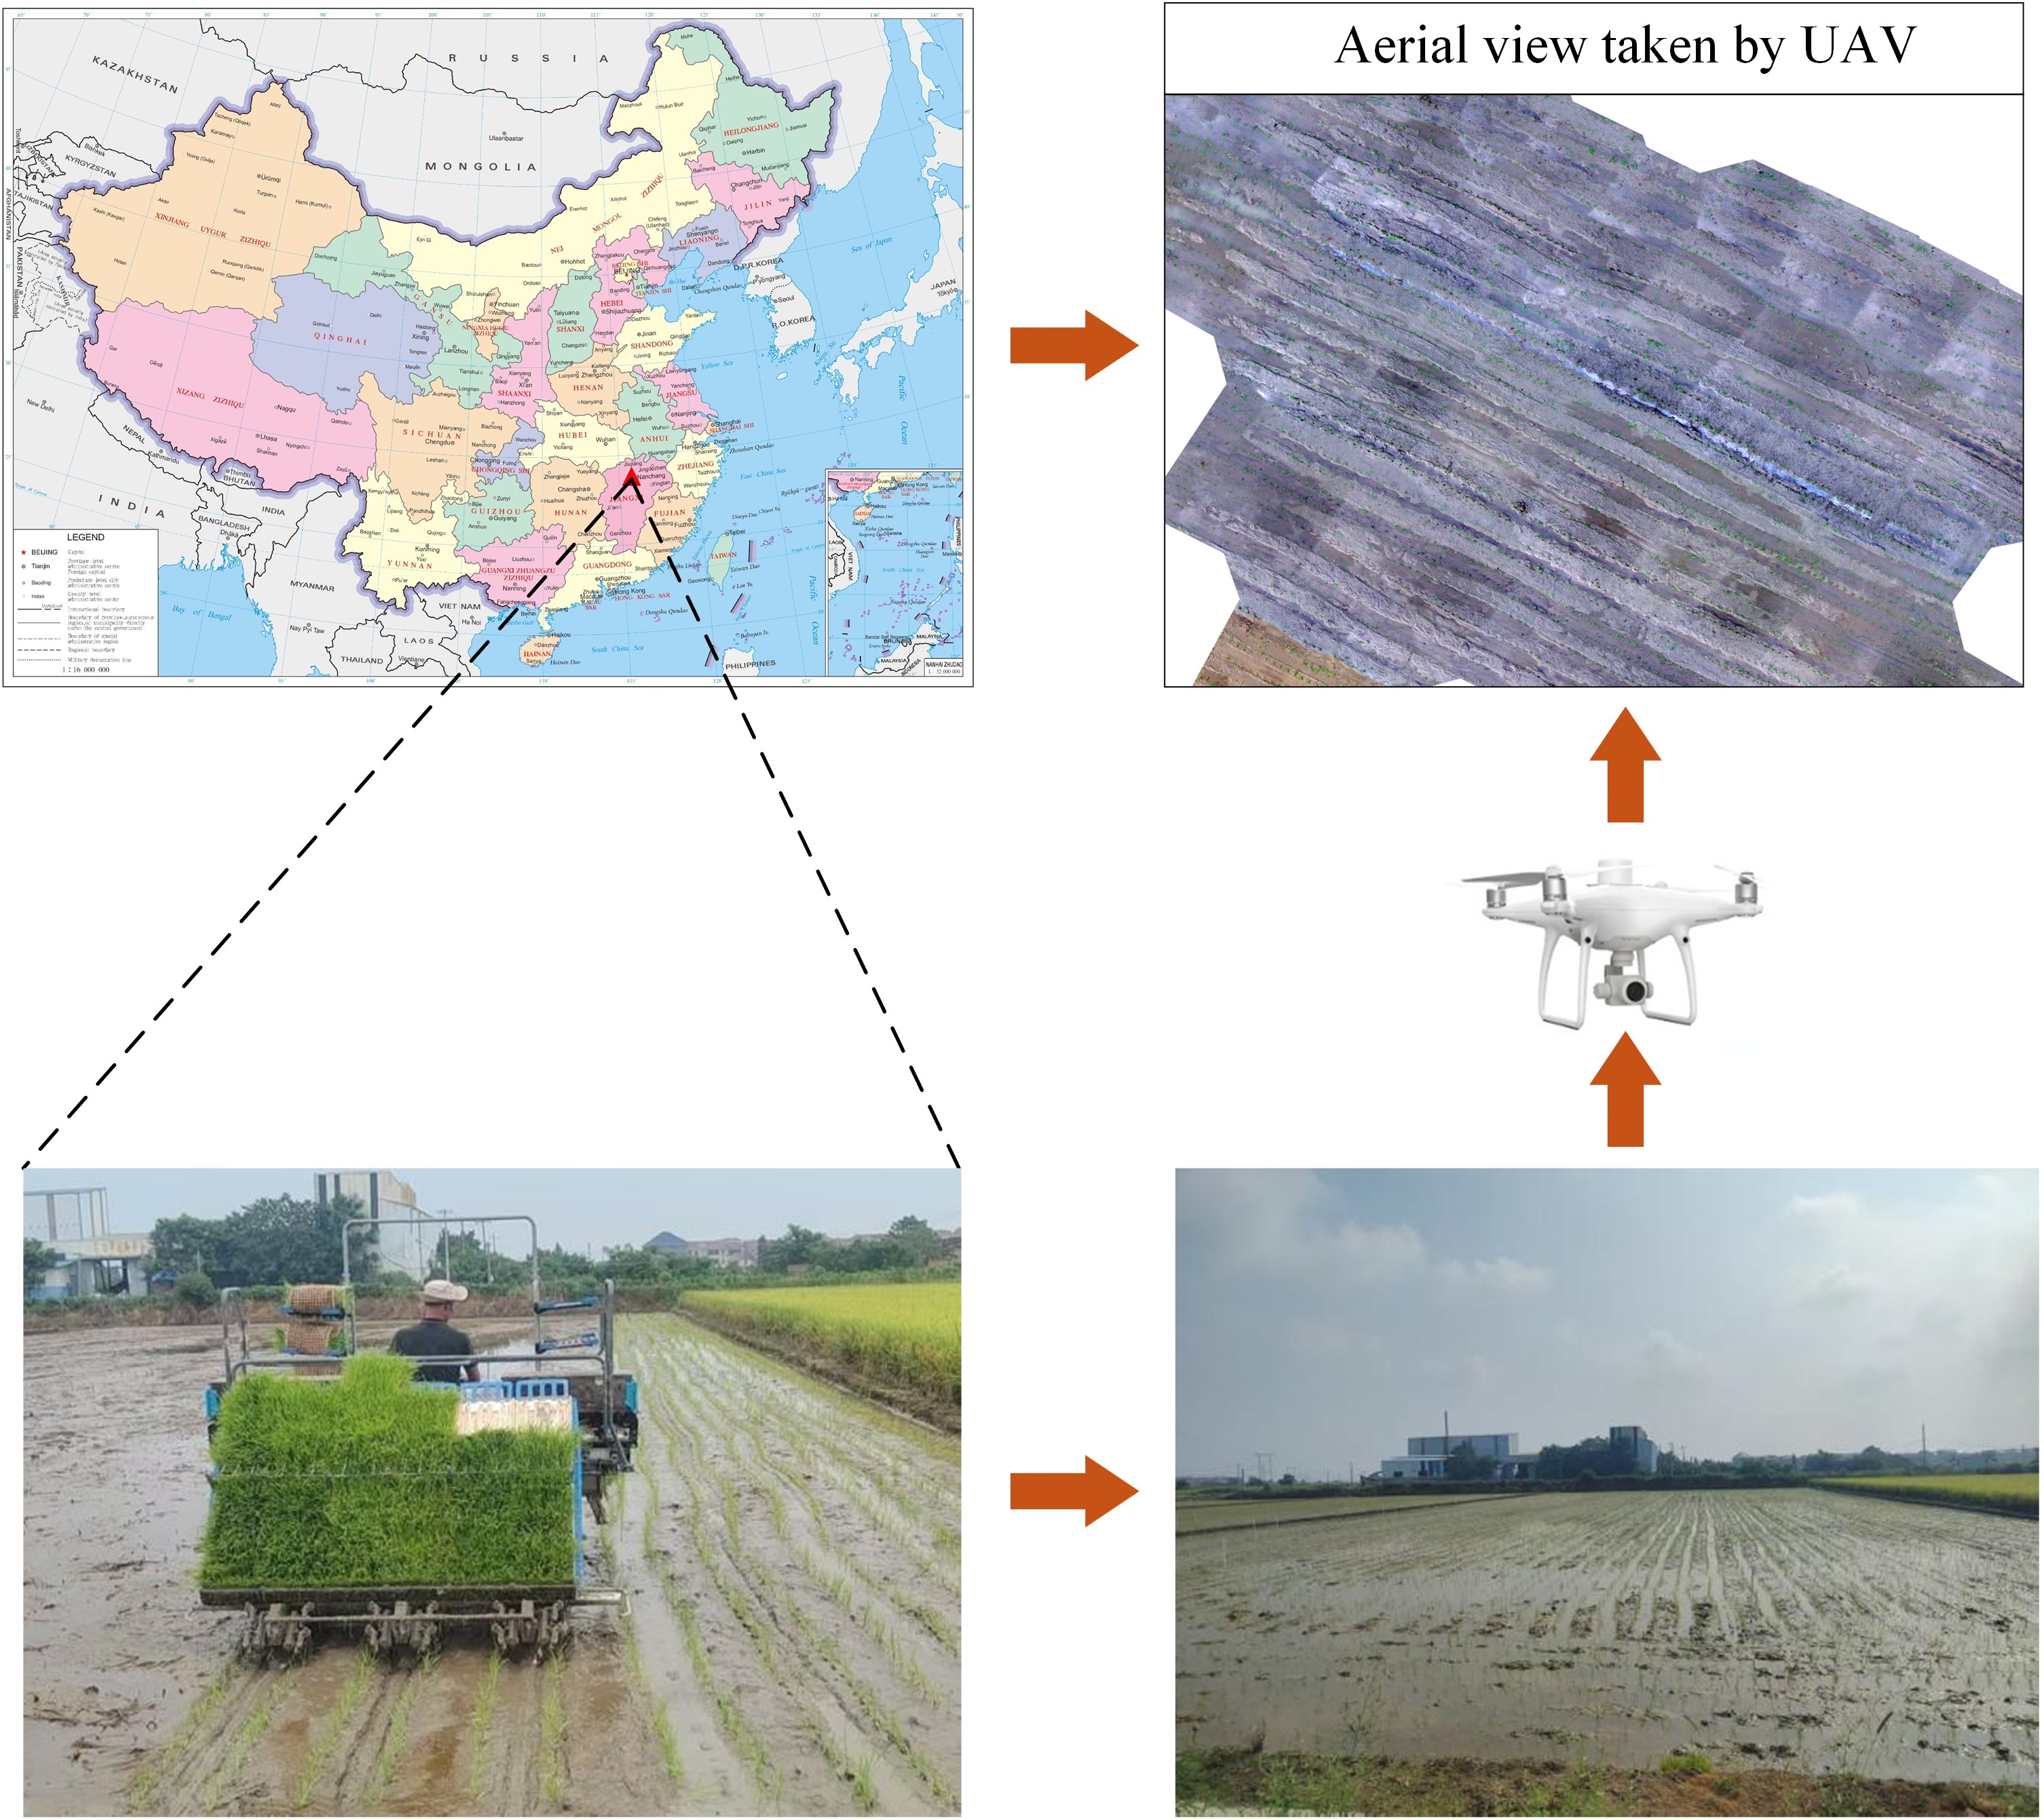
The study area for this experiment is Zhifei Family Farm in Dayangzhou, Xin’gan County, Ji’an City, Jiangxi Province, China (27°56′11.86″ N, 115°28′42.57″ E). This region has a typical subtropical monsoon climate that supports agriculture and mechanized rice cultivation, making it suitable for collecting a representative dataset.
As shown in Figure 1, the rice seedlings were transplanted in rows using a rice transplanter, with 65 cm between rows, 15 cm between plants, and a planting depth of 3–5 cm. Image acquisition was conducted on 10 June 2025, using a Phantom 4-RTK UAV (Shenzhen DJI Innovation Technology Co., Ltd., Shenzhen, China). The UAV was flown at 2.5 m, and the camera was configured for top-down shooting. Under clear weather conditions with no rain or wind, images were acquired between 10:00 and 12:00 local time to cover the dynamic range of light intensity. Images were saved as JPGs at 5472 × 3648 pixels, with ISO fixed at 100. The UAV’s exposure parameters are automatically adjusted according to lighting conditions.
Figure 1.
Data acquisition.
2.2. Data Construction and Preprocessing
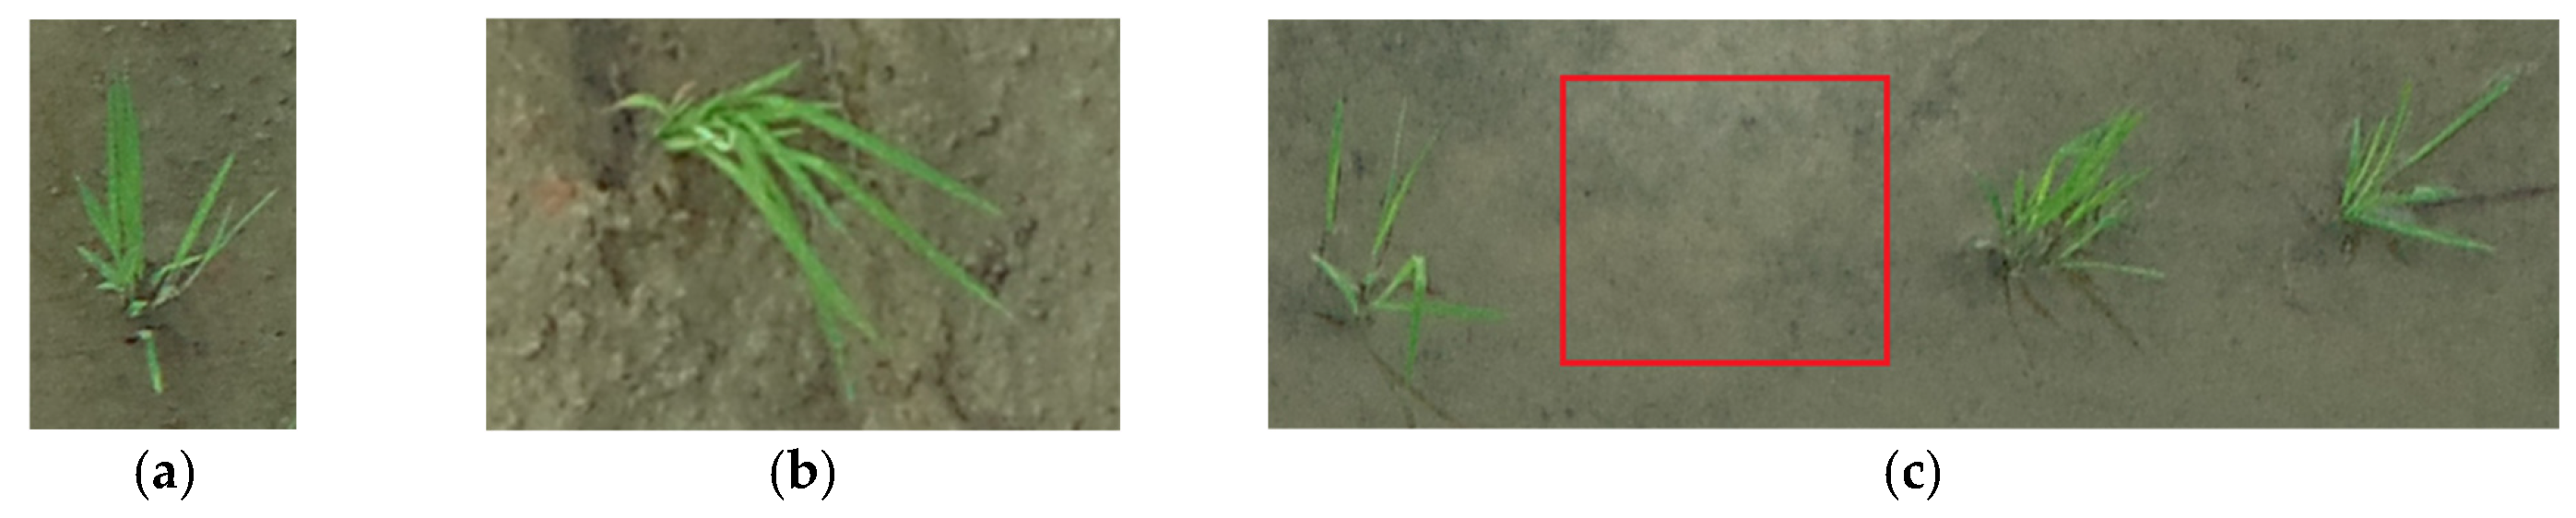
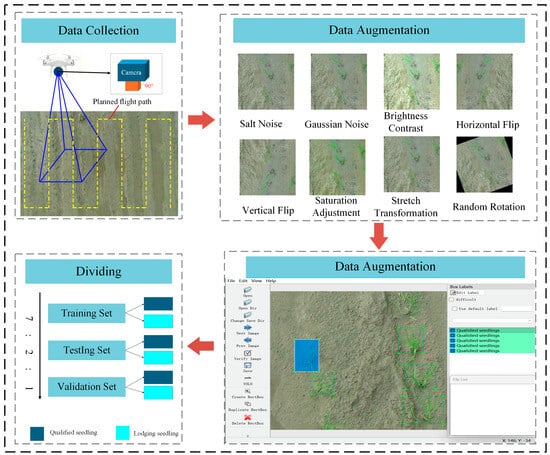
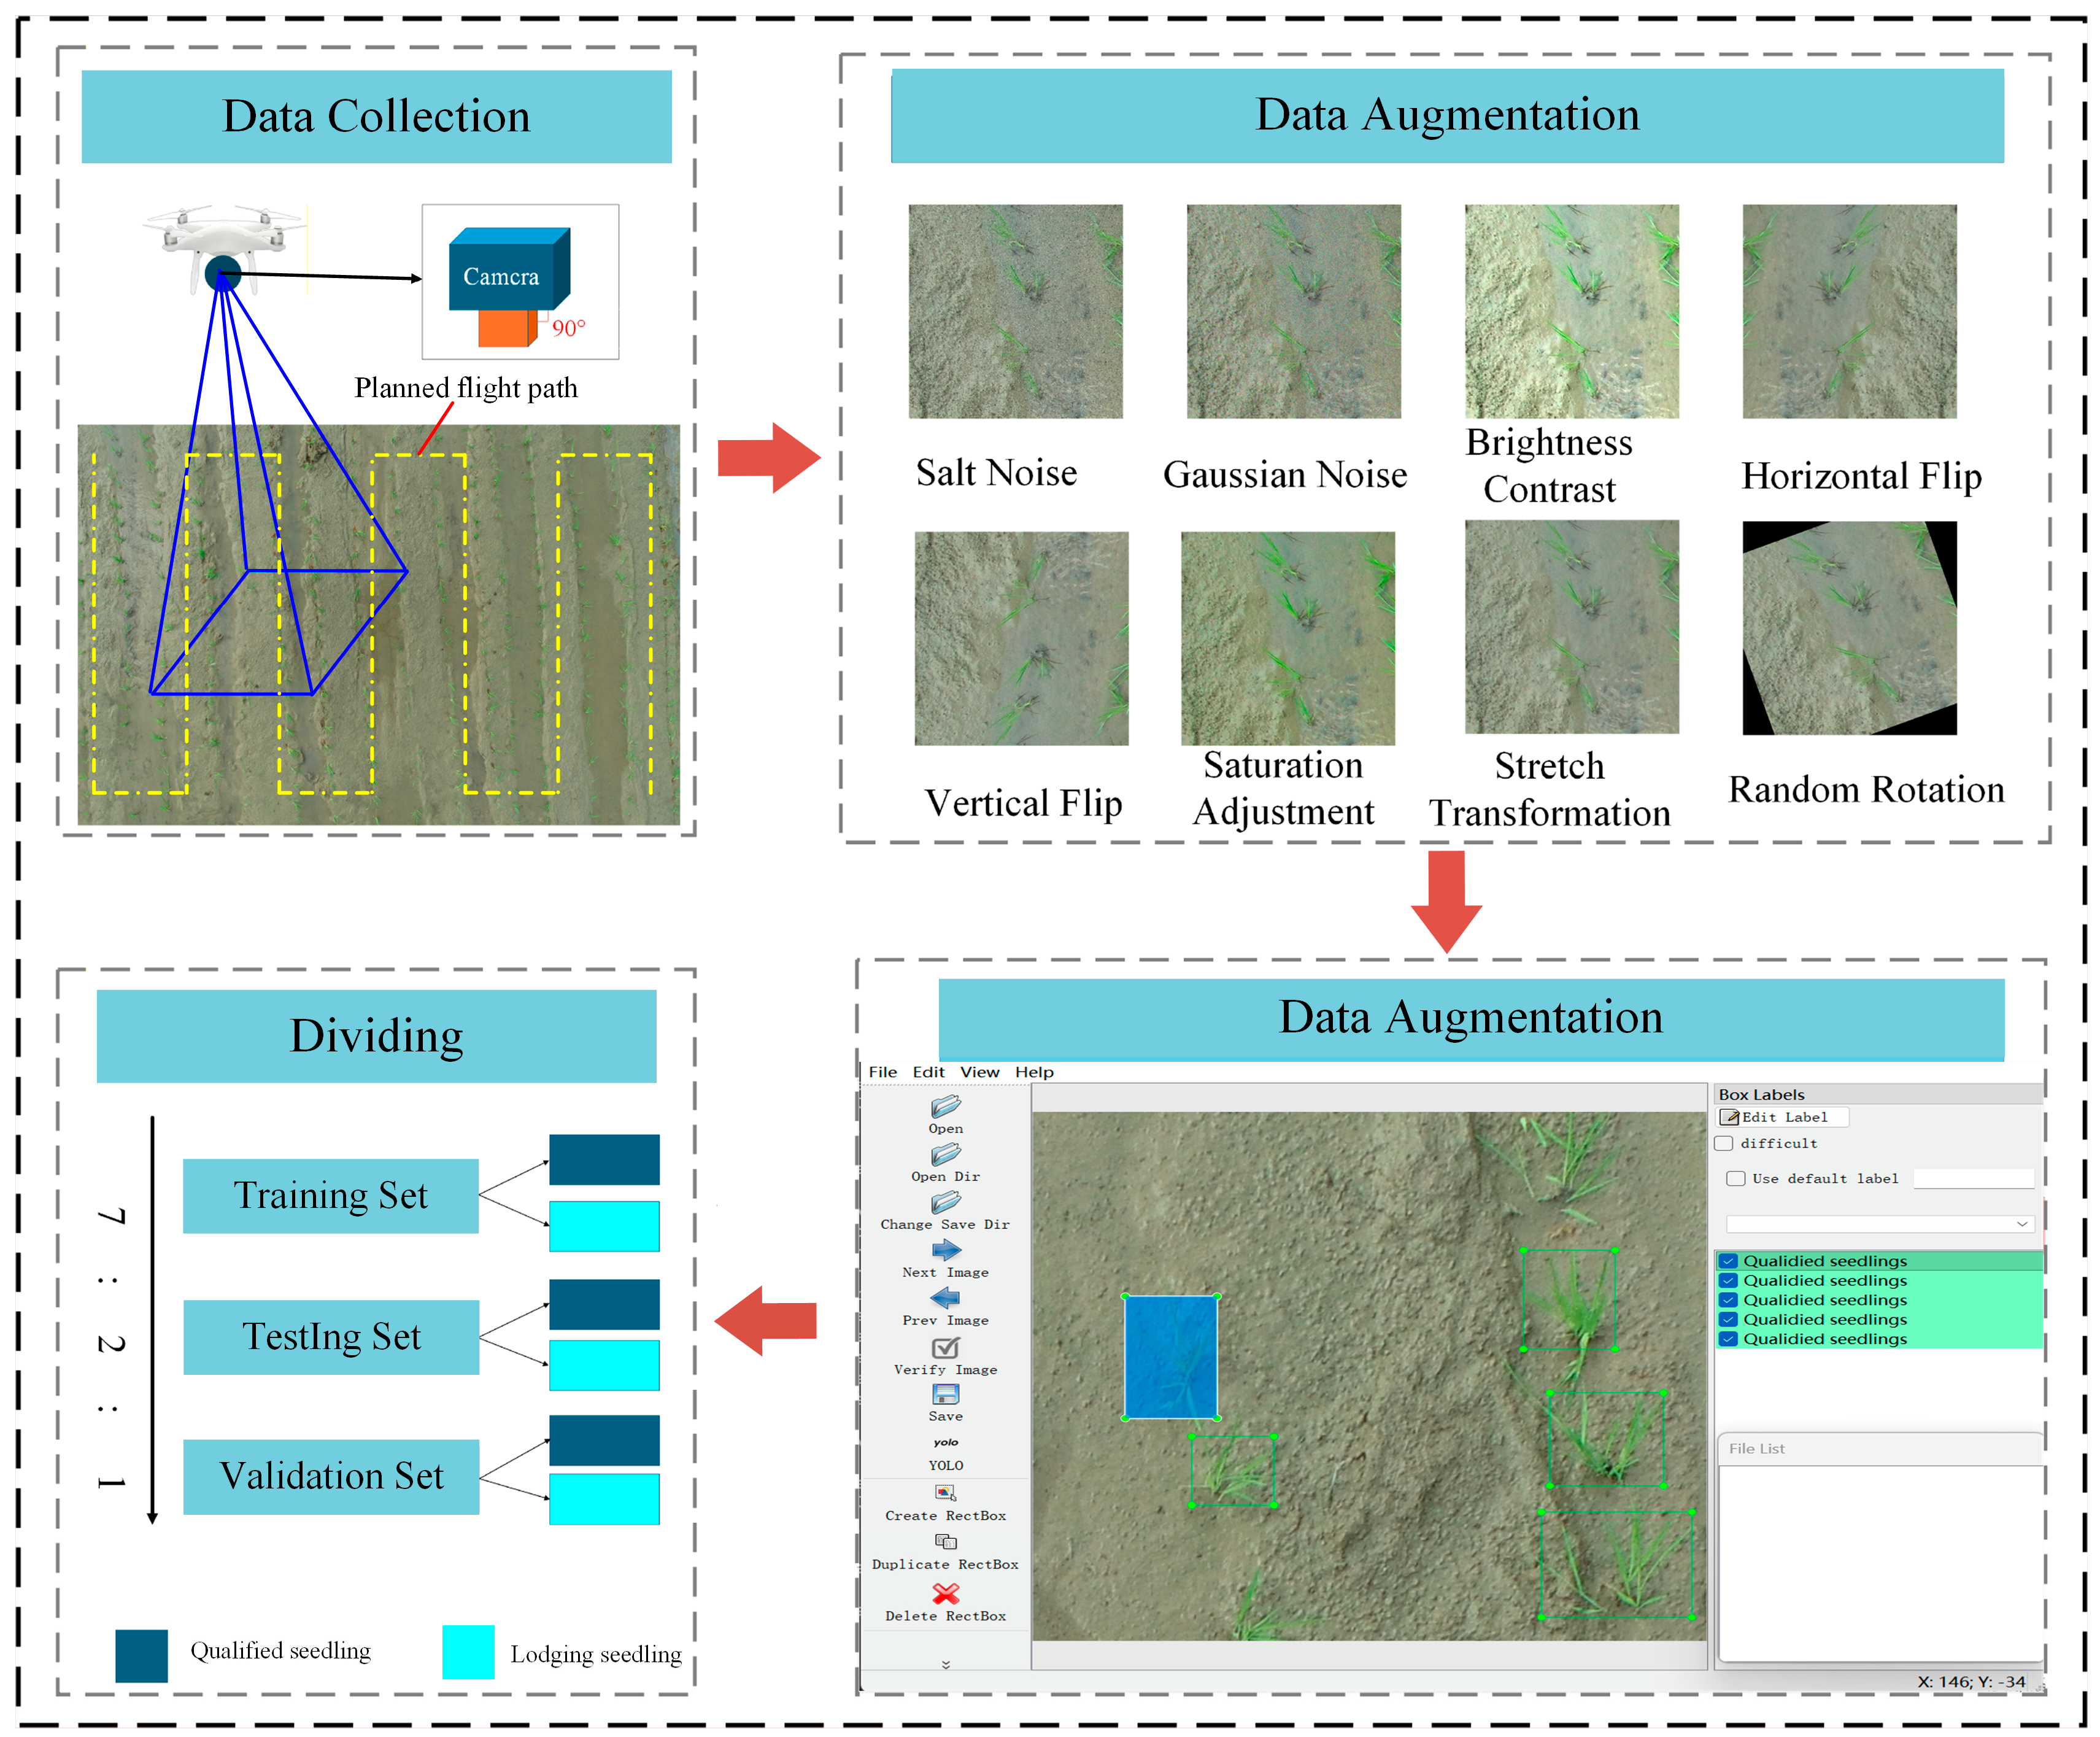
The UAV flies along a predetermined route at 3 m/s to collect data, with minimal, nearly negligible overlap. This ensures complete data overlap across the farmland and prevents data leakage. As shown in Figure 2, the collected dataset is categorized into three types: qualified seedlings, lodging seedlings, and areas with missed transplants.
Figure 2.
Sample presentation: (a) qualified seedlings, (b) lodging seedlings, and (c) areas with missed transplants.
After image acquisition, DJI Terra software (v5.1.1) registered and stitched the UAV images, producing continuous, complete orthophotos of the rice paddies. As shown in Figure 3, image preprocessing crops the original image using a fixed-size 640 × 640-pixel window. Cropping begins at the top-left corner and proceeds in a preset incremental sequence. When the remaining edge area is smaller than the window size, that portion of the image is discarded to ensure that the dataset is not compromised.
Figure 3.
Data processing flow.
To improve sample diversity and the model’s stability and generalization in complex field environments, eight data augmentation operations were applied to the cropped images: salt-and-pepper noise, Gaussian noise, brightness and contrast adjustments, horizontal and vertical flipping, saturation adjustments, stretching, and random rotation. Salt-and-pepper noise and Gaussian noise simulated random interference during image acquisition. Brightness, contrast, and saturation adjustments enhanced the model’s adaptability to varying lighting conditions and water-surface reflections. Horizontal and vertical flipping, stretching, and random rotation further enriched the distribution characteristics of seedlings in orientation, scale, and morphology. The various data augmentation methods are shown in Figure 3, along with their processing results.
Images were annotated using LabelImg (v1.8.6) (https://github.com/HumanSignal/labelImg, accessed on 2 March 2026), with qualified and lodging seedlings as the two detection classes; missing-seedling areas were not annotated. Class definitions were established before annotation. Personnel familiar with field conditions performed the initial labeling, and additional annotators checked for incorrect labels, omissions, and class inconsistencies. Images with blur or indistinguishable seedlings were excluded. The annotations were converted to YOLO-format TXT files, and the normalized bounding box coordinates were checked for consistency. Multiple review rounds were used to reduce annotation errors. The drones collected a total of 3998 raw images. These images were processed through image registration and stitching to generate orthophotos, which were then cropped using a fixed window (640 × 640), resulting in a total of 5813 images. These images were manually annotated and divided into a 7:2:1 ratio to form the final dataset for model training, testing, and validation. An analysis of the class distributions for each subset yielded the results shown in Table 1.
Table 1.
Statistics of dataset subsets.
2.3. YOLOv12n Module
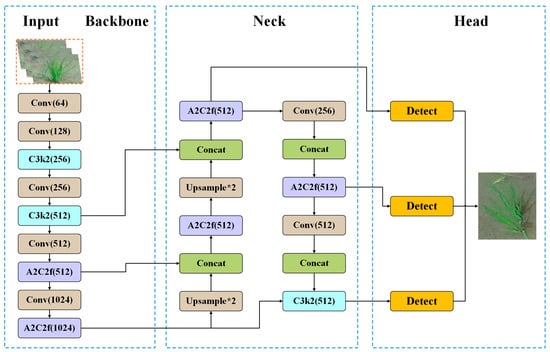
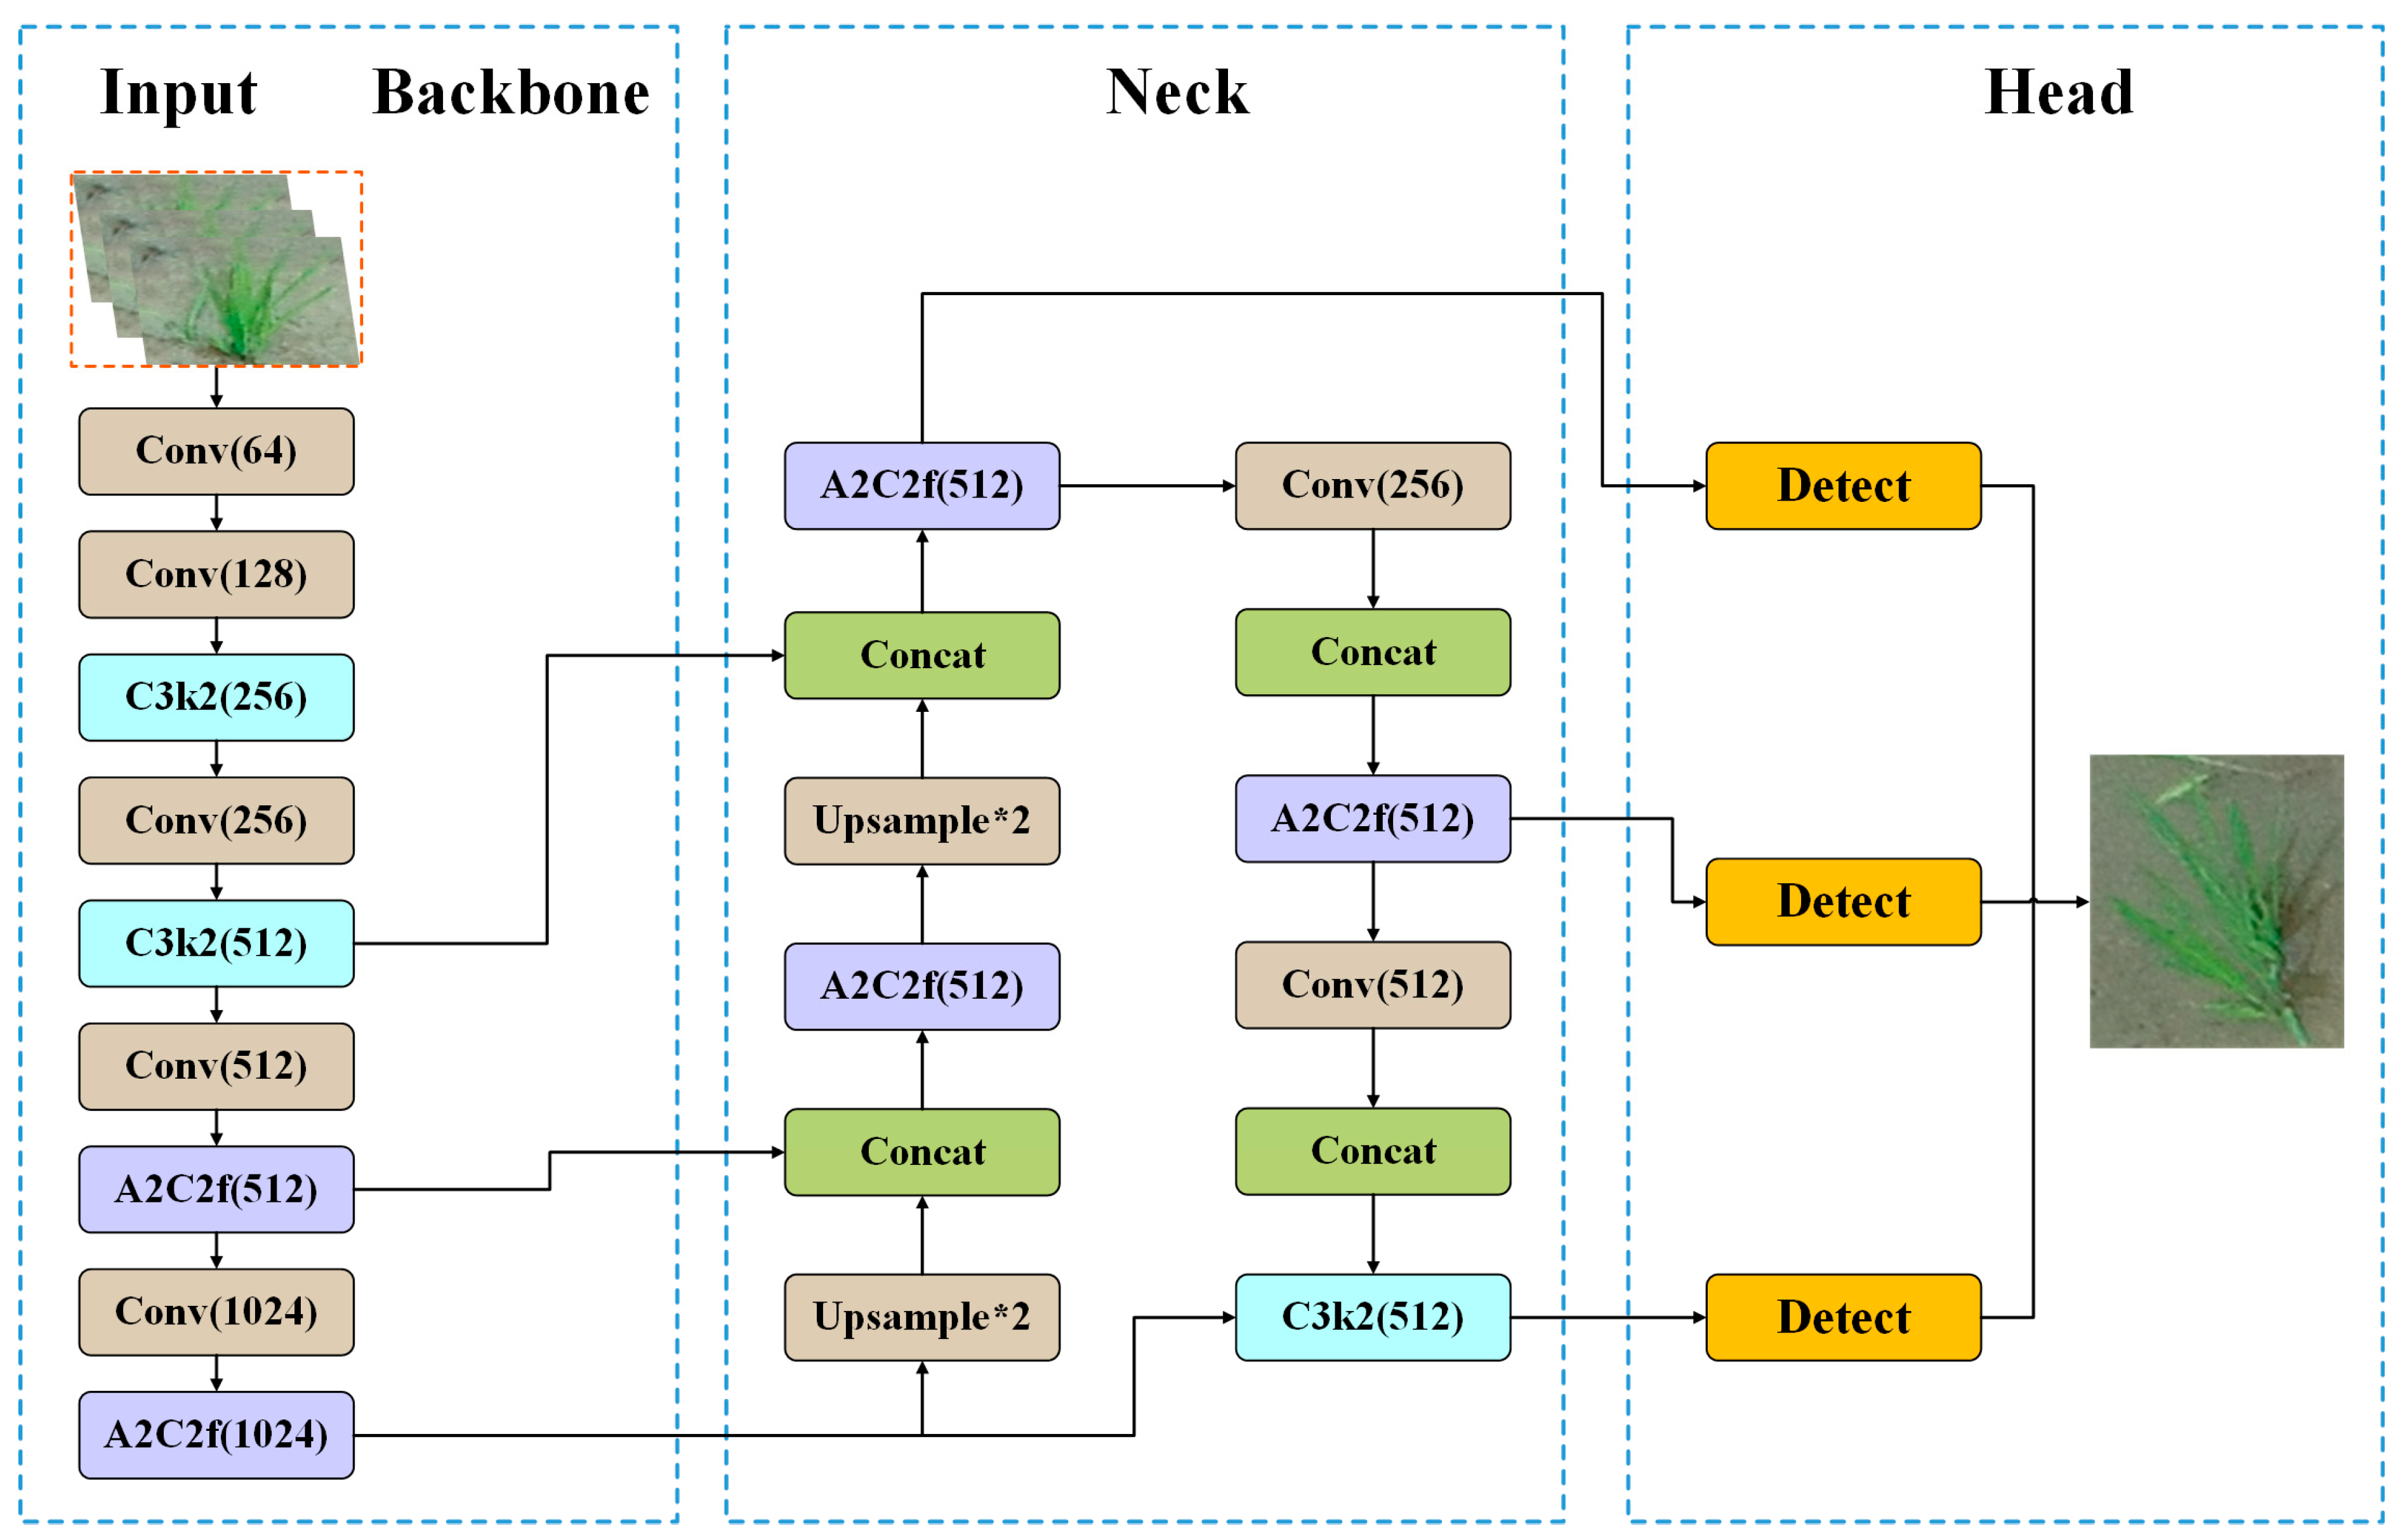
To achieve accurate and efficient detection of the operational quality of rice transplanters, this study selected the lightweight YOLOv12n as the baseline detection framework. The model introduces an attention-centered architecture that departs from the CNN-based approach of earlier YOLO versions, improving detection accuracy and speed on complex tasks while remaining lightweight [28]. It integrates a lightweight Area Attention (A2) module, an enhanced backbone based on the Residual Efficient Layer Aggregation Network (R-ELAN), and integrated Flash Attention, which together sustain detection speeds comparable to those of earlier purely convolutional models [29].
These components broaden spatial coverage and improve memory efficiency, resulting in a more expressive and computationally optimized framework [30]. As shown in Figure 4, YOLOv12 operates across five scales (N, S, M, L, and X) with a unified multi-task head, supporting detection, segmentation, and keypoint localization within a coherent design [31].
Figure 4.
YOLOv12n model architecture.
2.4. Improved YOLOv12n Model
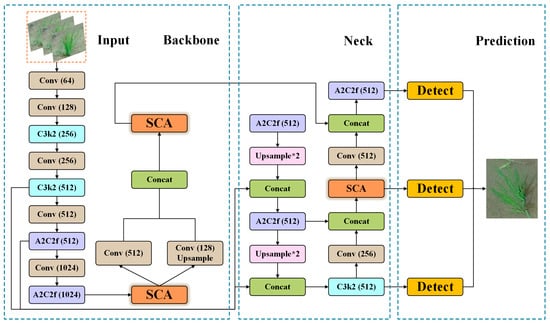
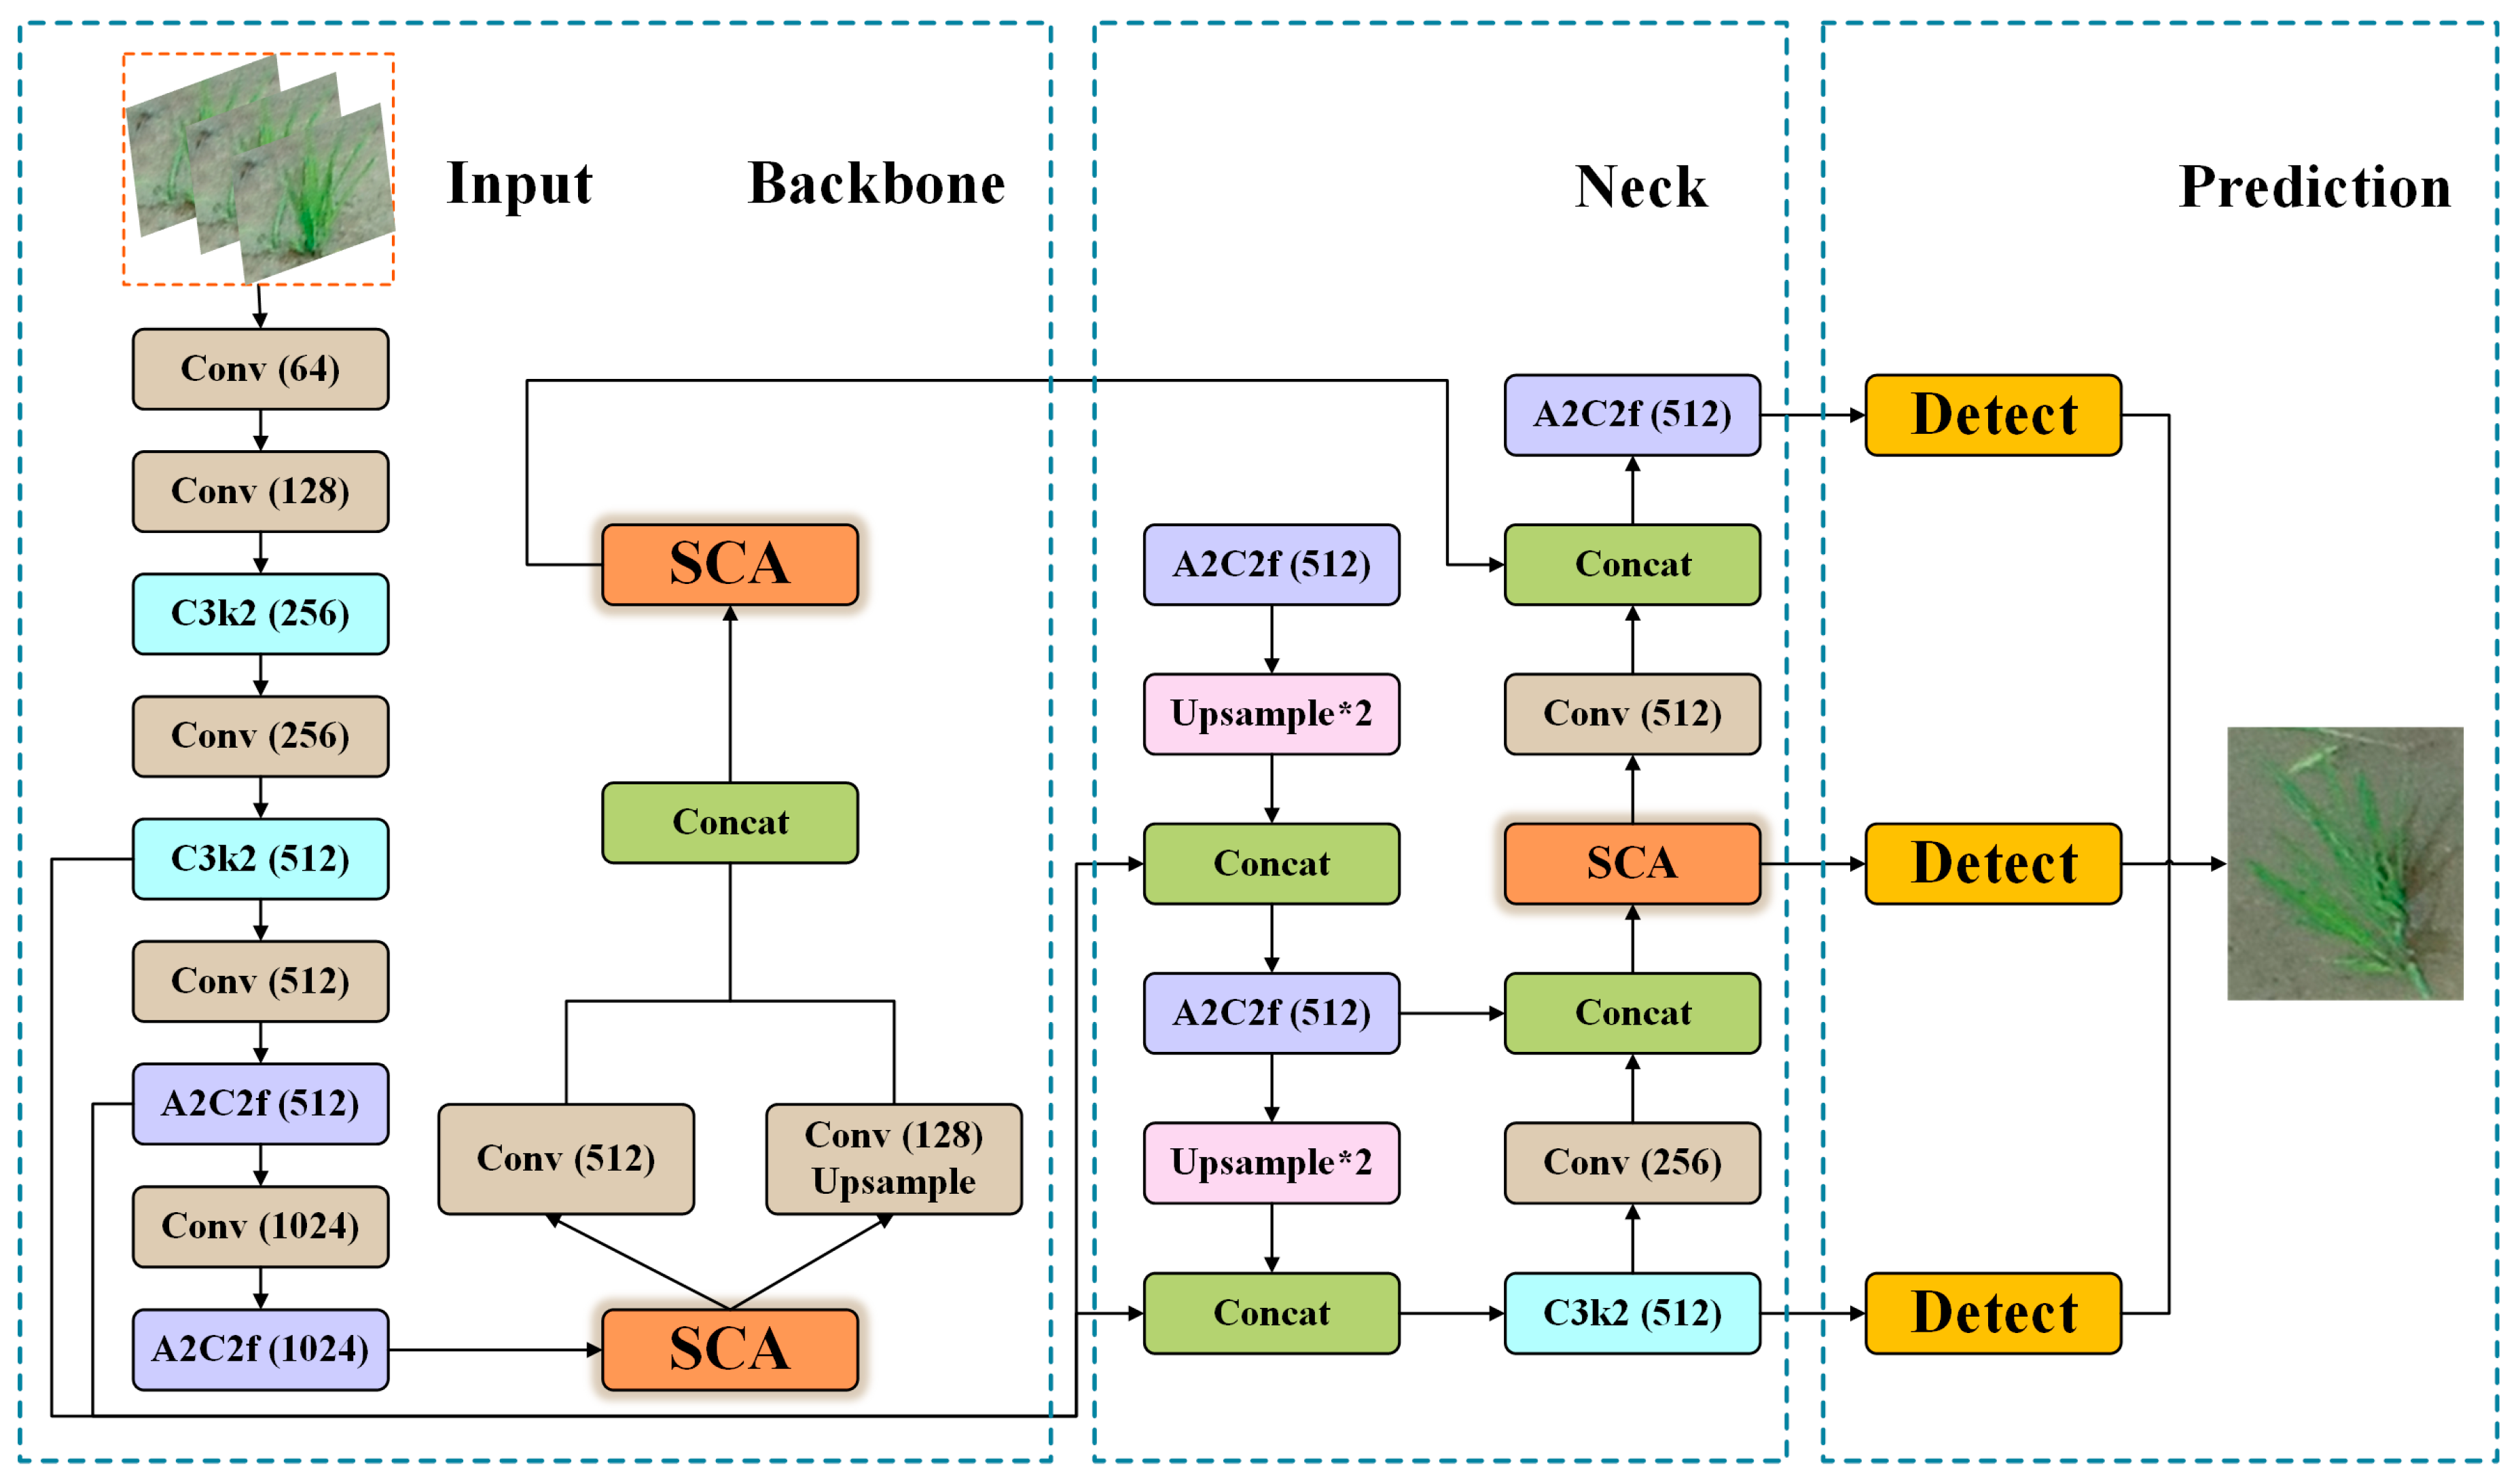
This paper uses the YOLOv12n model as the baseline for real-time detection of the mechanical transplanting status of rice seedlings. The improved YOLOv12n-SCA network architecture has four parts: input, backbone, neck, and prediction. The original seedling image is resized to 640 × 640 while preserving the aspect ratio, and the remaining areas are filled with background. The resized image is then fed into the backbone, where multi-layer convolutions and an A2C2f module extract features and produce three effective feature layers. The neck employs an improved FPN architecture that uses upsampling and downsampling operations to fuse features across stages. In the prediction section, the decoupled head structures perform classification and regression separately, reducing the number of channels and improving detection speed and accuracy. The output includes the seedling detection class, bounding box coordinates, and predicted confidence scores. Figure 5 shows the architecture of the improved YOLOv12n.
Figure 5.
YOLOv12n-SCA model architecture.
2.5. SCA Hybrid Attention Mechanism
Rice paddy environments are complex and variable, with factors such as deep water layers, ripples, strong light reflection, and floating debris on the water surface. In windy conditions, rice seedlings’ leaves attach to the stems in the same direction to varying degrees, and their shapes and floating states are highly similar, which can easily lead to model omissions or misclassifications. To improve the model’s ability to capture features of normal seedlings and key details of lodging seedlings, and to recognize targets with indistinct features. Based on a lightweight YOLOv12n model focused on attention mechanisms, this paper proposes an SCA hybrid attention module with dual-branch parallel weighted fusion.
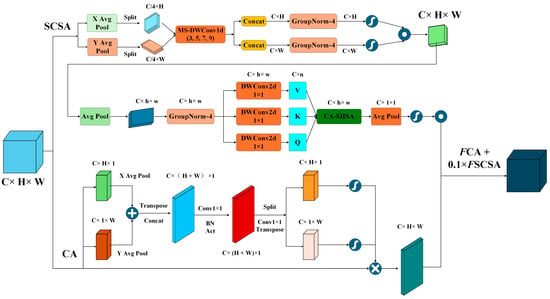
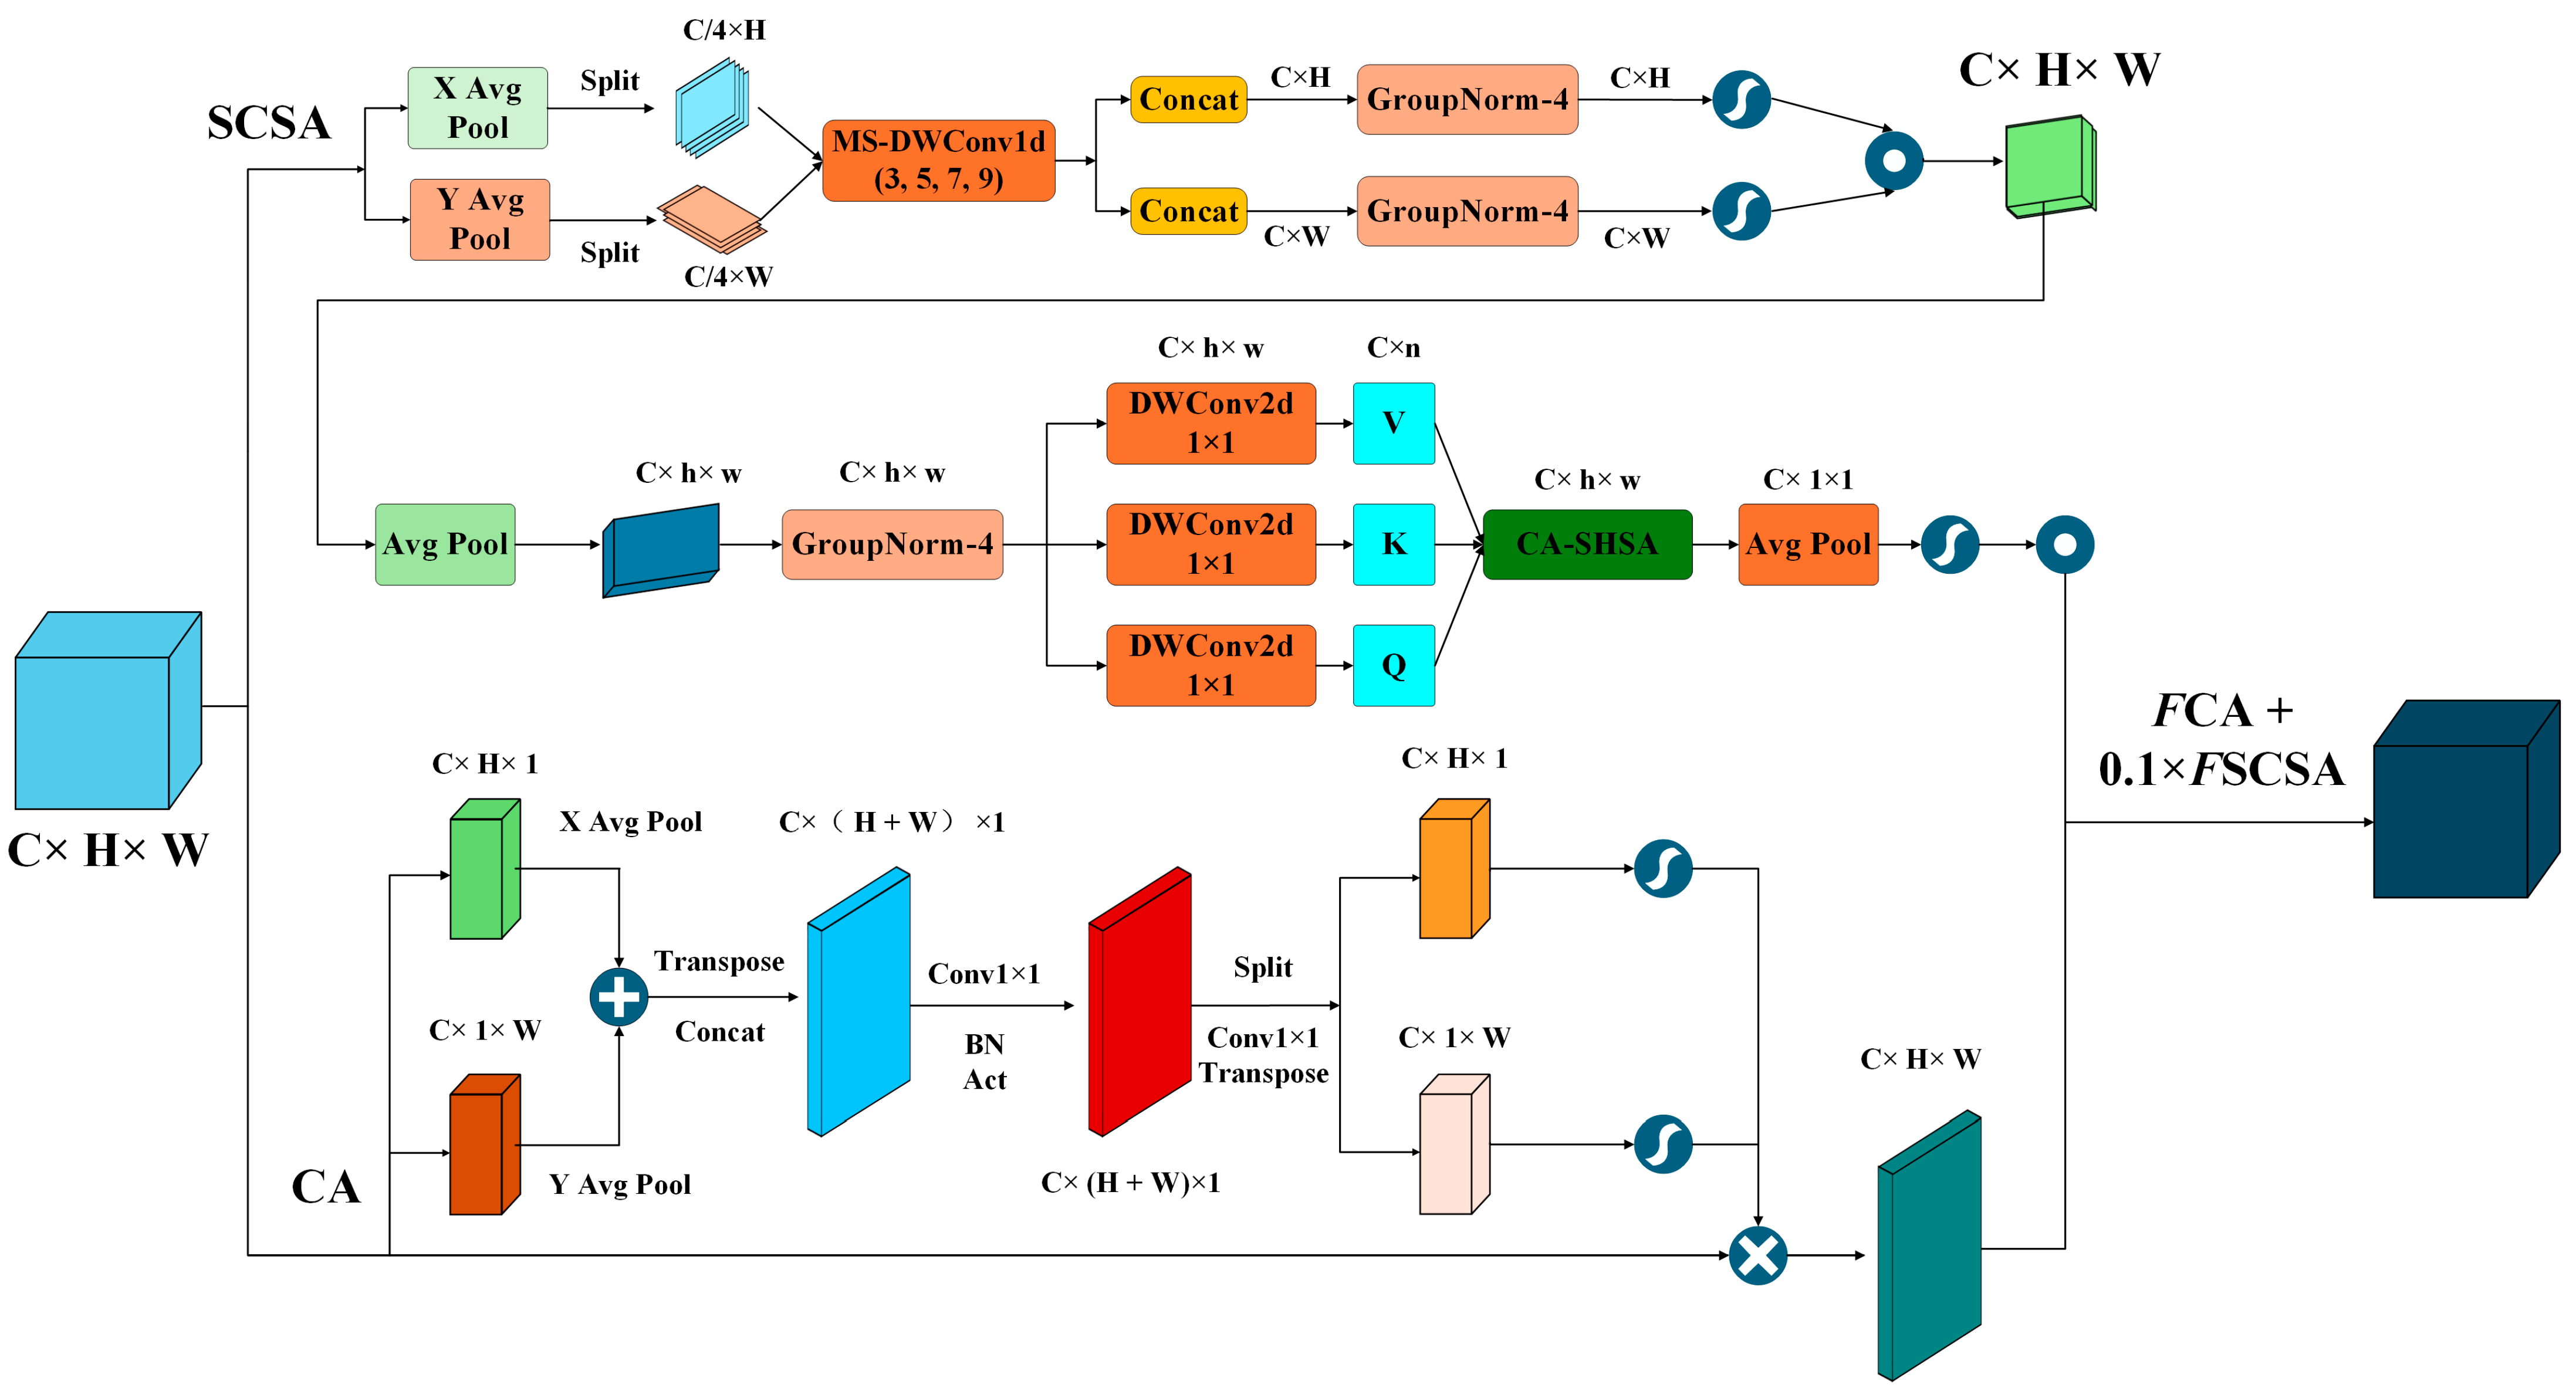
As shown in Figure 6, the SCSA branch enhances seedlings’ fine-grained feature representation through interactions between multi-semantic spatial features and channels. In contrast, the CA branch captures long-range dependencies via one-dimensional pooling in both horizontal and vertical directions, preserving direction-sensitive positional information. The two branches focus on multi-semantic feature modeling and directional-positional encoding, respectively, providing complementary information for seedling recognition in complex backgrounds. For fusion, the two branches compute independently from the same input and adjust their contributions through learnable residual weight coefficients. This aims to reduce excessive suppression of effective features that may result from serial recalibration and promote the synergistic use of target details and spatial position information.
Figure 6.
SCA Hybrid Attention Module Architecture.
Furthermore, this paper embeds SCA into layers 9, 13, and 23 of the network and combines it with cross-layer residual connections to enable feature interaction across different levels. During deep feature extraction, this approach enhances the semantic representation of seedlings while suppressing background interference such as muddy water and floating debris. Through cross-layer feature fusion, the model promotes complementarity between high-level semantics and low-level details. In the Neck layer, multi-scale fused features are further refined to represent seedlings of varying scales and morphologies. This design combines parallel fusion within modules with multi-position embedding at the network level to meet the feature extraction requirements for UAV-based rice seedling detection in paddy fields.
The overall workflow of the SCA module is shown in Figure 6. The input feature map first passes through the SCSA branch, then through the CA branch, and finally outputs a dual-attention-weighted feature map. The internal structure of the SCA module includes grouped deep convolutions, adaptive global pooling and channel gating, learnable residual weights α, a CA coordinate-pooling branch, a shared MLP, and bidirectional coordinate-attention convolutions. Without significantly increasing the number of parameters, this module provides the model with dual enhancements: rich spatial detail and precise positional awareness.
2.6. Rice-Seedling Detection Algorithm for Missed Transplants
To convert YOLOv12n-SCA seedling-detection results into quality metrics for rice transplanting operations, this paper proposes a rice-seedling detection algorithm for missed transplants that integrates principal component analysis (PCA) projections of seedling row orientations. The algorithm has four stages: seedling row clustering, within-row spacing estimation, missing-seedling detection, and transplanting-quality evaluation. It uses PCA to fit the true orientation of the seedling ridges. It then projects spacing measurements and residuals into a local coordinate system aligned with the ridge direction, thereby eliminating geometric projection errors associated with tilted rows in UAV images.
2.6.1. Seedling Row Clustering
Let represent the center coordinates of each valid bounding box. Sort the data by the X or Y coordinate of the seedling’s center point, then perform simple clustering using the row spacing threshold to group seedlings in the same row. Filter out invalid rows with too few seedlings and calculate each row’s center position. After analyzing the seedling image dataset, we found that the X-coordinate variation in seedling center points within the same planting column is mostly less than 50 pixels. In comparison, the X-direction distance between different planting rows is mostly greater than 50 pixels. Thus, we set the threshold to 50 px. Sort the seedling points by their grouping axis coordinates. If the difference in grouping axis coordinates between two adjacent points is less than the threshold , group them into the same seedling row:
To further suppress outlier detection noise in skewed seedling field images, construct a covariance matrix for the seedling points within each clustered row and perform feature decomposition:
In this equation, Σ is the covariance matrix calculated from the transpose matrix of the seedling point set P, which is used to characterize the degree of dispersion in the distribution of seedling points; v represents the eigenvector corresponding to the covariance matrix Σ; and α is the corresponding eigenvalue. By solving the characteristic equation , the principal direction eigenvector is obtained, which is used to determine the fitted orientation of the seedling rows.
Select the normalized eigenvector d corresponding to the largest eigenvalue as the principal direction vector for that seedling row; its normal vector is . Calculate the perpendicular distance from each seedling point to the centerline of the PCA-fitted seedling row:
To mitigate outliers, this study uses the median, rather than the mean, as the threshold. Outliers with vertical distances exceeding k × median (D) are removed, where k is an adaptive coefficient optimized for each image, yielding valid seedling rows.
2.6.2. Within-Row Spacing Estimation
For a single row of seedlings, project the center points of all seedlings onto the row’s principal direction d to obtain one-dimensional coordinates along the row:
After sorting in ascending order by , the actual spacing between adjacent seedlings along the direction of the seedling row is calculated as follows:
2.6.3. Missing-Seedling Detection
To minimize the impact of local outliers on missing-seedling detection, we introduce a threshold coefficient λ. When the distance between adjacent seedlings satisfies Equation (2), an internal gap between the two seedlings is detected:
In the equation, indicates missing plants, indicates normal plant spacing, and λ is the threshold coefficient for detecting missing plants. Based on the agronomic geometric characteristics of rice transplanting, gaps in the labeled samples with an inter-plant distance of or greater are considered the ground truth. In this study, 645 images were randomly selected from the test set in Table 1 to construct a calibration subset labeled only with missing locations, yielding a total of 873 manually annotated missing locations for calibrating the threshold coefficient λ. The center of each detected seedling in a row was projected onto the row direction fitted by PCA, and the center-to-center distance between adjacent seedlings along the row was calculated. The mode of these distances was used as the standard plant spacing, and gaps were identified based on Equation (6). Theoretically, the spacing between adjacent surviving seedlings resulting from a single missing seedling is approximately 1 times and 2 times the standard plant spacing, respectively; therefore, the interval [1, 2] is used as the theoretical reference range for λ, with 1.5 taken as the initial reference value. Taking into account factors such as center positioning errors, missed seedlings, merged detection boxes, and natural variations in plant spacing, the search range was expanded to the interval [0, 2], with a step size of 0.2, and the final threshold was determined using measured data. During the calibration process, only λ was adjusted; the detection model, confidence threshold, row grouping and PCA fitting method, boundary gap determination, prediction gap deduplication, matching distance, and all other parameters remained unchanged. Therefore, λ = 1.5 was substituted into the actual internal plant gap calculation to determine the number of internally missing seedlings ().
When calculating missing seedlings at the edges of an image, the following criteria apply for determining missing seedlings at the leftmost edge of a row:
Here, is the y-coordinate of the leftmost boundary point, and is the y-coordinate of the leftmost seedling in the row. The determination of a missing seedling at the rightmost boundary is as follows:
In the formula, represents the y-coordinate of the bottom-most seedling in a row. The total number of missing seedlings at the boundaries, , is calculated, and finally, the total number of missing seedlings, , is determined.
The total number of theoretical seedlings () in an image is the sum of the number of detected seedlings () and the total number of missing seedlings:
2.6.4. Transplanting-Quality Evaluation
Based on , the missing seedling rate () is further defined to characterize the severity of missed seedlings during transplanting. When is greater than 0, the missing seedling rate is the ratio of to . If there are no valid seedlings in the image, set the missing seedling rate to 0 to avoid errors. Therefore, the formula for calculating the missing seedling rate is:
During rice transplanting, seedlings may be planted crookedly or deviate from the centerline of the transplanting row, affecting subsequent field management and crop growth. Therefore, we introduce a straightness metric for the transplanting row. All center points of the seedlings within a single seedling row are transformed into the local coordinate system of the seedling row, and then the least-squares method is used to fit a straight line [32]:
The residuals are calculated as follows:
The standard deviation of the residuals is calculated as follows:
In this equation, n represents the number of seedlings in a row, and represents the mean of the residuals. The reflects the degree of dispersion of the seedling points relative to the centerline of the seedling row. To eliminate the effects of image scale and variations in plant spacing between seedling rows, both and the actual mean plant spacing of the current seedling row are normalized, resulting in the residual-plant spacing normalization ratio as follows:
Here, is the mean within-row plant spacing. The normalized residual is converted to a row straightness score bounded between 0 and 100:
The value ranges from 0 to 100. Higher scores indicate straighter seedling rows, whereas lower scores indicate greater deviation from the fitted centerline.
The global straightness score for the entire image is calculated as follows, where m is the number of seedling rows in the entire image; that is, the arithmetic mean of the scores for all valid seedling rows:
Maintaining consistent plant spacing is essential for rice transplanting. Excessive variation can cause uneven seedling distribution and affect overall crop growth. This study therefore develops an evaluation metric for plant spacing uniformity. Extract the set of plant spacing samples for all adjacent seedlings in a single seedling row. Calculate the mean plant spacing for that row:
In the equation, K represents the number of samples per row and the plant spacing. The standard deviation of the plant spacing is :
The coefficient of variation () indicates the relative level of variation in plant spacing. The higher the , the greater the variation in plant spacing.
Convert the coefficient of variation for plant spacing to a single-row spacing uniformity score () on a scale of 0 to 100:
The score for a single row of seedlings reflects only that row’s condition. To obtain an evaluation result covering the entire farmland area depicted in the image, calculate the arithmetic mean of the values for all valid seedlings in the image to derive a global plant spacing uniformity score for the entire image (), representing the arithmetic mean of all valid scores:
The three metrics—, , and —were used as the final evaluation criteria for the rice transplanter’s transplanting quality in this farmland area.
3. Results
3.1. Experimental Environment
Table 2 summarizes the hardware and software environment. Training used a batch size of 8 and a maximum of 400 epochs. Component-specific learning rates were set to 5 × 10⁻⁵ for the backbone and neck, 3 × 10⁻⁴ for the SCA modules, and 1 × 10⁻³ for the detection head. The lower backbone and neck learning rate was used to preserve pretrained feature representations.
Table 2.
Configuring the model training and testing environments.
3.2. Parameter Settings
Table 3 lists the training hyperparameters. The model detects two classes, qualified and lodging seedlings, using 640 × 640-pixel inputs. AdamW was used for optimization, with Mosaic and MixUp augmentation. Early stopping was applied with a patience of 50 epochs to prevent overfitting.
Table 3.
Model hyperparameter settings.
3.3. Evaluation Indicators
To comprehensively evaluate the model’s performance in detecting qualified and lodging seedlings in complex paddy field environments, this study employed precision (P), recall (R), mAP@0.5, and mAP@0.5:0.95 as evaluation metrics. Precision is the proportion of predicted detections that are correct, while recall is the proportion of ground-truth targets detected. mAP@0.5 averages class-specific AP at an intersection over union (IoU) threshold of 0.5; mAP@0.5:0.95 additionally averages across IoU thresholds from 0.50 to 0.95 in increments of 0.05. Given the small, dense seedlings in UAV images, mAP@0.5 was the primary metric, supplemented by the other three measures. The metrics were calculated as follows:
In the formula, TP represents the number of seedling targets for which the category prediction is correct and the IoU between the predicted bounding box and the ground-truth bounding box meets the set threshold; FP represents the number of predicted bounding boxes for which the category prediction is incorrect, the localization is inaccurate, or the box is not correctly matched to a ground-truth target; FN represents the number of ground-truth seedling targets not detected by the model; APIT represents the average precision for the i-th target category at an IoU threshold of t; and C represents the number of target categories in the dataset. The detection targets in this study include qualified seedlings and lodging seedlings, so C = 2.
3.4. Comparative Experimental Results
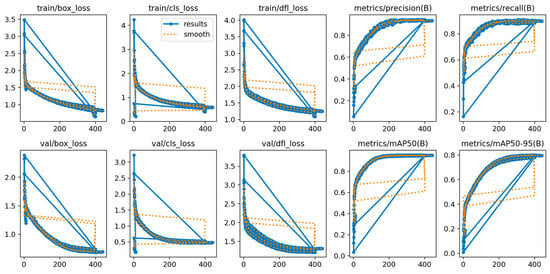
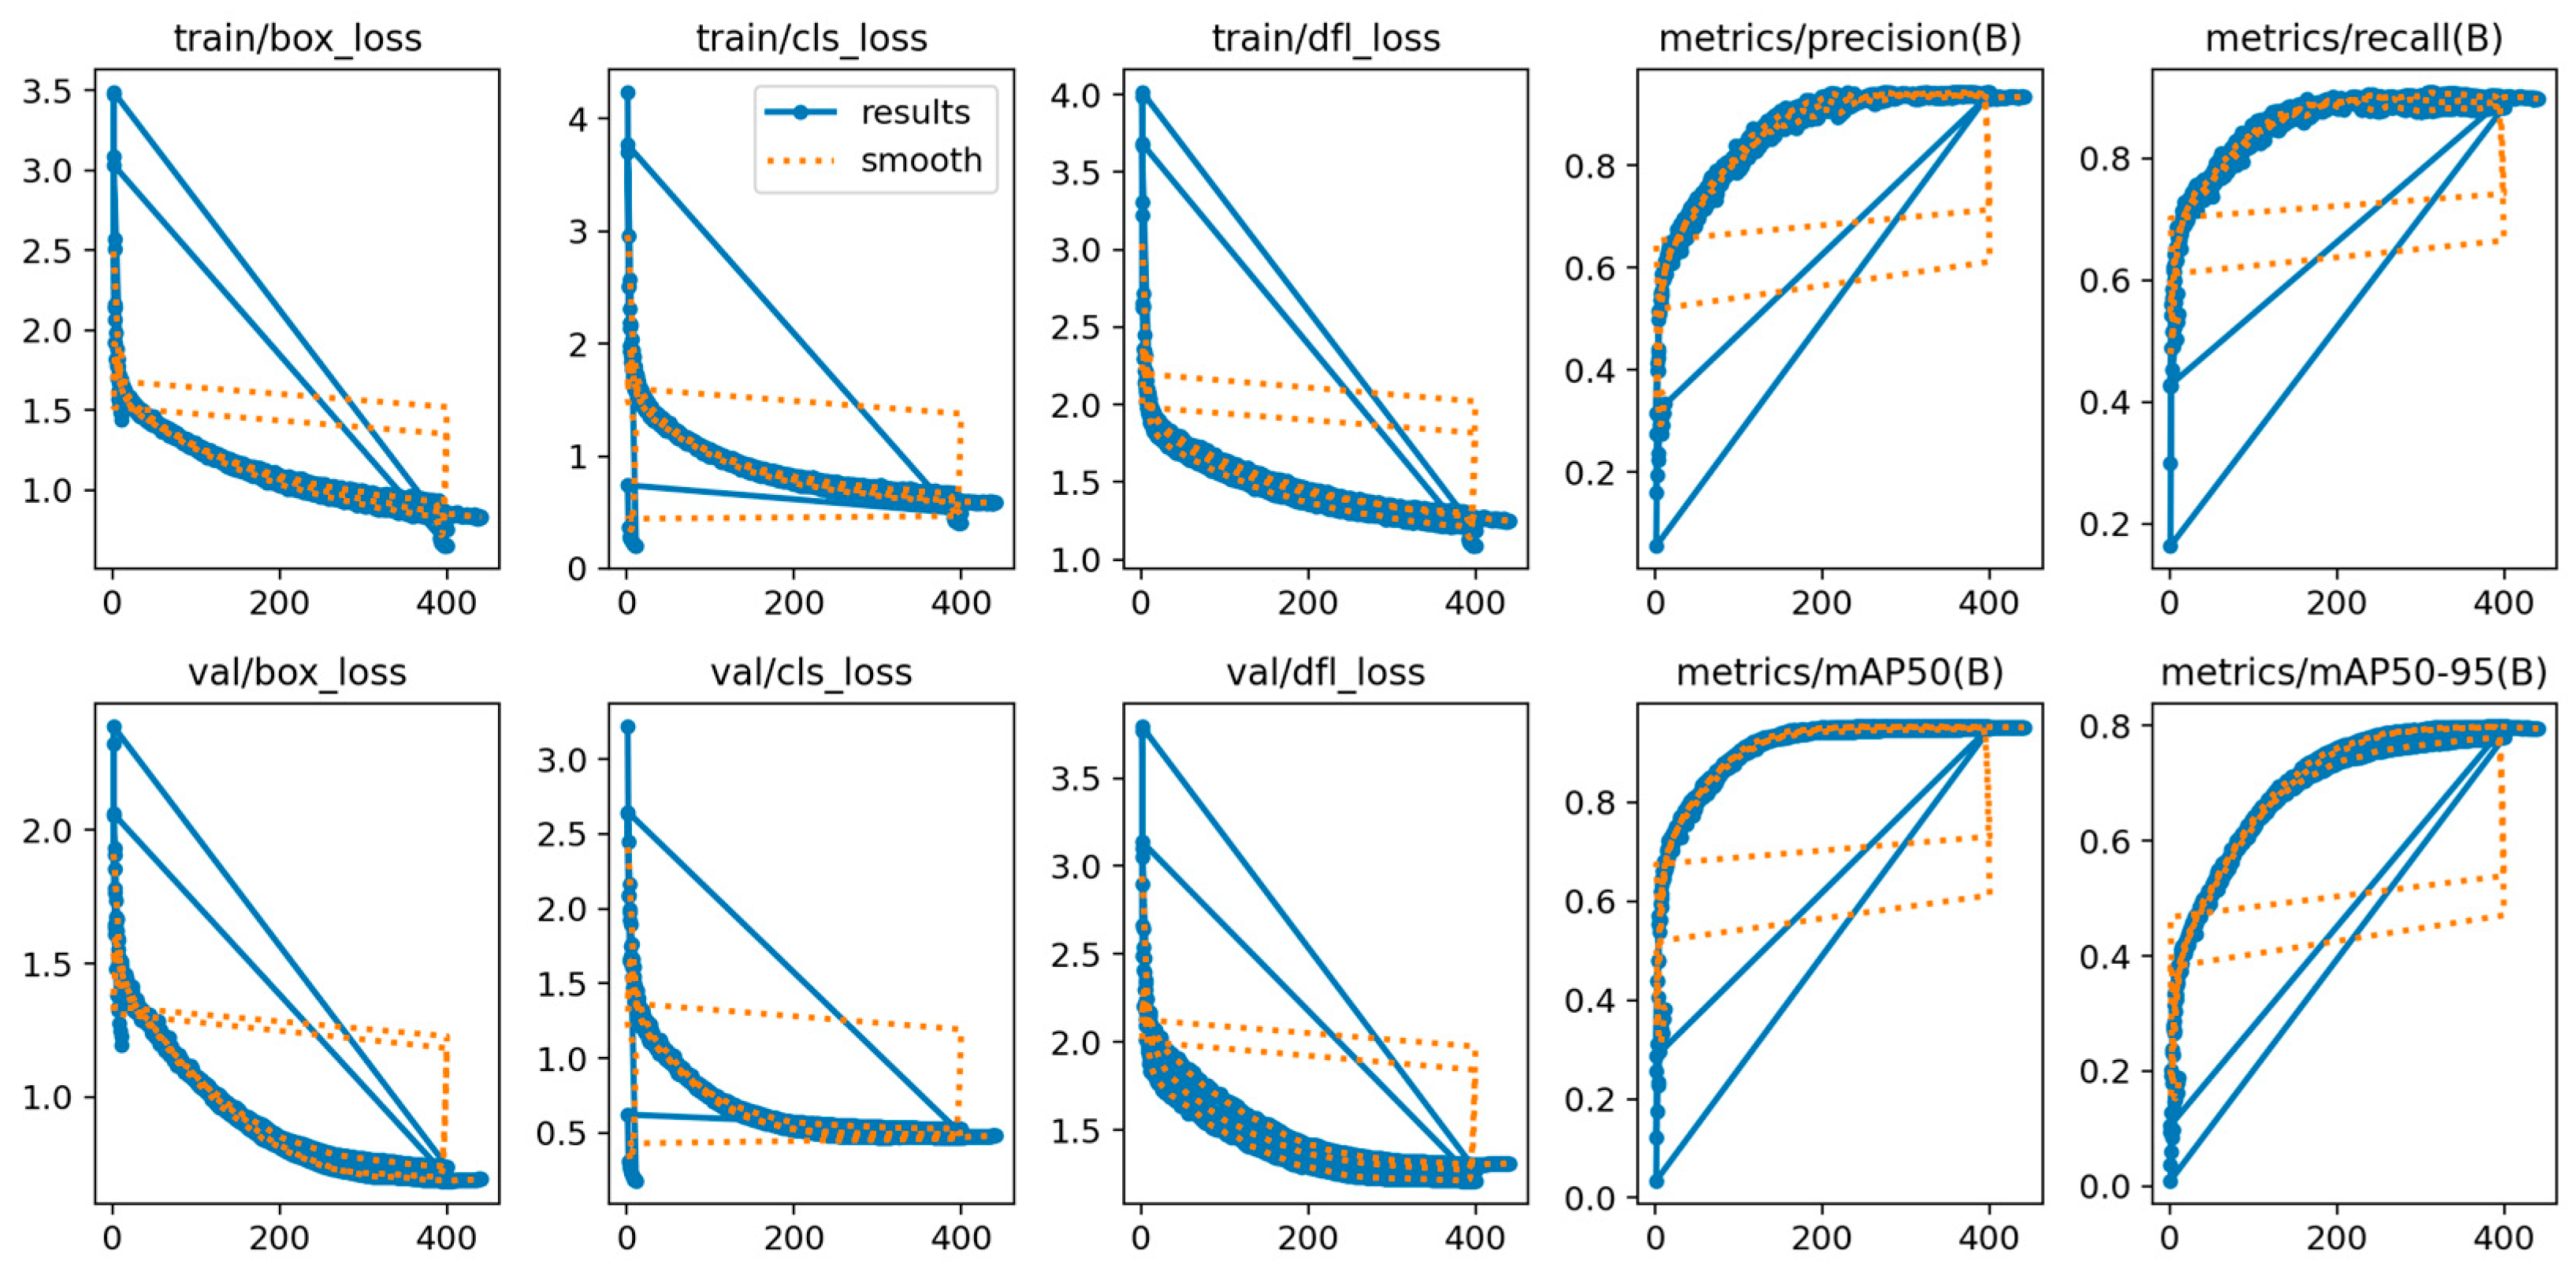
Figure 7 shows the training and validation losses and detection metrics over 400 epochs. Box, classification, and distribution focal losses decreased rapidly, then stabilized. The training and validation curves followed similar trends, with no clear divergence suggesting substantial overfitting. Precision, recall, mAP@0.5, and mAP@0.5:0.95 increased during training and stabilized at 93.6%, 90.3%, 95.3%, and 79.8%, respectively. It indicates that the model can detect most true seedling targets while controlling false positives. The lower mAP@0.5:0.95 than mAP@0.5 indicates that, at high IoU thresholds, elongated leaves, variations in seedling morphology, and partial occlusion still affect bounding-box localization accuracy. Performance remained lower under stricter IoU thresholds, indicating room for improvement in bounding-box localization.
Figure 7.
Loss and metric curves for YOLOv12n-SCA.
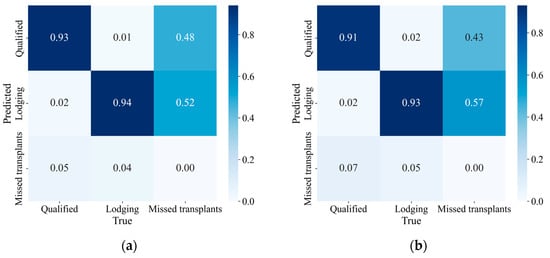
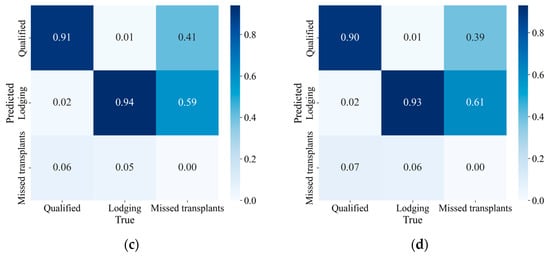
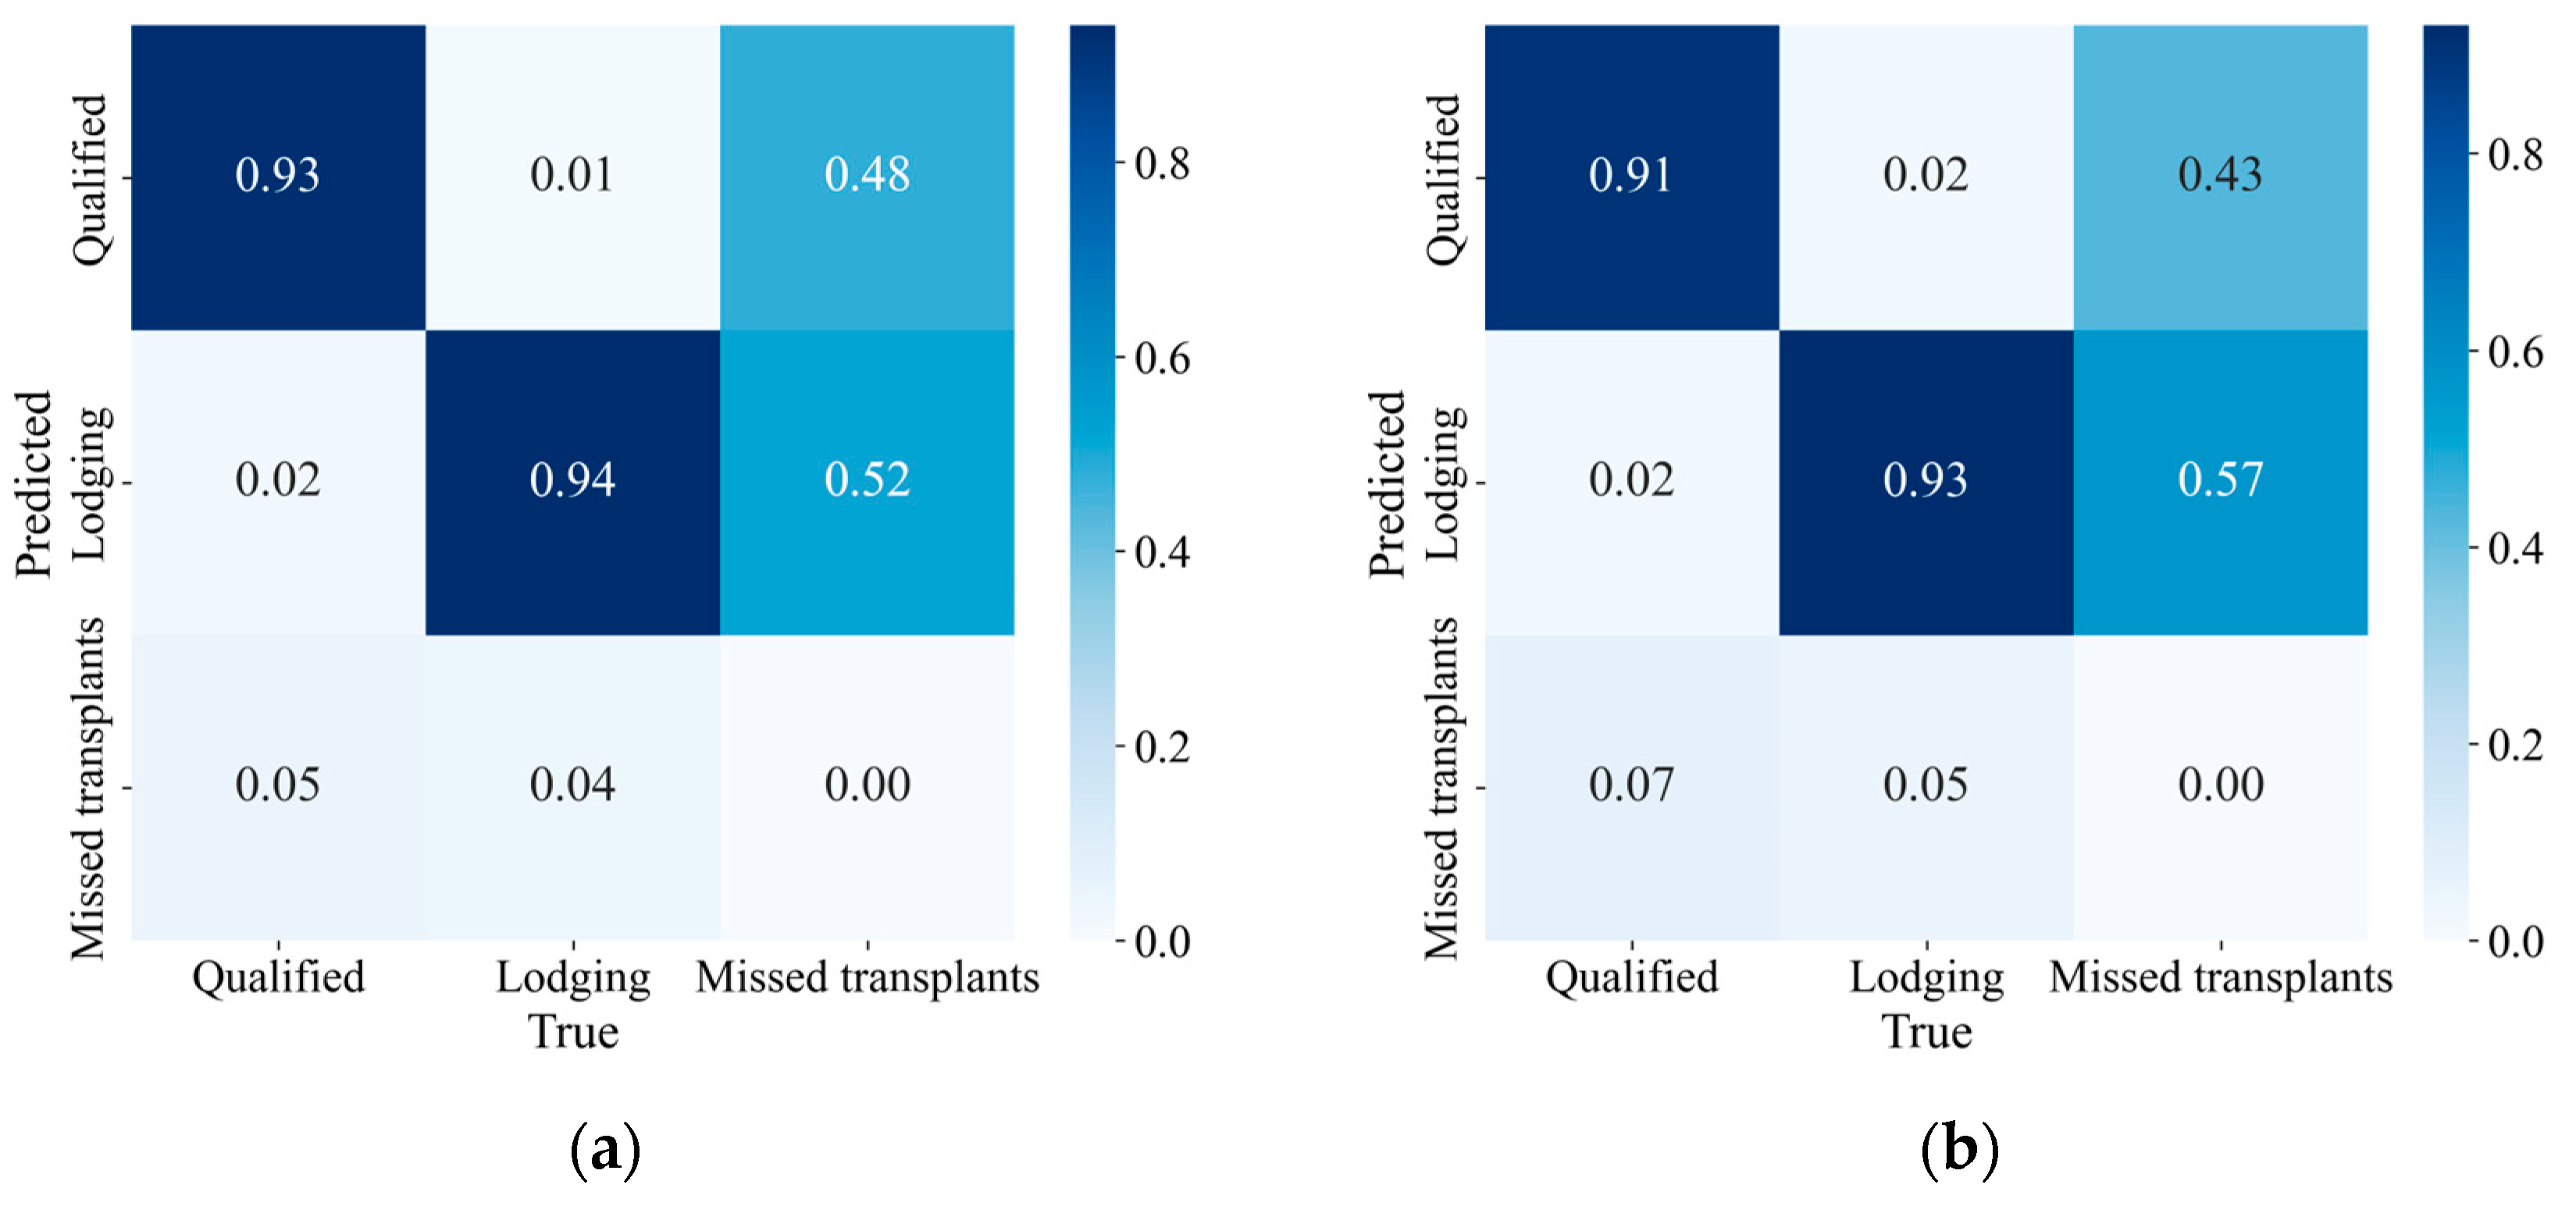
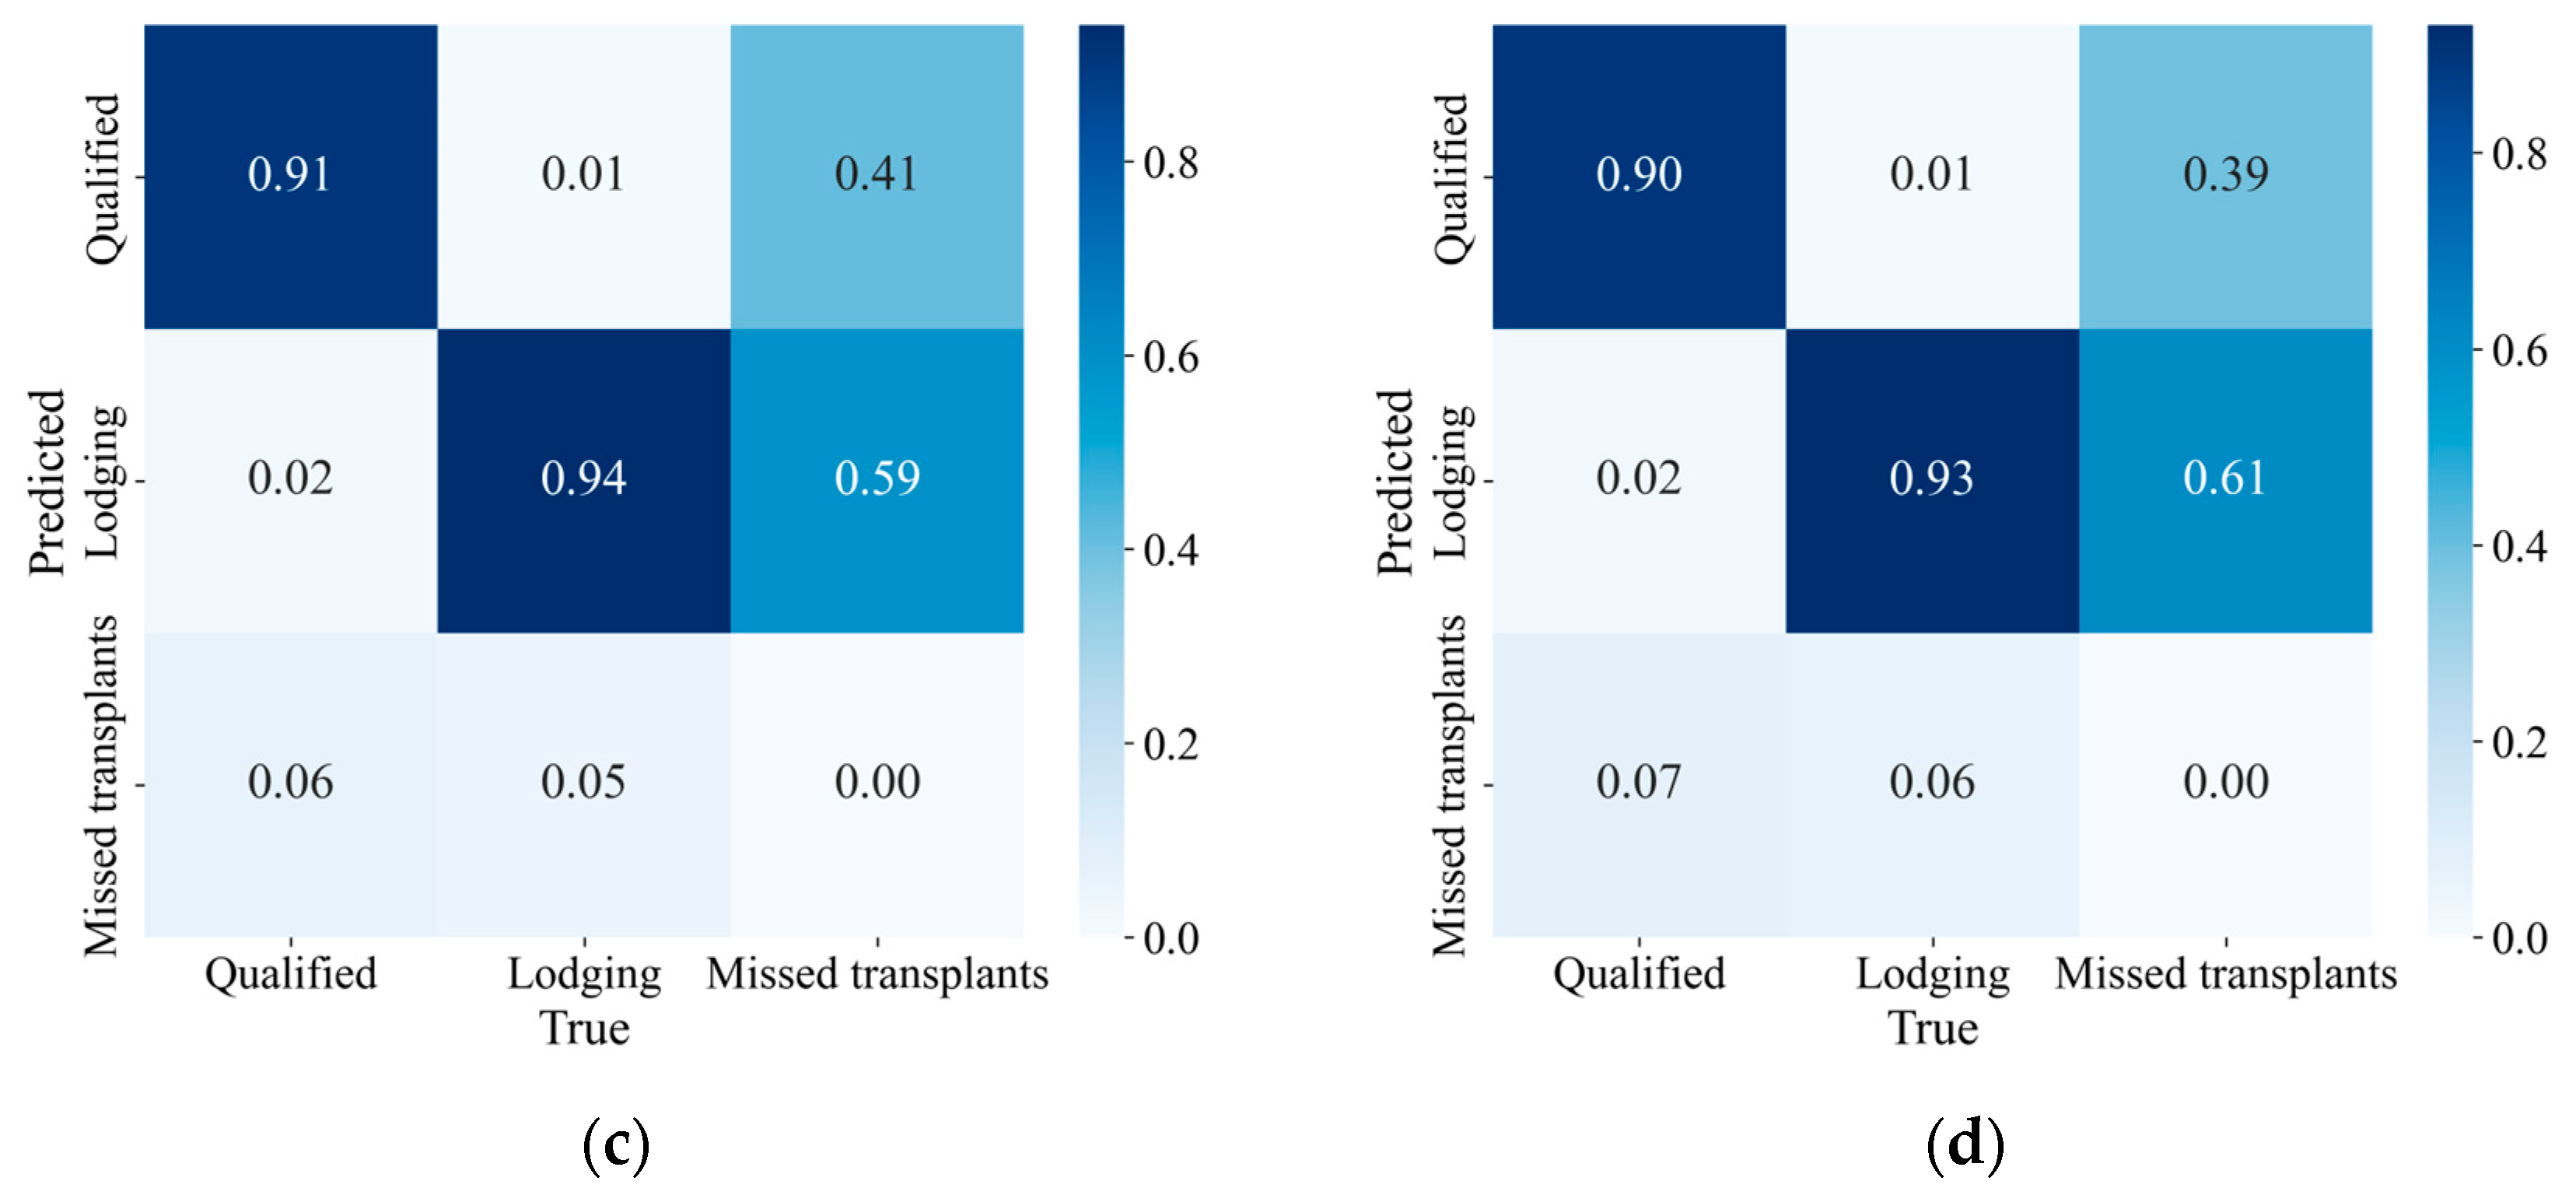
Figure 8d shows that YOLOv12n-SCA correctly identified 90% of qualified seedlings and 93% of lodged seedlings. Cross-class misclassification rates were 2% and 1%, respectively, while missed-detection rates were 7% and 6%. This low cross-class misclassification indicates that YOLOv12n-SCA can effectively distinguish the morphological features of qualified seedlings from those of lodging seedlings. In contrast, background-related false positives were more concentrated in the lodging seedling category, suggesting that water surface reflections, soil textures, floating debris, and irregularly shaped background areas may share certain visual similarities with lodging seedlings and remain major factors affecting the model’s detection performance. Overall, the model demonstrates stable performance in extracting and distinguishing seedling-class features. The two-stage detection architecture effectively compensates for the base model’s algorithmic omissions, resulting in balanced overall performance in object detection and classification.
Figure 8.
Comparison of confusion matrices for different models. (a) YOLOv12n. (b) YOLOv12n-CA. (c) YOLOv12n-SCSA. (d) YOLOv12n-SCA.
3.5. Ablation Experiments
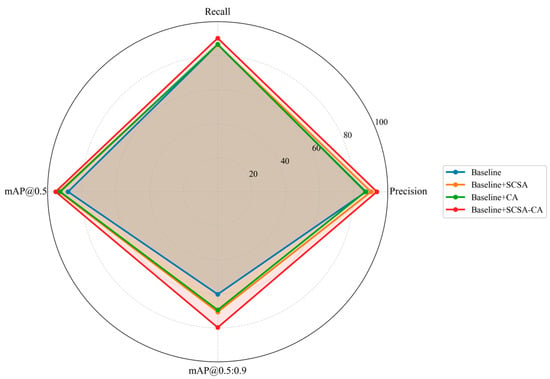
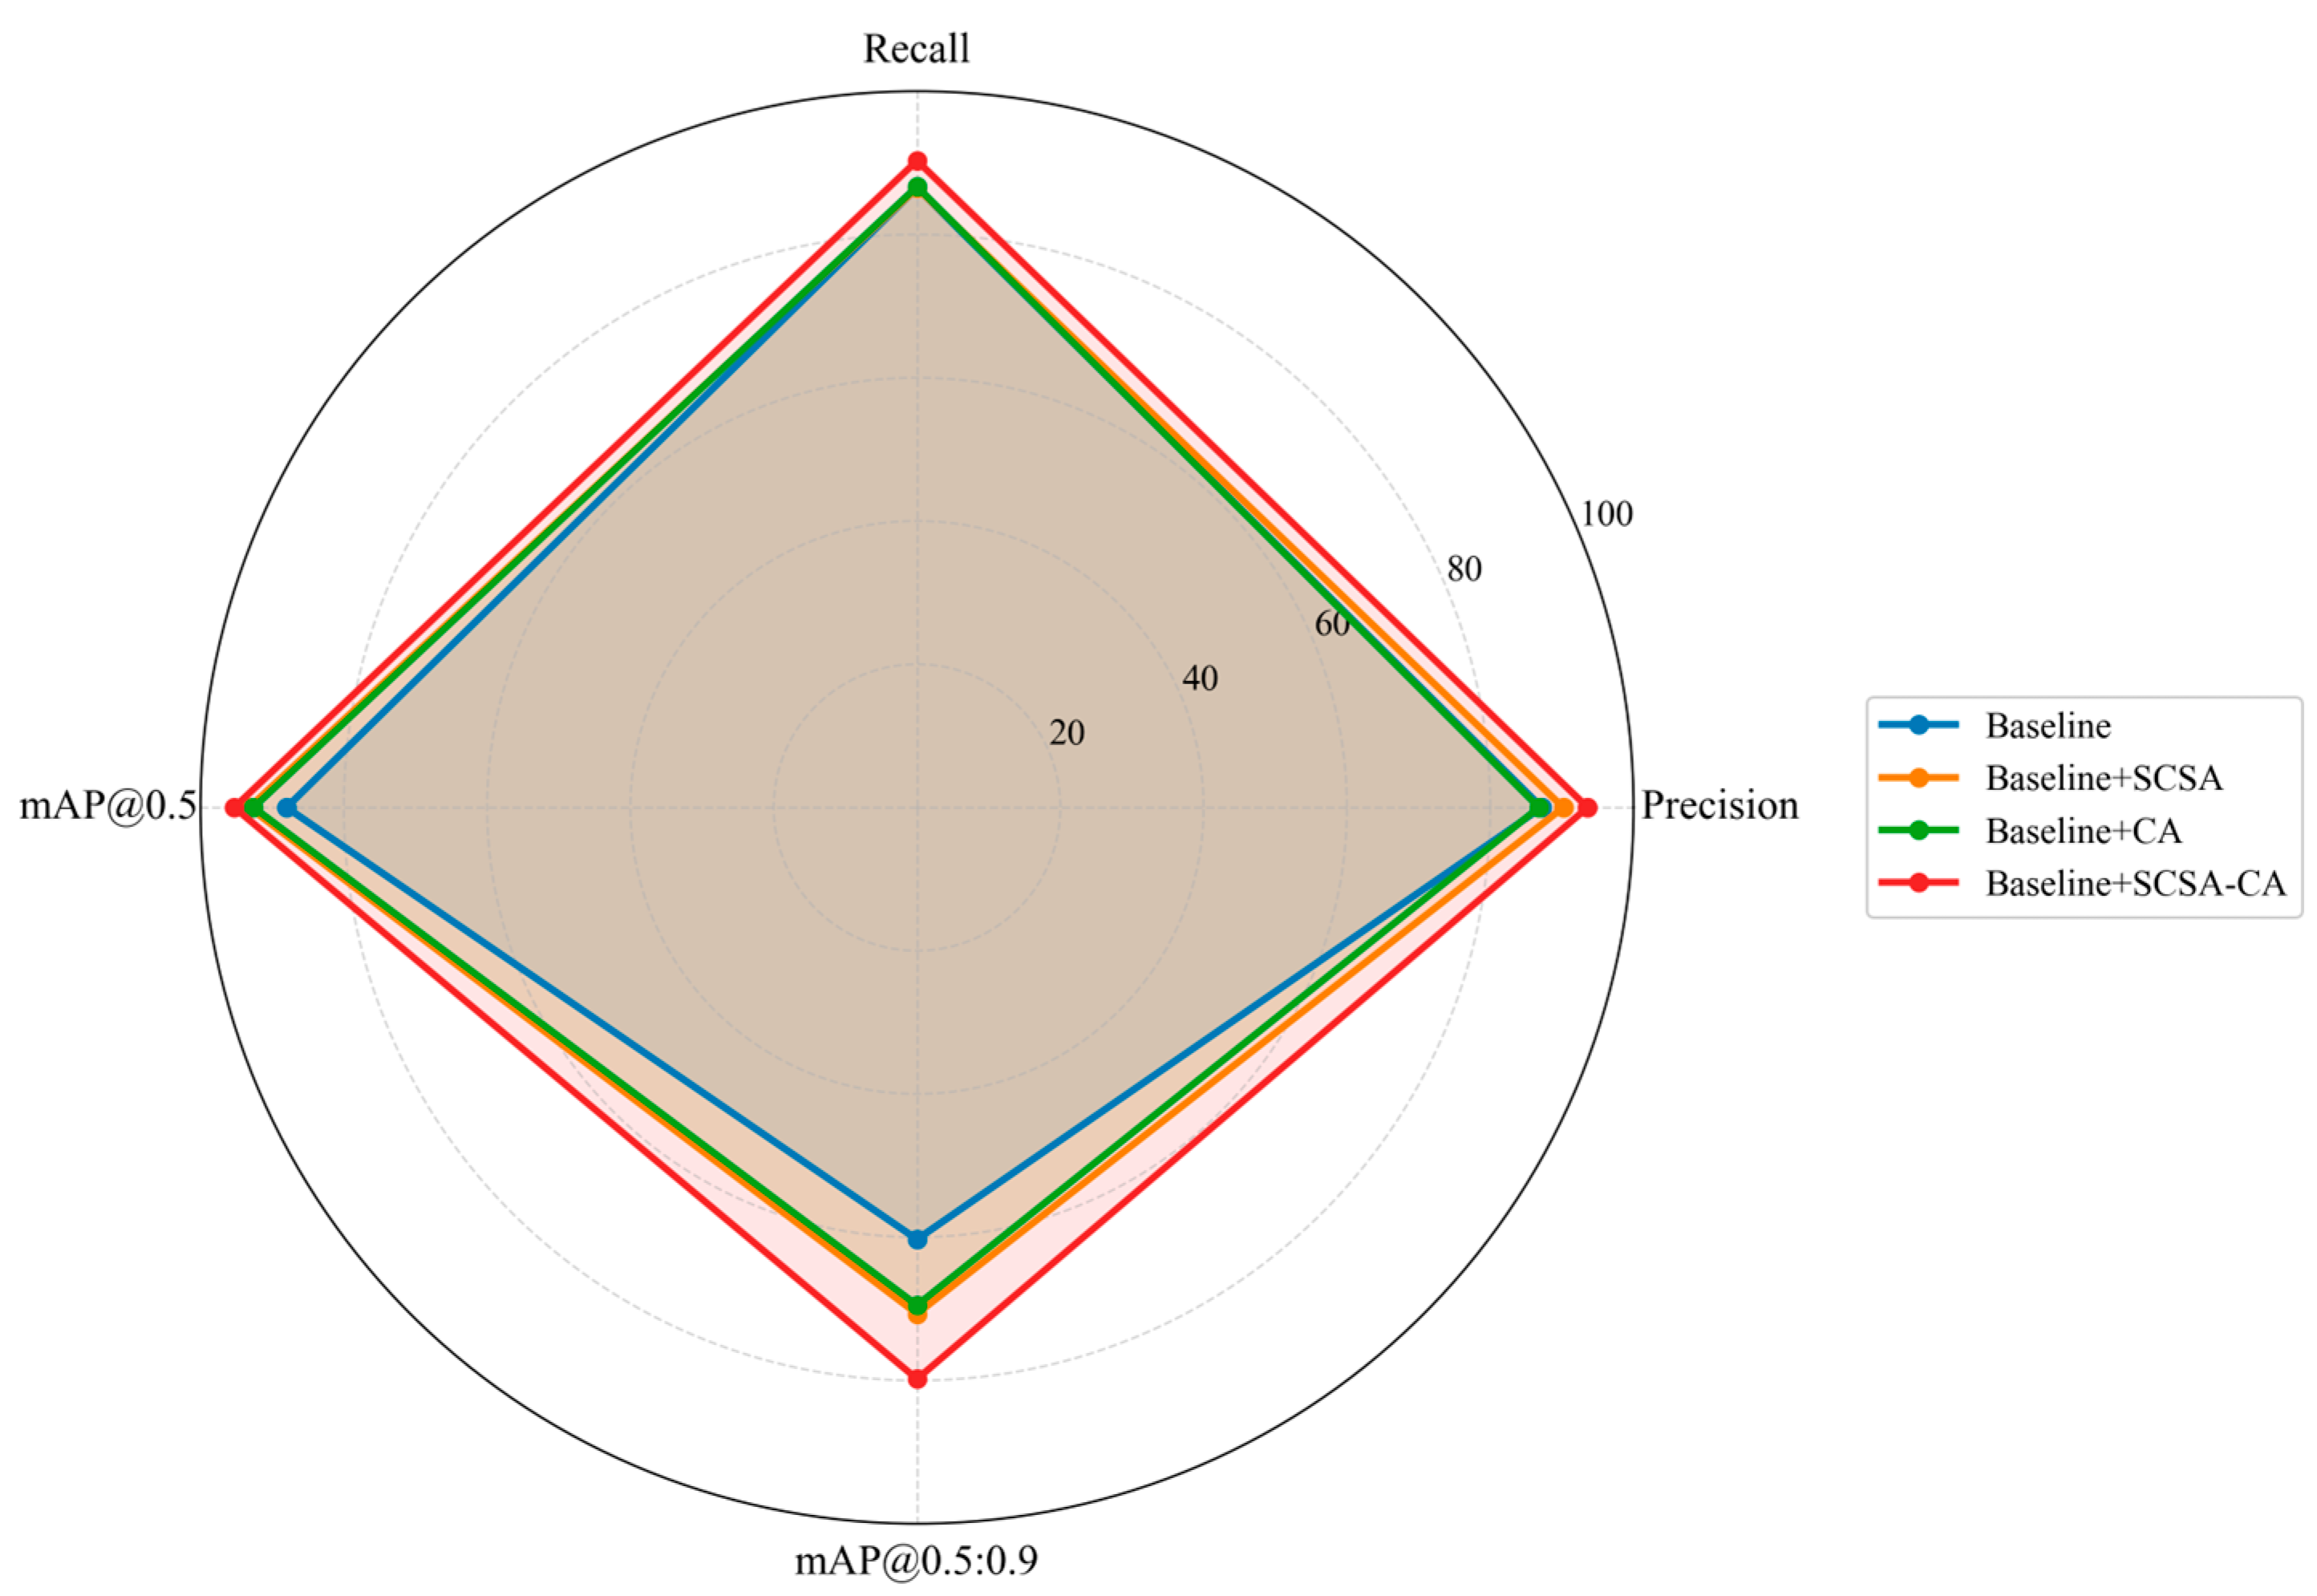
To verify the impact of the SCSA, CA, and their fusion, the SCA hybrid attention module on the quality inspection of rice transplanters, ablation experiments were conducted using the same dataset, training parameters, and pre-trained weights. The results are shown in Table 4 and Figure 9. Overall, the original YOLOv12n served as the baseline model, with Precision, Recall, mAP@0.5, and mAP@0.5:0.95 of 87.2%, 86.5%, 88.0%, and 60.3%, respectively.
Table 4.
The results of ablation experiment.
Figure 9.
Radar chart of ablation study results.
After introducing only the SCSA module, Precision increased to 90.2%, while mAP@0.5 and mAP@0.5:0.95 rose to 93.2% and 70.7%, respectively. These gains over the baseline model were 3.0, 5.2, and 10.4 percentage points. Recall remained at 86.5%. This suggests that SCSA may help model spatial and channel features, thereby improving the capture of local texture and multiscale seedling features and reducing false positives in complex paddy field backgrounds. After introducing the CA module alone, Recall increased slightly to 86.7%, and mAP@0.5 and mAP@0.5:0.95 improved by 4.6 and 9.2 percentage points, respectively. Although Precision decreased slightly to 86.8%, the overall detection accuracy improved significantly, suggesting that CA may be associated with improved perception of seedling spatial location and contours by encoding positional information in both the horizontal and vertical directions.
As shown in Table 4, integrating SCSA and CA into the SCA module yielded the best overall performance, with precision, recall, mAP@0.5, and mAP@0.5:0.95 of 93.6%, 90.3%, 95.3%, and 79.8%, respectively. These values improved by 6.4, 3.8, 7.3, and 19.5 percentage points over the baseline model. Compared with SCSA alone, the fused model improved mAP@0.5 and mAP@0.5:0.95 by 2.1 and 9.1 percentage points, and compared with CA alone, by 2.7 and 10.3 percentage points. The significant gain in mAP@0.5:0.95 indicates that SCA improves object detection and bounding-box localization at stricter IoU thresholds. These results show the complementarity between SCSA and CA in feature extraction: SCSA enhances local texture and space-channel dependencies, while CA preserves orientation-aware and precise positional information. Together, they improve the model’s ability to distinguish qualified seedlings from lodging seedlings.
To further validate the results, this study conducted three replicate experiments on the same dataset (with random seeds of 42, 2024, and 2025, respectively) and compared the detection performance before and after the improvement. Table 5 shows that the improved YOLOv12n-SCA model achieved significant improvements over the baseline model across all evaluation metrics. The standard deviation for both models was less than 0.02, indicating that the experimental results were relatively stable and reliable. The Baseline model showed less fluctuation across the mAP metrics, while the YOLOv12n-SCA model was more stable in precision.
Table 5.
The Performance comparison between Baseline and the proposed YOLOv12n-SCA.
Statistical significance tests showed a paired t-test p-value of 0.039 for the mAP@0.5:0.95 metric (p < 0.05), meeting the significance level. This indicates that the SCA module substantially improves the model’s detection capability under strict IoU thresholds, enhancing the localization accuracy of rice seedlings. The SCA attention mechanism effectively improves the YOLOv12n model’s performance in more detailed and complex rice paddy environment detection tasks. In subsequent practical deployments, we will adopt the improved SCA version, increase the number of repeated experiments to further enhance statistical power, and explore the optimal insertion positions for the attention module across different network layers.
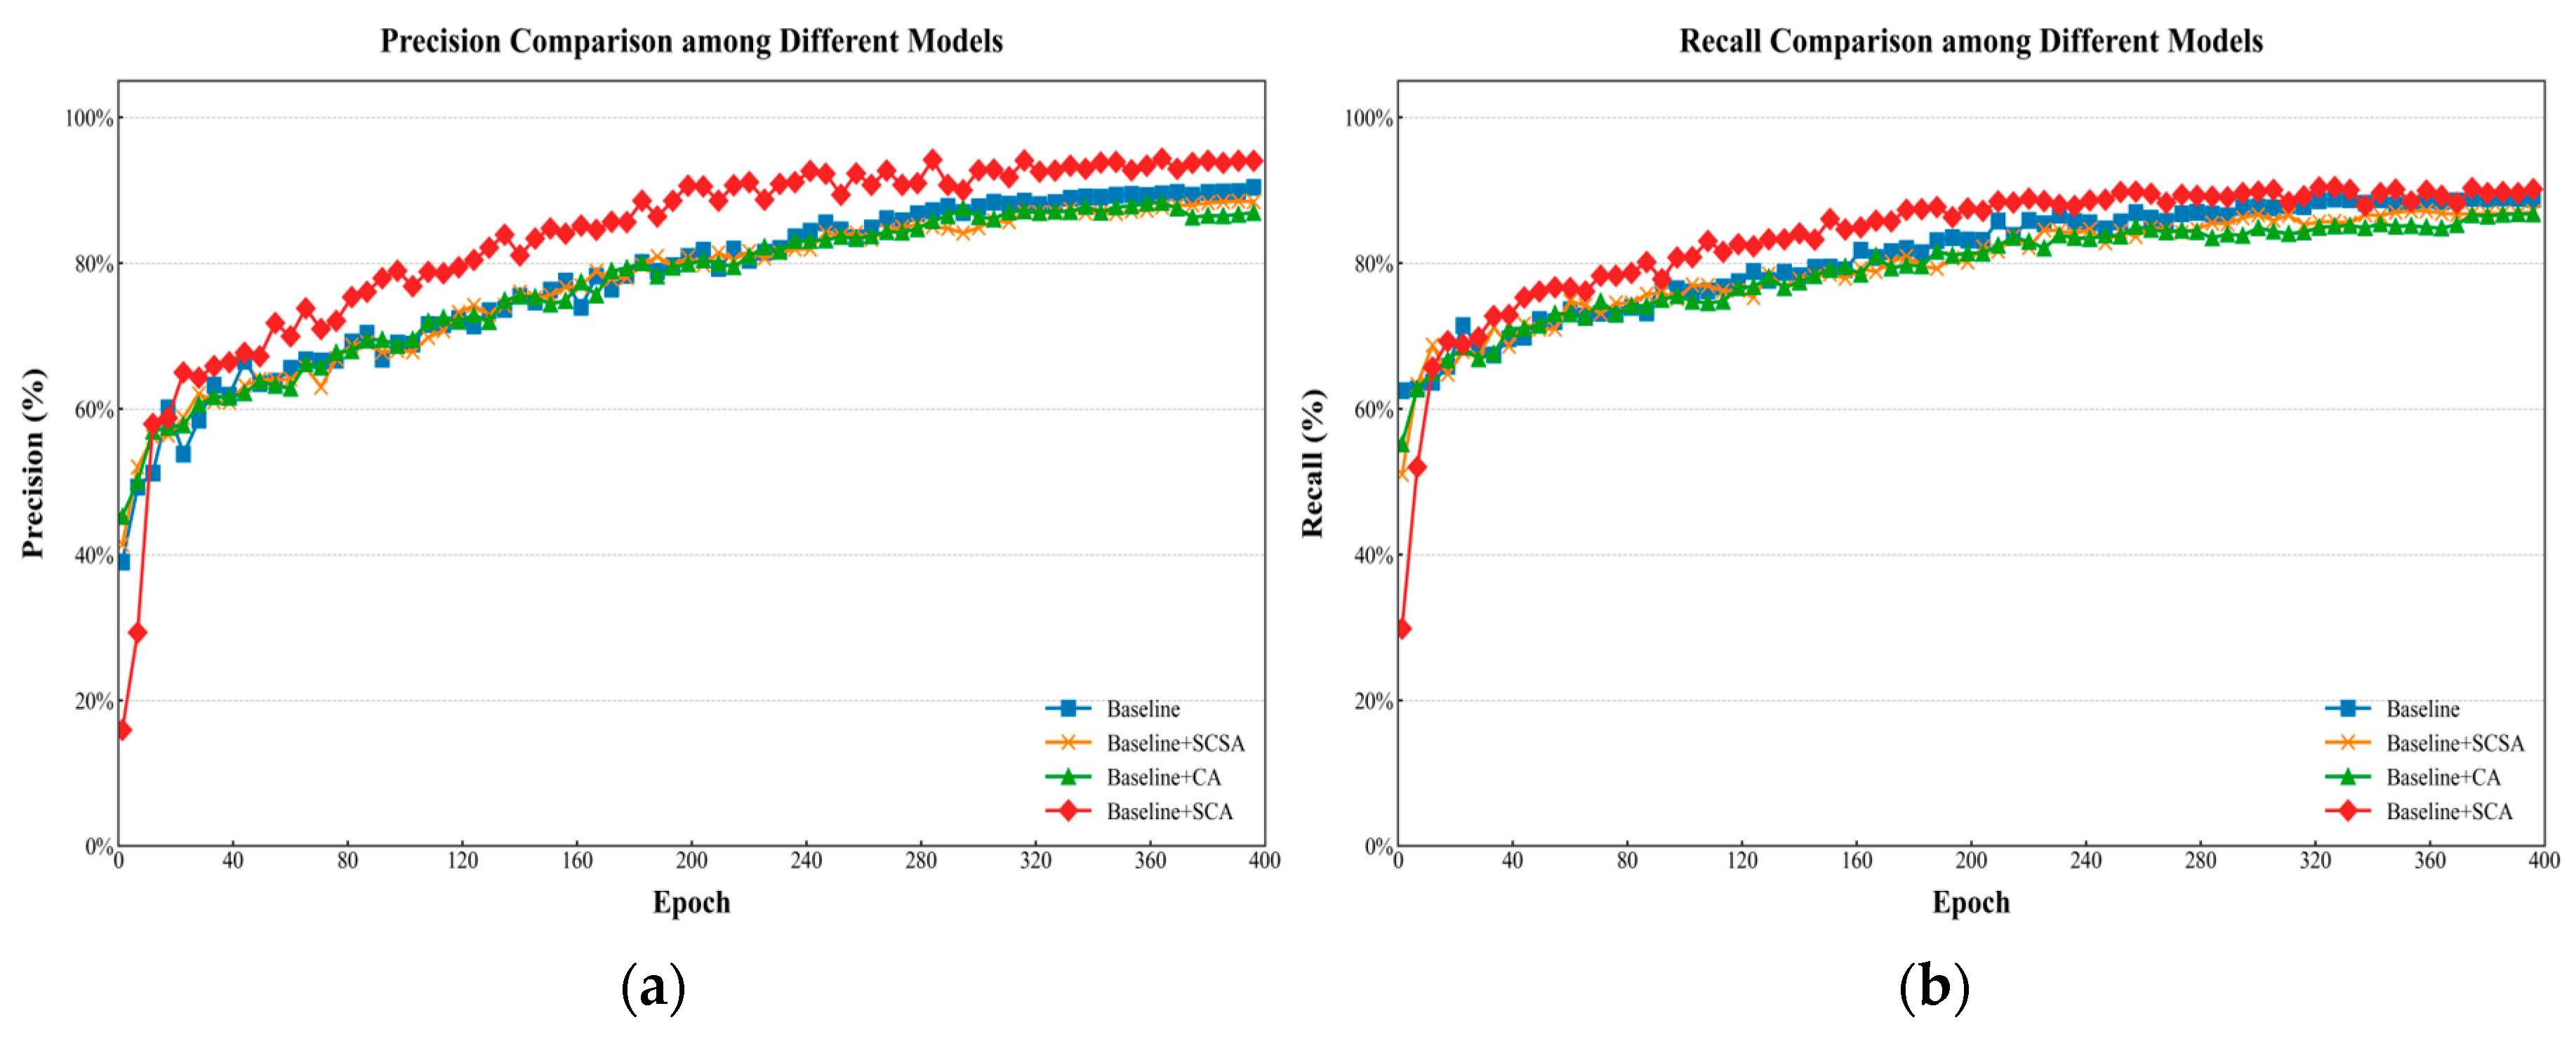
Figure 10 compares precision and recall during training. Both metrics increased rapidly, then stabilized, with YOLOv12n-SCA reaching higher converged values than the other models. Since all models loaded the YOLOv12n pre-trained weights, they began with some ability to extract edge and texture features, which helped the curves rise quickly at the outset. Compared with the other models, YOLOv12n-SCA showed higher and more stable Precision and Recall during training, with less fluctuation after convergence. Overall, SCSA and CA each improve YOLOv12n detection performance, and their combination in the SCA module yields greater gains, improving accuracy and localization stability in complex paddy-field backgrounds with varying seedling morphology and local occlusion.
Figure 10.
Comparison of performance among different models. (a) Precision comparison among different models. (b) Recall comparison among different models.
3.6. Comparative Analysis of Rice Seedling Detection Models
The missing-seedling detection algorithm was evaluated on an independent dataset of 645 UAV images in which only missing-seedling locations were manually annotated. Predictions were compared with these annotations, and the results are summarized in Table 6. The evaluation metrics for the missing seedling detection algorithm are based on the statistical results. The algorithm produced 704 true positives (TP), 151 false positives (FP), and 169 false negatives (FN), yielding precision, recall, and F1-Score values of 82.34%, 80.64%, and 81.48%, respectively. True positives represent predicted missing-seedling locations matched to the manual annotations; false positives and false negatives represent unmatched predictions and missed annotated locations, respectively. All three metrics exceed 80%, indicating relatively stable performance for missing seedling detection. The high precision suggests that most targets the model predicts are actual seedlings or areas with missing seedlings, while the slightly lower recall indicates some missed detections. The F1-Score balances false positives and false negatives, showing strong overall detection performance in complex field environments.
Table 6.
Detection results of the missing seedling algorithm.
The counting error equals the difference between the predicted total and the actual total, divided by the actual total. Across the dataset, the model predicted 855 missing-seedling locations, while 873 were annotated, corresponding to an aggregate undercount of 2.06%. This indicates that the model’s statistically estimated total count slightly undercounts compared to the manual ground truth, with no serious overestimation. Although individual detection errors may occur in a single image, the overall counting results are relatively reliable under large-sample conditions, indicating that the missing seedling detection algorithm is suitable for statistical analysis of missing seedlings across large fields.
The results in Table 6 show that λ has a significant impact on recall and counting error, but a relatively minor impact on localization error. When λ = 0.8, the algorithm performs best overall, with Precision, Recall, and F1-Score at 82.34%, 80.64%, and 81.48%, respectively; the absolute counting error is 2.06%, and the average localization error is 34.73 pixels. When λ is within the range of 0.6 to 1.0, F1-Score remained between 81.09% and 81.48%, with a maximum difference of only 0.39 percentage points, indicating that the algorithm exhibits good local stability near the optimal threshold. As λ increases further, Precision changes only slightly, while Recall decreases significantly. When λ = 1.5, Recall drops to 52.81%, and the absolute counting error increases to 37.69%, indicating that an excessively high threshold leads to a large number of true vacancies being missed. Therefore, this study ultimately adopts λ = 0.8 to balance precision, recall, and counting accuracy in vacancy identification.
The mean localization error for matched missing-seedling detections was 34.73 pixels and was calculated as the mean Euclidean distance between predicted and annotated bounding box centers. The localization error reflects the model’s ability to locate seedlings and gaps spatially and can be evaluated alongside image resolution and the UAV’s ground sampling distance. Accurate localization provides data for visualizing areas with missing seedlings and analyzing field operations.
Here, represents the number of true examples; (, ) and (, ) are the predicted and ground-truth center coordinates, respectively. Lower values indicate better localization. This metric describes only matched detections and does not account for false positives or missed detections.
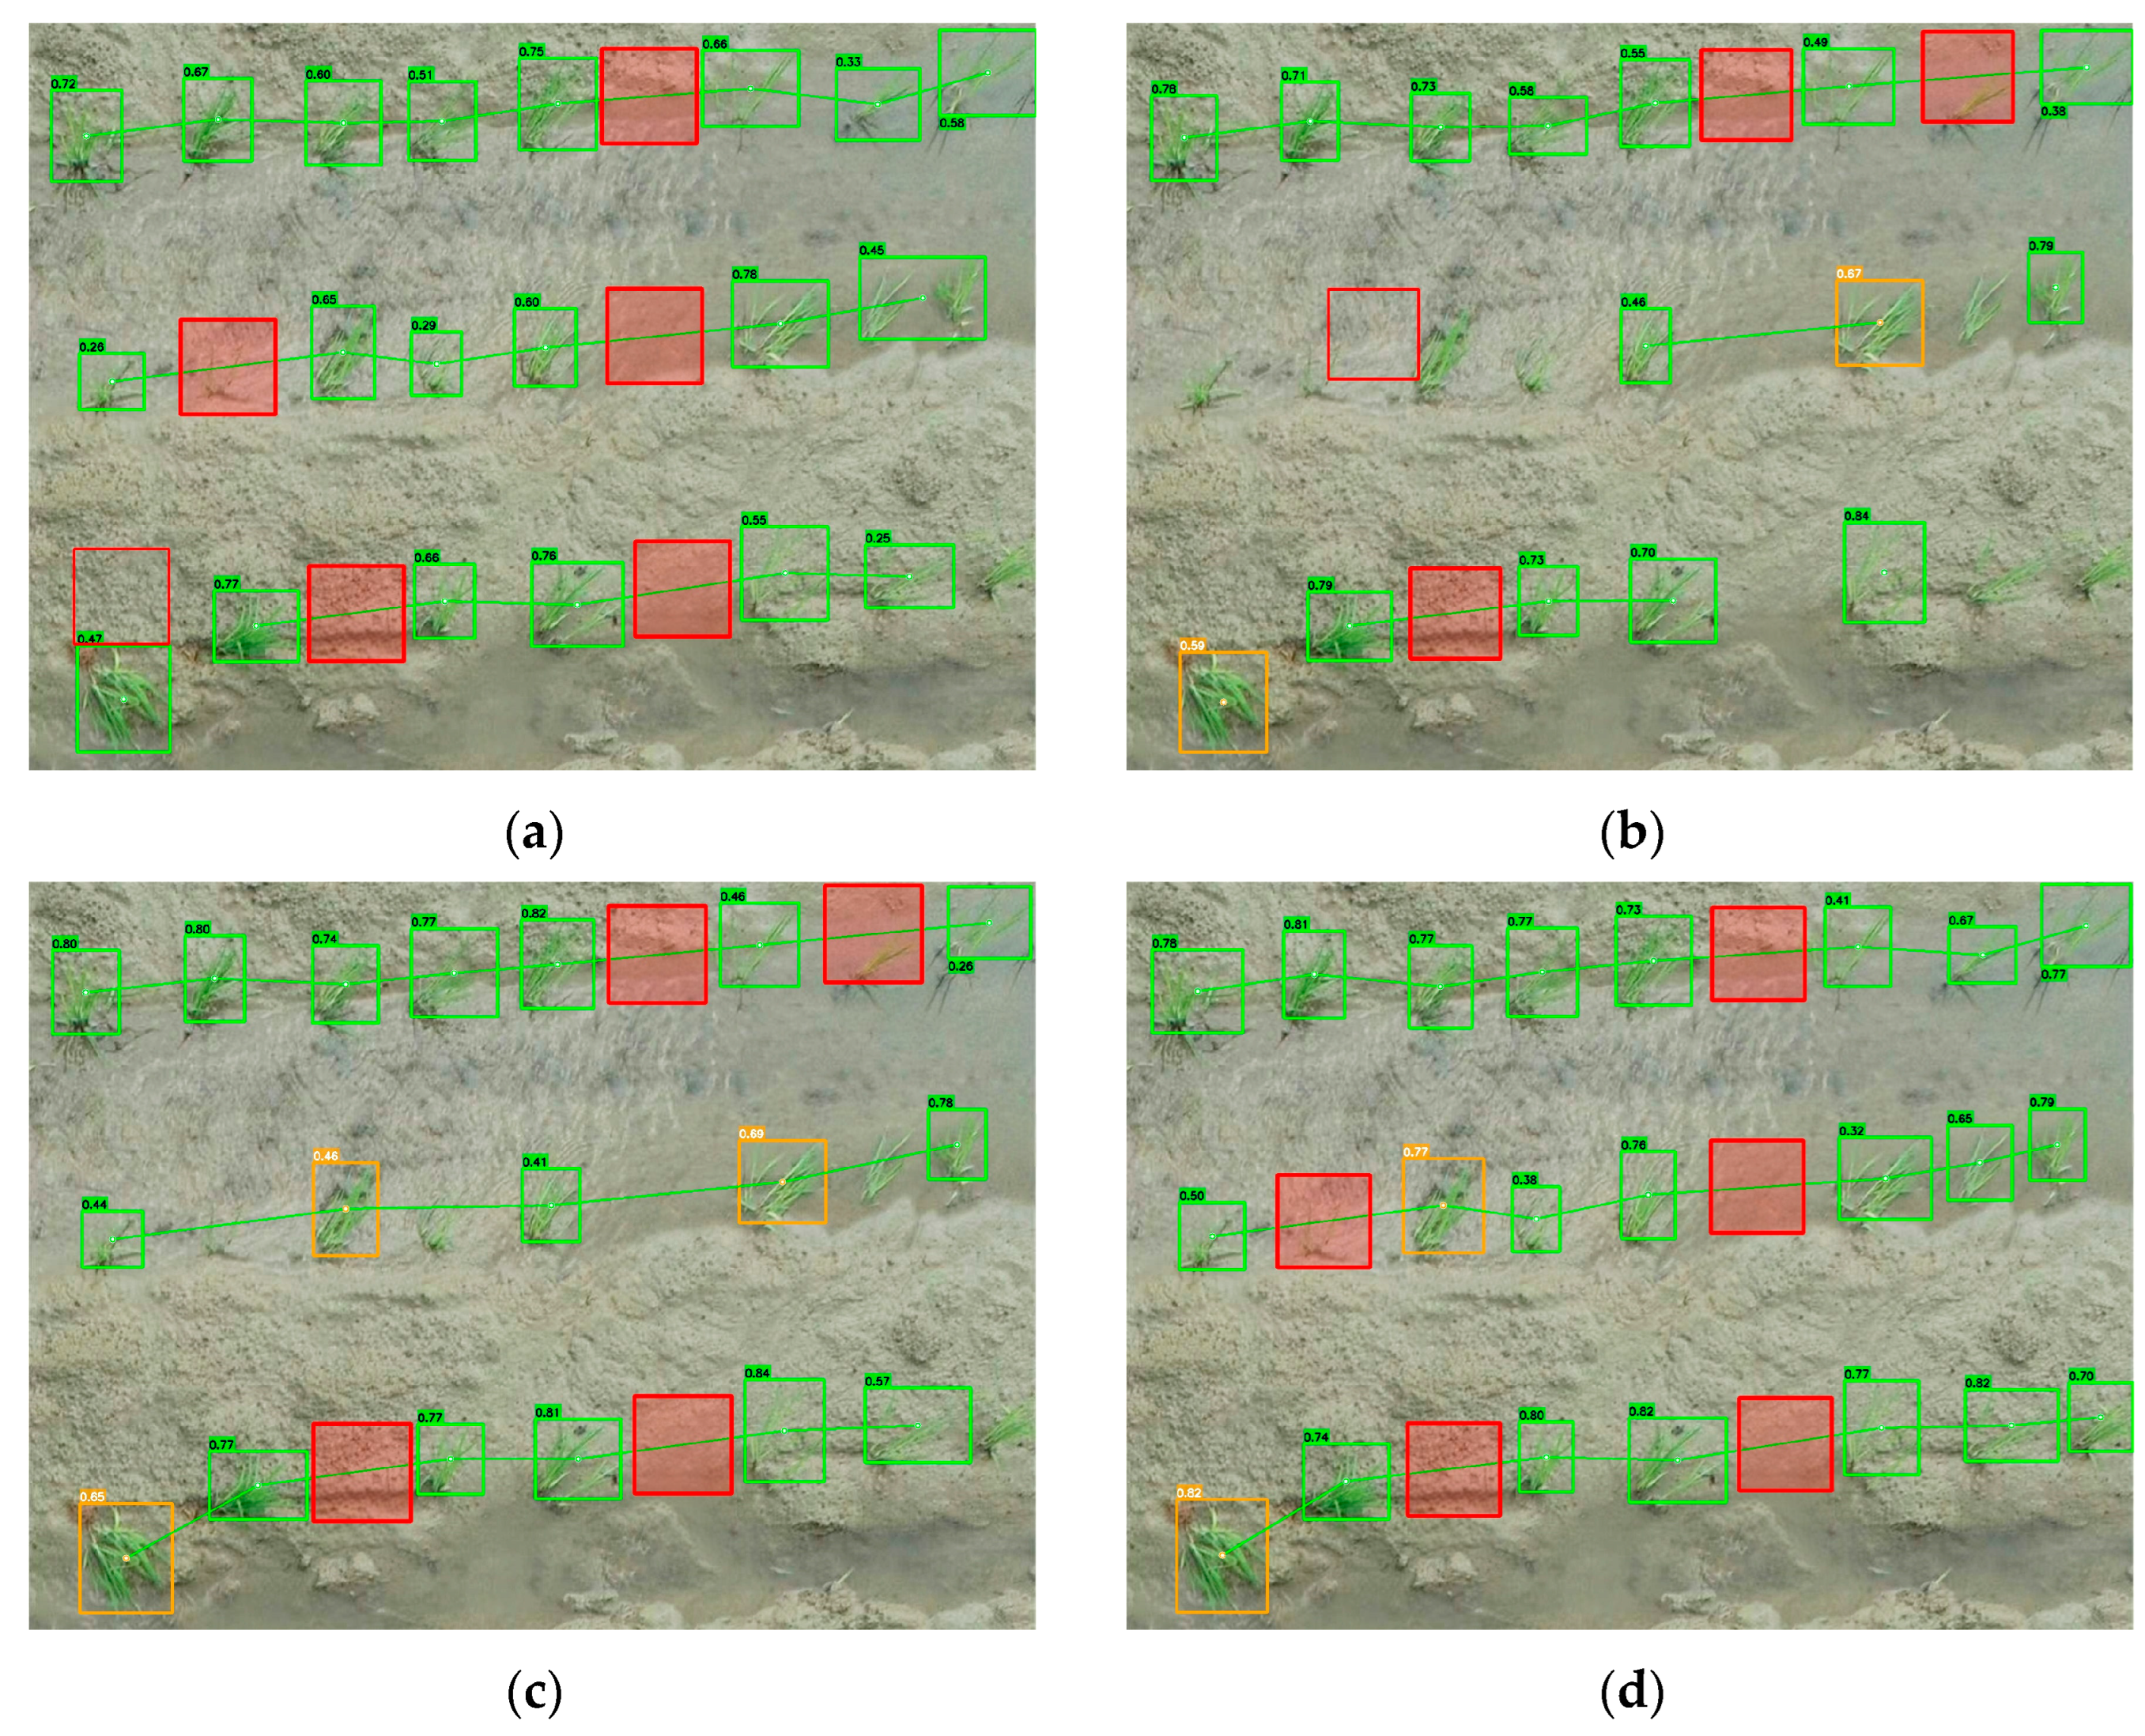
Using the YOLOv12n-SCA detection results shown in Figure 11d as an example, the model detected 27 seedling targets. After filtering overlapping bounding boxes, 4 duplicate detections were removed, leaving 3 valid rows of seedlings. Based on the row-level spacing analysis, 5 missing seedling locations were detected. The value was 93.1, indicating relatively uniform row alignment; the value was 69.2, indicating variation in plant spacing; the value was 18.52%, the lowest among the four model evaluations. Overall, the missing seedling detection algorithm produced satisfactory results.
Figure 11.
Comparison of detection results from different models. (a) YOLOv12n. (b) YOLOv12n-CA. (c) YOLOv12n-SCSA. (d) YOLOv12n-SCA. The green boxes for qualified seedlings, red boxes for missing seedling areas, and orange boxes for lodging seedlings.
The above results indicate that transplanting quality evaluation depends on model object-detection accuracy, seedling center-positioning accuracy, bounding-box overlap handling, and the completeness of the restored spatial structure in seedling rows. The CA mechanism improves linearity and regularity in mechanical transplanting, while the SCSA mechanism optimizes the distribution of gaps. Although the rice transplanters maintain a stable overall number of transplanted rows with no significant structural deviations, they still exhibit common operational issues, such as uneven row density and sporadic gaps in certain areas. The SCA hybrid attention mechanism improves the completeness of seedling detection in complex paddy field environments, providing a more reliable data foundation for subsequent seedling row clustering, missing seedling localization, and quantitative evaluation of transplanting quality.
3.7. Visualization Analysis
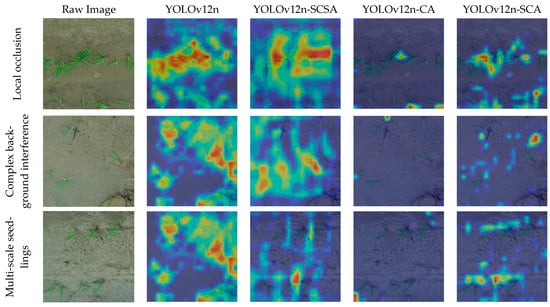
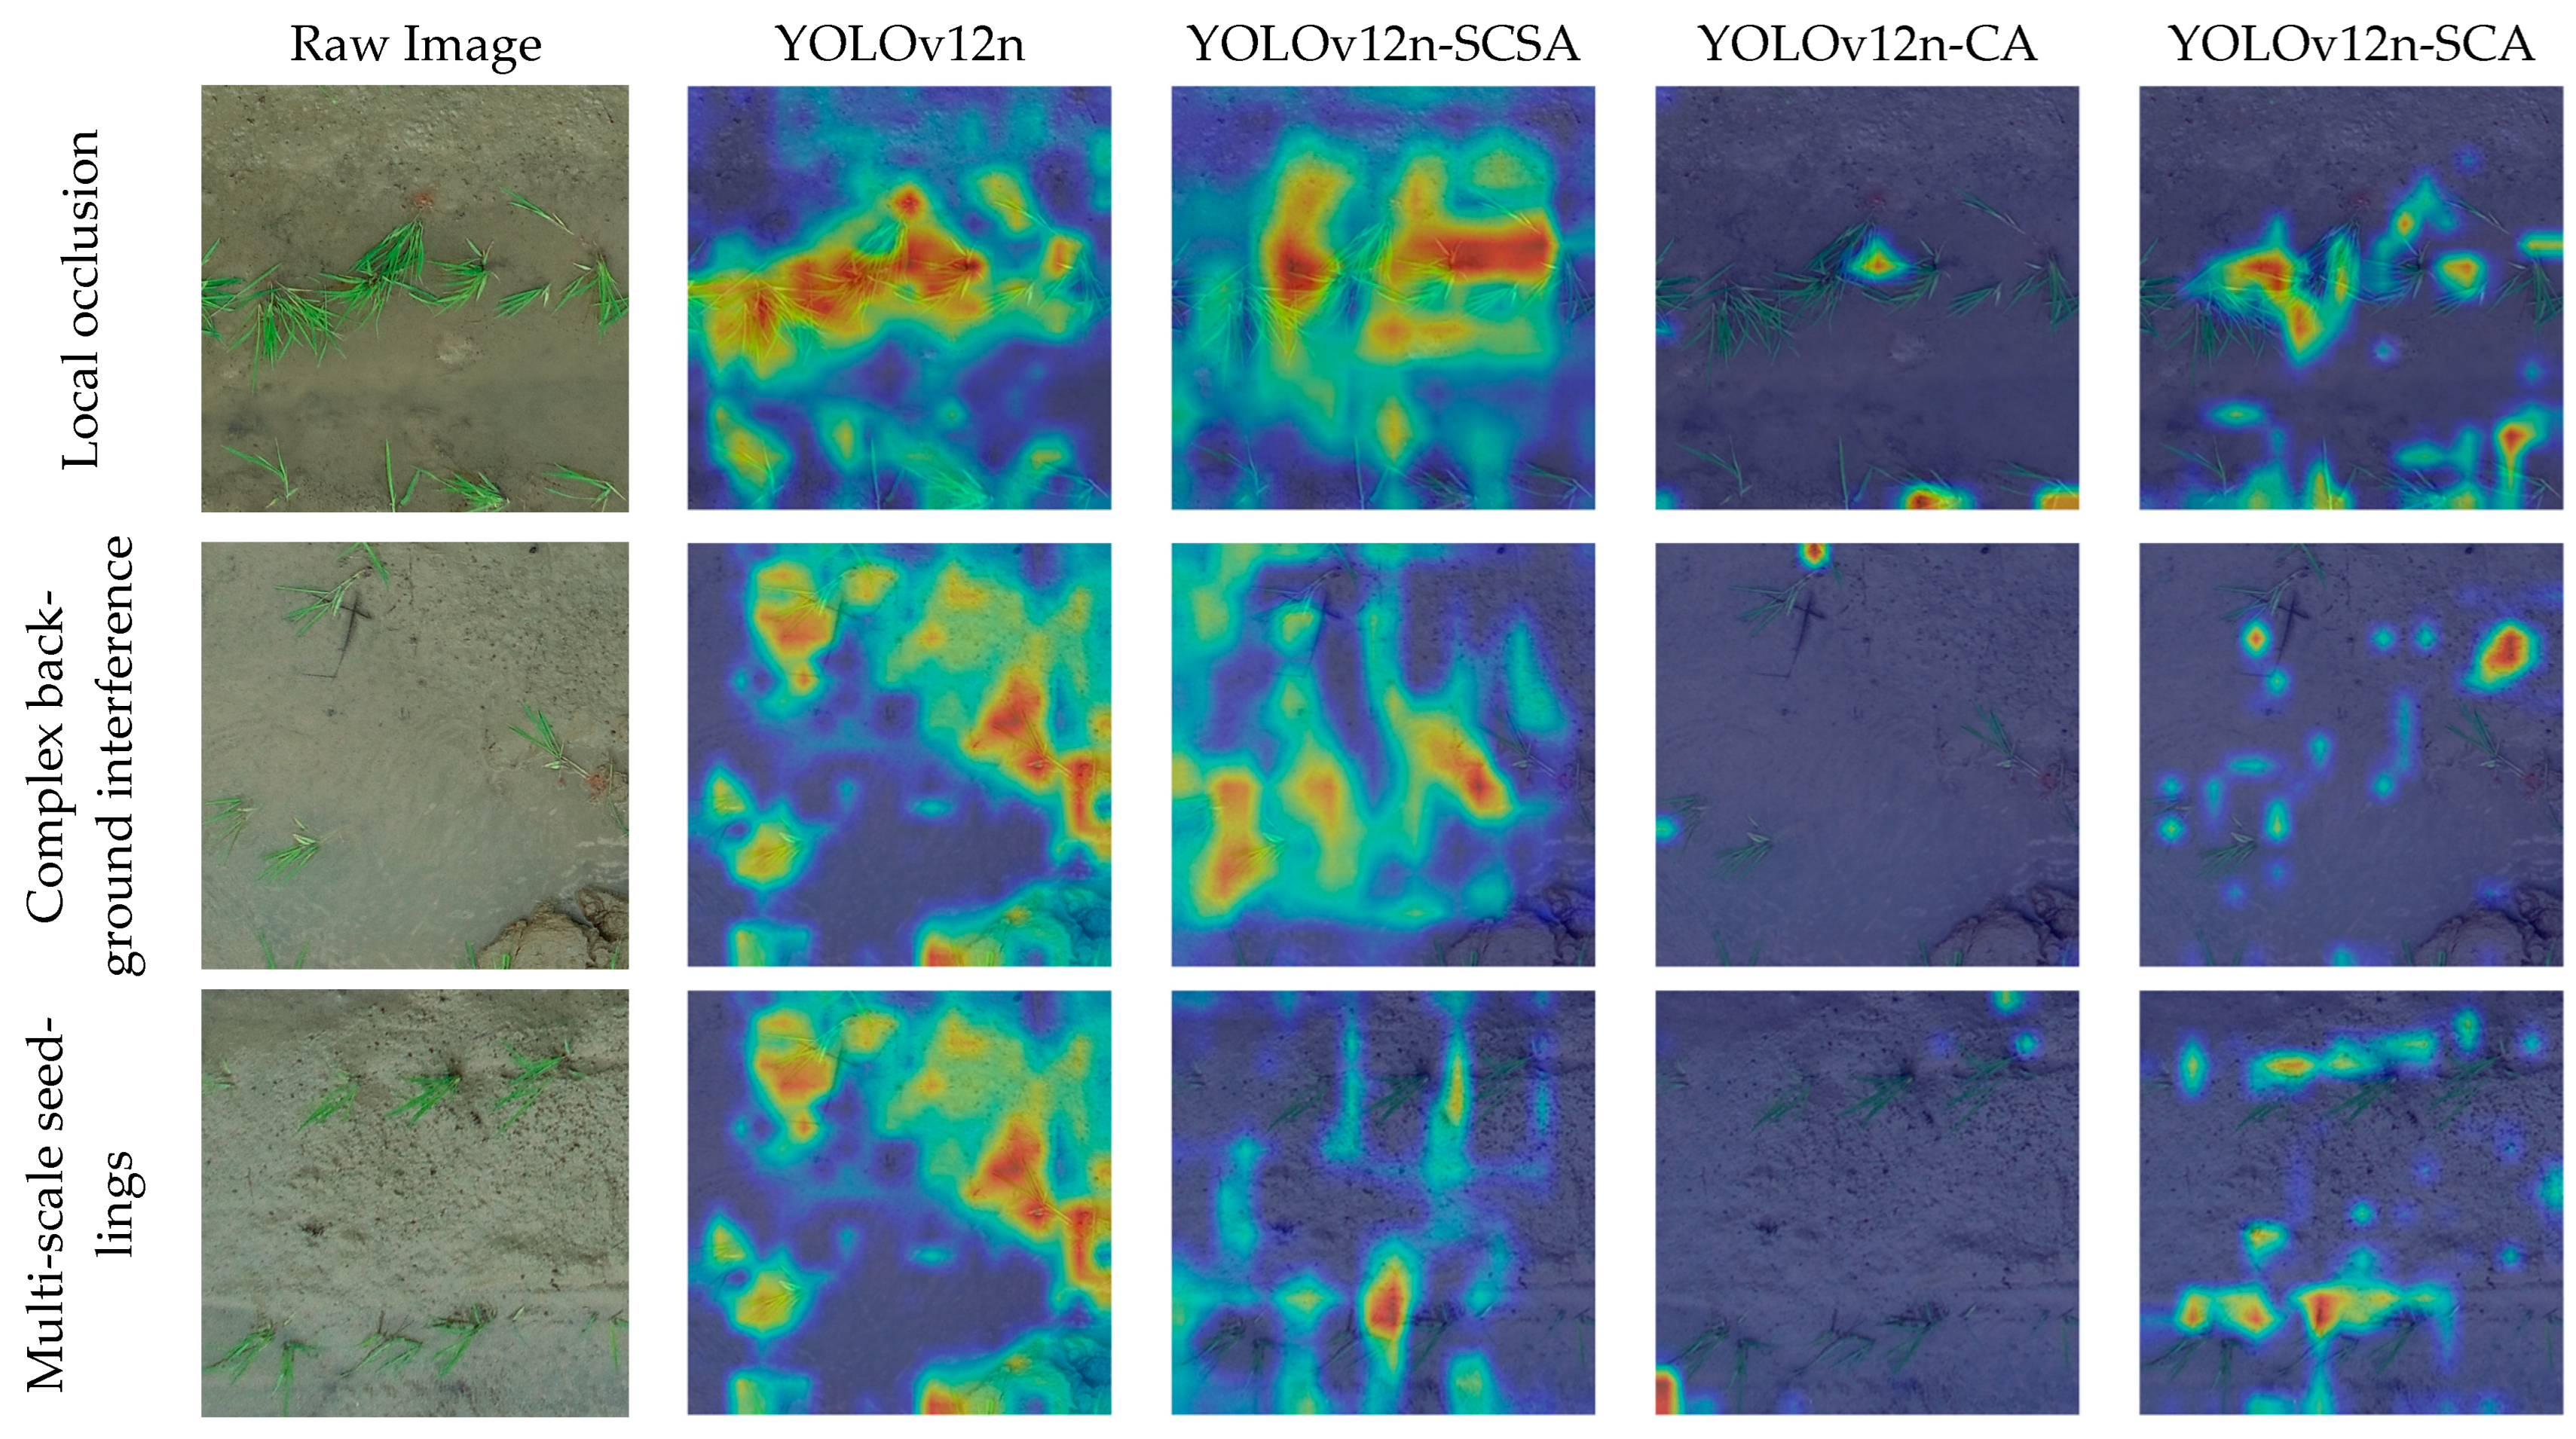
To further analyze the regions of interest and decision-making criteria of different models, we used Gradient-weighted Class Activation Mapping (Grad-CAM) to visualize model outputs. As shown in Figure 12, we selected three representative paddy field scenarios: multi-scale seedlings, complex background interference, and local occlusion, and compared the heatmaps of YOLOv12n with those of various attention-enhanced models. High-response regions in the heatmaps indicate the image areas emphasized during object recognition.
Figure 12.
Visualization results of YOLOv12n-SCA under different conditions.
The activation regions of the original YOLOv12n are relatively scattered, with some high-response areas extending into soil, the water surface, and other non-target background areas. This suggests that the baseline model is susceptible to environmental interference, such as water reflections, muddy textures, and floating debris, making it difficult to reliably distinguish rice seedlings from complex backgrounds. After introducing SCSA, the model’s response to local textures and channel features of the seedlings was significantly enhanced, and attention gradually concentrated on the target areas. However, some drift remained in regions with local occlusions and similar background textures.
The high-response regions of YOLOv12n-CA are mainly concentrated around seedling locations, with fewer false activations in the background. This suggests that CA can improve the model’s ability to perceive seedling spatial locations by encoding horizontal and vertical positional information. However, its activation range is relatively narrow. When seedlings vary greatly in scale or exhibit incomplete local morphologies, the model still struggles to capture overall target features, indicating that CA is better suited to precise positioning than broad feature coverage.
In contrast, the high-response regions of YOLOv12n-SCA are more consistent with the distribution of seedlings and seedling rows and do not extend into the surrounding soil. Under conditions involving multi-scale targets, complex backgrounds, and local occlusions, the model focuses mainly on valid seedling regions while suppressing irrelevant responses from soil, water-surface reflections, and background noise. This suggests that SCSA and CA are complementary in feature modeling: SCSA enhances local texture and space-channel dependencies, while CA preserves the target’s orientation and precise location. Their integration improves feature representation and localization of complex field targets. Grad-CAM results further validate the SCA module’s effectiveness in reducing background interference and improving the reliability of seedling detection, thereby strengthening the connection between the two modules.
3.8. Comparison of Different Backbone Networks
To evaluate the overall performance of YOLOv12n-SCA on the rice seedling detection task, relevant models, including CAD-UNet, HGV-YOLO, MobileNetV3-YOLOv8, Enhanced YOLOv8n, and OE-YOLO, were selected for comparison. Precision, Recall, and mAP@0.5 were used as evaluation metrics, and the results are shown in Table 7.
Table 7.
Comparison of the proposed model with mainstream algorithms.
YOLOv12n-SCA achieved a Precision of 93.6%, only 0.1 percentage point lower than HGV-YOLO and 2.46 and 2.6 percentage points higher than CAD-UNet and Enhanced YOLOv8n, respectively. Its Recall was 90.3%, only 0.9 percentage points lower than Enhanced YOLOv8n but significantly higher than CAD-UNet, HGV-YOLO, and MobileNetV3-YOLOv8. In terms of mAP@0.5, YOLOv12n-SCA also showed strong overall detection performance. These results suggest that the model effectively reduces false detections in complex paddy-field backgrounds while maintaining strong seedling detection performance.
In terms of comprehensive detection performance, YOLOv12n-SCA achieved an mAP@0.5 of 95.3%, the highest among all compared models. It outperformed CAD-UNet, HGV-YOLO, MobileNetV3-YOLOv8, Enhanced YOLOv8n, and OE-YOLO by 5.78, 4.2, 11.22, 0.6, and 8.4 percentage points, respectively. These results indicate that the proposed SCA hybrid attention mechanism can better leverage the spatial location, local texture, and channel features of seedlings, supporting accurate object classification and bounding box localization in complex backgrounds with morphological variations and local occlusions.
A comprehensive analysis of Precision, Recall, and mAP@0.5 shows that, although YOLOv12n-SCA performs slightly below some comparison models on individual Precision and Recall metrics, it achieves the best overall balance across the three metrics and the highest mAP@0.5. These results indicate that the proposed model improves detection accuracy for rice seedlings while controlling false positives and false negatives. It provides reliable object detection for the subsequent identification of missing seedlings and the evaluation of rice transplanting quality. It should be noted that, due to potential differences in the datasets, image acquisition conditions, and training strategies across studies, the results in Table 7 are primarily intended to show the model’s relative performance and application potential rather than to serve as a strict cross-comparison under identical experimental conditions.
4. Discussion
4.1. Synergistic Effects of Model Improvements
Compared with other plug-and-play attention modules, the Squeeze-and-Excitation (SE) Module and the Efficient Channel Attention (ECA) Module primarily focus on channel re-calibration and make limited explicit use of spatial position information. The Convolutional Block Attention Module (CBAM) combines channel and spatial attention serially. CA emphasizes direction awareness and position encoding, while SCSA enhances feature representations by interacting multi-semantic spatial features with channels. Although they overlap functionally, their modeling priorities differ. Therefore, SCA uses parallel adaptive fusion to jointly leverage seedlings’ fine-grained morphological information and directional-positional cues to enhance target representation in complex backgrounds. This design simultaneously addresses the requirements for reliable target localization in both seedling detection and subsequent rice transplanting quality evaluation.
Ablation experiments show that SCA improves mAP@0.5:0.95 by 19.5 percentage points, a greater gain than introducing SCSA or CA alone, supporting the effectiveness of using both branches in combination. This metric comprehensively evaluates detection performance across IoU thresholds from 0.50 to 0.95. Its improvement indicates that the model’s overall detection capability has improved under varying localization requirements. More reliable target locations reduce error propagation in seedling row clustering and plant spacing calculations, laying the foundation for identifying gaps caused by missing seedlings and quantitatively evaluating transplanting quality. Grad-CAM visualizations further demonstrate that, in the samples shown, the high-response regions of SCA are more concentrated on the seedling bodies, with weaker background responses to mud, water surface reflections, and floating debris. In contrast, the single-attention variant still exhibits relatively scattered non-target activations, providing qualitative support for the complementary roles of the two branches.
Building on existing attention units, this study develops a task-specific solution for YOLOv12n through dual-branch parallel adaptive fusion, cross-layer residual feature interaction, and multi-layer embedding. The method’s distinctive features lie primarily in the collaborative design of the fusion architecture and embedding strategies, as well as the integrated consideration of seedling-detection requirements and the evaluation of rice transplanting quality.
4.2. Challenges and Limitations
Although YOLOv12n-SCA achieved strong detection and evaluation results, this study faces several challenges and limitations. The dataset was collected at one site during a single growing season, limiting its coverage of rice varieties, growth stages, and environmental conditions. Although augmentation increased image diversity, it cannot replace independent validation across regions, seasons, and varieties. The current findings therefore establish performance under the study conditions, while broader generalization remains to be evaluated.
Second, this study primarily compared models using a small number of training runs and their corresponding test set results. Although ablation experiments, training curves, and Grad-CAM results all support the effectiveness of the SCA module, parameter initialization, random data splitting, and batch sampling in deep learning models may introduce variability and affect stability. Future work will involve multiple independent training iterations and report the mean, standard deviation, and significance test results for the evaluation metrics to analyze performance improvements and training stability more rigorously.
This study has not yet quantitatively verified YOLOv12n-SCA’s robustness under variable field conditions. The test data were collected at the same location during a single data collection session, and the evaluation lacks stratified testing for conditions such as strong reflections, deep shadows, severe occlusion, strong winds, and highly turbid water. Image-block-level data augmentation cannot fully simulate appearance changes caused by specular reflection, cast shadows, wind-induced motion blur, and water turbidity. The SCA’s adaptability to these disturbances also requires validation through field testing. Therefore, the reported precision, recall, and mAP reflect performance only under the conditions of this data collection; further evidence is needed to demonstrate the model’s reliability in the aforementioned complex environments. In the future, we will conduct targeted data collection to record environmental information such as wind speed, solar elevation angle, water turbidity, and cloud cover, and construct condition-stratified test subsets to clarify the model’s scope of applicability.
4.3. Future Perspectives
In the future, we will expand the seedling dataset to cover different geographic regions, growing seasons, rice varieties, and field environments, and verify the model’s generalization ability and stability through cross-dataset evaluation and repeated experiments. At the same time, we will incorporate different UAV platforms, sensors, and flight altitudes to assess domain shifts caused by differences in ground sampling distance (GSD), lens distortion, signal-to-noise ratio, and on-board image processing, and explore corresponding adaptation strategies. To address issues such as target truncation at image edges, dense overlaps, and severe lodging, we will further optimize the adaptive decision threshold and the strategy for suppressing overlapping detection boxes to reduce false negatives and false positives. Furthermore, future work will deploy the model to UAV platforms equipped with NVIDIA Jetson series hardware for field testing. We will report on the number of parameters, FLOPs, model storage size, per-frame inference time, and memory usage, and calculate the total processing time for the entire workflow—including orthorectification, seedling detection, row clustering, and rice transplanting quality scoring—to evaluate the model’s practical applicability on onboard edge devices.
5. Conclusions
This study addresses the challenges posed by small-scale targets, significant morphological variation, and strong background interference in complex paddy field environments by proposing YOLOv12n-SCA, an improved YOLOv12n model for evaluating transplanting quality. The model integrates the SCSA and CA attention mechanisms to form the SCA module and, together with a cross-layer feature fusion path, enhances the extraction of local details, spatial positions, and multiscale features of seedlings. Experimental results show that YOLOv12n-SCA achieves precision, recall, mAP@0.5, and mAP@0.5:0.95 of 93.6%, 90.3%, 95.3%, and 79.8%, respectively, representing improvements of 6.4, 3.8, 7.3, and 19.5 percentage points over the baseline model. Ablation experiments on the module and three replicate experiments demonstrated that the SCA fusion module effectively improved localization accuracy. The missing seedling detection and quality evaluation algorithm, built on seedling detection results, enables clustering of seedling rows, identification of empty positions, and quantitative assessment of seedling-row linearity, plant-spacing uniformity, and seedling-deficiency rate. Overall, this method integrates rice seedling recognition, missing-seedling localization, and transplanting-quality evaluation in complex paddy-field environments. It reduces reliance on manual field surveys and supports monitoring transplanter operation, re-planting abnormal areas, and precision management in mechanized rice cultivation.
Author Contributions
Conceptualization, P.X. and P.F.; methodology, P.F.; software, Z.L.; validation, L.X., Z.L. and J.C.; formal analysis, F.X.; investigation, P.X.; resources, P.X.; data curation, F.X.; writing—original draft preparation, F.X. and P.X.; writing—review and editing, F.X. and P.X.; visualization, F.X.; supervision, X.C. and M.L.; project administration, P.X.; funding acquisition, P.X. All authors have read and agreed to the published version of the manuscript.
Funding
This research was funded by the Science and Technology Research Project of Jiangxi Provincial Department of Education (grant number GJJ2400311), the Science and Technology Talent Cultivation Project of Early Career of Jiangxi Provincial Youth (grant number 20252BEJ730038), and the Doctoral Research Start up Fund of Jiangxi Agricultural University (grant number 9232311110).
Data Availability Statement
The original contributions presented in this study are included in the article. Further inquiries can be directed to the corresponding author.
Conflicts of Interest
The authors declare no conflicts of interest.
References
- Anandakrishnan, J.; Sangaiah, A.K.; Darmawan, H.; Son, N.K.; Lin, Y.-B.; Alenazi, M.J.F. Precise Spatial Prediction of Rice Seedlings From Large-Scale Airborne Remote Sensing Data Using Optimized Li-YOLOv9. IEEE J. Sel. Top. Appl. Earth Obs. Remote Sens. 2025, 18, 2226–2238. [Google Scholar] [CrossRef] [Scilit]
- Luo, Y.; Li, X.; Bai, B.; Yu, X.; Wang, Y.; Ma, Z.; Zhang, L.; Peng, X. A Field Rice Panicle Detection Model Based on Improved YOLOv11x. Front. Plant Sci. 2025, 16, 1656505. [Google Scholar] [CrossRef] [Scilit] [PubMed]
- Feng, Y.; Liu, M.; Wang, K.; Ling, Y.; Hu, Q.; Zhang, H.; Zhang, H. Optimal Seeding Rate Enhances Seedling Quality, Mechanical Transplanting Quality, and Yield in Hybrid Rice. Front. Plant Sci. 2024, 15, 1427972. [Google Scholar] [CrossRef] [Scilit] [PubMed]
- Patel, V.; S, G.P.M.; Chandel, T.; Sharma, V.; N, N.K.H.; S, C. Deep Rice: A Comprehensive Deep Learning Approach for Quality Assessment in Rice Grains. In Proceedings of the 2024 Second International Conference on Advances in Information Technology (ICAIT); IEEE: Chikkamagaluru, Karnataka, India, 2024; pp. 1–5. [Google Scholar]
- Park, D.; Ko, K.; Pyo, D.; Kang, J. Incremental 3D Crop Model Association for Real-Time Counting in Dense Orchards. IEEE Robot. Autom. Lett. 2026, 11, 3860–3866. [Google Scholar] [CrossRef] [Scilit]
- Hashim, N.; Ali, M.M.; Mahadi, M.R.; Abdullah, A.F.; Wayayok, A.; Mohd Kassim, M.S.; Jamaluddin, A. Smart Farming for Sustainable Rice Production: An Insight into Application, Challenge, and Future Prospect. Rice Sci. 2024, 31, 47–61. [Google Scholar] [CrossRef] [Scilit]
- Mihancea, P.F.; Driebold, L.; Blaj, D.; Bogdănescu, M.I.; Lăpădat, R.T.; Ciorica, R.C.; Onişa, A.A.; Zamosteanu, A.M.; Bienmüller, T. Scriptview: BTC Embedded Platform® Extension for Test Case Implementation. In Proceedings of the 2024 26th International Symposium on Symbolic and Numeric Algorithms for Scientific Computing (SYNASC); IEEE: Timisoara, Romania, 2024; pp. 111–112. [Google Scholar]
- Sankararao, A.U.G.; Rajalakshmi, P.; Choudhary, S. UC-HSI: UAV-Based Crop Hyperspectral Imaging Datasets and Machine Learning Benchmark Results. IEEE Geosci. Remote Sens. Lett. 2024, 21, 5508005. [Google Scholar] [CrossRef] [Scilit]
- Raghav, M.; Dubey, A.; Singh, J. Hyperspectral Imaging for Detection and Classification of Plant Primary and Secondary Metabolites: A Review. Phytochem. Anal. 2026, 37, 4–27. [Google Scholar] [CrossRef] [Scilit] [PubMed]
- Nansen, C.; Lee, H.; Mesgaran, M.B. Experimental Design Issues Associated with Classifications of Hyperspectral Sensing Data. Precis. Agric. 2025, 26, 80. [Google Scholar] [CrossRef] [Scilit]
- Tan, S.; Xie, Q.; Zhu, W.; Deng, Y.; Zhu, L.; Yu, X.; Yuan, Z.; Chen, Y. Deep Learning and Hyperspectral Features for Seedling Stage Identification of Barnyard Grass in Paddy Field. Front. Plant Sci. 2025, 16, 1507442. [Google Scholar] [CrossRef] [Scilit] [PubMed]
- Tsuchiya, Y.; Sonobe, R. Crop Classification Using Time-Series Sentinel-1 SAR Data: A Comparison of LSTM, GRU, and TCN with Attention. Remote Sens. 2025, 17, 2095. [Google Scholar] [CrossRef] [Scilit]
- Ashraf, M.; Chen, L.; Innab, N.; Umer, M.; Baili, J.; Kim, T.-H.; Ashraf, I. Novel 3-D Deep Neural Network Architecture for Crop Classification Using Remote Sensing-Based Hyperspectral Images. IEEE J. Sel. Top. Appl. Earth Obs. Remote Sens. 2024, 17, 12649–12665. [Google Scholar] [CrossRef] [Scilit]
- Paganucci, S.; Juchli, L.; Parisi, F.; Moor, T.; Braun, L.; Wolfer, T.; Eberle, P. Accurate Discrimination and Quantification of Cellulosic Fibers Using NIR Hyperspectral Imaging and Optimized Machine Learning. Infrared Phys. Technol. 2026, 155, 106519. [Google Scholar] [CrossRef] [Scilit]
- Tan, S.; Liu, J.; Lu, H.; Lan, M.; Yu, J.; Liao, G.; Wang, Y.; Li, Z.; Qi, L.; Ma, X. Machine Learning Approaches for Rice Seedling Growth Stages Detection. Front. Plant Sci. 2022, 13, 914771. [Google Scholar] [CrossRef] [Scilit] [PubMed]
- Cheng, E.; Zhang, B.; Peng, D.; Zhong, L.; Yu, L.; Liu, Y.; Xiao, C.; Li, C.; Li, X.; Chen, Y.; et al. Wheat Yield Estimation Using Remote Sensing Data Based on Machine Learning Approaches. Front. Plant Sci. 2022, 13, 1090970. [Google Scholar] [CrossRef] [Scilit] [PubMed]
- Aldakheel, E.A.; Zakariah, M.; Alabdalall, A.H. Detection and Identification of Plant Leaf Diseases Using YOLOv4. Front. Plant Sci. 2024, 15, 1355941. [Google Scholar] [CrossRef] [Scilit] [PubMed]
- Ju, J.; Ma, X.; Yang, C.; Qian, F.; Wang, J.; Chen, G. Lightweight Detection Method for Weeds in Complex Paddy Fields Based on the Improved YOLOv5. Smart Agric. Technol. 2025, 12, 101418. [Google Scholar] [CrossRef] [Scilit]
- Jiang, Y.; Xu, S.; Zhang, Z.; Wang, Y.; Yu, X.; Zhang, Z. Multimodal Fusion-Driven Precision Irrigation Decision Model for Greenhouse Cucumber Integrating Enhanced YOLO11n and TSMixer. Comput. Electron. Agric. 2026, 245, 111530. [Google Scholar] [CrossRef] [Scilit]
- Tseng, H.-H.; Yang, M.-D.; Saminathan, R.; Hsu, Y.-C.; Yang, C.-Y.; Wu, D.-H. Rice Seedling Detection in UAV Images Using Transfer Learning and Machine Learning. Remote Sens. 2022, 14, 2837. [Google Scholar] [CrossRef] [Scilit]
- Gan, S.; Yu, G.; Wang, L.; Sun, L. Seedling Row Extraction on Unmanned Rice Transplanter Operating Side Based on Semi-Supervised Semantic Segmentation. Comput. Electron. Agric. 2025, 230, 109759. [Google Scholar] [CrossRef] [Scilit]
- Luo, W.; Yuan, S. Enhanced YOLOv8 for Small-Object Detection in Multiscale UAV Imagery: Innovations in Detection Accuracy and Efficiency. Digit. Signal Process. 2025, 158, 104964. [Google Scholar] [CrossRef] [Scilit]
- Chen, S.; Li, W.; Chen, D.; Xie, Z.; Zhang, S.; Cen, F.; Huang, X.; Tu, L.; Gao, Z. Recognition of Rice Seedling Counts in UAV Remote Sensing Images via the YOLO Algorithm. Smart Agric. Technol. 2025, 12, 101107. [Google Scholar] [CrossRef] [Scilit]
- Wu, Z. An Enhanced YOLOv5 Architecture with CBAM for Accurate and Real-Time Object Detection. In Proceedings of the 2025 5th International Conference on Computer Science and Blockchain (CCSB); IEEE: Shenzhen, China, 2025; pp. 74–78. [Google Scholar]
- Yan, C.; Li, Z.; Zhang, Z.; Sun, Y.; Wang, Y.; Xin, Q. High-Resolution Mapping of Paddy Rice Fields from Unmanned Airborne Vehicle Images Using Enhanced-TransUnet. Comput. Electron. Agric. 2023, 210, 107867. [Google Scholar] [CrossRef] [Scilit]
- Zhang, P.; Sun, X.; Zhang, D.; Yang, Y.; Wang, Z. Lightweight Deep Learning Models for High-Precision Rice Seedling Segmentation from UAV-Based Multispectral Images. Plant Phenomics 2023, 5, 0123. [Google Scholar] [CrossRef] [Scilit] [PubMed]
- Atanasov, S. Methodology for Irrigation Water Uptake Time Estimation Based on RGB Colorimetric Measurements of Leaves (A Visual-Graphical Observation). IOP Conf. Ser. Mater. Sci. Eng. 2021, 1031, 012016. [Google Scholar] [CrossRef] [Scilit]
- Tian, Y.; Ye, Q.; Doermann, D. YOLOv12: Attention-Centric Real-Time Object Detectors. arXiv 2025, arXiv:2502.12524. [Google Scholar]
- Yin, Y.; Liu, X. Small Target Worker Detection Based on Improved YOLOv12 for Large Construction Scenes. Autom. Constr. 2026, 182, 106722. [Google Scholar] [CrossRef] [Scilit]
- Sapkota, R.; Karkee, M. Improved YOLOv12 with LLM-Generated Synthetic Data for Enhanced Apple Detection and Benchmarking Against YOLOv11 and YOLOv10. IFAC-PapersOnLine 2025, 59, 239–244. [Google Scholar] [CrossRef] [Scilit]
- Jegannath, S.; S, M.R.; Abirami, R. Evaluating YOLOv12 Architectural Enhancements for Small Objects and License Plate Detection. In Proceedings of the 2026 Second International Conference on Intelligent Systems for Communication, IoT and Security (ICISCoIS); IEEE: Coimbatore, India, 2026; pp. 1–6. [Google Scholar]
- Atanasov, S. Automated Remote Sensing System for Crops Monitoring and Irrigation Management, Based on Leaf Color Change and Piecewise Linear Regression Models for Soil Moisture Content Predicting. Sci. Horiz. 2024, 27, 127–139. [Google Scholar] [CrossRef] [Scilit]
- Luo, Y.; Dai, J.; Shi, S.; Xu, Y.; Zou, W.; Zhang, H.; Yang, X.; Zhao, Z.; Li, Y. Deep Learning-Based Seedling Row Detection and Localization Using High-Resolution UAV Imagery for Rice Transplanter Operation Quality Evaluation. Remote Sens. 2025, 17, 607. [Google Scholar] [CrossRef] [Scilit]
- Liang, C.; Chen, Y.; Hu, J.; Zhou, Z. HGV-YOLO: A Detection Method for Floating Seedlings and Missed Transplanting Based on the Morphological Characteristics of Rice Seedlings. Agronomy 2026, 16, 678. [Google Scholar] [CrossRef] [Scilit]
- Cai, W.; Lu, K.; Fan, M.; Liu, C.; Huang, W.; Chen, J.; Wu, Z.; Xu, C.; Ma, X.; Tan, S. Rice Growth-Stage Recognition Based on Improved YOLOv8 with UAV Imagery. Agronomy 2024, 14, 2751. [Google Scholar] [CrossRef] [Scilit]
- Li, Z.; Yao, X.; Ban, S.; Hu, D.; Tian, M.; Yuan, T.; Li, L. High-Altitude UAV-Based Detection of Rice Seedlings in Large-Area Paddy Fields. Agriculture 2026, 16, 307. [Google Scholar] [CrossRef] [Scilit]
- Wu, H.; Guan, M.; Chen, J.; Pan, Y.; Zheng, J.; Jin, Z.; Li, H.; Tan, S. OE-YOLO: An EfficientNet-Based YOLO Network for Rice Panicle Detection. Plants 2025, 14, 1370. [Google Scholar] [CrossRef] [Scilit] [PubMed]

Disclaimer/Publisher’s Note: The statements, opinions and data contained in all publications are solely those of the individual author(s) and contributor(s) and not of MDPI and/or the editor(s). MDPI and/or the editor(s) disclaim responsibility for any injury to people or property resulting from any ideas, methods, instructions or products referred to in the content. |
© 2026 by the authors. Licensee MDPI, Basel, Switzerland. This article is an open access article distributed under the terms and conditions of the Creative Commons Attribution (CC BY) license.